review of potential onsite wastewater disinfection technologies · 2013-01-30 · review of...
TRANSCRIPT


Review of Potential Onsite Wastewater Disinfection Technologies
Final Report to the Texas Commission on Environmental Quality:
Texas Onsite Wastewater Treatment Research Council
Project No. 582-11-11054
Prepared by:
Clifford B. Fedler, Richard Francis, Dhiraj Parekh, and Samir Blanchet
Civil and Environmental Engineering Department
Texas Tech University
Lubbock, TX 79409
15 December 2012
i
Executive Summary
A literature review was conducted to assess the viability and applicability of various treatment techniques for onsite sewage facilities (OSSF). The primary treatment techniques reviewed were chlorination, ultraviolet irradiation, ozone, and membrane filtration. These technologies are the most widely accepted techniques; therefore, more data can be found regarding installation costs, maintenance costs, and life cycles of the systems. Although chlorine is still the most widely used, the ongoing discoveries of disinfection byproducts (DBPs) have caused consumers and manufacturers to seek out safer ways to disinfect effluents from onsite sewage facilities. Other technologies that show promise and are currently in various phases of research include bromide, potassium permanganate, peracetic acid, ultrasonic irradiation, ferrate oxide, gamma irradiation, electrochemical disinfection, and photocatalytic disinfection. One of the biggest problems with making a complete analysis of the various technologies is obtaining sufficient cost information for the small-scaled systems such as the onsite systems since most of the technologies have been used primarily for municipal-scaled systems. Even though the use of chlorine has been the most widely used technology for disinfecting onsite effluents, it has many disadvantages that cause researchers and practitioners to seek an alternative technology. This is especially true because of the various by-products produced, the hazards of handling chlorine, and the fact that it does not remove some harmful organisms, even though it is often the more cost effective process. Even though ozone is more effective than chlorine at removing more of the harmful organisms in the effluent, the ozone can be a bit more difficult to work with due to such things as the corrosive nature and the resulting need for special equipment. When comparing the annualized cost between ozone and chlorine, the difference is relatively small. When comparing the four primary disinfection technologies, one can conclude that UV and ozone are the better technologies to replace chlorine. While the membrane technologies are promising, there is still much research that needs to be completed to reduce the problems of how to deal with the life of the membrane along with the maintenance issues of cleaning the membrane. Of the alternative, newer, technologies, electrochemical disinfection, ferrate disinfection, and bromide show more promise for use with onsite system effluents while others are more applicable to the large-scale municipal or industrial treatment facilities due to the cost of equipment and materials.
Acknowledgements
Many people made great contribution to the completion of this study and I would like to express my appreciation to them. Without the help of Emre Guven, Nick Kalos, and Bahar Amoli this project would not have had the same conclusions. Special thanks are extended to Dr. John Borrelli who served as the outside reviewer this report.

ii
Tables of Contents
Executive Summary ....................................................................................................................................... i
Acknowledgements ........................................................................................................................................ i
Tables of Contents ........................................................................................................................................ ii
List of Tables ............................................................................................................................................... iii
List of Figures .............................................................................................................................................. iii
Abbreviations and Acronyms ...................................................................................................................... iv
Introduction ................................................................................................................................................... 1
Objectives ..................................................................................................................................................... 2
Chlorine Disinfection .................................................................................................................................... 5
Chlorine Gas ............................................................................................................................................. 5
Sodium Hypochlorite (NaOCl) ................................................................................................................. 6
Calcium Hypochlorite Ca(OCl) 2 .............................................................................................................. 6
Ozone Disinfection ....................................................................................................................................... 8
Costs Associated with Ozone Disinfection ............................................................................................... 9
Ultraviolet Disinfection .............................................................................................................................. 10
UV Application for Onsite Systems ........................................................................................................ 11
Environmental Impact of the UV Disinfection Process .......................................................................... 12
Cost of UV Disinfection ......................................................................................................................... 12
Membrane Disinfection .............................................................................................................................. 13
Cost of Membrane Disinfection .............................................................................................................. 14
Alternative Wastewater Disinfection .......................................................................................................... 14
Bromine Disinfection .................................................................................................................................. 15
Peracetic Acid Disinfection ........................................................................................................................ 16
Ultrasonic Pre-Treatment ............................................................................................................................ 16
Electrochemical Disinfection ...................................................................................................................... 16
Ferrate Disinfection .................................................................................................................................... 18
Gamma Irradiation ...................................................................................................................................... 18
Potassium ferrate(VI) .................................................................................................................................. 18
Potassium ferrate(VI) .................................................................................................................................. 18
Potassium ferrate(VI) .................................................................................................................................. 18
Potassium ferrate(VI) .................................................................................................................................. 18
Photocatalyst (TiO2) Disinfection ............................................................................................................... 19

iii
Conclusions ................................................................................................................................................. 19
References ................................................................................................................................................... 20
List of Tables
Table 1. List of reviewed disinfection technologies considered. .................................................................. 3 Table 2. Advantages and disadvantages of chlorine disinfection technologies. ........................................... 3 Table 3. Advantages and disadvantages of ozone disinfection technologies. ............................................... 4 Table 4. Advantages and disadvantages of UV disinfection technologies. .................................................. 4 Table 5. Advantages and disadvantages of membrane disinfection technologies. ....................................... 5 Table 6. Estimated costs for 20 MGD chlorine gas disinfection systems. .................................................... 6 Table 7. Estimated costs for 20 MGD sodium hypochlorite disinfection systems. ...................................... 6 Table 8. Chlorine generated products used for disinfection and their chlorine strength............................... 7 Table 9. Estimated costs for 10 PPM chlorination and dechlorination systems. .......................................... 7 Table 10. Estimated costs for onsite ozone disinfection systems. ................................................................ 9 Table 11. Parameters of a typical UV treatment process. ........................................................................... 12 Table 12. Comparison between onsite disinfectants. .................................................................................. 13 Table 13. Estimated costs for 5-10 MGD UV radiation systems. ............................................................... 13 Table 14. Estimated cost comparison for onsite chlorination and UV systems. ......................................... 13 Table 15. Estimated costs of various membrane technologies. .................................................................. 15 Table 16. Advantages and disadvantages of minor disinfection technologies. ........................................... 17 Table 17. Estimated costs associated with peak large-flow 12 mg/L bromochlorodimethylhydantion (BCDMH) disinfection systems. ................................................................................................................. 18 Table 18. Typical costs of ferrate compounds. ........................................................................................... 18
List of Figures
Figure 1. Process diagram for ozone disinfection. ........................................................................................ 8 Figure 2. The electromagnetic spectrum for the UV light spectrum. .......................................................... 10 Figure 3. The UV portion of the electromagnetic spectrum. ...................................................................... 11 Figure 4. Wastewater treatment in a horizontal UV chamber. .................................................................... 11

iv
Abbreviations and Acronyms
Abbreviation Definition
OSSF Onsite sewage facility DBPs Disinfection byproducts gpd Gallons per day MGD Million gallons per day m3/d Cubic meter per day UV Ultraviolet THMs Trihalomethanes DO Dissolved oxygen Cl2 Chlorine gas O & M Operation and maintenance EPA Environmental Protection Agency Ca(OCl)2 Calcium hypochlorite mg/L Milligram per liter ADWF Average dry weather flow PWWF Peak wet weather flow O3 Ozone NSFC National Small Flows Clearinghouse gph Gallons per hour mW-s/cm2 microwatt-second per square centimeter CFU Colony forming unit DNA Deoxyribonucleic acid CH3CO3H Peracetic acid kWh Kilowatt hours RO Reverse osmosis NF Nanofiltration MF Microfiltration UF Ultrafiltration TiO2 Titanium dioxide BCDMH Bromochlorodimethylhydantion PAA Peroxyacetic acid BDD Boron-doped diamond mA/cm2 Milliamp per square centimeter Fe+ Ferric ion COD Chemical oxygen demand BOD Biochemical oxygen demand kGy Kilo gray mJ/cm2 millijoules per square centimeter

1
Introduction
Treating wastewater is of prime concern to the developed world, and a large number of wastewater effluent disinfection technologies currently exist. These various technologies have been developed primarily for the use in commercial or public owned wastewater treatment facilities where the volume of flow can vary from less than 50,000 gpd 189 m3/d) to over 100 mgd (378,500 m3/d). Of these available disinfection technologies, three stand out as what many people would call mature technologies -- chlorine, ultraviolet (UV), ozone, and membrane systems. When considering the chlorine technology, there are four different forms considered, liquid chlorine, chlorine gas, sodium hypochlorite and calcium hypochlorite. When considering membrane technologies the four different forms are reverse osmosis, nanofiltration, microfiltration, and ultrafiltration. Other technologies reviewed include bromine, potassium permanganate, peracetic acid, ultrasonic irradiation, ferrate oxide, and gamma irradiation. All of these technologies have their advantages and disadvantages, and their scope of use becomes both technological and site-specific. One concern considered when investigating the use of these technologies is their applicable use for onsite wastewater treatment systems (In Texas they are referred to as onsite sewage facilities or OSSFs) where flow rates can range from 250 gpd to less than 5,000 gpd. (18.93 m3/d) These two types of systems, large-scale and small-scale, pose some difficult safety and equipment issues when determining which disinfection technology can be used.
The type of equipment used for large-scale wastewater treatment systems is quite different from the small-scale systems with the most obvious being the methods used to move the wastewater effluent through the system. For example, the equipment needed to utilize liquid chlorine for the small flows does not exist because the flow rates are too small whereas it is readily available for large flows. Chlorine tablets on the other hand can be used for small onsite systems because they are easy to use, easy to store, and require minimal knowledge of how the system functions. When comparing the various technologies currently available, it will become obvious which technologies fall into the various size categories.
For the OSSF systems, the effluent is applied to the soil surface where a cover crop is present, usually the local grass because most leach systems are located within an individual’s back yard. Because the wastewater effluent is applied on the surface, disinfection is required to protect human health due to the potential for direct contact during the application process. Many of the most widely used disinfection processes add dissolved solids to the effluent stream; therefore, care must be taken when designing the application rate for the system. The salt tolerance of the plants used at the land application site must be factored into the design of the system in addition to the water and nutrient (usually nitrogen is of greatest concerned) balance, which can complicate the optimum design. If a disinfection technology does not add dissolved solids to the effluent, then the design and operation of the land applied system becomes much easier.
Partially treated wastewater effluent percolating into the soil has the potential to contaminate groundwater quality. As water percolates through the soil, some degree of disinfection occurs; however, most soil infiltration systems have been traditionally designed for treated wastewater disposal and are not designed with disinfection in mind. There is very little information on the reliability and maintenance required to keep the performance of small flow disinfection processes to high levels. Thus research is needed to characterize the reliability, constraints, maintenance, and cost of installation and operation involved in the disinfection of onsite sewage facilities.

2
Objectives
Chlorination has been the most acceptable means of disinfection over the past century; however, the detection of disinfection by-products (DBPs) from chlorination has stimulated investigation into alternative technologies. Other disinfection technologies that are currently in practice include ozone, chlorine dioxide, potassium permanganate, and ultraviolet irradiation. The most suitable disinfection technology depends on many factors such as the ability to destroy infectious agents under normal operating conditions, safe and easy to store, absence of carcinogenic compounds after disinfection and affordable total costs of system operation. Factors that affect disinfection efficiency are: nature of disinfectant, concentration of disinfectant, length of contact time with the disinfectant, temperature, type and concentration of organisms, and pH levels.
Disinfection is required for onsite wastewater treatment systems under following circumstances:
a) If there is inadequate soil (depth to groundwater) in order to meet ground water quality standards.
b) If immediate reuse (onsite recycling) of effluent is utilized: for example vegetation watering (surface application of the effluent).
c) If a process requires a surface discharge.
The overall objective of this project was to conduct a literature review in order to characterize and identify the performance, reliability, constraints, maintenance, cost of installation, and operation involved with the disinfection of small wastewater flows, such as those for individual homes or those consolidated system with total flows of less than 5,000 gpd (18.93 m3/d). This review will concentrate on various existing disinfection technologies for reducing the presence of pathogens. In addition to the efficacy of pathogen reduction, the technologies were evaluated for their initial cost, operating costs, efficiency, and environmental side-effects. Listed in Table 1 are the disinfection technologies that were reviewed. Presented in Tables 2 through 5 are the major advantages and disadvantages of the four major classes of disinfection technologies.
3
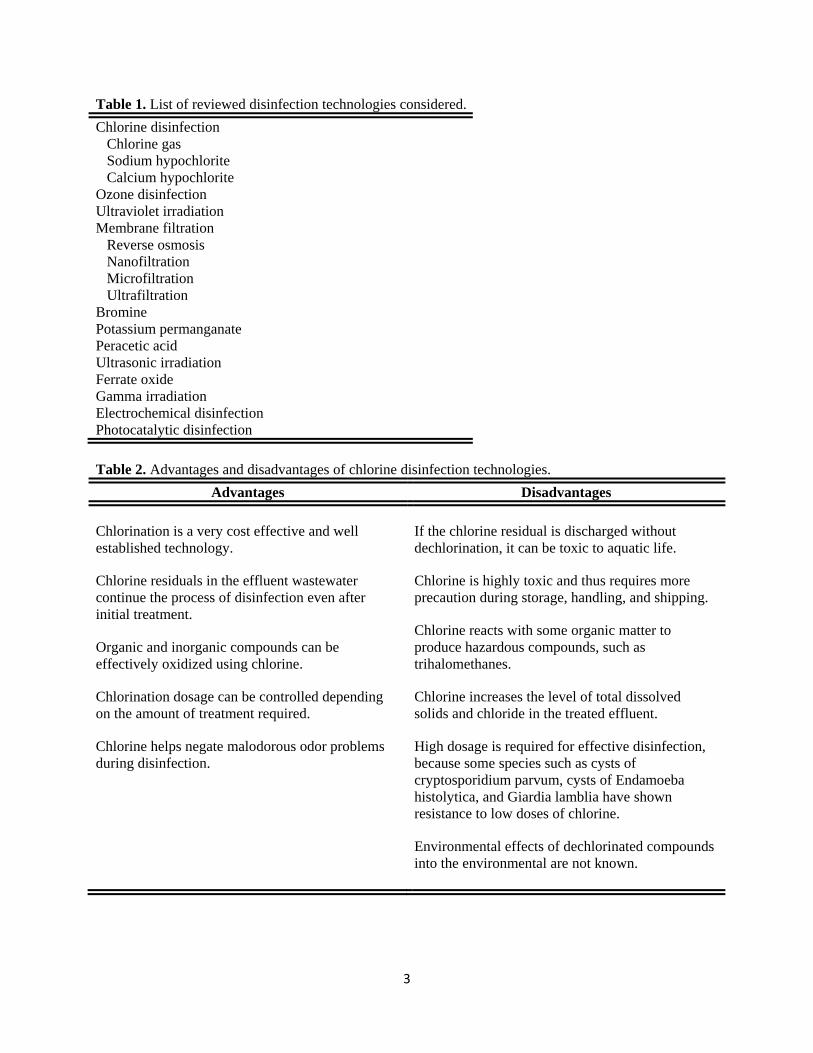
Table 1. List of reviewed disinfection technologies considered.
Chlorine disinfection Chlorine gas Sodium hypochlorite Calcium hypochlorite Ozone disinfection Ultraviolet irradiation Membrane filtration Reverse osmosis Nanofiltration Microfiltration Ultrafiltration Bromine Potassium permanganate Peracetic acid Ultrasonic irradiation Ferrate oxide Gamma irradiation Electrochemical disinfection Photocatalytic disinfection
Table 2. Advantages and disadvantages of chlorine disinfection technologies.
Advantages Disadvantages
Chlorination is a very cost effective and well established technology.
Chlorine residuals in the effluent wastewater continue the process of disinfection even after initial treatment.
Organic and inorganic compounds can be effectively oxidized using chlorine.
Chlorination dosage can be controlled depending on the amount of treatment required.
Chlorine helps negate malodorous odor problems during disinfection.
If the chlorine residual is discharged without dechlorination, it can be toxic to aquatic life.
Chlorine is highly toxic and thus requires more precaution during storage, handling, and shipping.
Chlorine reacts with some organic matter to produce hazardous compounds, such as trihalomethanes.
Chlorine increases the level of total dissolved solids and chloride in the treated effluent.
High dosage is required for effective disinfection, because some species such as cysts of cryptosporidium parvum, cysts of Endamoeba histolytica, and Giardia lamblia have shown resistance to low doses of chlorine.
Environmental effects of dechlorinated compounds into the environmental are not known.

4
Table 3. Advantages and disadvantages of ozone disinfection technologies.
Advantages Disadvantages
More effective than chlorine as a disinfectant.
Ozone is generated onsite negating need for storage of chemicals (except when compressed oxygen is used).
Shorter contact time needed than chlorine.
No trihalomethanes (THMs).
Increases the dissolved oxygen (DO) concentration of the treated water.
No increase is total dissolved solids in the effluent.
Complex technology requiring expensive equipment.
Ozone is very corrosive, and the equipment must be made with corrosive-resistant material.
Excess ozone must be recycled or destroyed to prevent exposure.
Effectiveness decreases as concentration of suspended solids increases.
Can produce bromate or aldehydes thought to be harmful to humans.
Energy intensive, not suggested if treated area affected by frequent power surges and outages.
Table 4. Advantages and disadvantages of UV disinfection technologies.
Advantages Disadvantages
It is a physical process thus eliminating the hazards of handling & storage of chemicals.
UV is effective in inactivating most of the viruses, spores, and cysts found in wastewater.
No residual effect that can affect humans or aquatic life.
UV disinfection requires less space compared to other mainstream technologies.
With proper dosage and exposure time, the effluent water quality can reach the most stringent limits.
UV disinfects water faster than chlorine within a few seconds, compared to 15 minutes generally needed for chlorine.
Improper dosage can result in reactivation of the microbes.
Turbidity will reduce the efficiency of UV systems.
Regular maintenance is required to prevent fouling of the tubes.
UV is not as cost effective as chlorination, but competitive when dechlorination is involved.
Efficacy of UV cannot be measured due to the absence of residuals.

5
Table 5. Advantages and disadvantages of membrane disinfection technologies.
Advantages Disadvantages
Effluent stream quality is very high.
No disinfection residuals in effluent.
Does not require generation or storage of volatile chemicals.
Microorganisms cannot develop a resistance to treatment.
Some systems cannot use a backwashing process requiring more frequent replacement of membranes.
All membrane filtration systems require some pre-treatment.
Small scale systems have very high waste to product ratios.
Depending on the level of filtration, the effluent can be overly pure for OSSF systems.
Very little research has been done on the application of membrane filtration in OSSF systems and small scale operations in general.
Chlorine Disinfection
Chlorine disinfection can be performed using several forms of chlorine such as chlorine gas, sodium hypochlorite, and calcium hypochlorite; however, the form of chlorine used is determined by several factors such as application, safety, stability, deodorizing ability, availability, solubility, corrosiveness, and ability to respond immediately rate changes. For effective chlorination, a system must be designed for the wastewater to flow turbulently in a plug flow fashion throughout a contact chamber for complete mixing and for a specified amount of time. The mixing allows the wastewater maximum contact time and ensures optimum performance. Chlorine disinfection produces residues that remain in the treated wastewater for many hours, which is the reason a municipality will use it for drinking water. The free chlorine radicals remain in the line and continue to kill most microorganisms. While this is advantageous for drinking water, the chlorine can adversely impact aquatic life. It is for this reason that most states require chlorinated wastewater to be dechlorinated in order to minimize the adverse effect on aquatic life and the environment. Dechlorination is the process of removing free chlorine radicals prior to discharge. Commonly used dechlorinating agents are sulfur dioxide, sodium disulfite, sodium metabisulfite, and activated carbon or aeration (Solomon et al., 1998). This dechlorination process also adds dissolved solids to the effluent.
Chlorine Gas
Pure chlorine in the form of chlorine gas (Cl2) is readily available and has a low production and operation cost. It is stable and can be stored for a longer period of time if in a liquid form under high pressure. Chlorine gas is toxic and corrosive and reacts with organic matter present in effluent; hence it is not applicable to onsite facilities that release the treated water onto plant life. Chlorine gas also reacts with organics, ammonia, and phenolic compounds before it reacts with pathogens. Chlorine reacts with ammonia and phenol to form chloramines and chlorophenols, respectively (US EPA, 1999). Due to the high availability of chlorine, the costs associated with OSSFs are smaller compared to those of other systems. Shown in Table 6 are typical costs for a large scale chlorine gas disinfection system.
6
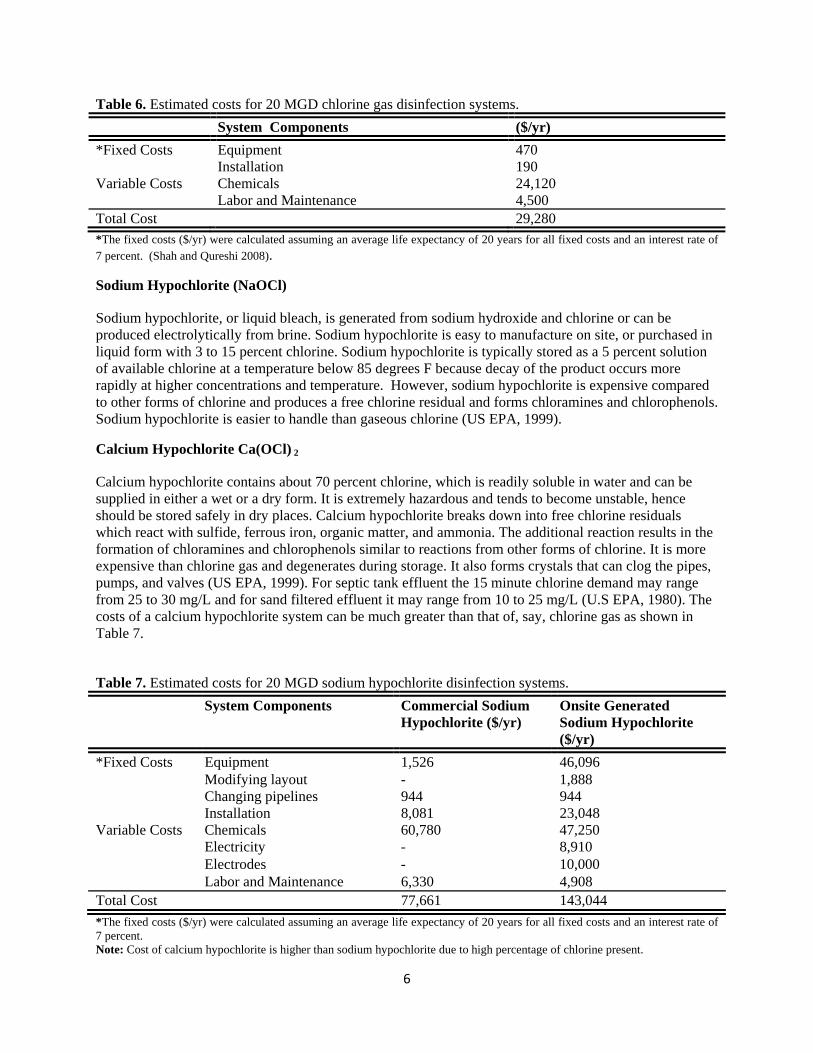
Table 6. Estimated costs for 20 MGD chlorine gas disinfection systems.
System Components ($/yr)
*Fixed Costs Equipment 470 Installation 190 Variable Costs Chemicals 24,120 Labor and Maintenance 4,500 Total Cost 29,280 *The fixed costs ($/yr) were calculated assuming an average life expectancy of 20 years for all fixed costs and an interest rate of 7 percent. (Shah and Qureshi 2008).
Sodium Hypochlorite (NaOCl)
Sodium hypochlorite, or liquid bleach, is generated from sodium hydroxide and chlorine or can be produced electrolytically from brine. Sodium hypochlorite is easy to manufacture on site, or purchased in liquid form with 3 to 15 percent chlorine. Sodium hypochlorite is typically stored as a 5 percent solution of available chlorine at a temperature below 85 degrees F because decay of the product occurs more rapidly at higher concentrations and temperature. However, sodium hypochlorite is expensive compared to other forms of chlorine and produces a free chlorine residual and forms chloramines and chlorophenols. Sodium hypochlorite is easier to handle than gaseous chlorine (US EPA, 1999).
Calcium Hypochlorite Ca(OCl) 2
Calcium hypochlorite contains about 70 percent chlorine, which is readily soluble in water and can be supplied in either a wet or a dry form. It is extremely hazardous and tends to become unstable, hence should be stored safely in dry places. Calcium hypochlorite breaks down into free chlorine residuals which react with sulfide, ferrous iron, organic matter, and ammonia. The additional reaction results in the formation of chloramines and chlorophenols similar to reactions from other forms of chlorine. It is more expensive than chlorine gas and degenerates during storage. It also forms crystals that can clog the pipes, pumps, and valves (US EPA, 1999). For septic tank effluent the 15 minute chlorine demand may range from 25 to 30 mg/L and for sand filtered effluent it may range from 10 to 25 mg/L (U.S EPA, 1980). The costs of a calcium hypochlorite system can be much greater than that of, say, chlorine gas as shown in Table 7.
Table 7. Estimated costs for 20 MGD sodium hypochlorite disinfection systems.
System Components Commercial Sodium Hypochlorite ($/yr)
Onsite Generated Sodium Hypochlorite ($/yr)
*Fixed Costs Equipment 1,526 46,096 Modifying layout - 1,888 Changing pipelines 944 944 Installation 8,081 23,048 Variable Costs Chemicals 60,780 47,250 Electricity - 8,910 Electrodes - 10,000 Labor and Maintenance 6,330 4,908 Total Cost 77,661 143,044
*The fixed costs ($/yr) were calculated assuming an average life expectancy of 20 years for all fixed costs and an interest rate of 7 percent. Note: Cost of calcium hypochlorite is higher than sodium hypochlorite due to high percentage of chlorine present.

7
For OSSF's, calcium hypochlorite is used in the form of tablets through a tablet feeder device. Wastewater is passed through the feeder into the contact tank for the initial reaction to occur. For designing a system, the product of the contact time and disinfectant residual concentration is used as a design parameter. The common problem with tablets is occurrence of overdosing, which causes risk of excess chlorine in the environment or under-dosing which, can be harmful to human health by incomplete disinfection. The use of liquid sodium hypochlorite (bleach) is more consistent; however it requires regular site visits to check the dosing equipment, which is undesirable for most OSSF owners. Presented in Table 8 are the relative strengths of the various chlorine technologies used along with some remarks as to the stability of the various forms used. Table 8. Chlorine generated products used for disinfection and their chlorine strength.
Product Strength (%) Remarks
Calcium hypochlorite 65-70 Stable, 2% active chlorine loss per year. Bleaching powder 30 Powder form (unstable). Sodium hypochlorite 2.5-10 Liquid form (unstable). Sodium dichloro-isocyanurate 50- 60 Very stable (5 year shelf life). Center for Affordable Water and Sanitation Technology, 2008 http://www.cawst.org/assets/File/chlorine.pdf.
Research (Solomon et al., 1998) has found that for an average dry weather flow of 1 million gallons per day the operation and maintenance cost was $49,300 per year with a chlorine dose of 5 – 20 mg/L. This annual cost included power consumption, cleaning supplies, equipment repair, and personnel cost. Due to the rising costs of dechlorination and hypochlorite compounds, as shown in Table 9, the overall cost of wastewater disinfection through chlorine has steadily risen over the years (EPA 1999).
Table 9. Estimated costs for 10 PPM chlorination and dechlorination systems.
ADWF1 (MGD) PWWF (MGD) System Components ($/yr)
*Fixed Costs 1 2.25 Chlorination 41,630 Dechlorination 34,928 Variable Costs UFC 239,000 Operation and
Maintenance 59,200
Total Cost 374,758 *Fixed Costs 100 175 Chlorination 968,355 Dechlorination 118,755 Variable Costs UFC 788,000 Operation and
Maintenance 721,800
Total Cost 2,596,910
*The fixed costs ($/yr) were calculated assuming an average life expectancy of 20 years for all fixed costs and an interest rate of 7 percent. Taken From: US EPA. 1999, Wastewater technology fact sheet for Chlorine disinfection. 1ADWF: Average dry weather flow, PWWF: Peak wet weather flow, UFC: Uniform Fire Code.
8
Ozone Disinfection
Use of Ozone (O3) as a drinking water disinfectant has been common in Europe since the 20th century. Its use as a disinfectant in the US has been limited; however, as the negative effects of chlorine are becoming more evident the use of ozone is increasing in popularity. In the state of Texas, East Texas power utility was the first water utility service to use ozone for purification of drinking water (Biozone Corp, 2010).
Ozone is a colorless, unstable gas and a powerful oxidizer. Ozone has greater disinfection capabilities compared to chlorine and other disinfectants due to its high oxidation potential (2.07 volts) ( Koltunski and Plumbridge, 2007). Ozone is used generally after secondary treatment and is also commonly used to control odor. Ozone decomposes quickly, does not leave any disinfection byproducts, such as chloramines, and has better tolerance to pH and temperature changes compared to chlorine (Solomon et al., 1998). Ozone breaks apart to its natural form of oxygen, during which the free radicals of oxygen attack foreign particles present in water. This leads to disintegration of bacteria or organic matter present in the water. This, along with an increase in the dissolved oxygen content in the water makes it ideal for discharge into an aquatic environment. Ozone has also been found to break down endocrine disrupting compounds and pharmaceutical and personal care products (Leong et al., 2008). While the benefits of ozone are numerous, there are some microorganisms that show resilience to its use. Cryptosporidium parvum is one such organism that has shown resilience to ozone (Leong et al., 2008), so laboratory tests should be run in order to determine the viability of using O3 with regard to these microorganisms.
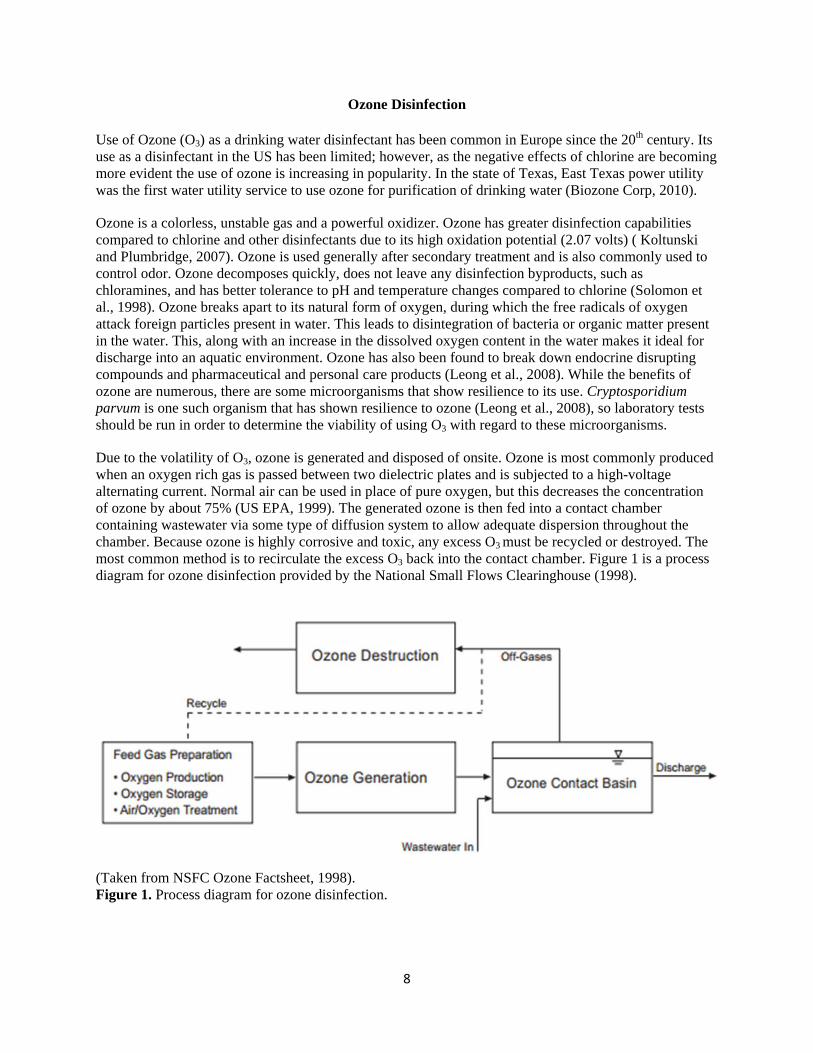
Due to the volatility of O3, ozone is generated and disposed of onsite. Ozone is most commonly produced when an oxygen rich gas is passed between two dielectric plates and is subjected to a high-voltage alternating current. Normal air can be used in place of pure oxygen, but this decreases the concentration of ozone by about 75% (US EPA, 1999). The generated ozone is then fed into a contact chamber containing wastewater via some type of diffusion system to allow adequate dispersion throughout the chamber. Because ozone is highly corrosive and toxic, any excess O3 must be recycled or destroyed. The most common method is to recirculate the excess O3 back into the contact chamber. Figure 1 is a process diagram for ozone disinfection provided by the National Small Flows Clearinghouse (1998).
(Taken from NSFC Ozone Factsheet, 1998). Figure 1. Process diagram for ozone disinfection.

9
Ozone technology is more complex compared to other technologies; the overall costs, while getting more economical, reflects these complexities. Several factors must be considered when designing an ozone disinfection system. These steps can be found with the EPA (1999) and include:
a) Determination of initial ozone demand and required applied ozone dosage.
b) Estimate ozone-transfer dosage and efficiency.
c) Determine required capacity for ozone generators and liquid oxygen tanks (if needed).
Costs Associated with Ozone Disinfection
As stated previously, ozone is a highly corrosive gas, and the equipment that comes into contact with it must be resistant. Stainless Steel 316, glass, and ceramic parts can increase the overall cost of the equipment, and replacement costs must also be taken into account. Other costs vary with design requirements and variations can be seen in Table 10, which include:
Table 10. Estimated costs for onsite ozone disinfection systems.
Flow Rate (GPH) System Components ($/yr)
*Fixed Costs 16 Oxygen Concentrator 179 Flood preventing device 24 Base unit 377 Installation 165 Variable Costs Oxygen input filter 75 Ozone injector 100 Ozone destructor 899 Maintenance cost 619 Total Cost 2,438 *Fixed Costs 200 Oxygen Concentrator 1,095 Flood preventing device 28 Base unit 2,738 Installation 570 Variable Costs Oxygen input filter 100 Ozone injector 150 Ozone destructor 1,590 Maintenance cost 3937 Total Cost 6,271 *The fixed costs ($/yr) were calculated assuming an average life expectancy of 20 years for all fixed costs and an interest rate of 7 percent. (Absolute Ozone, 2012).
While some of the equipment may be more expensive than that used for chlorine disinfection, the reduced size of the equipment and lack of required chemical storage can offset the price for a comparable system in many cases. Also, technology has allowed home users the ability to monitor their individual ozone production and contamination levels.

10
Ultraviolet Disinfection
Ultraviolet (UV) disinfection of water is the use of ultraviolet radiation to reduce the occurrence of pathogens and other micro-organisms in water. UV rays have been used for water purification for quite some time, with the first widespread usage of the method being initiated in Marseilles, France, from 1906 to 1910, to disinfect water from the river Durance. This was made possible by the development of the mercury vapor lamp and the use of Quartz for transmitting the UV rays (Baruth et al., 2005 ). Today the UV-C range of the spectrum, from 280 nm to 200nm, is most widely used because these wavelengths are absorbed most effectively by nucleic acid, making the process a viable purifying agent (Edzwald, 2011).
To illustrate the UV-A, UV-B and UV-C wavelengths, shown in Figures 2 and 3 is the spectrum of electromagnetic waves and a magnification of the UV portion within that spectrum. Recently, however, the UV-B portion is being studied for its photolyzation effect on proteic and other cellular material (Masschelein, 2002).
(Taken from Masschelein, 2002. p.5). Figure 2. The electromagnetic spectrum for the UV light spectrum.

11
(Taken from USEPA Manual, 2006. p. 2-2). Figure 3. The UV portion of the electromagnetic spectrum.
UV Application for Onsite Systems
An important application of ultraviolet treatment of water is its use for pretreatment of wastewater for onsite sewage facilities. To maximize the effectiveness of treatment, the wastewater should have the minimum possible amount of turbidity and a thin film of the water should be exposed to irradiation in a continuous flow process. The quantity of radiation to be delivered, measured in microwatt-seconds per square centimeter (mW-s/cm2), depends on factors such as the wastewater transmittance value, presence of bacteria and other pathogens, lamp, and sleeve condition. Commercially available wastewater systems employ design principles such as mercury vapor lamps of different pressures, horizontal or vertical layout of the irradiation chamber, quartz or Teflon as the sleeve material and water temperature. Shown in Figure 4 is a horizontal configuration for treating wastewater employing quartz as the separating material for the sleeve.
(Taken from US EPA Factsheet, 2010). Figure 4. Wastewater treatment in a horizontal UV chamber.
12
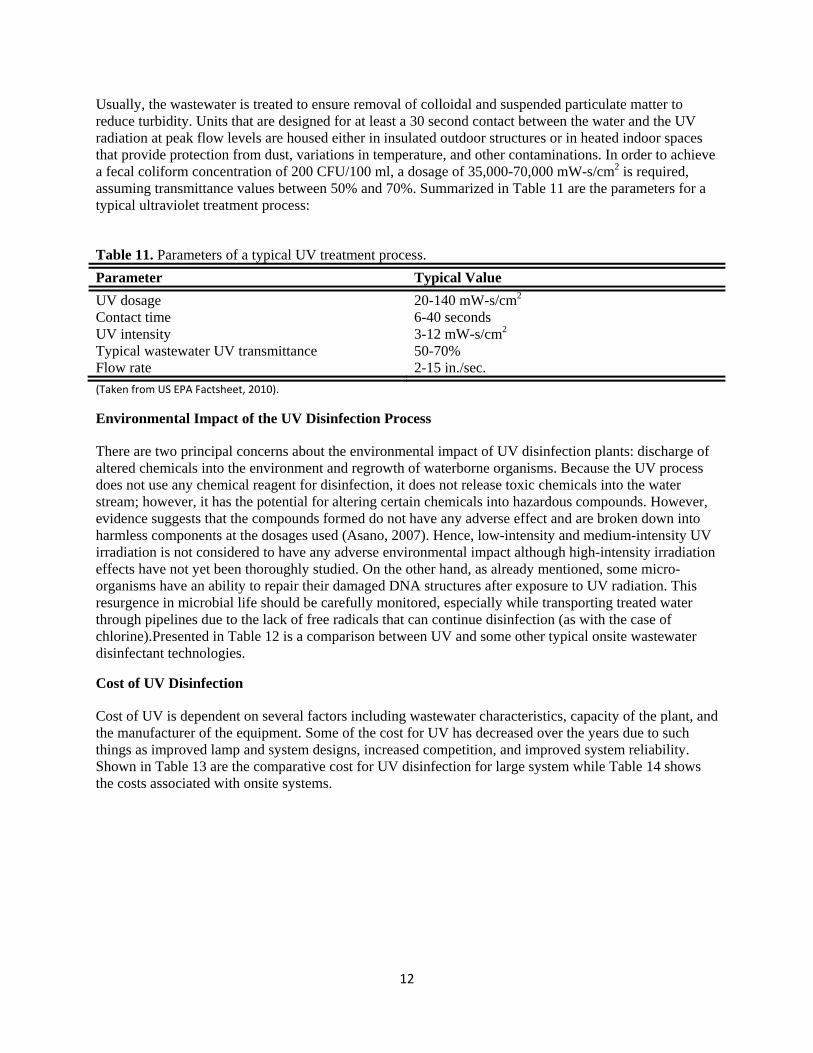
Usually, the wastewater is treated to ensure removal of colloidal and suspended particulate matter to reduce turbidity. Units that are designed for at least a 30 second contact between the water and the UV radiation at peak flow levels are housed either in insulated outdoor structures or in heated indoor spaces that provide protection from dust, variations in temperature, and other contaminations. In order to achieve a fecal coliform concentration of 200 CFU/100 ml, a dosage of 35,000-70,000 mW-s/cm2 is required, assuming transmittance values between 50% and 70%. Summarized in Table 11 are the parameters for a typical ultraviolet treatment process:
Table 11. Parameters of a typical UV treatment process.
Parameter Typical Value
UV dosage 20-140 mW-s/cm2 Contact time 6-40 seconds UV intensity 3-12 mW-s/cm2 Typical wastewater UV transmittance 50-70% Flow rate 2-15 in./sec.
(Taken from US EPA Factsheet, 2010).
Environmental Impact of the UV Disinfection Process
There are two principal concerns about the environmental impact of UV disinfection plants: discharge of altered chemicals into the environment and regrowth of waterborne organisms. Because the UV process does not use any chemical reagent for disinfection, it does not release toxic chemicals into the water stream; however, it has the potential for altering certain chemicals into hazardous compounds. However, evidence suggests that the compounds formed do not have any adverse effect and are broken down into harmless components at the dosages used (Asano, 2007). Hence, low-intensity and medium-intensity UV irradiation is not considered to have any adverse environmental impact although high-intensity irradiation effects have not yet been thoroughly studied. On the other hand, as already mentioned, some micro-organisms have an ability to repair their damaged DNA structures after exposure to UV radiation. This resurgence in microbial life should be carefully monitored, especially while transporting treated water through pipelines due to the lack of free radicals that can continue disinfection (as with the case of chlorine).Presented in Table 12 is a comparison between UV and some other typical onsite wastewater disinfectant technologies.
Cost of UV Disinfection
Cost of UV is dependent on several factors including wastewater characteristics, capacity of the plant, and the manufacturer of the equipment. Some of the cost for UV has decreased over the years due to such things as improved lamp and system designs, increased competition, and improved system reliability. Shown in Table 13 are the comparative cost for UV disinfection for large system while Table 14 shows the costs associated with onsite systems.

13
Table 12. Comparison between onsite disinfectants.
Disinfectant Formula Form Constraints
Sodium Hypochlorite NaOCl Liquid Corrosive and toxic. Forms carcinogenic byproducts. Requires chemical feed systems.
Calcium Hypochlorite Ca(OCl)2 Solid Tablet Corrosive and toxic. Forms carcinogenic byproducts. Requires tablet feed systems. Non-uniform tablet erosion may affect dosage.
Ozone O3 Gas Corrosive and toxic. Requires gas preparation unit and a pump for injection of ozone.
Peracetic Acid CH3CO3H Liquid Corrosive and toxic. Not available for all OSSF. Requires a chemical feed system.
UV Light - Radiation Requires periodic lamp replacement. Turbidity can reduce effectiveness.
(Leverenz et. al., 2006).
Table 13. Estimated costs for 5-10 MGD UV radiation systems.
System Components ($/yr)
*Fixed Costs Materials (lamps, ballasts, etc) 4,059 Labor cost 982 Variable Costs Power 416,000 kwh at $0.045/kwh 18,907 Total Cost 23,948 *The fixed costs ($/yr) were calculated assuming an average life expectancy of 20 years for all fixed costs and an interest rate of 7 percent. Table 14. Estimated cost comparison for onsite chlorination and UV systems.
System Components Chlorination ($/yr) UV ($/yr)
*Fixed Costs Installation 47 189 Chlorinator & Material 113 - Variable Costs Power - 40 Tablets 50 - Labor 100 100 Replacement 25 80 Total Cost 335 409 *The fixed costs ($/yr) were calculated assuming an average life expectancy of 20 years for all fixed costs and an interest rate of 7 percent. Source: US EPA 625/R-00/008 onsite Wastewater Treatment System Technology Fact Sheet, Effluent Disinfection Processes.
Membrane Disinfection
Membrane disinfection technologies have been in use with large flow treatment facilities for the last several decades. Membrane technologies utilize a pressure flux to reject particles down to 1 micron over a porous water permeable engineered membrane. There are several types of membrane technologies and are
14
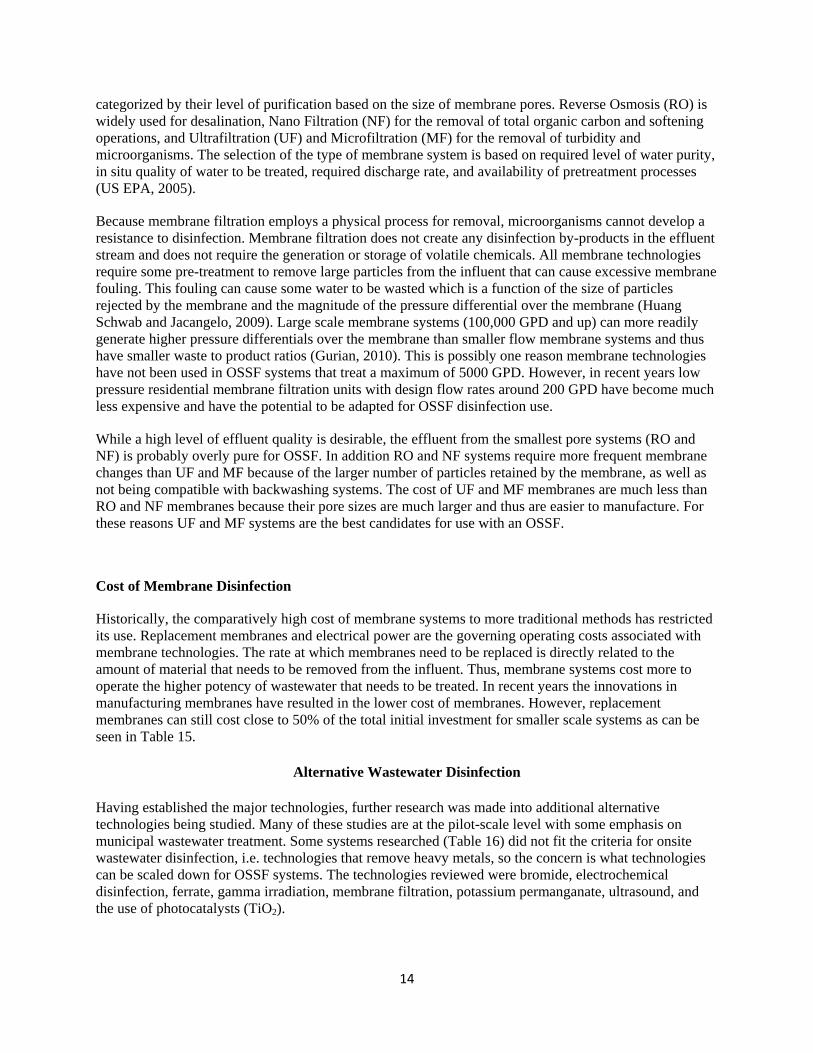
categorized by their level of purification based on the size of membrane pores. Reverse Osmosis (RO) is widely used for desalination, Nano Filtration (NF) for the removal of total organic carbon and softening operations, and Ultrafiltration (UF) and Microfiltration (MF) for the removal of turbidity and microorganisms. The selection of the type of membrane system is based on required level of water purity, in situ quality of water to be treated, required discharge rate, and availability of pretreatment processes (US EPA, 2005).
Because membrane filtration employs a physical process for removal, microorganisms cannot develop a resistance to disinfection. Membrane filtration does not create any disinfection by-products in the effluent stream and does not require the generation or storage of volatile chemicals. All membrane technologies require some pre-treatment to remove large particles from the influent that can cause excessive membrane fouling. This fouling can cause some water to be wasted which is a function of the size of particles rejected by the membrane and the magnitude of the pressure differential over the membrane (Huang Schwab and Jacangelo, 2009). Large scale membrane systems (100,000 GPD and up) can more readily generate higher pressure differentials over the membrane than smaller flow membrane systems and thus have smaller waste to product ratios (Gurian, 2010). This is possibly one reason membrane technologies have not been used in OSSF systems that treat a maximum of 5000 GPD. However, in recent years low pressure residential membrane filtration units with design flow rates around 200 GPD have become much less expensive and have the potential to be adapted for OSSF disinfection use.
While a high level of effluent quality is desirable, the effluent from the smallest pore systems (RO and NF) is probably overly pure for OSSF. In addition RO and NF systems require more frequent membrane changes than UF and MF because of the larger number of particles retained by the membrane, as well as not being compatible with backwashing systems. The cost of UF and MF membranes are much less than RO and NF membranes because their pore sizes are much larger and thus are easier to manufacture. For these reasons UF and MF systems are the best candidates for use with an OSSF.
Cost of Membrane Disinfection
Historically, the comparatively high cost of membrane systems to more traditional methods has restricted its use. Replacement membranes and electrical power are the governing operating costs associated with membrane technologies. The rate at which membranes need to be replaced is directly related to the amount of material that needs to be removed from the influent. Thus, membrane systems cost more to operate the higher potency of wastewater that needs to be treated. In recent years the innovations in manufacturing membranes have resulted in the lower cost of membranes. However, replacement membranes can still cost close to 50% of the total initial investment for smaller scale systems as can be seen in Table 15.
Alternative Wastewater Disinfection
Having established the major technologies, further research was made into additional alternative technologies being studied. Many of these studies are at the pilot-scale level with some emphasis on municipal wastewater treatment. Some systems researched (Table 16) did not fit the criteria for onsite wastewater disinfection, i.e. technologies that remove heavy metals, so the concern is what technologies can be scaled down for OSSF systems. The technologies reviewed were bromide, electrochemical disinfection, ferrate, gamma irradiation, membrane filtration, potassium permanganate, ultrasound, and the use of photocatalysts (TiO2).

15
Table 15. Estimated costs of various membrane technologies.
System Components
Reverse Osmosis ($/yr)
Nano Filtration ($/yr)
Microfiltration ($/yr)
Ultrafiltration ($/yr)
Flow Rate: 250 (GPD) *Fixed Costs Equipment 19 19 9 9 Variable Costs Membrane 75 65 55 55 Operating 35 33 20 25 Total Cost 129 117 84 89 Flow Rate: 500 (GPD) *Fixed Costs Equipment 189 189 47 47 Variable Costs Membrane 300 150 150 Operating 250 225 200 200 Total Cost 739 414 397 397 Flow Rate: 5,000 (GPD) *Fixed Costs Equipment 566 448 283 236 Variable Costs Membrane 2,000 1,500 1,500 1,250 Operating 750 690 550 550 Total Cost 3,316 2,630 2,333 2,036 *The fixed costs ($/yr) were calculated assuming an average life expectancy of 20 years for all fixed costs and an interest rate of 7 percent.
These technologies were compared with the three standard disinfection technologies currently in use in order to note the replacement requirements and similarities of processes. Some alternative technologies can operate with current equipment, while others require everything from a simple part change to a complete overhaul of the in-place system. Table 16 provides a quick, first review of the technologies that could potentially be used for onsite systems and some noted advantages and disadvantages.
Bromine Disinfection
One alternative to the use of chlorine for disinfecting wastewater is the use of bromine. Early tests have shown that bromochlorodimethylhydantion (BCDMH), a common pool and hot tub disinfector in the US, can reduce a comparable amount of bacteria in less time than sodium hypochlorite. In one study (Moffa and Davis, 2007), fecal coliform experienced a 4-log reduction after only three minutes with BCDMH as opposed to sodium hypochlorite which took five minutes for a 4-log reduction. This means that the reduced time needed for the water in a contact chamber can help offset the increased costs found in the purchase of chemicals. BCDMH also has a longer shelf life than sodium hypochlorite, although there will be some added expenses due to additional equipment needed such as an injection system and a mixing unit. Shown in Table 17 are estimated costs associated with bromide disinfection for various flow rate.
The most significant drawback to bromide is its highly reactive nature. The disinfection byproducts associated with bromide can be harmful to human health; therefore care must be exercised to avoid these risks. When used in conjunction with chlorine there is evidence showing an even greater increase in DBPs including THMs and haloacetic acids (Ying-Xue et al., 2009).

16
Peracetic Acid Disinfection
Peracetic acid, also known as peroxyacetic acid (PAA), is a very powerful oxidant and disinfectant and research into using PAA as water disinfectant has been going on since the 1980’s (Kitis, 1980). One Italian experiment, (Caretti and Lubello, 2003), found that using 2 ppm PAA with 192mJ/cm2 UV can purify wastewater to meet Italy’s legislative standards for agricultural reuse. Another study (Rossi et al., 2007) shows a 4-log reduction of E. coli with 5 to 10 mg/L concentration of PAA with a contact time of 35 to 50 minutes compares to a 5 to 15 mg/L concentration of chlorine with a contact time of 30 to 60 minutes. A review of PAA as a disinfectant (Kitis, 2003) states that while there are benefits to using PAA there are some considerable drawbacks. While PAA can boast a high kill rate and little toxic by-products, especially the bromination of phenol (Dell’Erba, 2007), there is an increase in the organic content of the effluent. This is caused by the remaining acetic acid acting as an additional food source. Another drawback for use of PAA as a disinfectant is the cost, which can be four or five times higher than sodium hypochlorite.
Ultrasonic Pre-Treatment
Disinfection through Ultraviolet irradiation is greatly hindered by the size of the suspended solids found in wastewater. Ultraviolet waves have difficulty penetrating water if solids within exceed 50µm. To reduce the overall size of the coliforms the water is exposed to ultrasonic sound waves between 170- 310 W/l for 5 to 10 seconds. In one experiment (Blume and Neis, 2003), this was sufficient to completely reduce the overall sizes of the coliforms by 25- 60%, thus enabling up to a 3.7 log reduction in total coliforms. While the use of ultrasound could be a useful pretreatment for reducing coliform size, more studies are needed before the benefits of total disinfection can be defined.
Electrochemical Disinfection
Much of the published data on the use of electrochemical disinfection is for the use of purifying drinking water; however, there are studies that show the effectiveness of these systems in wastewater disinfection. Generally, dimensionally stable anodes with titanium tips were used to send a current through the water, but boron-doped diamond (BDD) electrodes are quickly becoming the standard. The main drawback to electrochemical disinfection is the cost for power. One experiment that used a batch reactor system (Schmalz, 2009) showed a 3-log reduction in E. coli after 60 minutes at a current density of 2.5 mA/cm2 and a 4-log reduction after 1.4 minutes at 120mA/cm2. Another experiment (Perez, 2010) used an inline electrochemical cell that used a pump to continuously circulate water from a tank through the cell. In that experiment total E. coli reduction was found at 40, 20, and 10 minutes at 40, 80, and 120mA/cm2, respectively. Yet, another study (Li et al., 2010) showed the optimal current density for E. coli inactivation to be 20 mA/cm2, as well as a faster inactivation time with the presence of sodium sulfate (Na2SO4).The added power usage associated with electrochemical disinfection can be offset by other factors that can be seen as more favorable than using chlorine. Some of these factors include: no need for chemical storage (as with chlorine), no need for a chemical injection system, or a chemical destruction system (as with ozone). The most notable factor is the reduced formation of disinfection byproducts, such as trihalomethanes (THMs) compared to that of chlorine, which can reduce secondary treatment costs.

17
Table 16. Advantages and disadvantages of minor disinfection technologies.
Disinfection Method Advantages Disadvantages Bromide Lower contact time needed than
sodium hypochlorite. Can be stored longer than sodium hypochlorite.
Not widely used in US. Equipment upgrade needed.
Potassium Permanganate Very high kill rate. Minimal equipment upgrade needed from a chlorine system. Very low toxicity.
Expensive due to low production. Increases organic content of effluent.
Ultrasonic Pre-treatment Reduces coliform size making UV more efficient.
Must be teamed with a disinfectant.
Membrane Disinfection Effluent stream quality is very high. No disinfection residuals in effluent. Does not require generation or storage of volatile chemicals. Microorganisms cannot develop a resistance to treatment.
Some systems cannot use a backwashing process requiring more frequent replacement of membranes. All membrane filtration systems require some pre-treatment. Small scale systems have very high waste to product ratios. Effluent is probably overly pure for OSSF systems. Very little research has been done on the application of membrane filtration in OSSF systems and small scale operations in general.
Electrochemical Disinfection No oxidizing chemicals needed. Lower formations of DBPs. Forms hydroxyl radicals.
Energy intensive.
Ferrate Disinfection Very high oxidation potential. Requires less contact time than chlorine. Acts as a coagulant. Can achieve disinfection at. relatively low doses over a wide range of pH levels. No disinfection byproducts. (does not react with bromide). Irreversible inactivation of E. coli.
Still expensive to synthesize. Still in research phase, so technology is new. No commercial products available.
Gamma Irradiation No additional chemicals required. No DBPs. Forms hydroxyl radicals. Decreases BOD5 and COD levels to below irrigation standards. Good for removing metals.
Only feasible for industrial or municipal use. Expensive equipment. Gamma radiation leaks can occur.
Peracetic Acid Higher oxidation potential than chlorine. Virtually unaffected by pH. Low cost to upgrade existing equipment.
Unstable- will lose 1-2% of its active ingredients per month. A solution containing more than 15% PAA is highly volatile (explosive). Corrosive to rubber, galvanized iron, copper, brass, and bronze.
Photocatalytic Disinfection Increases UV efficiency. Expensive to synthesize. Poor quality without UV light.

18
Table 17. Estimated costs associated with peak large-flow 12 mg/L bromochlorodimethylhydantion (BCDMH) disinfection systems.
Flow Rate (MGD) System Components ($/yr)
*Fixed Costs 3.6 Equipment 7,552 Variable Costs Chemicals 400 Total Cost 7,952 *Fixed Costs 26.1 Equipment 18,314 Variable Costs Chemicals 2,500 Total Cost 20,814
*The fixed costs ($/yr) were calculated assuming an average life expectancy of 20 years for all fixed costs and an interest rate of 7 percent. (Moffa et al. 2007)
Ferrate Disinfection
Studies into the use of iron ferrate in wastewater disinfection have shown great promise on the municipal or industrial scale. Iron ferrate can be synthesized into several forms including FeVIO4
2-, HFeVO4-, and
FeIV(OH)4- by means of dry thermal synthesis, wet chemical synthesis, and electrochemical synthesis
(Sharma, 2010). Electrochemical synthesis can be performed onsite, thereby negating the need for storage (Sanford, 2009). Iron Ferrate is a powerful oxidizer and coagulant, and even has the ability to remove some metals from the water. However, due to the cost of producing ferrate, which can be seen in Table 18, this technology is currently suited for industrial or municipal purposes.
Gamma Irradiation
The process of gamma irradiation uses onsite industrial-sized gamma irradiators with dosage up to 6 kGy (6,000,000 rad) for primary and secondary treated effluents. Higher inactivation of bacteria was shown during secondary treatment due to increased levels of dissolved oxygen (Chu, 2011). Gamma irradiation was also found to be effective against metals, COD, and BOD present in the water (Tahri L. et al., 2010). While effective, the size and cost of the equipment necessary makes its viability for small onsite systems appears to be quite low at the present time.
Table 18. Typical costs of ferrate compounds.
Cost Variations For Potassium Ferrate
Company Chemical Name Compound Amount (g) Pricing ($) Sigma-Aldrich+ Potassium ferrate(VI) K2FeO4(s) 25 60.50 Sigma-Aldrich+ Potassium ferrate(VI) K2FeO4(s) 100 228.50 Sigma-Aldrich+ Potassium ferrate(VI) K2FeO4(s) 500 1,140.00 Sigma-Aldrich+ Potassium ferrate(VI) K2FeO4(s) 1 211.00 Sigma-Aldrich+ Potassium ferricyanide(III) K3Fe(CN)6(s) 50 31.00 Sigma-Aldrich+ Potassium ferricyanide(III) K3Fe(CN)6(s) 250 77.00 GFS Chemicals* Potassium iron (VI) oxide K2FeO4(s) 10 103.10 GFS Chemicals* Potassium iron (VI) oxide K2FeO4(s) 50 257.50 GFS Chemicals* Potassium iron (VI) oxide K2FeO4(s) 250 592.40 +(Source Sigma Aldrich Chemicals < http://www.sigmaaldrich.com/catalog>) *(Source: Taken from GFS Chemicals < www.gfschemicals.com>)

19
Photocatalyst (TiO2) Disinfection
The use of titanium dioxide (TiO2) is quickly becoming a universal protectant for surfaces that need to remain sterile. The use of TiO2 for wastewater disinfection is similar to that of ferrate and chlorine. The powder form of the compound is introduced to the system via a rapid mix operation and the mix is then introduced to UV light. UV light is important due to the photocatalytic nature of titanium dioxide. Studies have shown poor disinfection capabilities without the use of UV (Miranda-Garcia et al., 2012). Use of titanium dioxide for a pretreatment to UV can be a viable option, but as stated, not as a disinfection method in-and-of itself.
Conclusions
When it comes to examining technologies that deal with disinfection of streams of water, there are a large number of technologies available. If you narrow the field to only wastewater, the number of technologies is still quite limitless. The issue of concern is to understand the total benefits of one technology over another while at the same time considering the cost of the alternative systems. The literature reviewed on the subject of disinfection technologies resulted in more questions than answers, but it also proved that there are a great number of people addressing the issue. The literature reviewed for this report considered the viability and applicability of various treatment techniques, more specifically for onsite sewage facilities (OSSFs). The primary treatment techniques reviewed were chlorination, ultraviolet irradiation, ozone, and membrane filtration. These technologies are the most widely accepted techniques; therefore, more data can be found regarding installation costs, maintenance costs, and life cycles of the systems. Although chlorine is still the most widely used, the ongoing discoveries of disinfection byproducts (DBPs) have caused consumers and manufacturers to seek alternative ways to disinfect effluents from onsite sewage facilities. Other technologies that show promise and are currently in various phases of research include bromide, potassium permanganate, peracetic acid, ultrasonic irradiation, ferrate oxide, gamma irradiation, electrochemical disinfection, and photocatalytic disinfection. One of the biggest problems with making a complete analysis of the various technologies is obtaining sufficient cost information for the small-scaled systems such as the onsite systems since most of the technologies have been used primarily for municipal-scaled systems. Even though the use of chlorine has been the most widely used technology for disinfecting onsite effluents, it has many disadvantages that cause researchers and practitioners to seek an alternative technology. This is especially true because of the various by-products produced, the hazards of handling chlorine, and the fact that it does not remove some harmful organisms, even though it is often the more cost effective process. Even though ozone is more effective than chlorine at removing more of the harmful organisms in the effluent, the ozone can be a bit more difficult to work with due to such things as the corrosive nature and the resulting need for special equipment. When comparing the annualized cost between ozone and chlorine, the difference is relatively small. When comparing the four primary disinfection technologies, one can conclude that UV and ozone are the better technologies to replace chlorine. While the membrane technologies are promising, there is still much research that needs to be completed to reduce the problems of how to deal with the life of the membrane along with the maintenance issues of cleaning the membrane. Of the alternative, newer, technologies, electrochemical disinfection, ferrate disinfection, and bromide show more promise for use with onsite system effluents while others are more applicable to the large-scale municipal or industrial treatment facilities due to the cost of equipment and materials.

20
References
Absolute Ozone ® Corporation, (1995), “Ozone Generator Order Form” Accessed at <http://www.absoluteozone.com/ozone_generator_orderform.htm> (accessed on 5/20/2011)
Adams, J., Bartley, B. (2007). "Nanofiltration for Removal of Drinking Water Disinfection By-Product Precursors." Report EPA/600/S-07/019, ETV Drinking Water Systems Center, U.S. Environmental Protection Agency., Washington D.C.
Asano, T., Burton F., Leverenz, H., Tsuchihahshi H., Tchobanoglous, G.(2007). “Water Reuse: Issues Technologies, and Applications.” McGraw Hill, New York, 11(6), 711.
Baruth, E. (2005). “Water Treatment Plant Design.” 4th Ed., McGraw-Hill, New York, 29(1), 2.
BiOzone® Corporation, (2010). “Ozone Water Treatment” Accessed at <http://www.biozone.com/ozone_water_treatment.html> (accessed on 03/14/2010)
Blume, T., Neis, U. (2004). “Improved Wastewater Disinfection by Ultrasonic Pre-treatment.”, Ultrasonics Sonochemistry, 11(1), 333-336.
Caretti, C., Lubello, C, (2003). “Wastewater disinfection with PAA and UV Combined Treatment: A Pilot Plant Study.”, Water Research, 37(1), 2365-2371.
Centre for Affordable Water and Sanitation Technology, (2008). "Chlorine Disinfection." Accessed at <http://www.cawst.org/assets/File/chlorine.pdf> (accessed on 04/16/2011).
Clement S., Casey, P., Mackne, C., Lake, A. (1998) “Ozone Disinfection; Factsheet,” National Small Flows Clearinghouse, Environmental Technologies Initiative.
Dell’Erba, A., Falsanisi, D., Liberti, L., Notarnicola, M., Santoro, D. (2007) “Disinfection by-products formation during wastewater disinfection with peracetic acid.” Desalination 215, 177-186.
GFS Chemicals. “Potassium Ferrate, Ferrateca Brand” < http://www.gfschemicals.com/statics/productdetails/POTASSIUM_FERRATE_5449.html> (accessed online on 10/1/2012)
Huang, H., Schwab, K., Jacangelo, J. (2009). "Pretreatment for Low Pressure Membranes in Water Treatment: A Review," Johns Hopkins University, Baltimore, MD.
Kitis, M., (2003). “Disinfection of Wastewater with Peracetic Acid: A Review.”, Environment International. 30(1), 47-55.
Koltunski, E., Plumridge, J. (2007). “Ozone as a Disinfecting Agent in the Reuse of Wastewater.” Ozonia Ltd., Duebendorf, Switzerland.

21
Leong, L., Kuo, J., Tang, C. (2008). “Disinfection of Wastewater Effluent- Comparison of Alternate Technologies,” Water Environment Research Foundation Report and IWA Publishing, Alexandria, VA.
Leverenz H., Darby J. (2006). “Evaluation of Disinfection Units for On-site Wastewater Treatment Systems.” University of California, Davis, California. Li, H., Zhu, X.;, Ni, J. (2010) “Inactivation of Escherichia coli in Na2SO4 electrolyte using boron-doped diamond anode.” Electrochimica Acta 56. Department of Environmental Engineering, Peking University. Beijing, China 448-453.
Libing C., L., Wang, L., Wang, B. (2011), “Effects of gamma irradiation on activities and physical psysicochemical characterisitics of sewage sludge,” Biochemical Engineering Journal 54, 34-39.
Masschelein, W., (2002). “Ultraviolet Light in Water and Wastewater Sanitation.” Lewis Publishers. Boca Raton, Florida, 1(3), 7. Miranda-Garcia, N., Suarez, S., Sanchez, B., Coronado,
Miranda-Garcia, N., Suarez, S., Sanchez, S., Coronado, J., Malato, M., Maldanado, M. (2011). Photocatalytic degradation of emerging contaminants in municipal wastewater treatment plant effluents using immobilized TiO2 in a solar pilot plant. Applied Catalysis B: Environmental. 103, 294-301.
Moffa, P., Davis, D., Somerlot, C., Sharek, D., Gresser, B., Smith, T., (2007) “Going for the Kill: Alternative disinfection Technology Demonstrates Advantages for Wet Weather Applications.”, Water and Environmental Technology, 19(1), 46-51.
National Small Flows Clearinghouse. (1998) “Ozone Fact Sheet.” Environmental Technology Initiative, WWFSGN100 Accessed at <http://www.nesc.wvu.edu/pdf/WW/publications/eti/Ozone_Dis_gen.pdf> (accessed on 6/1/2011)
Perez, G, Gomez, P., Ibanez, R.,Ortiz, I.,Urtiaga, A. (2010). "Elechrochemical disinfection of secondary wastewater treatment plant (WWTP) effluent," Water Science & Technology, 624, 892-897. Rossi, C. Antonelli, M. Mezzanotte, V. Nurizzo, C. (2007) “Peracetic Acid Disinfection: A feasible alternative to wastewater chlorination.” Water Environment Research Volume 79, Number 4. Italian Ministry of Research and University, Rome, Italy.
Schmalz, V., Dittmar, T., Haaken, D., Worch, E. (2009). "Electrochemical disinfection of biologically treated wastewater from small treatment plant by using boron-doped diamond (BDD) electrodes- Contribution for direct reuse of domestic wastewater." Water Research, 43, 5260-5266.
Sharma, V. (2010). “Oxidation of inorganic contaminants by ferrates (VI, V, and IV)- kinetics and mechanisms: A review.” Journal of Environmental Management 92, 1051-1073.
22
Shah, J., Qureshi, N. (2008) "Chlorine Gas vs. Sodium Hypochlorite: What's the Best Option?" Progressive Consulting Engineers. Minneapolis, MN.
Sigma Aldrich Co. LLC. “Product Catalog” <http://www.sigmaaldrich.com/catalog/product/ALDRICH/723835?lang=en>. <http://www.sigmaaldrich.com/catalog/product/ALDRICH/480010?lang=en>. <http://www.sigmaaldrich.com/catalog/product/sial/702587?lang=en>. (accessed online 10/01/2012)
Solomon, C., Casey, P., Mackne, C., Lake, A., (1998). “Ozone Disinfection,” Environmental Technology Initiative. National Small Flows Clearinghouse, Washington, D.C.
Edzwald, J. (2011). “Water Quality & Treatment: A Handbook on Drinking Water,” 6th Ed., McGraw Hill, New York, 18(1), 4. Gurian, P.L., (2010). "Microfiltration Cost Benchmarking for Large Facilities," Dept. of Civil Engineering, Drexel, Philadelphia, PA.
Stanford, C., Jia-Quian J., Alsheyab, M. (2009) “Electrochemical Production of Ferrate (Iron VI): Application to the Wastewater Treatment on a Laboratory Scale and Comparison with Iron (III) Coagulant.” Water Air Soil Pollution 209, 483-488.
Tahri, L., Elgarrouj, D., Zantar, S., Mouhib, M., Azmani, A., Sayah, F., (2010) “Wastewater treatment using gamma irradiation: Tétouan pilot station, Morocco.” Radiation Physics and Chemistry 79, 424-428.
Taylor, J., Hong S. (2000). "Potable Water Quality and Membrane Technology." CE Update, 563-568.
United States Environmental Protection Agency (EPA), (1980). “On-site Wastewater Treatment Systems Technology Fact Sheet 4.” Washington, D.C.
United States Environmental Protection Agency (EPA), (1999). “Combined Sewer Overflow Technology Fact Sheet Chlorine Disinfection.” Washington, D.C.
United States Environmental Protection Agency (EPA), (1999). “Wastewater Disinfection Fact Sheet: Ozone.” Washington, D.C.
United States Environmental Protection Agency (EPA) (1999). “Wastewater Technology Fact Sheet: Chlorine Disinfection.” Washington, D.C.
United States Environmental Protection Agency (EPA), (2002). “Onsite Wastewater Treatment Systems Manual,” Washington, D.C.
United States Environmental Protection Agency (EPA), (2005). “Membrane Filtration Guidance Manual.”, Washington, D.C. Ying-Xue S., Qian-Yuan W., Hong-Ying H., Tian, J. (2009) “Effect of Bromide on the formation of disinfection by-products during wastewater disinfection.” Environmental Simulation and Pollution Control. Department of Environmental Science and Engineering, Tsinghua University, Beijing 100084, P. R. China. 2391-2398