review of discharge characteristics – physical properties
TRANSCRIPT
Review of discharge characteristics – physical properties (every 10mins) monitoring licence conditions for the Adelaide Desalination
Plant: June 2014
Prepared for
AdelaideAqua Pty Ltd
Report number 12 in the series
By
Prof. Anthony Cheshire B.Sc. Ph.D. MAICD
Science to Manage Uncertainty
Adelaide, South Australia.
http://www.science-to-manage-uncertainty.com.au
18-Jun-2014
ADP Licence condition independent review Overview Page i
Science to Manage Uncertainty
Document control
Title Review of discharge characteristics – physical properties (every 10mins) monitoring licence conditions for the Adelaide Desalination Plant
Revision 5
Author Anthony Cheshire
Client AdelaideAqua Pty Ltd
Date finalised 18-Jun-2014
Distribution Vanesa Ayala
Version Final version for publication
For citation purposes this document should be referred to as:
CHESHIRE, A.C. (2014). REVIEW OF DISCHARGE CHARACTERISTICS – PHYSICAL PROPERTIES (EVERY 10MINS)
MONITORING LICENCE CONDITIONS FOR THE ADELAIDE DESALINATION PLANT, JUNE 2014. REPORT 12
IN A SERIES PREPARED FOR ADELAIDEAQUA PTY LTD BY SCIENCE TO MANAGE UNCERTAINTY PP: 17.
ADP Licence condition independent review Page ii
Science to Manage Uncertainty
Table of contents
EXECUTIVE SUMMARY ................................................................................................................................... 1
PURPOSE .............................................................................................................................................................. 1
BACKGROUND ..................................................................................................................................................... 1
APPROACH .......................................................................................................................................................... 2
Specific requirements ..................................................................................................................................... 2
General requirements .................................................................................................................................... 2
CONCLUSION ....................................................................................................................................................... 2
LICENCE CONDITION: DISCHARGE MONITORING - DISCHARGE EVERY 10MINS
MONITORING ..................................................................................................................................................... 3
SPECIFIC REQUIREMENT (SEE ATTACHMENT A – MARINE MONITORING SCHEDULE): ......................................... 4
OVERALL SUMMARY IN RELATION TO DISCHARGE MONITORING - DISCHARGE EVERY 10MINS MONITORING ....... 4
APPENDIX A KEY DATES IN PLANT CONSTRUCTION AND OPERATION ............................... 14
ADP Licence condition independent review Overview Page 1
Science to Manage Uncertainty
EXECUTIVE SUMMARY
Purpose This document represents a report on the extent to which monitoring of discharge character - physical characteristics from selected sites in the vicinity of Port Stanvac meets with the EPA Licence Conditions for the construction and operation of the Adelaide Desalination Plant (ADP) over the period February 2009 to 12-Dec-2013. The monitoring reports were associated with the construction (including commissioning) of the desalination plant (by AdelaideAqua D&C Consortium – AAD&C) from February 2009 to 12-Dec-2012 and to the operation of the desalination plant (AdelaideAqua Pty Ltd) from 12-Dec-2012 to 12-Dec-
2013.
Background AdelaideAqua Pty Ltd is the operator of the Adelaide Desalination Plant at Port Stanvac South Australia. Operation of the ADP requires the discharge of reject water to the marine
environment; this activity was originally conducted under a licence issued to AAD&C by the Environment Protection Authority of South Australia (EPA Licence Number 26902) and subsequently under another licence issued to AAPL (EPA Licence Number 39143). These licences authorised AAD&C and AAPL to undertake a series of activities of environmental significance under Schedule 1 Part A of the Environment Protection Act 1993 (the Act). The licences had specific requirements in relation to “Discharges to Marine Waters” that are the
subject of this report.
Section 14 (305-626) of the licence requires that the licensee must ensure that:
1. An independent review of all marine monitoring is conducted by independent
specialist(s) as approved in writing by the EPA prior to the review commencing;
2. All marine monitoring from the period commencing with the issue of the licence and
ending 12 months after project handover of the 100 GL desalination plant is included
in the review; and
3. The full results of the review are provided to the EPA not more than 18 months after
project handover of the 100 GL desalination plant.
The EPA has also advised that prior to appointment, the independent reviewer must be able
to demonstrate to the EPA that:
1. They will use their own professional judgment;
2. They will take appropriate specialised advice when the issue is outside their
expertise;
3. Their opinions will be reached independently;
4. In forming opinions, they will not be unduly influenced by the views or actions of
others who may have an interest in the outcome of the review; and
5. They must declare any real or apparent conflict of interest.
With the approval of the EPA, Anthony Cheshire (the author of this report) was selected by
AdelaideAqua Pty Ltd (AAPL) to undertake this review.
ADP Licence condition independent review Overview Page 2
Science to Manage Uncertainty
Approach This review of discharge characteristics – physical properties (every 10mins) monitoring encompassed a study of all documentation provided by AdelaideAqua Pty Ltd which comprised a series of 24 monitoring reports each of which was produced by staff at AAD&C, AAPL or by experts contracted by the parties for that purpose.
Each report has been critically reviewed and key issues that pertain to compliance with the licence conditions have been aggregated into a summary that has been presented in this report.
Specific requirements
To consider the work done against the Scheduled Marine Monitoring Requirements detailed in Attachment A to Licences 26902 and 39143. These being:
Licence 26902 & Licence 39143: Measure conductivity, temperature, DO, pH and Chlorine of whole of effluent discharge every 10 minutes.
General requirements
In addition the EPA require that the Independent Reviewer is to undertake a technical review of all marine monitoring results from the commencement date of the Licence 26902 (D&C) until 12 December 2013 (12 months after plant handover) in order to assess the environmental impact of the desalination plant. This matter will be addressed in a subsequent report.
Conclusion The average coverage for the physical properties of the discharge is 79% (number of valid data readings relative to the number expected for complete coverage). Overall the data coverage for Temperature (87%) and pH (85%) was better than for Conductivity (79%), Chlorine (73%) and DO (70%). This is largely to be expected as Chlorine and DO probes both require substantially more maintenance and calibration than other sensors.
There were some notable periods when data coverage was insufficient notably: 1. Prior to 1-Jan-2012 when no data were recorded. 2. There was no data coverage in March 2012.
3. There were many months (Table 1) where data coverage was below 60% for one or more of the discharge sources, for one or more of the sensors. However, when a weighted average is taken that adjusts the number of data records for the actual number of ten minute periods when flow occurred from one or more of these sources then these periods of reduced coverage have only a minor impact on the overall coverage).

ADP Licence condition independent review Overview Page 3
Science to Manage Uncertainty
LICENCE CONDITION: DISCHARGE MONITORING - DISCHARGE EVERY
10MINS MONITORING In the following the specific requirements pertaining to the licence condition (discharge characteristics – physical properties (every 10mins)) are summarised along with information about the documents that have been reviewed.
Documents reviewed for this licence condition:
Document Name Reference
2012_1 EPA_january discharge charcteristics 12 All.xlsx
AdelaideAqua, (2012). Discharge Characteristics - Physical Properties (10 minute data) for January 2012. AdelaideAqua Pty Ltd.
2012_2 EPA_February_Discharge characteristics 12.xlsx
AdelaideAqua, (2012). Discharge Characteristics - Physical Properties (10 minute data) for February 2012. AdelaideAqua Pty Ltd.
2012_3 EPA_March Discharge 12 All.xlsx
AdelaideAqua, (2012). Discharge Characteristics - Physical Properties (10 minute data) for March 2012. AdelaideAqua Pty Ltd.
2012_4_EPA_APRIL_12 ALL.XLSX AdelaideAqua, (2012). Discharge Characteristics - Physical Properties (10 minute data) for April 2012. AdelaideAqua Pty Ltd.
2012_5_EPA_MAY_12 ALL.XLSX AdelaideAqua, (2012). Discharge Characteristics - Physical Properties (10 minute data) for May 2012. AdelaideAqua Pty Ltd.
2012_6_EPA_JUNE_12 ALL.XLSX AdelaideAqua, (2012). Discharge Characteristics - Physical Properties (10 minute data) for June 2012. AdelaideAqua Pty Ltd.
2012_7 EPA_JULY_ ALL discharge characteristics_12.XLSX
AdelaideAqua, (2012). Discharge Characteristics - Physical Properties (10 minute data) for July 2012. AdelaideAqua Pty Ltd.
2012_8 EPA_AUGUST_All discharge characteristics 12.xlsx
AdelaideAqua, (2012). Discharge Characteristics - Physical Properties (10 minute data) for August 2012. AdelaideAqua Pty Ltd.
2012_9 EPA_SEPTEMBER_12 ALL discharge characteristics.XLSX
AdelaideAqua, (2012). Discharge Characteristics - Physical Properties (10 minute data) for September 2012. AdelaideAqua Pty Ltd.
2012_10_EPA_October_c_12.xlsx AdelaideAqua, (2012). Discharge Characteristics - Physical Properties (10 minute data) for October 2012. AdelaideAqua Pty Ltd.
2012_11_EPA_November_c_12.xlsx AdelaideAqua, (2012). Discharge Characteristics - Physical Properties (10 minute data) for November 2012. AdelaideAqua Pty Ltd.
2012_12_EPA_December_c_12.xlsx AdelaideAqua, (2012). Discharge Characteristics - Physical Properties (10 minute data) for December 2012. AdelaideAqua Pty Ltd.
2013_01_EPA_January_c_12.xlsx AdelaideAqua, (2013). Discharge Characteristics - Physical Properties (10 minute data) for January 2013. AdelaideAqua Pty Ltd.
2013_02_EPA_February_c_12.xlsx AdelaideAqua, (2013). Discharge Characteristics - Physical Properties (10 minute data) for February 2013. AdelaideAqua Pty Ltd.
2013_03_EPA_March_c_12.xlsx AdelaideAqua, (2013). Discharge Characteristics - Physical Properties (10 minute data) for March 2013. AdelaideAqua Pty Ltd.

ADP Licence condition independent review Overview Page 4
Science to Manage Uncertainty
Document Name Reference
2013_04_EPA_April_c_12.xlsx AdelaideAqua, (2013). Discharge Characteristics - Physical Properties (10 minute data) for April 2013. AdelaideAqua Pty Ltd.
2013_05_EPA_May_c_12.xlsx AdelaideAqua, (2013). Discharge Characteristics - Physical Properties (10 minute data) for May 2013. AdelaideAqua Pty Ltd.
2013_06_EPA_June_c_12.xlsx AdelaideAqua, (2013). Discharge Characteristics - Physical Properties (10 minute data) for June 2013. AdelaideAqua Pty Ltd.
2013_07_EPA_July_c_12.xlsx AdelaideAqua, (2013). Discharge Characteristics - Physical Properties (10 minute data) for July 2013. AdelaideAqua Pty Ltd.
2013_08_EPA_August_c_12.xlsx AdelaideAqua, (2013). Discharge Characteristics - Physical Properties (10 minute data) for August 2013. AdelaideAqua Pty Ltd.
2013_09_EPA_September_c_12.xlsx AdelaideAqua, (2013). Discharge Characteristics - Physical Properties (10 minute data) for September 2013. AdelaideAqua Pty Ltd.
2013_10_EPA_October_c_12.xlsx AdelaideAqua, (2013). Discharge Characteristics - Physical Properties (10 minute data) for October 2013. AdelaideAqua Pty Ltd.
2013_11_EPA_November_c_12.xlsx AdelaideAqua, (2013). Discharge Characteristics - Physical Properties (10 minute data) for November 2013. AdelaideAqua Pty Ltd.
2013_12_EPA_December_c_12.xlsx AdelaideAqua, (2013). Discharge Characteristics - Physical Properties (10 minute data) for December 2013. AdelaideAqua Pty Ltd.
Specific requirement (see Attachment A – Marine Monitoring Schedule): Licence 26902 & Licence 39143: Measure conductivity, temperature, DO, pH and Chlorine of whole of effluent discharge every 10 minutes.
Overall summary in relation to monitoring of discharge The discharge characteristics for the outfall are made up out of six streams from different parts of the plant. The information below lists the details of the various discharge streams and the tanks and instrumentation used for reporting purposes for the plant.
Saline concentrate buffering tanks from SP1 and SP2 (Source SCBT1 and SCBT2 respectively) hold saline concentrate for pH buffering prior to discharge. To determine if there was a discharge occurring from the Saline Concentrate Buffering tank number 1 flow meter 951-FIT-1001B was used and for SCBT2 flow meter 951-FIT-2001B.
• Salinity data will be valid in the range of 32-85ppt.
• Conductivity meter used: 951-CIT-1501 for SP1 and 951-CIT-2501 for SP2.
• Brine pH will be in the range >4. pH meter used: 951-AIT-1504 and 951-AIT-2504.
• Brine DO will be in the range 4-11.5 mg/L. DO meter used: 951-AIT-1502 and 951-AIT-
2502.
• Temperature – no range limitation. Temperature meter used: 951-TIT-1501 and 951-
TIT-2501.

ADP Licence condition independent review Overview Page 5
Science to Manage Uncertainty
• Chlorine range <0.1mg/L. Chlorine meter used 951-AIT-1501 and 951-AIT-2501.
During the commissioning stages significant problems were encountered with the on
line Chlorine analyser and analysis was done manually for most of the time until such
a point that the instrument was running reliably. A hand held chlorine testing unit
(Palintest) was used during times that the online chlorine instrument was not
available. The Palintest unit has a practical limit of detection of <0.1mg/l . Data is
presented as >0.1mg/l to represent this. If both the on-line and the hand held
instrument were providing reliable data this overlap is included in the data
presented.
If any of the data are outside those ranges, data will not be considered representative. These
criteria are established based on the WQ of the water in Gulf St. Vincent and includes a relatively large margin of error.
UF CIP Neutralization tank 1 and 2 (Source UFCIP1 and UFCIP2 respectively). To determine if there was a discharge occurring from UFCIP1 valve 910-XV-1001E was used and for UFCIP2 valve 910-XV-2001E was used. Values above 1% of the valve value were considered to represent discharges from these tanks.
• Salinity - no range limitation. Conductivity meter used: 910-CIT-1001E for SP1 and 910-CIT-
2001E for SP2.
• pH - no range limitation. pH meter used: 910-AIT-1001A and 910-AIT-2001A.
• DO will be <11.5 mg/L. DO meter used: 910-AIT-1001F and 910-AIT-2001F.
• Temperature - no range limitation. Temperature meter used: 910-TIT-1001 and 910-TIT-
2001.
• Chlorine - no range limitation. Chlorine meter used 910-AIT-1001C and 910-AIT-2001C. Same
comments as per the previous tank.
Holding tank (Source Holding). To determine if there was a discharge occurring from the
holding tank the flow meter 951-FIT-1001A was used.
• Salinity - no range limitation. Conductivity meter used: 904-CIT-0204.
• pH – no range limitation. pH meter used: 904-AIT-0201.
• DO will be <11.5 mg/L. DO meter used: 904-AIT-0205.
• No limits for temperature. Temperature meter used: 951-TIT-0002.
• Chlorine - no range limitation. Chlorine meter used 910-AIT-0202. Same comments as per the
previous tank.
Waste and Drains tank (Source W&D). To determine if there was a discharge occurring from the Waste and Drains tank the valve 904-XV-0008 was used that when it opens empty the tank. Values above 0.1% of the valve were considered discharge from the tanks.
• Salinity - no range limitation. Conductivity meter used: 904-CIT-0204.
• pH - no range limitation. pH meter used: 904-AIT-0201.
• DO will be <11.5 mg/L. DO meter used: 904-AIT-0205.
• Temperature - no range limitation. Temperature meter used: 951-TIT-0001.

ADP Licence condition independent review Overview Page 6
Science to Manage Uncertainty
Chlorine - no range limitation. Chlorine meter used 910-AIT-0202. Same comments as per the
previous tank.
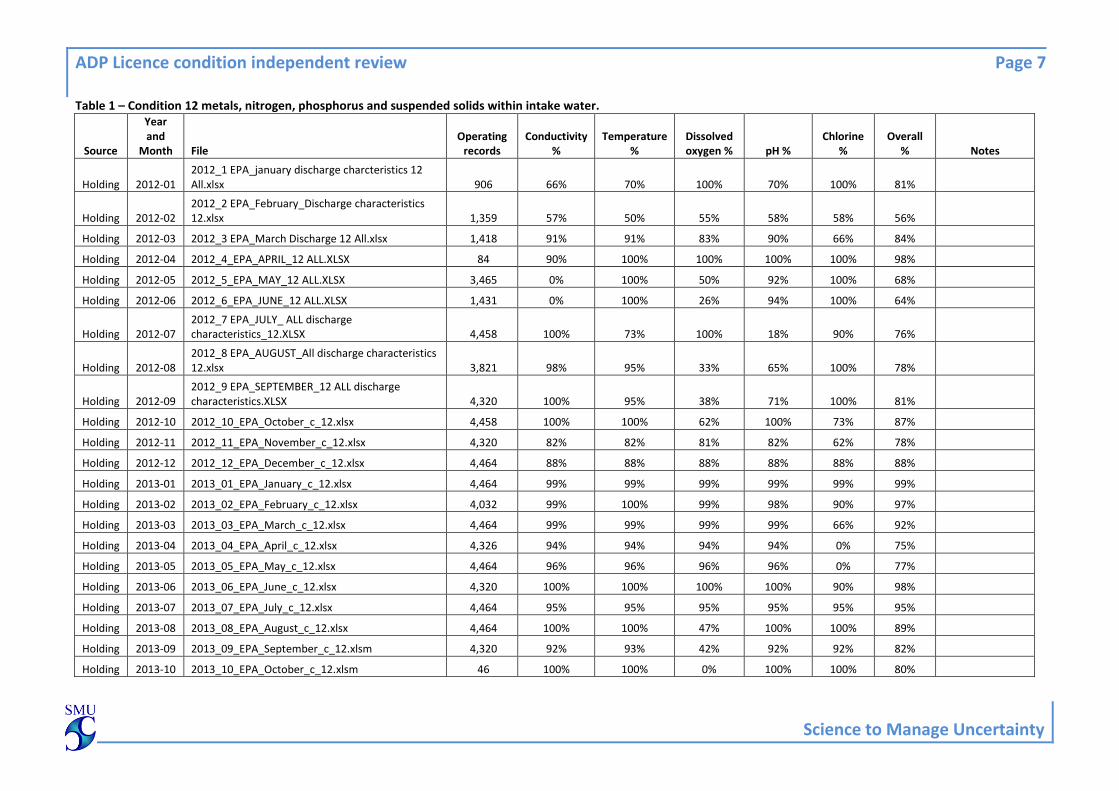
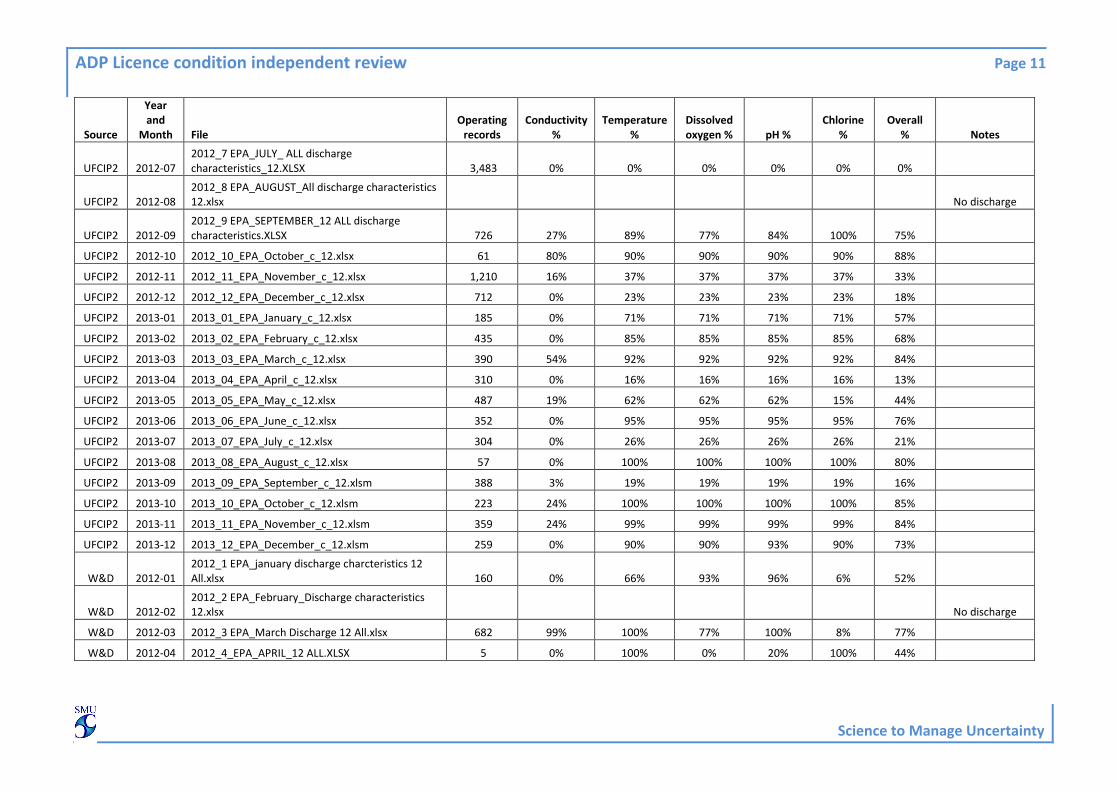
Table 1 presents a summary of the data obtained from monitoring each of these sources. Overall a total of 264,784 data records were expected for each of Conductivity, Temperature, Dissolved Oxygen (DO), pH and Chlorine. The values shown in Table 1 are weighted averages across all monitoring periods and take account of the number of “valid readings” for each month from 1-Jan-2012 to 31-Dec-2013. Given that the various sources were not discharging constantly any estimate of the number of valid records needs to take specific account of the operating periods for each discharge source.
For the purposes of this Licence condition the data have been validated against a series of
reasonableness criteria; values that do not meet those criteria have been excluded. Percentage coverage has been determined based on the number of valid data records obtained as a percentage of the number of records expected based on the assumption that one data record would be required for each parameter for every 10 minute period that a discharge was occurring from any given source.
No attempt has been made to interpret the data other than to report the coverage the various parameters (noting that data were provided for review in a series of EXCEL files as detailed above).
Overall data coverage for the physical properties of the discharge water (Table 1) was good1 comprising an average coverage of 79%. Overall the data coverage for Temperature (87%)
and pH (85%) was better than for Conductivity (79%), Chlorine (73%) and DO (70%). This is largely to be expected as Chlorine and DO probes both require substantially more maintenance and calibration than other sensors.
There were some notable periods when data coverage was insufficient notably: 1. Prior to 1-Jan-2012 no data were recorded. 2. There was no data coverage in March 2012.
3. There were many months (Table 1) where data coverage was below 60% for one or more of the discharge sources, for one or more of the sensors. However, when a weighted average is taken that adjusts the number of actual data records for the actual number of ten minute periods when flow actually occurred from one or more of these sources then these periods of reduced coverage have only a minor impact
on the overall coverage).
1 Qualitative evaluation of the data coverage has been based on the following scale; Excellent >= 90%, Good
>=75%, Fair >= 60%, Materially deficient < 60%.
ADP Licence condition independent review Page 7
Science to Manage Uncertainty
Table 1 – Condition 12 metals, nitrogen, phosphorus and suspended solids within intake water.
Source
Year and
Month File Operating
records Conductivity
% Temperature
% Dissolved oxygen % pH %
Chlorine %
Overall % Notes
Holding 2012-01 2012_1 EPA_january discharge charcteristics 12 All.xlsx 906 66% 70% 100% 70% 100% 81%
Holding 2012-02 2012_2 EPA_February_Discharge characteristics 12.xlsx 1,359 57% 50% 55% 58% 58% 56%
Holding 2012-03 2012_3 EPA_March Discharge 12 All.xlsx 1,418 91% 91% 83% 90% 66% 84%
Holding 2012-04 2012_4_EPA_APRIL_12 ALL.XLSX 84 90% 100% 100% 100% 100% 98%
Holding 2012-05 2012_5_EPA_MAY_12 ALL.XLSX 3,465 0% 100% 50% 92% 100% 68%
Holding 2012-06 2012_6_EPA_JUNE_12 ALL.XLSX 1,431 0% 100% 26% 94% 100% 64%
Holding 2012-07 2012_7 EPA_JULY_ ALL discharge characteristics_12.XLSX 4,458 100% 73% 100% 18% 90% 76%
Holding 2012-08 2012_8 EPA_AUGUST_All discharge characteristics 12.xlsx 3,821 98% 95% 33% 65% 100% 78%
Holding 2012-09 2012_9 EPA_SEPTEMBER_12 ALL discharge characteristics.XLSX 4,320 100% 95% 38% 71% 100% 81%
Holding 2012-10 2012_10_EPA_October_c_12.xlsx 4,458 100% 100% 62% 100% 73% 87%
Holding 2012-11 2012_11_EPA_November_c_12.xlsx 4,320 82% 82% 81% 82% 62% 78%
Holding 2012-12 2012_12_EPA_December_c_12.xlsx 4,464 88% 88% 88% 88% 88% 88%
Holding 2013-01 2013_01_EPA_January_c_12.xlsx 4,464 99% 99% 99% 99% 99% 99%
Holding 2013-02 2013_02_EPA_February_c_12.xlsx 4,032 99% 100% 99% 98% 90% 97%
Holding 2013-03 2013_03_EPA_March_c_12.xlsx 4,464 99% 99% 99% 99% 66% 92%
Holding 2013-04 2013_04_EPA_April_c_12.xlsx 4,326 94% 94% 94% 94% 0% 75%
Holding 2013-05 2013_05_EPA_May_c_12.xlsx 4,464 96% 96% 96% 96% 0% 77%
Holding 2013-06 2013_06_EPA_June_c_12.xlsx 4,320 100% 100% 100% 100% 90% 98%
Holding 2013-07 2013_07_EPA_July_c_12.xlsx 4,464 95% 95% 95% 95% 95% 95%
Holding 2013-08 2013_08_EPA_August_c_12.xlsx 4,464 100% 100% 47% 100% 100% 89%
Holding 2013-09 2013_09_EPA_September_c_12.xlsm 4,320 92% 93% 42% 92% 92% 82%
Holding 2013-10 2013_10_EPA_October_c_12.xlsm 46 100% 100% 0% 100% 100% 80%

ADP Licence condition independent review Page 8
Science to Manage Uncertainty
Source
Year and
Month File Operating
records Conductivity
% Temperature
% Dissolved oxygen % pH %
Chlorine %
Overall % Notes
Holding 2013-11 2013_11_EPA_November_c_12.xlsm 2,591 100% 100% 7% 100% 100% 81%
Holding 2013-12 2013_12_EPA_December_c_12.xlsm 3,047 99% 99% 44% 99% 99% 88%
SCBT1 2012-01 2012_1 EPA_january discharge charcteristics 12 All.xlsx 906 0% 52% 81% 100% 91% 65%
SCBT1 2012-02 2012_2 EPA_February_Discharge characteristics 12.xlsx 1,360 52% 56% 12% 65% 65% 50%
SCBT1 2012-03 2012_3 EPA_March Discharge 12 All.xlsx 1,409 79% 67% 9% 81% 81% 63%
SCBT1 2012-04 2012_4_EPA_APRIL_12 ALL.XLSX No discharge
SCBT1 2012-05 2012_5_EPA_MAY_12 ALL.xlsm 3,089 97% 100% 10% 99% 100% 81%
SCBT1 2012-06 2012_6_EPA_JUNE_12 ALL.xlsm 3,963 100% 99% 8% 81% 100% 78%
SCBT1 2012-07 2012_7 EPA_JULY_ ALL discharge characteristics_12.XLSX 4,283 100% 100% 13% 87% 100% 80%
SCBT1 2012-08 2012_8 EPA_AUGUST_All discharge characteristics 12.xlsx 3,427 100% 98% 1% 62% 100% 72%
SCBT1 2012-09 2012_9 EPA_SEPTEMBER_12 ALL discharge characteristics.XLSX 2,284 91% 98% 26% 76% 100% 78%
SCBT1 2012-10 2012_10_EPA_October_c_12.xlsx 481 95% 99% 71% 99% 99% 93%
SCBT1 2012-11 2012_11_EPA_November_c_12.xlsx 3,177 39% 76% 74% 76% 65% 66%
SCBT1 2012-12 2012_12_EPA_December_c_12.xlsx 1,768 69% 69% 69% 69% 67% 69%
SCBT1 2013-01 2013_01_EPA_January_c_12.xlsx 3,506 98% 98% 98% 98% 0% 78%
SCBT1 2013-02 2013_02_EPA_February_c_12.xlsx 1,431 96% 96% 95% 96% 0% 77%
SCBT1 2013-03 2013_03_EPA_March_c_12.xlsx 3,307 99% 99% 99% 99% 0% 79%
SCBT1 2013-04 2013_04_EPA_April_c_12.xlsx 2,255 88% 88% 53% 88% 0% 63%
SCBT1 2013-05 2013_05_EPA_May_c_12.xlsx 4,092 95% 95% 92% 95% 49% 85%
SCBT1 2013-06 2013_06_EPA_June_c_12.xlsx 2,284 99% 99% 97% 99% 99% 99%
SCBT1 2013-07 2013_07_EPA_July_c_12.xlsx 228 0% 0% 0% 0% 0% 0%
SCBT1 2013-08 2013_08_EPA_August_c_12.xlsx No discharge

ADP Licence condition independent review Page 9
Science to Manage Uncertainty
Source
Year and
Month File Operating
records Conductivity
% Temperature
% Dissolved oxygen % pH %
Chlorine %
Overall % Notes
SCBT1 2013-09 2013_09_EPA_September_c_12.xlsm 2,553 88% 88% 88% 88% 88% 88%
SCBT1 2013-10 2013_10_EPA_October_c_12.xlsm 4,401 99% 100% 100% 100% 100% 100%
SCBT1 2013-11 2013_11_EPA_November_c_12.xlsm 4,305 97% 100% 100% 100% 100% 99%
SCBT1 2013-12 2013_12_EPA_December_c_12.xlsm 4,135 86% 99% 91% 99% 99% 95%
SCBT2 2012-07 2012_7 EPA_JULY_ ALL discharge characteristics_12.XLSX No discharge
SCBT2 2012-08 2012_8 EPA_AUGUST_All discharge characteristics 12.xlsx No discharge
SCBT2 2012-09 2012_9 EPA_SEPTEMBER_12 ALL discharge characteristics.XLSX 139 36% 94% 47% 93% 94% 73%
SCBT2 2012-10 2012_10_EPA_October_c_12.xlsx 2,029 97% 100% 23% 100% 100% 84%
SCBT2 2012-11 2012_11_EPA_November_c_12.xlsx 3,238 19% 76% 75% 76% 76% 64%
SCBT2 2012-12 2012_12_EPA_December_c_12.xlsx 2,642 40% 79% 40% 79% 79% 63%
SCBT2 2013-01 2013_01_EPA_January_c_12.xlsx 3,254 98% 98% 98% 98% 98% 98%
SCBT2 2013-02 2013_02_EPA_February_c_12.xlsx 3,612 98% 98% 98% 98% 98% 98%
SCBT2 2013-03 2013_03_EPA_March_c_12.xlsx 3,710 99% 99% 97% 99% 99% 99%
SCBT2 2013-04 2013_04_EPA_April_c_12.xlsx 2,193 88% 88% 88% 88% 88% 88%
SCBT2 2013-05 2013_05_EPA_May_c_12.xlsx 4,370 96% 96% 95% 96% 76% 92%
SCBT2 2013-06 2013_06_EPA_June_c_12.xlsx 1,980 99% 99% 99% 99% 82% 96%
SCBT2 2013-07 2013_07_EPA_July_c_12.xlsx 228 0% 0% 0% 3% 0% 1%
SCBT2 2013-08 2013_08_EPA_August_c_12.xlsx No discharge
SCBT2 2013-09 2013_09_EPA_September_c_12.xlsm 2,528 86% 86% 85% 85% 85% 85%
SCBT2 2013-10 2013_10_EPA_October_c_12.xlsm 4,158 99% 100% 100% 100% 80% 96%
SCBT2 2013-11 2013_11_EPA_November_c_12.xlsm 4,002 91% 100% 99% 100% 100% 98%
SCBT2 2013-12 2013_12_EPA_December_c_12.xlsm 4,234 96% 99% 97% 99% 99% 98%
UFCIP1 2012-01 2012_1 EPA_january discharge charcteristics 12 All.xlsx No discharge

ADP Licence condition independent review Page 10
Science to Manage Uncertainty
Source
Year and
Month File Operating
records Conductivity
% Temperature
% Dissolved oxygen % pH %
Chlorine %
Overall % Notes
UFCIP1 2012-02 2012_2 EPA_February_Discharge characteristics 12.xlsx 1,052 71% 3% 6% 3% 71% 31%
UFCIP1 2012-03 2012_3 EPA_March Discharge 12 All.xlsx - 0% 0% 0% 0% 0% 0% No Data
UFCIP1 2012-04 2012_4_EPA_APRIL_12 ALL.XLSX 121 0% 80% 100% 80% 0% 52%
UFCIP1 2012-05 2012_5_EPA_MAY_12 ALL.xlsm 623 0% 100% 10% 100% 0% 42%
UFCIP1 2012-06 2012_6_EPA_JUNE_12 ALL.xlsm 359 0% 56% 38% 56% 0% 30%
UFCIP1 2012-07 2012_7 EPA_JULY_ ALL discharge characteristics_12.XLSX 365 0% 67% 34% 54% 100% 51%
UFCIP1 2012-08 2012_8 EPA_AUGUST_All discharge characteristics 12.xlsx 113 90% 85% 91% 0% 100% 73%
UFCIP1 2012-09 2012_9 EPA_SEPTEMBER_12 ALL discharge characteristics.XLSX 20 0% 80% 80% 65% 100% 65%
UFCIP1 2012-10 2012_10_EPA_October_c_12.xlsx 44 80% 86% 59% 86% 52% 73%
UFCIP1 2012-11 2012_11_EPA_November_c_12.xlsx 914 4% 16% 11% 16% 16% 13%
UFCIP1 2012-12 2012_12_EPA_December_c_12.xlsx 775 29% 29% 29% 29% 28% 29%
UFCIP1 2013-01 2013_01_EPA_January_c_12.xlsx 339 68% 84% 82% 84% 57% 75%
UFCIP1 2013-02 2013_02_EPA_February_c_12.xlsx 642 64% 90% 86% 90% 77% 81%
UFCIP1 2013-03 2013_03_EPA_March_c_12.xlsx 485 85% 94% 93% 94% 60% 85%
UFCIP1 2013-04 2013_04_EPA_April_c_12.xlsx 273 5% 5% 5% 5% 5% 5%
UFCIP1 2013-05 2013_05_EPA_May_c_12.xlsx 265 41% 29% 29% 29% 29% 31%
UFCIP1 2013-06 2013_06_EPA_June_c_12.xlsx 462 23% 96% 95% 96% 34% 69%
UFCIP1 2013-07 2013_07_EPA_July_c_12.xlsx 754 31% 70% 68% 70% 0% 48%
UFCIP1 2013-08 2013_08_EPA_August_c_12.xlsx 167 50% 100% 98% 100% 0% 70%
UFCIP1 2013-09 2013_09_EPA_September_c_12.xlsm 836 38% 63% 62% 63% 63% 58%
UFCIP1 2013-10 2013_10_EPA_October_c_12.xlsm 600 95% 100% 100% 100% 100% 99%
UFCIP1 2013-11 2013_11_EPA_November_c_12.xlsm 443 76% 99% 97% 99% 99% 94%
UFCIP1 2013-12 2013_12_EPA_December_c_12.xlsm 363 0% 93% 93% 92% 93% 74%
ADP Licence condition independent review Page 11
Science to Manage Uncertainty
Source
Year and
Month File Operating
records Conductivity
% Temperature
% Dissolved oxygen % pH %
Chlorine %
Overall % Notes
UFCIP2 2012-07 2012_7 EPA_JULY_ ALL discharge characteristics_12.XLSX 3,483 0% 0% 0% 0% 0% 0%
UFCIP2 2012-08 2012_8 EPA_AUGUST_All discharge characteristics 12.xlsx No discharge
UFCIP2 2012-09 2012_9 EPA_SEPTEMBER_12 ALL discharge characteristics.XLSX 726 27% 89% 77% 84% 100% 75%
UFCIP2 2012-10 2012_10_EPA_October_c_12.xlsx 61 80% 90% 90% 90% 90% 88%
UFCIP2 2012-11 2012_11_EPA_November_c_12.xlsx 1,210 16% 37% 37% 37% 37% 33%
UFCIP2 2012-12 2012_12_EPA_December_c_12.xlsx 712 0% 23% 23% 23% 23% 18%
UFCIP2 2013-01 2013_01_EPA_January_c_12.xlsx 185 0% 71% 71% 71% 71% 57%
UFCIP2 2013-02 2013_02_EPA_February_c_12.xlsx 435 0% 85% 85% 85% 85% 68%
UFCIP2 2013-03 2013_03_EPA_March_c_12.xlsx 390 54% 92% 92% 92% 92% 84%
UFCIP2 2013-04 2013_04_EPA_April_c_12.xlsx 310 0% 16% 16% 16% 16% 13%
UFCIP2 2013-05 2013_05_EPA_May_c_12.xlsx 487 19% 62% 62% 62% 15% 44%
UFCIP2 2013-06 2013_06_EPA_June_c_12.xlsx 352 0% 95% 95% 95% 95% 76%
UFCIP2 2013-07 2013_07_EPA_July_c_12.xlsx 304 0% 26% 26% 26% 26% 21%
UFCIP2 2013-08 2013_08_EPA_August_c_12.xlsx 57 0% 100% 100% 100% 100% 80%
UFCIP2 2013-09 2013_09_EPA_September_c_12.xlsm 388 3% 19% 19% 19% 19% 16%
UFCIP2 2013-10 2013_10_EPA_October_c_12.xlsm 223 24% 100% 100% 100% 100% 85%
UFCIP2 2013-11 2013_11_EPA_November_c_12.xlsm 359 24% 99% 99% 99% 99% 84%
UFCIP2 2013-12 2013_12_EPA_December_c_12.xlsm 259 0% 90% 90% 93% 90% 73%
W&D 2012-01 2012_1 EPA_january discharge charcteristics 12 All.xlsx 160 0% 66% 93% 96% 6% 52%
W&D 2012-02 2012_2 EPA_February_Discharge characteristics 12.xlsx No discharge
W&D 2012-03 2012_3 EPA_March Discharge 12 All.xlsx 682 99% 100% 77% 100% 8% 77%
W&D 2012-04 2012_4_EPA_APRIL_12 ALL.XLSX 5 0% 100% 0% 20% 100% 44%

ADP Licence condition independent review Page 12
Science to Manage Uncertainty
Source
Year and
Month File Operating
records Conductivity
% Temperature
% Dissolved oxygen % pH %
Chlorine %
Overall % Notes
W&D 2012-05 2012_5_EPA_MAY_12 ALL.XLSX 1,704 3% 100% 15% 89% 100% 61%
W&D 2012-06 2012_6_EPA_JUNE_12 ALL.XLSX 4,320 0% 7% 0% 7% 7% 4%
W&D 2012-07 2012_7 EPA_JULY_ ALL discharge characteristics_12.XLSX 4,464 0% 80% 12% 45% 100% 47%
W&D 2012-08 2012_8 EPA_AUGUST_All discharge characteristics 12.xlsx 4,321 0% 79% 100% 73% 0% 50%
W&D 2012-09 2012_9 EPA_SEPTEMBER_12 ALL discharge characteristics.XLSX 141 95% 99% 77% 94% 100% 93%
W&D 2012-10 2012_10_EPA_October_c_12.xlsx 311 98% 98% 31% 98% 98% 85%
W&D 2012-11 2012_11_EPA_November_c_12.xlsx 1,437 46% 47% 46% 47% 29% 43%
W&D 2012-12 2012_12_EPA_December_c_12.xlsx 2,603 79% 79% 70% 79% 69% 75%
W&D 2013-01 2013_01_EPA_January_c_12.xlsx 3,235 97% 98% 95% 98% 0% 78%
W&D 2013-02 2013_02_EPA_February_c_12.xlsx 3,719 100% 100% 93% 99% 9% 80%
W&D 2013-03 2013_03_EPA_March_c_12.xlsx 3,858 99% 99% 83% 99% 99% 96%
W&D 2013-04 2013_04_EPA_April_c_12.xlsx 1,921 87% 86% 36% 87% 87% 77%
W&D 2013-05 2013_05_EPA_May_c_12.xlsx 4,016 95% 95% 64% 95% 95% 89%
W&D 2013-06 2013_06_EPA_June_c_12.xlsx 3,839 61% 100% 90% 100% 100% 90%
W&D 2013-07 2013_07_EPA_July_c_12.xlsx 3,187 68% 93% 85% 93% 93% 86%
W&D 2013-08 2013_08_EPA_August_c_12.xlsx 4,259 87% 100% 77% 100% 100% 93%
W&D 2013-09 2013_09_EPA_September_c_12.xlsm 4,149 90% 92% 92% 92% 92% 92%
W&D 2013-10 2013_10_EPA_October_c_12.xlsm 4,343 98% 100% 99% 100% 91% 98%
W&D 2013-11 2013_11_EPA_November_c_12.xlsm 4,018 100% 100% 99% 100% 57% 91%
W&D 2013-12 2013_12_EPA_December_c_12.xlsm 3,669 99% 99% 50% 97% 69% 83%
Compliance performance (totals and other statistics) 264,784 79% 89% 70% 85% 73% 79%
Notes to Table 1:

ADP Licence condition independent review Page 13
Science to Manage Uncertainty
“Sources” include:
1. “Operating records” represent the number of 10 minute periods during which a discharge was occurring for the given source during the given month.
2. “Overall %” is a measure of “valid” readings (averaged across all sensors) for a given month.
3. All other percentages are the number of “valid” readings as a percentage of the number of operating records from any given source, for any given sensor,
for any given month.
4. Compliance measures are weighted averages that take account of the differences in operating times from one month to the other (note they are not equal
to column averages) and thereby provide a value for the percentage of valid observations obtained relative to the total number of operating records.

ADP Licence condition independent review Page 14
Science to Manage Uncertainty
Appendix A KEY DATES IN PLANT CONSTRUCTION AND OPERATION The following provides a list of key dates in the construction and operation of the plant. This material provides background to the review and in particular places the analysis and interpretation of each of the monitoring reports into context with the activities that were occurring on-site in the period leading up to the monitoring event.
Date Activity
01-Feb-2009 Construction activities commenced
16-Nov-2009 Maritime platform arrived on site
08-Jul-2010 Maritime platform completed operations
01-Jun-2011 First discharge and first intake of seawater
14-Oct-2011 First Water – plant production was (30 MLD)
21-Mar-2012 SP1 – Full production from first half the plant (150 MLD)
31-May-2012 SP2 – Full production from second half of the plant (150 MLD)
24-Oct-2012 Performance test – plant running at full production for 7 days (150 MLD)
07-Nov-2012 Performance test – plant running at full production for 7 days (150 MLD)
21-Nov-2012 Reliability test – continuous running at various production rates
12-Dec-2012 Plant handover from commissioning