characteristics of a pulse-periodic corona discharge in
TRANSCRIPT

ISSN 1063-780X, Plasma Physics Reports, 2018, Vol. 44, No. 5, pp. 520–532. © Pleiades Publishing, Ltd., 2018.Original Russian Text © V.F. Tarasenko, E.Kh. Baksht, E.A. Sosnin, A.G. Burachenko, V.A. Panarin, V.S. Skakun, 2018, published in Fizika Plazmy, 2018, Vol. 44, No. 5, pp. 447–460.
LOW-TEMPERATURE PLASMA
Characteristics of a Pulse-Periodic Corona Dischargein Atmospheric Air
V. F. Tarasenkoa, b, *, E. Kh. Bakshta, E. A. Sosnina, b, A. G. Burachenkoa,V. A. Panarina, and V. S. Skakuna
aInstitute of High Current Electronics, Siberian Branch, Russian Academy of Sciences, Tomsk, 634055 RussiabNational Research Tomsk State University, Tomsk, 634050 Russia
*e-mail: [email protected] October 6, 2017; in final form, November 27, 2017
Abstract—Pulse-periodic corona discharge in atmospheric air excited by applying a voltage pulse with a sub-nanosecond or microsecond rise time to a point electrode is studied experimentally. It is shown that, at a volt-age rise rate of dU/dt ~1014 V/s, positive and negative ball-shaped streamers with a front velocity of ≥2 mm/nsform near the point electrode. As dU/dt is reduced to 1010−1011 V/s, the streamer shape changes and becomesclose to cylindrical. The propagation velocity of cylindrical streamers is found to be ~0.1 mm/ns at dU/dt ~2 × 10¹⁰ V/s. It is shown that the propagation direction of a cylindrical streamer can be changed by tilting thepoint electrode, on the axis of which the electric field strength reaches its maximum value. It is establishedthat, for the negative polarity of the point electrode and a microsecond rise time of the voltage pulse, a highervoltage is required to form a cylindrical streamer than for the positive polarity of the point electrode.
DOI: 10.1134/S1063780X18050100
1. INTRODUCTIONCorona discharge in atmospheric-pressure air and
other gases is a specific type of self-sustained dis-charge, which has permanently attracted interest ofresearchers [1–24] and has received application invarious technologies [25–28]. A specific feature of thecorona discharge is that, for its formation, it sufficientto apply a high voltage to the electrode with a smallradius of curvature. Due to the enhancement of theelectric field near the point electrode, gas particlesnear it are excited and ionized and a plasma cloudforms. As the distance from the electrode increases,the electric field strength is reduced and the electronenergy becomes insufficient for ionization and exci-tation of the gas molecules and atoms. In this region,the charged particles drifting away from the electroderecombine, while new particles do not form because ofthe low value of the electric field. In the corona dis-charge operating between two electrodes, e.g., in apoint-to-plane gap, a glowing plasma region formsnear the point electrode, while a “dark” region isobserved near the plane electrode. If the gap consistsof two point electrodes located at a relatively short dis-tance from one another, then the glowing plasmaregions form near both electrodes, while the darkregion is observed in the middle of the gap. We notethat, in certain modes of a corona discharge excited ina point-to-plane gap by applying the voltage to thepoint electrode, a glow can be observed not only near
the point electrode but also near the plane electrode[9, 11].
The modes of a corona discharge excited by a dcvoltage or a sinusoidal voltage of the mains frequencyhave received the most thorough study. For a dc volt-age of a few tens of kilovolts at the corona electrode inatmospheric-pressure air, the discharge current isfrom a few microamperes to several tens of microam-peres. For the negative polarity of the corona elec-trode, Trichel pulses are typically detected [29]. Forthe positive polarity of the dc voltage applied to thepoint electrode and in the absence of leader break-down, periodic current pulses caused by cathodestreamers bridging the gap are also detected [9].
In [2, 5, 6, 10, 13, 15–21], corona discharges oper-ating in the pulse-periodic mode, as well as in the sin-gle-pulse mode of nanosecond or microsecond dura-tion, were studied. In this case, due to the short risetime of the voltage pulse, the electric field strengthnear the point electrode and in the gap reaches signifi-cantly higher values than in a discharge excited by a dcvoltage or a sinusoidal voltage of the mains frequency.At such high electric fields, the corona dischargemode, including in the presence of the second elec-trode (such as a conductor placed at a short distancefrom the corona electrode, the metal surfaces of theexperimental setup, and the walls of the laboratoryroom), is maintained because complete breakdown ofthe gap has no time to occur due to the short duration
520
CHARACTERISTICS OF A PULSE-PERIODIC CORONA DISCHARGE 521
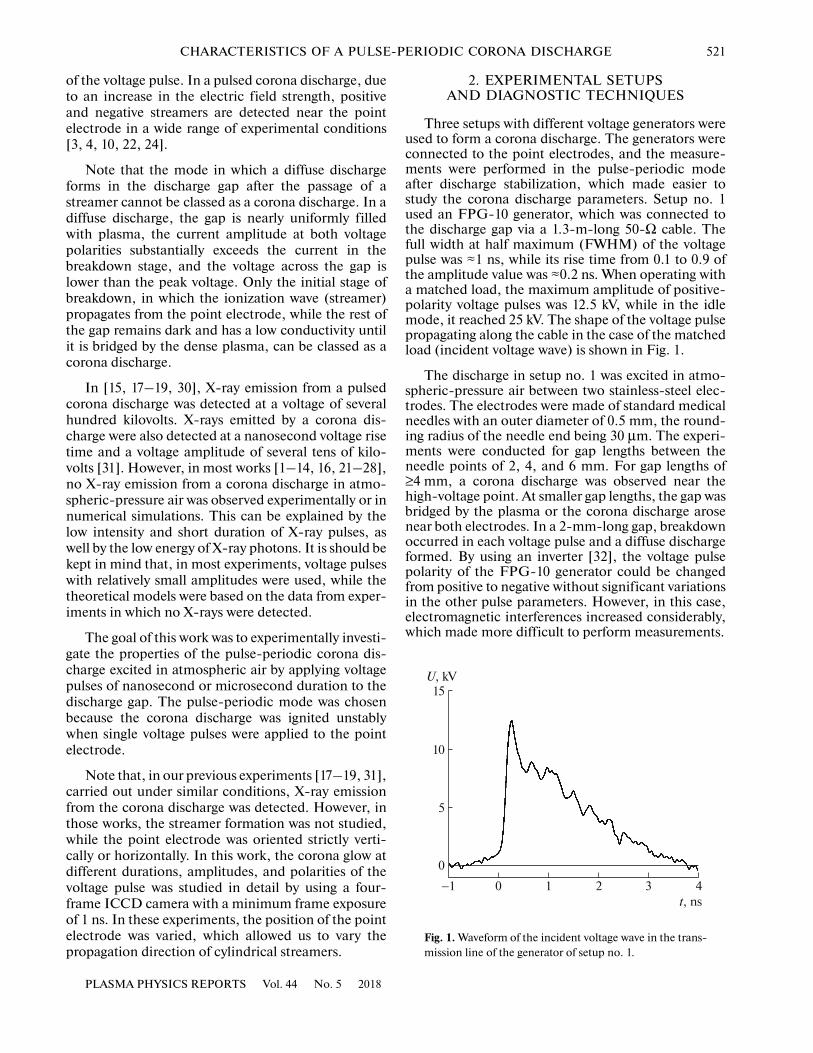
Fig. 1. Waveform of the incident voltage wave in the trans-mission line of the generator of setup no. 1.
5
10
15U, kV
0
0 1 2 3 4t, ns
−1
of the voltage pulse. In a pulsed corona discharge, dueto an increase in the electric field strength, positiveand negative streamers are detected near the pointelectrode in a wide range of experimental conditions[3, 4, 10, 22, 24].
Note that the mode in which a diffuse dischargeforms in the discharge gap after the passage of astreamer cannot be classed as a corona discharge. In adiffuse discharge, the gap is nearly uniformly filledwith plasma, the current amplitude at both voltagepolarities substantially exceeds the current in thebreakdown stage, and the voltage across the gap islower than the peak voltage. Only the initial stage ofbreakdown, in which the ionization wave (streamer)propagates from the point electrode, while the rest ofthe gap remains dark and has a low conductivity untilit is bridged by the dense plasma, can be classed as acorona discharge.
In [15, 17–19, 30], X-ray emission from a pulsedcorona discharge was detected at a voltage of severalhundred kilovolts. X-rays emitted by a corona dis-charge were also detected at a nanosecond voltage risetime and a voltage amplitude of several tens of kilo-volts [31]. However, in most works [1–14, 16, 21–28],no X-ray emission from a corona discharge in atmo-spheric-pressure air was observed experimentally or innumerical simulations. This can be explained by thelow intensity and short duration of X-ray pulses, aswell by the low energy of X-ray photons. It is should bekept in mind that, in most experiments, voltage pulseswith relatively small amplitudes were used, while thetheoretical models were based on the data from exper-iments in which no X-rays were detected.
The goal of this work was to experimentally investi-gate the properties of the pulse-periodic corona dis-charge excited in atmospheric air by applying voltagepulses of nanosecond or microsecond duration to thedischarge gap. The pulse-periodic mode was chosenbecause the corona discharge was ignited unstablywhen single voltage pulses were applied to the pointelectrode.
Note that, in our previous experiments [17–19, 31],carried out under similar conditions, X-ray emissionfrom the corona discharge was detected. However, inthose works, the streamer formation was not studied,while the point electrode was oriented strictly verti-cally or horizontally. In this work, the corona glow atdifferent durations, amplitudes, and polarities of thevoltage pulse was studied in detail by using a four-frame ICCD camera with a minimum frame exposureof 1 ns. In these experiments, the position of the pointelectrode was varied, which allowed us to vary thepropagation direction of cylindrical streamers.
PLASMA PHYSICS REPORTS Vol. 44 No. 5 2018
2. EXPERIMENTAL SETUPSAND DIAGNOSTIC TECHNIQUES
Three setups with different voltage generators wereused to form a corona discharge. The generators wereconnected to the point electrodes, and the measure-ments were performed in the pulse-periodic modeafter discharge stabilization, which made easier tostudy the corona discharge parameters. Setup no. 1used an FPG-10 generator, which was connected tothe discharge gap via a 1.3-m-long 50-Ω cable. Thefull width at half maximum (FWHM) of the voltagepulse was ≈1 ns, while its rise time from 0.1 to 0.9 ofthe amplitude value was ≈0.2 ns. When operating witha matched load, the maximum amplitude of positive-polarity voltage pulses was 12.5 kV, while in the idlemode, it reached 25 kV. The shape of the voltage pulsepropagating along the cable in the case of the matchedload (incident voltage wave) is shown in Fig. 1.
The discharge in setup no. 1 was excited in atmo-spheric-pressure air between two stainless-steel elec-trodes. The electrodes were made of standard medicalneedles with an outer diameter of 0.5 mm, the round-ing radius of the needle end being 30 μm. The experi-ments were conducted for gap lengths between theneedle points of 2, 4, and 6 mm. For gap lengths of≥4 mm, a corona discharge was observed near thehigh-voltage point. At smaller gap lengths, the gap wasbridged by the plasma or the corona discharge arosenear both electrodes. In a 2-mm-long gap, breakdownoccurred in each voltage pulse and a diffuse dischargeformed. By using an inverter [32], the voltage pulsepolarity of the FPG-10 generator could be changedfrom positive to negative without significant variationsin the other pulse parameters. However, in this case,electromagnetic interferences increased considerably,which made more difficult to perform measurements.

522 TARASENKO et al.
Fig. 2. Block diagram of setup no. 2: (1) discharge region,(2) 2-mm-diameter stainless-steel needle electrode withan apex angle of 15° and a 70-μm radius of rounding,(3) step-up transformer, (4) pulsed voltage supply,(5) ICCD camera, (6) 110-mm-diameter lens with a focaldistance of 70 mm, (7) BNC 565 converter, (8) Rogowskicoil (or shunt made of chip resistors), (9) oscilloscope, and(10) quartz chamber with a pumping-out and gas-puffingsystem. Here, C1 = 1.65 pF and C2 = 1.68 nF are thecapacitors of the capacitive voltage divider (a resistive volt-age divider was also applied).
С1
С2
5
9
6
8
1
2
10
7
3
4
It should be noted that, due to the high resistanceof the corona discharge, the use of a cable (transmis-sion line) connecting the FPG-10 generator to theneedle electrode, and a short voltage pulse duration, asequence of decaying pulses of positive and negativepolarities arrived at the gap during each generatorpulse. The pulse polarity was inverted automaticallydue to reflections of the voltage pulse from the gap andthe generator. During the corona discharge, the resis-tance of the gap is much higher than the wave imped-ance of the coaxial cable through which the voltagepulse is supplied to the gap. Therefore, the polarity ofthe reflected voltage pulse remains unchanged. How-ever, the input resistance of the FPG-10 generatorafter its actuation is reduced substantially, which cor-responds to a short circuit for the reflected pulse. As aresult, after the voltage pulse is reflected from the gap,its polarity is inverted after the subsequent ref lectionfrom the generator. The time at which the reflectedpulse arrives at the needle point corresponds to thedoubled time of the pulse passage over the cable andamounts to ≈13 ns. The voltage pulse amplitude afterthe first reflection is reduced less than twice. As will beshown in the next section, the corona glow at the pos-itive polarity of the main pulse and the negative polar-ity of the second pulse reflected from the generatorcould be sequentially detected by using the ICCDcamera without applying an inverter. Due to the effectof the capacitive current and technical difficultiesrelated to the mounting a shunt with a subnanosecondtime resolution, we did not perform measurements ofthe corona current at this setup.
The block diagram of setup no. 2, used to study thecorona discharge at amplitudes of microsecond volt-age pulses of up to 18 kV, is shown in Fig. 2.
Since the discharge chamber of setup no. 2 waslarge-diameter evacuated quartz tube 10, the experi-ments at this setup could be conducted at different airpressures. High-voltage pulses from the secondarywinding of step-up transformer 3 were supplied to nee-dle electrode 2, which could be installed at an angle tothe vertical axis. The generator provided voltage pulsesof the positive or negative polarity with a repetitionrate f from 16 to 96 kHz on the electrode. The FWHMof the voltage pulse was τ0.5 ≈ 0.8 μs. Due to the rela-tively long rise time of the voltage pulse, no transmis-sion line was used at setup no. 2. Figure 3 shows thewaveforms of the positive-polarity voltage pulses at thepoint electrode, current signals from the shunt, andthe gate pulse of the ICCD camera in the presence andabsence of a corona discharge.
The triggering time of the ICCD camera could begradually varied, which allowed us to take photographsof the discharge at the front of the voltage pulse andnear its maximum. At the trailing edge of the voltagepulse, the scatter in time delays before corona dis-charge ignition increased substantially, which made itdifficult take photographs of the discharge. The cur-
rent through the gap was mainly determined by thedisplacement current. Therefore, its amplitude andshape in the presence and absence of a corona dis-charge was almost the same (Fig. 3). As the voltageamplitude decreased by 6% (curves 2, 5), no coronaformed near the needle point.
Setup no. 3 used a generator of high-voltage pulseswith amplitudes of several hundred kilovolts. The gen-erator was also connected to the point electrode. Thissetup and the preliminary results obtained whenstudying a corona discharge with a vertically orientedpoint electrode were described in detail in [15, 18, 20].The generator formed voltage pulses consisting of sep-arate trains with a duration of ∼10 ms. Each train com-prised a sinusoidal signal with an oscillations fre-quency of ≈290 kHz. The 50-Hz high-voltage pulseswere applied to the cylindrical copper electrode with apointed end. The electrode diameter was 3.6 mm, theapex angle of the pointed end was 20°, and the radiusof rounding was 0.3 mm. With the use of the second(grounded) electrode and for a gap length of ≤30 cm,the corona discharge transformed into a spark. For agap length of ∼20 cm, the spark current did not exceed10 A. When second electrode was removed to a dis-tance of ≥40 cm (as well as in the absence of the sec-ond electrode), a corona discharge formed in atmo-spheric-pressure air. The voltage pulse amplitude andthe shapes of signals in the primary and secondarywindings of the high-voltage transformer were mea-
PLASMA PHYSICS REPORTS Vol. 44 No. 5 2018

CHARACTERISTICS OF A PULSE-PERIODIC CORONA DISCHARGE 523
Fig. 3. (1, 2) Waveforms positive-polarity voltage pulses, (3) rectangular gate pulse of the ICCD camera, and (4, 5) current signalsfrom the shunt (setup no. 2, f = 50 kHz). Curves 1 and 4 correspond to the corona discharge mode.
0.2
0.1
0
0.1
0.2
0.3
0 1t, µs
2 3
1
1
2
3
4
5
6
U, k
VI,
A
0
0 1 2 3
1
2
3
4
5
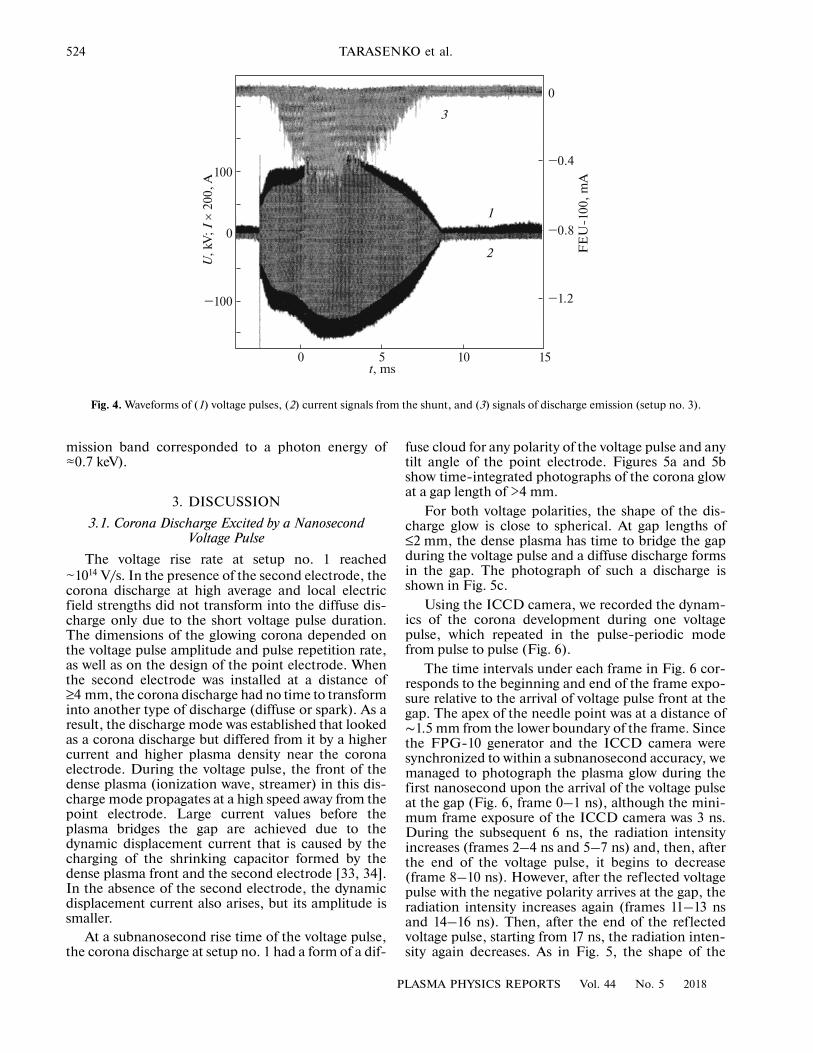
sured using resistive voltage dividers. The currents ofthe corona and spark discharges were measured usinga shunt connected in series to the secondary windingof the pulse transformer. Typical voltage pulses in thesecondary winding of the pulse transformer, currentsignals from the shunt, and signals of the dischargeemission detected using the FEU-100 image tube areshown in Fig. 4.
The largest difference between the maximum val-ues of the positive and negative voltage in the train was∼250 kV. The maximum negative-polarity voltage inthe sinusoidal signal was ≈20% higher than maximumpositive-polarity voltage. The current detected by theshunt was ∼0.5 A. As in setup no. 2, the main contri-bution to the detected current was made by the dis-placement current.
In this work, the point electrode was installed atdifferent angles to the vertical axis. The time-inte-grated discharge glow was photographed using aSONY A100 camera. The dynamics of corona emis-
PLASMA PHYSICS REPORTS Vol. 44 No. 5 2018
sion at setup no. 3 was studied using a HiSpec 1 high-speed camera (Fastec Imaging Company, UnitedStates) [18]. The exposure of each frame and the pausebetween frames could be varied from several hundredmicroseconds to a few milliseconds. To study thedynamics of discharge radiation at setup nos. 1 and 2,we used a four-channel HSFC PRO high-speedICCD camera with a minimal exposure of 3 ns and anFEU-100 image tube. In the experiments carried outat setup no. 1, the electrical signals were recordedusing a DPO 70604 oscilloscope (6 GHz, 25 samplesper 1 ns), whereas at setup nos. 2 and 3, the electricalsignals were recorded using a ТDS 3034 oscilloscope(0.3 GHz, 5 samples per 1 ns).
X-ray emission was detected by the blackening ofan X-ray film (Kodak RAR 2497), which was placed inan envelope with a 6-mm-diameter window. Theenvelope was impenetrable for visible light and softX-rays, and its window was closed by a 15-μm-thickberyllium foil (the long-wavelength edge of the trans-
524 TARASENKO et al.
Fig. 4. Waveforms of (1) voltage pulses, (2) current signals from the shunt, and (3) signals of discharge emission (setup no. 3).
100 1.2
0.8
0.4
0
100
0
0 5t, ms
10
3
1
2
15
U, k
V; I
× 2
00, A
FE
U-1
00, m
A
mission band corresponded to a photon energy of≈0.7 keV).
3. DISCUSSION3.1. Corona Discharge Excited by a Nanosecond
Voltage PulseThe voltage rise rate at setup no. 1 reached
~1014 V/s. In the presence of the second electrode, thecorona discharge at high average and local electricfield strengths did not transform into the diffuse dis-charge only due to the short voltage pulse duration.The dimensions of the glowing corona depended onthe voltage pulse amplitude and pulse repetition rate,as well as on the design of the point electrode. Whenthe second electrode was installed at a distance of≥4 mm, the corona discharge had no time to transforminto another type of discharge (diffuse or spark). As aresult, the discharge mode was established that lookedas a corona discharge but differed from it by a highercurrent and higher plasma density near the coronaelectrode. During the voltage pulse, the front of thedense plasma (ionization wave, streamer) in this dis-charge mode propagates at a high speed away from thepoint electrode. Large current values before theplasma bridges the gap are achieved due to thedynamic displacement current that is caused by thecharging of the shrinking capacitor formed by thedense plasma front and the second electrode [33, 34].In the absence of the second electrode, the dynamicdisplacement current also arises, but its amplitude issmaller.
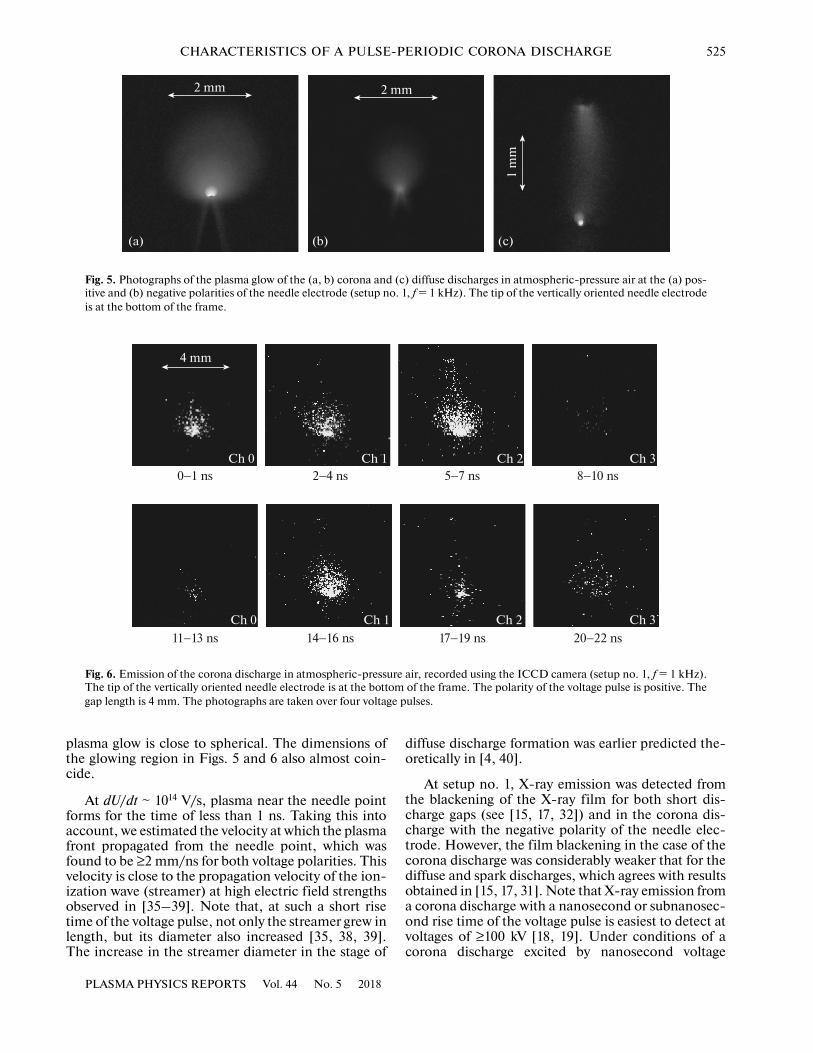
At a subnanosecond rise time of the voltage pulse,the corona discharge at setup no. 1 had a form of a dif-
fuse cloud for any polarity of the voltage pulse and anytilt angle of the point electrode. Figures 5a and 5bshow time-integrated photographs of the corona glowat a gap length of >4 mm.
For both voltage polarities, the shape of the dis-charge glow is close to spherical. At gap lengths of≤2 mm, the dense plasma has time to bridge the gapduring the voltage pulse and a diffuse discharge formsin the gap. The photograph of such a discharge isshown in Fig. 5c.
Using the ICCD camera, we recorded the dynam-ics of the corona development during one voltagepulse, which repeated in the pulse-periodic modefrom pulse to pulse (Fig. 6).
The time intervals under each frame in Fig. 6 cor-responds to the beginning and end of the frame expo-sure relative to the arrival of voltage pulse front at thegap. The apex of the needle point was at a distance of∼1.5 mm from the lower boundary of the frame. Sincethe FPG-10 generator and the ICCD camera weresynchronized to within a subnanosecond accuracy, wemanaged to photograph the plasma glow during thefirst nanosecond upon the arrival of the voltage pulseat the gap (Fig. 6, frame 0–1 ns), although the mini-mum frame exposure of the ICCD camera was 3 ns.During the subsequent 6 ns, the radiation intensityincreases (frames 2–4 ns and 5–7 ns) and, then, afterthe end of the voltage pulse, it begins to decrease(frame 8–10 ns). However, after the reflected voltagepulse with the negative polarity arrives at the gap, theradiation intensity increases again (frames 11–13 nsand 14–16 ns). Then, after the end of the reflectedvoltage pulse, starting from 17 ns, the radiation inten-sity again decreases. As in Fig. 5, the shape of the
PLASMA PHYSICS REPORTS Vol. 44 No. 5 2018
CHARACTERISTICS OF A PULSE-PERIODIC CORONA DISCHARGE 525
Fig. 5. Photographs of the plasma glow of the (a, b) corona and (c) diffuse discharges in atmospheric-pressure air at the (a) pos-itive and (b) negative polarities of the needle electrode (setup no. 1, f = 1 kHz). The tip of the vertically oriented needle electrodeis at the bottom of the frame.
2 mm 2 mm
1 m
m
(a) (b) (c)
Fig. 6. Emission of the corona discharge in atmospheric-pressure air, recorded using the ICCD camera (setup no. 1, f = 1 kHz).The tip of the vertically oriented needle electrode is at the bottom of the frame. The polarity of the voltage pulse is positive. Thegap length is 4 mm. The photographs are taken over four voltage pulses.
4 mm
Ch 0 Ch 1 Ch 2 Ch 3
Ch 0 Ch 1 Ch 2 Ch 3
0−1 ns
11−13 ns 14−16 ns 17−19 ns 20−22 ns
2−4 ns 5−7 ns 8−10 ns
plasma glow is close to spherical. The dimensions ofthe glowing region in Figs. 5 and 6 also almost coin-cide.
At dU/dt ~ 1014 V/s, plasma near the needle pointforms for the time of less than 1 ns. Taking this intoaccount, we estimated the velocity at which the plasmafront propagated from the needle point, which wasfound to be ≥2 mm/ns for both voltage polarities. Thisvelocity is close to the propagation velocity of the ion-ization wave (streamer) at high electric field strengthsobserved in [35–39]. Note that, at such a short risetime of the voltage pulse, not only the streamer grew inlength, but its diameter also increased [35, 38, 39].The increase in the streamer diameter in the stage of
PLASMA PHYSICS REPORTS Vol. 44 No. 5 2018
diffuse discharge formation was earlier predicted the-oretically in [4, 40].
At setup no. 1, X-ray emission was detected fromthe blackening of the X-ray film for both short dis-charge gaps (see [15, 17, 32]) and in the corona dis-charge with the negative polarity of the needle elec-trode. However, the film blackening in the case of thecorona discharge was considerably weaker that for thediffuse and spark discharges, which agrees with resultsobtained in [15, 17, 31]. Note that X-ray emission froma corona discharge with a nanosecond or subnanosec-ond rise time of the voltage pulse is easiest to detect atvoltages of ≥100 kV [18, 19]. Under conditions of acorona discharge excited by nanosecond voltage

526 TARASENKO et al.
Fig. 7. Emission of the corona discharge in atmospheric-pressure air, recorded using the ICCD camera at setupno. 2 (U = 15.6 kV, f = 50 kHz) at the (a) positive and(b) negative polarities of the voltage pulses. The exposuretime is τ = (a) 60 and (b) 100 ns. The frame height is6.5 mm. The needle electrode is tilted at an angle of 60° tothe vertical.
(a)
(b)
pulses with an amplitude of several hundred kilovolts,it is possible not only to fix the film blackening over alarge number of voltage pulses but also to measure thecurrent of runaway electrons (by using a collector) andthe X-ray dose (by using a dosimeter) [15, 17].
3.2. Corona Discharge Excited by a MicrosecondVoltage Pulse
The waveforms of the microsecond voltage pulseand the current signal from the shunt are shown inFig. 3. To ignite a corona discharge, it sufficient toincrease the voltage by 5%. Since the current throughthe gap is mainly determined by the displacement cur-rent, the amplitude and shape of the current pulse are
Fig. 8. Photographs of the plasma glow of a corona discharge in apulses: U = (a) 7, (b) 8, and (c) 10 kV (setup no. 2, f = 50 kHz). needle electrode is tilted at an angle of 60° to the vertical.
(a) (b)
almost the same in both the presence and absence of acorona discharge.
In atmospheric-pressure air, the visible dimensionsof the corona region were as small as ≤1 mm. Torecord the corona glow by using the ICCD camera, itwas necessary to increase the exposure time and thecamera should be switched on at the minimum voltageat the needle electrode. Under these conditions, thecorona glow near the needle point was detected forboth positive and negative polarities of the voltagepulse (Fig. 7).
The size of the glowing region at the maximumvoltage of 18 kV did not exceed 3 mm, and it has aspherical shape. We failed to photograph the forma-tion dynamics of this region by using the ICCD cam-era with a frame exposure of 3 ns, because the intensityof corona emission was too low. In addition, it was dif-ficult to synchronize the ICCD camera with the timeof corona formation at setup no. 2. However, takinginto account the results of measurements, it can beasserted that a spherical streamer formed near the nee-dle point for a time of <50 ns. These data agree withthe results of experiments on the formation of spheri-cal streamers in different gases at a voltage pulseamplitude of 50 kV and voltage rise time of 2 ns [39].
A decrease in the pressure in the discharge cham-ber led to a change in the corona shape. At the positivepolarity of voltage pulses, conical jets (streamers)began to emerge from the bright region near the tip ofthe needle electrode. Figure 8 shows time-integratedphotographs of the corona glow in air at a pressure of340 Torr and different voltages applied to the gap.
The photographs of the corona discharge shown inFig. 8 were taken during 6250 voltage pulses of positivepolarity. It can be seen in Figs. 8a and 8b that the dis-charge has the form of a jet propagating from a brightpoint along the axis of the needle electrode, which wastilted at an angle of 60° to the vertical. In Fig. 8c, addi-tional jets propagating at other angles and affecting the
PLASMA PHYSICS REPORTS Vol. 44 No. 5 2018
ir at a pressure of 340 Torr and different amplitudes of the voltageThe frame height is 2.5 cm, and the frame exposure is 1/8 s. The
(c)
CHARACTERISTICS OF A PULSE-PERIODIC CORONA DISCHARGE 527
Fig. 9. Emission of the corona discharge in air at a pressureof 340 Torr, recorded using the ICCD camera at setupno. 2 (U = 7.7 kV, f = 50 kHz). The frame height is 3.5 mm,and the frame exposure is τ = (a–c) 10 and (d) 30 ns. Thephotographs are taken without pauses between frames.The needle electrode is tilted at an angle of 70° to the ver-tical.
(a)
(b)
(c)
(d)
propagation of the primary jet have appeared. Notethat the electric field is maximum on the axis of theneedle electrode, due to which the single jets propa-gate along this axis.
As the voltage pulse amplitude increases, the jetfirst grows in length. However, as the voltage increasesfurther, there arise additional jets, which propagatefrom the bright region near the needle point in otherdirections (Fig. 8c), as was previously observed in [15,17], where the needle electrode was oriented vertically.Presumably, such jets appear because the fieldstrength near the needle point on the boundary of thedense plasma reaches a threshold value for the forma-tion of several streamers. The change in the voltagepulse polarity at setup no. 2 at an air pressure of340 Torr from positive to negative leads to a change ina discharge shape. A brightly glowing region is seennear the needle point, but no jets form.
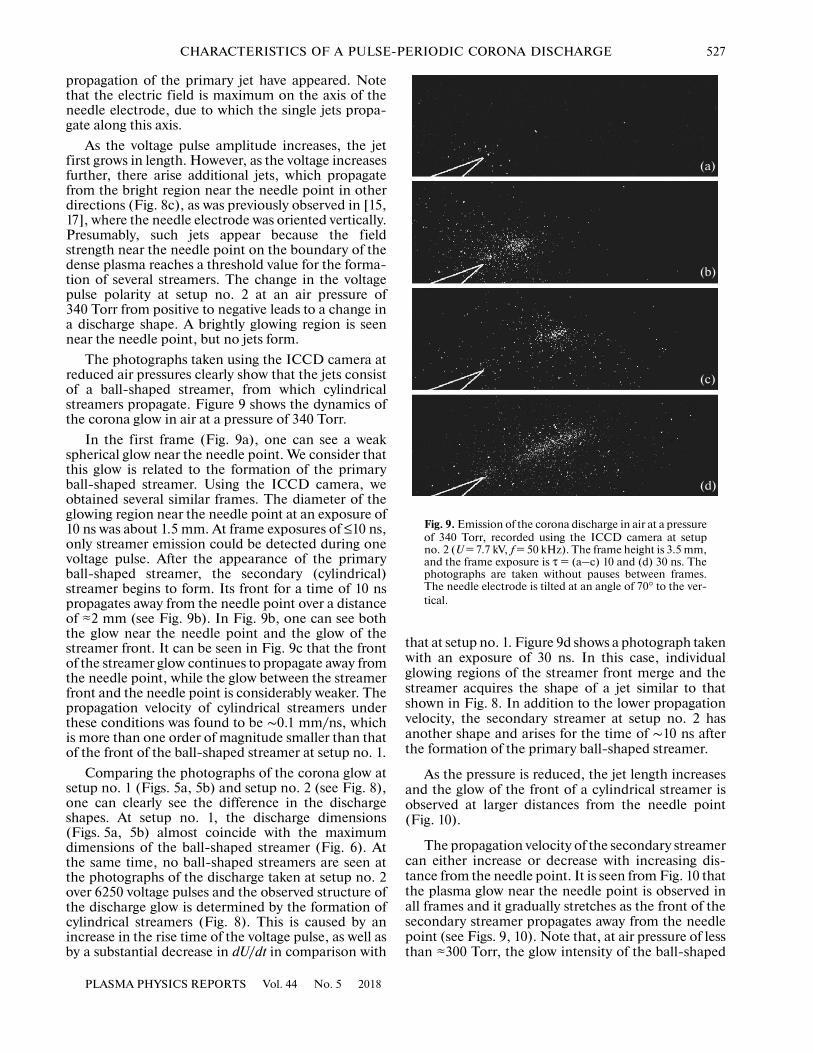
The photographs taken using the ICCD camera atreduced air pressures clearly show that the jets consistof a ball-shaped streamer, from which cylindricalstreamers propagate. Figure 9 shows the dynamics ofthe corona glow in air at a pressure of 340 Torr.
In the first frame (Fig. 9a), one can see a weakspherical glow near the needle point. We consider thatthis glow is related to the formation of the primaryball-shaped streamer. Using the ICCD camera, weobtained several similar frames. The diameter of theglowing region near the needle point at an exposure of10 ns was about 1.5 mm. At frame exposures of ≤10 ns,only streamer emission could be detected during onevoltage pulse. After the appearance of the primaryball-shaped streamer, the secondary (cylindrical)streamer begins to form. Its front for a time of 10 nspropagates away from the needle point over a distanceof ≈2 mm (see Fig. 9b). In Fig. 9b, one can see boththe glow near the needle point and the glow of thestreamer front. It can be seen in Fig. 9c that the frontof the streamer glow continues to propagate away fromthe needle point, while the glow between the streamerfront and the needle point is considerably weaker. Thepropagation velocity of cylindrical streamers underthese conditions was found to be ∼0.1 mm/ns, whichis more than one order of magnitude smaller than thatof the front of the ball-shaped streamer at setup no. 1.
Comparing the photographs of the corona glow atsetup no. 1 (Figs. 5a, 5b) and setup no. 2 (see Fig. 8),one can clearly see the difference in the dischargeshapes. At setup no. 1, the discharge dimensions(Figs. 5a, 5b) almost coincide with the maximumdimensions of the ball-shaped streamer (Fig. 6). Atthe same time, no ball-shaped streamers are seen atthe photographs of the discharge taken at setup no. 2over 6250 voltage pulses and the observed structure ofthe discharge glow is determined by the formation ofcylindrical streamers (Fig. 8). This is caused by anincrease in the rise time of the voltage pulse, as well asby a substantial decrease in dU/dt in comparison with
PLASMA PHYSICS REPORTS Vol. 44 No. 5 2018
that at setup no. 1. Figure 9d shows a photograph takenwith an exposure of 30 ns. In this case, individualglowing regions of the streamer front merge and thestreamer acquires the shape of a jet similar to thatshown in Fig. 8. In addition to the lower propagationvelocity, the secondary streamer at setup no. 2 hasanother shape and arises for the time of ∼10 ns afterthe formation of the primary ball-shaped streamer.
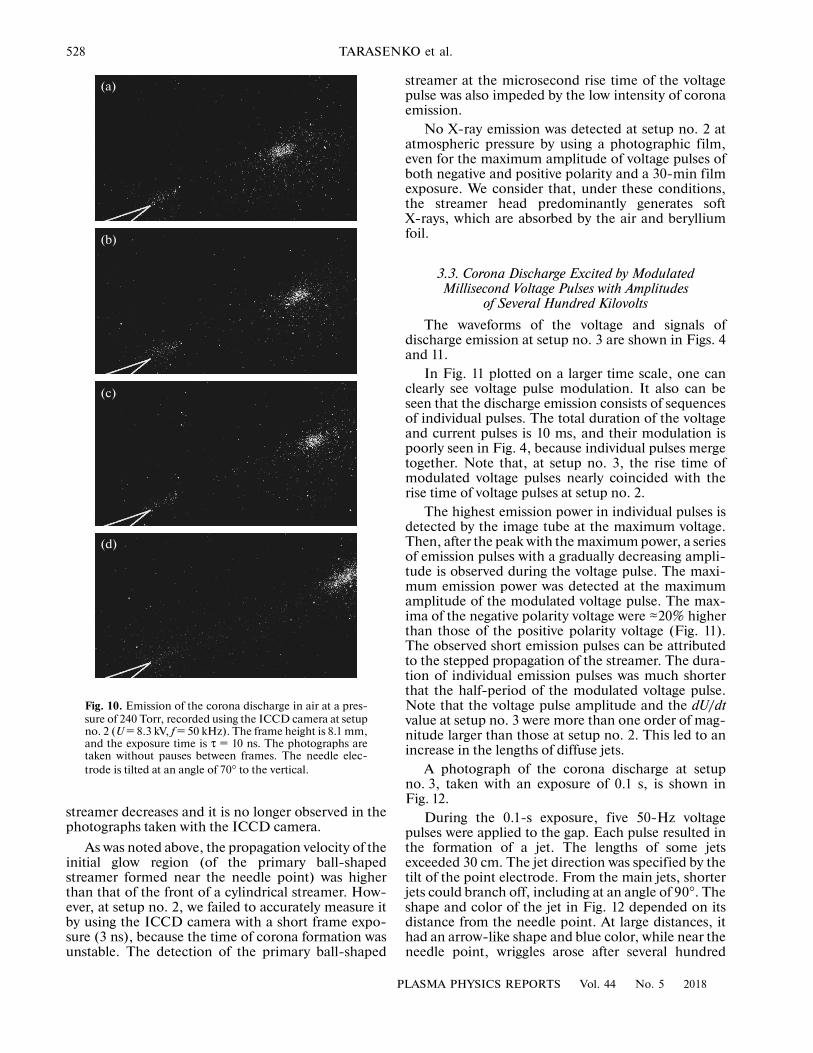
As the pressure is reduced, the jet length increasesand the glow of the front of a cylindrical streamer isobserved at larger distances from the needle point(Fig. 10).
The propagation velocity of the secondary streamercan either increase or decrease with increasing dis-tance from the needle point. It is seen from Fig. 10 thatthe plasma glow near the needle point is observed inall frames and it gradually stretches as the front of thesecondary streamer propagates away from the needlepoint (see Figs. 9, 10). Note that, at air pressure of lessthan ≈300 Torr, the glow intensity of the ball-shaped
528 TARASENKO et al.
Fig. 10. Emission of the corona discharge in air at a pres-sure of 240 Torr, recorded using the ICCD camera at setupno. 2 (U = 8.3 kV, f = 50 kHz). The frame height is 8.1 mm,and the exposure time is τ = 10 ns. The photographs aretaken without pauses between frames. The needle elec-trode is tilted at an angle of 70° to the vertical.
(a)
(b)
(c)
(d)
streamer decreases and it is no longer observed in thephotographs taken with the ICCD camera.
As was noted above, the propagation velocity of theinitial glow region (of the primary ball-shapedstreamer formed near the needle point) was higherthan that of the front of a cylindrical streamer. How-ever, at setup no. 2, we failed to accurately measure itby using the ICCD camera with a short frame expo-sure (3 ns), because the time of corona formation wasunstable. The detection of the primary ball-shaped
streamer at the microsecond rise time of the voltagepulse was also impeded by the low intensity of coronaemission.
No X-ray emission was detected at setup no. 2 atatmospheric pressure by using a photographic film,even for the maximum amplitude of voltage pulses ofboth negative and positive polarity and a 30-min filmexposure. We consider that, under these conditions,the streamer head predominantly generates softX-rays, which are absorbed by the air and berylliumfoil.
3.3. Corona Discharge Excited by Modulated Millisecond Voltage Pulses with Amplitudes
of Several Hundred KilovoltsThe waveforms of the voltage and signals of
discharge emission at setup no. 3 are shown in Figs. 4and 11.
In Fig. 11 plotted on a larger time scale, one canclearly see voltage pulse modulation. It also can beseen that the discharge emission consists of sequencesof individual pulses. The total duration of the voltageand current pulses is 10 ms, and their modulation ispoorly seen in Fig. 4, because individual pulses mergetogether. Note that, at setup no. 3, the rise time ofmodulated voltage pulses nearly coincided with therise time of voltage pulses at setup no. 2.
The highest emission power in individual pulses isdetected by the image tube at the maximum voltage.Then, after the peak with the maximum power, a seriesof emission pulses with a gradually decreasing ampli-tude is observed during the voltage pulse. The maxi-mum emission power was detected at the maximumamplitude of the modulated voltage pulse. The max-ima of the negative polarity voltage were ≈20% higherthan those of the positive polarity voltage (Fig. 11).The observed short emission pulses can be attributedto the stepped propagation of the streamer. The dura-tion of individual emission pulses was much shorterthat the half-period of the modulated voltage pulse.Note that the voltage pulse amplitude and the dU/dtvalue at setup no. 3 were more than one order of mag-nitude larger than those at setup no. 2. This led to anincrease in the lengths of diffuse jets.
A photograph of the corona discharge at setupno. 3, taken with an exposure of 0.1 s, is shown inFig. 12.
During the 0.1-s exposure, five 50-Hz voltagepulses were applied to the gap. Each pulse resulted inthe formation of a jet. The lengths of some jetsexceeded 30 cm. The jet direction was specified by thetilt of the point electrode. From the main jets, shorterjets could branch off, including at an angle of 90°. Theshape and color of the jet in Fig. 12 depended on itsdistance from the needle point. At large distances, ithad an arrow-like shape and blue color, while near theneedle point, wriggles arose after several hundred
PLASMA PHYSICS REPORTS Vol. 44 No. 5 2018

CHARACTERISTICS OF A PULSE-PERIODIC CORONA DISCHARGE 529
Fig. 11. (1) Waveform of the voltage pulse in its middle part and (2) synchronized signals of discharge emission during a coronadischarge in atmospheric-pressure air (setup no. 3).
0.6
0.4
0.2
0150
200
100
50
0
−50
−100
−150
−200 182 184 186 188 190 192 194t, µs
1
2
U, k
V
FE
U-1
00, m
A
microseconds. The wriggles appeared as a result ofwriggle instability, which is typical of current filaments[18]. The discharge near the needle point was visuallyof white color.
Figure 13 shows photographs taken with the HiS-pec 1 high-speed camera and illustrating the develop-ment of an individual jet.
Initially, the jet has an arrow-like shape, whilewriggles begin to form several hundred microsecondslater. In [18], the appearance of wriggles was explainedby the onset of wriggle instability of a current filament.To determine the streamer velocity, a jet with a smallnumber of wriggles was chosen. The average propaga-tion velocity of the glow during the 500-μs time inter-val between two subsequent frames did not exceed104 cm/s. However, the actual streamer velocity issubstantially higher. Figure 14 shows a segment of thewaveform of the modulated voltage pulse near themaximum of the negative voltage and the emissionpulses recorded during the corona formation in thistime interval at setup no. 3.
It can be seen that the discharge emission consistsof a sequence of short pulses with an FWHM of∼15 ns. The duration of these pulses is close to thetime resolution of the detection system with the imagetube. The first emission pulse with the largest ampli-tude is detected near the peak of the negative voltageapplied to the point electrode, while the subsequentpulses are detected after the peak of the modulatedvoltage pulse. As a rule, the amplitude of first emissionpulse significantly exceeds the amplitudes of the nextpulses (see Figs. 11, 14). Signals from the image tubeare caused the streamer emission and indicate that the
PLASMA PHYSICS REPORTS Vol. 44 No. 5 2018
streamers propagate unevenly (in jumps). Accord-ingly, the propagation velocity of the streamer front issubstantially higher than 104 cm/s. However, the timeresolution of the detection system with the HiSpec 1camera did not allow us to exactly determine the dis-tance traveled by the streamer for one “jump” (i.e.during one emission pulse) at setup no. 3. It can besupposed that, at setup no. 2, this velocity was higherdue to the higher values of dU/dt (up to 1011 V/s), butit was lower than the velocity of the front of the ball-shaped streamers at setup no. 1 (∼2 mm/ns). We couldnot use the ICCD camera at setup no. 3 because of thehigher level of electromagnetic interferences. Accord-ingly, we failed to fix the shape of the primary streamernear the needle point, as well as to determine thevelocity of the secondary arrow-like (cylindrical)streamer.
As in [18], X-ray emission was detected at setupno. 3 due to the large amplitude of the voltage pulse byusing a Kodak RAR film behind a beryllium foil. Thefilm in the envelope was placed on a metal disk, whichwas installed 5 cm below the tip of the needle elec-trode. The disk was oriented perpendicular to thecylindrical part of the needle electrode and galvani-cally connected to it. The streamers of the corona dis-charge did not reach the envelope. We believe that thefilm exposure is caused by the runaway electrons thatare accelerated in the field of the high positive voltageapplied to the needle electrode and the disk and reachthe surface of the beryllium foil. An additional contri-bution to the film exposure could be made by X-raybremsstrahlung from the needle point.

530 TARASENKO et al.
Fig. 12. Photograph of the corona glow taken with anexposure of 0.1 s. The needle electrode is tilted at the 20°angle to the vertical. The photograph height is 30 cm.
Fig. 13. Photographs illustrating streamer propagation inatmospheric-pressure air at setup no. 3. The tip of the ver-tically oriented needle electrode is at the bottom of theframe. The height of the photographs is 20 cm. The firstframe is on the left. The frame exposure is 250 μs, and thepause between frames is 500 μs.
4. MECHANISM OF STREAMER FORMATION IN A CORONA DISCHARGE
The experimental results obtained in this workallow us to propose the following mechanism ofstreamer formation in a corona discharge when a high-voltage pulse with a steep front is applied to the dis-charge gap. For a subnanosecond or nanosecond risetime of the voltage pulse [35, 38, 39], the appearanceof a brightly glowing region near the needle point iscaused by the formation and propagation of a ball-shaped streamer, the front velocity of which amountsto ≥2 mm/ns under the conditions of the experimentscarried out at setup no. 1 with dU/dt ~1014 V/s. Such ahigh velocity of the streamer front is provided by ion-ization of air by fast electrons at the streamer front.Gas preionization ahead of the streamer front at thenegative polarity of the needle electrode is mainly pro-vided by runaway electrons, while at the positivepolarity, by soft X-rays. By fast electrons, as in [41], wemean electrons with energies from ∼100 eV to a fewkiloelectronvolts, which gain energy in the enhancedfield at the streamer front and near the needle pointand completely lose it during their slowing-down ingas. At the negative polarity of the voltage pulse, run-away electrons also gain energy in the enhanced elec-
tric field near the needle point and at the streamerfront, but this energy is higher (≥10 keV). Runawayelectrons pass ahead of the streamer front and preion-ize the gas there. Soft X-ray emission generated in col-lisions of the fast and runaway electrons with air mol-ecules also preionize the gas ahead of the streamerfront. However, the ionizing power of electrons is sub-stantially higher and, therefore, they make the maincontribution to gas preionization.
For the positive polarity of the needle electrode,fast and runaway electrons escape into the plasma ofthe propagating streamer. The number of runawayelectrons under these conditions is very small, as fol-lows, e.g., from X-ray measurements [42]. The gasahead of the streamer front is preionized by the char-acteristic X-radiation and X-ray bremsstrahlung gen-erated due to the deceleration of fast and runawayelectrons in the anode and gas. When electrons aredecelerated in the metal electrode, the main contribu-tion to gas preionization is made by X-ray bremsstrah-lung, while in the propagation the streamer front, thecharacteristic radiation generated in collisions of elec-trons with air molecules plays a major role [43].
The increase in the voltage rise time leads to theformation of ball-shaped streamers, from the plasmaof which cylindrical streamers propagate. We supposethat, at voltage rise times of several hundred nanosec-onds to one microsecond, the appearance of the glow-ing region near the needle point in the first stage of thedischarge (Figs. 7, 9a) can also be related to the forma-tion of a ball-shaped streamer. This is due to the smallradius of curvature of the needle point, the additionalenhancement of the electric field near microrough-nesses at the tip of the point electrode, and the recom-
PLASMA PHYSICS REPORTS Vol. 44 No. 5 2018

CHARACTERISTICS OF A PULSE-PERIODIC CORONA DISCHARGE 531
Fig. 14. (1) Waveform of the central part of the voltage pulse and (2) synchronized signals of discharge emission during a coronadischarge in atmospheric-pressure air (setup no. 3).
0.6
0.8
0.4
0.2
0150
100
50
0
−50
−100
181.6 181.8 182.0 182.2 182.4 182.6t, µs
1
2U
, kV
FE
U-1
00, m
A
bination of the corona plasma in the pause betweenvoltage pulses. The latter allows the electric fieldstrength at the needle point to be increased in thepulse-periodic mode. In the second stage, the second-ary (cylindrical) streamer starts from the primarysmall-size ball-shaped streamer consisting of thedense plasma. The front of the secondary streamerpropagates at a lower velocity (~0.1 mm/ns at setupno. 2). As is known, the electron density in thestreamer can reach 1014 cm–3 [44]. The propagationdirection of the cylindrical streamer is determined bythe direction in which the electric field is mostenhanced. As a rule, this direction corresponds to thecentral axis passing through the tip of the point elec-trode.
The proposed mechanism of the streamer propaga-tion due to gas ionization by fast electrons and gas pre-ionization by runaway electrons or soft X-rays(depending on the polarity of the point electrode) alsooperates at the microsecond rise time of the voltagepulse. However, due to the lower electric fieldstrength, the streamer propagates mainly along theaxis of the point electrode, where the field is maximal.For the microsecond rise time of the voltage pulse, theelectric field is insufficient for the ball-shapedstreamer to propagate to a large distance from the nee-dle point.
5. CONCLUSIONS
The experimental studies of a pulse-periodiccorona discharge excited in atmospheric air by nano-second or microsecond voltage pulses have shown
PLASMA PHYSICS REPORTS Vol. 44 No. 5 2018
that, for both polarities of voltage pulses, plasma formsfor a short time near the point electrode. For a sub-nanosecond rise time of the voltage pulse, the appear-ance of the brightly glowing region near the needlepoint is caused by the formation of a ball-shapedstreamer, the front of which propagates in atmo-spheric-pressure air with a velocity of ≥2 mm/ns.After the end of the voltage pulse, the streamer stopspropagating and the intensity of its emission decreases.
For a microsecond rise time of the voltage pulse,the appearance of the brightly glowing region near theneedle point in the first stage of the discharge is alsoassociated with the formation of the primary ball-shaped streamer. This is probably due to the additionalenhancement of the electric field near the micror-oughnesses on the tip of the point electrode. In thesecond stage, the secondary (cylindrical) streamerstarts from the primary streamer. At a voltage pulseamplitude of ∼10 kV, the front of the secondarystreamer propagates with a velocity of ~0.1 mm/ns.The propagation direction of the secondary streamerunder these conditions is determined by the directionin which the electric field is most enhanced, which inour experiments could be varied by varying by the ori-entation of the needle electrode. It is established that,for the negative polarity of the needle electrode and amicrosecond rise time of the voltage pulse, higherelectric field strengths are required for the formationof a negative streamer.
ACKNOWLEDGMENTSThe authors are grateful to I.D. Kostyrya,
D.V. Rybka, and M.V. Trigub for their assistance in
532 TARASENKO et al.
performing the experiments. This work was carried outunder the state assignment of the Institute of HighCurrent Electronics, Siberian Branch, Russian Acad-emy of Sciences, problem no. 13.1.4.
REFERENCES1. C. G. Miller and L. B. Loeb, J. Appl. Phys. 22, 494
(1951).2. Y. Kawada, S. Shamoto, and T. Hosokawa, J. Appl.
Phys. 63, 1877 (1988).3. M. Cernak, T. Hosokawa, S. Kobayachi, and T. Ka-
neda, J. Appl. Phys. 83, 5678 (1998).4. G. V. Naidis, Phys. Rev. E 79, 057401 (2009).5. Yu. S. Akishev, M. E. Grushin, V. B. Karal’nik,
I. V. Kochetov, A. E. Monich, A. P. Napartovich, andN. I. Trushkin, Plasma Phys. Rep. 29, 176 (2003).
6. Yu. S. Akishev, G. I. Aponin, V. B. Karal’nik,A. E. Monich, and N. I. Trushkin, Plasma Phys. Rep.30, 779 (2004).
7. A. Settaouti and L. Settaouti, J. Electrost. 65, 625(2007).
8. G. N. B. Dandaron and B. B. Baldanov, Plasma Phys.Rep. 33, 243 (2007).
9. S. B. Afanas’ev, D. S. Lavrenyuk, I. N. Petrushenko,and Yu. K. Stishkov, Tech. Phys. 53, 848 (2008).
10. A. Abahazem, N. Merbahi, O. Ducasse, O. Eichwald,and M. Yousfi, IEEE Trans. Plasma Sci. 36, 924(2008).
11. V. I. Karas’, V. I. Golota, O. V. Bolotov, B. B. Kadolin,and D. V. Kudin, Plasma Phys. Rep. 34, 879 (2008).
12. B. B. Baldanov, Plasma Phys. Rep. 35, 552 (2009).13. A. Mraihi, N. Merbahi, M. Yousfi, A. Abahazem, and
O. Eichwald, Plasma Source Sci. Technol. 20, 065002(2011).
14. N. Jiang, L. Gao, A. Ji, and Z. Cao, J. Appl. Phys. 110,083301 (2011).
15. A. V. Kozyrev, V. Yu. Kozhevnikov, I. D. Kostyrya,D. V. Rybka, V. F. Tarasenko, and D. V. Shitts, Opt.Atmos. Okeana 24, 1009 (2011).
16. T. Czapka and R. Kacprzyk, J. Phys. Conf. Ser. 301,012019 (2011).
17. T. Shao, V. F. Tarasenko, C. Zhang, D. V. Rybka,I. D. Kostyrya, A. V. Kozyrev, P. Yan, and V. Y. Ko-zhevnikov, New J. Phys. 13, 113035 (2011).
18. D. V. Rybka, I. V. Andronikov, G. S. Evtushenko,A. V. Kozyrev, V. Yu. Kozhevnikov, I. D. Kostyrya,V. F. Tarasenko, M. V. Trigub, and Yu. V. Shut’ko,Atmos. Ocean. Opt. 26, 449 (2013).
19. T. Shao, V. F. Tarasenko, Ch. Zhang, E. K. Baksht,D. Zhang, M. V. Erofeev, C. Ren, Yu. V. Shutko, andP. Yan, J. Appl. Phys. 113, 093301 (2013).
20. D. V. Rybka, M. V. Trigub, D. A. Sorokin, G. S. Ev-tushenko, and V. F. Tarasenko, Opt. Atmos. Okeana 27,306 (2014).
21. A. Abahazem, H. Guedah, N. Merbahi, M. Yousfi,O. Eichwald, and A. Ihlal, Mater. Today Proc. 2, 4694(2015).
22. K. M. Bozhko, I. V. Morozova, V. A. Porev, S. Yu. Si-dorenko, A. D. Rudenko, and V. P. Maslov, Wschod-nioeurop. Czasop. Naukowe 10, 118 (2016).
23. L. M. Vasilyak, S. P. Vetchinin, and V. Ya. Pecherkin,Vest. Dagest. Gos. Univ. Ser. 1: Estest. Nauki 31, 6(2016)
24. A. Abahazem, N. Merbahi, H. Guedah, and M. Yousfi,J. Analyt. Sci., Methods Instrum. 7, 57 (2017).
25. J. S. Chang, P. A. Lawless, and T. Yamamoto, IEEETrans. Plasma Sci. 19, 1152 (1991).
26. M. C. Hsiao, B. T. Merritt, B. M. Penetrante, G. E. Vog-tlin, and P. H. Wallman, J. Appl. Phys. 78, 3451 (1995).
27. E. M. van Veldhuizen, W. R. Rutgers, and V. A. Bityu-rin, Chem. Plasma Process. 16, 227 (1996).
28. V. V. Andreev and L. A. Vasil’eva, Prikl. Fiz., No. 4, 16(2016).
29. P. Stritzke, I. Sander, and H. Raether, J. Phys. D 10,2285 (1977).
30. V. S. Bosamykin, V. I. Karelin, A. I. Pavlovskii, andP. B. Repin, Sov. Tech. Phys. Lett. 6, 383 (1980).
31. D. V. Rybka, A. G. Burachenko, V. Yu. Kozhevnikov,A. V. Kozyrev, and V. F. Tarasenko, Opt. Atmos.Okeana 27, 311 (2014).
32. M. V. Erofeev, E. Kh. Baksht, V. F. Tarasenko, andYu. V. Shut’ko, Tech. Phys. 58, 200 (2013).
33. V. F. Tarasenko, E. Kh. Baksht, A. G. Burachenko,I. D. Kostyrya, M. I. Lomaev, and D. V. Rybka, Tech.Phys. 55, 210 (2010).
34. T. Shao, V. F. Tarasenko, Ch. Zhang, A. G. Bura-chenko, D. V. Rybka, I. D. Kostyrya, M. I. Lomaev,E. Kh. Baksht, and P. Yan, Rev. Sci. Instrum. 84,053506 (2013).
35. P. Tardiveau, N. Moreau, S. Bentaleb, C. Postel, andS. Pasquiers, J. Phys. D 42, 175202 (2009).
36. A. Yu. Starikovskiy, IEEE Trans. Plasma Sci. 39, 2602(2011).
37. V. F. Tarasenko, D. V. Beloplotov, and M. I. Lomaev,Plasma Phys. Rep. 41, 832 (2015).
38. D. V. Beloplotov, M. I. Lomaev, D. A. Sorokin, andV. F. Tarasenko, Rus. Phys. J. 60, 1308 (2017).
39. D. V. Beloplotov, V. F. Tarasenko, D. A. Sorokin, andM. I. Lomaev, JETP Lett. 106, 653 (2017).
40. N. Yu. Babaeva and G. V. Naidis, Phys. Plasmas 23,083527 (2016).
41. E. E. Kunhardt and W. W. Byszewski, Phys. Rev. A 21,2069 (1980).
42. C. V. Nguyen, A. P. J. Van Deursen, E. J. M. VanHeesch, G. J. J. Winands, and A. J. M. Pemen, J. Phys.D 43, 025202 (2010).
43. V. F. Tarasenko, E. Kh. Baksht, A. G. Burachenko, andM. I. Lomaev, Plasma Phys. Rep. 43, 792 (2017).
44. Yu. P. Raizer, Gas Discharge Physics (Nauka, Moscow,1992; Springer, Berlin, 1997).
Translated by M. Samokhina
PLASMA PHYSICS REPORTS Vol. 44 No. 5 2018