review of biosimilar biologic product applications · review of biosimilar biologic product...
TRANSCRIPT

Review of Biosimilar Biologic Product Applications
Study of Workload Volume and Full Costs
Final Results Report
PREPARED BY:
Eastern Research Group, Inc. 110 Hartwell Avenue Lexington, MA 02420
February 24, 2016

BsUFA Study of Workload Cost and Volume
i
CONTENTS Executive Summary .............................................................................................................................................. 1
1. Introduction .................................................................................................................................................... 1
1.1 Project Purpose and Scope ................................................................................................................................ 1
1.2 Scope of the Data Collection and Analysis ................................................................................................... 2
1.3 Limitations ............................................................................................................................................................... 2
1.4 Volume of Biosimilar Program Applications and Submissions .......................................................... 4
1.5 Organization of the Report ................................................................................................................................ 5
2. Approach and Data ....................................................................................................................................... 6
2.1 Data Sources and Data Processing ................................................................................................................. 6
2.1.1 In-Person Interviews ....................................................................................................................... 6 2.1.2 CDER Time Reporting Data ........................................................................................................... 7 2.1.3 Email Requests ................................................................................................................................... 9 2.1.4 Other Data Provided to ERG ....................................................................................................... 10
2.2 Estimating Labor Costs .................................................................................................................................... 10
2.3 Dealing with Overlapping Estimates .......................................................................................................... 11
3. Biosimilar Development Program Activities .................................................................................... 12
3.1 Approach and Data ............................................................................................................................................. 12
3.2 Estimated Hours and FTEs ............................................................................................................................. 12
3.2.1 Estimates Derived from Unit Costs and Volume Numbers ............................................ 12 3.2.1 Estimates Derived from CDER Time Reporting Data ....................................................... 14 3.2.2 Summary ............................................................................................................................................ 15
4. 351(k) Biologic Licensing Application (BLA) Review .................................................................... 16
4.1 Approach and Data ............................................................................................................................................. 16
4.2 Estimates of Hours and FTEs ......................................................................................................................... 16
5. Regular Internal Biosimilars-Related Meetings .............................................................................. 18
5.1 Approach and Data ............................................................................................................................................. 18
5.2 BRC Meetings ....................................................................................................................................................... 18
5.3 OCP Regular Meetings ...................................................................................................................................... 20
5.4 OBP Regular Meetings ...................................................................................................................................... 20
5.5 Summary ................................................................................................................................................................ 21
6. Biosimilars-Related Policy Work .......................................................................................................... 22
6.1 Approach and Data ............................................................................................................................................. 22
6.2 Estimates of Hour and FTEs ........................................................................................................................... 22

BsUFA Study of Workload Cost and Volume
ii
7. Science and Research ................................................................................................................................ 24
7.1 Approach and Data ............................................................................................................................................. 24
7.2 Estimates of Hour and FTEs ........................................................................................................................... 24
8. Training, Continuing Education Course, Focus Groups, and CASE Seminar .......................... 26
8.1 Approach and Data ............................................................................................................................................. 26
8.2 Estimated Hours and FTEs ............................................................................................................................. 27
8.2.1 Training ............................................................................................................................................... 27 8.2.2 Continuing Education Course .................................................................................................... 27 8.2.3 Focus Groups .................................................................................................................................... 27 8.2.4 CDER Committee for Advanced Scientific Education (CASE) Seminar ..................... 27
8.3 Summary ................................................................................................................................................................ 28
9. Summary: Biosimilar FTEs, Costs, and Comparison to FDA Estimates .................................... 29
9.1 Estimated Total FTEs for Biosimilars Work ............................................................................................ 29
9.2 Estimated Costs ................................................................................................................................................... 30
9.3 Comparison to FDA Financial Report Values .......................................................................................... 31

BsUFA Study of Workload Cost and Volume
iii
Tables
Table ES-1 – Numbers of Submissions and Applications ............................................................................................... 6 Table ES-2 – Summary of ERG Estimated FTEs by Cost Category, by Fiscal Year ........................................................... 7 Table ES-3 – Summary of ERG Estimates: FTEs, Labor Costs, and Indirect Costs, by Fiscal Year ................................... 9 Table ES-4 – Comparison of ERG Estimate for FDA Financial Reporting Estimates ....................................................... 9 Table 1 – Numbers of Submissions and Applications .................................................................................................... 4 Table 2 – Number of CDER Time Reporting Entries for Categories of Work Selected for Analysis ............................... 8 Table 3 – Calculation of Cost Per FTEs for Salary and Benefits .................................................................................... 11 Table 4 – Estimated Hours and FTEs Associated Biosimilar Development Program Activities Derived From Interview
and Volume Data ................................................................................................................................................ 13 Table 5 – Estimated Hours and FTEs Associated with Meetings ................................................................................. 13 Table 6 – Estimated Hours and FTEs Associated with Denied or Cancelled Meetings that Involved Written Advice . 14 Table 7 – Estimated Total Hours and FTEs Associated with Biosimilar Development Program Work Derived from
Time Reporting Data ........................................................................................................................................... 15 Table 8 – Summary Estimates for FTEs for Biosimilar Development Program Activities ............................................ 15 Table 9 – Summary of Estimated Labor Hours and FTEs from Interviews and Email Responses ................................ 17 Table 10 – Summary of 351(k) BLA Review Estimates by Fiscal Year .......................................................................... 17 Table 11 – Data for Estimating BRC Meeting Workload .............................................................................................. 19 Table 12 – OCP Meeting Attendance and Preparation Time ....................................................................................... 20 Table 13 – OBP Meeting Attendance and Preparation Time ....................................................................................... 21 Table 14 – Summary of Estimates for Regular Biosimilar-Related Meetings .............................................................. 21 Table 15 – Estimated Total Hours and FTEs Associated with Policy-Related Work Derived from Time Reporting Data
............................................................................................................................................................................ 22 Table 16 – Summary of Policy-Related Work Estimates by Fiscal Year ....................................................................... 23 Table 17 – Estimated Total Hours and FTEs Associated with Science and Research Work Derived from Time
Reporting Data .................................................................................................................................................... 24 Table 18 – FTEs and Costs for Biosimilar Labs Work Derived from OBP-Supplied Data .............................................. 25 Table 19 – Summary Estimates by Fiscal Year for Science and Research Work .......................................................... 25 Table 20 – Estimated Total Hours and FTEs Associated with Training Derived from Time Reporting Data and
Marked-Up to Reflect All Relevant Training, by Fiscal Year ................................................................................ 27 Table 21 – Summary of Hours, FTEs, and Non-Labor Costs for Training, the Continuiing Education Course, Focus
Groups, and the CDER CASE Seminar, by Fiscal Year .......................................................................................... 28 Table 22 – Estimated CDER FTEs for Biosimilars Program Work ................................................................................. 29 Table 23 – FTEs for CDER Offices Not Covered by ERG Estimates ............................................................................... 29 Table 24 – Summary of Non-CDER FTEs ...................................................................................................................... 30 Table 25 – Summary of ERG Estimates: FTEs, Labor Costs, and Indirect Costs, by Fiscal Year .................................... 31 Table 26 – Comparison of ERG Estimates to FDA BsUFA Financial Reporting ............................................................. 32 Table A-1 - Estimated Total Hours, FTEs, and Cost Associated with Biosimilar Development Program Work Derived
from Time Reporting Data, Including 95 Percent Confidence Intervals ........................................................... A-2 Table A-2 - Estimated Total Hours, FTEs, and Cost Associated with Biosimilars Policy-Related Work Derived from
Time Reporting Data, Including 95 Percent Confidence Intervals .................................................................... A-3 Table A-3 - Estimated Total Hours, FTEs, and Cost Associated with Biosimilars Science and Research-Related Work
Derived from Time Reporting Data, Including 95 Percent Confidence Intervals .............................................. A-4

BsUFA Workload Volume and Cost: Interim Report
Executive Summary ES-1
EXECUTIVE SUMMARY Background
The Biologics Price Competition and Innovation Act of 2009 (BCPI Act)1 amended the Public Health Service (PHS) Act and other statutes to create an abbreviated approval pathway for biological products that can be demonstrated to be “biosimilar” to or “interchangeable” with currently approved biological products. The BPCI Act also directed FDA to develop recommendations for a user fee program for biosimilars applications for fiscal years 2013 through 2017. Following consultation with stakeholders and holding a series of public meetings, FDA developed recommendations for a user fee program and submitted those recommendations to Congress on January 13, 2012. Congress enacted the Biosimilar User Fee Act (BsUFA) on July 9, 2012.2 Section 744I(d) of the Food, Drug, and Cosmetic Act (FD&C Act), as amended by BsUFA, instructed FDA to contract with an independent consulting firm to study the workload volume and full costs associated with the process for the review of biosimilar biological product applications; Eastern Research Group, Inc. (ERG) of Lexington, MA was selected by FDA to develop these estimates. An Interim Report, containing estimates from the beginning of Fiscal Year 2013 (FY13) through March 2015 was published by FDA in September 2015. This Final Report expands on the analysis contained in the Interim Report to include the final six months of FY15; covering the first three full fiscal years of FDA’s biosimilars program.
ERG’s estimates in this report focus on the workload and cost associated with activities that FDA is allowed to expend fee-related revenue on under BsUFA. Appendix D of the FY13 BsUFA Financial Report3 provides details on the set of allowable activities and costs that can be covered by BsUFA fees. The activities include:4
• The activities necessary for the review of submissions in connection with biosimilar biological product development, biosimilar biological product applications, and supplements.
• Actions related to submissions in connection with biosimilar biological product development, the issuance of action letters which approve biosimilar biological product applications or which set forth in detail the specific deficiencies in such applications, and where appropriate, the actions necessary to place such applications in condition for approval.
• The inspection of biosimilar biological product establishments and other facilities undertaken as part of FDA’s review of pending biosimilar biological product applications and supplements.
• Activities necessary for the release of lots of biosimilar biological products under section 351(k) of the Public Health Service Act.
1 The BCPI Act was contained as a subtitle within the Patient Protection and Affordable Care Act (Affordable Care Act or ACA) which was signed into law on March 23, 2010 by President Obama. 2 http://www.gpo.gov/fdsys/pkg/BILLS-112s3187enr/pdf/BILLS-112s3187enr.pdf. 3http://www.fda.gov/downloads/AboutFDA/ReportsManualsForms/Reports/UserFeeReports/FinancialReports/BsUFA/UCM395875.pdf. 4 The following list was taken directly from the FY13 BsUFA Financial Report; see footnote 3.

BsUFA Workload Volume and Cost: Interim Report
Executive Summary ES-2
• Monitoring of research conducted in connection with the review of biosimilar biological product applications.
• Postmarket safety activities with respect to biologics approved under biosimilar biological product applications or supplements, including the following activities:
o Collecting, developing, and reviewing safety information on biosimilar biological products, including adverse-event reports.
o Developing and using improved adverse-event data-collection systems, including information technology systems.
o Developing and using improved analytical tools to assess potential safety problems, including access to external data bases.
o Implementing and enforcing section 505(o) of the FD&C Act (relating to post-approval studies and clinical trials and labeling changes) and section 505(p) of the FD&C Act (relating to risk evaluation and mitigation strategies).
o Carrying out section 505(k)(5) of the FD&C Act (relating to adverse-event reports and postmarket safety activities).
Estimates Included in Current Document
ERG’s estimates cover the first three fiscal years of the FDA biosimilars program, from the beginning of FY13 through the end of FY15. This report focuses primarily on work performed by FDA’s Center for Drug Evaluation and Research (CDER) given that the vast majority of the biosimilars work performed by FDA through September 30, 2015 has been performed by CDER.
This document includes full-time equivalent (FTE) estimates for the following cost components:
• Biosimilar development program activities – This includes the work associated with proposed and ongoing biosimilar development program review and advice, Investigational New Drug (IND) reviews, and participation in (preparation, attendance, and follow-up) Biosimilar Initial Advisory (BIA) and Biomilar Product Development (BPD) meetings.
• 351(k) BLA review – ERG’s estimates cover 351(k) review activities through September 30, 2015 for the first seven 351(k) BLAs under the biosimilar program. As of September 30, 2015 seven applications have been submitted under section 351(k) of the Public Health Service Act. Of these seven applications, six were filed and one application was still pending FDA’s filing decision as of September 30, 2015. One application was approved by the end of within the BsUFA goal date.
• Regular biosimilar meetings within CDER – CDER holds a number of regular internal meetings that discuss specific applications and submissions and also deal with policy issues.
• Policy-related work – FDA’s work to interpret the BPCI Act, to develop policies related to the review and approval of biosimilar and interchangeable products, and to develop Guidance documents.
• Science and research – Science and research work at FDA related to the BsUFA program.

BsUFA Workload Volume and Cost: Interim Report
Executive Summary ES-3
• Training – FDA staff both participate in and conduct training related to biosimilars.
• Outreach – FDA’s work on developing materials and conducting education and outreach related to biosimilars. For this category we included the time and expense associated with biosimilar-related focus groups, a continuing education course, and a CDER Committee for Advanced Scientific Education (CASE) seminar in October of 2015.
• CDER offices not otherwise covered by ERG’s estimates – FDA provided ERG with estimates of the biosimilar-related FTEs that can be allocated to the CDER offices for each fiscal year, including Office of the Center Director (OCD), Office of Executive Programs (OEP), Office of Management (OM), Office of Communications (OCOMM), and Office of Strategic Programs (OSP).
ERG was also provided with biosimilar-related FTE estimates for the Center for Biologics Evaluation and Research (CBER), the Office of Regulatory Affairs (ORA), and the FDA Office of the Commissioner. In our summary estimates we also included data on operating and other indirect costs allocated by FDA to the biosimilars program.
Overall Approach and Data Collected Efforts
ERG collected data from multiple sources under this project.
• ERG conducted three different sets of interviews between fall 2014 and fall 2015. In the fall of 2014, ERG interviewed 43 individuals on a variety of biosimilar program-related subjects. These interviews covered biosimilar development program activities and BLA review workload, including meetings, policy work, preparation for post-market activities, and outreach. In the spring of 2015, ERG interviewed 61 individuals,5 55 of which were interviewed for their role in reviewing the 5 351(k) BLAs received before March 31, 2015. The interviews related to the five 351(k) BLAs provided ERG with estimates of the time it took individuals to perform their review functions for each BLA6. In the fall of 2015, ERG interviewed 84 individuals (many of whom were interviewed previously) to update previous workload estimates or capture remaining workload estimates for the review of the first five 351(k) BLA applications.
• ERG sent email requests for time estimates associated with work on two 351(k) applications that were received in the summer of 2015 because both were in the early stages of the review process; the associated time spent by FDA personnel on these two BLAs was expected to be significantly less than the time spent on the first five 351(k) BLAs. ERG also sent email requests to FDA staff asking for time spent on certain biosimilar-related activities (e.g., developing a
5 Some of the same individuals were interviewed in both the fall of 2014 and spring of 2015. 6 As indicated in the interim report, ERG also implemented a web survey of individuals who were involved in the review of the five 351(k) BLAs who were not interviewed in person. A total of 88 surveys requests were sent out across the five 351(k) BLAs. Due to poor survey response, ERG determined that full interviews with all personnel involved in the 351(k) BLA review process should be conducted, and these additional interviews were conducted in the fall of 2015.
BsUFA Workload Volume and Cost: Interim Report
Executive Summary ES-4
continuing education course). ERG limited email requests to areas where only specific information was being asked for (e.g., time spent on a well-defined task/activity), and the question being asked could be answered more efficiently via email rather than in an interview setting.
• ERG was provided with CDER time reporting data for staff that had performed biosimilar-related work. ERG developed a method to use those data to develop quarterly-level projections of biosimilar-related hours for specific types of work (biosimilar development program activities; policy-related work; and science and research) and 95 percent confidence intervals around those projections. ERG also used the time reporting data to estimate training-related FTEs for each fiscal year.
• ERG was provided with the 2013, 2014, and 2015 FDA BsUFA financial reports and the associated process cost spreadsheets. ERG was also provided with the 2013, 2014, and 2015 BsUFA performance reports.
• ERG was provided with volume numbers for sponsors in the program, meetings, meeting requests, and other aspects that FDA tracks as program “volume” for biosimilars work.
Limitations
The estimates that we have developed have a number of limitations that should be kept in mind when reviewing the information in this report. These include:
• Interviewee recall – ERG has built a number of estimates from information collected through interviews with FDA staff. In these interviews we have asked respondents to recall the time spent on certain activities. Accurate recall of the time spent on certain activities is most likely an issue in the interviews we conducted, especially for work that was performed a year or more before the interview took place. For the most part, however, ERG did not ask interviewees to provide the time spent on work a year or more in the past. Rather, we asked respondents to provide an estimate of the “average” or “usual” time spent on an activity. Nevertheless, if the interviewee had not performed that work in a long time, the interviewee would have to recall from events in the past. The bulk of our interviews, however, were related to the 351(k) BLA reviews and, at most, respondents were recalling information from 10-12 months prior.7
• Average unit hours – ERG developed a set of estimates for biosimilar development program activities (including meetings) based on interviews in which we asked for the “average” or “usual” time it took to perform certain activities. From that information, we developed an estimate of the “average unit hours” for aspects of the biosimilar development program (e.g., average time for the different types of meetings). These average unit hours were then applied to the volume of activities in each FY to develop an estimate of labor hours for the different aspects of the biosimilar development program. The average unit hours estimates discussions,
7 The first 351(k) BLA was received in May of 2014 and ERG performed the interviews for that 351(k) BLA review from late March through May of 2015. Interviews for subsequent 351(k) reviews were conducted through September 2015.
BsUFA Workload Volume and Cost: Interim Report
Executive Summary ES-5
however, do not take into account several complexities that could result in the actual hours being higher or lower than the value we used in our calculations. On the one hand, there is most likely a learning curve that could result in initial biosimilars work being performed in FY13 taking longer to complete compared to work being performed in FY14 and FY15. On the other hand, the work has grown more complex over the three fiscal years we considered with a corresponding increase in the number of program-specific issues; the increasing complexity over time would lead to work being performed later in the three-year period taking longer than work at the start of the period. With both considerations, our estimate of an average time to complete the work based on discussions with FDA staff may underestimate the actual time. We have not attempted to adjust these estimates for any of these factors.
• Misclassification of hours in time reporting data – The time reporting data are used in several areas of this report and most likely contain some misclassification of labor hours. Specifically, some staff may have inadvertently classified their labor hours as being under another program area (e.g., Prescription Drug User Fee Act (PDUFA) instead of a biosimilar-related category) or in an incorrect category (e.g., as being for 351(k) BLA review rather than being for an IND review).
• Time reporting data represent a sample – The time reporting data are a sample of work performed based on a two-week period each quarter. This implies that any data from the time reporting system are subject to sampling error. ERG has attempted to account for that sampling error by calculating 95 percent confidence intervals. Additionally, the data are collected during two consecutive weeks in a quarter which may also introduce some error. For example, if the two week period had fewer sponsor meetings or or was a slow period for policy-related discussions on biosimilars, then the time for biosimilars-related work during the two-week period will underestimate of the work performed during the quarter in which the data were collected.
Summary of Estimates and Comparison to BsUFA Performance Goals
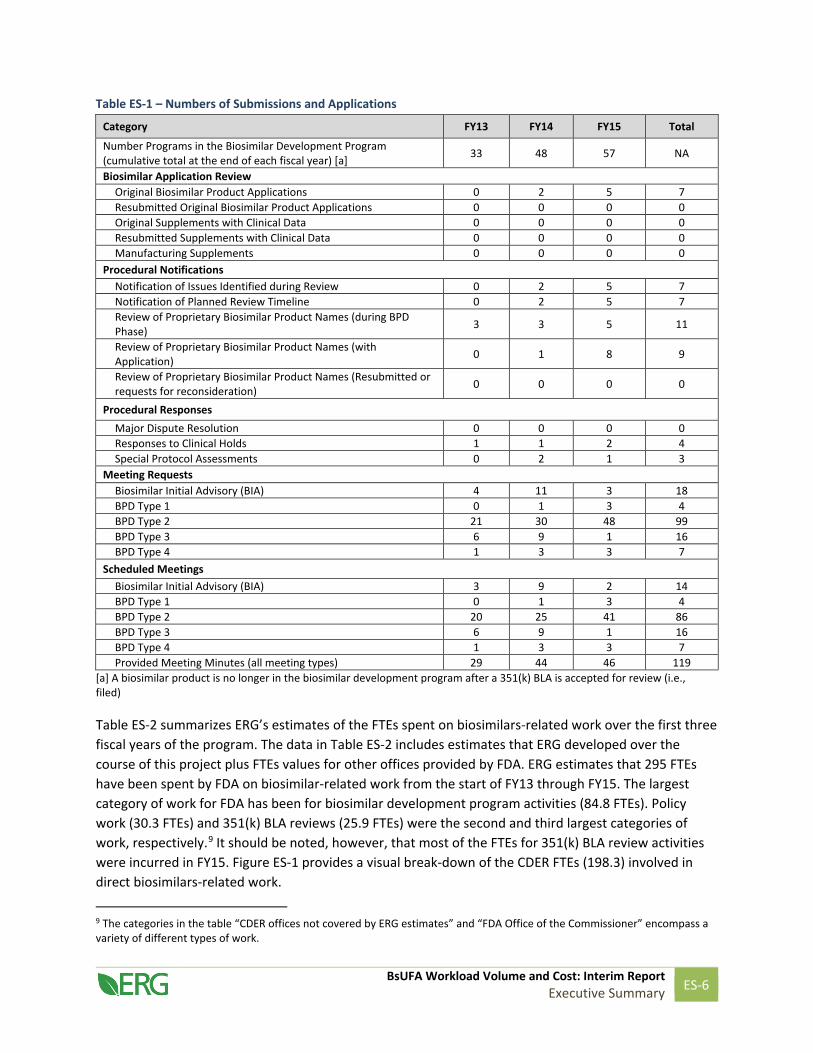
Table ES-1 provides a summary of the number of sponsor programs in the biosimilar development program at the end of each fiscal year, meetings (by type) requested and scheduled, and 351(k) BLAs. Table ES-1 also provides inforation on the number of certain procedural activities associated with submissions and applications. As of September 30, 2015, FDA had 57 programs in the biosimilars development program,8 participated in 127 meetings of all types (BIA meetings and the Type 1 – 4 BPD meetings), and received seven 351(k) BLAs for proposed biosimilar products.
8 This total does not include programs that submitted a 351(k) BLA (and thus, left the biosimial development program) or the number of sponsor who withdrew from the program.
BsUFA Workload Volume and Cost: Interim Report
Executive Summary ES-6
Table ES-1 – Numbers of Submissions and Applications
Category FY13 FY14 FY15 Total
Number Programs in the Biosimilar Development Program (cumulative total at the end of each fiscal year) [a] 33 48 57 NA
Biosimilar Application Review Original Biosimilar Product Applications 0 2 5 7 Resubmitted Original Biosimilar Product Applications 0 0 0 0 Original Supplements with Clinical Data 0 0 0 0 Resubmitted Supplements with Clinical Data 0 0 0 0 Manufacturing Supplements 0 0 0 0
Procedural Notifications Notification of Issues Identified during Review 0 2 5 7 Notification of Planned Review Timeline 0 2 5 7 Review of Proprietary Biosimilar Product Names (during BPD Phase) 3 3 5 11
Review of Proprietary Biosimilar Product Names (with Application) 0 1 8 9
Review of Proprietary Biosimilar Product Names (Resubmitted or requests for reconsideration) 0 0 0 0
Procedural Responses Major Dispute Resolution 0 0 0 0 Responses to Clinical Holds 1 1 2 4 Special Protocol Assessments 0 2 1 3
Meeting Requests Biosimilar Initial Advisory (BIA) 4 11 3 18 BPD Type 1 0 1 3 4 BPD Type 2 21 30 48 99 BPD Type 3 6 9 1 16 BPD Type 4 1 3 3 7
Scheduled Meetings Biosimilar Initial Advisory (BIA) 3 9 2 14 BPD Type 1 0 1 3 4 BPD Type 2 20 25 41 86 BPD Type 3 6 9 1 16 BPD Type 4 1 3 3 7 Provided Meeting Minutes (all meeting types) 29 44 46 119
[a] A biosimilar product is no longer in the biosimilar development program after a 351(k) BLA is accepted for review (i.e., filed)
Table ES-2 summarizes ERG’s estimates of the FTEs spent on biosimilars-related work over the first three fiscal years of the program. The data in Table ES-2 includes estimates that ERG developed over the course of this project plus FTEs values for other offices provided by FDA. ERG estimates that 295 FTEs have been spent by FDA on biosimilar-related work from the start of FY13 through FY15. The largest category of work for FDA has been for biosimilar development program activities (84.8 FTEs). Policy work (30.3 FTEs) and 351(k) BLA reviews (25.9 FTEs) were the second and third largest categories of work, respectively.9 It should be noted, however, that most of the FTEs for 351(k) BLA review activities were incurred in FY15. Figure ES-1 provides a visual break-down of the CDER FTEs (198.3) involved in direct biosimilars-related work.
9 The categories in the table “CDER offices not covered by ERG estimates” and “FDA Office of the Commissioner” encompass a variety of different types of work.

BsUFA Workload Volume and Cost: Interim Report
Executive Summary ES-7
Table ES-2 – Summary of ERG Estimated FTEs by Cost Category, by Fiscal Year
Category FY13 FY14 FY15 Totals FTEs Estimated by ERG for Biosimilars-Related Work
Biosimilar Development Program Activities
21.86 31.43 31.47 84.76
351(k) BLA Review 0.00 2.31 23.58 25.89 Regular Biosimilars-Related Meetings
3.56 2.90 3.64 10.10
Policy 8.96 8.42 12.94 30.32
Science and Research 9.42 7.44 6.96 23.82
Training 12.31 3.13 6.59 22.03 Continuing Education Course, Focus Groups, CDER CASE Seminar
0.00 0.00 1.37 1.37
CDER Overhead Offices that support all CDER functions including BsUFA [a]
10.95 11.02 14.89 36.86
FDA Office of Commissioner [b] 15.16 14.33 20.39 49.88
ORA [c] 0.00 0.00 5.00 5.00
CBER 4.00 1.00 0.00 5.00
Total FTEs 86.22 81.98 126.83 295.03 [a] Overhead offices (e.g., OM, OSP, OEP, OCOMM, OCD) support the operations of CDER and do not report time to any specific program but rather have their time proportionally distributed to each program based on the directly reported time. [b] FTEs for FY13, FY14, and FY15 for the FDA Office of the Commissioner were estimated based on the share of total FDA salary that the Office of the Commissioner represents. These percentages were 21.34 percent for FY13, 21.18 percent in FY14, and 19.16 percent of FY15. These percentages were then applied to the sum of all CDER, CBER, and ORA FTEs in this table. [c] The BsUFA financial reports indicate that ORA has incurred no biosimilar-related hours in FY13 and FY14. ORA, however, was involved in inspections during the 351(k) BLA reviews and incurred time associated with those inspections in FY15. The number of FTEs and associated costs were provided by FDA to ERG.

BsUFA Workload Volume and Cost: Interim Report
Executive Summary ES-8
Figure ES-1 - Breakdown of CDER FTEs for Direct Work on Biosimilars
Table ES-3 estimates the total cost associated with biosimilars work by first converting FTEs to costs10 (for salary and benefits), then adding in operating costs and costs for FDA centrally managed accounts. Data on operating costs and costs for FDA centrally managed accounts attributed to BsUFA were taken from the BsUFA process cost worksheets for FY13-FY15. ERG estimates that FDA spent $26.0 million in FY13, $23.5 million in FY14, and $32.3 million in FY15. In total, ERG estimates that FDA has spent a total of $81.7 million on biosimilars-related work over the first three fiscal years of the program.
10 This is described in Section 2.2, Estimating Labor Costs.

BsUFA Workload Volume and Cost: Interim Report
Executive Summary ES-9
Table ES-3 – Summary of ERG Estimates: FTEs, Labor Costs, and Indirect Costs, by Fiscal Year
Category FY13 FY14 FY15 Total
Total Biosimilars FTEs 86.22 81.98 126.83 295.03
Labor Costs (salary and benefits) ($1,000s)
$13,496.7 $13,098.0 $21,387.6 $47,992.3
Operating Costs ($1,000s) $7,663.9 $6,216.7 $2,845.7 $16,726.3
Centrally Managed Accounts Costs ($1,000s) FDA Central $1,861.5 $1,560.7 $4,513.9 $7,936.1
GSA Rent $964.3 $867.3 $1,307.0 $3,138.6
Other Rent Related $403.6 $628.8 $732.9 $1,765.3
White Oak Relocation $697.5 $456.3 $484.9 $1,638.7
HR $166.4 $116.7 $232.8 $515.9
Shared Services $699.0 $544.1 $249.4 $1,492.5
ORA Non-Labor Costs $0.0 $0.0 $512.5 $512.5
Total Costs ($1,000s) $25,952.9 $23,506.4 $32,709.0 $82,168.3
Table ES-4 compares ERG’s total estimate to the values reported by FDA in its annual BsUFA financial reporting.11 ERG’s total cost estimates represent 93 to 100 percent of the values that are reported by FDA in its BsUFA financial reporting. ERG’s FTE estimates are between 83 and 105 percent of the FDA-reported FTEs.
Table ES-4 – Comparison of ERG Estimate for FDA Financial Reporting Estimates
Category FTEs Costs
FY13 FY14 FY15 FY13 FY14 FY15 ERG Estimates 86 82 127 25,952.9 23,488.6 32,276.7 FDA Financial Reporting Totals 98 78 153 28,040.5 23,391.6 34,817.2 ERG Value Relative to FDA Value 88% 105% 83% 93% 100% 93%
11 http://www.fda.gov/AboutFDA/ReportsManualsForms/Reports/UserFeeReports/FinancialReports/BsUFA/default.htm.
BsUFA Workload Volume and Cost: Interim Report
Introduction 1
1. INTRODUCTION
The Biosimilar User Fee Act (BsUFA) was created as part of the Affordable Care Act (ACA) signed into law in 2010. The ACA contains a subtitle called the Biologics Price Competition and Innovation Act of 2009 (BPCI Act) that amends the Public Health Service (PHS) Act and other statutes to create an abbreviated approval pathway for biosimilar and interchangeable biological products. Section 351(k) of the PHS Act, added by the BPCI Act, allows a company to submit an application for licensure of a biosimilar or interchangeable biological product. The BPCI Act directed FDA to develop recommendations for a user fee program for 351(k) applications for fiscal years 2013 through 2017. The FDA consulted with regulated industry and public stakeholders to develop recommendations for biosimilars user fee program, published the recommendations in the Federal Register, and held a public meeting to review the recommendations. The recommendations were provided to Congress on January 13, 2012, and the Biosimilar User Fee Act of 2012 (BsUFA) was enacted on July 9, 2012.
FDA did not receive any biosimilar applications or supplements in FY 2013 but devoted considerable resources and effort to reviewing submissions for biosimilars in development, meeting with sponsors to discuss their development programs, and developing other non-application review portions of the program (e.g., guidance documents, staff training).12 As of September 30, 2015, there were 57 programs participating in the biosimilar product development program and a total of seven Biologics License Applications (BLAs) submitted under section 351(k) of the Public Health Service Act (hereafter, referred to as “351(k) BLAs”). One of these applications was approved in March of 2015.
This document presents the final findings of a study of the workload volume and full costs associated with the process for the review of biosimilar biological product applications (hereafter referred to as the “biosimilar program”). This Final Report builds upon the Interim Report published by FDA in September 2015 that covered the FDA biosimilar-related work over the first 2.5 years of the 351(k) program (beginning of Fiscal Year 2013 (FY13) until March 31, 2015) and expands the timeframe to an additional six months to capture three full fiscal years of data (through September 30, 2015).
1.1 Project Purpose and Scope
The purpose of this report is to provide an independent study of the workload volume and full costs associated with the biosimilar program as required by Section 744I(d) of the Food, Drug, and Cosmetic Act (FD&C Act), as amended by BsUFA.13 The study was performed by Eastern Research Group, Inc. (ERG), and estimates the volume of biosimilar program work components and estimates the workload volume and full costs (direct and indirect) of these work components.
12 FY 2014 Performance Report to the President and Congress for the Biosimilar User Fee Act. FDA Department of Health and Human Services. 13 The Biosimilar User Fee Act of 2012, http://www.gpo.gov/fdsys/pkg/BILLS-112s3187enr/pdf/BILLS-112s3187enr.pdf

BsUFA Workload Volume and Cost: Interim Report
Introduction 2
Appendix D of the FY13 BsUFA Financial Report14 provides details on the set of activities that comprise FDA’s biosimilars program; our work was limited to activites that fall within that scope. The specific set of activities that we included in our analysis are detailed in Seciton 1.2 below.
This report focuses on the workload volume and costs of the program from FY 2013 through FY 2015. Furthermore, this report focuses primarily on work performed by FDA’s Center for Drug Evaluation and Research (CDER) given that the vast majority of the biosimilars work performed by FDA through September 30, 2015 has been performed by CDER.
1.2 Scope of the Data Collection and Analysis FDA asked ERG to develop estimates for work performed from the start of FY13 (October 1, 2012) through FY15 (September 30, 2015). This time frame allowed ERG to include the full first cycle review or a portion of the first cycle review for seven 351(k) BLAs received by FDA before September 30, 2015.
This report provides estimates of the labor hours, full-time equivalents (FTEs), and costs incurred by FDA for biosimilars-related activities. Included in this report are estimates for the following activity areas:
• Biosimilar development program activities
• 351(k) BLA review, including inspections performed as part of the review
• Regular internal biosimilars-related meetings held by CDER
• Policy-related work
• Science and research work
• Training
• Developing a continuing education course, developing and implementing focus groups, and planning a CDER Committee for Advanced Scientific Education (CASE) seminar
• FDA-provided estimates for CDER offices not included in ERG’s estimates, including Office of the Center Director (OCD), Office of Executive Programs (OEP), Office of Management (OM), Office of Communications (OCOMM), and Office of Strategic Programs (OSP).
ERG was also provided with biosimilar-related FTE estimates for the Center for Biologics Evaluation and Research (CBER), the Office of Regulatory Affairs (ORA), and the FDA Office of the Commissioner. In our summary estimates we also included data on operating and other indirect costs allocated by FDA to the biosimilars program.
1.3 Limitations The estimates that we have developed have a number of limitations that should be kept in mind when reviewing the information in the report. These include:
14 http://www.fda.gov/downloads/AboutFDA/ReportsManualsForms/Reports/UserFeeReports/FinancialReports/BsUFA/UCM395875.pdf.

BsUFA Workload Volume and Cost: Interim Report
Introduction 3
• Interviewee recall – ERG has built a number of estimates from information collected through interviews with FDA staff. In these interviews we have asked respondents to recall the time spent on certain activities. Accurate recall of the time spent on certain activities is most likely an issue in the interviews we conducted, especially for work that was performed a year or more before the interview took place. For the most part, however, ERG did not ask interviewees to provide the time spent on work a year or more in the past. Rather, we asked respondents to provide an estimate of the “average” or “usual” time spent on an activity. Nevertheless, if the interviewee had not performed that work in a long time, the interviewee would have to recall from events in the past. The bulk of our interviews, however, were related to the 351(k) BLA reviews and, at most, respondents were recalling information from 10-12 months prior.15
• Average unit hours – ERG developed a set of estimates for biosimilar development program activities (including meetings) based on interviews in which we asked for the “average” or “usual” time it took to perform certain activities. From that information, we developed an estimate of the “average unit hours” for aspects of the biosimilar development program (e.g., average time for the different types of meetings). These average unit hours were then applied to the volume of activities in each FY to develop an estimate of labor hours for the different aspects of the biosimilar development program. The average unit hours estimates, however, do not take into account several complexities that could result in the actual hours being higher or lower than that value we used in our calculations. On the one hand, there is most likely a learning curve that could result in initial biosimilars work being performed in FY13 taking longer to complete compared to work being performed in FY14 and FY15. On the other hand, the work has grown more complex over the three fiscal years we considered with a corresponding increase in the number of program-specific issues; the increasing complexity over time would lead to work being performed later in the three-year period taking longer than work at the start of the period. With both considerations, our estimate of an average time to complete the work based on discussions with FDA staff may underestimate the actual time. We have not attempted to adjust these estimates for any of these factors.
• Misclassification of hours in time reporting data – The CDER time reporting data are used in several areas of this report and most likely contain some misclassification of labor hours. Specifically, some staff may have inadvertently classified their labor hours as being under another program area (e.g., Prescription Drug User Fee Act (PDUFA) instead of a biosimilar-related category) or in an incorrect category (e.g., as being for 351(k) BLA review rather than being for an IND review).
• Time reporting data represent a sample – The time reporting data are a sample of work performed based on a two-week period each quarter. This implies that any data from the time reporting system are subject to sampling error. ERG has attempted to account for that sampling error by calculating 95 percent confidence intervals. Additionally, the data are collected during two consecutive weeks in a quarter which may also introduce some error. For example, if the
15 The first 351(k) BLA was received in May of 2014 and ERG performed the interviews for that 351(k) BLA review from late March through May of 2015. Interviews for subsequent 351(k) reviews were conducted through September 2015.

BsUFA Workload Volume and Cost: Interim Report
Introduction 4
two week period had fewer sponsor meetings or or was a slow period for policy-related discussions on biosimilars, then the time for biosimilars-related work during the two-week period will underestimate of the work performed during the quarter in which the data were collected.
1.4 Volume of Biosimilar Program Applications and Submissions Table 1 provides a summary of the number of sponsor programs in the biosimilar development program at the end of each fiscal year, meetings (by type) requested and scheduled, and 351(k) BLAs. Table ES-1 also provides information on the number of certain procedural activities associated with submissions and applications. As of September 30, 2015, FDA had 57 programs in the biosimilars development program,16 participated in 127 meetings of all types (BIA meetings and the Type 1 – 4 BPD meetings), and received seven 351(k) BLAs for proposed biosimilar products.
Table 1 – Numbers of Submissions and Applications Category FY13 FY14 FY15 Total
Number of Pre-INDs/ INDs in the Biosimilar Product Development program (cumulative totals) [a] 33 48 57 NA
Biosimilar Application Review Original Biosimilar Product Applications 0 2 5 7 Resubmitted Original Biosimilar Product Applications 0 0 0 0 Original Supplements with Clinical Data 0 0 0 0 Resubmitted Supplements with Clinical Data 0 0 0 0 Manufacturing Supplements 0 0 0 0
Procedural Notifications Notification of Issues Identified during Review 0 2 5 7 Notification of Planned Review Timeline 0 2 5 7 Review of Proprietary Biosimilar Product Names (during BPD Phase) 3 3 5 11
Review of Proprietary Biosimilar Product Names (with Application) 0 1 8 9
Review of Proprietary Biosimilar Product Names (Resubmitted or requests for reconsideration) 0 0 0 0
Procedural Responses Major Dispute Resolution 0 0 0 0 Responses to Clinical Holds 1 1 2 4 Special Protocol Assessments 0 2 1 3
Meeting Requests Biosimilar Initial Advisory (BIA) 4 11 3 18 BPD Type 1 0 1 3 4 BPD Type 2 21 30 48 99 BPD Type 3 6 9 1 16 BPD Type 4 1 3 3 7
Scheduled Meetings Biosimilar Initial Advisory (BIA) 3 9 2 14 BPD Type 1 0 1 3 4 BPD Type 2 20 25 41 86 BPD Type 3 6 9 1 16
16 This total does not include programs that submitted an 351(k) BLA (and thus, left the biosimial development program) or the number of sponsor who withdrew from the program.

BsUFA Workload Volume and Cost: Interim Report
Introduction 5
Category FY13 FY14 FY15 Total
BPD Type 4 1 3 3 7 Provided Meeting Minutes (all meeting types) 29 44 46 119
[a] A biosimilar product is no longer in the biosimilar development program after a 351(k) BLA is accepted for review (i.e., filed)
1.5 Organization of the Report The remainder of this report is organized as follows:
• Section 2 discusses the methods and data sources that ERG used to develop our estimates
• Section 3 provides estimates for biosimilar development program-related work
• Section 4 provides estimates for 351(k) BLA reviews
• Section 5 provides estimates for CDER’s regular biosimilars meetings
• Section 6 provides estimates for policy-related work
• Section 7 provides estimates for science and research work
• Section 8 provides estimates for training, developing a continuing education course, developing and implementing focus groups, and planning a CDER CASE seminar on biosimilars.
• Section 9 summarizes the FTE estimates from Sections 3 through 8, converts the FTE estimates to costs (for salary and benefits) and then adds in operating and indirect costs to develop an estimate of the full cost of the program. Section 9 also compares the resulting estimates to data reported in FDA’s BsUFA financial reports.

BsUFA Workload Volume and Cost: Interim Report
Approach and Data 6
2. APPROACH AND DATA This section provides an overview of the data and methods that ERG used to develop estimates of workload volume and full costs associated with the FDA biosimilars program. Details that are specific to the cost categories (e.g., 351(k) BLA review) are discussed within the section for each category.
2.1 Data Sources and Data Processing ERG used a number of data sources to develop the estimates summarized in this report. The two main sources of data for this report are in-person interviews conducted in the fall of 2014, spring of 2015, and fall of 2015 as well as CDER’s time reporting data.17 In addition, ERG sent email information requests to FDA personnel participating in two 351(k) BLA reviews as well as other specific requests. FDA also provided ERG with a number of data items to use in our analyses.
2.1.1 In-Person Interviews
ERG performed a series of in-person interviews with FDA staff involved in biosimilars work at the Agency in the fall of 2014, spring of 2015, and then again in the fall of 2015. In the fall of 2014, ERG interviewed 43 individuals on a variety of biosimilars-related subjects. These interviews covered biosimilar development program related work and 351(k) BLA review workload, policy work, preparation for post-market activities, and outreach. In the spring of 2015, ERG interviewed 61 individuals,18 55 of which were interviewed for their role in reviewing the 5 351(k) BLAs received before March 31, 2015. The interviews related to the 351(k) BLAs provided ERG with estimates of the time it took individuals to perform their review functions for each BLA. In the fall of 2015, ERG interviewed 84 individuals (many of whom were interviewed previously) to update the 351(k) BLA workload estimates or capture remaining workload estimates for the remaining six months of FY15 .
The interviews usually involved two or more individuals to allow the interviewees to prompt one another; for example, when interviewing staff regarding 351(k) BLA reviews, we tried to interview both primary reviewers and their team leads at the same time. This allowed the primary reviewers to remind the team leads of the work performed or vice versa. Most interviews lasted between 30 and 60 minutes with some taking 20 minutes or less.19
In discussing the 351(k) BLAs reviews with interviewees, we used a process map we developed based on the FDA 21st Century Review Desk Reference Guide.20 In performing these interviews, we broke the review process down into four stages:
17 As indicated in the interim report, ERG also implemented a web survey of individuals who were involved in the review of the first five 351(k) BLAs who were not interviewed in person during development of the Interim Results report. Due to poor survey response, ERG determined that full interviews with all personnel involved in the 351(k) BLA review process should be conducted for the Final Report, and these additional interviews were conducted in the fall of 2015. 18 Some of the same individuals were interviewed in both the fall of 2014 and spring of 2015. 19 Interviews that took 20 minutes or less tended to be focused on an update of previous interview estimates or a specific activity that was easily explained/discussed. 20 http://www.fda.gov/downloads/AboutFDA/CentersOffices/CDER/ManualofPoliciesProcedures/UCM218757.pdf.

BsUFA Workload Volume and Cost: Interim Report
Approach and Data 7
• From receipt of the application through the filing meeting.
• From the filing meeting through the secondary sign off on the review. This stage included the primary and secondary reviews, the mid-cycle meeting, and participation in inspections and labeling meetings.
• Work on an Advisory Committee meeting, if applicable.
• From the secondary sign off to the final action.
This step by step process allowed the interviewees to think through the time they spent on specific tasks and to build a “bottom-up” estimate of their workload. We expect this to be a more comprehensive approach to estimating workload compared to asking for a total time. After we completed reviewing the process map with the interviewees we asked if there was any additional work performed on the 351(k) review that had not been discussed.
In many cases interviewees provided ERG with ranges for some estimates (e.g., 10-20 hours) for steps in the process. ERG dealt with the ranges in three ways:
• For ranges that were large in magnitude (e.g., 100-200 hours), ERG asked follow-up questions to discern whether the mid-point of the range was a reasonable point estimate or whether the upper or lower end of the range was more likely. This follow-on discussion worked to clarify a representative value for the time spent and to reduce the breadth of the range.
• For ranges that involved small values (e.g., 1-2 hours), ERG used the upper end-point of the range.
• For all other ranges, ERG used the mid-point value (rounded up to the nearest whole integer value).
Most ranges that were provided by interviewees fell into the third category; i.e., they were neither large in magnitude nor involved small values.
2.1.2 CDER Time Reporting Data
FDA provided ERG with CDER time reporting data for FY13 through FY15. CDER staff report time for two weeks each quarter. The time reporting system has CDER staff put their time into both “projects” and “tasks.” The set of tasks can be used to identify which hours were associated with biosimilar-related work. FDA provided ERG with a list of task codes that can be considered biosimilars work. The set of project codes can be used to divide labor hours into types of work such as IND/pre-IND, 351(k) BLA review, policy-related work, etc. Based on the project codes, ERG was able to categorize labor hours reported by CDER staff into the following categories:
• IND and pre-IND review activities (including meetings)
• Special protocol assessments (SPA)
• Original 351(k) BLA reviews
• Supplement review activities, including industry meetings
• Post-marketing annual reports, safety activities, and surveillance
• Enforcement
• Policy and Regulation
BsUFA Workload Volume and Cost: Interim Report
Approach and Data 8
• Science and Research
• Training
• Program Management and Administration
• Employee Leave
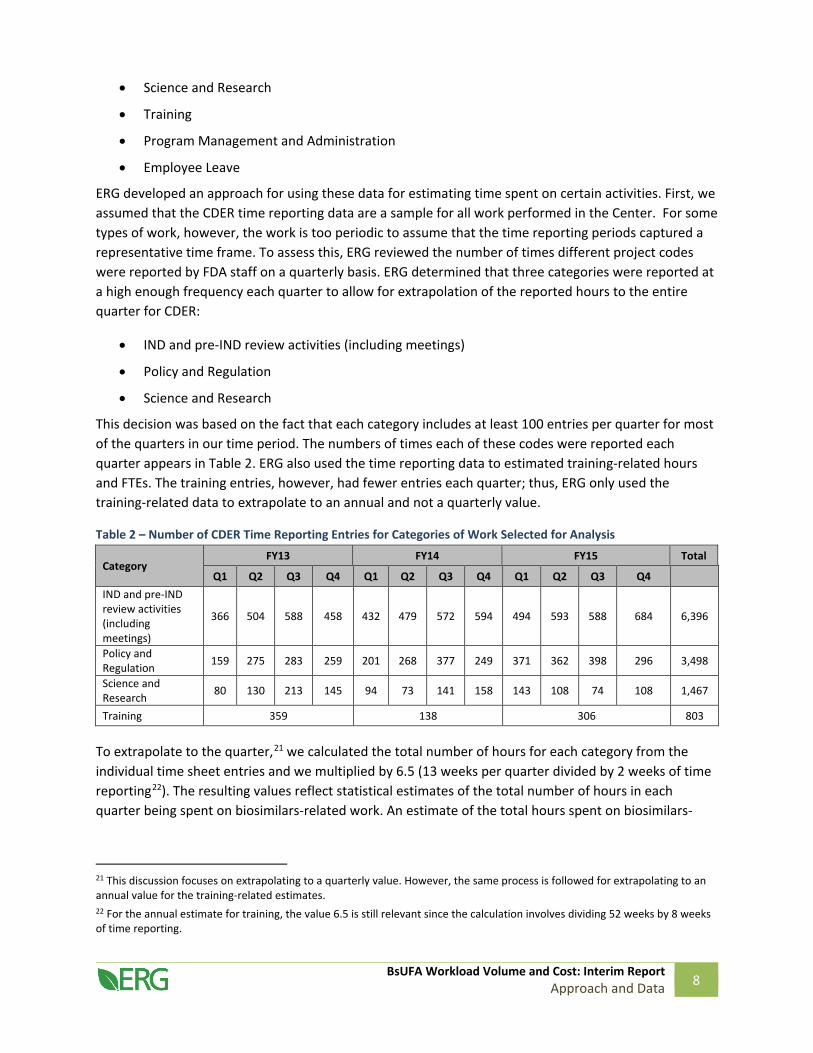
ERG developed an approach for using these data for estimating time spent on certain activities. First, we assumed that the CDER time reporting data are a sample for all work performed in the Center. For some types of work, however, the work is too periodic to assume that the time reporting periods captured a representative time frame. To assess this, ERG reviewed the number of times different project codes were reported by FDA staff on a quarterly basis. ERG determined that three categories were reported at a high enough frequency each quarter to allow for extrapolation of the reported hours to the entire quarter for CDER:
• IND and pre-IND review activities (including meetings)
• Policy and Regulation
• Science and Research
This decision was based on the fact that each category includes at least 100 entries per quarter for most of the quarters in our time period. The numbers of times each of these codes were reported each quarter appears in Table 2. ERG also used the time reporting data to estimated training-related hours and FTEs. The training entries, however, had fewer entries each quarter; thus, ERG only used the training-related data to extrapolate to an annual and not a quarterly value.
Table 2 – Number of CDER Time Reporting Entries for Categories of Work Selected for Analysis
Category FY13 FY14 FY15 Total
Q1 Q2 Q3 Q4 Q1 Q2 Q3 Q4 Q1 Q2 Q3 Q4 IND and pre-IND review activities (including meetings)
366 504 588 458 432 479 572 594 494 593 588 684 6,396
Policy and Regulation 159 275 283 259 201 268 377 249 371 362 398 296 3,498
Science and Research 80 130 213 145 94 73 141 158 143 108 74 108 1,467
Training 359 138 306 803
To extrapolate to the quarter,21 we calculated the total number of hours for each category from the individual time sheet entries and we multiplied by 6.5 (13 weeks per quarter divided by 2 weeks of time reporting22). The resulting values reflect statistical estimates of the total number of hours in each quarter being spent on biosimilars-related work. An estimate of the total hours spent on biosimilars-
21 This discussion focuses on extrapolating to a quarterly value. However, the same process is followed for extrapolating to an annual value for the training-related estimates. 22 For the annual estimate for training, the value 6.5 is still relevant since the calculation involves dividing 52 weeks by 8 weeks of time reporting.

BsUFA Workload Volume and Cost: Interim Report
Approach and Data 9
related work over the first three years of the program is calculated by summing over the estimates for each quarter.
Given that these are derived from a sample, we can also develop 95 percent confidence intervals around each quarterly total hour estimate and around the estimate for the three-year period. The upper and lower confidence limits were calculated by assuming the data reflect an exponential distribution.23 The functional form of the exponential distribution has one shape parameter, λ, which can be approximated using the inverse of the sample mean value. A suitable approximation for the confidence interval of λ when there are more than 15 to 20 subjects is24
𝜆𝜆𝑙𝑙𝑙𝑙𝑙𝑙𝑙𝑙𝑙𝑙 = �̂�𝜆 �1 −1.96√𝑛𝑛
�
𝜆𝜆𝑢𝑢𝑢𝑢𝑢𝑢𝑙𝑙𝑙𝑙 = �̂�𝜆 �1 +1.96√𝑛𝑛
�
where �̂�𝜆 is the sample estimate of λ estimated as the inverse of the sample mean and n is the number of sample units (time sheet entries). Once we calculate both the lower and upper bounds for λ, we invert the values (to approximate upper and lower bounds on the sample mean), multiply each by n (to approximate the total hours), and then multiply each by 6.5 to extrapolate to the quarter. For the three-year period, we follow the same process but use the total calculated for the three-year period and the total number of timesheet entries over the three-year period.
In summarizing our estimates in this report we focus on the values for the three-year period and not on the values for the individual quarters. For context, we provide the 95 percent confidence intervals in the text and details on the intervals in Appendix A.
2.1.3 Email Requests
ERG sent email requests to FDA staff under two circumstances: (1) to collect time estimates for two specific 351(k) applications and (2) to request activity-specific time estimates.
Instead of interviews, ERG used email requests to obtain time estimates spent on two 351(k) BLAs that were received in the summer of 2015. Email requests were selected to solicit work hours associated with these applications because both applications were still in early stages of the review process by the end of September 2015, and the time spent by FDA personnel on the associated activities was expected to be small relative to the time spent on the five other reviews we included in the report which were at more advanced stages of the review cycle. Similar to interviews, ERG obtained a list of FDA personnel involved with each application from the RPMs. ERG sent emails to each of the 79 individuals identified by the RPMs and grouped the email recipients by discipline so that reviewers and team leads could (where appropriate) prompt each other via email responses. Each group email asked for time estimates
23 An exponential distribution can be used to reflect the distribution of a non-negative variable where the probability density is a concave decreasing function. 24 Guerriero, V. (2012). "Power Law Distribution: Method of Multi-scale Inferential Statistics". Journal of Modern Mathematics Frontier (JMMF) 1: 21–28.

BsUFA Workload Volume and Cost: Interim Report
Approach and Data 10
for the set of review activities that had occurred to date for that application. ERG also sent a follow-up email to serve as a reminder to individuals who had not yet submitted their estimates.
ERG also sent email requests to FDA staff asking for time spent on certain biosimilars-related activities. ERG limited these requests to areas where only specific information was being asked for (e.g., time spent on a well-defined task/activity) and the question being asked could be answered more efficiently via email rather than in an interview setting. These requests covered:
• Developing a biosimilars continuing education course
• Developing and performing biosimilars focus group testing
• Developing and implementing a CDER Committee for Advanced Scientific Education (CASE) Seminar for biosimilars
2.1.4 Other Data Provided to ERG
In addition to the data sources discussed above, ERG was provided with a number of other data items for use in this project:
• The 2013, 2014, and 2015 FDA BsUFA financial reports and the associated process cost spreadsheets and the 2013, 2014, and 2015 BsUFA performance reports. These reports were used in multiple ways in this report, including as a source for FTEs and costs associated with CBER, FDA Office of the Commissioner, and ORA. ERG made formal requests to CDER’s Office of Surveillance and Epidemiology (OSE) for the number of hours spent by Division of Medication Error Prevention and Analysis (DMEPA) and Division of Risk Management (DRISK) staff on 351(k) BLAs.
• Estimates of the FTEs that can be allocated to CDER offices not included in our other estimates for each fiscal year, including Office of the Center Director (OCD), Office of Executive Programs (OEP), Office of Management (OM), Office of Communications (OCOMM), and Office of Strategic Programs (OSP).
• Operating costs and costs for FDA centrally managed accounts; these were added to the labor costs we estimated (see Section 2.2 below for discussion of calculation of labor costs) to develop a full cost of the program.
2.2 Estimating Labor Costs The data sources described above, for the most part, provided estimates of the labor hours associated with biosimilars work at FDA. To develop cost estimates associated with the labor time, ERG used an estimate of 1,600 productive labor hours (estimate provided by FDA) to define a full-time equivalent (FTE). ERG converted FTEs into cost per FTE for salary and benefits using data taken from the BsUFA financial reports; these data appear in Table 3.
For costs incurred by the FDA Office of the Commissioner, ERG used the percentages of total salary that the Office of the Commissioner represents to calculate values from the CDER and CBER totals. These percentages were 21.34 percent for FY13, 21.18 percent in FY14, and 19.16 percent of FY15. These percentages were then applied to the sum of all CDER and CBER labor costs to generate an estimate of

BsUFA Workload Volume and Cost: Interim Report
Approach and Data 11
the FDA Office of the Commissioner labor costs.25 ORA provided a number of FTEs for FY15 and a total labor cost for those FY15 FTEs.
Table 3 – Calculation of Cost Per FTEs for Salary and Benefits
FY and Center
Total Salary and Benefits Total FTEs
Salary and Benefit Cost Per FTE
($1,000s) FY13 CDER $529,388,910 3,370.6 $157.1 CBER $150,766,567 1,021.4 $147.6 FY14 CDER $588,671,430 3,684.4 $159.8 CBER $153,403,094 1,001.7 $153.1 FY15 CDER $664,620,877 3,889.6 $170.9 CBER $155,009,717 963.1 $161.0
Source: ERG calculation based on BsUFA financial reports for FY13-FY15.
ERG also had to allocate some labor hours for the 351(k) BLA review between fiscal years to account for reviews that spanned across fiscal years. ERG divided the 351(k) BLA review process into four stages: Receipt and Filing Review, Primary and Secondary Review (including mid-cycle meeting), Advisory Committee Meeting, and Finalizing the Review. For each 351(k) BLA, we used information supplied by FDA interviewees on the timing of the review steps to divide the hours between fiscal years.
2.3 Dealing with Overlapping Estimates There are a number of areas where our data collection activities led to collecting data on the same activity twice. For example, For the most part, overlaps occurred between time reporting data and other data sources; i.e., some of the hours estimates we collected from other sources may also be covered by the time reporting data. To avoid double-counting the hours in our estimates, ERG assessed each instance of potential overlap and made a decision based on our understanding of the data. We address these instances in the sections that follow.
25 A similar process was used to estimate FTEs.

BsUFA Workload Volume and Cost: Interim Report
Biosimilar Development Program Activities 12
3. BIOSIMILAR DEVELOPMENT PROGRAM ACTIVITIES
3.1 Approach and Data • During the fall of 2014, ERG interviewed staff working on biosimilar development program-
related activities. Data collected from those interviews were used to calculate the unit hours associated with working with sponsors who were in the biosimilar development program and for preparation for and participation in meetings.
• Volume numbers for the number of programs, meetings, and the number of written responses provided when meetings were denied were either provided by FDA directly for this report or were taken from FDA reports.
• ERG used the time reporting data to estimate total quarterly hours for biosimilar development program work. The method developed by ERG involves assuming the time reporting data (reported 2 weeks each quarter) are a sample of hours and then using the sample data to calculate a total for each quarter and then a total for the three-year period. ERG then calculated 95 percent confidence intervals around the estimated totals for each quarter and for the three-year period to provide context.
• The time reporting data in the bullet point above results in a competing estimate to the volume/interview-based estimates described in the first two bullets. The time reporting data should provide an estimate that encompasses the biosimialr development program review- and meeting-related work. Nevertheless, as discussed in the limitations section in Section 1, the time reporting data are still subject to some level of sampling error. Thus, in FY14 and FY15, the estimates from the volume/interview data exceeded the estimates from time reporting data. For each FY, ERG used the maximum of the two competing values as an estimate of the costs incurred during the FY.
3.2 Estimated Hours and FTEs
3.2.1 Estimates Derived from Unit Costs and Volume Numbers
Table 4 presents the estimated hours and FTEs associated with reviewing information provided by FDA staff working on biosimilar development program activities. Total hours for each fiscal year are estimated by multiplying the cumulatative number of participants in the program each year by the estimated number of hours to perform the work. Volume data were taken from the FY15 BsUFA Performance Report. The number of hours to perform these activities for sponsors in the program was derived from interviews ERG performed in the fall of 2014.26 ERG estimates that the biosimilar development program review work involved 45.5 FTEs over the first three fiscal years of the program.
26 The unit hour estimates are the same for each FY and reflect an average for performing this type of work. There may be some learning curve-related costs associated with work performed in FY13 and the work has grown more complex over the three fiscal years. ERG has not made an attempt to adjust our estimtes for these considerations.

BsUFA Workload Volume and Cost: Interim Report
Biosimilar Development Program Activities 13
Table 4 – Estimated Hours and FTEs Associated Biosimilar Development Program Activities Derived From Interview and Volume Data
FY
Number of Development
Programs Unit Hours [a] Total Hours FTEs 2013 33 527.75 17,415.75 10.88 2014 48 527.75 25,332.00 15.83 2015 57 527.75 30,081.75 18.80 Totals - - 72,829.50 45.52
[a] The unit hour estimates are the same for each FY and reflect an average for performing this type of work. There may be some learning curve-related costs associated with work performed in FY13. ERG has not made an attempt to capture any increased cost associated with work performed early in the program.
Table 5 provides estimates for the total hours and FTEs associated with participating in meetings, including the time to prepare for, attend, and perform any follow-up related to the meetings. Total hours are estimated by multiplying the number of meetings by the labor hours associated with the BIA meeting and BPD Type 1 to 4 meetings. The numbers of meetings were taken from the FY15 BsUFA Draft Performance Report and reflect the number of scheduled meetings in each fiscal year. Hours associated with each type of meeting were derived from interviews ERG conducted in the fall of 2014. ERG estimates that 30.4 FTEs were incurred by FDA to participate in meetings over the first three years of the program.
Over the first three fiscal years FDA has also denied or cancelled 22 meeting requests with sponsors, but provided written advice to sponsors in 16 of those requests. ERG assumed that providing that written advice would require the same number of labor hours as a BIA meeting request (i.e., approximately 600 hours). Table 6 summarizes these estimates by fiscal year. FDA incurred 6.0 FTEs to provide written responses to sponsors associated with denied or cancelled meeting requests.
Table 5 – Estimated Hours and FTEs Associated with Meetings
FY Meeting Type Number of Meetings
Unit Hours [a] Total Hours FTEs
2013
BIA 3 599.97 1,799.91 1.12 BPD Type 1 0 7.50 0.00 0.00 BPD Type 2 20 322.68 6,453.62 4.03 BPD Type 3 6 631.26 3,787.57 2.37 BPD Type 4 1 331.51 331.51 0.21
FY13 Totals 12,372.61 7.73
2014
BIA 9 599.97 5,399.72 3.37 BPD Type 1 1 7.50 7.50 < 0.01 BPD Type 2 25 322.68 8,067.02 5.04 BPD Type 3 9 631.26 5,681.36 3.55 BPD Type 4 3 331.51 994.53 0.62
FY14 Totals 20,150.12 12.59

BsUFA Workload Volume and Cost: Interim Report
Biosimilar Development Program Activities 14
FY Meeting Type Number of Meetings
Unit Hours [a] Total Hours FTEs
2015
BIA 2 599.97 1,199.94 0.75
BPD Type 1 3 7.50 22.49 0.01 BPD Type 2 [b] 41 322.68 13,229.92 8.27
BPD Type 3 1 631.26 631.26 0.39
BPD Type 4 3 331.51 994.53 0.62
FY15 Totals 16,078.14 10.05
Totals 48,600.87 30.38 [a] The unit hour estimates for each meeting type are the same for each FY and reflect an average for performing this type of work. [b] This includes one meeting that was classified as an “unknown” meeting type. ERG included it here since most meetings are Type 2 meetings.
Table 6 – Estimated Hours and FTEs Associated with Denied or Cancelled Meetings that Involved Written Advice
FY
Number of Denied or Cancelled Meetings with
Written Responses Provided
Unit Hours [a] Total Hours FTEs
2013 1 599.97 600.0 0.4 2014 8 599.97 4,799.7 3.0 2015 7 599.97 4,199.8 2.6 Total 16 - 9,599.5 6.0
[a] The unit hour estimates for each meeting type are the same for each FY and reflect an average for performing this type of work.
3.2.1 Estimates Derived from CDER Time Reporting Data
Table 7 presents estimates of hours and FTEs associated with biosimilar development program work derived from CDER’s time reporting data. The hour estimates in Table 7 reflect the hours reported in the time reporting data extrapolated to a whole quarter and the total in the table reflects the total number of hours and FTEs for the entire three-year period. The method used by ERG to develop 95 percent confidence intervals for these estimates is described in Section 2.1.2. The CDER time reporting data results in an estimate of 70.1 FTEs in the first three years of FDA’s biosimilars program implementation for biosimilar development program-related work. Table A-1 in the Appendix A provides the 95 percent confidence intervals for the data derived from the time reporting data. The three-year total of 70.1 FTEs has a 95 percent confidence interval of 66.7 FTEs to 73.9 FTEs.

BsUFA Workload Volume and Cost: Interim Report
Biosimilar Development Program Activities 15
Table 7 – Estimated Total Hours and FTEs Associated with Biosimilar Development Program Work Derived from Time Reporting Data
Quarter Estimated Total Hours FTEs 2013Q1 6,462.63 4.04
2013Q2 8,132.48 5.08
2013Q3 11,144.25 6.97
2013Q4 9,231.63 5.77
2014Q1 8,102.25 5.06
2014Q2 9,283.63 5.80
2014Q3 9,612.20 6.01
2014Q4 10,520.25 6.58
2015Q1 8,333.00 5.21
2015Q2 8,928.73 5.58 2015Q3 10,437.38 6.52 2015Q4 11,986.00 7.49 Totals 112,174.40 70.11
3.2.2 Summary
Table 8 provides a summary of the FTEs estimated in this section. As noted above, the volume/interview-based estimates (Table 4, Table 5, and Table 6) and the estimates from the time reporting data (Table 7) are competing estimates. ERG used the maximum of the two sets of estimates within each fiscal year as the estimate for the hours and FTEs for biosimilar development program-related work. ERG estimates that biosimilar development program work involved 84.8 FTEs over the first three years of the program.
Table 8 – Summary Estimates for FTEs for Biosimilar Development Program Activities
FY
FTEs for Biosimilar Development-Related Work
and Meetings (Including written advice for canceled
meetings) [a]
FTEs Estimated from Time Reporting Data [b]
FTE Estimate (maximum of two preceding columns) [c]
2013 18.99 21.86 21.86 2014 31.43 23.45 31.43 2015 31.47 24.80 31.47
Totals 81.89 70.11 84.76 [a] These esimates comes from Table 4, Table 5, and Table 6. [b] These estimate come from Table 7. [c] Calculated as the maximum two preceding columns for each fiscal year; the total is the sum of the column.

BsUFA Workload Volume and Cost: Interim Report
351(k) Biologic Licensing Application (BLA) Review 16
4. 351(K) BIOLOGIC LICENSING APPLICATION (BLA) REVIEW
4.1 Approach and Data • During fall 2014, ERG interviewed staff who perform BLA and NDA reviews. Given the limited
experience with 351(k) BLA reviews in the fall of 2014, however, ERG asked interviewees to extrapolate from similar work being performed under 351(a) reviews. ERG used the data from the fall interviews to (1) directly provide estimates of the time to review 351(k) BLAs for some steps in the process for individuals who had worked on the BLAs at that time, (2) fill in gaps27 from the interviews we conducted in the spring of 2015 (discussed below) and (3) provide a consistency check against the data we collected in spring 2015.
• ERG interviewed a total of 88 staff (including the RPMs) working on 5 of the seven 351(k) BLAs. Interviews were performed from March to September 2015. For each interview, ERG used a process map for the 351(k) BLA review that started with the receipt of the application to final action. For each step on the process map, ERG reviewed the labor time it took interviewees to perform each step.
• ERG also emailed 79 individuals involved in the review of two 351(k) BLAs where interviews were not conducted due to the application being in the early stages of the review process.28 Group emails (categorized by review discipline) were sent to individuals identified by the RPMs. Each email asked for time estimates for the set of review activities that had occurred to date for that application.
4.2 Estimates of Hours and FTEs Table 9 provides a summary of the estimated labor hours and FTEs associated with reviewing the seven 351(k) BLAs received before September 30, 2015. In total, the individuals with whom ERG spoke and collected email estimates from estimated that 25.89 FTEs were involved in in reviewing the seven 351(k) BLAs through September 30, 2015. As noted in the limitations section, one caveat on this estimate is that the interviews with FDA staff were conducted in March to September of 2015, which means that some interviewees were being asked to recall information on the time spent on tasks 10-12 months prior. Table 10 re-summarizes the estimates of hours and FTEs by fiscal year.
27 For example, one individual we interviewed was unable to provide an estimate of the time to work on one aspect the 351(k) BLA she was involved in. Instead, she indicated it took 1.5 times the effort of a “normal” review. We used the time for her discipline to review a 351(a) NDA (obtained in the fall interviews) and multiplied by 1.5. 28 Some of these 79 individuals provided estimates for both BLAs.

BsUFA Workload Volume and Cost: Interim Report
351(k) Biologic Licensing Application (BLA) Review 17
Table 9 – Summary of Estimated Labor Hours and FTEs from Interviews and Email Responses 351(k) BLA Stage Labor Hours FTEs Interviews Receipt and Filing Review 1,467.58 0.92 Primary and Secondary Review (including mid-cycle) 34,804.95 21.75 Advisory Committee Meeting 3,465.50 2.17 Finalizing Review 221.50 0.14 Totals from Interviews 39,959.53 24.97 Email Responses Receipt and Filing Review 1,452.25 0.91 Total from Email Responses 1,452.25 0.91 Interviews and Email Total Receipt and Filing Review 2,919.83 1.82 Primary and Secondary Review (including mid-cycle) 34,804.95 21.75 Advisory Committee Meeting 3,465.50 2.17 Finalizing Review 221.50 0.14 Totals 41,411.80 25.89 [a] The survey data reflect collection of only 52 percent of the surveys sent out.
Table 10 – Summary of 351(k) BLA Review Estimates by Fiscal Year
Fiscal Year Hours FTEs FY13 NA NA FY14 3,688.95 2.31
FY15 37,722.85 23.58
Totals 41,411.80 25.89
BsUFA Workload Volume and Cost: Interim Report Regular Internal Biosimilars-Related Meetings 18
5. REGULAR INTERNAL BIOSIMILARS-RELATED MEETINGS This section provides workload estimates of the labor hours and FTEs for FDA offices in CDER to hold regular internal biosimilar-related meetings. These meetings can involve a variety of topics and can include policy discussions as well as discussions that deal with specific applications or submissions. This section provides estimates for three regular meetings that relate to biosimilars within CDER:
• CDER’s TBBS holds the Biosimilar Review Committee (BRC) meetings on a frequent basis
• CDER’s Office of Clinical Pharmacology (OCP) holds weekly meetings
• CDER’s Office of Biotechnology Products (OBP) holds weekly meetings.
5.1 Approach and Data • ERG interviewed (via phone) staff from OCP, OBP, and TBBS to develop estimates of the time
FDA staff spend in regular meetings associated with biosimilars.
• Time spent in these meetings could potentially be covered under two separate areas of this report: (1) in the hours for biosimilar development program activities (Section 3) or in reviewing 351(k) BLAs (Section 4) since the meetings will often involve discussions related to specific applications and/or submissions or (2) in the policy-related hours under Section 6. We are including the estimates in this section as separate line items in our analysis for the following reasons: o Biosimilar development program activities or 351(k) BLA review. Although some
interviewees appeared to have included time for these meetings in the estimates provided during interviews, some may not have. Additionally, the magnitude of the estimates in this section seems to indicate that the interviewees did not adequately capture this time in the estimates provided to ERG.
o Policy-related work. ERG has assumed that attendance at and preparation for these meetings is not well captured in the time reporting data. There are a number of reasons for this. First, although attendance at these regular meetings may be captured in the time reporting data, preparation time may be missed since preparation time may fall outside of the two-week reporting periods, or vice versa. Second, we are not certain that staff would categorize their time as “policy and regulation” time in the CDER time reporting for these meetings; regular meetings are often categorized under the “Program Administration and Management” category in the time reporting data.
o Overall. While including these hours in the totals may, in certain instances, result in some double-counting with the time reporting estimates, we expect the amount of double counting in this case would be minimal. On the other hand, not including them in the total will very likely result in under-counting the hours spent on these regular meetings.
5.2 BRC Meetings ERG discussed the number and frequency of BRC meetings with TBBS. In total, there were 51 BRC meetings held between FY13 and September 30, 2015 (20 in FY13, 13 in FY14, and 18 in FY15). All meetings held before January of 2015 were scheduled for 1.5 hours, while those in January 2015 and

BsUFA Workload Volume and Cost: Interim Report Regular Internal Biosimilars-Related Meetings 19
after were 2 hours. Based on our discussion with TBBS, 39 BRC meetings in the time period for this report lasted 1.5 hours, with the remaining 12 lasting 2 hours.
There are approximately 45 members of the BRC and approximately 30 attend each meeting. Additionally, review team members from the disciplines also attend meetings to present and discuss information and proposals related to their review; this adds, on average, 12 people per meeting. Thus, ERG estimates that, on average, 42 people attend each BRC meeting.Combing these data results in a total of 3,549 hours for meeting attendance.
In addition to meeting time, staff prepare for the meeting ahead of time. ERG estimates the following time is spent on meeting preparation:
• TBBS spends approximately 40 hours preparing an agenda including questions for committee discussion.
• Each member of the BRC will spend on average 30 minutes reviewing the agenda and other associated tasks. With 30 BRC members per meeting, this is a total of 15 hours per meeting for BRC members.
• Review team members will prepare presentations and other materials. Based on our interviews in the fall of 2014, we estimate that approximately 4 people will spend 8 hours each for each BRC meeting from the review teams. This results in a total of 32 hours per BRC meeting for review team preparation.
The sum total of preparation time is 87 hours per BRC meeting. Applying this estimate to the number of BRC meetings results in a total of 4,524 hours of preparation time for BRC meetings between FY13 and FY15 (see Table 11).
Table 11 summarizes the calculation of labor hours for the BRC meetings. The combined estimate for labor hours for meeting attendance and preparation time is 8,073 hours, or a total of five FTEs.
Table 11 – Data for Estimating BRC Meeting Workload
Fiscal Year/ Time
Period
Number of Meetings
Meeting Attendance Meeting Preparation
Totals Attendees
Time per Meeting
(hrs)
Total Time (hrs)
Time per Meeting
(hrs)
Total Time (hrs)
FY13 20 42 1.5 1,260 87 1,740 3,000 FY14 13 42 1.5 819 87 1,131 1,950 FY15 (Oct-Dec) 6 42 1.5 378 87 522 900
FY15 (Jan-Sept) 13 42 2 1,092 87 1,131 2,223
Totals 52 - - 3,549 - 4,524 8,073

BsUFA Workload Volume and Cost: Interim Report Regular Internal Biosimilars-Related Meetings 20
5.3 OCP Regular Meetings Table 12 shows the workload associated with attending and preparing for OCP regular meetings. OCP has been holding weekly meetings since 2011 to discuss biosimilars-related issues.29 OCP also estimates that about 8 to 10 of these are canceled each year for various reasons, resulting in an estimated 40 to 42 meetings each year. ERG used 42 meetings per year in our estimates. The meetings last 1.5 hours on average and have 8 to 10 attendees (ERG used 10 attendees in our estimates). Among the meetings attendees, approximately 3 will need to do preparation ahead of time. OCP assumed that one person would spend 1 to 2 days (ERG estimate: 12 hours on average) and the other 2 would spend half that time (ERG estimate: 6 hours each). These estimates of time spent result in a total of 630 meeting hours (42 meetings × 10 attendees per meeting × 1.5 hours per meeting) and a total of 1,008 preparation hours (42 meetings × [1 person × 12 hours preparation time + 2 people × 6 hours preparation time]) annually. Thus, each year OCP spends 1,638 hours in biosimilar meetings, or 1.02 FTEs. Over the first three fiscal years of the program, ERG estimates OCP has spent 4,914 hours (3.06 FTEs) on the regular OCP biosimilar meetings.
Table 12 – OCP Meeting Attendance and Preparation Time
Annual Number
of Meetings
Meeting Attendance Meeting Preparation Annual Totals Totals Over Three Fiscal Years
Number of
Attendees
Time per Meeting
(hrs)
Total Time (hrs)
People Needing
12 hrs
People Needing
6 hrs
Total Time (hrs)
Meeting Time
(hrs) [a] FTEs
Meeting Time
(hrs) [a] FTEs
42 10 2 630 1 2 1,008 1,638 1.02 4,914 3.06 [a] Total meeting time includes time for meeting attendance and preparation
5.4 OBP Regular Meetings Table 13 shows the workload associated with attending and preparing for OBP regular meetings. OBP has been holding regular meetings at least once per week since 2010 and few of these are canceled each year. OBP indicated that they hold at least 42 meetings each year (ERG estimate: 46). The meetings run for one hour. The meetings involves a core group of 13 people and would also include at least 2 more people each meeting to present on the current issues/submissions they are dealing with. Thus, at a minimum 15 people attend each meeting (ERG estimate: 16 people). Of those involved, 3-5 may need to prepare materials ahead of time. OBP estimated that a total of 7 hours would be spent on preparation for each meeting from the staff presenting. Thus, ERG estimates that OBP staff spend 736 hours in meetings (46 meetings × 16 people per meeting × 1 hour per meeting) and 322 hours in preparing for meetings (46 meetings × 7 hours per meeting for staff to prepare) each year. This is a total 1,058 labor hours each year for regular meetings, or 0.66 FTEs annually. Over the first three fiscal years of the program, ERG estimates OBP has spent 3,174 hours (approximately two FTEs) on regular biosimilar meetings.
29 ERG has only included hours from FY13-FY15 in our estimates.
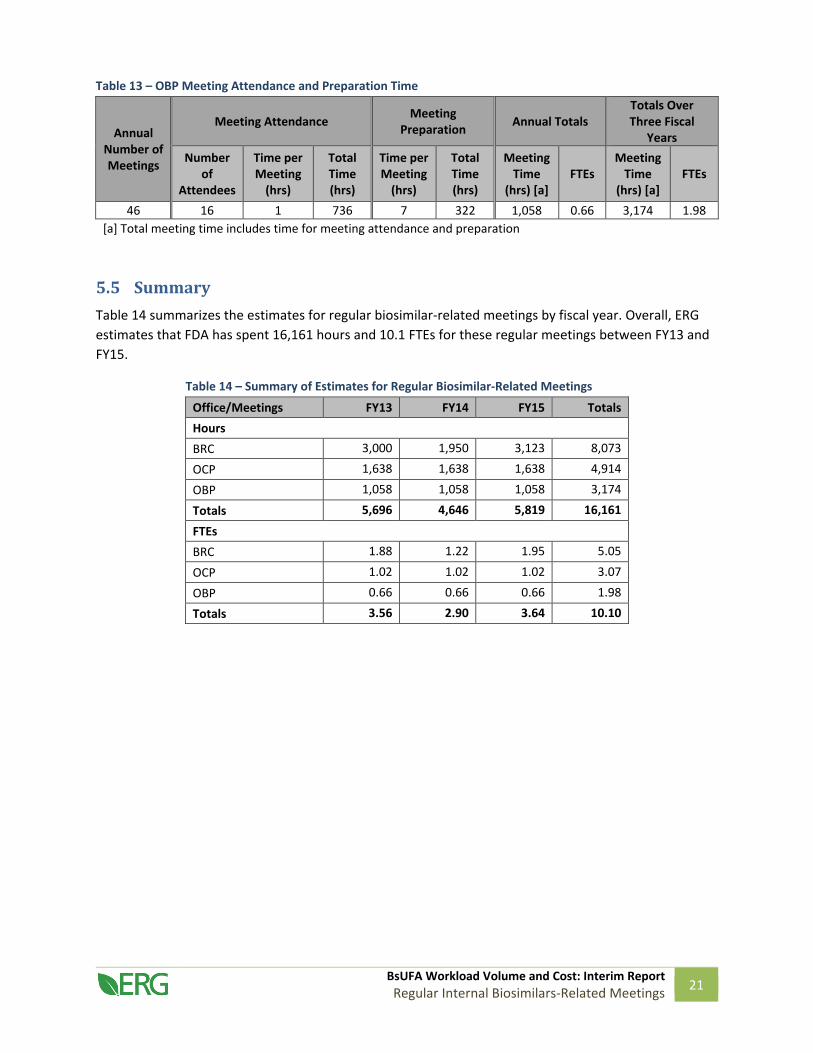
BsUFA Workload Volume and Cost: Interim Report Regular Internal Biosimilars-Related Meetings 21
Table 13 – OBP Meeting Attendance and Preparation Time
Annual Number of Meetings
Meeting Attendance Meeting Preparation Annual Totals
Totals Over Three Fiscal
Years Number
of Attendees
Time per Meeting
(hrs)
Total Time (hrs)
Time per Meeting
(hrs)
Total Time (hrs)
Meeting Time
(hrs) [a] FTEs
Meeting Time
(hrs) [a] FTEs
46 16 1 736 7 322 1,058 0.66 3,174 1.98 [a] Total meeting time includes time for meeting attendance and preparation
5.5 Summary Table 14 summarizes the estimates for regular biosimilar-related meetings by fiscal year. Overall, ERG estimates that FDA has spent 16,161 hours and 10.1 FTEs for these regular meetings between FY13 and FY15.
Table 14 – Summary of Estimates for Regular Biosimilar-Related Meetings
Office/Meetings FY13 FY14 FY15 Totals Hours BRC 3,000 1,950 3,123 8,073 OCP 1,638 1,638 1,638 4,914
OBP 1,058 1,058 1,058 3,174
Totals 5,696 4,646 5,819 16,161 FTEs BRC 1.88 1.22 1.95 5.05 OCP 1.02 1.02 1.02 3.07 OBP 0.66 0.66 0.66 1.98 Totals 3.56 2.90 3.64 10.10

BsUFA Workload Volume and Cost: Interim Report
Biosimilars-Related Policy Work 22
6. BIOSIMILARS-RELATED POLICY WORK
6.1 Approach and Data ERG used the time reporting data to estimate total quarterly hours for biosimilars policy-related work. The method developed by ERG involves assuming the time reporting data (reported 2 weeks each quarter) are a sample of hours, using the sample data to calculate a total for each quarter, and then calculating a total for the three-year period. ERG then calculated 95 percent confidence intervals around the estimated totals for each quarter and for the three-year period to provide context. This approach generated an estimate of the total hours and cost associated with policy-related work at FDA from FY13 to FY15.30
6.2 Estimates of Hour and FTEs Table 15 provides estimates for policy-related work derived from the CDER time reporting data. These estimates indicate that CDER has spent 30.3 FTEs on biosimilar policy-related work over the first three years of the program. Table A-2 in Appendix A provides the estimates and the associated confidence intervals for policy-related work derived from the time reporting data. The mean number of FTEs (30.32) has a 95 percent confidence interval that ranges from 28.41 to 32.51. Table 16 summarizes ERG’s estimates for policy-related work by fiscal year.
Table 15 – Estimated Total Hours and FTEs Associated with Policy-Related Work Derived from Time Reporting Data
Quarter Estimated Total
Hours FTEs 2013Q1 2,665.00 1.67
2013Q2 4,134.00 2.58
2013Q3 3,861.00 2.41
2013Q4 3,670.20 2.29
2014Q1 3,009.50 1.88
2014Q2 3,188.30 1.99
2014Q3 4,365.10 2.73
2014Q4 2,910.40 1.82
2015Q1 4,819.80 3.01
2015Q2 5,282.90 3.30 2015Q3 5,936.10 3.71 2015Q4 4,667.00 2.92 Totals 48,509.18 30.32
30 ERG also interviewed the Office of Medical Policy (OMP) in CDER to estimate the time spent on Guidance documents and included those estimates in the Interim Results report. However, we determined the OMP estimates should be covered by the CDER time reporting estimates. We do not include the OMP estimates in this report for that reason.

BsUFA Workload Volume and Cost: Interim Report
Biosimilars-Related Policy Work 23
Table 16 – Summary of Policy-Related Work Estimates by Fiscal Year
Fiscl Year Hours FTEs FY13 14,330.23 8.96 FY14 13,473.20 8.42 FY15 20,705.75 12.94 Totals 48,509.18 30.32

BsUFA Workload Volume and Cost: Interim Report
Science and Research 24
7. SCIENCE AND RESEARCH
7.1 Approach and Data • ERG used the time reporting data to estimate total quarterly hours for science and research
work. The method developed by ERG involves assuming the time reporting data (reported 2 weeks each quarter) are a sample of hours and then using the sample data to calculate a total for each quarter and then a total for the three-year period. ERG then calculated 95 percent confidence intervals around the estimated totals for each quarter and for the three-year period to provide context. This approach generated an estimate of the total hours and cost associated with science and research work at FDA from FY13 to FY15.
• ERG obtained estimates from the CDER Office of Biotechnology Products (OBP) to determine the number of hours that FDA has spent on lab-related research. These estimates provide a check on the estimates derived from the time reporting data.
7.2 Estimates of Hour and FTEs Table 17 provides estimates for science and research work derived from the CDER time reporting data. These estimates indicate that CDER has spent 23.8 FTEs on biosimilar science and research-related work. Table A-3 in Appendix A provides the estimates and the associated confidence intervals for science and research work derived from the time reporting data. The mean number of FTEs (23.78) has a 95 percent confidence interval that ranges from 21.56 to 26.61.
Table 17 – Estimated Total Hours and FTEs Associated with Science and Research Work Derived from Time Reporting Data
Quarter Estimated Total Hours FTEs
2013Q1 1,748.50 1.09 2013Q2 3,885.70 2.43 2013Q3 5,736.30 3.59 2013Q4 3,705.00 2.32 2014Q1 2,590.30 1.62 2014Q2 1,850.90 1.16 2014Q3 3,446.60 2.15 2014Q4 4,020.30 2.51 2015Q1 3,872.40 2.42 2015Q2 2,736.50 1.71 2015Q3 1,774.50 1.11 2015Q4 2,749.50 1.72 Totals 38,051.33 23.82
OBP provided an alternative set of estimates for lab-related work at FDA on biosimilars. These estimates are summarized in Table 18. OBP developed the labor estimates by working back from its FY15

BsUFA Workload Volume and Cost: Interim Report
Science and Research 25
allocation. First, the labs at CDER had 45 FTEs in FY15 and OBP assumed 25 percent of that would be allocated to biosimilars work (11.25 FTEs). OBP then assumed that FY14 would be two-thirds of the total FY15 biosimilar allocation (i.e., two-thirds of 11.25 FTEs) and FY13 would be one-tenth of the total FY15 biosimilar allocation (one-tenth of 11.25 FTEs). This results in an estimated 19.88 FTEs over the first three fiscal years of biosimilars work. OBP also added in costs of supplies and contracts of $2.7 million.
Table 18 – FTEs and Costs for Biosimilar Labs Work Derived from OBP-Supplied Data
Fiscal Year FTEs as a
Percentage of FY15 FTEs
FTEs Supplies and
Contracts ($1,000s)
FY13 10% 1.13 [a] $150 FY14 67% 7.50 [a] $1,000 FY15 - 11.25 [b] $1,500 Totals - 19.88 $2,650
[a] Calculated as 45 total FTEs for FY15 multiplied by 25 percent (biosimilar allocation in FY15) and then multiplied by the percentage in the preceding column. [b] Calculated as 45 FTEs total in the labs, multiplied by 25 percent allocation to biosimilar
The lab work is expected to represent a subset of the science and research hours. The FTEs for FY14 (7.44) and FY15 (6.96) estimated from the time reporting data, however, are fewer than the ones estimated from OBP’s calculation (7.50 and 11.25, respectively). We use the time reporting data as our estimate for science and research work, however. Table 19 summarizes the estimates for biosimilars science and research work. ERG estimates that biosimilars science and research work at FDA between FY13 and FY15 has involved 23.8 FTEs and $2.7 million in non-labor cost.
Table 19 – Summary Estimates by Fiscal Year for Science and Research Work
Fiscal Year FTEs Non-Labor Cost ($1,000s) FY13 9.42 $150 FY14 7.44 $1,000 FY15 6.96 $1,500
Totals 23.82 $2,650

BsUFA Workload Volume and Cost: Interim Report
Training, Continuing Education Course, Focus Groups, and CASE Seminar 26
8. TRAINING, CONTINUING EDUCATION COURSE, FOCUS GROUPS, AND CASE SEMINAR
This section summarizes estimates of hours and FTEs for a set of activities that did not fit well into the other sections of this report. Included in this section are:
• Time spent by CDER staff in training-related activities.
• Time spent by OMP and TBBS staff on developing and implementing a biosimilar continuing education course.
• Time spent by OMP and TBBS staff on developing and implementing biosimilar-related focus group testing.
• Time spent by CDER staff to develop a CDER CASE seminar on biosimilars.31
8.1 Approach and Data • The training-related hours were estimated using the CDER time reporing data. The method
developed by ERG involves assuming the time reporting data (reported 2 weeks each quarter) are a sample of hours and then using the sample data to calculate a total for each fiscal year and then a total for the three-year period.32 ERG then calculated 95 percent confidence intervals around the estimated totals for each fiscal year and for the three-year period to provide context. This approach generated an estimate of the total hours and cost associated with training at FDA from FY13 to FY15.
• FDA performed an analysis to calculate mark-up values that could be used to account for the fact most training that is relevant for biosimilars-related work will not be tagged as biosimilar-related in the time reporting data. Specifically, FDA conducts general training sessions that are relevant and some FDA staff may not allocate the training to a biosimilar-related code in the time reporting data. FDA’s analysis indicated that appropriate mark-ups for biosimilar training hours are 3.63 in FY13, 2.70 in FY14, and 2.65 in FY15. ERG applied these mark-ups to the number of hours estimates from the time reporting data.
• Data for the continuing education course, focus groups, and CDER CASE seminar were collected through a combination of interviews and email requests.
31 The CDER CASE seminar occurred after then end of FY15 on October 7, 2015, but most of the preparation time for the seminar occurred in FY15. 32 As noted in Section 2.1.2, the approach for using the time reporting data differs for training compared to other uses in this report. For training, we extrapolate to the fiscal year rather than to quarterly values.
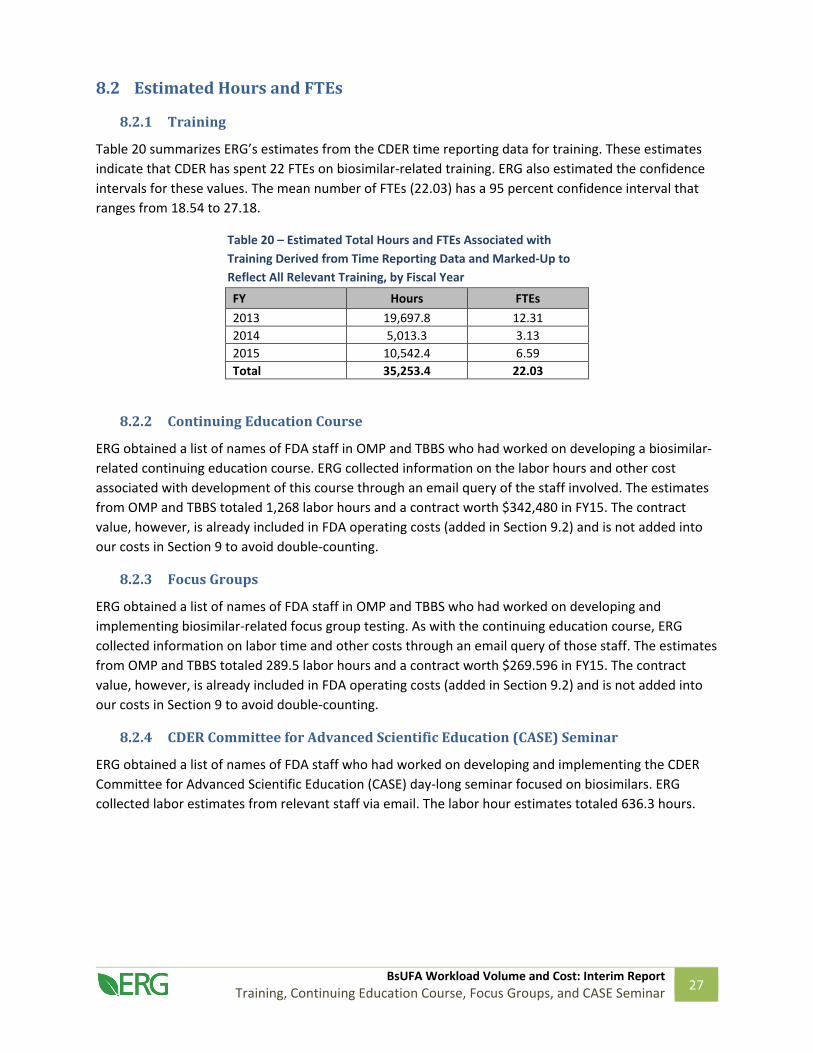
BsUFA Workload Volume and Cost: Interim Report
Training, Continuing Education Course, Focus Groups, and CASE Seminar 27
8.2 Estimated Hours and FTEs
8.2.1 Training
Table 20 summarizes ERG’s estimates from the CDER time reporting data for training. These estimates indicate that CDER has spent 22 FTEs on biosimilar-related training. ERG also estimated the confidence intervals for these values. The mean number of FTEs (22.03) has a 95 percent confidence interval that ranges from 18.54 to 27.18.
Table 20 – Estimated Total Hours and FTEs Associated with Training Derived from Time Reporting Data and Marked-Up to Reflect All Relevant Training, by Fiscal Year
FY Hours FTEs 2013 19,697.8 12.31 2014 5,013.3 3.13 2015 10,542.4 6.59 Total 35,253.4 22.03
8.2.2 Continuing Education Course
ERG obtained a list of names of FDA staff in OMP and TBBS who had worked on developing a biosimilar-related continuing education course. ERG collected information on the labor hours and other cost associated with development of this course through an email query of the staff involved. The estimates from OMP and TBBS totaled 1,268 labor hours and a contract worth $342,480 in FY15. The contract value, however, is already included in FDA operating costs (added in Section 9.2) and is not added into our costs in Section 9 to avoid double-counting.
8.2.3 Focus Groups
ERG obtained a list of names of FDA staff in OMP and TBBS who had worked on developing and implementing biosimilar-related focus group testing. As with the continuing education course, ERG collected information on labor time and other costs through an email query of those staff. The estimates from OMP and TBBS totaled 289.5 labor hours and a contract worth $269.596 in FY15. The contract value, however, is already included in FDA operating costs (added in Section 9.2) and is not added into our costs in Section 9 to avoid double-counting.
8.2.4 CDER Committee for Advanced Scientific Education (CASE) Seminar
ERG obtained a list of names of FDA staff who had worked on developing and implementing the CDER Committee for Advanced Scientific Education (CASE) day-long seminar focused on biosimilars. ERG collected labor estimates from relevant staff via email. The labor hour estimates totaled 636.3 hours.

BsUFA Workload Volume and Cost: Interim Report
Training, Continuing Education Course, Focus Groups, and CASE Seminar 28
8.3 Summary Table 21 provides a summary of the labor-related estimates for work we included in this section.
Table 21 – Summary of Hours, FTEs, and Non-Labor Costs for Training, the Continuiing Education Course, Focus Groups, and the CDER CASE Seminar, by Fiscal Year
Category FY13 FY14 FY15 Total Labor Hours Training 19,697.8 5,013.3 10,542.4 35,253.4 Continuing Education Course - - 1,268.0 1,268.0 Focus Groups - - 289.5 289.5 CDER CASE - - 636.3 636.3 Totals - - 12,736.1 37,447.2
FTEs Training 12.31 3.13 6.59 22.03
Continuing Education Course - - 0.79 0.79
Focus Groups - - 0.18 0.18
CDER CASE - - 0.40 0.40
Totals - - 7.96 23.40
Contract Costs ($1,000s) Continuing Education Course [a] - - $171.2 $171.2 Focus Groups [a] - - $134.8 $134.8 Totals - - $306.0 $306.0
[a] Not included in our totals since ERG was provided with an estimate of operating costs for CDER.

BsUFA Workload Volume and Cost: Interim Report
Summary: Biosimilar FTEs, Costs, and Comparison to FDA Estimates 29
9. SUMMARY: BIOSIMILAR FTES, COSTS, AND COMPARISON TO FDA ESTIMATES
This section summarizes our FTE estimates, estimates total costs, and compares our estimates of the estimates developed by FDA in its BsUFA financial reports. The section begins by summarizing the estimated FTEs from the previous sections of the report. Next, we add in FTE estimates provided by FDA for CDER offices not covered in our other estimates, CBER, ORA, and the FDA Office of the Commissioner. The total FTEs are then translated into labor costs (salary and benefits). We then add in operating costs and costs allocated to the biosimilars program from FDA’s centrally-managed accounts. Finally, we compare our FTE and cost estimates with the costs reported in FDA’s financial reports.
9.1 Estimated Total FTEs for Biosimilars Work Table 22 summarizes the number of FTEs that ERG estimates through our data collection efforts; these are the estimates detailed in Sections 3 through 8 above. FDA provided ERG with FTE estimates for CDER offices not included in ERG’s estimates; these are detailed in Table 23.
Table 22 – Estimated CDER FTEs for Biosimilars Program Work
Category FY13 FY14 FY15 Totals
FTEs Estimated by ERG for Biosimilars-Related Work Biosimilar Development Program Activities
21.86 31.43 31.47 84.76
351(k) BLA Review 0.00 2.31 23.58 25.89
Regular Biosimilars Meetings 3.56 2.90 3.64 10.10
Policy 8.96 8.42 12.94 30.32
Science and Research 9.42 7.44 6.96 23.82
Training 12.31 3.13 6.59 22.03 Continuing Education Course, Focus Groups, and CDER CASE
0.00 0.00 1.37 1.37
Total CDER FTEs 56.11 55.63 86.55 198.29 [a] Outreach combines the miscellaneous workload categories of continuing education course and focus groups.
Table 23 – FTEs for CDER Offices Not Covered by ERG Estimates
CDER Office FY13 FY14 FY15 Office of the Center Director (OCD) 1.49 1.44 2.11 Office of Executive Programs (OEP) 0.13 1.4 4.17 Office of Management (OM) 3.18 2.84 3.72 Office of Communications (OCOMM) 1.76 1.5 1.9 Office of Strategic Programs (OSP) 4.39 3.84 2.99 Total CDER FTE for Office not covered by ERG estimates 10.95 11.02 14.89
Finally, FDA also provided ERG with the number of biosimilars-related FTEs for CBER and ORA for the three fiscal years; these estimates are provided in Table 24. FDA Office of the Commissioner estimates

BsUFA Workload Volume and Cost: Interim Report
Summary: Biosimilar FTEs, Costs, and Comparison to FDA Estimates 30
for FY13 - FY15 were derived by assuming FDA Office of the Commissioner biosimilar FTEs represented a percentage of the total FTEs for CDER, ORA, and CBER in each year.33 For FY13 we used 21.34 percent, for FY14 the percentage was 21.18 percent, and for FY15 we used 19.16 percent.34
Table 24 – Summary of Non-CDER FTEs Office/Center FY13 FY14 FY15 CBER 4.00 1.00 0.00 FDA Office of the Commissioner
15.16 14.33 20.39
ORA 0.00 0.00 5.00 Total Non-CDER FTEs 19.16 15.33 25.39
9.2 Estimated Costs Table 25 summarizes ERG’s estimates for the total program costs. We begin with the FTEs (Section 9.1) and then calculate labor costs based on the method described in Section 2.2 using the cost of salary and benefits per FTE found in Table 3. ERG then added in operating cost values and the amounts allocated to biosimilars work from FDA’s centrally managed accounts made available to ERG by FDA from BsUFA financial reporting. ERG estimates that FDA spent $23.6 million in FY13, $21.4 million in FY14, and $28.7 million in FY15.
33 The total number of CDER, ORA, and CBER FTEs in each fiscal year is calculated by summing the total values for each fiscal year from Table 20 and Table 21 and then adding in the CBER and ORA values from Table 22. 34 These percentages reflect the percentage of total salary represented by FDA Office of the Commissioner staff and were taken from the FDA biosimilars process cost worksheets for each fiscal year.

BsUFA Workload Volume and Cost: Interim Report
Summary: Biosimilar FTEs, Costs, and Comparison to FDA Estimates 31
Table 25 – Summary of ERG Estimates: FTEs, Labor Costs, and Indirect Costs, by Fiscal Year Category FY13 FY14 FY15 Total
Total Biosimilars FTEs 86.22 81.98 126.83 295.03
Labor Costs (salary and benefits) ($1,000s)
$13,496.7 $13,098.0 $21,397.6 $47,992.3
Operating Costs ($1,000s) $7,663.9 $6,216.7 $2,845.7 $16,726.3 Centrally Managed Accounts Costs ($1,000s)
FDA Central $1,861.5 $1,560.7 $4,513.9 $7,936.1
GSA Rent $964.3 $867.3 $1,307.0 $3,138.6
Other Rent Related $403.6 $628.8 $732.9 $1,765.3
White Oak Relocation $697.5 $456.3 $484.9 $1,638.7
HR $166.4 $116.7 $232.8 $515.9
Shared Services $699.0 $544.1 $249.4 $1,492.5
ORA Non-Labor Costs $0.0 $0.0 $512.5 $512.5 Total Costs ($1,000s) $25,952.9 $23,488.6 $32,276.7 $81,718.2
9.3 Comparison to FDA Financial Report Values Table 26 compares ERG’s total estimate to the values reported by FDA in its annual BsUFA financial reporting.35 ERG’s total cost estimates represent 83 to 105 percent of the values that are reported by FDA in its BsUFA financial reporting. ERG’s FTE estimates are between 88 and 105 percent of the FDA reported FTEs. The FDA estimate is based on the total process costs developed for the annual financial reports while ERG’s estimates are governed by the limitations listed above. ERG’s understanding is that the FDA estimate of FTEs in its financial report is calculated by multiplying the number of total FTEs for each CDER office by a percentage reflecting biosimilars work for that office. ERG’s estimates, on the other hand, are built from projections based on the time reporting data and interviews with FDA staff on time spent performing biosimilars work. As noted, there are some limitations related to ERG’s estimates. First, ERG’s estimates rely on interviews and interviewees may not fully remember all work performed. Second, FDA’s time reporting data is based on only a two week sample each quarter and is thus subject to sampling error. Additionally, FDA expects that some staff may have reported time as being PDUFA-related rather than being related to biosimilars program work.
35 http://www.fda.gov/AboutFDA/ReportsManualsForms/Reports/UserFeeReports/FinancialReports/BsUFA/default.htm.

BsUFA Workload Volume and Cost: Interim Report
Summary: Biosimilar FTEs, Costs, and Comparison to FDA Estimates 32
Table 26 – Comparison of ERG Estimates to FDA BsUFA Financial Reporting
Category FTEs Costs
FY13 FY14 FY15 FY13 FY14 FY15 ERG Estimate Totals 86 82 127 $25,952.9 $23,488.6 $32,276.7 FDA Financial Reporting Totals 98 78 153 $28,040.5 $23,391.6 $34,817.2 ERG Value Relative to FDA Value 88% 105% 83% 93% 100% 93%

BsUFA Workload Volume and Cost: Interim Report
Appendix B A-1
Appendix A: 95 PERCENT CONFIDENCE INTERVALS FOR TIME REPORTING DATA ESTIMATES

BsUFA Workload Volume and Cost: Interim Report
Appendix B A-2
Table A-1 - Estimated Total Hours, FTEs, and Cost Associated with Biosimilar Development Program Work Derived from Time Reporting Data, Including 95 Percent Confidence Intervals
Quarter
Estimated Total Hours FTEs Cost 95 Percent CI Lower Bound Mean
95 Percent CI Upper Bound
95 Percent CI Lower Bound Mean
95 Percent CI Upper Bound
95 Percent CI Lower Bound Mean
95 Percent CI Upper Bound
2013Q1 5,361.11 6,462.63 8,133.83 3.35 4.04 5.08 $921.4 $1,110.8 $1,398.0
2013Q2 6,943.44 8,132.48 9,812.89 4.34 5.08 6.13 $1,193.4 $1,397.8 $1,686.6
2013Q3 9,525.38 11,144.25 13,426.06 5.95 6.97 8.39 $1,637.2 $1,915.4 $2,307.6
2013Q4 7,854.65 9,231.63 11,194.02 4.91 5.77 7.00 $1,350.0 $1,586.7 $1,924.0
2014Q1 6,826.52 8,102.25 9,964.38 4.27 5.06 6.23 $1,173.3 $1,392.6 $1,712.6
2014Q2 7,854.29 9,283.63 11,348.92 4.91 5.80 7.09 $1,350.0 $1,595.6 $1,950.6
2014Q3 8,211.37 9,612.20 11,589.29 5.13 6.01 7.24 $1,411.3 $1,652.1 $1,991.9
2014Q4 9,001.75 10,520.25 12,655.03 5.63 6.58 7.91 $1,547.2 $1,808.2 $2,175.1
2015Q1 7,010.76 8,333.00 10,269.92 4.38 5.21 6.42 $1,248.8 $1,484.3 $1,829.3
2015Q2 7,619.00 8,928.73 10,782.23 4.76 5.58 6.74 $1,357.1 $1,590.4 $1,920.6
2015Q3 8,926.04 10,437.38 12,564.83 5.58 6.52 7.85 $1,590.0 $1,859.2 $2,238.1
2015Q4 10,322.87 11,986.00 14,287.95 6.45 7.49 8.93 $1,838.8 $2,135.0 $2,545.0
Totals 106,759.01 112,174.40 118,168.57 66.72 70.11 73.86 $13,189.7 $15,533.8 $18,896.3

BsUFA Workload Volume and Cost: Interim Report
Appendix B A-3
Table A-2 - Estimated Total Hours, FTEs, and Cost Associated with Biosimilars Policy-Related Work Derived from Time Reporting Data, Including 95 Percent Confidence Intervals
Quarter
Estimated Total Hours FTEs Cost 95 Percent CI Lower Bound Mean
95 Percent CI Upper Bound
95 Percent CI Lower Bound Mean
95 Percent CI Upper Bound
95 Percent CI Lower Bound Mean
95 Percent CI Upper Bound
2013Q1 2,077.32 2,665.00 3,716.37 1.30 1.67 2.32 $357.0 $458.0 $638.8
2013Q2 3,349.36 4,134.00 5,398.73 2.09 2.58 3.37 $575.7 $710.5 $927.9
2013Q3 3,115.09 3,861.00 5,076.60 1.95 2.41 3.17 $535.4 $663.6 $872.5
2013Q4 2,929.07 3,670.23 4,913.52 1.83 2.29 3.07 $503.4 $630.8 $844.5
2014Q1 2,366.33 3,009.50 4,132.81 1.48 1.88 2.58 $406.7 $517.3 $710.3
2014Q2 2,572.31 3,188.25 4,192.04 1.61 1.99 2.62 $442.1 $548.0 $720.5
2014Q3 3,646.72 4,365.08 5,435.87 2.28 2.73 3.40 $626.8 $750.2 $934.3
2014Q4 2,337.65 2,910.38 3,854.80 1.46 1.82 2.41 $401.8 $500.2 $662.5
2015Q1 3,970.62 4,819.75 6,130.86 2.48 3.01 3.83 $707.3 $858.5 $1,092.1
2015Q2 4,328.39 5,282.88 6,777.41 2.71 3.30 4.24 $771.0 $941.0 $1,207.2
2015Q3 4,895.40 5,936.13 7,538.82 3.06 3.71 4.71 $872.0 $1,057.4 $1,342.9
2015Q4 3,791.26 4,667.00 6,068.83 2.37 2.92 3.79 $675.3 $831.3 $1,081.0
Totals 45,448.39 48,509.18 52,012.00 28.41 30.32 32.51 $7,811.4 $8,337.5 $8,939.6
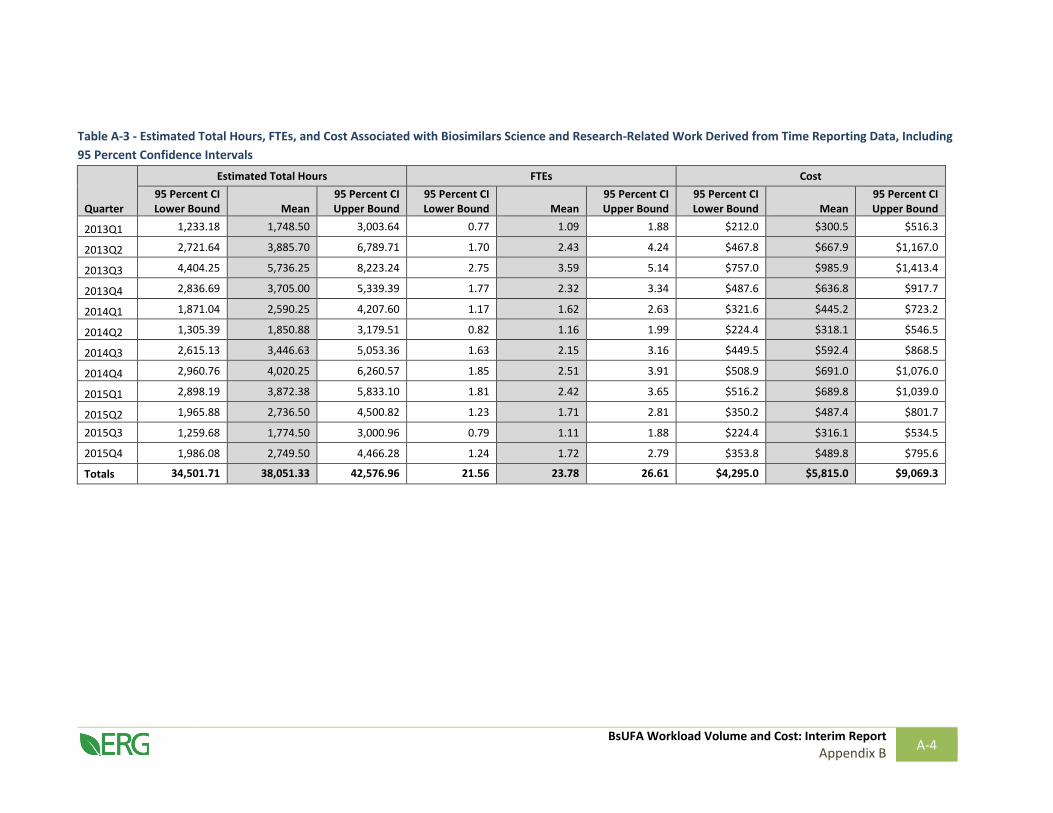
BsUFA Workload Volume and Cost: Interim Report
Appendix B A-4
Table A-3 - Estimated Total Hours, FTEs, and Cost Associated with Biosimilars Science and Research-Related Work Derived from Time Reporting Data, Including 95 Percent Confidence Intervals
Quarter
Estimated Total Hours FTEs Cost 95 Percent CI Lower Bound Mean
95 Percent CI Upper Bound
95 Percent CI Lower Bound Mean
95 Percent CI Upper Bound
95 Percent CI Lower Bound Mean
95 Percent CI Upper Bound
2013Q1 1,233.18 1,748.50 3,003.64 0.77 1.09 1.88 $212.0 $300.5 $516.3
2013Q2 2,721.64 3,885.70 6,789.71 1.70 2.43 4.24 $467.8 $667.9 $1,167.0
2013Q3 4,404.25 5,736.25 8,223.24 2.75 3.59 5.14 $757.0 $985.9 $1,413.4
2013Q4 2,836.69 3,705.00 5,339.39 1.77 2.32 3.34 $487.6 $636.8 $917.7
2014Q1 1,871.04 2,590.25 4,207.60 1.17 1.62 2.63 $321.6 $445.2 $723.2
2014Q2 1,305.39 1,850.88 3,179.51 0.82 1.16 1.99 $224.4 $318.1 $546.5
2014Q3 2,615.13 3,446.63 5,053.36 1.63 2.15 3.16 $449.5 $592.4 $868.5
2014Q4 2,960.76 4,020.25 6,260.57 1.85 2.51 3.91 $508.9 $691.0 $1,076.0
2015Q1 2,898.19 3,872.38 5,833.10 1.81 2.42 3.65 $516.2 $689.8 $1,039.0
2015Q2 1,965.88 2,736.50 4,500.82 1.23 1.71 2.81 $350.2 $487.4 $801.7
2015Q3 1,259.68 1,774.50 3,000.96 0.79 1.11 1.88 $224.4 $316.1 $534.5
2015Q4 1,986.08 2,749.50 4,466.28 1.24 1.72 2.79 $353.8 $489.8 $795.6
Totals 34,501.71 38,051.33 42,576.96 21.56 23.78 26.61 $4,295.0 $5,815.0 $9,069.3