reverse electrodialysis - waddenacademie · reverse electrodialysis: evaluation of suitable...
TRANSCRIPT

r e v e r s e e l e c t r o -d i a l y s i s
design and optimization
by
modeling and experimentation
Joost Veerman
rev
erse
ele
ctro
dia
lysis design and optim
ization by modeling and experim
entation Joost Veerman
Invitation
You and your partner are kindly invited to the public defense of my PhD
thesis and the party afterwards. The thesis is titled:
Reverse Electrodialysisdesign and optimization
bymodeling and experimentation
CeremonyFriday, 1st October 2010 at 14:45
AcademiegebouwBroerstraat 5, Groningen
Afterwards the defense, a reception will be held.
Please inform me or my paranimfs.if you are coming, if possible before
September, 17th
PartyBuffet, drinks & music,
Friday 1st October 2010 from ±18:00 Schaatsfabriek
Leeuwarderweg 4, Wergea
Please inform me or my paranimfs.if you are coming, if possible before
September, 17th
ParanimfsVera Veerman
[email protected] Veerman
Joost VeermanLeeuwarderweg 4
9005NE Wergea [email protected]
058-255241706-12155996
Reverse Electrodialysisdesign and optimization
bymodeling and experimentation
Joost Veerman

ISBN: 978-90-367-4463-8 (print)ISBN: 978-90-367-4464-5 (online)
© 2010, J. Veerman No parts of this thesis may be reproduced or transmitted in any forms or by any means, electronic or mechanical, including photocopying, recording or any information storage and retrieval system, without permission of the author
Cover design : Peter van der Sijde, Groningen
Cover painting : Yolanda Wijnsma, Burdaard
Lay-out: Peter van der Sijde, Groningen
Printed by: drukkerij van Denderen, Groningen

RIJKSUNIVERSITEIT GRONINGEN
Reverse Electrodialysisdesign and optimization
bymodeling and experimentation
Proefschrift
ter verkrijging van het doctoraat in de Wiskunde en Natuurwetenschappen
aan de Rijksuniversiteit Groningen op gezag van de
Rector Magnifi cus, dr. F. Zwarts,in het openbaar te verdedigen op
vrijdag 1 oktober 2010om 14:45 uur
door
Joost Veerman
geboren op 11 december 1945te Zwolle

Promotor: Prof. ir. G.J. Harmsen
Copromotor: Dr. S.J. Metz
Beoordelingscommissie: Prof. ir. M.W.M. Boesten Prof. ir. G.J. Harmsen Prof. dr. F. Kapteijn Prof. dr. -Ing. M. Wessling

de zee en de rivieren
niemand die dit had verwacht wat nu gebeurt was eens een droom de zee die glinstert in haar pracht
de hardste rots wijkt, week en zacht ontworteld meegesleurd, een boom rivieren met hun stille kracht
de wind drijft ginds een haastig jacht een bark vaart stampend onder stoom de zee die glinstert in haar pracht
de maan, die in het water lacht de nacht maakt alles monochroom rivieren met hun stille kracht
het zout dat ons het leven bracht broedplaats van het oeratoom de zee die glinstert in haar pracht
bij windstilte en in de nacht steeds is daar die blauwe stroom rivieren met hun stille kracht de zee die glinstert in haar pracht
Joost Veerman april 2009

Contents
1. Introduction 9
2. Comparison of diff erent techniques for salinity gradient power 19
3. Reducing power losses caused by ionic shortcut currents in reverse 31 electrodialysis stacks by a validated model
4. Reverse electrodialysis: Evaluation of suitable electrode systems 55
5. Reverse electrodialysis: Performance of a stack with 50 cells on the mixing 83 of sea and river water
6. Reverse electrodialysis: Comparison of six commercial membrane pairs on 107 the thermodynamic effi ciency and power density
7. The performance of a scaled-up reverse electrodialysis stack 131
8. Modeling the performance of a reverse electrodialysis stack 157
Summary 197
Samenvatting 203
Publications 209
Dankwoord 213


9
Introduction
Chapter 1

10
Chapter 1
1.1. History
In 1972, the Club of Rome published Limits to Growth1 that created a public shock. The report predicted that economic growth is limited by an fi nite amount of ores and fossil fuel. Shortly after the publication, the oil crisis broke out and increased the public concern about the scarcity of natural resources. In 1985 a conference on the “Assessment of the Role of Carbon Dioxide and Other Greenhouse Gases in Climate Variations and Associated Impacts” was organized in Villach, Austria by UNEP/WMO/ICSU. The conclusion was that greenhouse gases “are expected” to cause signifi cant warming in the next century and that some warming is inevitable2. In June 1988, James E. Hansen stated that human actions had already measurably aff ects on the global climate3. The next milestone was the Kyoto Protocol, adopted in 1997 and entered in force in 2005. The target of the protocol was the reduction of the emission of four greenhouse gases (CO2, CH4, N2O, SF6) and two groups of ozone attacking gases (hydrofl uorocarbons and perfl uorocarbons).
New renewable forms of energy are needed without thermal pollution, without emission of environmental unwanted substances and without net emission of greenhouse gasses. Wind power, hydropower, biofuel, solar power, geothermal power and ocean power are contributors to an economy of renewable energy. A relatively young member of this group is salinity gradient power (SGP), the energy that can be generated from reversible mixing of two kinds of water with diff erent salt contents. This technique is proposed by Pattle in 19544,5. In 1954 Pattle wrote4: The osmotic pressure of sea-water is about 20 atmospheres, so that when a river mixes with the sea, free energy equal to that obtainable from a waterfall 680 ft. high is lost. There thus exists an untapped source of power which has (so far as I know) been unmentioned in the literature.
The potential of salinity gradient power (SGP) is the product of the exergy density of river water times the fl ow rate of the river water:
The average value of the exergy content of river water can be used for an estimation of the global power. This exergy content is about 2.5∙106 J/m3, supposing that a large excess of sea water is used. The t otal discharge of all rivers in the world is estimated to be 1.13∙106 m3/s 6. Therefore, the global potential power is 2.8∙TW, a v alue near to the 2.6 TW as estimated in 1977 by Wick and Schmitt7.
In 2008, the average world energy consumption was about 15 TW; 5 TW of his amount was
rateFlow*densityExergypowerPotential
11
Introduction
used to generate 2 TW of electrical energy in most low effi cient coal fi red power plants8. Thus the potential of SGP is more than the current global electricity consumption.
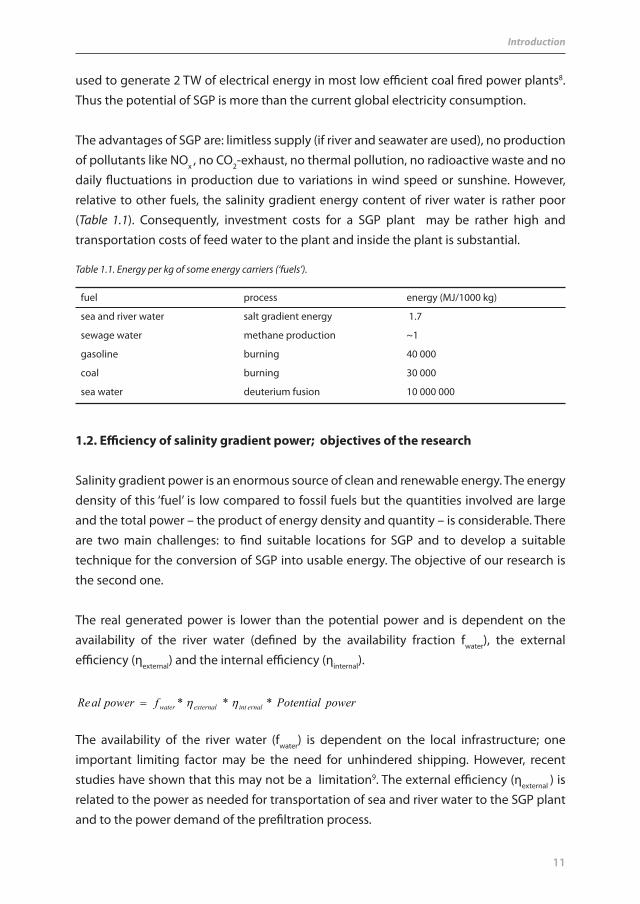
The advantages of SGP are: limitless supply (if river and seawater are used), no production of pollutants like NOx , no CO2-exhaust, no thermal pollution, no radioactive waste and no daily fl uctuations in production due to variations in wind speed or sunshine. However, relative to other fuels, the salinity gradient energy content of river water is rather poor (Table 1.1). Consequently, investment costs for a SGP plant may be rather high and transportation costs of feed water to the plant and inside the plant is substantial.
fuel process energy (MJ/1000 kg)
sea and river water salt gradient energy 1.7
sewage water methane production ~1
gasoline burning 40 000
coal burning 30 000
sea water deuterium fusion 10 000 000
1.2. Effi ciency of salinity gradient power; ob jectives of the research
Salinity gradient power is an enormous source of clean and renewable energy. The energy density of this ‘fuel’ is low compared to fossil fuels but the quantities involved are large and the total power – the product of energy density and quantity – is considerable. There are two main challenges: to fi nd suitable locations for SGP and to develop a suitable technique for the conversion of SGP into usable energy. The objective of our research is the second one.
The real generated power is lower than the potential power and is dependent on the availability of the river water (defi ned by the availability fraction fwater), the external effi ciency (ηexternal) and the internal effi ciency (ηinternal).
The ava ilability of the river water (fwater) is dependent on the local infrastructure; one important limiting factor may be the need for unhindered shipping. However, recent studies have shown that this may not be a limitation9. The external effi ciency (ηexternal ) is related to the power as needed for transportation of sea and river water to the SGP plant and to the power demand of the prefi ltration process.
Table 1.1. Energy per kg of some energy carriers (‘fuels’).
powerPotential***fpoweralRe ernalintexternalwater
12
Chapter 1
The internal effi ciency (ηinternal) is related to all processes within the SGP generator. Our research was restricted to the SGP generator; availability of the river water, prefi ltration and transport of feed water to the generator were not included in or project; fouling of the generator was also excluded as research object.
Our goal was the design of a generator, capable to convert salinity gradient power into electricity. Special points of attention are:
the power density (expressed in Watts per square meter membrane area) the total produced power (Watt) the internal effi ciency of the process
1.3. Defi nition of the research questions
When we started the project in 2005, the literature revealed two serious candidates: reverse electrodialysis (RED) and pressure-retarded osmosis (PRO). At that moment only six scientifi c articles describing real experiments on RED have been published and for PRO there was about the same amount of literature. All described experiments concerned small laboratory generators with a power output of less than 1 Watt. An exception was the work of V. Kniajev of the Institute of Marine Technology Problems FEB RAS in Vladivostok (Russia) who constructed a RED generator and tested this using fi eld conditions; regretfully, results were never published in scientifi c literature10.
RED compared to PROFrom the two candidate techniques, RED seemed to be more attractive experimentally because by using this method the conversion is rather simple, without the requirement of high pressure set-ups, pressure exchangers and turbines. Therefore, the fi rst research question was (and discussed in Chapter 2):
Is RED better than PRO for generating energy from sea and river water?
The techniques should be compared on diff erent aspects; the main are internal effi ciency and power density. Effi ciency is important to obtain a maximal amount of energy from a given quantity of river water; power density can be defi ned as the generated power per unit of investment (W/€), power per cubic meter installation (W/m3) etc. We decided to use the generated power per square meter membrane (W/m2) because some proper data were available both for RED and for PRO in W/m2.

13
Introduction
Managing parasitic currentsParasitic currents may be present in a RED stack and decrease the overall effi ciency of this process. In principle, there may be an energy loss due to three short circuits: the sea water feed channels, the river water channels and the electrode rinse solution. In principle parasitic currents can be prevented by the use of mechanical valves or air bubble injection, but it would be more practical to design a RED stack with inherently low losses. Therefore, the next research question was (and answered in Chapter 3):
Is it possible to manage power losses by ionic short-circuit through a proper stack design?
Electrode systemsIn the literature on RED, diff erent electrode systems are described. Some of these systems require a reversal of the electrical current (which is only possible with symmetric stacks), some make use of gas evolving reactions (which may be dangerous) and other apply platinum electrodes in their system (which is expensive). Therefore, we discussed in Chapter 4:
What are useful electrode systems for RED?
Used aspects for a comparison should include safety, health, environment, technical feasibility and e conomics.
Stack propertiesThe produced net power by a RED stack is the generated electrical power minus the hydrodynamic power losses. The spacers play a crucial role in the power production: thick spacers (with large openings) have a small lateral hydrodynamic resistance but induce, when fi lled with feed water, a high electrical resistance perpendicular on the membranes and vise versa. High fl ow rates lead to a large produced power but to a low effi ciency and vise versa. Besides the produced net power, also net power density and net effi ciency are aff ected by hydrodynamic losses. A stack of 10x10 cm2 with 50 cells seems large enough to serve as a prototype of larger stacks and can be used to study the complicated properties of the RED process. Therefore, the next research question was (and is the subject of Chapter 5):
What is the performance of a 10x10 cm2 stack with 50 cells?
MembranesThe central theme will be describing the power density and effi ciency in terms of

14
Chapter 1
membrane and spacer properties, stack and cell dimensions and fl uid velocities. The performance of a stack is aff ected by two kinds of losses: hydrodynamic and electrical. The fi rst are located in the manifolds and in the spacers, the second in the feed water supply and in the membranes. Membranes are of particular interest, because they include three sources of losses: osmosis, co-ion transport and membrane resistance. Therefore, we take a closer look at the properties of the membranes in Chapter 6:
What is the eff ect of osmosis, co-ion transport and membrane resistance on the generated power and effi ciency of diff erent membranes?
Scale-upBesides power density and effi ciency, especially power is an important response parameter. To obtain more power, the dimensions of the cells should be increased and therewith the length of the fl ow channels. An important process variable to be studied is the fl ow rate of the feed, or the residence time. In such an up-scaled stack, the eff ect of fl ow direction (co-current or counter-current) should be investigated. Because the salt concentration in the river water compartment increases during the passage through the cells, the area stack resistance decreases locally (the eff ect of the decreasing concentration in the sea water compartment is less). Therefore, it is expected that segmentation of the electrodes is profi table. Therefore, the research question was (as discussed in Chapter 7):
What is the eff ect of fl ow channel length, residence time, fl ow direction and of electrode segmentation on power density and effi ciency of a RED stack?
ModelingThere are two types of mass transport in a RED cell: the lateral transport of sea and river water through the spacer fi lled compartments and perpendicular to the membranes, the transport of ions (co- and counter-ion transport) and water (osmosis). Feed water transport is described by hydrodynamics; the driving forces are the applied hydrostatic pressures. Transport of ions and water is described by the theory of membrane transport and of transport in free solutions; the driving forces are the electrical and chemical potentials.
On the basis of these theoretical considerations, it should be possible to construct a model. This model can be validated by formerly performed experimental data. Our goal is an optimal RED stack design with optimal operation parameters for further upscaling. In short, two research questions can be formulated (and are answered in Chapter 8):
How to model the RED process and how to optimize the design with this model?

15
Introduction
1.4. The Wetsus Blue Energy project
The idea of Wetsus, centre of excellence for sustainable water technology11, is combining scientifi c excellence with commercial relevance. In the Wetsus themes, technical universities work together with participants, companies interested in the diff erent subjects. In January 2005 Wetsus started, the Blue Energy theme, the development of salinity gradient energy on economical scale. It was decided to focus on reverse electrodialysis, a technique from with only four experiments were described in scientifi c literature in the period 1955 to 19864, 5,12-15. The Blue Energy theme is coordinated by Dr. Ir. M. Saakes from the Wetsus institute. Within the Blue Energy project, three aspects were formulated: membrane development, fouling prevention and stack design.
1.4.1. Membrane developmentThis work w as performed by P. Długołęcki u nder the responsibility of Prof. Dr. –Ing. M. Wessling and Dr. Ir. D.C. Nijmeijer of the University of Twente (The Netherlands) and resulted in fi ve scientifi c publications16-20 and a thesis21. In short terms, we shall discuss the most important fi ndings.- It was indicated that the development of special membranes for RED is necessary. The
fi rst step was to determine the requirements for these membranes and to investigate the possibility of using commercial membranes for RED to bridge over the time that the new membranes are in development. Długołęcki et al. found that the membrane resistance should be as low as possible, while the membrane selectivity is of minor importance. According to the membrane model calculations, power densities higher than 6 W/m2 could be obtained by using thin spacers and especially for reverse electrodialysis designed membranes16.
- With direct current and alternating current experimental stack characterization methods, it is possible to quantify the contribution of the concentration polarization, spacer shadow eff ects and stack resistance in RED on the power output of a RED stack17.
- Because the resistance of ion exchange membranes is the key parameter in a RED stack, the eff ect of the solution concentration was investigated. It proved that at low concentrations the membrane resistance increases very strong. This has large implications for the RED process18.
- Next to concentration polarization phenomena, especially the spacer shadow eff ect, has a high impact on the net power output. Normal, non-conductive spacers block the ionic transport in the stack, thus reducing the area eff ectively available for ionic transport. The authors developed and applied ion conductive spacers for RED, which eliminate the spacer shadow eff ect and obviously improves the overall process performance19.

16
Chapter 1
- Because direct current methods do not allow discriminating between these individual resistances, electrochemical impedance spectroscopy (EIS) was applied, which uses an alternating current, to analyze resistance phenomena in ion exchange membranes. The authors found that the increase in membrane resistance with decreasing concentration is the consequence of the strong increase in resistance of the diff usion boundary layer. This also explains the strong eff ect of the fl ow rate on the resistance20.
1.4.2. Fouling preve ntionThis work was perfo rmed by J.W. Post under the supervision of Prof. Dr. Ir. C.J.N. Buisman and Dr. Ir. H.V.M. Hamelers of the Wageningen University (The Netherlands) and resulted in four scientifi c publications22-25 and a thesis26. Again the main points of this research are summarized: - The central aspect of this research was the expected fouling on membranes and
spacers within a RED stack. However, Post et al. started with a comparison of the two most promising energy conversion techniques: PRO (pressure-retarded osmosis) and RED (reverse electrodialysis). It proved that each technique has its own fi eld of application. PRO seems to be more attractive for power generation using concentrated saline brines and RED seems to be more attractive using seawater and river water. Another conclusion was that for improvements of PRO, membrane characteristics are the most important and for the development of RED, one must focus on system characteristics, i.e. optimization of the internal resistance, which is mainly determined by the width of the spacers22.
- RED has been investigated generally with a focus on obtained power, without taking care of the energy recovery. However, optimizing the technology to power output only, would generally result in a low energetic effi ciency. Therefore, Post et al. studied the aspect of energy recovery. They concluded that under special conditions an energy recovery of >80% can be achieved. This number was obtained with recirculating the feed waters and pump losses were ignored23.
- In most publications on RED pure sodium chloride solutions were used. In practice, however, also other ions are present in both feed solutions. Therefore, the eff ect of multivalent ions on the performance of a RED stack was investigated. Results show that, especially the presence of multivalent ions in the dilute solution has a lowering eff ect on the stack voltage. In order to prevent or hamper this transport against the activity gradient, monovalent-selective membranes can be used24.
- For pre-treatment, a capital-inexpensive microscreen fi lter with 50 mm pores was selected and tested. Such a straightforward pre-treatment is only suffi cient given the fact that the reverse electrodialysis stack was redesigned towards a more robust

17
Introduction
spacer-less system25.- For the economic feasibility, a 200 kW repetitive unit was designed. Post et al.
estimated a cost price of less than 0.08 €/kWh (excl. any subsidy or compensation), comparable with that of wind energy25.
1.4.3. Stack design This work was performed by J. Veerman under responsibility of Prof. Ir. G.J. Harmsen of the University of Groningen (The Netherlands) and Dr. Ir. S.J. Metz of the Wetsus Institute and resulted in four published and two submitted scientifi c publications27-32 and this thesis33. The structure of this research was discussed in Chapter 1.3.
References Chapter 1
1 D.H. Meadows, D.L. Meadows, J. Randers, W.W. Behrens III (1972). The Limits to Growth. New York: Universe Books
2 World Meteorological Organization (WMO) (1986). Report of the International Conference on the assessment of the role of carbon dioxide and of other greenhouse gases in climate variations and associated impacts. Villach, Austria
3 J. Hansen, Statement presented to United States senate , Committee on Energy and Natural Resources (1988)
4 R.E. Pattle, Production of electric power by mixing fresh and salt water in the hydroelectric pile. Nature 174 (1954) 660
5 R.E. Pattle, Electricity from fresh and salt water - without fuel. Chem. Proc. Eng. 35 (1955) 351–354
6 J.T. Kuleszo, The global and regional potential of salinity-gradient power. Dept. Environmental Sciences, Environmental Systems Analysis Group, Wageningen University and Research centre (2008)
7 G.L. Wick, W.R. Schmitt, Prospects for renewable energy from sea. Mar. Technol. Soc. J. 11 (1977) 16-21
8 Energy Information Administration, http://www.eia.doe.gov/
9 R. Quak, Feasibility of a power plant, Blue Energy in Dutch Delta. Faculty of Civil Engineering and Geosciences, Department of Hydraulic Engineering. Delft University of Technology (2009)
10 V. Kniajev, Energy of salinity gradient - new source of energy with minimal environmental impact. Abstracts from the International Workshop “Result of Fundamental Research for Investments” (IWRFRI’2001’), St. Petersburg. Russia (2001)
11 http://www.wetsus.nl
12 J.N. Weinstein, F.B. Leitz, Electric power from diff erences in salinity: the dialytic battery. Science 191 (1976) 557–559
13 R. Audinos, Electrodialyse inverse. Etude de l’energie electrique obtenue a partir de deux solutions de salinites diff erentes. J. Power Sources 10 (1983) 203–217
14 R. Audinos, Electric power produced from two solutions of unequal salinity by reverse electrodialysis. Ind. J. Chem. 31A. (1992) 348–354
15 J. Jagur-Grodzinski, R. Kramer, Novel process for direct conversion of free energy of mixing into electric power. Ind. Eng. Chem. Process Des. Dev. 25 (1986) 443–449
16 P. Długołęcki, K. Nymeijer, S. Metz, M. Wessling, Current status of ion exchange membranes for power generation from salinity gradients J. Membr. Sci. 319 (2008) 214-222
18
Chapter 1
17 P. Długołęcki, A. Gambier A, K. Nijmeijer, M. Wessling, Practical potential of reverse electrodialysis as process for sustainable energy generation. Environ. S
18 P. Długołęcki, B. Anet, S.J. Metz, K. Nijmeijer, M. Wessling, Transport limitations in ion exchang e membranes at low salt concen trations. J. Membr. Sci. 346 (2010) 163-171
19 P. Długołęcki, P. Ogonowski, S.J. Metz, K. Nijmeijer, M. Wessling, On the resistances of membrane, diff usion b o undary layer and double layer in ion exchange membrane transport. J. Membr. Sci. 349 (2010) 369-379
20 P. Długołęcki, J. Dabrowska, K. Nijmeijer, M. Wessling, Ion conductive spacers for increased power generation in reverse electrodialysis. J. Membr. Sci. 347 (2010) 101-107
21 P.E. Długołęcki, Mass transport in reverse electrodialysis for sustainable energy generation. Thesis, University of Twente, The Netherlands (2009). ISBN 978-90-365-2928-0
22 J.W. Post, J. Veerman, H.V.M. Hamelers, G.J.W. Euverink, S.J. Mets, K. Nymijer, C.J.N. Buisman, Salinity-gradient power: Evaluation of pressure-retarded osmosis and reverse electrodialysis. J. Membr. Sci. 288 (2007) 218-230
23 J.W. Post, H.V.M. Hamelers, C.J.N. Buisman, Energy recovery from controlled mixing salt and fresh water with a reverse electrodialysis system. Environ. Sci. Technol. 42 (2008) 5785-5790
24 J.W. Post, H.V.M. Hamelers, C.J.N. Buisman, Infl uence of multivalent ions on power production from mixing salt and fresh water with a reverse electrodialysis system. J. Membr. Sci. 330 (2009) 65-72
25 J.W. Post, C.H. Goeting, J. Valk, S. Goinga, J. Veerman, H.V.M. Hamelers, P.J.F.M. Hack, Towards implementation of reverse electrodialysis for power generation from salinity gradients. Desalination and Water Treatment 16 (2010) 182-193
26 J.W. Post, Blue Energy: electricity production from salinity gradients by reverse electrodialysis. Thesis, Wageningen University, Wageningen The Netherlands (2009). ISBN 978-90-8585-510-1
27 J. Veerman, J. W. Post, S.J. Metz, M. Saak es, G.J. Harmsen, Reducing power losses caused by ionic shortcut currents in reverse electrodialysis stacks by a validated model.J. Membr. Sci. 310 (2008) 418-430
28 J. Veerman, S.J. Metz, M. Saakes, G.J. Harmsen, Reverse electrodialysis: performance of a stack with 50 cells on the mixing of sea and river water.J. Membr. Sci. 327 (2009) 136-144
29 J. Veerman, R.M. de Jong, M. Saakes, S.J. Metz, G.J. Harmsen, Reverse electrodialysis: Comparison of six commercial membrane pairs on the thermodynamic effi ciency and power density.J. Membr. Sci. 343 (2009) 7–15
30 J. Veerman, M. Saakes, S.J. Metz, G.J. Harmsen, Reverse electrodialysis: evaluation of suitable electrode systems. J. Appl. Electrochem. DOI 10.1007/s10800-010-0124-8
31 J. Veerman, M. Saakes, S.J. Metz, G.J. Harmsen, Electrical power from sea and river water by reverse electrodialysis: a fi rst step from the laboratory to a real power plant. Submitted to Environmental Science & Technology.
32 J. Veerman, M. Saakes, S.J. Metz, G.J. Harmsen, Reverse electrodialysis: a validated process model for design and optimization. Submitted to the Chemical Engineering Journal.
33 J. Veerman, Reverse electrodialysis, design and optimization by modeling and experimentation. Thesis, University of Groningen, The Netherlands (2010). ISBN: 978-90-367-4463-8 (Print), 978-90-367-4464-5 (Online)
19
Comparison of diff erent techniques for salinity gradient power
Abstract
Salinity gradient power (SGP) is the energy that can be obtained from the mixing entropy of two solutions with a diff erent salt concentration. It is a potentially huge source of sustainable energy when sea water and river water are used. Literature describes fi ve techniques to convert this energy into electricity. However only reverse electrodialysis (RED) and pressure-retarded osmosis (PRO) seemed to be realistic when we started the project. In theory both techniques generate the same amount of energy from given volumes of sea and river water with specifi ed salinity; in practice the RED technique seems to be more attractive for power generation using sea water and river water.
Chapter 2

20
Chapter 2
2 .1. Techniques for energy generation using salinity gradient power (SGP)
There are diff erent processes that can convert the potential energy from SGP into electricity. Most of these methods are the reversal of formerly developed desalination techniques.
(a) Rever se electrodialysis (RED), the inverse of electrodialysis (ED). The ED technique was founded by Maigrot and Sabates in 18901,2. Manecke proposed to store energy with the ED process in 19523. He demonstrated that it is possible to reuse this electrical energy by the reversal operation of his ‘Membranakkumulator’. Pattle was the fi rst who remarked that the combination of river water with seawater can be used as a power source in a ‘hydroelectric pile’4,5.
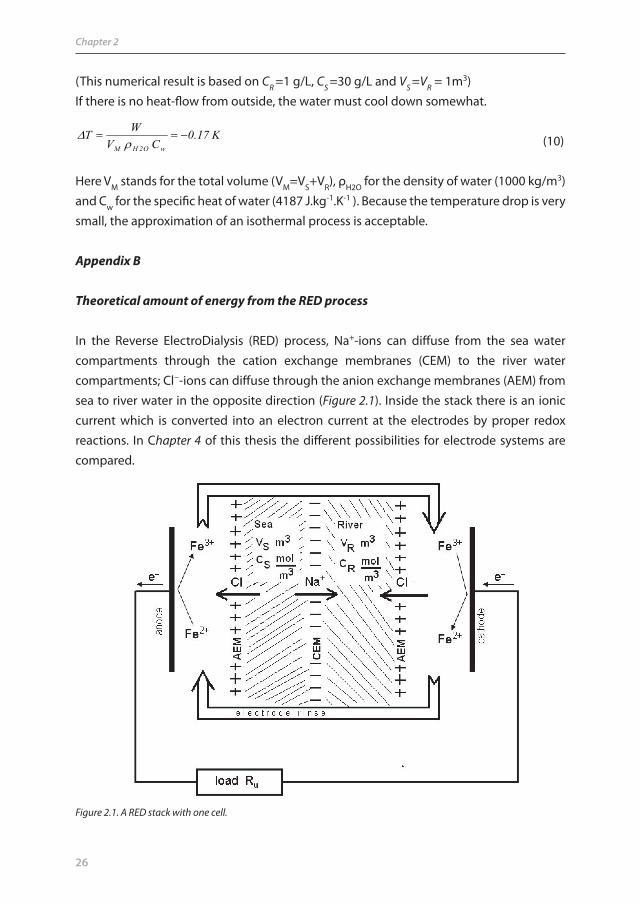
In principle, the set-up for RED and ED are similar. Figure 2.1 shows a simple apparatus in the RED mode. Two kinds of membranes are used in this process: one permeable for positive ions (the cation exchanging membrane, CEM) and another only permeable for negative ions (the anion exchanging membrane, AEM). By diff usion of ions, an ionic current is generated. This ionic current is converted in an electron current at the electrodes by proper redox reactions.
There are three ways of using the potential power with a RED technique: Conversion into electricity. As stated above, Pattle was the fi rst who performed RED
experiments4,5. For desalination. Murphy and Matthews described a process where the SGP was used
for demineralization6,7. Unaware of their work, Veerman made a new approach of this technique with a four cell device8.
Conversion into chemical energy. If the electrode rinse solution does not contain a reversible redox couple, H2 is evolved at the cathode and O2 and/or Cl2 at the anode. Especially H2 is valuable as energy carrier. The possibility of hydrogen generation with RED was remarked by Weinstein and Leitz in 1976. They stated: Electrode reactions could be chosen to yield useful products, but the fi rst law of thermodynamics dictates that any energy so used would represent an ineffi ciency in power generation9. Nevertheless, J.B. Seale obtained a patent on the generat ion of H2 with RED in 200610. A specialized RED stack for hydrogen production contains special electrodes with a low overvoltage for gas evolution and a limited amount of cells (~50) in the stack.
(b) Pressure-retarded osmosis (PRO), the reversal of reverse osmosis (RO). A semi permeable membrane is used: only water can pass but not ions like Na+ and Cl−. Loeb and

21
Comparison of diff erent techniques for salinity gradient power
cooperators are the pioneers of this technique11.
(c) Vapor pressure diff erence utilization process (VPDU), the reversal of vacuum distillation. The vapor pressure of water decreases with the salt content. If an amount of water is separated through a copper plate from an amount salt water and the vapor phase of both waters are in contact, there would be water vapor fl ow from the river to the sea compartment. The formed heat of condensation is directed backward through the copper plate to the evaporating vessel. A demonstration model was built by Olsson et al.12. On economical scale, the technique seems to be very diffi cult: a large area of evaporation surface is needed for the phase transfer and the maintenance of the vacuum in a continuous process will require much eff ort. Moreover, special turbines would have to be designed for large quantities of vapor with very low pressure diff erences, typically about 50 Pa.
(d) The ‘mechanochemi cal turbine’ (MT). The biophysicist Katchalsky has remarked the contraction of collagen fi ber in a salt solution and the expansion is immersed in fresh water. A working machine based on this eff ect was described by Sussman and Katchalsky13. Despite the genius of the concept, a megawatt MT plant seems to be very impractical.
(e ) The reversal of the capacitive deionization (RCD). Brogioli succeeded to invert capacitive deionization14. The capacitor in the setup is formed by two activated carbon electrodes, immersed in the feed solution, alternately salt and fresh water. It is charged when fi lled with salt water, and discharged when fi lled with fresh water. Charging and discharging are promoted by the diff usion of ions and consequently there is a net energy gain. Because no membranes are involved, this technique appears to be promising at fi rst sight. However, now the electrodes play the central role in the process and the problem of membrane fouling is now moved to the electrodes.
The number of articles describing real experiments on RED are restricted to about 12; the same holds for PRO. For up-to-date references on RED and PRO, we refer to the review article from Nijmeijer and Metz15.
2.2. Choice for the RED technique
As the methods of Olsson (VDPU) and Sussman / Katchalsky (MT) looked impractical and the method of Brogioli (RCD) was yet unknown when we started the project in 2005, we concentrated on the two remaining techniques: PRO and RED.

22
Chapter 2
The theoretical amount of energy obtainable with the RED technique and the PRO technique are equal. This is proven in the appendices A, B and C of this chapter. In Cha pter 2- Appendix A, the energy is calculated from the concept of the mixing entropy, in Chapter 2- Appendix B from the RED process as based on the Nernst equation and in Chapter 2- Appendix C from the PRO process as based on the Van ‘t Hoff equation.
A comparison between the two techniques was made by Post et al.16. All published data on RED and PRO were analyzed; however, reported performances were incomplete and the measurement conditions were not comparable. A theoretical method was developed which allows a comparison of both techniques under equal conditions, both with respect to power density and energy. The conclusions of Post et al. were: RED is more attractive for power generation using river and sea water and PRO is
more attractive using concentrated saline brines. The installed costs are in the same order of magnitude. The costs for ED membranes is about 2-3 times higher than for RO membranes.
However, the market for ED is small and a large reduction of the price is expected if the RED will have a breakthrough.
Ou r goal was to use the large energy potential from river water and sea water and therefore, we decided to choose for the RED technique.
2.3. Conclusions
Sev eral diff erent technologies are described to convert SGP into useful power; the most practical are RED and PRO. PRO and RED can theoretical produce the same amount of energy from SGP. If river water with seawater is used, the RED technique seems to be more attractive for power generation.
References Chapter 2
1 E. Maigrot, J. Sabates, Apparat zur Läuterung von Zuckersäften mittels Elektriztät. Germ. Pat. Nr. 50443 (1890)
2 V.A. Shaposhnik, K. Kesore K, An early history of electrodialysis with permselective membranes. J. Membr. Sci. 136 (1997) 35-39
3 G. Manecke, Membranakkumulator. Zeitschrift für Physikalische Chemie 201 (1952) 1-15
4 R.E. Pattle, Production of electric power by mixing fresh and salt water in the hydroelectric pile. Nature 174 (1954) 660
5 R.E. Pattle, Electricity from fresh and salt water - without fuel. Chem. Proc. Eng. 35 (1955) 351–354
6 G.W. Murphy, Osmionic demineralization. Ind. Eng. Chem. 50 (1958) 1181-1188

23
Comparison of diff erent techniques for salinity gradient power
7 G.W. Murphy, R.R. Matthews, Migration in transference cells with and without membranes -application to osmionic demineralization. Electrochim. Acta 12 (1967) 983-998
8 J. Veerman, Rijnwater ontzouten hoeft geen energie te kosten. Polytechnisch Tijdschrift September 1994, 52-55
9 J.N. Weinstein, F.B. Leitz, Electric power from diff erences in salinity: The dialytic battery. Science 191 (1976) 557-559
10 J.B. Seale, Reverse dialysis for generation of hydrogen. Patent US20060263646 (2006)
11 S. Loeb, F. van Hessen, D. Shahaf, Production of energy from concentrated brines by pressure- retarded osmosis II. Experimental results and projected energy costs. J. Membr. Sci.1 (1976) 249-269
12 M. Olsson, G.L. Wick, J.D. Isaacs, Salinity gradient power - utilizing vapor-pressure diff erences. Science 206 (1979) 452–454
13 M.V. Sussman, A. Katchalsky, Mechanochemical turbine: a new power cycle. Science 167 (1970) 45–47
14 D. Brogioli, Extracting Renewable Energy from a Salinity Diff erence Using a capacitor. Phys. Rev. Lett. 103, (2009) 058501 1-5
15 K. Nijmeijer, S.J. Metz, Salinity Gradient Energy, Chapter 5 from Sustainability Science and Engineering Volume 2 Sustainable Water for the Future: Water Recycling versus Desalination (Editors I.C. Escobar and A.I. Schäfer)
16 J.W. Post, J. Veerman, H.V.M. Hamelers, G.J.W. Euverink, S.J. Metz, D.C. Nymeijer, C.J.N. Buisman, Salinity-gradient power: Evaluation of pressure-retarded osmosis and reverse electrodialysis. J. Membr. Sci. 288 (2007) 218–230
17 C. Forgacs, R.N. O’Brien, Utilization of membrane processes in the development of non-conventional renewable energy sources. Chem. Can. 31 (1979) 19-21
18 J.N. Weinstein, F.B. Leitz, Electric power from diff erences in salinity: The dialytic battery. Science 191 (1976) 557-559
19 B.H. Clampitt, F.E. Kiviat, Energy recovery from saline water by means of electrochemical cells. Science 194 (1976) 719-720
20 J. Jagur-Grodzinski, R. Kramer, Novel Process for direct conversion of free energy of mixing into electric power. Ind. Eng. Chem. Process Des. Dev. 25 (1986) 443-449

24
Chapter 2
volume salt conc. moles mol fractions
m3 mol/m3 ions water ions water
sea VS CS nx,S = 2VS.CS ny,S = VS.m - nX,S xS = nX,S/( nX,S + n Y,S) yS = 1 - xS
river VR CR nx,R = 2VR.CR ny,R =VR.m - nX,RxR = nX,R/( nX,R + nY,R) yR = 1 - xR
mixture VM=VS+VR CM*) nx,M = nx,S+nX,R ny,M = nY,S + nY,R xM = nX,M/( nX,M + nY,M) yM = 1 - xM
*) CM=(CSVS+CRVR)/(VS+VR)
Appendix A
Theoretical amount of energy from the mixing entropy of seawater and river water
When two NaCl solutions with diff erent concentrations are mixed, the entropy S increases; the volume change is negligible. If the solutions are ideal, there is no thermal eff ect on irreversible mixing (adding together fresh and salt water and stirring). The electrolyte simulation program OLI (OLI Systems Inc. Morris Plains, NJ, USA) predicts a temperature rise of 0.013 K on mixing of equal volumes of pure water and a 0.5 M NaCl solution (about the total salt concentration of sea water). This implies that, if the process is performed reversible and energy is extracted, there must be added heat to the system (if operated isothermal) or the system should cool down slightly (if the process is adiabatic). The latter is the normal way and it will be proven that the temperature eff ect is not more than about −0.2 degrees if sea water with river water is used. Consequently, for entropy calculation the mixing process (reversible or irreversible) can be regarded to be isothermal.
We assume the total number of moles (m) in a cubic meter of salt solution at 298 K to be independent of the salt content, thereby regarding the particles H2O, Na+ and Cl− as independent molecules. Then m=55555 mol/m3 in pure water and in NaCl solutions. The fractions used are x for the ions and y for water, and the indices used are S for the concentrated solution (or seawater), R for the diluted solution (or river water) and M for the mixture of sea and river water. The seawater contains CS NaCl/m3 and the river water CR mol NaCl/m3. Table 2.1 shows the relation of the mol fractions of ions (x) and water (y) in the sea water, the river water and the mixture.
Table 2.1. Mol fractions as function of volume and salt content

25
Comparison of diff erent techniques for salinity gradient power
First the entropy increase of the river and sea water is calculated if these were composed from pure water and solid salt, using:
(1)
where n is the number of moles and R the gas constant.Using NaCl concentrations CR =17.1 mol/m3 (1 g/L) and CS =5 13.3 mol/m3 (30 g/L) and volumes VS =VR = 1m3, the next entropies are achieved for the sea water (SS), the river water (SR) and the mixture (SM):
(2)
(3)
(4)The increase of entropy (ΔStotal) on mixing is:
(5)Ignoring the contribution of water to the entropy, the result is:
(6)
Eq. (6) can be rewrit ten to:
(7)
with
(8)
The simp lifi cation as used in Eq. (6) is only 0.8% less than the more correct value from Eq. (5) and consequently we will use the derived equation - Eq. (7) - in the future. This equation was fi rst derived by Forgacs17.
In the case of a reversible isothermal process, the change of the free enthalpy can be calculated. If the solutions are ideal, the enthalpy change is zero and th e reversible work (from the entropy increase) W is equal to the free enthalpy change.
(9)J1045.110857.42980STHGW 64
RS
RRSSM VV
VCVCC
M
RRR
M
SSS
M
RRR
M
SSS C
ClnCVCC
lnCVR2xxlnxV
xx
lnxVmRS
)yln(y)xln(xnRS
13SSSSSS JK1053.42)yln(y)xln(xmRVS
13RRRRRR JK1039.2)yln(y)xln(xmRVS
13MMMMMM JK1081.49)yln(y)xln(xmRVS
13RSMtotal JK1089.4SSSS
13RRRSSSMMM JK1086.4)xln(xV)xln(xV)xln(xVmRS
26
Chapter 2
(This numerical result is based on CR =1 g/L, CS =30 g/L and VS =VR = 1m3)If there is no heat-fl ow from outside, the water must cool down somewhat.
(10)
Here VM stands for the total volume (VM=VS+VR), ρH2O for the density of water (1000 kg/m3) and Cw for the specifi c heat of water (4187 J.kg-1.K-1 ). Because the temperature drop is very small, the approximation of an isothermal process is acceptable.
Appendix B
Theoretical amount of energy from the RED process
In the Reverse ElectroDialysis (RED) process, Na+-ions can diff use from the sea water compartments through the cation exchange membranes (CEM) to the river water compartments; Cl−-ions can diff use through the anion exchange membranes (AEM) from sea to river water in the opposite direction (Figure 2.1). Inside the stack there is an ionic current which is converted into an electron current at the electrodes by proper redox reactions. In Chapter 4 of this thesis the diff erent possibilities for electrode systems are compared.
Figure 2.1. A RED stack with one cell.
K17.0CV
WTwO2HM

27
Comparison of diff erent techniques for salinity gradient power
In the following calculations, we assume a batch process: the compartments are fi lled with VS m3 sea water and VR m3 river water with initial salt concentrations CS and CR mol/m3. These solutions are not refreshed in the next consideration.
The generated potential over each membrane is given by the Nernst-equation18,19,20. Assuming ideal circumstances, the activities can be replaced by concentrations. Further, for univalent ions, the value of z (the valency) is unity. If the poles of a RED stack are connected by a load an electrical current goes through this external resistance Ru and through the internal resistance Ri of the stack the Nernst voltage φ is time dependent en given by the equation:
(11)
F stands for the Faraday constant (F = 96485 C/mol) and aS and aR for the mean activity of the ions. Assumed is a permselectivity α =1 for the membranes.
The energy delivered to both resistances is the integral −∫Φ(t)dQ where Q is the transported charge. This generated energy has a minus sign because streams to the system are positive as usual in thermodynamics. This current is proportional to the amount of transported ions n: anions through the AEMs and cations through the CEMs from the sea to the river water compartments.
(12)
(13)
The process stops if both concentrations are equal. This equilibrium concentration is the formerly CM as defi ned in Eq. (8). The amount of transported ions d (mol) at the end is:
(14)
(15)
(Again, this numerical result is based on CR =1 g/L, CS =30 g/L and VS =VR = 1m3)
The result from Eq. (15) as calculated with Mathcad 11.0 (Mathsoft Engineering & Education,
dC
)t(C)t(C
lnFVF
RTdQW R
SRED
J1045.1dQ
VQC
VQC
lnRT2W 6d
0
RR
SS
RED
)CC(Vd MSS
dCVF)VCF(d)nF(ddQ
)t(C)t(C
lnF
RT)t(a)t(a
lnzFRT(t)
R
S
R
S
28
Chapter 2
Inc) is the same as the calculated value from the entropy increase WE in Eq (9). This is not surprising because same physical principles are used in theory of entropy and of the RED process.
Appendix C
Theoretical amount of energy from the PRO process
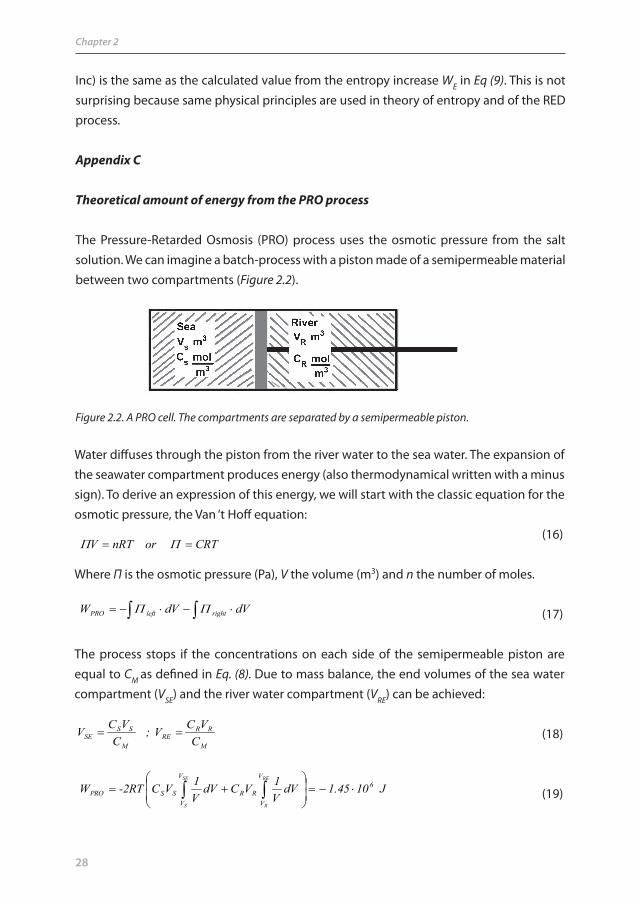
The Pressure-Retarded Osmosis (PRO) process uses the osmotic pressure from the salt solution. We can imagine a batch-process with a piston made of a semipermeable material between two compartments (Figure 2.2).
Figure 2.2. A PRO cell. The compartments are separated by a semipe rmeable piston.
Water diff uses through the piston from the river water to the sea water. The expansion of the seawater compartment produces energy (also thermodynamical written with a minus sign). To derive an expression of this energy, we will start with the classic equation for the osmotic pressure, the Van ‘t Hoff equation:
(16)
Where Π is the osmotic pressure (Pa), V the volume (m3) and n the number of moles.
(17)
The process stops if the concentrations on each side of the semipermeable piston are equal to CM as defi ned in Eq. (8). Due to mass balance, the end volumes of the sea water compartment (VSE) and the river water compartment (VRE) can b e achieved:
(18)
(19)
CRTornRTV
dVdVW rightleftPRO
M
RRRE
M
SSSE C
VCV;C
VCV
J1045.1dVV1VCdV
V1VC-2RTW 6
V
V
V
VRRSSPRO
SE
S
RE
R

29
Comparison of diff erent techniques for salinity gradient power
(Again, this numerical result is based on CR =1 g/L, CS =30 g/L and VS =VR = 1m3)The result from Eq. (19) is the same as the calculated value from the entropy increase WE in Eq. (9). This is due to the fact that the theory of PRO is based on the same physical principles as thermodynamics.
Nomenclature
a mean activityC concentration (mol/m3)Cw specifi c heat of water (4187 J.kg-1.K-1 )d number of moles transported in the RED processF Faraday constant (96485 C/mol)G free enthalpy (J)H enthalpy (J)m total number of moles per m3 (55555 mol/m3)n number of molesQ electric charge (C)R gas constant (8.314 J∙mol-1K-1)Ri internal resistance (Ω)Ru external resistance (Ω)t time (s)S entropy (J/K)T temperature (K)U voltage (V)V volume (m3)VSE end volume concentrate (m3)VRE end volume diluate (m3)W work (J)x mole fraction of ionsy mole fraction of waterz valency of an ion
Greek symbolsα permselectivity of the ion exchange membraneρH2O density of water (~1000 kg/m3)Π osmotic pressure (Pa)φ Nernst potential(V)
Subscriptsx ionsy waterS sea (or concentrate)R river (or diluate)M equilibrium (or mixture)
AbbreviationsAEM anion exchange membraneCD capacitive deionizationCEM cation exchange membraneED electrodialysisMT mechanochemical turbinePRO pressure-retarded osmosis

30
RCD reverse capacitive deionizationRED reverse electrodialysisRO reverse osmosisVPDU vapor pressure diff erence utilization

31
Reducing power losses caused by ionic shortcut currents in reverse electrodialysis stacks by a validated model*
AbstractBoth in electrodialysis and in reverse electrodialysis ionic shortcut currents through feed and drain channels cause a conside rable loss in effi ciency. Model calculations based on an equivalent electric system of a reverse electrodialysis stack reveal that the eff ect of these salt bridges could be reduced via a proper stack design. The critical parameters which are to be optimized are ρ/r and R/r; where ρ is the lateral resistance along the spacers, R is the resistance of the feed and drain channels between two adjacent cells, and r is the internal resistance of a cell. Because these two parameters (ρ/r and R/r) are dimensionless, diff erent stacks can be easily compared. The model is validated with two experimental stacks diff ering in membrane type and spacer thickness, one with large ionic shortcut currents and one where this eff ect is less. The loss in effi ciency decreased from 25% to 5% for a well designed stack. The loss of effi ciency in reverse electrodialysis and in electrodialysis can be reduced with the aid of the design parameters presented in this chapter.
* Published asJ. Veerman, J. W. Post, M. Saakes, S.J. Metz, and G.J. HarmsenReducing power losses caused by ionic shortcut currents in reverse electrodialysis stacks by a validated modelJournal of Membrane Science 310 (2008) 418-430
Chapter 3

32
Chapter 3
3.1. Introduction
Reverse electro dialysis (RED) is one of the possible processes for generating energy from the salt gradient between river and sea water1. Already in 1953 Pattle showed the possibility of this method2. A typical RED stack consists of a variable number of alternating cation and anion exchange membranes. The compartments between the membranes are fed in turn with a concentrated and a diluted salt solution, for instance of sea and river water. In Figure 3.1 the situation is drawn for a stack with four cells.
Parasitic currents, also called current leakage, cause a loss in performance in both electrodialysis (ED) and reverse electrodialysis. There are two sources of these parasitic currents. Firstly in an ion exchange membrane, besides the wanted transport of the counter-ions, there is a transport of co-ions due to the fact that membranes are not 100% selective. Secondly, there are ionic shortcut currents, arising from the transport of ions through the feed and drain channels. These channels act as salt bridges between the compartments. Transport of ions through these salt bridges occurs due to an electrochemical potential diff erence between adjacent cells. Both types of parasitic currents cause a reduction of power and a decrease in energy effi ciency in a RED stack. Reduction of the co-ion transport is a matter of membrane optimization and is left out of consideration in this chapter. However, the eff ect of the ionic shortcut currents is strongly related to the stack design and is discussed here.
That ionic shortcut can cause effi ciency loss in electrodialysis was understood already in an early stage of the development of ED. Mandersloot and Hicks made already in 1966 a mathematical model of an ED stack and concluded that it is important to have a low
Salt water
Fresh water
Brackish
Brackish
Ru
A
V
e-e-
Redox couple
Cl-Na+
Redox couple
Cathode
Anode
AEM
+++++++
+++++++
AEM
+++++++
+++++++
AEM
+++++++
+++++++
AEM
+++++++
+++++++
CEM
-------
-------
CEM
-------
-------
CEM
-------
-------
CEM
-------
-------
CEM
-------
-------
Electrode rinse solution
Figure 3.1. Schematic representation of a reverse electrodialysis stack with four cells.

33
Reducing power losses caused by ionic shortcut currents
channel conductivity between the compartments3. The effi ciency loss is more drastic if the salt concentration becomes higher. Some measures to restrict the ionic shortcut currents are suggested: In Japan already in the sixties all edible salt was produced from seawater with
electrodialysis. The high salt concentrations used in this process cause severe ionic shortcut losses in the system. Yamane et al. have found that the use of separate unit cells in the production of brine from sea water can reduce the ionic shortcut current by more than 30%4. The individual cells have separate feed tubes. The long conductive paths through these tubes give enough resistance to reduce the parasitic currents eff ectively.
Air bubbles can be added to the feed. This decreases the ionic shortcut currents and has less eff ect on the water transport in the stack.
Rotating valves which act as barriers to the electrolytic currents5. An alternative method is the serial feed. The sea water is directed successively
through all sea water compartments of the stack. These compartments are connected alternating at the top and at the bottom, causing a zigzag fl ow. The same holds for the river water. In this case a possible ionic shortcut current should pass a much longer pathway and is therefore signifi cantly reduced. However, this causes also a much higher fl uid resistance. However, a combination of parallel and serial feed can be realistic for an optimal design.
The use of spiral wound modules makes the feed and drain channels superfl uous. In fact there are only two compartments: the diluate and the concentrate6,7,8.
Especially for bipolar cell stacks, the electrical leakage has been studied by diff erent groups. In 1979 Kuhn and Booth reviewed the state-of-art in that fi eld9 and calculated the ionic shortcut currents as function of the place in a bipolar cell stack. Pretz and Staude10 used a RED system with bipolar membranes and observed a limiting value of the open circuit voltage (OCV) with the increase of the number of membranes. Rubinstein11 explained this eff ect by ionic shortcut currents.
The objective of this work is to quantify the effi ciency losses due to ionic shortcut currents in (reverse) electrodialysis. These eff ects can be modeled via an equivalent electrical circuit and are validated experimentally. Experiments are performed with two diff erent stack designs, one with a large ionic shortcut current and another where this eff ect is less. The model is calibrated by experiments with small stacks (1, 2 .. 5 cells) and validated by experiment with large stacks (10, 20 .. 50 cells). Model and experiments are in good agreement and this shows the possibility of managing the ionic shortcut currents within acceptable proportions.

34
Chapter 3
3.2. Theory
3.2.1. Reverse electrodialysisA RED stack with four cells is drawn in Figure 3.1. Each cell contains a cation exchange membrane (CEM), a compartment with a concentrated salt solution, an anion exchange membrane (AEM), and a compartment with a lower salt concentration. The last cell is closed with an extra cation exchange membrane. The ‘fuel’ consists of a concentrated and a diluted salt solution, for instance sea and river water.
The Na+ ions from the sea water tend to diff use through the cation exchange membranes and cause a positive potential on the left side of the stack. In the same way, the Cl− ions diff use through the anion exchange membrane in the reverse direction, also resulting in a positive potential on the left side of the stack. Transport of ions through the membranes occurs if an electrical load is connected to the electrodes. Externally there is a normal electrical current but in the cell this is an ionic current. The ionic current in the cells is converted to an electron current at the electrodes by redox reactions.These redox reactions can be facilitated by means of a solution of K4Fe(CN)6 and K3Fe(CN)6 (potassium hexacyanoferrate (II) and potassium hexacyanoferrate (III) ) in a bulk of NaCl in combination of inert electrodes. The iron(III) complex is reduced on the cathode and the iron(II) complex is reoxidized on the anode. Because the electrode rinse is recirculated through both electrode compartments, the original Fe(III)/Fe(II) ratio is maintained and there is no net chemical reaction.
Fe(CN)63– + e Fe(CN)6
4–, E0 = 0.36 V
3.2.2. The electromotive forceThe theory about reverse electrodialysis was formulated by Weinstein and Leitz12, Clampitt and Kiviat13, Jagur-Grodzinski and Kramer14 and Lacy15. The potential to the left of a given cation exchange membrane in Figure 3.1, generated by the diff usion of Na+ ions , is given by:
(1)
where E is the generated electromotive force (EMF), αCEM the permselectivity of the cation exchange membrane, z the valency (z=1 for Na+), R the gas constant, F the Faraday constant and a+
c and a+d the activities of the sodium ion in the concentrated and diluted
compartments. This formula holds also for the potential caused by the diff usion of Cl− ions through an anion exchange membrane if αAEM is taken for the permselectivity and a-
c and
d
cCEM a
azFRTE ln
35
Reducing power losses caused by ionic shortcut currents
a-d for the activity of the Cl− ion. Activities can be calculated with the extended Debye-
Hückel formula16. With Eq. (1), the voltages across a 100% selective membrane can be calculated. For pure NaCl solutions of 1 and 30 g/L this gives values of 0.080 V for a CEM and 0.078 V for an AEM, or 0.158 V for a complete cell.
3.2.3. Ionic shortcut currentsA proper RED stack has a high power output characterized by the specifi c power (Pspec), which is the power generated at one square meter of membrane. An equally important process parameter is the energy effi ciency: the amount of obtained energy in relation to the theoretical maximum for a given amount of fuel.
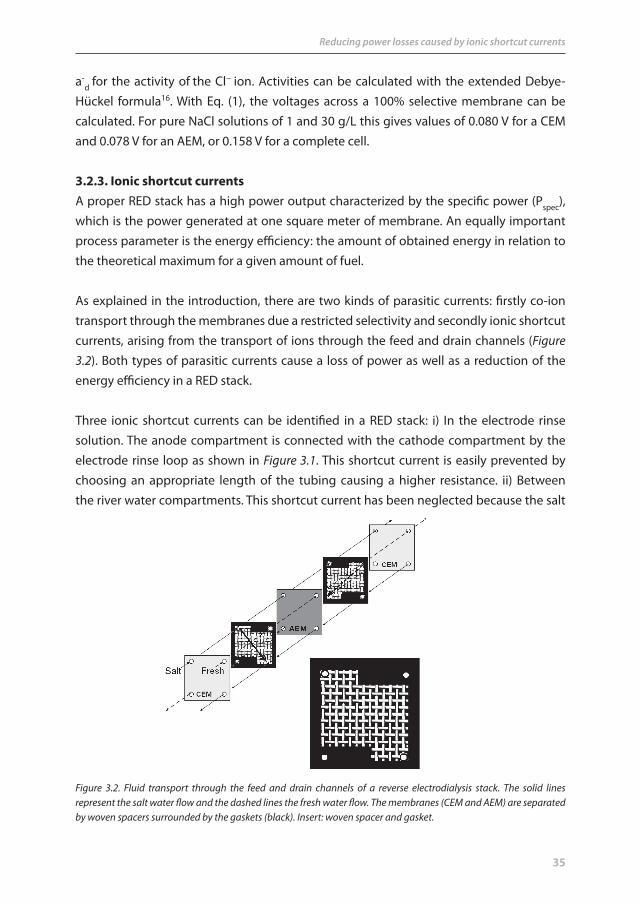
As explained in the introduction, there are two kinds of parasitic currents: fi rstly co-ion transport through the membranes due a restricted selectivity and secondly ionic shortcut currents, arising from the transport of ions through the feed and drain channels (Figure 3.2). Both types of parasitic currents cause a loss of power as well as a reduction of the energy effi ciency in a RED stack.
Three ionic shortcut currents can be identifi ed in a RED stack: i) In the electrode rinse solution. The anode compartment is connected with the cathode compartment by the electrode rinse loop as shown in Figure 3.1. This shortcut current is easily prevented by choosing an appropriate length of the tubing causing a higher resistance. ii) Between the river water compartments. This shortcut current has been neglected because the salt
Figure 3.2. Fluid transport through the feed and drain channels of a reverse electrodialysis stack. The solid lines represent the salt water fl ow and the dashed lines the fresh water fl ow. The membranes (CEM and AEM) are separated by woven spacers surrounded by the gaskets (black). Insert: woven spacer and gasket.
36
Chapter 3
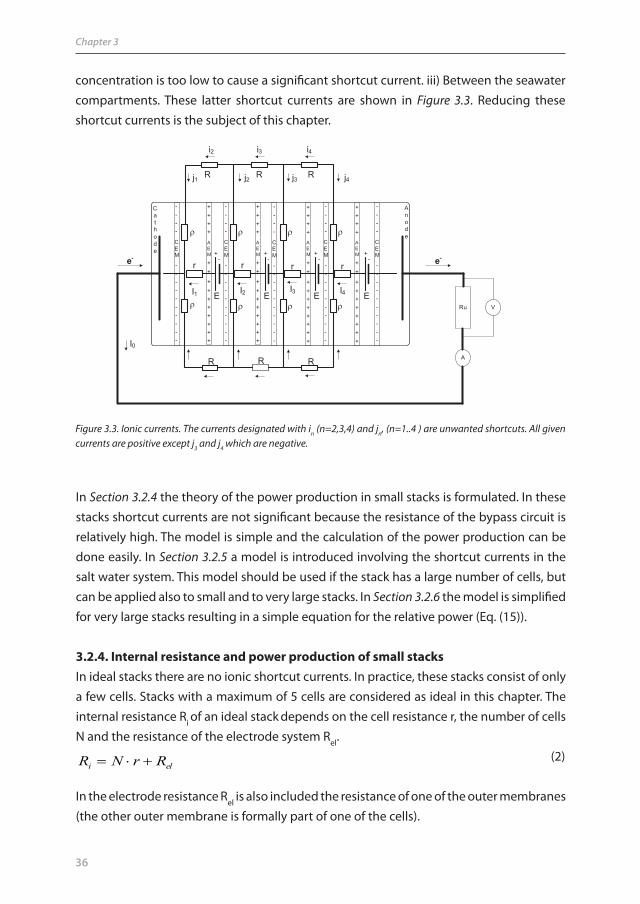
concentration is too low to cause a signifi cant shortcut current. iii) Between the seawater compartments. These latter shortcut currents are shown in Figure 3.3. Reducing these shortcut currents is the subject of this chapter.
Ru
A
V
e-e-
Cathode
Anode
+-
+-
+-
+-
R R R
r r r r
E E E E
j4j3j1 j2
i2 i3 i4
I4I3I2I1
I0
++++
++
++++++++
AEM
----
--
--------
CEM
++++
++
++++++++
AEM
----
--
--------
CEM
----
--
--------
CEM
----
--
--------
CEM
----
--
--------
CEM
++++
++
++++++++
AEM
++++
++
++++++++
AEM
R R R
Figure 3.3. Ionic currents. The currents designated with in (n=2,3,4) and jn, (n=1..4 ) are unwanted shortcuts. All given currents are positive except j3 and j4 which are negative.
In Section 3.2.4 the theory of the power production in small stacks is formulated. In these stacks shortcut currents are not signifi cant because the resistance of the bypass circuit is relatively high. The model is simple and the calculation of the power production can be done easily. In Section 3.2.5 a model is introduced involving the shortcut currents in the salt water system. This model should be used if the stack has a large number of cells, but can be applied also to small and to very large stacks. In Section 3.2.6 the model is simplifi ed for very large stacks resulting in a simple equation for the relative power (Eq. (15)).
3.2.4. Internal resistance and power production of small stacksIn ideal stacks there are no ionic shortcut currents. In practice, these stacks consist of only a few cells. Stacks with a maximum of 5 cells are considered as ideal in this chapter. The internal resistance Ri of an ideal stack depends on the cell resistance r, the number of cells N and the resistance of the electrode system Rel.
(2)
In the electrode resistance Rel is also included the resistance of one of the outer membranes (the other outer membrane is formally part of one of the cells).
eli RrNR

37
Reducing power losses caused by ionic shortcut currents
The cell resistance r is the sum of the resistances of two membranes (RAEM and RCEM) and two water compartments (Rriver and Rsea).
(3)
If there is no spacer in the water compartment, the resistance of the water compartments, Rcomp can be calculated from the specifi c conductivity σ (S/m) of the salt solution, the area Acell (m
2) and the thickness δ (m) of the compartment. A correction is used for the volume occupied by the spacer material. The void factor fv expresses the relative volume available for the salt solution (void volume).
(4)
An ideal RED installation without complicating shortcut currents, behaves like a normal battery and its current I is given by:
(5)
where E is the electromotive force, Ri the internal resistance of the stack and Ru the external load resistance.
The power dissipated in the external resistance Ru in this ideal system is:
(6)
From Eq. (6) it follows that a maximum of Pu arises if Ru = Ri. In this case the terminal voltage is Vt = ½E. The effi ciency (Eff ) is the fraction of the power delivered to Ru and the total power dissipation in Ri and Ru.
(7)
At the condition for maximal power ( Ru = Ri ) even in an ideal system the effi ciency is no higher than 50%. A higher effi ciency can be achieved (by taking Ru > Ri) at the expense of a decreased power output.
3.2.5. Modeling the stackAn equivalent circuit model for a real stack with four cells and all shortcut circuits caused by the concentrate feed, is given in Figure 3.4. This stack is connected to an external load. The nomenclature of the symbols follows the model of Rubinstein et al.11. The directions
seariverCEMAEM RRRRr
cellvcomp Af
R 11
ui RREI
uui
uu RRR
ERIP2
2
ui
u
ui
u
RRR
RIRIRI
Eff
22
2

38
Chapter 3
of the currents are arbitrarily designated. The resistors ρ are the lateral resistances along the spacers, from the middle to the drain and the feed. The resistors R are the resistances of the feed and drain channels through the stack and r is the internal resistance of a cell. For simplicity, only the shortcut by the sea water is taken into account. Shortcut by the river water is ignored because the conductivity in this part is much lower.In fact, the equivalent circuit model in Figure 3.4 is a summary of the circuit drawn in Figure 3.3. For reasons of symmetry, this model is simplifi ed by omitting the lower part from Figure 3.3.
Figure 3.4. Equivalent circuit model for a RED stack with 4 cells. r is the internal resistance of a cell, ρ the resistance across a salt water space, R the resistance in the feed and drain channels between two salt water compartments, Re the resistance of the electrode system, Ru the external load, I is the current through the membrane, i the current through the feed and drain channels, j the lateral current leakage along the membrane surface, U the potential at the centre of the membrane, V the potential in the feed and drain channel, and E the electromotive force of one cell.
Rubinstein et al.11 have given an approach for solving a system like this in a sophisticated way. However, their model did not include an external load and only the open circuit voltage (OCV) could be calculated.
But adding a load to the system the method of Rubinstein is not applicable and a diff erent method is necessary. This model involves many unknowns: each cell in the stack involves three currents (I, i and j) and two potentials (U and V). The fi ve equations for solving these unknowns are three times the Law of Ohm (over r, over R and over ρ) and two times the law of Kirchhoff (in the junctions U and V). In Mathcad these equations are solved numerically.
3.2.6. An approximation for very large stacksThere are good ion conducting paths: fi rst the main route through the cell (resistances r)

39
Reducing power losses caused by ionic shortcut currents
the internal resistance of the stack (Ri) and the total bypass resistance (Rs) can be calculated from the cell parameters (E, r, R) and the number of cells (N): EMF=N∙E, Ri=N∙r and Rs=N∙R. This little network, easily accessible for a straightforward calculation, gives the next results:
The maximum external power is achieved if the resistance of the load (Ru) equals the internal resistance of the parallel resistances Ri and Rs
(8)
Figure 3.5 shows a very large stack with N cells. The internal resistance is Ri, the shunt resistance (from the shortcut circuit) is Rs and the load (the external resistance) is Ru. We can apply the voltage divider rule to calculate the voltage on point U relative to the ground:
(9)
and next the bypass through the feed and drain channel (resistances R). The connection between both paths consists of the lateral spacer resistances (ρ) with a relative high resistance. However, a circuitry of many of such parallel connections result in a relatively low substitution resistance, well enough (in relation to the channel resistance) to realize an ionic shortcut current intruding into the feed and drain channels.
In this case the greater part of the resistance of the ionic shortcut current is formed by the resistances of the feed and drain channels and the lateral spacer resistance can be ignored. In Figure 3.5 the model with this approximation is drawn. The EMF of the source,
Ri Rs Ru
N E
U
Figure 3.5. Simplifi ed equivalent circuit model for a very large stack. The stack EMF is N times the cell EMF. Ri is resistance of the N cells, Rs the feed and drain channel resistance and Ru the external load. Because the stack is very large, the number of lateral spacer resistances connected parallel is so large that these can be omitted from the model.
si
siu RR
RRR
ENRRR
RRUusi
us
||
||

40
Chapter 3
The sign ║ means adding two parallel resistances:(10)
From this the generated power in Ru can be stated:
(11)
To generate maximum power in Ru, the external load Ru should be equal to substitution value of the internal load and the shunt resistance:
R R ||Ru i s (12)
Substituting this value for Ru in the foregoing equation leads to
(13)
In an ideal stack, the bypass resistance is infi nite, resulting in a maximum external power Pideal
(14)
The power can also be expressed in relation to this value of Pideal: the power ratio (PR). The method has been tested on all 75 combinations, mentioned in Section 3.4.4. It follows that this approximation is suitable if satisfi ed to the condition N∙R/ρ>1. In this case the approximation gives a maximal deviation of 10% downward.
(15)
From the experiments, it appeared that the criterion N∙R/ρ>1 is satisfi ed at N=50 for poor stacks and at N=1000 or more for well designed stacks.
3.2.7. Validation of the model for salinity power productionThe optimization with respect to shortcut currents also holds for a salinity power production when the concentrated solution is depleted with ions and the diluted solution is enriched with ions. This causes a decrease of the shortcut currents in the concentrated compartments and an increase in the diluted compartments. If the conductivity of the salt solutions changes linearly with concentration, the net loss due to shortcut currents is equal to net loss that is the case when there is no transport of ions. Moreover, during mixing the internal resistance (r) also decreases, causing increased ratio of R/r and ρ/r and
22max )(4
ENRRR
RPsii
s
22
41 ENR
Pi
ideal
1
RNifrR
RP
PPideal
R
us
usus RR
RRR||R
uusi
us
uu R
ENRRR
RRRUP 1
||||
22

41
Reducing power losses caused by ionic shortcut currents
a reduced power loss via shortcut currents. Therefore, optimization of the cell with respect to ionic shortcut currents also holds when ions are transported and salt concentrations are changing.
3.3. Experimental
3.3.1. Stack confi guration3.3.1.1. StacksThe functional dimensions of the membranes in both types were 10 cm x 10 cm. On the outsides of the stacks cation exchange membranes prevent the transportation of negatively charged iron complexes.Two types of stacks were used both with a variable number of cells. First stacks with Ralex anion and cation exchange membranes (MEGA a.s. Czech Republic) with a thickness of 0.65 mm. The stacks were equipped with regular nonwoven spacers of 1 mm. The radius of the holes in the membranes for the water supply and drain are 5 mm. These stacks are denoted R1.0 in this chapter.Next stacks were used with Fumasep anion and cation exchange membranes FAD and FKD with a thickness of 0.082 mm (Fumatech, Germany). The stacks were provided with polyamide woven spacers with a thickness of 200 μm (Nitex 03-300/51, Sefar, the Netherlands). The radius of the supply holes in the membranes are 4 mm in this case. The stacks of this type are designated as F0.2 .
3.3.1.2. Electrode systemThe electrode compartment consisted of a solution of NaCl (1 mol/L) with K4Fe(CN)6 ( 0.05 mol/L ) and K3Fe(CN)6 ( 0.05 mol/L ) (All chemicals were technical grade and purchased from Boom, Meppel, the Netherlands). This electrolyte is pumped through the anode and cathode compartment at a rate of 60 mL/min. Used were Ru-Ir mixed metal oxide electrodes, obtained from Magneto (Magneto Special Anodes b.v., the Netherlands).
3.3.1.3. Set upThe tests with the R1.0-stacks were done in a recirculating system with centrifugal pumps. Flows in the stack with 50 cells were about 2 L/min for both types of water. For the experiment with the F0.2-stacks, peristaltic pumps were used. The stack with 50 cells was fed with 700 mL/min. In both cases, smaller stacks were fed with proportional lower fl ow rates. This lower fl ow rate in the F0.2 stems from a higher hydrodynamic resistance of the thinner spacers. The temperature was about 24-25 oC for all experiments. The used salt concentrations were 1 and 30 g/L of NaCl.

42
Chapter 3
3.3.1.4. Power measurementsOn the R1.0-stacks, the voltage was measured between the work and the counter electrode. The F0.2-stacks were fi tted with two little platinum electrodes in the middle of the work and the counter electrode. Stack potentials were measured in the anolyte and catholyte between these reference Pt electrodes whereas the current was applied to the working and counter electrode.
Measurements were done with an Ivium potentiostat (Ivium Technologies, Eindhoven, the Netherlands) in the galvanostatic mode. From the measured U(I)-curves the power was calculated as the maximum of the product from U and I and the resistance was calculated as the slope of the U(I) curve at the maximum power.
3.3.3. Calculation of the resistances r, R and ρ in a single cellFor comparing the electric characteristics of a R1.0-stack with a F0.2-stack it is necessary to know the resistances r, R and ρ. These parameters, which are typical cell properties, were calculated as well as possible. Afterwards the internal resistance r was experimentally determined in small stacks with 0,1..5 cells.
3.3.3.1. The internal resistance rThe internal resistance can be calculated from the membrane specifi cations at 0.5 mol/L NaCl (near to 30 g/L), given by the membrane supplier. The ionic resistance for Ralex membranes (8 Ω.cm2) is 10 times higher than the Fumasep membranes (0.8 Ω.cm2). It is assumed that the area resistance is independent of the salinity. A void factor fv = 0.80 is used for the resistance of the water compartments.
Table 3.1 shows that the stack resistance is only reduced signifi cantly if low resistance membranes are combined with thin spacers.
Table 3.1 Resistance (Ω) of one cell of 0.01 m2 for various cell designs
Spacer: 1.0 mm Spacer: 0.2 mm Spacer: 0.1 mm
Ralex Fumasep Ralex Fumasep Ralex Fumasep
AEM 0.080 0.008 0.080 0.008 0.080 0.008
CEM 0.080 0.008 0.080 0.008 0.080 0.008
Sea (30 gNaCl /L) 0.026 0.026 0.005 0.005 0.003 0.003
River (1 g NaCl/L) 0.629 0.629 0.126 0.126 0.063 0.063
Total 0.815 0.671 0.291 0.147 0.225 0.081
Ratio Ralex/Fumasep 1.21 1.98 2.77
43
Reducing power losses caused by ionic shortcut currents
3.3.3.2. The feed and drain channel resistance RAs explained earlier, only the salt water channels are taken in account. The channel resistance R is calculated from the dimensions of the cylindrical bore through the cell and the conductivity of the salt water. In fact on the place where the channel crosses a spacer, the width of the channel increases. If we assign a zero resistance to this passage, the channel resistance is somewhat lower than the formerly calculated value. A good approximation is the average of the two mentioned values. Because R stands for two parallel resistances (feed and drain) in the model, this resistance value should be halved. The resistances calculated in this manner are 3.9 Ω for the R1.0-stack and 0.81 Ω for the F0.2-stack.
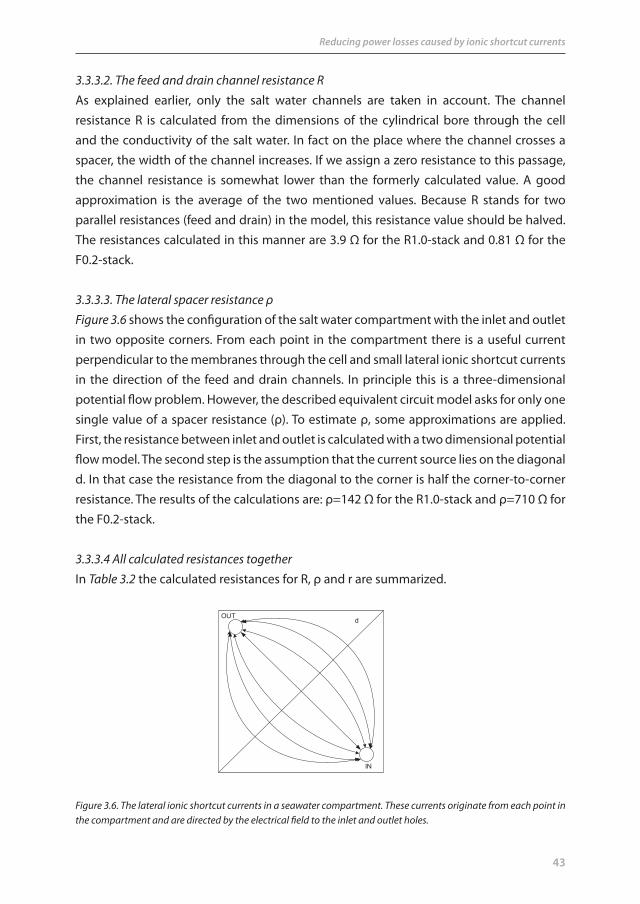
3.3.3.3. The lateral spacer resistance ρFigure 3.6 shows the confi guration of the salt water compartment with the inlet and outlet in two opposite corners. From each point in the compartment there is a useful current perpendicular to the membranes through the cell and small lateral ionic shortcut currents in the direction of the feed and drain channels. In principle this is a three-dimensional potential fl ow problem. However, the described equivalent circuit model asks for only one single value of a spacer resistance (ρ). To estimate ρ, some approximations are applied. First, the resistance between inlet and outlet is calculated with a two dimensional potential fl ow model. The second step is the assumption that the current source lies on the diagonal d. In that case the resistance from the diagonal to the corner is half the corner-to-corner resistance. The results of the calculations are: ρ=142 Ω for the R1.0-stack and ρ=710 Ω for the F0.2-stack.
3.3.3.4 All calculated resistances togetherIn Table 3.2 the calculated resistances for R, ρ and r are summarized.
d
OUT
IN
Figure 3.6. The lateral ionic shortcut currents in a seawater compartment. These currents originate from each point in the compartment and are directed by the electrical fi eld to the inlet and outlet holes.

44
Chapter 3
Calculation
ValidationN=10, 20 .. 50
CalibrationN = 1, 2 .. 5 cells
E r R
Figure 3.7. The validation procedure of the equivalent current model.
3.3.4. Experimental procedureThe equivalent circuit model was calibrated and validated (Figure 3.7). The calibration was performed successively with a stack of 5, 4 .. 0 cells. In the case of a small number of cells (N), the ionic shortcut currents through the spacers (ρ) and the channels (R) are negligible. Therefore, the calculation of E and r is rather straightforward. For each stack, the OCV was measured and the internal resistance (Ri) at maximal power was measured. From the slope of the regression lines of OCV versus N and Ri versus N, the EMF (E) and the cell resistance (r) were determined.
For the validation, experiments were done with larger stacks with 50, 40 .. 10 cells. Here the OCV and the maximal power were measured. These values were compared with the forecasted values calculated with the equivalent ci rcuit model. In this model the EMF (E) and the cell resistance (r) from the calibration procedure were used together with the channel resistance (R) and the lateral spacer resistance (ρ) from the calculations in the previous Sections (3.3.3.2 and 3.3.3.3).The procedure is performed with the two types of stacks. In each case the series was started with the complete stack of 50 cells and ended with the small stacks.
R1.0 F0.2r cell (Ω) 0.815 0.147R channel (Ω) 3.9 0.81ρ spacer (Ω) 142 710
Table 3.2 Calculated resistances

45
Reducing power losses caused by ionic shortcut currents
3.4. Results and discussion
3.4.1. Calibration: measurement of r and Ea) The R1.0-stackThe resistance is measured in a RED stack with 4, 3, 2, 1 and 0 cells (Figure 3.8A). In the case of 0 cells, only one cation exchange membrane (CEM) is placed between the electrode compartments. As seen in Table 3.3, at N=0, the resistance of the electrode system together with one CEM is 2.62 Ω and the resistance of one RED cell is 1.54 Ω. The EMF of a single cell (E) was obtained from the slope of the OCV regression line (Figure 3.8C).
0 1 2 3 4 5 60
2
4
6
8
10
Number of cells (N)0 1 2 3 4 5 6
Inte
rnal
resi
stan
ce (
)
0,0
0,3
0,6
0,9
1,2
1,5
Inte
rnal
resi
stan
ce (
)
0 1 2 3 4 5 6
Ope
n C
ircui
t Vol
tage
(V)
0,0
0,2
0,4
0,6
0,8
0 1 2 3 4 5 6
Ope
n C
ircui
t Vol
tage
(V)
0,0
0,2
0,4
0,6
0,8
A B
C D
Number of cells (N)
Number of cells (N) Number of cells (N)
Figure 3.8 A and B: measured stack resistances. A: Resistance of R1.0-stacks measured between the working electrode and the counter electrode. B: Resistance of the F0.2-stacks measured between two platinum reference electrodes. For the calculation of the regression line, the point at N=4 is considered as an outlier and omitted. C and D: measured open circuit voltages. C: OCV of a R1.0-stack. D: OCV of a F0.2-stack.
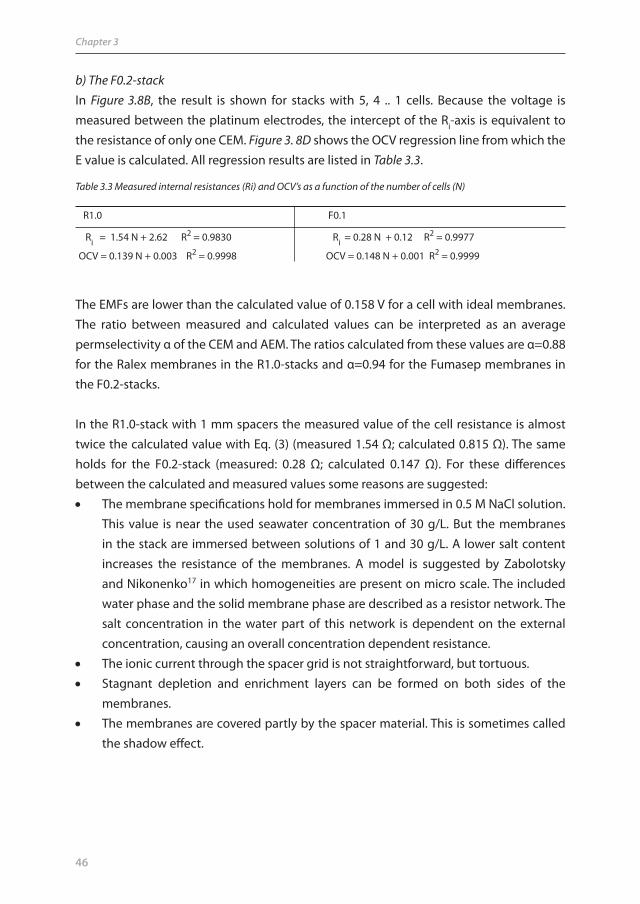
46
Chapter 3
b) The F0.2-stackIn Figure 3.8B, the result is shown for stacks with 5, 4 .. 1 cells. Because the voltage is measured between the platinum electrodes, the intercept of the Ri-axis is equivalent to the resistance of only one CEM. Figure 3. 8D shows the OCV regression line from which the E value is calculated. All regression results are listed in Table 3.3.
Table 3.3 Measured internal resistances (Ri) and OCV’s as a function of the number of cells (N)
R1.0 F0.1
Ri = 1.54 N + 2.62 R2 = 0.9830 Ri = 0.28 N + 0.12 R2 = 0.9977
OCV = 0.139 N + 0.003 R2 = 0.9998 OCV = 0.148 N + 0.001 R2 = 0.9999
The EMFs are lower than the calculated value of 0.158 V for a cell with ideal membranes. The ratio between measured and calculated values can be interpreted as an average permselectivity α of the CEM and AEM. The ratios calculated from these values are α=0.88 for the Ralex membranes in the R1.0-stacks and α=0.94 for the Fumasep membranes in the F0.2-stacks.
In the R1.0-stack with 1 mm spacers the measured value of the cell resistance is almost twice the calculated value with Eq. (3) (measured 1.54 Ω; calculated 0.815 Ω). The same holds for the F0.2-stack (measured: 0.28 Ω; calculated 0.147 Ω). For these diff erences between the calculated and measured values some reasons are suggested: The membrane specifi cations hold for membranes immersed in 0.5 M NaCl solution.
This value is near the used seawater concentration of 30 g/L. But the membranes in the stack are immersed between solutions of 1 and 30 g/L. A lower salt content increases the resistance of the membranes. A model is suggested by Zabolotsky and Nikonenko17 in which homogeneities are present on micro scale. The included water phase and the solid membrane phase are described as a resistor network. The salt concentration in the water part of this network is dependent on the external concentration, causing an overall concentration dependent resistance.
The ionic current through the spacer grid is not straightforward, but tortuous. Stagnant depletion and enrichment layers can be formed on both sides of the
membranes. The membranes are covered partly by the spacer material. This is sometimes called
the shadow eff ect.

47
Reducing power losses caused by ionic shortcut currents
Number of cells (N)
0 10 20 30 40 50
Ope
n C
ircui
t Vol
tage
(V)
0
2
4
6
8
Number of cells (N)
0 10 20 30 40 50
Ope
n C
ircui
t Vol
tage
(V)
0
2
4
6
8
Number of cells (N)
0 10 20 30 40 50
Pow
er (W
att)
0,00
0,05
0,10
0,15
0,20
Number of cells (N)
0 10 20 30 40 50
Pow
er (W
att)
0,0
0,2
0,4
0,6
0,8
1,0
1,2
A B
C D
Table 3.4 Used input parameters in the model
Figure 3.9 A and B. Measured and calculated Open Circuit Voltage (A: R1.0-stacks; B: F0.2-stacks). The solid lines represent the calculated values, the symbols represent the measured values, and the dashed line is the extrapolation of the fi rst two measured data points. C and D: Equivalent graphs for the dissipated power (C: R1.0-stacks; D: F0.2-stacks).
source R1.0 F0.2
E (V) experimental (N=1,2..5) 0.139 0.148
r (Ω) ,, 1.54 0.281
R (Ω) calculated 3.9 0.81
ρ (Ω) ,, 142 710
3.4.2. Validation of the modelWith the two types of stacks, experiments were done with a variable number of cells (N) in the range from 10 to 50. With the described model the stack performance was also calculated. The values of the used parameters are listed in Table 3.4. Figure 3.9 shows the measured open circuit voltage and the power, plotted against the number of cells (N).
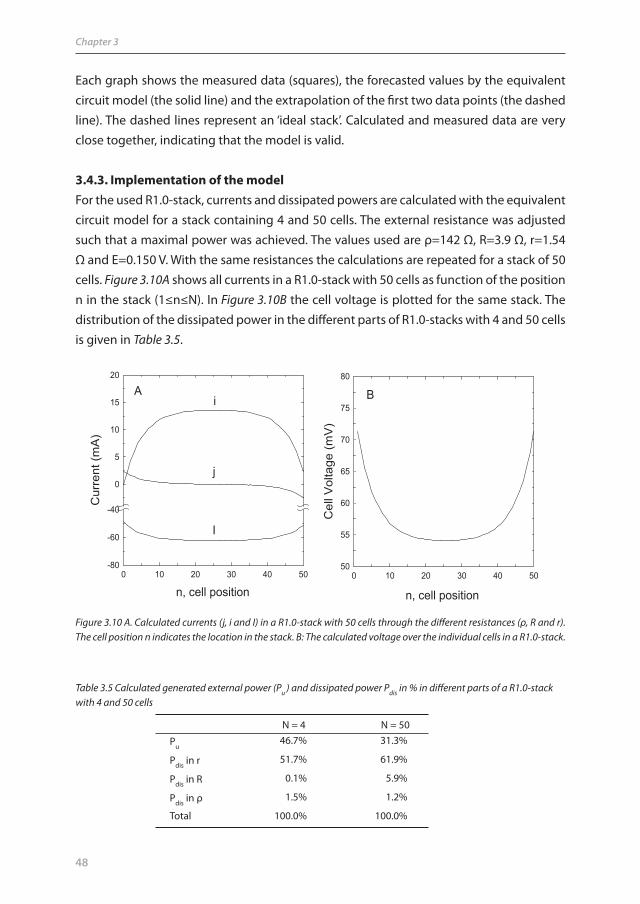
48
Chapter 3
Each graph shows the measured data (squares), the forecasted values by the equivalent circuit model (the solid line) and the extrapolation of the fi rst two data points (the dashed line). The dashed lines represent an ‘ideal stack’. Calculated and measured data are very close together, indicating that the model is valid.
3.4.3. Implementation of the modelFor the used R1.0-stack, currents and dissipated powers are calculated with the equivalent circuit model for a stack containing 4 and 50 cells. The external resistance was adjusted such that a maximal power was achieved. The values used are ρ=142 Ω, R=3.9 Ω, r=1.54 Ω and E=0.150 V. With the same resistances the calculations are repeated for a stack of 50 cells. Figure 3.10A shows all currents in a R1.0-stack with 50 cells as function of the position n in the stack (1≤n≤N). In Figure 3.10B the cell voltage is plotted for the same stack. The distribution of the dissipated power in the diff erent parts of R1.0-stacks with 4 and 50 cells is given in Table 3.5.
0 10 20 30 40 50
Cur
rent
(mA
)
-80
-60
-40
0
5
10
15
20
i
j
I
n, cell position
0 10 20 30 40 50
Cel
l Vol
tage
(mV
)
50
55
60
65
70
75
80
A B
n, cell position
Figure 3.10 A. Calculated currents (j, i and I) in a R1.0-stack with 50 cells through the diff erent resistances (ρ, R and r). The cell position n indicates the location in the stack. B: The calculated voltage over the individual cells in a R1.0-stack.
Table 3.5 Calculated generated external power (Pu ) and dissipated power Pdis in % in diff erent parts of a R1.0-stack with 4 and 50 cells
N = 4 N = 50
Pu46.7% 31.3%
Pdis in r 51.7% 61.9%
Pdis in R 0.1% 5.9%
Pdis in ρ 1.5% 1.2%
Total 100.0% 100.0%

49
Reducing power losses caused by ionic shortcut currents
The ionic shortcut currents cause a voltage drop over the individual cells (Figure 3.10B). Also here a fl attening is seen in the middle of the stack. Figure 3.10A shows the same fl attening eff ects, discussed already in Section 3.2.6 for very large stacks. Only the fi rst and fi nal ten lateral spacer currents ( j ) appear to be signifi cant. Assuming a number of 10 lateral spacer resistances of 142 Ω at the beginning, the result is a connection between the main route and the bypass of 14.2 Ω. This value is low compared to the resistance of the bypass channel (50∙3.9=145 Ω).
It is evident that longer stacks have a more serious loss of power by shortcut currents but they do not exceed the limit values of very large stacks. If the saturation of the shortcut current is not reached already, an improvement of the effi ciency can be achieved by an increase of both R/r as ρ/r.
The test value (N∙R/ρ) and the effi ciency at N=50 and at very large values of N for both studied stacks are summarized in Table 3.6. With the used test (N∙R/ρ=1.6), the R1.0-stack with 50 cells is already ‘very large’ and operates near the effi ciency limit. In this case of very large cells an improvement can be achieved only by increasing the ratio R/r. A higher ρ/r ratio has less eff ect on the effi ciency.
Table 3.6 The effi ciency at stacks with 50 cells and with a very large number of cells
A stack consists of an electrode system and N cells. It is shown above that the shortcut currents are minimal at low N. The electrochemical parameters of the used electrode system are important for calculation of the optimal number of cells. Moreover, at real (economically-operating) RED installations the price of the electrode system should be taken into account in the optimization as well, resulting in a value of N that is as large as possible, and that is only restricted by the available space. Table 3.6 shows that for such large stacks, the effi ciency reaches a limiting value.
3.4.4. The validated model expressed in one plotThe equivalent circuit model has been used to calculate various stack designs. The maximum power is calculated for 75 combinations of the channel resistance R (1, 3 and 10 Ω), the spacer resistance ρ (1, 3, 10, 100, 300 Ω) and the number of cells n (2, 3, 10, 30 and 50). The following assumptions were used for the calculation: E = 0.15 Volt and r = 1 Ω for a single cell. The ideal power (Pideal) is also calculated for each number of cells N by applying
R1.0 F0.2
test value N∙R/ρ (N=50) 1.6 0.06
effi ciency at N=50 77% 94%
effi ciency at N →∞ 72% 74%

50
Chapter 3
large values for ρ and R in the model. Power is expressed as the power ratio ( PR=P/Pideal ).
In fact, by taking one of the resistances unity ( r=1), the values of ρ and R can be considered as the relations ρ/r and R/r. So the power ratio is a function of these two relative resistances and of the number of cells N:
PR = f(ρ/r, R/r, N) (16)
The three variables form a three-dimensional space and at some points in this space the PR-values (in %) are given in circles to give a kind of a four dimensional plot (Figure 3.11).The data for the described two stacks: the R1.0-stack (R/r=2.5; ρ/r=94) and the F0.2-stack (R/r=2.9; ρ/r=2580) is given in the plot as well. The F0.2-stack operates at 94% effi ciency with 50 cells. Expansion of the stack to 250 cells will cause an estimated effi ciency drop to about 80% going to a limit of 74% for very large stacks. A 50-cell R1.0-stack operates at an effi ciency of 77% near to the limit of 72% for large stacks.
Figure 3.11. Power ratio (the values in the circles in %) as function of N, R/r and ρ/r. The lines between the diff erent colors are the 90% borders, the 80% borders and so on.
From this plot it follows that at stacks with a medium number of cells, R/r and ρ/r should be as high as possible. This can be achieved by: a) increasing R by narrowing the channels, b) increasing ρ by taking thinner spacers (especially in the sea water compartment)
51
Reducing power losses caused by ionic shortcut currents
c) decreasing r by using low resistive membranes and thin spacers (especially the river water compartment). The possibilities to maximize R are limited because the hydro dynamical resistance in the channels increases with narrowing of the channels. In a cylindrical tube with radius r, the electrical resistance is proportional with r2 whereas the fl uid resistance is related to r4, assuming Poiseuille fl ow dynamics. A benefi t with a factor x in the electrical resistance is paid for with a factor x2 in the fl uid resistance. Increasing ρ infl uences the relative power only marginal in large stacks as explained in the previous section. However, decreasing r seems to be very opportune as it causes not only a higher effi ciency but also an expansion of the specifi c power.
In addition to the theory described in Section 3.2.6 for very large stacks, improvements can be obtained by optimizing R/r. Decreasing r by minimization of both compartments and both membrane thicknesses results in an equal decrease of R resulting in an unaff ected ratio R/r. However, Table 3.1 shows the river water compartment is the bottleneck in the resistance. In very large stacks reduction ρ/r is not opportune, so there is no need for thinning the sea water compartments. However, with given membrane and river water compartment dimensions, decrease of only the thicknesses of the sea water compartment results in (i) a higher R/r ratio and therefore in a higher effi ciency (ii) a lower r, so a higher specifi c power of the stack.
3.5. Conclusions
In this work, a model for the ionic shortcut currents in a reverse electrodialysis stack is presented. The model is calibrated and validated on two diff erent stacks. Our main fi ndings are: Measured cell resistances are about a factor two higher than calculated. This
deviation might stem from (i) a strong concentration dependent behavior of the membranes, (ii) a restricted ionic transport in the spacers, (iii) a stagnant depletion and enrichment layers on both sides of the membranes, (iv) a shadow eff ect from the spacer on the membranes.
It is possible to describe the ionic shortcut loss with only three parameters: (i) the number of cells N, (ii) the channel resistance in proportion to the cell resistance R/r, (iii) the lateral spacer resistance in proportion to the cell resistance ρ/r.
The equivalent circuit model was calibrated and validated with two diff erent kinds of stacks. One type was built with Ralex membranes and 1 mm spacers, the other stack contained Fumasep membranes and spacers of 0.2 mm. Calibration was done with small stacks of 1, 2 to 5 cells and validation with large stacks of 10, 20 to 50 cells. The calculated and measured values of power and OCV’s were in very good agreement.

52
Chapter 3
With the used Fumasep stack with 0.2 mm spacers, the loss caused by ionic shortcut currents is 6% for a stack with 50 cells, showing that the ionic shortcut currents are manageable.
In very large stacks, increase of the ratio between the channel resistance and the cell resistance (R/r) is the most effi cient measure for reduction of the ionic shortcut current loss.
AcknowledgementThe Noordelijke Hogeschool Leeuwarden has facilitated this research by detaching the fi rst author. Also the Senter Novem organization is gratefully acknowledged for their grant. We thank all members of the energy theme from Wetsus for their support and fruitful discussions and especially the participating companies Nuon, Magneto, Triqua, Landustrie, Frisia Zout and the Waterlab Noord for their support.
Nomenclature
a activitya+ activity of the sodium iona− activity of the chloride ionAcell cell area (m2)E electromotive force of one cell (V)Eff effi ciency of a RED batteryF Faraday constant (96485 C/mol)fv void factorN number of cells in a stackn position of a special cell in a stack (1≤n≤N)I electrical current perpendicular on the membranes (A)i the current through the feed and drain channels (A)j the lateral current leakage along the membrane surface (A)Pdis dissipated power (W)Pideal ideal power (W)Pmax maximum external powerPR power ratioPspec specifi c power (W/m2)Pu external power (W)Ri internal resistance (Ω)Ru external resistance (Ω)Rel electrode system resistance (Ω)RAEM cation exchange membrane resistance (Ω)RCEM cation exchange membrane resistance (Ω)Rsea sea water compartment resistance (Ω)Rriver river water compartment resistance (Ω)Rcomp compartment resistance (Ω)

53
Reducing power losses caused by ionic shortcut currents
Rrel relative resistanceRs total bypass resistance (Ω)r cell resistance (Ω)R gas constant (8.31432 Jmol-1K-1)R channel resistance of one cell in a stack (Ω)R2 determination coeffi cientT temperature (K)U the potential at the centre of the membrane (V)OCV open circuit voltage (V)V the potential in the feed and drain channel (V)Vt terminal voltage (V)z valency
Greek symbolsαCEM permselectivity of the cation exchange membraneαAEM permselectivity of the anion exchange membraneδ compartment thickness (m)σ specifi c conductivity (S/m)ρ lateral spacer resistance (Ω)
Abbreviations AEM anion exchange membraneCEM cation exchange membraneED electrodialysisEMF electromotive force (V)RED reverse electrodialysisR1.0 stack with Ralex membranes and 1 mm spacersF0.2 stack with Fumasep membranes and 0.2 mm spacers
Defi nitionscompartment space between the membranescell combination of two membranes and two compartmentselectrode system the anode, cathode, electrode rinse and also one terminating membranestack a number of cells with an electrode system
References Chapter 3
1 J.W. Post, J. Veerman, H.V.M. Hamelers, G.J.W. Euverink, S.J. Metz, K. Nymeijer, C.J.N. Buisman, Salinity-gradient power: Evaluation of pressure-retarded osmosis and reverse electrodialysis. J. Membr. Sci. 288 (2007) 218-230
2 R.E. Pattle, Improvements relating to electric batteries. Patent GB731729 (1955)
3 W.G.B. Mandersloot, R.E. Hicks, Leakage currents in electrodialytic desalting and brine production. Desalination 1 (1966) 178-194
4 R. Yamane, M. Ichikawa, Y. Mizutani, Y. Onoue, Concentrated brine production from sea water by electrodialysis using ion exchange membranes. Ind. Eng. Chem. Process Design Develop. 8 (1969) 159-165
5 B.R. Bligh, Reverse electrodialysis. Patent GB2197116A (1988)

54
Chapter 3
6 T. Wen, G.S. Solt, Y.F. Sun, Spirally wound electrodialysis (SpED) modules. Desalination 101 (1995) 79-91
7 T. Wen, G.S. Solt, Y.F.Sun, Modelling the cross fl ow spirally wound electrodialysis (SED) process. Desalination 103 (1995) 165-176
8 T. Wen, G.S. Solt, D.W. Gao, Electrical resistance and coulomb effi ciency of electrodialysis (ED) apparatus in polarization. J. Membr. Sci. 114 (1996) 255-262
9 A.T. Kuhn, J.S. Booth, Electrical leakage currents in bipolar cell stacks. J. Appl. Electrochem. 10 (1980) 233-237
10 J. Pretz, E. Staude, Reverse electrodialysis (RED) with bipolar membranes , an energy storage system. Ber. Bunsen-Ges. Chem. 102 (1988) 676-685
11 I. Rubinstein, J. Pretz, E. Staude, Open voltage in a reverse electrodialysis cell. Phys. Chem. Chem. Phys. 3 (2001) 1666-1667
12 J.N. Weinstein, F.B. Leitz, Electric power from diff erences in salinity: The dialytic battery. Science 191 (1976) 557-559
13 B.H. Clampitt, F.E. Kiviat, Energy recovery from saline water by means of electrochemical cells. Science 194 (1976) 719-720
14 J. Jagur-Grodzinski, R. Kramer, Novel process for direct conversion of free energy of mixing into electric power. Ind. Eng. Chem. Process Des. Dev. 25 (1986) 443-449
15 R.E. Lacey, Energy by reverse electrodialysis. Ocean Eng. 7 (1980) 1-47
16 D.C. Harris, Quantitative Chemical Analysis, 6th edition, W. H. Freeman & Company (2003)
17 V.I. Zabolotsky, V.V. Nikonenko, Eff ect of structural membrane inhomogeneity on transport properties. J. Membr. Sci. 79 (1993) 181-198

55
Chapter 4
Reverse electrodialysis: Evaluation of suitable electrode systems*
AbstractReverse electrodialysis (RED) is a method for directly extracting electrical energy from salinity gradients, especially from sea and river water. For the commercial implementation of RED, the electrode system is a key component. In this chapter, novel electrode systems for RED were compared with existing systems on safety, health, environment, technical feasibility and economics.
Systems with inert electrodes and a NaCl−HCl supporting electrolyte with the reversible Fe2+/Fe3+ redox couple or the [Fe(CN)6]4– /Fe(CN)6]3– couple achieved the highest ranking. Improvements of the electrode system are also discussed such as the use of special stable metal electrodes, graphite electrodes, other reversible redox couples, capacitive electrodes and electrolytes with carbon particles.
* Published asJ. Veerman, M. Saakes, S.J. Metz and G.J. HarmsenReverse electrodialysis: evaluation of suitable electrode systemsJournal of Applied Electrochemistry 40 (2010) 1461-1474
56
Chapter 4
4.1. Introduction
Energy can be generated from the reversible mixing of salt solutions with diff erent concentrations and is called salinity gradient power (SGP). The energy that theoretically can be generated per m3 river water is 1.7 MJ when mixed with the same volume sea water or even 2.5 MJ when mixed with a large surplus of sea water (Chapter 5: Table 5.1). Post et al. proved experimentally that it is possible to convert 85% of this potential energy into useful electricity1. Wick and Schmitt2 estimated the total global salinity power to be 2.6 TW, which is suffi cient to supply the global electricity demand (2 TW) or 16% of the total present energy consumption3.
There are two membrane technologies capable of converting this potential energy into electricity: reverse electrodialysis (RED)4,5,6 and pressure retarded osmosis (PRO)7,8. Both PRO and RED are sustainable technologies without CO2 or other emissions. The only product is brackish water which is also formed when a river fl ows directly in the sea. Moreover, there is no thermal pollution: the conversion of entropy into electrical energy causes a slight decrease of the water temperature of about 0.1 K if all the potential energy is extracted (Chapter 6). Post et al.9 showed that in the case of using seawater with river water, RED is a good choice. In 1954 Pattle already4,5,6 showed the possibilities of this method.
A RED stack consists of a large number of cells. An example of a RED stack with only one cell is shown in Figure 4.1. The cell consists (from left to right in the fi gure) of an anion exchange membrane (AEM), a sea water compartment, a cation exchange membrane (CEM) and a river water compartment. On the right side, the stack contains an extra AEM. The ions in the sea water diff use through the membranes to the river water: the Na+ ions through the CEM and the Cl− ions through the AEM. The positive Na+ movement to the right and the negative Cl− movement to the left add together to a positive ionic current to the right. The electromotive force of such a cell is 175 mV if pure NaCl solutions are used of 1 and 30 g l-1 and ideal membranes are applied; practical cell voltages under conditions of maximal power generation are about 60 mV (Chapter 5). In practice, a large number of cells (N) would be used, in the range from 50 in laboratory equipments to 1000 or more in commercial RED plants (Chapter 5).
The N cells together are designed as ‘generating system’ (GS). At the electrodes, the ionic current is converted into an electron current. The electrode system (ES) consists at least of four parts: (i) electrodes, (ii) anolyte and catholyte, (iii) outer membranes, and (iv) technical equipment for recirculating the electrode rinse solution. Eventually the electrode rinse solution is controlled by an additional system.
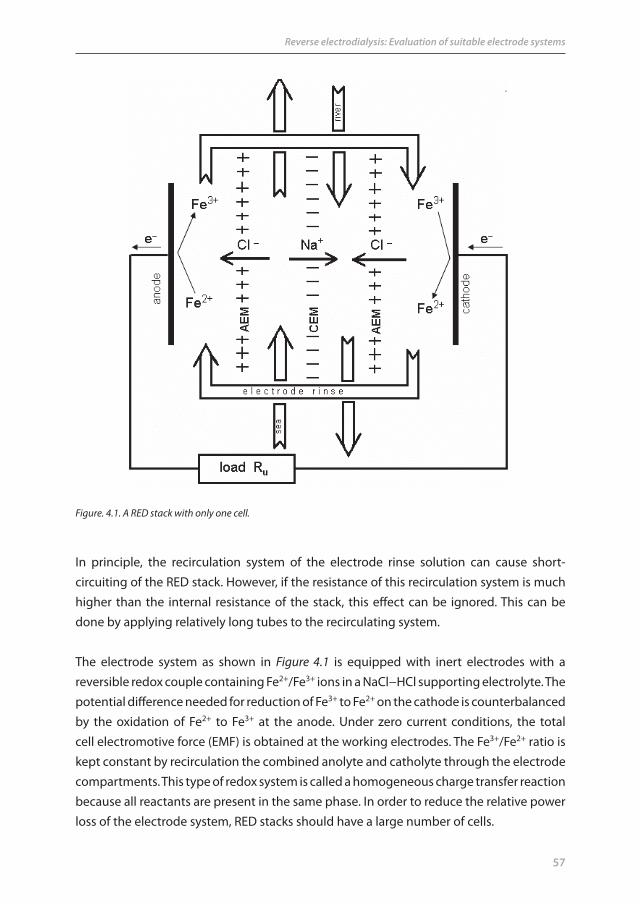
57
Reverse electrodialysis: Evaluation of suitable electrode systems
In principle, the recirculation system of the electrode rinse solution can cause short-circuiting of the RED stack. However, if the resistance of this recirculation system is much higher than the internal resistance of the stack, this eff ect can be ignored. This can be done by applying relatively long tubes to the recirculating system.
The electrode system as shown in Figure 4.1 is equipped with inert electrodes with a reversible redox couple containing Fe2+/Fe3+ ions in a NaCl−HCl supporting electrolyte. The potential diff erence needed for reduction of Fe3+ to Fe2+ on the cathode is counterbalanced by the oxidation of Fe2+ to Fe3+ at the anode. Under zero current conditions, the total cell electromotive force (EMF) is obtained at the working electrodes. The Fe3+/Fe2+ ratio is kept constant by recirculation the combined anolyte and catholyte through the electrode compartments. This type of redox system is called a homogeneous charge transfer reaction because all reactants are present in the same phase. In order to reduce the relative power loss of the electrode system, RED stacks should have a large number of cells.
Figure. 4 .1. A RED stack with only one cell.
58
Chapter 4
In literature many electrode systems are described for RED. These systems are all used on laboratory scale and none of these systems have been evaluated for their practical applicability on a commercial scale. Many aspects of the electrode system are important for its operation: electrochemical reactions, energy consumption, transport through the membranes of the electrode system, reversibility etc. The objective of this chapter is to compare these electrode systems for their suitability for RED. The evaluated systems include those already described in literature, but also contains electrode systems as used in supercapacitors, redox fl ow battery, electrodialysis and capacitive deionization, which might also be useful for RED.
4.2. Electrode systems for RED
4.2.1. Classical systemsTo be fair to the pioneers of RED, it should be mentioned that their electrode systems were designed for laboratory use and were not developed for real applications. However, we have used their systems in our comparison because their solutions vary so widely.
4.2.1.1. OverviewTable 4.1 shows the diff erent published electrode systems for RED. These electrode systems can be classifi ed into two groups: with or without opposite electrode reactions. First, for systems with opposite electrode reactions and a recirculating electrode rinse, there is no net chemical reaction. These systems have a zero equilibrium voltage. A RED system with such an electrode system can generate electrical energy with only a few cells because there is no energy consumption for a net chemical reaction. Another advantage is that there is no loss of chemicals (except for transport through the outer membranes) and no gas production. Pattle5,6 used copper gauze electrodes in a CuSO4 solution. On the cathode the dissolved Cu2+ was reduced to metallic copper and at the anode the copper was oxidized to Cu2+. With a typical RED current density of 50 A/m2 this eff ect on the thickness of electrodes is about 2 mm per week. Jagur-Grodzinski and Kramer10 and Audinos11,12 used zinc electrodes with a ZnSO4 electrode rinse solution. In another experiment Audinos used Ag/AgCl electrodes in a NaCl solution11,12.
In all these processes the electrodes play an active role in the redox process: one electrode is growing and the other is dissolving. In such systems the feed waters should be interchanged periodically to invert the direction of the electrical current and with that the electrode processes. This imposes limitations on the stack design: the stack should be equipped with identical sea and river water compartments. A less attractive solution is to mechanically perform the periodical interchange of anode and cathode.

59
Reverse electrodialysis: Evaluation of suitable electrode systems
Table 4.1. Ele ctrode systems described in literature .┤refers to the anode, ├ to the cathode, ≡ stands for a cation exchange membrane and ‡ for an anion exchange membrane. The repeating unit is underlined. S stands for sea water and R for river water. Direction of the ions through the membranes is designated by arrows.
anode anolyte repeating catholyte cathode author + bulk unit + bulk electrode reactions described systems in iterature
1 Cu ┤ CuSO4 ‡ S ≡ R ‡ CuSO4 ├ Cu Pattle [4, 5, 6] ← → ← cath.: Cu2+ + 2e → Cu Cl– Na+ Cl– anode: Cu → Cu2+ + 2e net: nil
2 metal ┤ sea ≡ R ‡ S sea ├ metal Weinstein/Leitz [13] → ← cath.: 2 H2O + 2e → H2 + 2OH– Na+ Cl– anode: 2 Cl– → Cl2 + 2e net: 2H2O + 2 Cl– → H2 + 2OH– + Cl2
3Ag/AgCl
┤ NaCl ‡ S ≡ R ‡ NaCl ├ Ag/AgCl Audinos [11, 12] ← → ← cath.: AgCl + e → Ag + Cl– Cl– Na+ Cl– anode: Ag + Cl– → AgCl + e net: nil
4 Zn ┤ ZnCl2 ‡ S ≡ R ‡ ZnCl2 ├ Zn Jagur–Grodzinski/Kramer [10] ← → ← cath.: Zn2+ + 2e → Zn Cl– Na+ Cl– anode: Zn → Zn2+ + 2e net: nil
5 C/Pt ┤ NaCl ≡ R ‡ S ≡ R ‡ NaCl ├ C/Pt Jagur–Grodzinski/Kramer [10] → ← → ← air cath.: ½O2 + 2H+ + 2e → H2O Na+ Cl– Na+ Cl– anode: H2O → ½O2 + 2H+ + 2e and 2Cl– → Cl2 + 2e separated anolyte and catholyte
6 Ti/Pt ┤ Na2SO4 ≡ R ‡ S ≡ Na2SO4 ├ Ti/Pt Turek [19, 20] → ← → cath.: 2H2O + 2e → H2 + 2OH– Na+ Cl– Na+ anode: H2O → ½ O2 + 2 H+ + 2e net: H2O + → 2 H2 + ½ O2
7 C ┤ sea ≡ R ‡ S sea ├ C Suda [17] → ← cath.: 2 H2O + 2e → H2 + 2OH– Na+ Cl– anode: 2Cl– → Cl2 + 2e net: 2H2O + 2 Cl– → H2 + 2OH– + Cl2used systems by author
8 Ti/RuIr ┤ Fe2+/Fe3+ ‡ S ≡ R ‡ Fe2+/Fe3+ ├ Ti/RuIr Veerman et al. [this chapter] NaCl / HCl ← → ← NaCl / HCl cath.: Fe3+ + e → Fe2+
Cl– Na+ Cl– anode: Fe2+ → Fe3+ + e net: nil
9 Ti/RuIr ┤ Fe(CN)63– / ≡ R ‡ S ≡ Fe(CN)6
3– / ├ Ti/RuIr Veerman et al. [Chapter 3 and 5] Fe(CN)6
4– → ← → Fe(CN)64– cath.: Fe(CN)6
3– + e → Fe(CN)64–
NaCl Na+ Cl– Na+ NaCl anode: Fe(CN)64– →Fe(CN)6
3– + e net: nil 10 Ti/RuIr ┤ NaCl ≡ R ‡ S ≡ NaCl ├ Ti/RuIr Veerman et al. [Chapter 6] → ← → Fe(CN)6
4– cath.: 2 H2O + 2e → H2 + 2OH– Na+ Cl– Na+ NaCl anode: 2Cl– → Cl2 + 2e net: 2H2O + 2 Cl– → H2 + 2OH– + Cl2suggested systems
11graphite
┤ Fe2+/Fe3+ ‡ S ≡ R ‡ Fe2+/Fe3+ ├ graphite Veerman et al. [this chapter] NaCl / HCl ← → ← NaCl / HCl cath.: Fe3+ + e → Fe2+
Cl– Na+ Cl– anode: Fe2+ → Fe3+ + e net: nil
12graphite
┤ Fe(CN)63– / ≡ R ‡ S ≡ Fe(CN)6
3– / ├ graphite Veerman et al. [this chapter] Fe(CN)6
4– → ← → Fe(CN)64– cath.: Fe(CN)6
3– + e → Fe(CN)64–
NaCl Na+ Cl– Na+ NaCl anode: Fe(CN)64– → Fe(CN)6
3– + e net: nil
60
Chapter 4
This reversal can be avoided by taking a homogeneous redox couple with inert electrodes. This may be platinized titanium for both electrodes, special coated titanium for specifi c anode and cathode and carbon or steel for the cathode. Jagur-Grodzinski and Kramer used platinized carbon electrodes in their so called ‘REF system’, a combination of a RED system and the electrode system of a fuel cell. At the anode water is oxidized to O2 and at the cathode oxygen from air is reduced to water. Because the electrode solution contained NaCl, it is also possible that Cl2 is evolved at the anode. Veerman et al. used a system with FeCl2 and FeCl3 in a NaCl bulk as described in Section 4.2.2.1, the system K4Fe(CN)6 with K3Fe(CN)6 in a NaCl bulk (Chapter 3 and 5) and also a H2/Cl2 generating system with only NaCl (Chapter 6).
Second, the alternative for the systems with opposite electrode reactions are the systems with gas generation. The disadvantage of these systems is the loss of energy due to these reactions; a signifi cant number of cells are required to overcome the cell equilibrium voltage before electricity production is possible. On laboratory scale the problem can be solved by using a small number of cells together with an external power supply. The virtual RED voltage (the voltage without the losses at the electrodes) is obtained from a pair of reference electrodes in the electrode compartments near to the outer membranes. Weinstein and Leitz13, Wick14, Loeb15, Metha16 and Suda et al.17 reported such systems. At the cathode hydrogen is evolved and at the anode chlorine is evolved if a NaCl solution (or sea water) is used in the electrode compartments. A possible succeeding reaction is hypochlorite and chlorate formation18. Turek et al. avoided the formation of chlorine by using an electrode rinse solution with Na2SO4
19,20. In this case oxygen is generated at the anode.
4.2.1.2. Membranes of the described electrode systemsThe sequence of the membranes in a RED stack is always alternating, but for the outer membranes – confi ning the electrode system - there are some requirements. The systems described in literature are given in Table 4.1. Some authors (Weinstein and Leitz13 and Suda et al.17) used seawater in the electrode compartments and applied two diff erent outer membranes, ensuring in this way an alternating system of sea and river water compartments. However, the generated Cl2 and ClO- are discharged into the sea water which is unacceptable from the viewpoint of safety, health and environment (SHE). Also the formation of Cl2 requires the application of chlorine resistant outer membranes.
Another possibility is to use a closed electrode system; we used a closed electrode rinse containing NaCl with CEMs as outer membranes (Chapter 6). In this case the negative ClO- is confi ned together with the Cl2 in the electrode rinse. Although there is no direct discharge

61
Reverse electrodialysis: Evaluation of suitable electrode systems
of these products to sea water, the problem of disposing these chemicals is not solved. Pattle6 used a CuSO4 solution and in Table 4.1 it is seen that the Cu2+-ions are maintained in the electrode compartments by the outer AEMs. Al though an AEM (with positively fi xed charges) is slightly permeable for monovalent (positive) co-ions, the bivalent positively charged Cu2+-ions are strongly excluded and Cu2+-loss is expected to be relatively low but not to be negligible in terms of SHE. The SO4
2- in the electrode system will be exchanged rapidly for Cl− from the sea water. This exchange has no eff ect on the functioning of the system as long as the Cu2+ ions stay in the electrode compartments.
Jagur-Grodzinski and Kramer10 also used active metal electrodes (zinc) but their design was improved by taking Cl− as anion. Turek and Bandura19 described a system with a Na2SO4 electrode rinse in combination with anion exchange outer membranes, evolving H2 at the cathode and in fi rst instance O2 at the anode. In such systems the SO4
2– can be exchanged for Cl−. This can cause generation of Cl2 because after some time there is enough Cl− in the electrode rinse solution (>5 g/L) to generate Cl2.
We conclude: if there is a closed electrode rinse loop, it is possible to contain only one type of ion (anion or cation) in the combined electrode compartments. In this case, the outer membranes should be of the same kind (both AEM or both CEM) and the ionic charge transport between the water compartments to the electrode rinse solution is done respectively by Cl− or by Na+.
4.2.2. Self-developed systemsIn our laboratory, we used three diff erent electrode rinse solutions, always with the same DSA (dimensionally stable anode) type electrodes: titanium mesh electrodes, coated with Ru–Ir mixed metal oxides. These electrodes are suitable as anode as well as cathode and therefore current reversal is allowed. The fi rst electrode rinse solution was unpractical for laboratory use; the other two are described in Chapter 3, 5 and 6.
4.2.2.1. Fe2+ / Fe3+ in NaCl−HClIn order to avoid the large overvoltages of gas generating systems, we fi rst used the system Fe2+/Fe3+ in a NaCl bulk together with the mentioned inert electrodes. For an electrode rinse containing FeCl2 (0.05 mol.l-1), FeCl3 (0.05 mol.l-1) and NaCl (0.5 mol.l-1), the resulting pH was 2.4. The disadvantage of this system is that O2 oxidizes Fe2+ to Fe3+ and H+ diff uses through the outer membranes, both causing an increase of the pH. After prolonged use, the electrode rinse solution assumed a red brownish color which can be explained by the formation of iron(III) oxyhydroxides. Oxidation can be decreased by means of an airtight system and the formation of insoluble salts can be avoided by controlling the pH to a
62
Chapter 4
low value (<2.3) by the addition of HCl. However, buff ering with HCl is diffi cult because anion exchange membranes are somewhat permeable for H+ and a constant supply of HCl is necessary. In this way the pH of the effl uent decreases which is unacceptable from an environmental viewpoint. A possible solution is the use of an external electrodialysis system with bipolar membranes, generating NaOH as well as HCl. The NaOH can be directed to the output stream and the HCl to the electrolyte. This process is pH neutral and there are no environmental implications. An internal electrodialysis system with bipolar membranes (built in the RED stack) for the same purpose is patented by Hamelers et al.21.
4.2.2.2. [Fe(CN)6]4– / [Fe(CN)6]3– in NaClFor the development and testing of RED systems in the laboratory the Fe2+/Fe3+ appeared to be rather unpractical. Therefore, we changed to a quite stable system: the hexacyanoferrate system:
[Fe(CN)6]3– + e [Fe(CN)6]4– ; E0 = 0.356 V vs. she (standard hydrogen electrode)
This system is described in Chapter 3, 5 and 6. Again, the inert electrodes were used as described in Section 4.2.2. To prevent loss of the iron complex we used CEMs as outer membranes. As long as the electrolyte is not in contact with the AEMs, there are no problems to be expected. However, in case of internal leakages, hexanoferrate ions may poison the AEMs in the stack by irreversible binding, eventually resulting in a decreased performance22.
4.2.2.3. NaClTo prevent the poisoning of the membranes, we changed to a pure NaCl solution in the electrode compartments. With this system, we characterized some membrane pairs for the use in RED stacks (Chapter 6). By applying CEMs as outer membranes, the generated Cl2 and OCl− was kept within the electrode system.
4.2.3. Proposal for a novel system: Fe2+/Fe3+ in NaCl−HCl with graphite electrodesThe formerly used DSA type electrodes (as described in Section 4.2.2) are designed for gas generation with low overvoltages. However, in our electrode systems with a reversible redox couple (the Fe2+/Fe3+ system and the [Fe(CN)6]4–/ [Fe(CN)6]3– system) gas evolution is undesirable.
Therefore, we suggest the use of graphite electrodes in these systems. Graphite electrodes have been extensively studied for use in redox fl ow batteries. One of these energy storage systems – the Fe/Cr system - uses the Fe2+/Fe3+ couple in the positive half-cell at low pH.

63
Reverse electrodialysis: Evaluation of suitable electrode systems
It appears that this system is well reversible in electrochemical sense23. Graphite felt is tested until current densities of 7000 A/m224 whereas the optimal current density at RED is much lower; we measured 40 A/m2 for our experiments (Chapter 5).Advantages of carbon electrodes to Ti/Ru/Ir electrodes are:- No use of exhaustible precious metals.- High overpotentials for gas formation. There is no risk of evolvement of dangerous and aggressive gasses (H2 , O2 and Cl2). Even with a reversible redo x couple this may be the case if the fl ow of the electrode rinse solution is obstructed locally.A disadvantage of graphite may be the lower mechanical stability with respect to DSA-type electrodes during longer operation times and the need for a proper current collecting system. Therefore, graphite electrodes may be advantageous for the Fe2+/Fe3+ system as well as for the [Fe(CN)6]4-/[Fe(CN)6]3- system. We added such systems to Table 4.3 (column 11 and 12). The rather good end scores encourages further research on these systems.
4.2.4. Symmetry in RED stacksIf the sea and river water inlets of a RED stack are interchanged, the polarity of the generated voltage is reversed. Consequently, the performance of the RED stack is unaltered if the generating system (GS) and the electrode system (ES) are both symmetrical. It is evident that the symmetrical properties of GS and ES are related.
4.2.4.1. Reversal of the electrical currentFor some electrode systems periodical reversal is obligatory as for systems with participating (one dissolving and one growing) electrodes. These electrode systems are designated as ‘obligatory reversal’ or ES1. Other systems consist of ‘universal’ electrodes where reversal is possible but not obligatory and are called ‘facultative reversal’ or ES2. A third case consists of the specifi c electrodes that are only suitable as cathode or as anode and in which reversal of the electrical current is not possible. These are denoted as forbidden reversal or ES3.
4.2.4.2. Interchange of the feed water in RED stacksJust as with the electrode system, we distinguish for the generating system between three types:
GS1: obligatory interchangeIn RED, growth of microorganisms in the stacks may be a serious problem. One approach to prevent this, is the periodical interchange of the river and sea water inputs. A compara-ble method is used for normal electrodialysis for desalination purposes and is called ‘elec-trodialysis reversal’ (EDR)25,26. From experiments in the future, it may be proven that such

64
Chapter 4
a procedure is necessary and we denote this system as ‘obligatory interchange” or as GS1.
GS2: facultative interchangeIf it should be proved that feed water interchange is not benefi cial for prevention of microbial growth or for breaking down polarization layers, then this interchange is not obligatory. If the GS is also symmetrical (with identical sea and river water compartments), the interchange of sea and river water is also not forbidden. In this case we have a ‘facultative interchange’ system or GS2.
GS3: forbidden interchangeBottlenecks in stack design for RED are the hydrodynamical fl uid resistance in all compartments and electrical resistance in river water compartments (Chapter 5). Optimization can lead to an asymmetric stack: sea water compartments may be thicker than river water compartments to reduce hydrostatic resistance without aff ecting electrical resistance substantially; also length and width can diff er. In such a stack interchanging sea and river water is possible for cleaning purposes but during this interchange the power production is low. We call this a ‘forbidden interchange‘ system GS3; although the adjective forbidden should not to be interpreted strictly.
4.2.5. Voltage losses in electrode systemsElectrode systems introduce a voltage loss in the RED system due to an overpotential, concentration polarization, an ohmic potential and a Nernst potential in each electrode compartment. In RED, current densities are relatively low (in our own experiments about 40 A/m2 (Chapter 5) ) and the losses due to concentration polarization and the ohmic potential are minimal. This is a general property of all studied electrode systems for RED. Further, with respect to voltage losses, these systems can be divided into low, high and medium loss electrode systems.
Low loss. In systems with opposite electrode reactions and a recirculating electrode rinse, there is no net chemical reaction and the Nernst voltages on both electrodes cancel each other out. In most of these systems no gas reactions are involved and the overpotentials are low. The total voltage loss in the whole electrode system is about 0.1 V; which is comparable to the generated voltage of 1-2 cells.
High loss. Electrode systems with gas evolution have higher voltage losses. For the electrolyses of water, the needed voltage based on the Nernst equation is 1.23 V, and the overpotentials are 0.03 V for H2 and 0.52 V for O2 evolution at a current density of 100 A/m227, together 1.78 V. Because the typical cell voltage is about 60 mV under power

65
Reverse electrodialysis: Evaluation of suitable electrode systems
generating circumstances, a number of 30 cells is used to overcome the voltage loss of this electrode system.
Medium loss. A special case is the so called ‘REF system’ of Jagur-Grodzinski and Kramer10 (system 5 in Table 4.1). At the anode O2 is evolved and at the cathode O2 is consumed, so there is no net generation of O2. Because there are separated anode and cathode compartments, the net reactions is: H2O H+ + OH-. This water dissociation in ions consumes about 15 kJ per mole28, much lower less than the 286 kJ per mole as necessary for splitting of water in H2 and O2
29. Therefore, this system is classifi ed in the category ‘medium loss’.
It should be noted that electrode losses are only important in stacks with a small number of cells as in laboratory equipments. In a stack with 1000 cells the loss of a high loss system is only 3%. High loss systems are assessed with minus 1 point with respect to low loss systems (Section 4.3.2-A5 and Chapter 4-Appendix A5 ).
4.3. Criteria for electrode systems
4.3.1. Method of assessmentIn the assessment of electrode systems, all relevant aspects concerning safety, health, environment (SHE), technical feasibility and economics are taken into account. In total 13 of these aspects were considered. A judgment in a scale from 0 (unacceptable) to 5 (good) is given. Because a commercial RED power plant was never built so far, there is no experience with the diff erent systems under real economical power producing circumstances. Nine diff erent electrode systems for RED are described in literature. To rank the quality of diff erent systems, there are a large number of methods. Data envelopment analysis (DEA) is a powerful method, especially because the diff erent weight factors are determined by the method itself. However, the consequence is that the method is only applicable if the number of systems is larger than the number of the aspects30,31 and that is not the case in our current topic.
Often a much more simple system is used: the end result is calculated as the arithmetic mean of the diff erent marks. However, to prevent compensation of bad marks by other good aspects, we achieved the total rating by calculating the geometric mean A of all (n) parts Ai. Each aspect Ai is judged with a mark in the range from 0 (unacceptable) to 5 (good).
(1)nn
iiAA
1
1
66
Chapter 4
In fact, the geometric mean is closely related to the logarithmic mean with the diff erence that the fi rst method can cope with zeros and the second method cannot. The advantages of this way of ranking are: (i) unacceptable systems are mentioned (judged as 0 on a single criterion) but always remain at the lowest level of the ranking, (ii) there is no need for ambiguous weight factors (iii) very diff erent variables can be used for diff erent items; even nominal and ordinal data can used together (iv) masking bad properties by averaging with good properties hardly occurs.
For most items, the generating system (N cells of the stack) is independent of the electrode system: each generating system can be combined with each electrode system. An important exception to this rule is the aspect of reversal as discussed in Section 4.3.2. This aspect requires a separate ranking system for stacks with obligatory, facultative and forbidden river and sea water reversal.
4.3.2. Assessed aspectsIn this paragraph, diff erent aspects are summarized. Applied criteria are included in the appendix. Aspects are classifi ed in three groups: i) technical feasibility (5 aspects), ii) safety, health and environment (SHE; 5 aspects) and iii) economics (3 aspects). A larger number o f aspects in a group make this group more important in the end score. Sometimes the classifi cation is rather arbitrary.
A Technical feasibility
A1 Reversal of the electrical current / interchange o f the feed waterDiscussed in Section 4. 2.4 are three types of electrode systems and three types of generating systems. Interchange of the feed water of a GS has consequences for the electrode system: by the reversal of the direction of the electrical current the anode becomes cathode and vise versa. Table 4.2 shows the scores of the diff erent combinations. All combinations are permitted except GS3-ES1.
Table 4.2. Marking the diff erent combinations of generating systems with electrode systems.
The combination GS1-ES3 is not strictly forbidden because of the following reason: Most modern electrodes are designed specifi cally as cathode or as anode. Cathodes can be
reversal direction of the electrical current
ES1: obligatory ES2: facultative ES3: forbidden
interchange GS1: obligatory 4 5 1
of the GS2: facultative 5 5 5
water inlets GS3: forbidden 0 5 5
67
Reverse electrodialysis: Evaluation of suitable electrode systems
made of diff erent materials like stainless steel and graphite; however, the requirements for anodes are much higher than for cathodes. Special mixed metal oxide electrodes based on thin layers of precious metals on titanium can act both as anode and as cathode but their lifetime is severely lowered if current reversal is applied32,33. In some patents for electrodialysis (ED), systems are described with composite electrodes34-36. These electrodes consist of an alternate array of strips of anode and cathode material. The power supply can be connected to the proper array on each side, dependent on the electrical current direction. In this way each used electrode material, as used in normal ED, can also be used also in the EDR mode, an ED method where the current is reversed periodically to prevent scaling on the membranes. Composite electrodes can be used in principle also for RED to cope with current reversal due to interchange of sea water and river water. Therefore, this ‘forbidden’ combination GS1-ES3 is judged with 1 point.The combination GS1-ES1 is not a defi nitely ideal because the GS and the ES may demand diff erent switch frequencies and therefore, only 4 points are noted.
A2 Stability of anolyte/catholyteMost anolytes/catholytes as listed in Table 4.1, contain only stable inorganic ions. The exception is the electrolyte with the hexacyanoferrate redox system. The complex ions in this solution are able to decompose and to form stable insoluble complexes with many multivalent metal ions with the risk of poisoning the membranes.
A3 Gas formation at the electrodesGas formation (Cl2 and O2 at the anode and H2 at the cathode) can cause problems at the electrodes (electrical obstruction) and Cl2 is highly corrosive. Besides this, Cl2 formation has a negative environmental value (again called in aspect B3) and H2 is an explosion hazard (again called in aspect B1).
A4 Participating electrodesParticipating electrodes are already counted at the reversal item. However, dissolving and plating (growing) should be reversible many thousands of times. For example, it is known that Zn is a diffi cult metal in this aspect and special provisions should be taken with the electrode rinse.
A5 Electrical properties of the electrode system
Voltage lossAs stated in Section 4.2.5, electrode systems can cause low, medium or high losses. If at both electrodes opposite electrochemical reactions occur in the same electrolyte, the

68
Chapter 4
voltage loss is low; otherwise this loss is high. For a large stack, this voltage loss is a minor problem.
Resistance of the electrode systemElectrodes are normally made from good conducting materials. An exception is the Ag/AgCl electrode with a thick AgCl layer where the Ag+ has to diff use from the solution to the Ag surface. This system was described by Audinos11,12 and included as system nr. 3 in Table 4.1.
B Safety, health and environment
B1 SafetyH2 is explosive and especially dangerous in closed spaces as sea containers or units for underwater operation.
B2 HealthToxicity is judged in case of skin and eye contact, swallowing and inhalation. Especially organic redox couples like hydroquinone/1,4-benzoquinone can be a risk if in contact with the skin. The same holds true for acidifi ed solutions of the couple Fe2+/Fe3+. Nearly all electrolytes are toxic if swallowed except NaCl solutions. The most probable danger of inhalation is Cl2; HCN can be evolved under extreme conditions (low pH, UV-light) from the [Fe(CN)6]4-/[Fe(CN)6]3- couple.
B3 Environment: normal exhaust of Cl2 , ClO− and ClO3−
If sea water or NaCl is used in the electrode system without a reversible redox couple, Cl2 can be evolved at the anode and H2
at the cathode. If anolyte and catholyte are combined, ClO− is formed and there is the possibility of formation of ClO3
− 18. Sometimes these products are useful (e.g. as biocide) but mostly they are unwanted. To prevent contamination of the outlet streams with ClO− and ClO3
−, the outer membranes should be of the CEM type. However, due to the non ideal behavior of these membranes, there is also a small transport of these anions into the effl uent. If other ‘safe’ salts (Na2SO4, NaNO3 etc.) are used in the electrode rinse solution, there is still the danger of Cl2 evolvement because Cl− can diff use from the sea water compartment to the electrode compartment through the CEM.
Even in the presence of a redox couple, Cl2 formation is not excluded totally if Cl− is present in the electrode rinse solution because the redox couple can be exhausted locally due to obstructions in the fl ow path in the electrode compartment.

69
Reverse electrodialysis: Evaluation of suitable electrode systems
If seawater is used as electrolyte, there is the possibility of a closed electrode rinse loop or an open single pass system. The last system is unacceptable from environmental viewpoint due to the discharge of Cl2.
B4 Environment: normal exhaust other chemicalsIn principle, ions can be blocked by a proper choice of the outer membranes although blocking of co-ions is not 100%. Especially protons can easily pass the most types of AEMs. Technically, the problems of transport from unwanted species from the electrode compartments to the sea or river water compartments and vice versa can be solved by using double outer membranes. Between these outer membranes a guard electrolyte is recirculated. Disadvantageous is the need of conditioning this guard electrolyte.
B5 Environment: accidental exhaustLoss of anolyte/catholyte may occur by accident: rupture of the outer membranes, human errors and defects in the electrode rinse pumping system are possible causes. The eff ects of outer membrane damaging can be decreased by using double outer membranes as described above under B4. Defects in the electrode rinse system can be controlled by leakage tanks. Moreover, a RED installation is built modular and in event of an accident only a small part of the electrolyte is drained.
C Economics
C1 Special provisions for the anolyte/catholyteThe most frequent measures to be taken are:
a) pH controlAt low pH, H+ can diff use easily through AEMs to the output stream and new H+ should be added to the electrolyte. This can be achieved by adding HCl; an environmentally better way is the use an external electrodialysis system with bipolar membranes generating NaOH and HCl. The NaOH can be directed in the output stream and the HCl to the electrolyte. This process is pH neutral.
b) Redox controlIn redox systems as Fe2+/Fe3+, the optimal Fe2+/Fe3+ ratio is about unity. However, by oxidation by air this ratio may be aff ected. An airtight system should be used and/or a reduction system should be incorporated.

70
Chapter 4
c) Concentration controlIn fact, each anolyte/catholyte should be controlled, especially electrolytes containing monovalents ions like NO3
− which can be exchanged rapidly with Cl− from the sea water.
C2 Price of the electrodesInert electrodes can be made of massive platinum, sometimes with added ruthenium or iridium for mechanical strength. Such electrodes are used in laboratories as measuring electrode or as working electrode in diff erent analytical processes. These electrodes are very expensive and eff orts have been made to platinize other metals or carbon in such a way that the inert properties of platinum are combined with the economics of other metals. This resulted in platinum coated titanium with 20-50 grams platinum per square meter. These electrodes are rather expensive and not catalytic enough for gas evolving processes. The next step was the invention of the so called ‘dimensional stable electrode’ (DSA) for the chlor-alkali membrane process37.
Modern stable electrodes consist of a metal support (mostly titanium) with a mixed metal oxide (MMO) layer38. The MMO consist of two components: one is a catalytic and conducting (e.g. RuO2, IrO2, PtO0.12), the other is inert and nonconducting (e.g. TiO2). The catalytic part of the electrode cover is developed for special electrochemical purposes like Cl2 or O2 evolution. On these electrodes the amount of precious metal is only 10-12 g/m2. Moreover the price of iridium and especially of ruthenium is much lower than of platinum. This may result in acceptable prices.
A further reduction of electrode price can be achieved by using partial electrodes: electrodes with a reduced surface by a proper dimensioning of a stretched metal process. In RED, partial electrodes can be used because the current density in the RED process is much lower than in other electrochemical processes for which these electrodes are developed.
Graphite electrodes are rather inexpensive. However, at larger surfaces, current collection may be a problem and results in a higher price.
C3 Lifetime of the electrodesMarks for the aspects of price (C2) and lifetime (C3) are generally opposite. In our used criteria (Appendix) all DSA type electrodes get the same judgment (mark=5). The actual lifetime of these electrodes is dependent on current direction (anodic or cathodic use), electrolyte and current density. Fields of application of electrodes with long erasing time are water desalination with electrodialysis (ED) and the chlor-alkali process. In normal
71
Reverse electrodialysis: Evaluation of suitable electrode systems
ED for desalination, a 5-year life of a platinum plated electrode is normal. Anode life was generally less than cathode life39. In fact all modern electrodes are MMO covered on titanium (DSA type). For chlorine evolving DSAs, as used in the chlor-alkali industry, typical current densities are more then 3000 A/m2 in the membrane cell process40. In this case the lifetime of DSAs is guaranteed to be up to 10 years41. In contrast, optimal current densities in our RED process were 40 A/m2 (Chapter 5). Therefore, lifetime of chlorine evolving DSAs may be expected to be much more than 10 years for RED. For oxygen evolution, Chen and Chen42 predicted for their Ti/RuO2–Sb2O5–SnO2 electrode a lifetime of 8.3 years at a current density of 200 A/m2 and even 27 years at 100 A/m2. These lifetimes are also an indication for use in RED electrode systems. The foregoing refers to unidirectional use of the electrodes. Current reversal (as in EDR) generally decreases electrode lifetime substantially39,43.
4.4. Discussion
4.4.1. Described electrode systemsDescribed electrode systems in literature for RED are not yet suitable for use in economical operated RED systems. A RED system should fulfi ll the requirements on safety, health, environment, technical feasibility and economics. In Table 4.3 the formulated criteria are applied to the diff erent described electrode systems from Table 4.1 (for GS1 in bold, for GS2 regular and for GS3 in italics). The row ‘reversal to the electrical current’ (A1) is split up in three parts for the combination of the diff erent generating systems with the electrode system in question. The same goes for the rows with the end-scores and ranks.
Table 4.3 shows that from the described used systems (column 1-10), the iron system with Ti/Ru,Ir electrodes (column 8) is the best system in combination with each of the three generating systems.The hexacyanoferrate system with the same electrodes (column 9) may be useful in laboratory equipment. The table also indicates that by application of graphite electrodes the score of these systems is approached (column 11 and 12).
4.4.2. Proposal for improved electrode systemsPossible improvements are:
a) Use of graphite electrodesAs indicated in the Sections 4.2.3 and 4.4.1, the us e of graphite electrodes in combination with homogeneous redox system like Fe2+/Fe3+ has good prospects.

72
Chapter 4
desc
ribed
sys
tem
s in
lite
ratu
re
used
sys
tem
s by
aut
hor
sugg
este
d sy
stem
s
1
23
45
67
89
1011
12
Pa
ttle
W
eins
tein
Audi
nos
Jagu
r-G
Jagu
r-G
Ture
k S
uda
Veer
man
Veer
man
Veer
man
Veer
man
Ve
erm
an
a
noly
te /
cath
olyt
eCu
SO4
NaC
lN
aCl
ZnCl
2N
aCl
Na 2SO
4N
aCl
Fe3+
/Fe2+
HCF
#)N
aCl
Fe3+
/Fe2+
H
CF #)
b
ulk
N
aCl-H
ClN
aCl
N
aCl-H
ClN
aCl
c
atho
deCu
Ti/P
t *)Ag
/AgC
lZn
C/Pt
/O2
Ti/P
t C
Ti/R
u,Ir
Ti/R
u,Ir
Ti/R
u,Ir
grap
hite
grap
hite
a
node
Cu
Ti/P
t *)Ag
/AgC
lZn
C/Pt
Ti/P
t C
Ti
/Ru,
IrTi
/Ru,
IrTi
/Ru,
Irgr
aphi
tegr
aphi
te
type
ES1
ES2
ES1
ES1
ES3
ES2
ES2
ES2
ES2
ES2
ES2
ES2
T e
c h
n i c
a l
f e
a s
i b
i l i
t y
G
S 1A
1 Rev
ersa
l of t
he e
l. cu
rren
t4
54
41
55
55
55
5G
S 2A
1 Re
vers
al o
f the
el.
curr
ent
55
55
55
55
55
55
GS 3
A 1Reve
rsal
of t
he e
l. cu
rren
t0
50
05
55
55
55
5al
lA
2 Sta
bilit
y of
ano
lyte
/cat
holy
te5
55
55
55
53
55
3al
lA
3 Gas
form
atio
n
52
55
44
25
52
55
all
A4
Part
icip
atin
g el
ectr
odes
4
53
25
55
55
55
5al
lA
5 Ele
ctric
al p
rope
rtie
s5
44
53
44
55
45
5S
a f e
t y,
h
e a
l t h
a
n d
e n
v i
r o n
m e
n t
(S H
E)
all
B 1 Hyd
roge
n fo
rmat
ion
53
55
53
35
53
55
all
B 2 Toxi
city
4
35
43
53
44
34
4al
lB 3
Nor
mal
exh
aust
of C
l 2 etc
.5
05
54
40
55
15
5al
lB 4 N
orm
al e
xhau
st o
ther
che
m.
45
44
55
54
45
44
all
B 5 Acc
iden
tally
exh
aust
.3
55
45
55
43
54
3E
c o
n o
m i
c s
all
C 1 Sp
ecia
l pro
visi
ons
43
44
24
33
43
34
all
C 2 Pr
ice
of th
e el
ectr
odes
51
25
11
54
44
33
all
C 3 Life
tim
e of
the
elec
trod
es2
42
24
42
55
53
3G
S 1Sc
ore
4.1
0.0
3.9
4.0
3.2
3.9
0.0
4.5
4.3
3.5
4.2
4.1
Ra
nk4
117
610
711
12
93
5G
S 2Sc
ore
4.2
0.0
4.0
4.1
3.6
3.9
0.0
4.5
4.3
3.5
4.2
4.1
Ra
nk4
117
69
811
12
103
5G
S 3Sc
ore
0.0
0.0
0.0
0.0
3.6
3.9
0.0
4.5
4.3
3.5
4.2
4.1
Ra
nk8
88
86
58
12
73
4
Tabl
e 4.
3. R
anki
ng th
e sy
stem
s des
c rib
ed in
lite
ratu
re fo
r pra
ctic
al u
se. T
he m
arks
in th
e ro
ws A
1 ar
e de
pend
ent o
n th
e ge
nera
ting
syst
em (G
S 1, GS 2 o
r GS 3).
The
sam
e ho
lds f
or th
e sc
ore/
rank
row
s at t
he b
otto
m.
*)
Ti/P
t ass
umed
#)
HCF
= h
exac
yano
ferr
ate
= Fe
(CN
) 63-/F
e(CN
) 64-

73
Reverse electrodialysis: Evaluation of suitable electrode systems
b) Improved electrodes of the DSA type- Longer lifetime.For our experiments we used titanium mesh end electrodes, coated with Ru–Ir mixed metal oxides (Chapter 3, 5 and 6). These electrodes are reversible (i.e. current reversal is possible) and therefore usable for all types of stacks. Lifetime of these electrodes is more than 10 years under the applied current density (40 A/m2). An improvement of the lifetime with a factor 5 can be achieved with special Ir-MMO (mixed metal oxide) coated titanium anodes and Ru-MMO coated cathodes; another option is to use the extra stability of these electrodes for reducing the cost of these electrodes by decreasing the surface of the electrodes (the so called partial electrodes). A limitation of this system is that frequent current reversal during longer times is not possible with these electrodes.
- High overvoltages for Cl2 / O2 evolutionThe success of DSA type electrodes is due to a combination of high mechanical and electrochemical stability with good catalytic properties and low overvoltages for special electrode reactions. Especially such anodes are developed for Cl2 and O2 generation. However, in a RED process with a homogeneous redox couple (e.g. the Fe2+/Fe3+ or the system [Fe(CN)6]4- / [Fe(CN)6]3-), these reactions are unwanted. Therefore, high overvoltages for gas evolution are favorable to the process. It requires some extra development to realize this with DSA type electrodes.
- Specifi c composite electrodes for REDFor use in normal electrodialysis some systems with composite electrodes are patented34-36. These systems allow current reversal with electrodes which are specifi cally usable as cathode or anode. In each current direction only one part of each electrode is used. Eventually the unused part can be protected with a low potential diff erence between this part and the adjacent part in operation.
c) New homogeneous redox coupleHomogeneous redox systems (e.g. the system [Fe(CN)6]4- / [Fe(CN)6]3-) do not cause net chemical reactions and therefore the power losses are low. Most organic homogeneous redox couples involve protons in their reactions and special measures should be taken to control the pH. However, there are many iron complexes and possibly candidates are available that satisfy all mentioned criteria. The use of graphite electrodes may be considered again in this case.
d) Capacitive electrodesIn the last decades, special high ion absorbing carbon has been developed for use in

74
Chapter 4
super capacitors44-46 and in capacitive deionization (CDI)47,48. If this material is used as electrode in a RED stack, during a certain time an internal ionic current can persist. The electrodes behave as a capacitor and during that time there is also an external electrical current. After some time, the process should be inverted by changing the sea water and the river water feed. It is obvious that the changing time is related to the residence time in the system. Assuming that time to be one minute, then a half period (the time between two feed interchanges) should be at least about 60 minutes. Current RED stacks operate at maximum power output with a current density of about 40 A/m2 or 144000 Coulomb per m2 per hour. The cathode should adsorb then 144000/Ғ= 1.5 mol Na+ and on the anode the same amount of Cl− (Ғ is the Faraday const ant; 1 Ғ = 96 485 C/mol). Typical specifi c capacitances are reported of 100–200 F/g carbon in aqueous solution44-46. Using the highest value of 200 F/g, for an uploading to 1 V, there is 200 C/g carbon needed. For a one hour operation, the electrodes should consist of 720 grams carbon per m2. This seems a realistic value for further development of such a system.
In principle, the method is very clean and sustainable. Carbon aerogel electrodes may have lifetimes of more than 10 years49. A restriction of this system is the obligatory interchange. For optimal performance, the connected load should be adapted continuously during one cycle. This is possible with modern DC-DC converters. For normal electrodialysis, such a system is patented by Wei et al.50.
Brogioli succeeded in the reversal of the capacitive deionization (CD) technique51. The capacitor is formed by two activated carbon electrodes, immersed in the feed solution, alternately salt and fresh water. When fi lled with salt water, it is charged, and with fresh water it is discharged. Charging and discharging are promoted by the diff usion of ions and consequently there is a net energy gain.
e) Systems with a n electrode rinse solution containing carbon particles and/or ion exchange resin particles
These systems are described by Kedem et al. for use in normal electrodialysis and patented52,53. The electrode rinse solution contains about 1% (w/w) active carbon and 1% (w/w) cation exchange resin in a NaCl solution of about 2% (w/w). The authors suggest that this system is based on the reversible system
H+ + e ½ H2
The H2 gas, as evolved at the cathode is adsorbed by the carbon and transported to the

75
Reverse electrodialysis: Evaluation of suitable electrode systems
anode where the reverse reaction proceeds. The involved H+ is transported by the ion exchange resin:RH + Na+ RNa + H+
where RH is the resin in the acid form and RNa the resin in the salt form. The net reaction at the cathode and at the anode is therefore:
RH + Na+ + e RNa + ½ H2
4.5. Conclusions
In this work, self-developed electrode systems and electrode systems described in literature are compared on safety, health, environment, technical feasibility and economics. A robust system of judging the diff erent systems is presented. Applying this system to the described and used systems, a ranking was made of the diff erent electrode systems. It is shown that the applicability of an electrode system is related to the generating system. Three types of generating systems can be distinguished: systems with (i) obligatory, (ii) facultative and (iii) forbidden interchange of the feed water inlets. The highest rankings for all the three generating systems are found for the Fe2+/Fe3+ couple in a NaCl−HCl supporting electrolyte with bidirectional Ru/Ir covered titanium electrodes.
This system is not ideal and may be improved for application in commercially operating, large scale RED. There are fi ve interesting topics: (i) improved stable metal electrodes (with longer lifetime, suitable for current reversal and high overpotential for gas evolvement), (ii) a new homogeneous redox couple (e.g. an iron complex), (iii) a system with capacitive electrodes, (iv) a system with an electrolyte, containing carbon particles and/or ion exchange resin particles, and (v) the Fe2+/Fe3+ couple in combination with graphite electrodes. The last improvement seems to be the most realistic alternative; however, duration test should be performed under real RED conditions to prove that it has suffi cient mechanical and electrochemical stability.
AcknowledgementThis work was performed in the TTIW-cooperation framework of Wetsus, centre of excellence for sustainable water technology (www.wetsus.nl). Wetsus is funded by the Dutch Ministry of Economic Aff airs, the European Union Regional Development Fund, the province of Fryslân, the city of Leeuwarden and the EZ/Kompas program of the “Samenwerkingsverband Noord-Nederland”. The fi rst author would like to thank the Noordelijke Hogeschool Leeuwarden who facilitated this research by detaching him to Wetsus and the participants of the theme “Energy” for their fruitful discussions and their fi nancial support.
76
Chapter 4
Nomenclature
AbbreviationsAEM anion exchange membraneDC direct currentCEM cation exchange membraneCDI capacitive deionizationDEA data envelopment analysisDSA dimensionally stable anodeED electrodialysisEDR electrodialysis reversalEMF electromotive forceES electrode systemGS generating systemMMO mixed metal oxidePRO pressure retarded osmosisRED reverse electrodialysisshe standard hydrogen electrodeSHE safety, health and environmentSGP salinity gradient power
Defi nitionscompartment space between the membranescell combination of two membranes and two compartmentsgenerating system a number of N cells without the electrode systemelectrode system anode, cathode, electrode rinse and outer membranesstack a number of N cells with an electrode system
References Chapter 4
1 J.W. Post, H.V.M. Hamelers, C.J.N. Buisman, Energy recovery from controlled mixing salt and fresh water with a reverse electrodialysis system. Environ. Sci. Technol. 42 (2008) 5785-5790
2 G.L. Wick, W.R. Schmitt, Prospects for renewable energy from sea. Mar. Technol. Soc. J. 11 (1977) 16-21
3 Energy information administration; offi cial energy statistics from the U.S. government, www.eia.doe.gov
4 R.E. Pattle, Production of electric power by mixing fresh and salt water in the hydroelectric pile. Nature 174 (1954) 660-660
5 R.E. Pattle, Electricity from fresh and salt water - without fuel. Chem. Proc. Eng. 35 (1955) 351–354
6 R.E. Pattle, Improvements to electric batteries. Patent GB 731.729 (1955)
7 S. Loeb, Osmotic power plants. Science 189 (1975) 654–655
8 S. Loeb, Production of energy from concentrated brines by pressure retarded osmosis.1. Preliminary technical and economic correlations. J. Membr. Sci. 1 (1976) 49–63
9 J.W. Post, J. Veerman, H.V.M. Hamelers, G.J.W. Euverink, S.J. Metz, K. Nymeijer, C.J.N. Buisman, Salinity-gradient power: Evaluation of pressure-retarded osmosis and reverse electrodialysis. J. Membr. Sci. 288 (2007) 218–230
10 J. Jagur-Grodzinski, R. Kramer, Novel process for direct conversion of free energy of mixing into electric power. Ind. Eng. Chem. Process Des. Dev. 25 (1986) 443–449
11 R. Audinos, Inverse electrodialysis. Study of electric energy obtained starting with two solutions of diff erent salinity. J. Power Sources 10 (1983) 203–217
77
Reverse electrodialysis: Evaluation of suitable electrode systems
12 R. Audinos, Electric power produced from two solutions of unequal salinity by reverse electrodialysis. Ind. J. Chem. 31A. (1992) 348–354
13 J.N. Weinstein, F.B. Leitz, Electric power from diff erences in salinity: the dialytic battery. Science 191 (1976) 557–559
14 G.L. Wick, Power from salinity gradients. Energy 3 (19878) 95-100
15 S. Loeb, Method and apparatus for generating power utilizing reverse electrodialysis. Patent US 4.171.409 (1979)
16 G.D. Metha, Performance of present-day ion-exchange membranes for power generation using a saturated solar pond. J. Membr. Sci. 11 (1982) 107-120
17 F.Suda, T. Matsuo, D. Ushioda, Transient changes in the power output from the concentration diff erence cell (dialytic battery) between seawater and river water. Energy 32 (2007) 165-173
18 L.R. Czarnetzki, L.J.J. Janssen, Formation of hypochlorite, chlorate and oxygen during NaCl electrolysis from alkaline solutions at an RuO 2/TiO2 anode. J. Appl. Electrochem. 22 (1992) 315-324
19 M. Turek, B. Bandura, Renewable energy by reverse electrodialysis. Desalination 205 (2007) 67-74
20 M. Turek, B. Bandura, P. Dydo, Power production from coal-mine brine utilizing reversed electrodialysis. Desalination 221 (2008) 462-466
21 H.V.M. Hamelers, J.W. Post, S.J. Metz, Device and method for performing a reversed electrodialysis process. Patent WO 2007/094659 A1 (2007)
22 R.E. Lacey, Energy by reverse electrodialysis. Ocean Eng. 7 (1980) 1-47
23 M. Lopez-Atalaya, G. Codina, J.R. Perez, J.L. Vazquez, A. Aldaz, Optimization studies on a Fe/Cr redox fl ow battery. J. Power Sources 39 (1992) 147-154
24 V. Pupkevich, V. Glibin, D. Karamanev, The eff ect of activation on the electrochemical behaviour of graphite felt towards the Fe3+/Fe2+ redox electrode reaction. Electrochem. Comm. 9 (2007) 1924-1930
25 W.E. Katz, The electrodialysis reversal (EDR) process. Desalination 28 (1979) 31-40
26 V.D. Grebenyuk, O.V. Grebenyuk, Electrodialysis, from an idea to realization. Russ. J. Electrochem. 38 (2002) 906-910
27 International Critical Tables 1929, 6, 339
28 K. Nagasubramanian, F.P. Chlanda, Kang-Jen Liu, Use of bipolar membranes for generation of acid and base - an engineering and economic analysis. J. Membr. Sci. 2 (1977) 109-124
29 D.R. Lide (editor), Handbook of chemistry and physics, (CRC-press), 85th d (2004-2005), p. 5-18
30 A. Charnes, W.W. Cooper, E. Rhodes, Measuring the effi ciency of decision making units. Eur. J. Operational Research 2 (1978) 429-444
31 N. Adler, L. Friedman, Z. Sinuany-Stern, Review of ranking methods in the data envelopment anaysis context. Eur. J. Operational Research 140 (2002) 249-965
32 J.X. Qu, S.M. Liu, Electrode for electrodialysis. Desalination 46 (1983) 233-242
33 A.T. Kuhn, C.J. Mortimer, The effi ciency of chlorine evolution in dilute brines on ruthenium dioxide electrodes. J. Appl. Electrochem. 2 (1972) 283-287
34 W. Kwo-Weo Chen, Electrodialysis apparatus for fl uid treatment. Patent US 3.192.148 (1965)
35 K. Mihara, M. Kato, Polarity reversing electrode units and electrical switching means therefore. Patent US 3.453.201 (1969)
36 S.M. Jain, Polarity reversal electrodes. Patent US 4.461.693 (1984)
37 H.B. Beer, Electrode and coating therefore. Patent US 3.632.498 (1972) and Electrode having platinum metal oxide coating thereon, and method of use thereof. Patent US 3.711.385 (1973)
38 C.H. Comninellis, G.P. Vercesi, Characterization of DSA-type oxygen evolving electrodes: choise of a coating. J. Appl. Electrochem. 21 (1991) 335-345
78
Chapter 4
39 K. Price (ed.) (2003), Desalination handbook for planners, 3rd edn Ch. 4.8.9 RosTek Associates, Tampa, Florida
40 T.F. O’Brien, T.V. Bommaraju, F. Hine (2005) Handbook of Chlor-Alkali Technology, Volume 1, p. 33 Springer
41 S. Trasatti, Electrocatalysis: understanding the success of DSA. Electrochim. Acta 45 (2000) 2377-2385
42 X. Chen, G. Chen, Stable Ti/RuO2-Sb2O5-SnO2 electrodes for O2 evolution. Electrochim. Acta (2005) 4155-4159
43 A. Kraft, Electrochemical water disinfection: a short review. Electrodes using platinum group metal oxides. Platinum Metals Rev. 52 (2008) 177-185
44 G. Lota, T.A. Centeno, E. Frackowiak, F. Stoeckli, Improvement of the str uctural and chemical properties of a commercial activated carbon for its application in electrochemical capacitors. Electrochim. Acta 53 (2008) 2210-2216
45 E. Frackowiak, F. Béguin, Carbon materials for the electrochemical storage of energy in capacitors. Carbon 39 (2001) 937-950
46 C. Kim, Y.O. Choi, W.J. Lee, K.S.Yang, Supercapacitor performances of activated carbon fi ber webs prepared by electrospinning of PMDA-ODA poly(amic acid) solutions. Electrochim. Acta 50 (2004) 883-887
47 J.C. Farmer, D.V. Fix, G.V. Mack, R.W. Pekala, J.F. Poco, Capacitive Deionization of NaCl and NaNO3 solutions with carbon aerogel electrodes. J. Electrochem. Soc. 143 (1996) 159-169
48 L.D. Zou, L.X. Li, H.H. Song, G. Morris Using mesoporous carbon electrodes for brackish water desalination. Water Research 42 (2008) 2340-2348
49 T.J. Welgemoed, C.F. Schutte, Capacitive Delonization Technology (TM): An alternative desalination solution. Desalination 183 (2005) 327-340
50 C. Wei, D. Yu, C. Wei, R. Xiong, L. Cao, Non-Faraday based systems, devices and methods for removing ionic species from liquid. Patent WO 2008/030646 A2 (2008)
51 D. Brogioli, Extracting Renewable Energy from a Salinity Diff erence Using a capacitor. Phys. Rev. Lett. 103 (2009) 058501 1-5
52 O. Kedem, G. Tanny, Y. Maoz, A simple electrodialysis stack. Desalination 24 (1978) 313-319
53 O. Kedem, T. Robinson, Electrodialysis device. Patent US 4.226.688 (1978)

79
Reverse electrodialysis: Evaluation of suitable electrode systems
Appendix
Applied criteria.
The used marks are: good=5; reasonable=4; acceptable=3; poor=2; bad=1 and unacceptable=0.In some cases minus signs are used. These mean that their value should be subtracted from the maximal score of 5.
A.Technical feasibility
A1. Reversal of the electrical currentscore: Already given in Table 2
A2 Stability of the anolyte/catholyte score: no instable ions 5 [Fe(CN)6]4- , [Fe(CN)6]3- 4
A3. Gas formation at the electrodesscore: no gas 5O2 formation -1Cl2 formation -2H2 formation -1
A4. Participating electrodesscore: no participating electrodes 5participating without problems (Cu) 4participating with minor problems (Ag/AgCl) 3participating with more severe problems (Zn) 2participating with severe problems 0
A5. Electrical properties of the electrode systemscore: no problems 5net chemical reaction -1
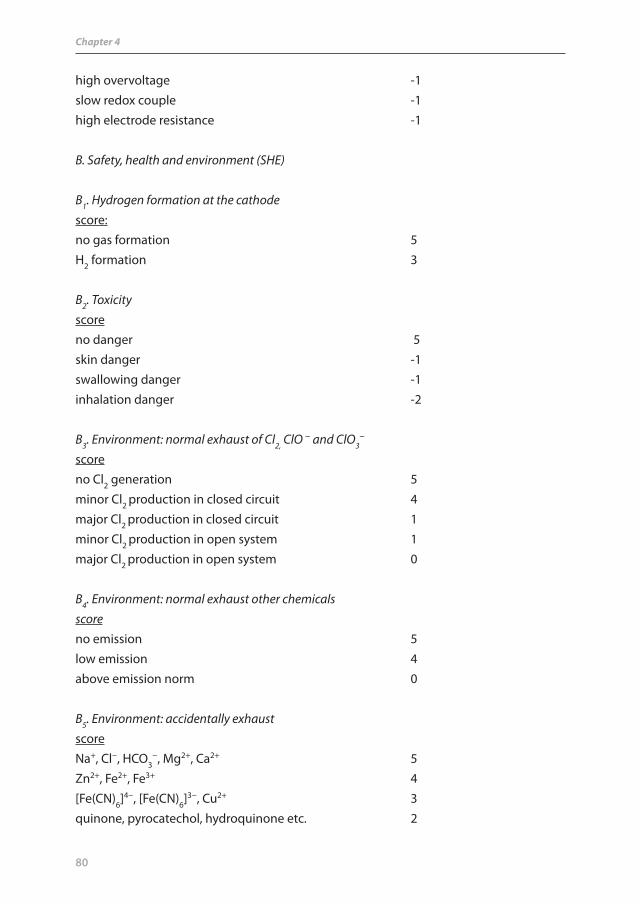
80
Chapter 4
high overvoltage -1slow redox couple -1high electrode resistance -1
B. Safety, health and environment (SHE)
B1. Hydrogen formation at the cathodescore: no gas formation 5H2 formation 3
B2. Toxicityscore no danger 5skin danger -1swallowing danger -1inhalation danger -2
B3. Environment: normal exhaust of Cl2, ClO − and ClO3−
score no Cl2 generation 5minor Cl2 production in closed circuit 4major Cl2 production in closed circuit 1minor Cl2 production in open system 1major Cl2 production in open system 0
B4. Environment: normal exhaust other chemicalsscore no emission 5low emission 4above emission norm 0
B5. Environment: accidentally exhaustscore Na+, Cl−, HCO3
−, Mg2+, Ca2+ 5Zn2+, Fe2+, Fe3+ 4[Fe(CN)6]4−, [Fe(CN)6]3−, Cu2+ 3quinone, pyrocatechol, hydroquinone etc. 2

81
Reverse electrodialysis: Evaluation of suitable electrode systems
C. Economics
C1. Special provisions for the anolyte/catholytescore:no provisions 5pH control -1concentration control -1air supply -1Cl2, ClO− and ClO3
− discharge -2
C2. Price of the electrodesscore: Ti, C, Zn, Cu 5DSA type 4 graphite 3Ag 2platinized Ti or C 1 C3. Lifetime of the electrodesscore: DSA type 5platinized Ti or C 4graphite 3participating electrodes, carbon 2

82

83
Chapter 5
Reverse electrodialysis: Performance of a stack with 50 cells on the mixing of sea and river water
Abstract The purpose of reverse electrodialysis (RED) is to produce electricity upon the mixing of two solutions. We studied the power density (W/m2) and the energy effi ciency (the amount of energy produced from specifi ed volumes of river and sea water in relation to the thermodynamic maximum). With a stack of 50 cells (of 10 cm X 10 cm), a power density of 0.93 W/m2 was obtained with artifi cial river water (1 g NaCl/L) and artifi cial sea water (30 g NaCl/L), which is the highest practical value reported for RED. This value is achieved due to an optimized cell design using a systematic measurement protocol.
The main factor in the power density is the cell resistance. With the used membranes (Fumasep FAD and FKD) and a spacer thickness of 200 μm, a cell resistance of 0.345 Ω is measured under RED conditions. This is about one and a half times the value as expected from the contribution of the individual components. This high value is probably caused by the shielding eff ect of the spacers. The largest contribution to this resistance (about 45%) is from the river water compartment.
The hydrodynamic loss resulted in a maximal net power density of about 0.8 W/m2 at a fl ow rate of 400 mL/min. At this optimum the consumed power for pumping is 25% of the total generated energy. The majority of the pump power is lost in the manifolds.
Multistage experiments were performed at maximal power conditions (a current density of about -30 A/m2 and at a fl ow rate of 300 mL/min). At these conditions the theoretical energy effi ciency is maximal 50%. In practice however, the energy effi ciency of a single stack is 9%. The effl uent concentrations of the so operated stack are used for a second experiment and so on, simulating a multi stage operation. With 3 stages a cumulative energy effi ciency of 18% is achieved. A fourth stage did not increase this value. The power density of the 3 stages together was 50% of the power density of the fi rst stage, indicating that energy effi ciency and power density are counteracting.
Further increase of power density and energy effi ciency can be obtained with a better spacer and manifold design. A more open spacer is benefi cial for RED in two ways: less shielding and lower pressure drop. Less shielding decreases the electrical resistance of the cell. A lower pressure drop permits the use of thinner water compartments, resulting again in a decreased electrical resistance of the cell and an improvement of the power density.
Published as
J. Veerman, M. Saakes, S.J. Metz and G.J. Harmsen
Reverse electrodialysis: performance of a laboratory device with 50 cells on the mixing of sea and river water
Journal of Membrane Science 327 (2009) 136-144
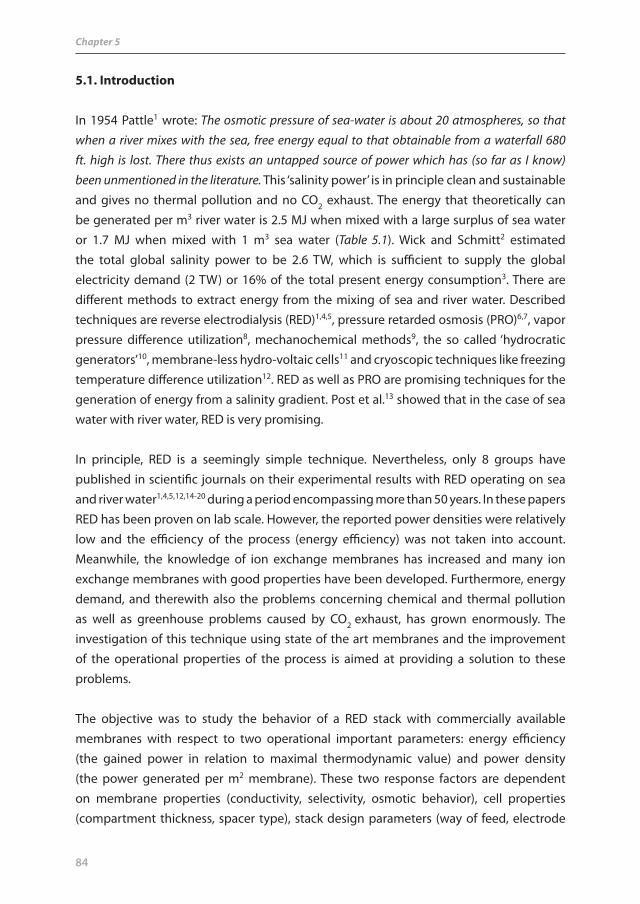
84
Chapter 5
5.1. Introduction
In 1954 Pattle1 wrote: The osmotic pressure of sea-water is about 20 atmospheres, so that when a river mixes with the sea, free energy equal to that obtainable from a waterfall 680 ft. high is lost. There thus exists an untapped source of power which has (so far as I know) been unmentioned in the literature. This ‘salinity power’ is in principle clean and sustainable and gives no thermal pollution and no CO2 exhaust. The energy that theoretically can be generated per m3 river water is 2.5 MJ when mixed with a large surplus of sea water or 1.7 MJ when mixed with 1 m3 sea water (Table 5.1). Wick and Schmitt2 estimated the total global salinity power to be 2.6 TW, which is suffi cient to supply the global electricity demand (2 TW) or 16% of the total present energy consumption3. There are diff erent methods to extract energy from the mixing of sea and river water. Described techniques are reverse electrodialysis (RED)1,4,5, pressure retarded osmosis (PRO)6,7, vapor pressure diff erence utilization8, mechanochemical methods9, the so called ‘hydrocratic generators’10, membrane-less hydro-voltaic cells11 and cryoscopic techniques like freezing temperature diff erence utilization12. RED as well as PRO are promising techniques for the generation of energy from a salinity gradient. Post et al.13 showed that in the case of sea water with river water, RED is very promising.
In principle, RED is a seemingly simple technique. Nevertheless, only 8 groups have published in scientifi c journals on their experimental results with RED operating on sea and river water1,4,5,12,14-20 during a period encompassing more than 50 years. In these papers RED has been proven on lab scale. However, the reported power densities were relatively low and the effi ciency of the process (energy effi ciency) was not taken into account. Meanwhile, the knowledge of ion exchange membranes has increased and many ion exchange membranes with good properties have been developed. Furthermore, energy demand, and therewith also the problems concerning chemical and thermal pollution as well as greenhouse problems caused by CO2 exhaust, has grown enormously. The investigation of this technique using state of the art membranes and the improvement of the operational properties of the process is aimed at providing a solution to these problems.
The objective was to study the behavior of a RED stack with commercially available membranes with respect to two operational important parameters: energy effi ciency (the gained power in relation to maximal thermodynamic value) and power density (the power generated per m2 membrane). These two response factors are dependent on membrane properties (conductivity, selectivity, osmotic behavior), cell properties (compartment thickness, spacer type), stack design parameters (way of feed, electrode

85
Reverse electrodialysis: Performance of a stack with 50 cells on the mixing of sea and river water
system), operating conditions (fl ow rates, electrical load) and water quality (salt content, impurities, temperature, polyvalent ions). These parameters are confl icting in many ways. This chapter focuses on the main parameters aff ecting power density and energy effi ciency: (i) current density, (ii) membrane and spacer resistance, and (iii) feed fl ow rate. In order to obtain a maximal power density we used commercial membranes with a low resistance. Experiments were performed with a custom made RED stack with a variable number of cells. The largest stack consisted of 50 cells with a total eff ective membrane area of 1 m2, generating a power output of 0.93 W which is the highest power density ever reported for RED operating on river and sea water.
5.2. Theory
5.2.1. Reverse electrodialysisA typical RED system consists of a variable number of alternating cation and anion exchange membranes in a stack. Figure 5.1 shows such a system with only one cell. Every cell consists of a cation exchange membrane (CEM), a salt water compartment, an anion exchange membrane (AEM) and a fresh water compartment. Positive ions from the sea water diff use through the CEMs to the river water compartment and build up a positive potential on one side of the stack. The negative ions from the sea water diff use through the AEMs to the river water compartment on the other side and cause a negative potential in this location. The potential diff erence between the two solutions can be calculated using the Nernst equation. If sea water is considered as a solution of 30 kg NaCl /m3 and river water as a solution of 1 kg NaCl/m3, this potential diff erence is 140-160 mV per cell. If there is an external circuit connected to the end electrodes, electrical power can be extracted from the system. The ionic current in the cells is then converted to an external electron current via redox reactions at the electrodes.
5.2.2. Power density determinationThe theory about reverse electrodialysis was formulated by Weinstein and Leitz14, Clampitt and Kiviat21, Jagur-Grodzinski, and Kramer17 and Lacey22 and is summarized by Veerman et al. (Chapter 3). Key parameters of a RED cell are the electromotive force, internal resistance and delivered power. The voltage across a 100% selective membrane can be calculated if pure NaCl solutions of 1 and 30 g/L at 298 K are used, giving values of 0.080 V for a CEM and 0.078 V for an AEM, or together Ecell = 0.158 V for a cell.
The power effi ciency (ŋP) is the fraction of total power that is delivered to an external power consumer with resistance Ru:

86
Chapter 5
(1)
At the condition of maximal power output (Ru = Ri), the power effi ciency is not higher than 50%. A higher effi ciency can be achieved (by taking Ru > Ri) at the cost of a decreased power output.
The power density Pd of a RED system is defi ned as the external (Pu) power per membrane area (W/m2) and is maximal under the condition of Ru = Ri :
(2)
where Pu stands for the external power, A for the active cell area, and 2A for the total membrane area (AEM and CEM) in a cell. RAEM, RCEM, Rriver and Rsea are the resistances of the AEM, CEM, river water compartment and sea water compartment, respectively.
5.2.3 The mixing entropy of seawater and river waterIn order to determine the amount of energy extracted from mixing, it is necessary to calculate the chemical potential between 2 solutions of diff erent concentrations. The Gibbs free energy of mixing (ΔGRED) of river water (VR (m3) ; NaCl concentration: CR (mol/m3)) with sea water (VS (m3); NaCl concentration: CS (mol/m3)) is given by23,24:
(3)
with
(4)
where R is t he gas constant (R=8.31 J.mol-1K-1) and T the temperature (K); the origin of the factor 2 is the dissociation of one mole NaCl in two moles of ions. CM is the equilibrium concentration, gained at total mixing. Eq. (3) is an approximation: the entropy increase of the water is not included and the activity coeffi cients are taken to unity but both eff ects tend to counterbalance.
For a zero salt concentration in the river water (CR=0), Eq. (3) can be simplifi ed to:
(5)
)(88222
2222
seariverCEMAEM
cell
i
cellu
ui
celluud RRRRA
EAR
EA
RRR
EARI
AP
P
M
SSS
M
RRRRED C
CCV
CCCVRTG lnln2
SR
SSRRM VV
CVCVC
R
RSSSRRED V
VVCVRTCG ln2)0(
ui
u
ui
uP RR
RRIRI
RI
22
2

87
Reverse electrodialysis: Performance of a stack with 50 cells on the mixing of sea and river water
In an ideal RED process, all the Gibbs free energy is liberated as electrical energy. Table 5.1 shows this amount of energy produced for diff erent mixing ratios of sea water (30 kg NaCl/m3) and river water (0 kg NaCl/m3) at 298 K. With 1 m3 sea water and 1 m3 of river water 1.76 MJ can theoretically be generated. With a large surplus of sea water this value is 2.55 MJ. Table 5.1 also shows that in cases where the amount of salt water is the limiting factor, using an excess of river water is very useful (compare the 6.1 MJ of the VR:VS=10:1 combination with the 2.42 MJ for VR:VS=1:10). Such cases may be industrial processes with a brine effl uent together with river or sea water.
In case of river water used with sea water, Table 5.1 suggests the use of a surplus of sea water. However, the costs of pretreatment, transport and pumping through the stack should also be taken in account from an economical viewpoint. Assuming these costs are equal per m3 for each type of water, the optimal ratio VS/VR can be obtained by substituting VR=1 in Eq. (3) and subsequently diff erentiating the equation with respect to VS. Solving d(ΔGRED)/d(VS)=0 gives VR/VS=e−1≈1.72. This ratio results in a slightly higher energy compared to the 1:1 mixture with the same total volume of 2 m3 as shown in Table 5.1 (in italics).
M
SSS
M
RRR C
CC
CCCRTX lnln2
Table 5.1. Gibbs free energy from mixing VR (m3) river water (SR = 0 kg NaCl/m3) with VS (m3) sea water (SS = 30 kg/m3) at 298 K.
VR VS VR/VS ΔGRED
[m3] [m3] [ − ] [MJ]
∞ 1 ∞ ∞
10 1 10 6.1
2 1 2 2.8
1 1 1 1.76
1.26 0.74 1.72 1.87
1 2 0.5 2.06
1 10 0.1 2.43
1 ∞ 0 2.55
By substituting the fl ows rates Φ for volumes V, Eq. (3) can used for calculating the free Gibbs energy per second before and after mixing in the RED stack:
(6)
The equilibrium conc entration CM can be obtained with Eq. (4) by using fl ow rates instead of volumes.

88
Chapter 5
The available free energy is also called ‘exergy’. The consumed free energy per second for the RED installation is obtained by taking the diff erence of output and input free energy per second:
(7)
5.3. Experimental
T he RED cell which was used in our experiments is shown in Figure 5.1. The specifi c components are described in the following sections.
Figure 5.1. A reverse electrodialysis stack with one cell.
outincons XXX
5.3.1. EndplatesElectrode compartments are situated inside the endplates. Endplates were milled from reinforced phenol formaldehyde (Epratex HGW 2082, Eriks, The Netherlands). Stainless steel bolts were used to close the stack. The distance between the end plates was about 33 mm in the case of 50 cells with 200 μm spacers and 200 μm gaskets.

89
Reverse electrodialysis: Performance of a stack with 50 cells on the mixing of sea and river water
5.3.2. CellsThe functional area of one membrane was 100 cm2. On the outsides of the stacks cation exchange membranes were used as shielding membranes to prevent the transportation of negatively charged iron complexes. Fumasep anion and cation exchange membranes FAD and FKD with a thickness of 0.082 mm (obtained from Fumatech, Germany) were used. The stacks were equipped with polyamide woven spacers with a thickness of 200 μm. The membranes, gaskets and spacers were made at their correct size by means of a punch and a press.
5.3.3. Electrode systemThe electrode compartments contained a solution of NaCl (1 mol/L) with K4Fe(CN)6 (0.05 mol/L) and K3Fe(CN)6 (0.05 mol/L). This electrolyte was pumped through the anode and cathode compartment at a rate of 60 mL/min. All chemicals used were technical grade and purchased from Boom, Meppel, The Netherlands. Titanium mesh end electrodes, coated with Ru–Ir mixed metal oxides with dimensions of 10cm X 10cm were used (Magneto Special Anodes b.v., Schiedam, the Netherlands. These electrodes are suitable as anode as well as cathode and therefore current reversal is possible.
5.3.4. Sea and river waterDemineralized water with technical grade sodium chloride (Boom, Meppel) was used. ‘Sea water’ consisted of 30 g NaCl/L and ‘river water’ of 1 g NaCl/L. A conduction meter with a Tetracon 325 cell (WTW, Weilheim, Germany) was used. To convert conductivities to salt content, a second-order calibration line was made in the 0–30 kg NaCl/m3 range at 298 K. Peristaltic pumps (Masterfl ex L/S, Cole Parmer Instrument Company) were used for the delivery sea and river water and for recirculation of the electrode rinse. The stack with 50 cells was fed with 700 mL/min. Smaller stacks were fed with proportional lower fl ow rates, thereby maintaining the same fl ow velocity along the membrane surface. The temperature was controlled at 298±1 K for all experiments.
5.3.5. Reference electrodesPlatinum electrodes (diameter 1 mm) were inserted near the centre of the working and counter electrode through the meshes of the electrode grid and adjusted until the end was in plane with the inner surface of the end electrode. The Pt-wire was covered with epoxy and the end was scoured and polished afterwards. The measuring system based on Pt-electrodes was compared with a system of Ag/AgCl reference electrodes and showed the same results.

90
Chapter 5
5.3.6. Electrical measurementsThe measurements were carried out with an Ivium potentiostat (Ivium Technologies, Eindhoven, The Netherlands) in the galvanostatic mode. The galvanostatic scan rate was always set to 2 mA/s. Initially, the voltage (E) as function of the electrical current (I) was measured, resulting in an EI-plot. The reference current direction is chosen so that a positive current causes normal electrodialysis; RED is associated with a negative current. In most graphs in this chapter, the electrical current is transformed to the current density (J) and galvanostatic scans appear as EJ-curves.
5.4. Results and discussion
5.4.1. Variable cell number experimentsIn order to determine the maximum power output of a RED stack, the stack voltage as function of the current density was measured. The applied current was controlled via a potentiostat. The optimal load (the external electrical resistance) for a maximal power density was determined with these values. The power output is maximal when the load equals the internal resistance (Eq. (1). EJ-curves plotted of a full stack with 50 cells, with 40 cells and so on (N=50, 40, 30, 20, 10 and 0) are shown in Figure 5.2. A stack with 0 cells contained only 1 CEM between the electrode compartments. The voltage at the end electrodes (the working and the counter electrode) is represented by the dashed lines, the voltage on the reference electrodes by solid lines. At zero current density, both voltages are equal; at lower current densities the voltage on the end electrodes is slightly lower due to overpotentials at the electrode and a voltage drop inside the electrode compartment.
Figure 5.3 shows the power as function of the current density derived from Figure 5.2 for diff erent stacks (the solid lines). This power is determined from the potential measured at the reference electrodes multiplied by the current density throughout the stack. The potential measurement on the reference electrodes does not contain energy loss due to redox processes at the electrode. Therefore, this value gives the actual power obtained from the mixing of sea and river water via the RED stack. The 50 cell stack contains a total membrane area of 1 m2 and therefore also represents the power density; the maximal (0.93 W/m2) is reached at a current density of –28 A/m2. At this point the theoretical energy effi ciency is not more than 50%. Between 0 and –28 A/m2, the energy effi ciency is higher but the power density is lower. The obtained power density (0.9 3 W/m2) is substantially higher than the power densities for the river water / sea water RED system published so far (Table 5.2). Furthermore, it can be observed from Figure 5.3 that the power increases almost linearly with the number of cells (N=10: P=0.20 W; N=20: P=0.40 W; . . . ; N=50: P=0.93 W). This indicates that the loss due to leaking currents is minimal (Chapter 3). The
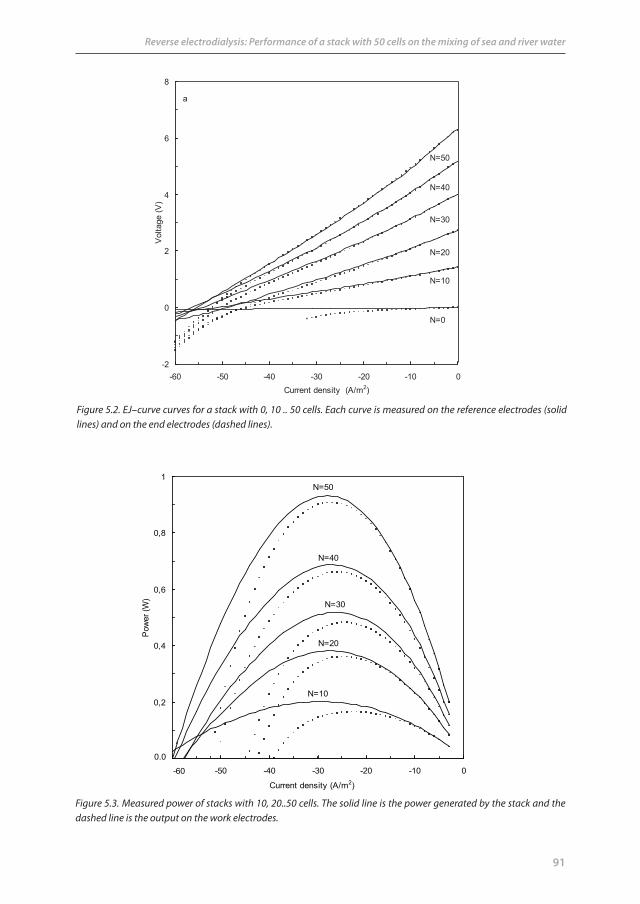
91
Reverse electrodialysis: Performance of a stack with 50 cells on the mixing of sea and river water
0.0
0,2
0,4
0,6
0,8
1
-60 -50 -40 -30 -20 -10 0
Current density (A/m2)
Pow
er (W
)
N=10
N=40
N=50
N=20
N=30
Figure 5.3. Measured power of stacks with 10, 20..50 cells. The solid line is the power generated by the stack and the dashed line is the output on the work electrodes.
Figure 5.2. EJ–curve curves for a stack with 0, 10 .. 50 cells. Each curve is measured on the reference electrodes (solid lines) and on the end electrodes (dashed lines).
a
-2
0
2
4
6
8
-60 -50 -40 -30 -20 -10 0Current density (A/m2)
Vol
tage
(V)
N=10
N=40
N=50
N=20
N=30
N=0
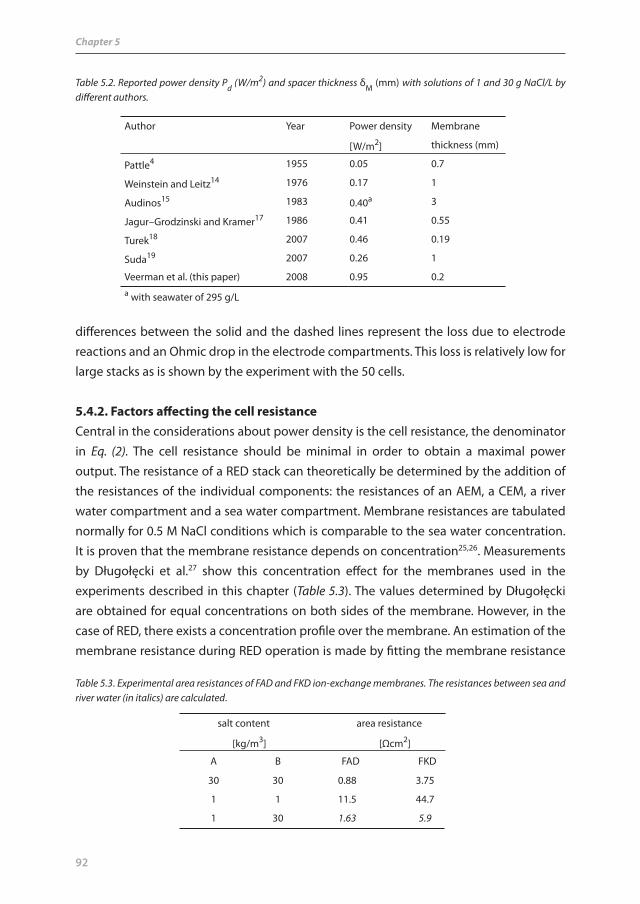
92
Chapter 5
Table 5.2. Reported power density Pd (W/m2) and spacer thickness δM (mm) with solutions of 1 and 30 g NaCl/L by diff erent authors.
diff erences between the solid and the dashed lines represent the loss due to electrode reactions and an Ohmic drop in the electrode compartments. This loss is relatively low for large stacks as is shown by the experiment with the 50 cells.
5.4.2. Factors aff ecting the cell resistanceCentral in the considerations about power density is the cell resistance, the denominator in Eq. (2). The cell resistance should be minimal in order to obtain a maximal power output. The resistance of a RED stack can theoretically be determined by the addition of the resistances of the individual components: the resistances of an AEM, a CEM, a river water compartment and a sea water compartment. Membrane resistances are tabulated normally for 0.5 M NaCl conditions which is comparable to the sea water concentration. It is proven that the membrane resistance depends on concentration25,26. Measurements by Długołęcki et al.27 show this concentration eff ect for the membranes used in the experiments described in this chapter (Table 5.3). The values determined by Długołęcki are obtained for equal concentrations on both sides of the membrane. However, in the case of RED, there exists a concentration profi le over the membrane. An estimation of the membrane resistance during RED operation is made by fi tting the membrane resistance
Table 5.3. Experimental area resistances of FAD and FKD ion-exchange membranes. The resistances between sea and river water (in italics) are calculated.
Author Year Power density Membrane
[W/m2] thickness (mm)
Pattle4 1955 0.05 0.7
Weinstein and Leitz14 1976 0.17 1
Audinos15 1983 0.40a 3
Jagur–Grodzinski and Kramer17 1986 0.41 0.55
Turek18 2007 0.46 0.19
Suda19 2007 0.26 1
Veerman et al. (this paper) 2008 0.95 0.2a with seawater of 295 g/L
salt content area resistance
[kg/m3] [Ωcm2]
A B FAD FKD
30 30 0.88 3.75
1 1 11.5 44.7
1 30 1.63 5.9

93
Reverse electrodialysis: Performance of a stack with 50 cells on the mixing of sea and river water
as a function of concentration and integrating this over the whole membrane thickness (Chapter 5 - Appendix A). It follows that the estimated membrane resistance under RED conditions (between NaCl solutions of 30 g/L and 1 g/L) is about twice the resistance under normal membrane test conditions (between identical NaCl solutions of 30 g/L).
If the sea and river water compartments did not contain any spacer, ‘spacer-less resistances’ of these compartments could be established from the dimensions of the compartment and the specifi c resistance of the concerning salt solution. However, spacers inhibit the ion fl ow. The woven spacers used in the experiments described in this chapter occupy 33% of the volume and 49% of the area in a plane projection, resulting in obstruction factors f for the ionic current of 1/(1−0.33)=1.49 or 1/(0.49)=1.96. The fi rst value is an underestimation because the ionic current follows a tortuous path between the threads of the spacer. The second value is an overestimation because the current can follow curved paths. Therefore, for the calculation of cell resistance all ‘spacer-less resistances’ were multiplied with obstruction factor f (the average of both values: f=1.72). The calculated and measured resistances of a single cell (10cm∙10cm; spacers of 200 μm) are shown in Table 5.4. The table shows the resistance for the case where both compartments are fed with sea water (SS), both with river water (RR) and with sea and river water (SR). From Table 5.4, it follows that under normal RED operation (column SR), the river water compartment has the largest contribution to the total
These theoretical values were compared with the experimental data which were determined for 3 diff erent cases when the diff erent compartments are fi lled with: (i) both with sea water , (ii) both with river water and (iii) one with sea water and the other with river water (the normal RED operation) (Figure 5.4). The current density is varied from -60 to 0 A/m2 in order to determine the cell resistance from the slope of the EJ-curves.
Table 5.4. Calculated and measured resistance and power density of a cell (A=0.01 m2) with Fumasep membranes (FAD and FKD). The cell is fed with sea and river water (SR, left column), with sea and sea water (SS, middle column) and with river water with river water (RR, right column).
feed SR SS RR
calculated
FAD (Ω) 0.016 0.009 0.115
FKD (Ω) 0.059 0.038 0.447sea water comp.(Ω) 0.007 0.007 0.155river water comp.(Ω) 0.156 0.007 0.155cell resistance (Ω) 0.238 0.061 0.872
power density (W/m2) 1.18 - -
experimentalcell resistance (Ω) 0.345 0.067 0.734
power density (W/m2) 0.93

94
Chapter 5
Current density (A/m2)
-60 -50 -40 -30 -20 -10 0
Vol
tage
(V)
-8
-6
-4
-2
0
2
4
6
8
Sea - River
Sea - Sea
River - River
Figure 5.4. EJ–curves at the Pt-reference electrodes for a stack with 50 cells: a) normal b) sea–sea c) river–river.
As shown in Figure 5.4, there is no potential diff erence for sea/sea and river/river at zero current density. In fact, the operation mode here is not RED but normal ED resulting in a salt depletion in one compartment and an enrichment in the other. In the river/river case, this disproportion of the salt concentration causes an extremely high resistance and sharply curved lines at higher (negative) current. In the normal RED operation (sea/river) the opposite eff ect occurs: at a high negative current there is a NaCl transport from the sea water to the river water compartments resulting in a lower resistance at increased negative current.
From these EJ-curves the cell resistance can be obtained at diff erent current densities. The experiment is done with a cell of 50, 30, 20, . . .1 cell. The results are presented in Figure 5.5. The resistances were calculated near J=0 by calculating ΔE/ΔI over the range −50 mA to 0 mA of the scan. The single cell resistance is the slope of the diff erent lines and is 0.73 Ω for the river/river system, 0.35 Ω for the sea/river system (normal RED) and 0.067 Ω for the sea/sea system and tabulated in Table 5.4. In Table 5.4 the calculated power density (1.18 W/m2) has been added according Eq. (2); for the cell voltage Ecell is taken the value of 0.150 V, based on a permselectivity of both membranes of 0.95 and on an ideal cell voltage of 0.158 V (Chapter 3). Measured power density (0.93 W/m2) is 21% less than the calculated value, which is close to the theoretical values if the obstruction of the spacer is taken into account. If no spacer would be used
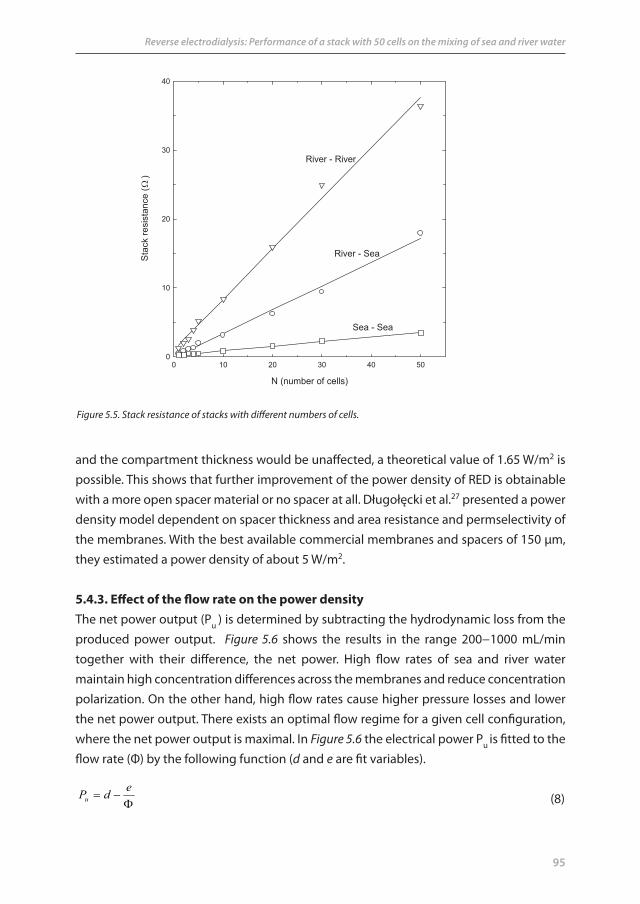
95
Reverse electrodialysis: Performance of a stack with 50 cells on the mixing of sea and river water
and the compartment thickness would be unaff ected, a theoretical value of 1.65 W/m2 is possible. This shows that further improvement of the power density of RED is obtainable with a more open spacer material or no spacer at all. Długołęcki et al.27 presented a power density model dependent on spacer thickness and area resistance and permselectivity of the membranes. With the best available commercial membranes and spacers of 150 μm, they estimated a power density of about 5 W/m2.
5.4.3. Eff ect of the fl ow rate on the power densityThe net power output (Pu ) is determined by subtracting the hydrodynamic loss from the produced power output. Figure 5.6 shows the results in the range 200−1000 mL/min together with their diff erence, the net power. High fl ow rates of sea and river water maintain high concentration diff erences across the membranes and reduce concentration polarization. On the other hand, high fl ow rates cause higher pressure losses and lower the net power output. There exists an optimal fl ow regime for a given cell confi guration, where the net power output is maximal. In Figure 5.6 the electrical power Pu is fi tted to the fl ow rate (Φ) by the following function (d and e are fi t variables).
(8)
N (number of cells)
0 10 20 30 40 50
Sta
ck re
sist
ance
(
)
0
10
20
30
40
River - River
River - Sea
Sea - Sea
Figure 5.5. Stack resistance of stacks with diff erent numbers of cells.
edPu

96
Chapter 5
The hydrodynamic power losses are fi tted by a parabolic function:
(9)
where a, b and c are specifi c constants for the system. The maximal net electrical power is reached near 400 mL/min (0.7 cm/s). At this optimum the consumed power for pumpin g is 25% of the total generated electrical energy. The hydrodynamic loss is relatively high in these experiments where the pressure was measured outside the stack. Experiments with pressure measurements in the spacer compartments show a much lower pressure drop28. The residual pressure losses are caused by the internal manifolds. Experiments with pressure measurements within cells showed pressure losses in the manifolds of 80% of the total pressure drop over the whole cell. The design of the manifolds is very critical and these locations are subject to obstruction by pollution and mechanical deformation of the stack. Besides improving the manifolds, the pressure drop can be decreased by using more open spacer material. Another approach is the use of relatively thick sea water spacers: if they are fi ve times thicker than the river water spacers, then the fl uid resistance and the electric resistance are negligible compared to the river water compartment. However, the resulting decrease in lateral electrical resistance that causes an increased ionic shortcut current is a point of attention (Chapter 3).
Flow rate (ml/min)
0 200 400 600 800
Pow
er d
ensi
ty (W
/m2)
0.0
0.2
0.4
0.6
0.8
1.0
hydrodynamic loss
net
electrical
Figure 5.6. Generated electrical power, hydrodynamic loss and the supplied net power in a 50 cell stack.
cbaPpump 2
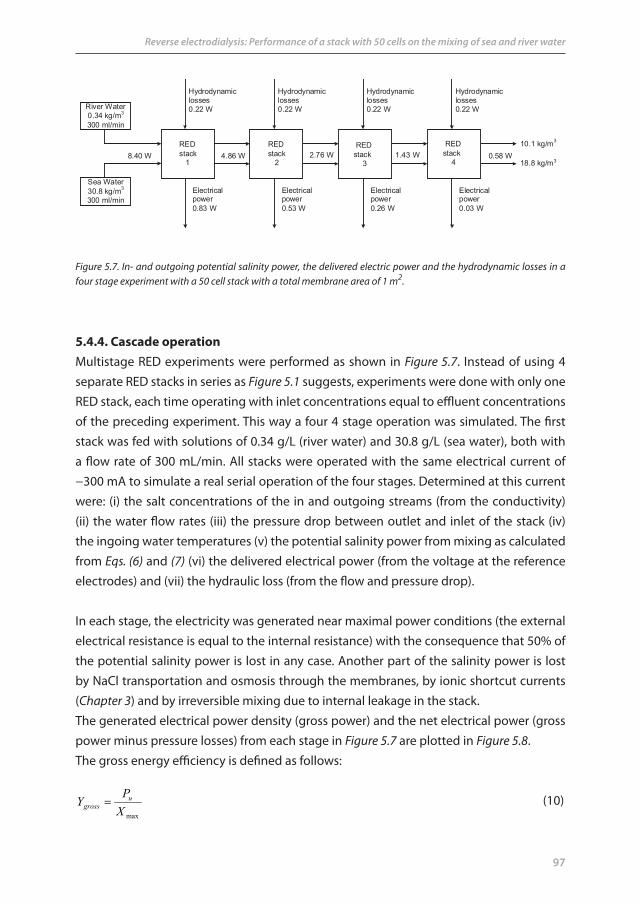
97
Reverse electrodialysis: Performance of a stack with 50 cells on the mixing of sea and river water
5.4.4. Cascade operationMult istage RED experiments were performed as shown in Figure 5.7. Instead of using 4 separate RED stacks in series as Figure 5.1 suggests, experiments were done with only one RED stack, each time operating with inlet concentrations equal to effl uent concentrations of the preceding experiment. This way a four 4 stage operation was simulated. The fi rst stack was fed with solutions of 0.34 g/L (river water) and 30.8 g/L (sea water), both with a fl ow rate of 300 mL/min. All stacks were operated with the same electrical current of −300 mA to simulate a real serial operation of the four stages. Determined at this current were: (i) the salt concentrations of the in and outgoing streams (from the conductivity) (ii) the water fl ow rates (iii) the pressure drop between outlet and inlet of the stack (iv) the ingoing water temperatures (v) the potential salinity power from mixing as calculated from Eqs. (6) and (7) (vi) the delivered electrical power (from the voltage at the reference electrodes) and (vii) the hydraulic loss (from the fl ow and pressure drop).
In each stage, the electricity was generated near maximal power conditions (the external electrical resistance is equal to the internal resistance) with the consequence that 50% of the potential salinity power is lost in any case. Another part of the salinity power is lost by NaCl transportation and osmosis through the membranes, by ionic shortcut currents (Chapter 3) and by irreversible mixing due to internal leakage in the stack. The generated electrical power density (gross power) and the net electrical power (gross power minus pressure losses) from each stage in Figure 5.7 are plotted in Figure 5.8.The gross energy effi ciency is defi ned as follows:
(10)
RED stack 2
RED stack
1
Hydrodynamic losses0.22 W
Electrical power0.83 W
River Water0.34 kg/m3
300 ml/min
Sea Water30.8 kg/m3
300 ml/min
Hydrodynamic losses0.22 W
Electrical power0.53 W
Hydrodynamic losses0.22 W
Electrical power0.26 W
Hydrodynamic losses0.22 W
Electrical power0.03 W
RED stack 3
RED stack 4
10.1 kg/m3
18.8 kg/m38.40 W 2.76 W4.86 W 1.43 W 0.58 W
Figure 5.7. In- and outgoing potential salinity power, the delivered electric power and the hydrodynamic losses in a four stage experiment with a 50 cell stack with a total membrane area of 1 m2.
maxXP
Y ugross

98
Chapter 5
Stage
0 1 2 3 4
Pow
er d
ensi
ty (W
/m2)
-0.4
-0.2
0.0
0.2
0.4
0.6
0.8
1.0
gross power density
net powerdensity
Figure 5.8. Power density and the hydraulic loss for each stage at a four stage experiment in a 50 cell stack with a total membrane area of 1 m2.
with Pu the generated (and usable) electric power. The fl ow ratio (the sea water fl ow divided by the river water fl ow) and a possible addition of NaCl to the river water are not prescribed.
In the net energy effi ciency Ynet, a correction for the hydrodynamic loss is made as well:
(11)
Figure 5.8 indicates that only two stages are useful. However, in the case of a large reduction of the hydraulic losses, the third stage can also contribute to the net energy yield. In this scheme the electrical power consumed by the electrode system is not included. This dissipated power is about 10% of the generated electrical power for a stack with 50 cells and is marginal in large stacks. Figure 5.9 shows the eff ect of multiple stages on the cumulative gross power density and the cumulative gross energy effi ciency: it follows that both important RED parameters are counteracting. However, these values depend on the mode of operation (current density) and the stack design (pressure drop).
The most important response variables of a RED stack are the power density Pd and the
maxXPP
Y pumpunet
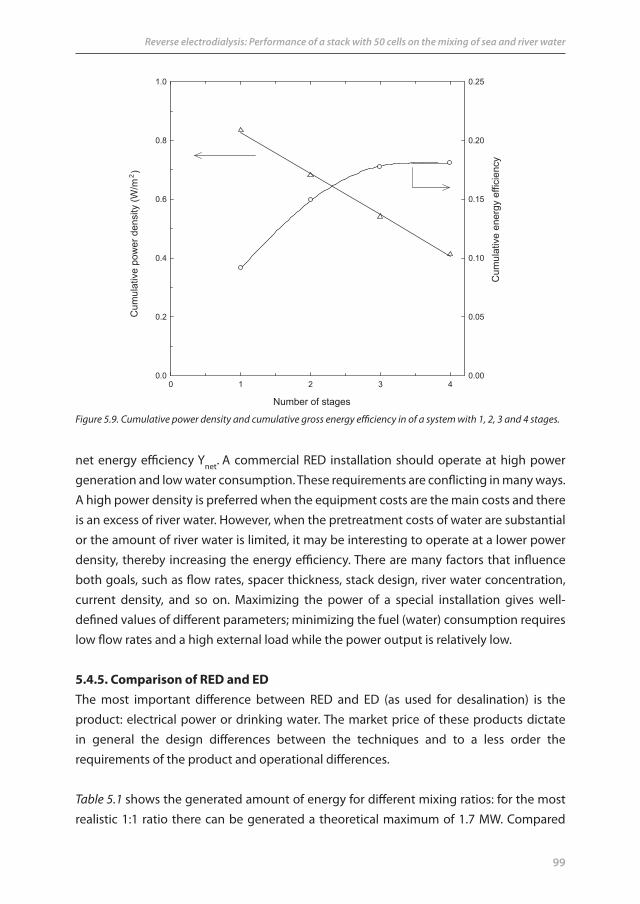
99
Reverse electrodialysis: Performance of a stack with 50 cells on the mixing of sea and river water
Number of stages
0 1 2 3 4
Cum
ulat
ive
ener
gy e
ffici
ency
0.00
0.05
0.10
0.15
0.20
0.25
Cum
ulat
ive
pow
er d
ensi
ty (W
/m2 )
0.0
0.2
0.4
0.6
0.8
1.0
Figure 5.9. Cumulative power density and cumulative gross energy effi ciency in of a system with 1, 2, 3 and 4 stages.
net energy effi ciency Ynet. A commercial RED installation should operate at high power generation and low water consumption. These requirements are confl icting in many ways. A high power density is preferred when the equipment costs are the main costs and there is an excess of river water. However, when the pretreatment costs of water are substantial or the amount of river water is limited, it may be interesting to operate at a lower power density, thereby increasing the energy effi ciency. There are many factors that infl uence both goals, such as fl ow rates, spacer thickness, stack design, river water concentration, current density, and so on. Maximizing the power of a special installation gives well-defi ned values of diff erent parameters; minimizing the fuel (water) consumption requires low fl ow rates and a high external load while the power output is relatively low.
5.4.5. Comparison of RED and EDThe most important diff erence between RED and ED (as used for desalination) is the product: electrical power or drinking water. The market price of these products dictate in general the design diff erences between the techniques and to a less order the requirements of the product and operational diff erences.
Table 5.1 shows the generated amount of energy for diff erent mixing ratios: for the most realistic 1:1 ratio there can be generated a theoretical maximum of 1.7 MW. Compared
100
Chapter 5
to fossil fuels this is a very low energy density. To operate on an economical base, high power densities and high energy effi ciencies should be achieved. This requires a very sophisticated design with tuned operational variables. These are low electrical resistance (thin compartments, thin membranes), low fl uid friction (well designed spacers and manifolds), high energy effi ciency (high permselective membranes), a high degree of exhaustion of the feed water (multi stage operation), an effi cient electrode system. At this moment there are no membranes and spacers designed specifi cally for RED.In contrast the suitability of the ED technique is dictated by the water price and by product requirements. Energy consumption is a second interest. For making drinking water, all materials should satisfy to food quality regulations. This concerns pumps, piping, spacers and especially the membranes. This is only possible with a rather robust and over dimensioned structure.
5.5. Conclusions
In this chapter we show that the a ctual power density of a RED stack operated on artifi cial sea and river water is 0.93 W/m2, which is the highest reported value for a real stack operation. This value is obtained with low resistance membranes, good sealing of the compartments, with small compartment thickness (200 μm) and an accurate method to determine the stack performance. 25% of this produced power is lost by pressure drop by using commercially available spacers. We show that this pressure drop is mainly caused by the resistance of the manifolds. The net produced power also depends on the fl ow rate. At high fl ow rates, it increases due to reduced concentration polarization, and decreases due to higher pressure losses. The optimal value is found at 400 mL/min (0.7 cm/s). The total cell resistance is one and a half times higher than expected from the sum of the contribution of the individual components. This may be caused by the shielding eff ect of the spacer. A more open spacer is benefi cial for RED in 2 ways: less shielding and lower pressure drop. The membrane resistance is of minor importance in the tested stacks, because the 200 μm river water compartment has a dominant infl uence on the total cell resistance. The energy effi ciency of 4 cells which are operated in series is also shown. A gross energy effi ciency of 18% is achieved in a 4 stage operation at maximal produced power. This value was achieved under conditions of maximal power density were the maximal energy effi ciency is 50%. The results are encouraging for further eff orts on the improvement of the system.
5.6. Recommendations
Power density and energy effi ciency are counteracting. Nowadays there is plenty of unused fuel (river water) and a RED installation is at present rather expensive. The fi rst goal
101
Reverse electrodialysis: Performance of a stack with 50 cells on the mixing of sea and river water
is to increase the power density, but proving the possibility of a high energy effi ciency is likewise necessary in order to make reverse electrodialysis a substantial energy source in the future.
The described results are encouraging and are the basis of further investigations. The central theme will be describing the power density and the energy effi ciency in terms of membrane and spacer properties, stack and cell dimensions, fl uid velocities and so on. Furthermore, the search for improved membranes, spacers, gaskets and electrode systems is ongoing. Also the use of real sea and river water in RED and its eff ect on the performance, fouling, spacers and membranes needs to be investigated. Fouling should be prevented by a balanced basic pre-treatment and improved, very open spacers. The goal is an economical performing RED installation operating on river water and sea water.
AcknowledgementThis research was performed at Wetsus, centre of excellence for sustainable water technology. Wetsus is funded by the city of Leeuwarden, the province of Fryslân, the European Union European Regional Development Fund and by the EZ/Kompas program of the Samenwerkingsverband Noord-Nederland. The fi rst author would like to thank the Noordelijke Hogeschool Leeuwarden who facilitated this research by detaching him to Wetsus and the participants of the energy theme for their interest and fi nancial contribution.

102
Chapter 5
Nomenclature
A cell area (m2)a, b, c fi t variables for Ppump C concentration (mol/m3)d, e fi t variables for Pu
E voltage (V)Ecell electromotive force of one cell (V)f obstruction factor F Faraday constant (96 485 C/mol)GRED free energy of the RED process (J)I electrical current (A)J electrical current density (A/m2)M mol mass NaCl (0.0584 kg/mol)N number of cells in a stackPd power density (W/m2)Pd-net net power density (W/m2)Pmax maximum external power (W)Pu external power (W) Ppump hydrodynamic loss (W)RAEM cation exchange membrane resistance (Ω)RCEM cation exchange membrane resistance (Ω)Rarea area resistance of a membrane (Ωm2)Reff eff ective area resistance of a membrane (Ωm2)Ri internal resistance (Ω)Ru external resistance (Ω)Rriver river water compartment resistance (Ω)Rsea sea water compartment resistance (Ω)R2 determination coeffi cient R gas constant (8.31432 J∙mol-1K-1) tw electro-osmotic water transport number (mol/F)S salt content (kg/m3)T temperature (K)OCV open circuit voltage (V)p, q, r fi t variables for Reff
V volume (m3)Xin free energy per second of the inlet (W)Xout free energy per second of the effl uent (W)Xcons consumed free energy per second (W)Xmax maximal available free energy per second (W)Y energy effi ciencyYgross gross energy effi ciency
Greek symbolsα permselectivity of the ion exchange membraneδC compartment thickness (m)δM membrane thickness (m)ηP power effi ciency Φ fl ow (m3/s)
103
Reverse electrodialysis: Performance of a stack with 50 cells on the mixing of sea and river water
Superscriptsi ino out
SubscriptsS seaR riverM equilibrium
AbbreviationsAEM anion exchange membraneCEM cation exchange membraneED electrodialysisEMF electromotive force (V)RED reverse electrodialysis
Defi nitionscompartment space between the membranescell combination of two membranes and two compartmentselectrode system the anode, cathode and electrode rinsestack a number of N cells with an electrode system
References Chapter 5
1 R.E. Pattle, Production of electric power by mixing fresh and salt water in the hydroelectric pile. Nature 174 (1954) 660
2 G.L. Wick, W.R. Schmitt, Prospects for renewable energy from sea. Mar. Technol. Soc. J. 11 (1977) 16-21
3 Energy information administration; offi cial energy statistics from the U.S. government. www.eia.doe.gov
4 R.E. Pattle, Electricity from fresh and salt water - without fuel. Chem. Proc. Eng. 35 (1955) 351–354
5 R.E. Pattle, Improvements to electric batteries. Patent GB731729 (1955)
6 S. Loeb, Osmotic power plants. Science 189 (1975) 654–655
7 S. Loeb, Production of energy from concentrated brines by pressure retarded osmosis.1. Preliminary technical and economic correlations. J. Membr. Sci. 1 (1976) 49–63
8 M. Olsson, G.L. Wick, J.D. Isaacs, Salinity gradient power - utilizing vapor-pressure diff erences. Science 206 (1979) 452–454
9 M.V. Sussman, A. Katchalsky, Mechanochemical turbine: a new power cycle. Science 167 (1970) 45–47
10 W. Finley, E. Pscheidt, Hydrocratic generator. US Patent 6.313.545 B1 (2001)
11 G. Lagger, H. Jensen, J. Josserand, H.H. Girault. Hydro-voltaic cells. Part 1. Concentration cells. J. Electroanal. Chem. 5445 (2003) 1–6
12 V. Kniajev, Energy of salinity gradient - new source of energy with minimal environmental impact. Abstracts from the International Workshop “Result of Fundamental Research for Investments” (IWRFRI’2001’), St. Petersburg. Russia (2001)
104
Chapter 5
13 J.W. Post, J. Veerman, H.V.M. Hamelers, G.J.W. Euverink, S.J. Metz, K. Nymeijer, C.J.N. Buisman. Salinity-gradient power: Evaluation of pressure-retarded osmosis and reverse electrodialysis. J. Membr. Sci. 288 (2007) 218–230
14 J.N. Weinstein, F.B. Leitz, Electric power from diff erences in salinity: the dialytic battery. Science 191 (1976) 557–559
15 R. Audinos, Electrodialyse inverse. Etude de l’energie electrique obtenue a partir de deux solutions de salinites diff erentes. J. Power Sources 10 (1983) 203–217
16 R. Audinos, Electric power produced from two solutions of unequal salinity by reverse electrodialysis. Ind. J. Chem. 31A. (1992) 348–354
17 J. Jagur-Grodzinski, R. Kramer, Novel process for direct conversion of free energy of mixing into electric power. Ind. Eng. Chem. Process Des. Dev. 25 (1986) 443–449
18 M. Turek, B. Bandura, Renewable energy by reverse electrodialysis. Desalination 205 (2007) 67–74
19 F. Suda, T. Matsuo, D. Ushioda, Transient changes in the power output from the concentration diff erence cell (dialytic battery) between seawater and river water. Energy 32 (2007) 165–173
20 J. Veerman, J. W. Post, S.J. Metz, M. Saakes, G.J. Harmsen. Reducing power losses caused by ionic shortcut currents in reverse electrodialysis stacks by a validated model. J. Membr. Sci. 310 (2008) 418-430
21 B.H. Clampitt, F.E. Kiviat, Energy recovery from saline water by means of electrochemical cells. Science 194 (1976) 719–720
22 R.E. Lacey, Energy by reverse electrodialysis. Ocean Eng. 7 (1980) 1–47
23 C. Forgacs, Generation of electricity by reverse electrodialysis. BGUN-RDA – 178-78 Ben-Gurion University, Israel (1978)
24 C. Forgacs, R.N. O’Brien, Utilization of membrane processes in the development of non-conventional renewable energy sources. Chem. Can. 31 (1979) 19-21
25 V.I. Zabolotsky, V.V. Nikonenko, Eff ect of structural membrane inhomogeneity on transport properties. J. Membr. Sci. 79 (1993) 181–189
26 L. X. Tuan, C. Buess-Herman, Study of water content and microheterogeneity of CMS cation exchange membrane. Chem. Phys. Letters 434 (2007) 49-55
27 P. Długołęcki , K. Nymeijer, S. Metz, M. Wessling, Current status of ion exchange membranes for power geration from salinity gradients. J. Membr. Sci. 319 ( 2008) 214–222
28 M.H. Dirkse, W.K.P. van Loon, J.W. Post, J. Veerman, J.D. Stigter, G.P.A. Bot, Extending Potential Flow Modelling of Flat-Sheet Geometries as Applied in Membrane-Based Systems. J. Membr. Sci. 325 (2008) 537-545

105
Reverse electrodialysis: Performance of a stack with 50 cells on the mixing of sea and river water
Appendix A. Resistance of a membrane between two solutions with diff erent concentration.
Długołęcki27 et al. have measured the area resistance of FKD and FAD membranes at diff erent NaCl concentrations. We fi tted exponential functions to these data points:
(1) where Rarea is the area resistance of the membrane, C the concentration and p, q and r fi t parameters.Fitting resulted in Rarea=4.37+99.4e-53.1C for the FKD and Rarea=0.91+17.6e-29.8C for the FAD membrane. The eff ective area resistance Reff can be determined by integrating the exponential function between the concentration boundaries C1 and C2.
(2)
The resulting eff ective area resistances are 5.90 Ωcm2 for the FKD and 1.63 Ωcm2 for the FAD if used NaCl concentrations of C2=0.51 mol/L (=30 g/L) and C1=0.017 mol/L (=1 g/L). For the used membranes it follows that the resulting resistance is about twice the resistances between solutions of 0.5 mol NaCl/L.
rC
areaR ( C ) p q e
12
pCpCC
C
CC
C 12
Cr
12eff CC
eerq1e
rqpC
CC1dC)eqp(
CC1R
212
1
2
1

106

107
Reverse electrodialysis: Comparison of six commercial membrane pairs on the
thermodynamic effi ciency and power density*
AbstractReverse electrodialysis (RED) generates electricity through the entropy increase from the mixing of sea and river water. Two important RED process parameters were investigated: power density (in Watts per square meter membrane) and the thermodynamic effi ciency. Beside this, we quantifi ed losses in a RED stack experimentally: co-ion transport, osmosis and internal loss as a function of current density and related those to the energy loss due to mixing. Six diff erent commercial available membrane pairs - Qianqiu Heterogeneous Ion Exchange Membrane (AEM and CEM), Qianqiu Homogeneous Ion Exchange Membrane (AEM and CEM), Fumasep (FKD and FAD), Selemion (AMV and CMV), Neosepta (ACS and CMS) and Neosepta (AMX and CMX) - were compared. It was found that at maximal power density, the thermodynamic effi ciency was between 14% and 35%, where 50% is the maximum theoretical value at at maximal power density. The highest score (35%) is achieved with the Neosepta (ACS-CMS) pair. The power density of the diff erent membrane pairs varied from 0.5 to 1.2 W/m2. The maximal value was found for Fumasep (FAD and FDK) and Selemion (AMV and CMV) pair. For ranking purpose, we have combined the two response parameters to a single one by multiplying the power density and the thermodynamic effi ciency. This response parameter is the highest (34 W/m2∙%) for the Selemion (AMV and CMV) pair.
* Published asJ. Veerman, R.M. de Jong, M. Saakes, S.J. Metz, G.J. HarmsenReverse electrodialysis: Comparison of six commercial membrane pairs on the thermodynamic effi ciency and power densityJournal of Membrane Science 343 (2009) 7–15
Chapter 6

108
Chapter 6
6.1. Introduction
Salinity power, using river and sea water, is a clean and sustainable source of energy. One of the technologies for generating energy from this source is reverse electrodialysis (RED). The basic theory of RED is described by diff erent authors in literature1-18. A RED stack consists of alternating CEMs (cation exchange membranes) and AEMs (anion exchange membranes). These membranes are separated by spacers that keep the membranes in a fi xed position, ensure defi ned water compartments and act as turbulence promoters. Sea and river water are alternately supplied through the spacer compartments. Positive charged ions diff use from the sea water to the river water through the CEMs in one direction and negative charged ions diff use through AEMs in the other direction. These ionic currents are converted in an electron current at the electrodes of the stack by proper redox reactions. Power can be withdrawn by connecting an external load to these electrodes. Maximal power is delivered if the resistance of the external load equals the internal stack resistance.
Theoretically, the maximal amount of energy that can be harvested from 1 m3 fresh water and a large surplus salt water (30 g NaCl/L) is 2.55 MJ (Chapter 5). However, transport of large amounts of seawater to and through the stack consumes a large amount of energy. Therefore, it is more realistic to mix 1m3 fresh water with 1m3 seawater, generating 1.76 MJ (Chapter 5). In the Netherlands, the Rhine has an average fl ow rate of 2200 m3/s and has a power potential (Ppot ) of 3.9 GW, about 30 % of the electricity consumption in the Netherlands. The amount of produced power by RED depends on the availability (Q) of the river water and on the energy effi ciency of the process. The fraction of the theoretical maximal energy that can be obtained from given volumes salt and fresh water with given concentrations is the energy effi ciency Y. Therefore, the total generated power is P= Q∙Y∙Ppot. It is clear that energy effi ciency is a key parameter in the RED process.
In this chapter, we focus on the energy balance during the RED process at maximal power. In order to obtain a maximal power density, relative high fl ow rates are used and a low degree of mixing is achieved. At these circumstances, the energy effi ciency Y – the produced energy in relation to the exergy of the feed - is low and rather useless. Therefore, we introduce the term ‘thermodynamic effi ciency’ (ηT, which is defi ned as the produced energy in relation to the diff erence of exergy of the incoming and outgoing water. The second key parameter is the power density Pd, the generated amount of power per square meter of membrane. It is a measure of the power per invested euro because the membranes (and spacers) form a substantial part of the price of a RED power plant.

109
Reverse electrodialysis: Comparison of six commercial membrane pairs
In fact power density and energy effi ciency interact in a confl icting way. If only electrical aspects are taken into account, it can easily be seen that for maximal power density the external resistance (the load) is equal to the internal resistance of the stack. Therefore, the energy effi ciency cannot exceed 50% (Chapter 3). The RED process is most energy effi cient at low current densities when the external resistance is much higher than the stack resistance. High power densities demand a maximal concentration diff erence over the membrane. This can be achieved with high fl ow rates, which is limited by an increase in pump power (Chapter 5). Therefore, there exists an optimal fl ow rate for maximal energy effi ciency.
Many authors have studied the power density of a RED stack2,3,8,9,15,16. In these studies no systematic approach on the eff ect of membrane properties on the total performance was made. Długołęcki et al.18 presented a theoretical model of the power density in relation to spacer thickness, area resistance of the membranes and permselectivity of the membranes. They concluded that a high power density could be obtained with small membrane spacing and low membrane resistance. Our goal is to compare diff erent commercial membrane pairs in a real RED stack and relate the measured power density and energy effi ciency of mixing from a RED stack to the membrane properties (area resistance and permselectivity).
6.2. Experimental
6.2.1. EndplatesThe RED stack that was used in our experiments is shown in Figure 6.1. This experimental setup is described in great detail in Chapter 3 and 5. Electrode compartments are situated inside the endplates. Endplates were milled from reinforced phenol formaldehyde (Epratex HGW 2082, Eriks, The Netherlands). Stainless steel bolts were used to close the stack.
6.2.2. CellsThe functional area of one membrane was 100 cm2. On the outsides of the stacks CEMs were used. The studied ion exchange membranes were:(a) Qianqiu Heterogeneous Ion Exchange Membrane AEM and CEM (Hangzhou QianQiu Industry Co, China)(b) Qianqiu Homogeneous Ion Exchange Membrane AEM and CEM (Hangzhou QianQiu Industry Co, China)(c) Fumasep FKD and FAD (Fumatech, Germany)(d) Selemion AMV and CMV (Asahi Glass Company, Japan) (e) Neosepta ACS and CMS (Tokuyama Corporation, Japan)(f ) Neosepta AMX and CMX (Tokuyama Corporation, Japan)

110
Chapter 6
The radius of the feed and drain channels through the membranes was 4 mm. The stacks were equipped with nylon woven spacers with a thickness of 200 μm (Nitex 03-300/51, Sefar, The Netherlands). Gaskets were made of silicon micro fi lm with a thickness of 200 μm (SSF-MLTN-940, Specialty Silicone Fabricators, Paso Robles, USA). Stacks were made with 25 cells (Fumasep and Qianqiu homogeneous) or 5 cells (the other membrane pairs). The membranes, spacers and gaskets were made at their correct size by means of a punch and a press.
6.2.3. Electrode system and electrical measurementsThe electrode compartments contained a NaCl solution of 15 g/L (technical grade; Frisia Salt, Harlingen, The Netherlands). For the anode and cathode compartment a separate electrode rinse circuit was used with a common supply vessel (Figure 6.2). The anolyte and catholyte fl ow rate was about 100 mL/min. Titanium mesh end electrodes, coated with Ru-Ir mixed metal oxides with dimensions of 10cm x 10cm were used (Magneto Special Anodes, Schiedam, the Netherlands). These electrodes are suitable as anode as well as cathode and therefore current reversal is allowed. Ag/AgCl gel fi lled reference electrodes (QM711X, ProSense, Oosterhout, the Netherlands) were inserted in small vessels. The vessels were connected via thin tubes to the inlet tubes of anolyte and catholyte, just
Galvanostat
E I
W2W1
P1
P2
R1 R2
T1 T2
STACK
R
Figure 6.1. Confi guration of the experimental set-up.The electrode rinse R is cir cul ated with pumps P1 and P2 to the electrode compartments of the stack. The Ag/AgCl reference electrodes R1 and R2 are inserted in two vessels which are connected to the inlets with the T-connectors T1 and T2. The galvanostat is electrically connected to the reference electrodes R1 and R2 and to the working electrodes W1 and W2. The river and sea water fl ows through the stack are not shown.

111
Reverse electrodialysis: Comparison of six commercial membrane pairs
before the inlet points of the stack (Figure6.1). The galvanostatic measurements were carried out with an Ivium potentiostat (Ivium Technologies, Eindhoven, the Netherlands).
6.2.4. Artifi cial sea and river waterThe artifi cial ‘sea water’ consisted of 30 g NaCl/L and the artifi cial ‘river water’ of 1 g NaCl/L. A conductivity meter with a Tetracon 325 cell (WTW, Weilheim, Germany) was used. To convert conductivities to salt content, a second order calibration line was used in the 0-30 g NaCl/L range at 298 K. For the delivery of sea and river water and for recirculation of the electrode rinse, peristaltic pumps are used (Masterfl ex L/S, Cole Parmer Instrument Company). The stack with 25 cells was fed with 700 mL/min. Smaller stacks were fed with proportional lower fl ow rates, thereby maintaining the same fl ow velocity along the membrane surface. The temperature was controlled at 298±1K for all experiments.
6.2.5. Improvement of the electrode rinse solutionIn previous experiments as described in Chapter 3 and 5, we used an electrode rinse, containing the hexacyanoferrate redox couple [Fe(CN)6)3- / [Fe(CN)6]4- in a bulk of NaCl. In this system there is a risk of poisoning the membranes7: especially at the AEM the negatively charged hexacyanoferrate ions can accumulate in the membrane with the positive fi xed amino groups. Although the outer membranes are CEMs, and there is no
J (A/m2 )
-120 -100 -80 -60 -40 -20 0 20 40
Vol
tage
(V)
-4
-2
0
2
4
6
8
reference electrodes
working electrodes
Figure 6.2. Voltages as function of the current density J of a RED stack with 25 cells with Fumasep membranes.
112
Chapter 6
direct contact between the electrode rinse and the AEMs, the sea water is circulated through the stack and hexacyanoferrate ions can leak to the sea water and contact the AEMs in this way. To be sure that the membranes are not aff ected by the electrolyte, only a pure NaCl solution is used in the electrode compartments. The salt content in the electrode compartments was maintained at 15 g/L, the mean of the concentrations in sea and river water. In this way a rather constant salt concentration in the electrode rinse is assured.
The potential diff erence over the former stacks - with the reversible hexacyanoferrate system - was measured between platinum electrodes. This is not possible in the NaCl system because a reversible electrochemical couple is lacking here. Therefore, standard Ag/AgCl reference electrodes were used, inserted in small vessels outside the stack. These vessels were connected to the electrode compartments with thin tubes.
A further improvement was the use of silicon gaskets. With this material no leakage was observed. Because these gaskets do not require coating to prevent leakage, the thickness of the gaskets is not aff ected.
6.3. Results and discussion
6.3.1. Experiments with a Fumasep stack of 25 cellsIn this section experiments are described with a stack of 25 cells and Fumasep membranes. In the next paragraph (Section 6.3.2) the properties of this Fumasep FAD/FKD pair are compared with other commercial membrane pairs. We studied power density, thermodynamic effi ciency, and ion transport behavior for diff erent RED stacks. Typical experimental results (voltage and power density as function of the current density) are shown in Figure 6.2 and Figure 6.3.
6.3.1.1. Determination of the power density.The RED stack was connected to the potentiostat and measurements were performed at fi xed current densities. At each current density we determined the (i) fl ow rates of the outlets, (ii) water conductivities and temperatures at the inlets and outlets, (iii) voltage on the working electrodes, and (iv) voltage on the reference electrodes. Conductivities were converted in concentrations.
In Figure 6.2 and following, positive current density implies normal electrodialysis (ED) operation; the negative current densities are related to RED. Current densities lower than the short cut current (<80 A/m2) cause a negative potential on the reference electrodes.
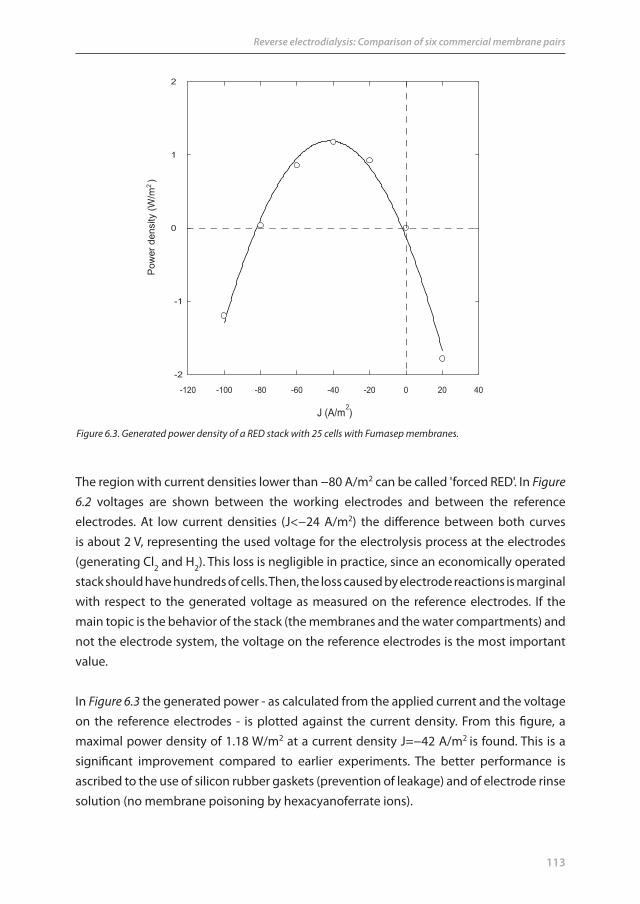
113
Reverse electrodialysis: Comparison of six commercial membrane pairs
The region with current densities lower than −80 A/m2 can be called 'forced RED'. In Figure 6.2 voltages are shown between the working electrodes and between the reference electrodes. At low current densities (J<−24 A/m2) the diff erence between both curves is about 2 V, representing the used voltage for the electrolysis process at the electrodes (generating Cl2 and H2). This loss is negligible in practice, since an economically operated stack should have hundreds of cells. Then, the loss caused by electrode reactions is marginal with respect to the generated voltage as measured on the reference electrodes. If the main topic is the behavior of the stack (the membranes and the water compartments) and not the electrode system, the voltage on the reference electrodes is the most important value.
In Figure 6.3 the generated power - as calculated from the applied current and the voltage on the reference electrodes - is plotted against the current density. From this fi gure, a maximal power density of 1.18 W/m2 at a current density J=−42 A/m2 is found. This is a signifi cant improvement compared to earlier experiments. The better performance is ascribed to the use of silicon rubber gaskets (prevention of leakage) and of electrode rinse solution (no membrane poisoning by hexacyanoferrate ions).
J (A/m2)
-120 -100 -80 -60 -40 -20 0 20 40
Pow
er d
ensi
ty (W
/m2)
-2
-1
0
1
2
Figure 6.3. Generated power density of a RED stack with 25 cells with Fumasep membranes.

114
Chapter 6
6.3.1.2. Ionic and water transport in a RED stack
6.3.1.2.1. Transport curves. The transport of ions through the membranes can be determined using a mass balance from the fl ows entering and leaving the stack. In Figure 6.4 results are presented for a stack containing 25 cells. In Figure 6.4 the NaCl transport (in mmol∙m-2s-1) to the sea water and to the river water is plotted as a function of the current density J (A/m2). Transport of salt is negative to the sea water and positive to the river water. The dashed lines represent the case of an ideal process (i.e. 100% selective membranes and no osmosis). Two deviations of the ideal behavior are observed: (i) at zero current density there is salt transport and (ii) the transport curves are not symmetrical with respect to the x-axis. The regression lines of the experimental data have high correlation coeffi cients (R2=0.999) indicating that these deviations are not ascribed to random errors.
6.3.1.2.2. Osmosis. The diff erence between the ideal transport and the measured transport in Figure 6.4 is larger for the sea water compartment than for the river water compartment. This is most likely caused by the transport of water from the river water compartment to the sea water compartment through the membranes (osmosis). The transport curves shown in Figure 6.4 are reproducibly determined for 10 diff erent stacks indicating the
J ( A/m2 )
-120 -100 -80 -60 -40 -20 0 20 40
Tran
spor
t NaC
l ( m
mol
-2 -1
)
-0.8
-0.6
-0.4
-0.2
0.0
0.2
0.4
0.6
0.8
sea
river
Max
. po
wer
Figure 6.4. Na Cl fl ux through the membranes in a stack with 25 cells with Fumasep membranes. The dashed lines show the ideal case (100% selective membranes and no osmosis). The transport causes a positive increase of the salt content in the river water and a negative increase in the sea water.

115
Reverse electrodialysis: Comparison of six commercial membrane pairs
asymmetry cannot be ascribed to leakage between the gaskets and membranes.Figure 6.4 shows that the asymmetry of the transport lines is relatively small but nevertheless very clear: At this point the plot suggests that more salt had disappeared from the sea water than transported to the river water. This eff ect of osmosis can be quantifi ed as follows:
For each RED process the salt balance can be written:
(1)
where Φ is the fl ow rate (m3/s) and C the concentration (mol/m3). The subscripts S and R stand for sea and river and the superscripts i en o for in and out.
Concentrations in feed and effl uent are obtained accurately by electrical conductivity measurement. Experimentally, outgoing fl ow rates are much better to measure than the ingoing ones. However, if we consider that the announced asymmetry can be ascribed to osmosis, we can write the following fl ow rate balances:
(2)where Φosm is the o smotic fl ow rate.
Substituting these equations in Eq. (1) result in:
(3)
or(4)
Figure 6.5 shows the calculated osmotic fl ux as function of the applied current density. The osmosis at J=0 A/m2 (where no electro-osmotic eff ects are expected) can be compared with the values of some other ion-exchange membranes. The osmosis at J=0 A/m2 is 9.03 mmol∙m-2s-1. Osmosis most likely has a negative eff ect on the power density in reverse electrodialysis by counteracting the diff usion of the counter ions (by drag) through the membranes and by dilution of the boundary layer on the sea water side of the membrane. Osmosis also decreases the thermodynamic effi ciency. Both eff ects (osmosis and co-ion transport) can be described - analogous to the eff ects in normal batteries - as self discharge.
iR
iR
iS
iS
oR
oR
oS
oS CCCC
osmiR
oRosm
iS
oS ;
iRosm
oR
iSosm
oS
oR
oR
oS
oS CCCC )()(
iR
iS
oR
iR
oR
oS
iS
oS
osm CCCCCC
)()(

116
Chapter 6
The diff usion constant Dwater for these membranes is calculated based on the given salt concentrations:
(5)
with J0w the measured water fl ux (mol∙m-2s-1), δm the membrane thickness (m). ΔCwater
and ΔCsalt are the diff erences of water and the NaCl concentration in the two solutions (in mol/L). From concentration tables it follows that ΔCwater is almost equal to -ΔCsalt for solutions with a concentration less than 0.5 mol NaCl/L.
In principle, for the determination of diff usion constants the concentration gradient in the membrane should be used and not the concentration diff erence of the bulk phases. The existence of boundary layers causes an extra transport resistance. However, in our experiments, we have used rather high fl ow rates to obtain a maximal power in combination with spacers acting as turbulence promoters. The consequence is that the boundary layers are very thin and our diff usion constants (obtained from bulk concentrations) are rather good estimates. Table 6.1 shows that our determined values are in the same range as those determined in literature.
6.3.1.2.3. Electro-osmosis. Figure 6.5 shows that the water fl ux depends on the current density. In comparison with the zero current density behavior, the water transport through the membranes decreases when the cell operates in the RED mode (with a negative current) and at J=−80 A/m2 (near to the shortcut current density), the water transport vanishes. This is caused by electro-osmosis: water is transported with the ions of the salt in a direction opposite the normal osmotic fl ow. The slope of the regression line (y=0.121x+9.03) is the transport of water per coulomb and given in Table 6.1 as tw , the water transport number (mol/F). Electro-osmosis counterbalances the negative eff ect of normal osmosis.
6.3.1.2.4. Co-ion transport. The reason that both lines in Figure 6.4 do not cross the origin (0 A/m2) is the imperfect behavior of the membranes. Ion-exchange membranes are slightly permeable for co-ions (ions with the same charge as the fi xed ion exchange groups). Transport of co-ions at zero current condition appears as NaCl diff usion through the ion-exchange membranes and can be compared with the self-discharge of normal electric batteries. The intersection of the two (solid) transport lines at J=+15 A/m2 in Figure 6.6 indicates the place were migration is balanced by co-ion transport. At higher current density the electrodialysis process is possible. At current densities J<0 A/m2, the reverse electrodialysis process starts. Between 0 and +15 A/m2 the discussed loss phenomena
salt
Mw
water
Mwwater C
JC
JD
00

117
Reverse electrodialysis: Comparison of six commercial membrane pairs
(osmosis and co-ion transport) wins the competition with electrodialysis. This range is of less importance from the viewpoint of RED (no energy production) as well as from the viewpoint of ED (no separation).
The total mass transport Ttotal (mol/s) of NaCl from the sea to the river side in the stack is obtained from the diff erence between the output and input fl ow of the river water:
(6)
Table 6.1. Osmosis values and salt diff usion measured for some ion−exchange membranes.
membrane Reference salt δm Dwater tW Dsalt
C=CEM, A=AEM A/C=mixed values
(m) (m2/s) (mol/F) (m2/s)
A/C: Fumasep FAD/FKD This chapter NaCl 8.0E−05 1.3E−09 11.7 1.3E−11
A/C: Qianqiu homogen. This chapter NaCl 2.5E−04 7.9E−09 − 3.2E−11
A/C: Qianqiu heterogen. This chapter NaCl 5.8E−04 3.9E−09 6.0 2.0E−11
A/C: Neosepta ACS/CMS This chapter NaCl 1.3E−04 9.0E−10 10.1 <2.0E−12
A/C: Neosepta AMX/CMX This chapter NaCl 1.5E−04 5.8E−10 4.6 5.5E−11
C: JJC−82 Jagur− NaCl 2.0E−05 5.8E−11 − 8.0E−14
A: JJA−72 Grodzinski9 ,, 2.0E−05 8.0E−11 − 1.8E−14
A: JJA−5/2PVP ,, ,, 2.0E−05 1.4E−10 − 7.3E−13
C: Nafi on 450 Visser19 NaCl 4.5E−04 2.0E−09 5.3 9.0E−12
A: Neosepta AFN Tasaka20 KCl 1.6E−04 2.4E−09 − −
C: Neosepta C66−10F Tasaka21 KCl 3.6E−04 5.8E−10 − −
C: Flemion AR1.25 ,, ,, 1.0E−04 1.7E−09 − −
C: Nafi on 417 ,, ,, 4.3E−04 3.2E−09 − −
C: Nafi on 120 Narebska22 NaCl 3.0E−04 2.4E−09 5.3 3.0E−11
C: Selemion CMV Schoeman23
,,NaCl 1.3E−04 2.4E−09 10.4 −
A: Selemion AMV ,, 1.3E−04 2.4E−09 10.4 −
A/C Selemion AMV/CMV This chapter NaCl 1.2E−04 1.2E−10 5.1 3.1E−12
C: MC−40−8 Berezina24 − − − 6.5 −
C: MC−40−6 ,, − − − 7.0 −
C: MC−40−4 ,, − − − 9.2 −
C: MC−41−8 ,, − − − 6.7 −
A: MA−41−9 ,, − − − 5.0 −
CL−25T Gnusin25 NaCl − − − 1.5E−11
MC−40 ,, ,, − − − 7.0E−12
Nafi on−117 ,, ,, − − − 6.0E−12
MF−3SC ,, ,, − − − 5.0E−12
SPEEK−1 ,, ,, − − − 1.5E−12
SPS−2 ,, ,, − − − 5.0E−13
iR
iR
oR
oRtotal CCT

118
Chapter 6
The mass transport of NaCl is due to two contributions: a coulombic part (Tcoul) and the part due to the co-ion transport (Tcit)
The coulombic part is obtained from the electrical current through the stack (F is the Faraday constant):
(7)
At RED conditions, the co-ions move through the membranes from the sea water to the river water compartment in the same direction as the counter ions and are measured as an extra salt transport Tcit. This part is obtained by:
(8)
The transport of NaCl from sea to r iver water is corrected for the osmotic fl ow of water. The results are presented in Figure 3.6. The transport of NaCl can be described by the linear relationships y=±0.0053x+0.080 with R2=0.9997. The slopes are very near to the ideal values ( y=±0.0052x ). At zero current the NaCl fl ux (J0
salt) is 0.080 mmol∙m-2s-1. This value is only due to co-ion transport and referred in literature as ‘NaCl diff usion’. It is remarkable
-120 -100 -80 -60 -40 -20 0 20 40
Osm
otic
flux
(mm
ol-2
-1)
-5
0
5
10
15
J ( A/m2 )
Max
. pow
er
Figure 6.5. Osmotic fl ux in a stack with 25 cells with Fumasep membranes.
FITcoul
coultotalcit TTT

119
Reverse electrodialysis: Comparison of six commercial membrane pairs
to note that the water fl ux (on mol base) in the other direction is more than 100 times the NaCl diff usion.
Besides the NaCl fl ux, the diff usion constant Dsalt (in m2/s) can be calculated:
(9)
with J0salt the measured NaCl fl ux (molm-2s-1), δm membrane thickness (m) and ΔCsalt
the diff erence of salt concentration on both sides of the membrane (mol/m3). Table 6.1 shows measured diff usion data of the investigated membrane pairs (in fact the average of the anion and the cation exchange membrane values) compared with data of other membranes. Most data are in the same range.
6.3.1.3. Thermodynamic exergy losses in the systemExergy in our RED system is the maximal amount of electrical energy that can be generated from a given amount of river water and sea water. However, in practice the fraction of generated electrical energy of the exergy content of the incoming water (Y) is less than 100%. The causes are threefold: (i) the reversible mixing of the water is not complete (especially at high fl ow rates), (ii) reversible mixing is only possible at infi nitesimally small current density and (iii) membranes are not ideal (there is an exergy loss by co-ion transport and by osmosis).
Because energy balances are the central theme in this work, the exergy content of the outlet of the RED stack should also to be considered. Therefore, we introduced the concept thermodynamic effi ciency (ηT), defi ned as the generated electrical energy divided by the exergy decrease of the water after passing the RED stack. For a system with ideal membranes, ηT can be 0.5 at maximal power density and may be higher at if the external resistance is increased, resulting in a lower power density.
The eff ect of co-ion transport and osmosis on ηT in a Fumasep cell is investigated in this paragraph.
Diluted salt solutions like river water and sea water can be considered as ideal and on irreversible mixing of the solutions, the temperature eff ect is small. The consequence is that when electrical energy is extracted during reversible mixing (as in a RED stack), the temperature of the water should decrease because the total energy is conserved. However, the eff ect on temperature is small: the maximum amount of energy on reversible mixing of 1 m3 sea water (30 g NaCl/L) with 1 m3 river water (0 g NaCl/L) is 1.6 MJ (Chapter 5)
salt
Msaltsalt C
JD
0

120
Chapter 6
and correspondents with a decrease of 0.2 degree. Thus, although the RED process is an adiabatic process, good estimation of entropy changes can be achieved with an isothermal approximation.
6.3.1.3.1. Exergy losses. The exergy content of two volumes of water with diff erent concentrations and the same temperature is derived from the entropy increase on total mixing of these volumes. The exergy fl ow rate X of two water streams with diff erent salt concentration is the power potential and is presented in Watt. The exergy fl ow rate Xi into a RED stack is given by (Chapter 5; 5, 6):
(10)
In this equa tion, CiM is the hypothetical resulting concentration on total mixing of both
streams:
(11)
During the residence time in the RED stack, the exergy content of the feed (sea water and
-120 -100 -80 -60 -40 -20 0 20 40
-0.8
-0.6
-0.4
-0.2
0.0
0.2
0.4
0.6
0.8
J ( A/m2 )
sea
river
Max
. po
wer
Tran
spor
t NaC
l ( m
mol
-2 -1
)
Figure 6.6. NaCl fl ux corrected for the osmotic fl ux in a stack with 25 cells with Fumasep membranes.
i
M
iSi
SiSi
M
iRi
RiR
i
CC
CCCCRTX lnln2
iS
iR
iS
iS
iR
iRi
MCC
C
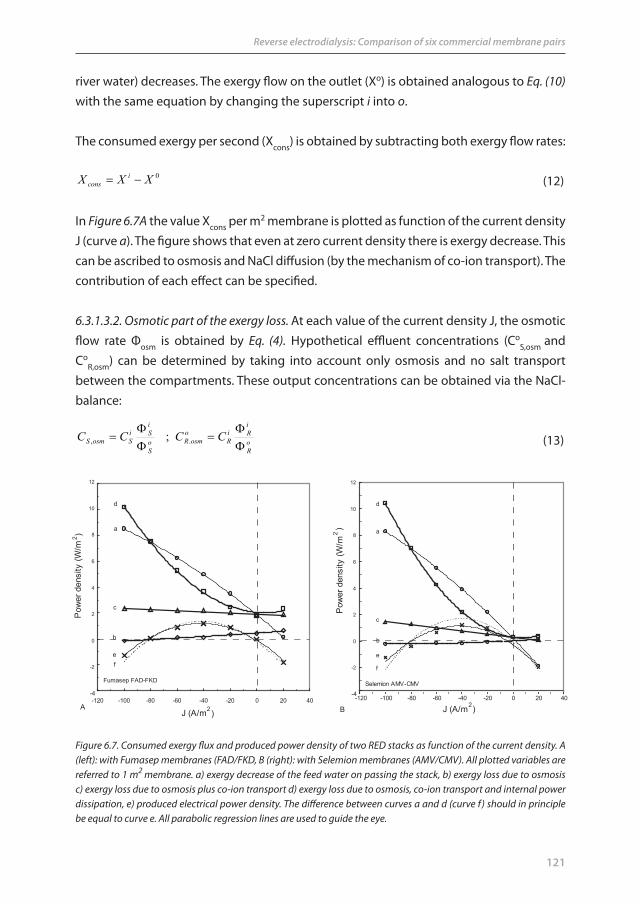
121
Reverse electrodialysis: Comparison of six commercial membrane pairs
river water) decreases. The exergy fl ow on the outlet (Xo) is obtained analogous to Eq. (10) with the same equation by changing the superscript i into o.
The consumed exergy per second (Xcons) is obtained by subtracting both exergy fl ow rates:
(12)
In Figure 6.7A the value Xcons per m2 membrane is plotted as function of the current density J (curve a). The fi gure shows that even at zero current density there is exergy decrease. This can be ascribed to osmosis and NaCl diff usion (by the mechanism of co-ion transport). The contribution of each eff ect can be specifi ed.
6.3.1.3.2. Osmotic part of the exergy loss. At each value of the current density J, the osmotic fl ow rate Φosm is obtained by Eq. (4). Hypothetical effl uent concentrations (Co
S,osm and
CoR,osm) can be determined by taking into account only osmosis and no salt transport
between the compartments. These output concentrations can be obtained via the NaCl-balance:
(13)
Figure 6.7 . Cons umed exergy fl ux and produced power density of two RED stacks as function of the current density. A (left): with Fumasep membranes (FAD/FKD, B (right): with Selemion membranes (AMV/CMV). All plotted variables are referred to 1 m2 membrane. a) exergy decrease of the feed water on passing the stack, b) exergy loss due to osmosis c) exergy loss due to osmosis plus co-ion transport d) exergy loss due to osmosis, co-ion transport and internal power dissipation, e) produced electrical power density. The diff erence between curves a and d (curve f) should in principle be equal to curve e. All parabolic regression lines are used to guide the eye.
0XXX icons
oR
iRi
Ro
osmRoS
iSi
SosmS CCCC
., ;
-120 -100 -80 -60 -40 -20 0 20 40
J (A/m2)
Pow
er d
ensi
ty (W
/m2 )
b
d
e
A
c
f
Fumasep FAD-FKD
-4
-2
0
2
4
6
8
10
12
-120 -100 -80 -60 -40 -20 0 20 40
J (A/m2)
Pow
er d
ensi
ty (W
/m2)
e
B
d
a
c
b
f
Selemion AMV-CMV-4
-2
0
2
4
6
8
10
12
a
122
Chapter 6
With these output concentrations in combination with the measured parameters (input concentrations, output fl ow rates) and the derived input fl ow rates, the osmotic part of the output exergy fl ow rate (Xo
osm) is obtained and with that the osmotic loss Xosm (using Eq. (10) and Eq. (11):
(14)
The obtained osmotic part of the exergy decrease is plotted per square meter used membrane in Figure 6.7A (curve b). At zero current density the osmotic part of the exergy loss is 26% of the total exergy loss and at the optimal current density (J=-42 A/m2) this is only 5%.
6.3.1.3.3. Ionic part of the exergy loss. The diff erence between the measured NaCl transport lines (the solid lines) and the calculated ideal lines (the dashed lines) in Figure 6.6A is the NaCl diff usion due to co-ion transport. The exergy fl ow rate loss of this part is obtained as follows.
Assuming salt transport is caused only by co-ion transport (Tcit), a balance can be written for the sea and river water stream. CS
co,o and CRco,o are the hypothetical effl uent
concentrations:
(15)
In the case of no osmosis, output fl ow rates (ΦSco,o and ΦR
co,o) would be equal to the input fl ow rates:
(16)
Now the output concentrations are known:
(17)
With this output concentrations, output exergy fl ow rate (Xocit) can be calculated. The
exergy loss due to co-ion transport Xcit can be obtained with (using Eq. (10) and Eq. (11):
(18)
oosm
iosm XXX
citiR
iR
iR
ocitRcit
iS
iS
iS
ocitS TCCTCC ,, ;
iR
ocitR
iS
ocitS ,, ;
iR
citiR
iRc
citRiS
citiS
iSo
citSTC
CTC
C
,, ;
ocit
icit XXX

123
Reverse electrodialysis: Comparison of six commercial membrane pairs
In Figure 6.7A the sum of the osmotic part and the co-ion transport part is plotted (curve c). In this case co-ion transport costs much more exergy then osmosis.6.3.1.3.4. Internal power dissipation exergy losses. The next exergy loss is the internal power dissipation (Pi) due to the ionic current through the cell. This part can be obtained by the square of the current and the internal resistance (Ri):
(19)
Because the harvested power (Pu) is related to the external resistance (Ru):
(20)
It follows that(21)
Maximal power output is achieved at Pu=Pi (Chapter 3): in fi rst instance the conclusion seems to be that in this case heat is generated in the RED stack (numerical equal to the electric output power). However, it should be emphasized that in the RED process all generated electrical power is equivalent to the decreased heat content of the feed water. Internal dissipation of heat is in fact a decrease of the cooling of the feed water. From a thermodynamical viewpoint, the mixing process is partially reversible and partially irreversible; at maximum power both parts are 50% and at very small current densities the part of reversible process approaches 100 %.
In practice, the experiments were performed with a potentiostat instead of an external resistance. The voltage measured at zero current is the open circuit voltage (OCV). At current I, the internal power dissipation is calculated by
(22)
where E stands for the voltage on the reference electrodes. This loss is added again to the aforementioned losses (due to osmosis and NaCl leak) and plotted in Figure 6.7A as curve d.
6.3.1.3.5. Extractable part of the exergy. The counterpart of the internal dissipated power - as given by Eq. (22) - is the produced electrical power Pu which is determined as:
(23)
ii RIP 2
uu RIP 2
ui
i
ui
i
RRR
PPP
IEOCVPi )(
EIPu
124
Chapter 6
Curve d in Figure 6.7A includes all exergy losses and curve a is the measured exergy loss; the diff erence between curve d and a can be extracted as usable energy. To verify this statement, the generated power density is also added to the fi gure (curve e). It is now evident now that the diff erence between the curves a and d is near to the power curve e.Especially important is the power density balance at the current density of maximal power density (J=−42 A/m2). Table 6.2 (column c) specifi es the contribution of the diff erent parts, expressed in percent of the exergy decrease of the feed water. Table 6.2 shows a produced power of 23% of the exergy decrease at optimal current density. We will refer to this value as ‘thermodynamic effi ciency' (ηT).
(24)
A related value is the energy effi ciency Y:
(25)
In this chapter we focus on thermodynamic effi ciency. This parameter describes the losses in the cell and is less sensitive to variations of the river and sea water fl ow rate. However, for a real operating RED power plant, the energy effi ciency is a more important process parameter.
6.3.2. Experiments with other membrane pairsThe experiments of Section 6.3.1 with Fumasep membranes were repeated with other membrane pairs: Qianqiu Heterogeneous Ion Exchange Membrane (AEM and CEM), Qianqiu Homogeneous Ion Exchange Membrane (AEM and CEM), Selemion (AMV and CMV), Neosepta (ACS and CMS) and Neosepta (AMX and CMX). The results and derived data are summarized in Table 6.2 and estimated diff usion parameters are added to Table 6.1. All exergy and energy data are expressed as power per m2 membrane area (W/m2).
A new parameter (RP) is introduced in Table 6.2. This response parameter is a product of the power density and the thermodynamic effi ciency (Eq. 26) and is a measure for the most optimal membrane stack confi guration for RED.
(26)
This response parameter allows for an easy ranking of the performance of a RED stack. For RED a high power density and energy effi ciency are preferred. Post et al. showed17 that a high effi ciency (> 80%) could be obtained at a low current density. This would yield a low value of the response product. This highest power density shown in Table 6.2 (1.18 W/m2)
iu
XP
Y
TdP PR
cons
uio
uT X
PXX
P
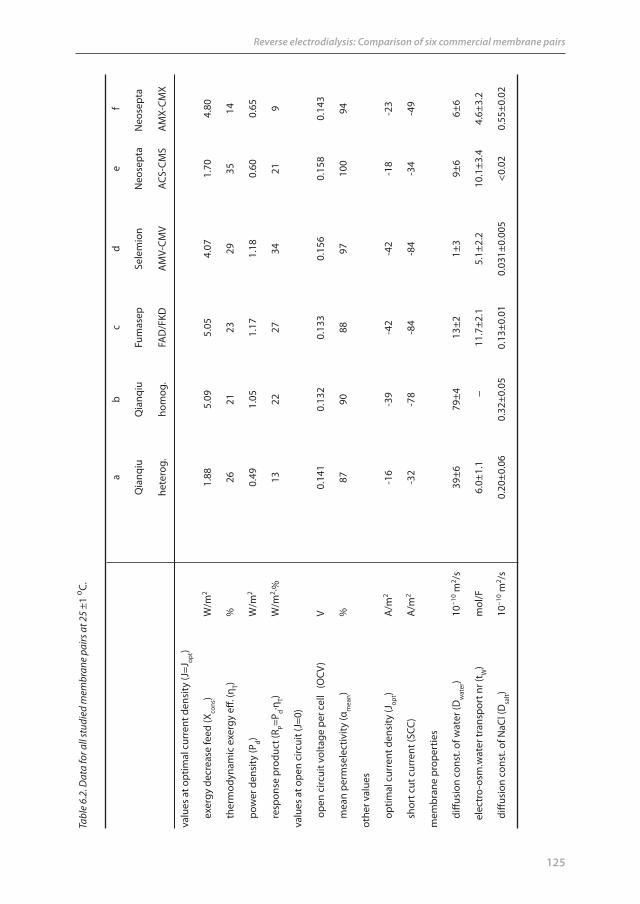
125
Reverse electrodialysis: Comparison of six commercial membrane pairs
a
bc
de
f
Q
ianq
iuQ
ianq
iuFu
mas
epSe
lem
ion
Neo
sept
a N
eose
pta
he
tero
g.ho
mog
.FA
D/F
KD
AM
V-CM
VAC
S-CM
SA
MX-
CMX
valu
es a
t opt
imal
cur
rent
den
sity
(J=J
opt)
e
xerg
y de
crea
se fe
ed (X
cons
)W
/m2
1.88
5.09
5.05
4.07
1.70
4.80
th
erm
odyn
amic
exe
rgy
eff .
(ηT)
%26
2123
2935
14
p
ower
den
sity
(Pd)
W/m
20.
491.
051.
171.
180.
600.
65
re
spon
se p
rodu
ct (R
P=Pd∙η
T)W
/m2 ∙%
1322
2734
219
valu
es a
t ope
n ci
rcui
t (J=
0)
ope
n ci
rcui
t vol
tage
per
cel
l (O
CV)
V0.
141
0.13
20.
133
0.15
60.
158
0.14
3
m
ean
perm
sele
ctiv
ity (α
mea
n)%
8790
8897
100
94
othe
r val
ues
o
ptim
al c
urre
nt d
ensi
ty (J
opt)
A/m
2-1
6-3
9-4
2-4
2-1
8-2
3
s
hort
cut
cur
rent
(SCC
)A
/m2
-32
-78
-84
-84
-34
-49
mem
bran
e pr
oper
ties
d
iff us
ion
cons
t. of
wat
er (D
wat
er)
10−1
0 m2 /s
39±6
79±4
13±2
1±
39±
66±
6
elec
tro-
osm
.wat
er tr
ansp
ort n
r (t W
)m
ol/F
6.0±
1.1
−
11
.7±2
.15.
1±2.
2 10
.1±3
.4
4.6±
3.2
d
iff us
ion
cons
t. of
NaC
l (D
salt)
10−1
0 m2 /s
0.20
±0.0
60.
32±0
.05
0.13
±0.0
10.
031±
0.00
5<0
.02
0.55
±0.0
2
Tabl
e 6.
2. D
ata
fo r a
ll st
udie
d m
embr
ane
pairs
at 2
5 ±1
o C.
126
Chapter 6
is the highest reported in literature up to now. This value can be further improved by optimizing the hydrodynamics in a RED stack (Chapter 5). Table 6.2 also shows the open circuit voltage (OCV), which is a measure for the selectivity of the membrane stack. A 100% selective membrane pair would yield an OCV of 0.158 V. Also shown are the optimal current density at maximal power density and the short cut current. Both values are high for a stack with a high current density. Table 6.2 also lists the membrane transport properties, which are in the same range as those reported in literature (see Table 6.1).
Figure 6.7B shows the exergy fl ux diagram for the Selemion cell. In comparison to the similar plot of the Fumasep cell in Figure 6.7A it is noticeable that the osmotic and co-ion transport losses are much less in the Selemion stack, yielding a higher thermodynamic effi ciency.As can be seen from Table 6.2 there is no clear relationship between the thermodynamic effi ciency and the mean membrane pair selectivity. This is because the thermodynamic effi ciency not only depends on the exclusion of co-ions but also on the chemical nature of the membranes, which aff ects transport phenomena like osmosis and membrane resistance.
The relation between membrane transport properties and structure is not straightforward. We refer to the detailed study on membrane properties in relation to membrane structure to Długołęcki et al.18 and especially on water transport to Berezina at al.26. Długołęcki et al.18 studied the relation between membrane properties and the theoretical performance of a RED stack. They showed that the charge density infl uences membrane permselectivity and resistance but these relations are not linear and depend on the type of membrane. Moreover, they showed that heterogeneous membranes have a relative large membrane resistance due to their membrane structure and a relative low charge density. In our experiments, we found for the only heterogeneous membrane pair in our tests (the Qianqiu heterogeneous pair) indeed a low power density, about 50% lower compared to the other membrane pairs.
6.4. Conclusions
In this chapter we show the experimental thermodynamic effi ciency determined at maximal power density for 6 diff erent commercial membrane pairs. The stacks were operated on artifi cial river and sea water of 1 and 30 g NaCl/L. The highest obtained power density is 1.2 W/m2 for the Fumasep (FAD and FDK) and Selemion (AMV and CMV) combinations. These values are the highest reported in literature for this concentration gradient. The thermodynamic effi ciency (ηT ) is ranged between 14% and 35% where 50%
127
Reverse electrodialysis: Comparison of six commercial membrane pairs
is the maximal possible value at maximal power output. We demonstrated that this non-ideal behavior of the membranes is due to osmosis and co-ion transport and we were able to quantify each eff ect. Higher effi ciencies can be obtained if the stack is operated at lower current densities.
Introduced is the response product (RP), the product of the response parameters. It combines the benefi ts of high power density with high thermodynamic effi ciency and may be a useful ranking parameter. The highest RP (34 W/m2∙%) is achieved with the Selemion (AMV-CMV) pair.
There is no clear relationship between the membrane selectivity and the thermodynamic effi ciency, since many membrane properties like membrane resistance, osmosis and co-ion transport aff ect the transport process. Osmosis and co-ion transport cause a loss in thermodynamic effi ciency. The loss in effi ciency due to osmosis is small compared to co-ion transport. Osmosis is current dependent and is especially low at a current density of maximal power density.
Membranes for RED should combine a low resistance with a high permselectivity. Until now, special RED membranes have not been developed. It is the challenge to develop such membranes for an economically acceptable price.
AcknowledgementThis research was performed at Wetsus, centre of excellence for sustainable water technology. Wetsus is funded by the city of Leeuwarden, the province of Fryslân, the European Union European Regional Development Fund and by the EZ/Kompas program of the Samenwerkingsverband Noord-Nederland. The fi rst author would like to thank the Noordelijke Hogeschool Leeuwarden who has facilitated this research by detaching him to Wetsus, and the participants of the energy theme for their interest and fi nancial contribution. We thank Maarten Biesheuvel (Wetsus) for his comment and contribution to the fi nal text.

128
Chapter 6
Nomenclature
C concentration (mol/m3)Dsalt diff usion constant of NaCl (m2/s)Dwater diff usion constant of water (m2/s)E voltage (V)Ecell electromotive force of one cell (V)Eideal voltage of a cell with ideal membranes (V)F Faraday constant (96485 C/mol)I electrical current (A)J electrical current density (A/m2)J0
w water fl ux at zero current (mol∙m-2s-1)J0
salt NaCl fl ux at zero current (mol∙m-2s-1)N number of cells in a stackP power (W)Pd power density (W/m2)Pi internal dissipated power (W)Pu external power (W)Ppot power potential of a river or country (W)Q fraction of river water available for REDR2 determination coeffi cientR gas constant (8.314 J∙mol-1K-1)Ri internal resistance (Ω)Ru external resistance (load) (Ω)RP response product (W/m2)tw electro-osmotic water transport number (mol/F)Ttotal total mass transport of NaCl (mol/s)Tcoul coulombic part of the NaCl transport (mol/s)Tcit co-ion transport current of NaCl (mol/s) T temperature (K)OCV open circuit voltage (V)SCC short circuit current (A)Xi exergy fl ow rate of the inlet (W)Xo exergy fl ow rate of the effl uent (W)Xcons consumed free energy per second (W)Y energy effi ciency
Greek symbolsα permselectivity of the ion exchange membraneδm membrane thickness (m)ηT thermodynamic effi ciencyΦ fl ow rate (m3/s)
Superscriptsi ino out
129
Reverse electrodialysis: Comparison of six commercial membrane pairs
SubscriptsS seaR riverM equilibriumosm osmoticcit co-ion transport
AbbreviationsAEM anion exchange membraneCEM cation exchange membraneED electrodialysisEMF electromotive forceOCV open circuit voltageRED reverse electrodialysisSCC short circuit current
Defi nitionscompartment space between the membranescell combination of two membranes and two compartmentselectrode system the anode, cathode and electrode rinsestack a number of N cells with an electrode system
References Chapter 6
1 R.E. Pattle, Production of electric power by mixing fresh and salt water in the hydroelectric pile. Nature 174 (1954) 660
2 R.E. Pattle, Electricity from fresh and salt water - without fuel. Chem. Proc. Eng. 35 (1955) 351-354
3 J.N. Weinstein, F.B. Leitz, Electric power from diff erences in salinity: the dialytic battery. Science 191 (1976) 557-559
4 B.H. Clampitt, F.E. Kiviat, Energy recovery from saline water by means of electrochemical cells. Science 194 (1976) 719-720
5 C. Forgacs, Generation of electricity by reverse electrodialysis. BGUN-RDA 178-78 Ben-Gurion University, Israel (1978)
6 C. Forgacs, R.N. O’Brien, Utilization of membrane processes in the development of non-conventional renewable energy sources. Chemistry in Canada 31 (1979) 19-21
7 R.E. Lacey, Energy by reverse electrodialysis. Ocean Eng. 7 (1980) 1-47
8 R. Audinos, Electrodialyse inverse, etude de l’energie electrique obtenue a partir de deux solutions de salinites diff erentes. J. Power Sources 10 (1983) 203-217
9 J. Jagur-Grodzinski, R. Kramer, Novel process for direct conversion of free energy of mixing into electric power. Ind. Eng. Chem. Process Des. Dev. 25 (1986) 443-449
10 R. Audinos, Electric power produced from two solutions of unequal salinity by reverse electrodialysis. Ind. J. Chem. 31A (1992) 348-354
11 I. Rubinstein, J. Pretz, E. Staude, Open voltage in a reverse electrodialysis cell. Phys. Chem. Chem. Phys. 3 (2001) 1666-1667

130
Chapter 6
12 J.W. Post, J. Veerman, H.V.M. Hamelers, G.J.W. Euverink, S.J. Metz, K. Nymeijer, C.J.N. Buisman. Salinity-gradient power: Evaluation of pressure-retarded osmosis and reverse electrodialysis. J. Membr. Sci. 288 (2007) 218-230
13 J. Veerman, J. W. Post, S.J. Metz, M. Saakes, G.J. Harmsen, Reducing power losses caused by ionic shortcut currents in reverse electrodialysis stacks by a validated model. J. Membr. Sci. 310 (2008) 418-430
14 J. Veerman, M. Saakes, S.J. Metz, G.J. Harmsen, Reverse electrodialysis: performance of a stack with 50 cells on the mixing of sea and river water. J. Membr. Sci. 327 (2009) 136-144
15 M. Turek, B. Bandura, Renewable energy by reverse electrodialysis. Desalination 205 (2007) 67-74
16 F. Suda, T. Matsuo, D. Ushioda, Transient changes in the power output from the concentration diff erence cell (dialytic battery) between seawater and river water. Energy 32 (2007) 165–173
17 J.W. Post, H.V.M. Hamelers, C.J.N. Buisman, Energy recovery from controlled mixing salt and fresh water with a reverse electrodialysis system. Environ. Sci. Technol. 42 (2008), 5785–5790
18 P. Długołęcki, K. Nymeijer, S.J. Metz, M. Wessling, Current status of ion exchange membranes for power generation from salinity gradients. J. Membr. Sci. 2008 (2008) 214-222
19 R.C. Visser, Electrodialytic recovery of acids and bases, Multicomponent mass transfer description. Thesis, Groningen 2001
20 M. Tasaka, T. Urata, R. Kiyono, Y. Aki, Solvent transport across anion-exchange membranes under a temperature diff erence and an osmotic pressure diff erence. J. Membr. Sci. 67 (1992) 83-91
21 M. Tasaka, T. Hirai, R. Kiyono, Y. Aki, Solvent transport across cation-exchange membranes under a temperature diff erence and an osmotic pressure diff erence. J. Membr. Sci. 71 (1992) 151-159
22 A. Narebska, S. Koter, W. Kujawski, Ions and water transport across charged Nafi on membranes. Irreversible thermodynamic approach. Desalination 51 (1984) 3-17
23 J.J. Schoeman, J.F. van Staden, Electro-osmotic pumping of sodium chloride solutions. J. Membr. Sci. 132 (1997) 1-21
24 N. Berezina, N. Gnusin, O. Dyomina, S. Timofeyev, Water electrotransport in membrane systems. Experiment and model description. J. Membr. Sci. 86 (1994) 207-229
25 N.P. Gnusin, N.P. Berezina, N.A. Kononenko, O.A. Dyomina, Transport structural parameters to characterize ion exchange membranes. J. Membr. Sci. 243 (2004) 301-310
26 N.P. Berezina, N.A. Kononenko, O.A. Dyomina, N.P. Gnusin, Characterization of ion-exchange membrane materials: Properties vs structure. Adv. Colloid Interface Sci. 139 (2008) 3-28

131
The performance of a scaled-up reverse electrodialysis stack*
Abstract
A scaled-up test stack for reverse electrodialysis was developed with an output of 11 Watt with 50 cells with active membrane dimensions of 25x75 cm2. This is the largest dimension of a reverse electrodialysis stack published so far. The stack was equipped with 3 pairs of electrodes, Qianqiu ion exchange membranes and woven polyamide spacers. We investigated the eff ect of fl ow rate, fl ow path length (25 or 75 cm), operation mode (co-current or counter-current), spacer thickness and segmentation of electrodes. Results were compared with those from small stacks. The main fi nding was that the key parameter for power density is the residence time of fl uids in the cell compartments. Spacers with a thickness of 200 μm were optimal for small stacks (10x10 cm2) but showed high hydrodynamic losses in cells with a fl ow path length of 25 cm. The novel stack generated more power in co-current fl ow than in counter-current fl ow operation. Co-current fl ow has other advantages: local pressure diff erences between sea and river water compartments are low, hence preventing leakage around the internal manifolds and through pinholes in the membranes. Low pressure diff erences also enable the use of very thin membranes (with low electrical resistance) as well as very open spacers (with low hydrodynamic losses) in the future.
* Submitted to Environmental Science & Technology in condensed form as:J. Veerman, M. Saakes, S.J. Metz and G.J. HarmsenElectrical power from sea and river water by reverse electrodialysis:a fi rst step from the laboratory to a real power plant
Chapter 7

132
Chapter 7
7.1. Introduction
Salinity gradient power (SGP) is a potentially clean and sustainable form of energy; and can be generated from the reversible mixing of sea water and river water, producing brackish water and electrical energy. The theoretical energy content of mixing 1 m3 river water with a large surplus of sea water is 2.5 MJ or 1.7 MJ when mixed with 1 m3 sea water (Chapter 5). The global potential of SGP is estimated to be 2.6 TW1 which is more than the global electricity consumption. There are two membrane-based technologies which can convert this potential energy into useful electricity: reverse electrodialysis (RED) and pressure retarded osmosis (PRO). It has been shown that, in the case of river water with seawater, RED is a promising technique2.
Figure 7.1 shows the principle of RED. A number of alternately stacked cation exchange membranes (CEM) and anion exchange membranes (AEM) are separated by spacers. These spacers are open structures that are needed for structural stability of the stack and the promotion of turbulence within the compartments. The spacer fi lled compartments are fed alternately with seawater and river water. The positive ions diff use from sea to river water compartments through the CEMs and the negative ions through the AEMs in the
Figure 7.1. Principle of RED. Positive ions diff use through CEMs from seawater to river water compartments in the direction of the cathode, negative ions diff use through the AEMs in the opposite direction. The ion current in the stack is converted to an electron current at the electrodes via the reversible redox reaction: Ox + e Ox−.

133
The performance of a scaled-up reverse electrodialysis stack
opposite direction. The ion current in the stack is converted to an electron current at the electrodes by redox reactions.
For optimal performance, a RED power plant should generate maximal power from a given river water feed at lowest investment and operational costs. Related to these economical aspects, three response parameters are important: power density, energy effi ciency and net power. A high power density (power generated per m2 membrane) decreases investments not only in membranes but in the whole stack. High energy effi ciency (the percentage of the generated energy from a given amount of feed water compared with the theoretical limit) is favorable for the optimal use of the available water sources. Power density and energy effi ciency are confl icting: for high energy effi ciency large membrane areas at a low power density are necessary (Chapter 5; 3). Hydrodynamic losses due to the pumping of water through a RED stack should be kept to a minimum. A key parameter for the hydrodynamic resistance is the length of the fl ow channel. If only power density and energy effi ciency are maximized, the result of an optimization procedure may be a very small stack with a low power production. Therefore, the total generated power of the stack (the net power) is also an important response parameter.
Post et al. showed that it is possible to extract 85% of the potential energy in a system with recirculating feed water, however, at the price of a low power density4. They also showed the eff ect of multivalent ions on the power output4. Veerman et al. showed that internal short-cut currents are controllable by a proper stack design (Chapter 3); they also quantifi ed the power losses by co-ion transport and osmosis in a RED stack and showed that these losses are substantial (Chapter 6). Długołęcki et al. made an overview of the properties of commercial membranes as possible candidates for application in RED5 and were able to specify the contributions of electrical stack resistance, concentration polarization and spacer shadow eff ects with electric impedance spectrometry, and suggested improvements on the current systems6. Dirkse et al. modeled water fl ows in the compartments using the potential fl ow theory7. With this validated model it is possible to achieve the residence time distribution in a RED compartment.
Up to now all our published experimental work on RED has been done with relatively small stacks (10x10 cm2). In this work we compare the performance of these small laboratory stacks with a scaled-up 25x75 cm2 stack. With this larger stack we will also study new aspects aff ecting the performance, such as: residence time, fl ow direction (co- or counter-current), fl ow velocity, segmentation of electrodes (various current densities as a function of the position in the stack).

134
Chapter 7
7.2. Theoretical
In a RED stack, electricity is produced directly at the working electrodes. A part of the generated energy is lost due to electrode reactions. However, in stacks with a large number of cells, as will be used in a commercially operated RED stack, these losses are relatively low. Besides the working electrodes, stacks were equipped with reference electrodes in the electrode compartments. By measuring the voltage between the reference electrodes, the voltage drop at the working electrodes was eliminated. We used this voltage for determining the stack power.
(1)
where ΦR and ΦS are fl ow rates of river and sea water (m3/s) and ΔPR and ΔPS the pressure drop (Pa) over the river and sea water compartments
The feed water entering a RED stack represents a certain amount of exergy Xi (Chapter 5 8,9);
(2)
where Xi is the exergy fl ow rate if the feed (W), R is the gas constant (8.314 J∙mol-1K-1), T temperature (K), ΦR and ΦS fl ow rates of river and sea water (m3/s) and CR and CS the salt concentrations in the river and sea water (mol/m3). CM is the equilibrium concentration, obtained at total mixing of river and sea water:
(3)
The energy effi ciency Y is the part of the incoming exergy fl ow rate that is converted to electrical power:
(4)
where Pu is the generated electrical energy.
The net energy effi ciency is the amount of generated electrical power (Pu) minus the hydrodynamic loss (Phydr) related to the exergy of the feed water:
(5)
SSRRhydr PPP
M
SSS
M
RRR
i
CCC
CCCRTX lnln2
SR
SSRRM
CCC
iu
XPY
inet
ihydru
net XP
XPP
Y

135
The performance of a scaled-up reverse electrodialysis stack
Besides effi ciency, other important process parameters are power density (Pd) and net power density (Pd−net):
(6, 7)
where A stands for the total active membrane area (AEMs and CEMs together).For theoretical considerations, the term thermodynamic effi ciency (ηT) is used. Here the generated electrical power Pu is related to the diff erence of ingoing (Xi) and outgoing (Xo) exergy fl ow rate of the feed water.
(8)
7.3. Experimental
7.3.1. RED stacksTwo types of stacks were investigated. The ‘small stack’ is described in detail in Chapter 5 and had a functional membrane area of 10x10 cm2. In addition to this, we constructed a novel stack (called ‘large stack’) as shown in Figure 7.2 and Figure 7.3. In this large stack three electrode compartments - each with its own electrodes - were located on each side
AP
PAP
P netd
ud net-;
iou
T XXP
Figure 7 2. Large stack, equipped on the front side with the piping for sea and river water delivery (bottom) and drain (top). Dimensions of the stainless steel end plates are 87 cm by 35 cm. The copper bar in the front connects the 3 cathodes to the power supply. The reference electrodes in the vessels at the top are connected via capillaries to the anolyte and catholyte entrances.
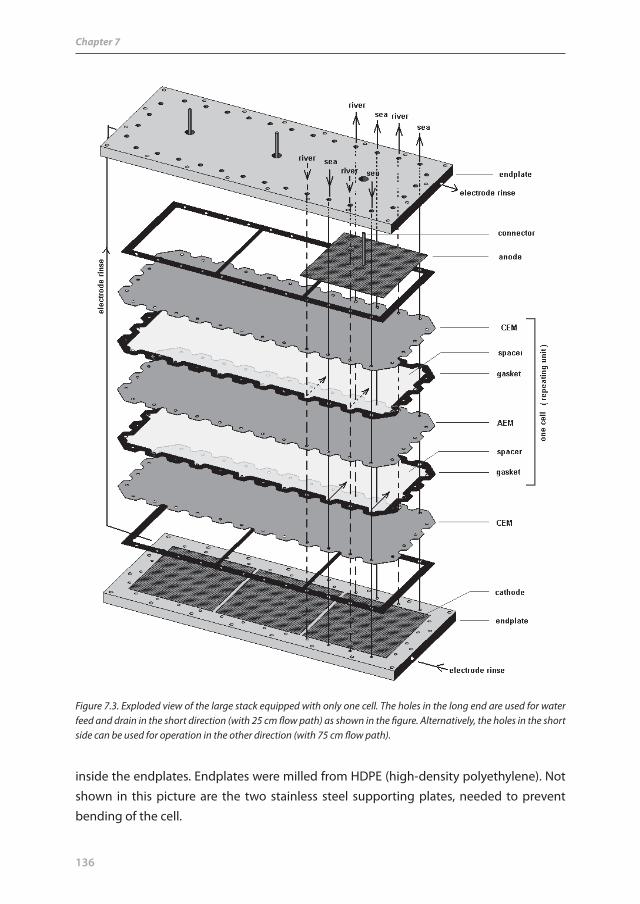
136
Chapter 7
Figure 7.3. Exploded view of the large stack equipped with only one cell. The holes in the long end are used for water feed and drain in the short direction (with 25 cm fl ow path) as shown in the fi gure. Alternatively, the holes in the short side can be used for operation in the other direction (with 75 cm fl ow path).
inside the endplates. Endplates were milled from HDPE (high-density polyethylene). Not shown in this picture are the two stainless steel supporting plates, needed to prevent bending of the cell.

137
The performance of a scaled-up reverse electrodialysis stack
7.3.2. Cells The functional area of one membrane in the large stack was 25x75 cm2 =1825 cm2. On the outsides of the stacks Fumasep FKD cation exchange membranes (Fumatech, Germany) were used as stable end membranes. These membranes are more resistant to chlorine, which evolved at the anode. The inner membranes were Qianqiu (Homogeneous AEM and CEM, Hangzhou Qianqiu Industry Co, China). The stacks were equipped with nylon woven spacers, thickness 200 μm (Nitex 03–300/51, Sefar, The Netherlands); in some experiments with the small stack, 100 μm spacers were used (Nitex 03–190/57). Gaskets were made of silicon micro fi lm with a thickness of 200 μm (SSF-MLTN-940, Specialty Silicone Fabricators, Paso Robles, USA). The stack was equipped with 25 cells and later on expanded to 50 cells.
7.3.3. Electrode system and electrical measurementsThe electrode system and the measurement method were analogous to those of the small stack, which is described in detail in Chapter 5. However, the electrodes used in the large stack were diff erent. Anodes were coated with Ir mixed metal oxides and the cathodes with Ru mixed metal oxides (Magneto Special Anodes, Schiedam, The Netherlands). These electrodes are optimized for one current direction.
Galvanostatic measurements were carried out with an Ivium potentiostat in combination with an Ivium booster (Ivium Technologies, Eindhoven, the Netherlands) which permits measurements up to 20 A at 20 V.
Two types of electrode rinse solutions were employed. In some experiments a solution of (15 g/L) NaCl (0.25 mol/L) was used. This electrolyte is electrolyzed at the electrodes and the electrolysis consumes a large part of the generated energy. However, even in the case of a net negative power production, measurements were possible because a potentiostat was used.
The eff ect of segmentation of the electrode was studied with the hexacyanoferrate electrode solution (K4Fe(CN)6: 0.05 mol/L, K3Fe(CN)6: 0.05 mol/L, NaCl: 0.25 mol/L). With this system electrode losses are much lower than the generated power and therefore it was possible to use 3 variable resistors (slide rheostats of 22 Ω, 5 A) as electrical load instead of 3 potentiostats and boosters.
7.3.4. Sea and river water‘Sea water’ consisted of 30 g NaCl/L and ‘river water’ of 1 g NaCl/L. A conductivity meter with a Tetracon 325 cell (WTW, Weilheim, Germany) was used. For the delivery of sea and river water and for recirculation of the electrode rinse, peristaltic pumps were used. Temperature was controlled at 298±1K for all experiments.

138
Chapter 7
7.3.5. Flow rate and pressure measurementsFlow rates were determined gravimetrically. Pressure diff erences were measured with a Deltabar S (Endress + Hauser, Germany) diff erential pressure gauge between inlet and outlets. Hydrodynamic losses were determined as the product of fl ow rate and pressure diff erence.
7.4. Results and discussion
7.4.1. Eff ects of scale-upIn this part, we compare the experimental results of the scaled up (large) stack (25x75 cm2) with the performance of the small stack (10x10 cm2). In order to compare both stacks, identical experimental conditions were used.
7.4.1.1. Eff ect of the residence time on the power densityAt high fl ow rates, it is expected that the power density is maximal because the concentration diff erence between the fresh and salt water on both sides of the membrane is nearly unaff ected by the transport of salts through the membrane. However, it should be taken into account that hydrodynamic power losses lower the net power output and is minimal at low fl ow rates. So, there exists an optimal fl ow rate for the maximal net power density. This optimum was determined for the large stack, containing 50 cells with Qianqiu homogeneous membranes, at diff erent fl ow rates. The fl ow direction was vertical (fl ow
I (A)
-10 -8 -6 -4 -2 0
P (W
)
0
2
4
6
8
10
12
0.611.
30
2.542.
71
3.68
L /
min
3.17
1.89
Figure 7.4. Power curves for a Qianqiu stack with 50 cells in the ‘large stack’. Flow rates vary from 0.61 L/min (lowest line) to 3.68 L/min (upper line).
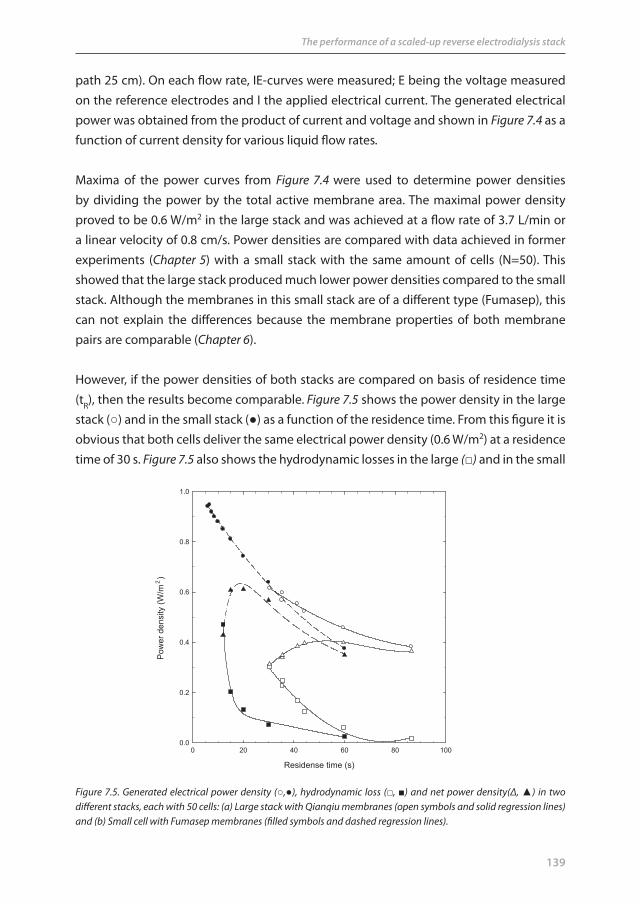
139
The performance of a scaled-up reverse electrodialysis stack
path 25 cm). On each fl ow rate, IE-curves were measured; E being the voltage measured on the reference electrodes and I the applied electrical current. The generated electrical power was obtained from the product of current and voltage and shown in Figure 7.4 as a function of current density for various liquid fl ow rates.
Maxima of the power curves from Figure 7.4 were used to determine power densities by dividing the power by the total active membrane area. The maximal power density proved to be 0.6 W/m2 in the large stack and was achieved at a fl ow rate of 3.7 L/min or a linear velocity of 0.8 cm/s. Power densities are compared with data achieved in former experiments (Chapter 5) with a small stack with the same amount of cells (N=50). This showed that the large stack produced much lower power densities compared to the small stack. Although the membranes in this small stack are of a diff erent type (Fumasep), this can not explain the diff erences because the membrane properties of both membrane pairs are comparable (Chapter 6).
However, if the power densities of both stacks are compared on basis of residence time (tR), then the results become comparable. Figure 7.5 shows the power density in the large stack (○) and in the small stack (●) as a function of the residence time. From this fi gure it is obvious that both cells deliver the same electrical power density (0.6 W/m2) at a residence time of 30 s. Figure 7.5 also shows the hydrodynamic losses in the large (□) and in the small
Residense time (s)
0 20 40 60 80 100
Pow
er d
ensi
ty (W
/m2)
0.0
0.2
0.4
0.6
0.8
1.0
Figure 7.5. Generated electrical power density (○,●), hydrodynamic loss (□, ■) and net power density(Δ, ▲) in two diff erent stacks, each with 50 cells: (a) Large stack with Qianqiu membranes (open symbols and solid regression lines) and (b) Small cell with Fumasep membranes (fi lled symbols and dashed regression lines).

140
Chapter 7
stack (■). Due to the longer fl ow path in the large stack, the hydrodynamic losses are also larger in this stack. Higher fl ow rates could not be obtained in this stack due to the higher hydrodynamic resistances in the large stack, and therefore residence times are generally higher.
Net power density, which is the diff erence between power density and hydrodynamic loss, is plotted in Figure 7.5 for the large (Δ) and the small stack (▲). For the large stack a maximal net power density of 0.4 W/m2 is achieved at a residence time of 50 s and the hydrodynamic loss is 13 % from the generated electrical power. For the small stack the maximal net power density of 0.6 W/m2 is obtained at a residence time of 20 s and the hydrodynamic loss is 18%.
Figure 7.6 compares data of experiments with diff erent process parameters. First, there is the small stack (□) equipped with Fumasep membranes and the large stack (Δ, ◊ and x) with Qianqiu membranes. Second, the fl ow directions are varied: the small stack (□) is operated in cross-current fl ow (the direction of the sea water and river water are perpendicular) and the large cell is operated with co-current fl ow (Δ and ◊) or with counter-current fl ow (x). Third, the number of cells diff ers: some experiments are performed with 25 cells (□ and Δ) other with 50 cells (◊ and x).
Residence time (s)
0 50 100 150 200
Pow
er d
ensi
ty (W
/m2)
0.0
0.2
0.4
0.6
0.8
1.0
1.2
Figure 7.6. Power densities of diff erent stacks and diff erent operational modes. □: small stack (10x10cm2), 50 cells, Fumasep membranes, cross current; Δ: large stack (25x75 cm2), 50 cells, Qianqiu, co-current, ◊: large stack, 25 cells, Qianqiu, co-current, x: large cell, 25 cells, Qianqiu, counter-current. The logarithmic regression line is added to guide the eye.

141
The performance of a scaled-up reverse electrodialysis stack
The main conclusion from Figure 7.5 and Figure 7.6 is that the residence time is the key parameter governing the power density. The generated electricity in diff erent stacks with the same spacers is largely independent of fl ow direction, membranes, cell dimensions and the number of cells. The small infl uence of the fl ow direction is discussed in 7.4.1.2. The independence of the membranes is most likely due to comparable membrane properties (electrical resistance, permselectivity) (Chapter 6) and by the fact that the electrical cell resistance is mainly determined by the electrical resistance of the river water compartment (Chapter 5). The eff ect of the number of cells in a stack (N) is probably too small for the two applied values of N (N=25 and N=50) to give diff erent results due to shortcut currents (Chapter3).Moreover, it is found that the application of spacers of 200 μm in combination with a fl ow path length of 25 cm causes unacceptable friction losses. With a thicker spacer these losses can be reduced; however, due to the increased electrical resistance of the river water compartment, the net power will be lower than the net power of the small stack.
7.4.1.2. Eff ect of the residence time on the energy effi ciencyAt low fl ow rates (long residence times), it is expected that the energy effi ciency is maximal because the equilibrium concentrations can be approached and hydrodynamic power losses are minimal. However, at very low fl ow rates, losses due to co-ion transport and osmosis start to play a signifi cant role (Chapter 6). Therefore, also for maximal energy effi ciency, there exists an optimal fl ow.
Net energy efficiency
0.0 0.1 0.2 0.3 0.4 0.5
Net
pow
er d
ensi
ty (W
/m2)
0.2
0.3
0.4
0.5
0.6
0.7
0.8
Figure 7.7. Net power density as function of the net energy effi ciency in the small stack (Δ) and in the large stack (□).

142
Chapter 7
Figure 7.7 shows the net energy effi ciency (Ynet) of a small stack and a large stack on as a function of the delivered net power (Pd-net) It should be emphasized that all power measurements were done at maximal power density. At these conditions only 50% of the potential power is harvested. This can be explained with a classical electric cell model with an internal electrical resistance (Ri) and an electrical load Ru. Maximal power is delivered on Ru if Ru=Ri. In this case the 50% of the electricity is dissipated in Ri, the other 50% utilized in Ru (Chapter 6).
If maximal power is required, Figure 7.7 is clear: the small stack performs the best. Maximal net power density for the small stack is 0.71 W/m2, about twice the value of the large stack (0.40 W/m2). The net energy effi ciency is at this point for 12% for the small stack and 18% for the large stack; the part of energy lost in hydrodynamic friction is 13% respectively 16%.
Higher energy effi ciency is possible by applying a lower fl ow rate. The upper graph of the small cell in Figure 7.7 illustrates this: If a net energy effi ciency is required of 30%, this is possible at the cost of a reduced net power density of 0.35 W/m2.
7.4.2. Co-current or counter currentIn many processes, like heat exchange and dialysis, the process can be performed in co-current and in counter-current mode. In most cases, counter-current operation is more effi cient due to its higher driving force and it should be investigated whether this is also the case for RED.
Co-current and counter-current operation were tested in the large stack (Figure 7.2 and Figure 7.3), equipped with 25 Qianqiu cells. The fl ow direction was vertical (fl ow path 25 cm); in the co-current mode, both sea and river water fl ow upwards and in the counter-current mode the direction of the river water fl ow is inverted. The electrode rinse solution contained NaCl (15 g/L) and the power was derived from the EI-curves. Figure 7.8 shows the generated power density for both fl ow directions Figure 7.8 shows that co-current operation yields a little higher power densities (about 0.05 W/m2) compared to counter current fl ow. This is at fi rst sight rather surprising, because in many processes, counter-current operation is more effi cient.
A part of the explanation of this behavior is the existence of two counteracting eff ects on the generated power density in the cell. In co-current operation the generated voltage is maximal near to the inlet. However, the conductivity of the river water is small at this point, resulting in a rather small current. On the outlet side, the Nernst potential is lower

143
The performance of a scaled-up reverse electrodialysis stack
but the conductivity of the river water compartment is higher. This results in a relatively constant power density on each position in the cell. Another part of the explanation is the internal deformation in the stack. In counter-current operation the pressures between sea and river water compartments are very diff erent; only in the middle of the stack, they are equal. Therefore, the spacers in the sea water compartments are compressed on one side of the stack and the river water spacers are compressed at the other side. This may result in local deformations of the fl ow path with an increase of the hydrodynamic loss and not optimal residence times.
The higher power densities in the co-current operation, have favorable implications on the design of large economical operated RED stacks. By using co-current feed, the pressure between the sea water and the river water compartments is very small. Therefore, leakage around the membranes in the surroundings of the manifolds inside the stack and leakage through pinholes in the membranes is minimal. Besides this, very thin and delicate low electrical resistance membranes can be used with the opportunity to give high power densities. For spacer materials the yielded profi t is that they can be made with a delicate open structure, as necessary for low hydrodynamic losses, and are not compressed by high pressures diff erences.
Flow rate (L/min)
1 2 3 4
Pd (
W/m
2)
0.0
0.2
0.4
0.6
0.8
1.0
co-current
counter-current
Figure 7.8. Co-current (□) and counter- current (Δ) operation of the large stack.
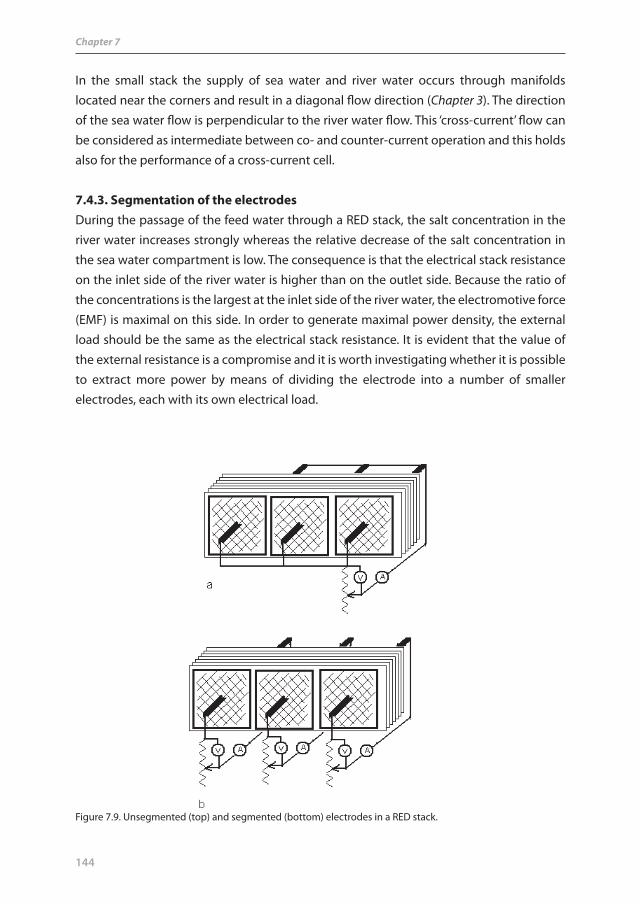
144
Chapter 7
In the small stack the supply of sea water and river water occurs through manifolds located near the corners and result in a diagonal fl ow direction (Chapter 3). The direction of the sea water fl ow is perpendicular to the river water fl ow. This ‘cross-current’ fl ow can be considered as intermediate between co- and counter-current operation and this holds also for the performance of a cross-current cell.
7.4.3. Segmentation of the electrodesDuring the passage of the feed water through a RED stack, the salt concentration in the river water increases strongly whereas the relative decrease of the salt concentration in the sea water compartment is low. The consequence is that the electrical stack resistance on the inlet side of the river water is higher than on the outlet side. Because the ratio of the concentrations is the largest at the inlet side of the river water, the electromotive force (EMF) is maximal on this side. In order to generate maximal power density, the external load should be the same as the electrical stack resistance. It is evident that the value of the external resistance is a compromise and it is worth investigating whether it is possible to extract more power by means of dividing the electrode into a number of smaller electrodes, each with its own electrical load.
Figure 7.9. Unsegmented (top) and segmented (bottom) electrodes in a RED stack.
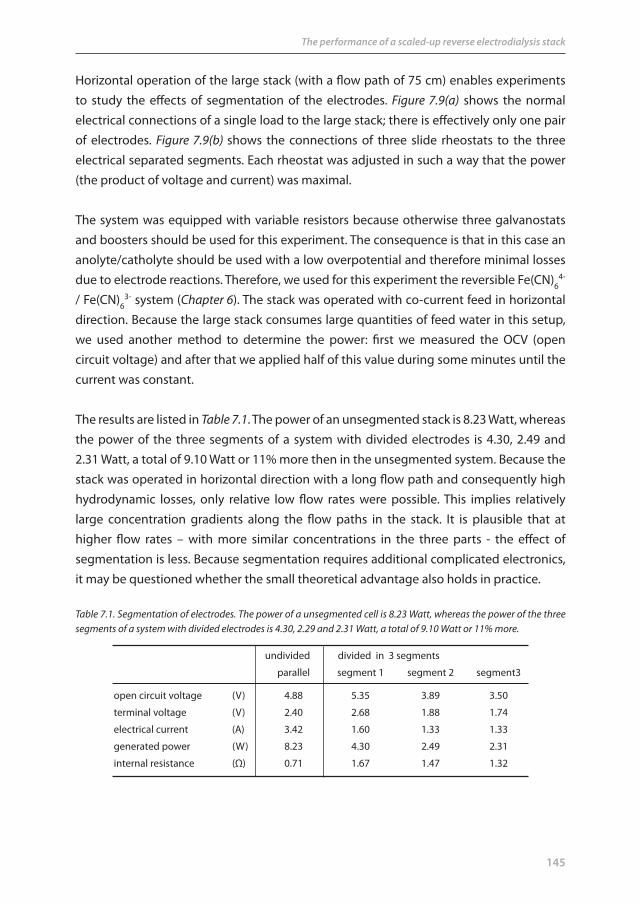
145
The performance of a scaled-up reverse electrodialysis stack
Horizontal operation of the large stack (with a fl ow path of 75 cm) enables experiments to study the eff ects of segmentation of the electrodes. Figure 7.9(a) shows the normal electrical connections of a single load to the large stack; there is eff ectively only one pair of electrodes. Figure 7.9(b) shows the connections of three slide rheostats to the three electrical separated segments. Each rheostat was adjusted in such a way that the power (the product of voltage and current) was maximal.
The system was equipped with variable resistors because otherwise three galvanostats and boosters should be used for this experiment. The consequence is that in this case an anolyte/catholyte should be used with a low overpotential and therefore minimal losses due to electrode reactions. Therefore, we used for this experiment the reversible Fe(CN)6
4- / Fe(CN)6
3- system (Chapter 6). The stack was operated with co-current feed in horizontal direction. Because the large stack consumes large quantities of feed water in this setup, we used another method to determine the power: fi rst we measured the OCV (open circuit voltage) and after that we applied half of this value during some minutes until the current was constant.
The results are listed in Table 7.1. The power of an unsegmented stack is 8.23 Watt, whereas the power of the three segments of a system with divided electrodes is 4.30, 2.49 and 2.31 Watt, a total of 9.10 Watt or 11% more then in the unsegmented system. Because the stack was operated in horizontal direction with a long fl ow path and consequently high hydrodynamic losses, only relative low fl ow rates were possible. This implies relatively large concentration gradients along the fl ow paths in the stack. It is plausible that at higher fl ow rates – with more similar concentrations in the three parts - the eff ect of segmentation is less. Because segmentation requires additional complicated electronics, it may be questioned whether the small theoretical advantage also holds in practice.
Table 7.1. Segmentation of electrodes. The power of a unsegmented cell is 8.23 Watt, whereas the power of the three segments of a system with divided electrodes is 4.30, 2.29 and 2.31 Watt, a total of 9.10 Watt or 11% more.
undivided divided in 3 segments
parallel segment 1 segment 2 segment3
open circuit voltage (V) 4.88 5.35 3.89 3.50
terminal voltage (V) 2.40 2.68 1.88 1.74
electrical current (A) 3.42 1.60 1.33 1.33
generated power (W) 8.23 4.30 2.49 2.31
internal resistance (Ω) 0.71 1.67 1.47 1.32

146
Chapter 7
7.4.4. Hydrodynamics; eff ect of fl ow path lengthHydrodynamic losses to and within the stack are important issues in the design of a RED generator. In this chapter we will focus on the stack and not on the supply of sea and river water from the sources (river and sea) to the stack. In our test equipment, pressure diff erence was measured between supply and drain, just outside the branching to the diff erent inlets and outlets. Therefore, we measured pressure drop due to the fl uid resistance in (i) the manifolds (the white tubing, visible in Figure 7.2), (ii) the bores through the stack, (iii) the spacer fi lled part of the compartments just around the supply and drain holes and (iv) the part of the spacer fi lled compartment where a rather uniform fl ow exists. Fluid resistance of the external tubing is negligible, because this system is well over-dimensioned. Likewise, the fl uid resistance in the internal bore-holes is very low because these channels are only 3 cm deep. However, the resistance around the inlet and outlet holes in the spacer can be very high. All feed water enters the compartments radially from these holes with relative high fl uid velocities7. We shall refer to this part as ‘radial spacer resistance’. After passing some distance in the spacer fi lled compartment, the fl ow is reasonable uniform and we will call this ‘uniform spacer resistance’.
The large stack makes it possible to distinguish between radial and uniform spacer resistance if vertical fl ow is compared with horizontal fl ow. The fl ow path in vertical direction is 25 cm and in horizontal direction 75 cm. However, the distance between the inlets (and also between the outlets) is the same in both directions.
Figure 7.10 shows pressure as function of the fl ow rate in the large stack for the two kinds of operation: horizontal (□) and vertical (Δ) (both in co-current mode). Data are obtained from diff erent experiments. Regression lines are added to the fi gure: y = 0.406x + 0.088; R2 = 0.96 for horizontal operation and y = 0.169x + 0.005; R2 = 0.93 for vertical operation. The slope of the regression line for horizontal operation (0.406) is 2.4 times the slope for vertical operation (0.169). This is remarkable because at horizontal operation the length of the fl ow path is three times and the width of the fl ow path one third of the values at vertical operation (the reduction of the width causes a threefold fl uid velocity at the same fl ow rate). If the ‘uniform spacer resistance’ contributes only to the total hydrodynamic resistance, a factor 9 should be expected.
As stated, a high fl uid resistance is expected around the feed holes in the spacer material. In a specifi c compartment, the feed water enters the compartment at two places and leaves at two other outlet holes; in vertical operation there are 6 inlet and outlet holes. If these places would be the sole source of hydrodynamic resistance, we would expect a factor 3 for the slope ratio. The actual factor is close to this value and the conclusion is that

147
The performance of a scaled-up reverse electrodialysis stack
most of the fl uid resistance can be ascribed to the direct surroundings of the inlet and outlet places within the spacer. Studies of Dirkse et al.7 support this idea: pictures from modeled velocity fi elds show high velocities around these places.
There are some possible measures to decrease the fl uid resistance. The total cross-sectional area of the supply and drain channels through the stack should not be increased, because in that case the eff ect of shortcut currents would be unacceptable (Chapter 3). However, it is possible to make more inlet and outlet places with the same total cross-sectional area. Another option is to use special very open spacers around the inlet and outlet holes.
7.4.5. Hydrodynamics; eff ect of spacer thicknessSpacer thickness is a key parameter in stack design. Although the fl uid resistance can be decreased by application of thick spacers, the electrical cell resistance increases in that case and it is clear that there is an optimal spacer thickness for a given stack. However, the electrical area resistance is due to an ionic current perpendicular to the membranes and is independent of length and width of the cell, while the fl uid resistance is lateral and increases with a longer fl ow path. Therefore, the optimal spacer thickness is dependent on the dimensions of the stack.
Flow rate (L/min)
0 1 2 3 4 5
Pre
ssur
e dr
op (B
ar)
0.0
0.5
1.0
1.5
2.0
Figure 7.10. Pressure drop as function of the fl ow rate in the large stack for diff erent lengths of the fl ow path. Squares (□) indicate horizontal operation (75 cm), triangles (Δ) vertical operation (25 cm). Data are obtained from diff erent experiments as well as for sea water fl ow as for river water fl ow.

148
Chapter 7
The eff ect of spacers was tested in the small stack. We equipped the small stack, containing 5 cells, successively with 200 μm and 100 μm spacers (Table 7.2). The generated electrical power increased with 19% after the 200 μm spacers were replaced by the100 μm spacers. However, due the large hydrodynamic losses, this resulted in a negative net power. Figure 7.11 shows a comparison between the hydrodynamic properties of the two spacers. The hydrodynamic resistance (as calculated from the average of the slopes of sea and river water fl ow) of the 100 μm spacer is 5.4 times higher than of the 200 μm spacer or 2.7 times higher if based on the same spacer thickness.
In order to compare the performance of the two spacer materials, which have diff erent wire thicknesses and porosities, we determined the lateral transport through spacers (embedded between membranes). If there are two similar spacers A and B with thicknesses δA and δB, and wire diameter δA/2 and δB/2, the ratio of diameter of the water channels will be δA/δB. The straight lines in Figure 7.11 indicate laminar fl ows within the compartments. Following the Hagen-Poiseuille equation for laminar fl ow, one may expect that at the same mean velocity, the relative pressure drop in A and B is (δB/δA)2. In our case with
Flow rate (mL/min)
0 20 40 60 80 100 120 140 160
Pre
ssur
e dr
op (m
illib
ar)
0
200
400
600
800
1000
1200
1400
1600
Figure 7.11. Pressure drop as function of the fl ow rate in the small stack for diff erent spacer thicknesses. Squares (■, □) indicate sea water and triangles (▲, Δ) river water fl ow. Open symbols (□, Δ) refer to 200 μm and fi lled symbols (▲, ■) to 100 μm spacers.
spacer thickness porosity wire diameter
type (μm) (%) (μm)
03-300/51 200 67 122
03-190/57 100 74 62
Table 7.2. Used spacer materials. Spacers are woven from polyamide 6.6.

149
The performance of a scaled-up reverse electrodialysis stack
spacers of 100 μm and 200 μm we would expect a pressure drop factor of 4. We found only a factor 2.7. This may be ascribed to (i) the somewhat more open structure of the thin spacer (porosity 74%) in relation to the thick one (porosity 67%), (ii) deviations of the actual from the nominal spacer thickness and porosity in the tightly fastened stacks and (iii) the impossibility to use the Hagen-Poiseuille equation.
To verify the possibility of the existence of a laminar fl ow, the Reynolds number (Re), is calculated. Spacer fi lled compartments have some resemblance to packed beds and therefore we apply the concerning equation for Re10:
(9)
Here, ρ stands for density of the fl uid, v0 for superfi cial velocity (hypothetical velocity for the bed without fi lling but with the same volumetric fl ow rate), Dp for particle diameter, μ for dynamic viscosity and ε for porosity. Typical values in RED are: ρ=1000 kg/m3, v0=0.03 m/s, Dp=10-4 m, μ= 0.001 Pa∙s and ε=0.7, resulting in Re=8. This value is low enough to ensure laminar fl ow, even around the inlet and outlet holes were the velocity may me much larger.
Although the packed bed theory was developed for more densely packed beds (0.35<ε<0.45) with spherical particles, we will use Ergun relation as an approximation of the pressure drop gradient (ΔP/L)10:
(10)
The left term between the brackets is due to laminar fl ow, the right term due to turbulence. With the typical RED values from the foregoing paragraph (v0=0.03 m/s, Dp=10-4 m and ε=0.7) it proves that ΔP/L=1.0∙105 Pa/m. For the 200 micron spacer we measured with the same velocity a pressure drop of 2.7∙104 Pa. The distance between inlet and outlet hole is 0.15 m and the pressure gradient is, using this distance, 1.8∙105 Pa/m. However, the concept of velocity is ambiguous in the small stack with a complicated velocity vector fi eld and the calculated value is only an approximation.
It is more realistic to compare the two spacers if we assume that the velocity vector fi eld in the two spacers is the same. With the discussed typical RED values it turns out that the contribution of the turbulence to the total pressure gradient is only 4% and therefore we can ignore the concerning part in Eq. (10), resulting in:
)1(32Re 0
pDv
75.1)1(1701
03
20
Pp DvDv
LP

150
Chapter 7
(11)
For two spacers with the same porosity, the ratio of the pressure gradient is inversely proportional to Dp
2. With wire diameters of 62 μm and 122 μm for both spacers, the ratio is 3.9. However, the porosities are also diff erent: ε=0.74 for the thin spacer and ε=0.67 for the thick spacer. With these diff erent porosities the ratio is 1.8. The measured ratio is 2.4. The result of the Ergun equation is strongly dependent on the value of the porosity. Small variations in ε result in large deviations of dP/L; if taken the value ε =0.70 for the thin spacer in stead of ε =0.69, the result would be ΔP/L=2.5 Pa/m.We conclude that:- the pressure gradient is inversely proportional to the square of the wire thickness,- deviations in our experiments from that relation can be probably ascribed to diff erences in porosity,- an open spacer structure is very important for the pressure gradient.
7.4.6. Net power density and net energy effi ciency in the large stackFor RED, there are three relevant response parameters: power, net power density and net energy effi ciency. Power density and energy effi ciency are counteracting to a certain degree and it can be questioned whether this also holds for net power density and net energy effi ciency. For a high power density a rather constant concentration of sea and river water during the pass through the compartments is benefi cial. This can be achieved by applying high fl ow rates. However, for the net power density (Pd-net) the hydrodynamic losses are subtracted from the power density and there should be an optimum fl ow rate. Net energy effi ciency (Ynet) is dependent on Pd-net and on the incoming exergy fl ow rate as stated in Eq. (5). At high fl ow rates much of the exergy is unused but at low fl ow rates the eff ects of co-ion transport and osmosis result in irreversible mixing of the sea and river water. Therefore, also for Ynet there is an optimum fl ow. This may have implications for the design of the stack: optimal fl ow rates for a power full stack (high Pd-net) may be diff erent for an energy effi cient stack (high Ynet).
The experiments with the large stack enabled us to study the optimum residence time for both response parameters. In 4.2 we compared the net power density in the co-current mode with the counter-current mode. The eff ect on the power density seemed to be small and we pooled the results. In 4.4. we investigated the pressure drop in vertical (25 cm) and horizontal (75 cm) operation. As stated in 4.2.1 the residence time is an important parameter for stack performance. Therefore, we made plots of net power density (Figure 7.12) and net energy effi ciency (Figure 7.13) as function of the residence time.
170)1(3
2
20
pDv
LP

151
The performance of a scaled-up reverse electrodialysis stack
Residence time (s)
0 50 100 150 200
Net
pow
er d
ensi
ty (W
/m2)
-0.6
-0.4
-0.2
0.0
0.2
0.4
Figure 7.12 Net power density as function of the residence time. Triangles (▲, Δ) indicate vertical and squares (■, □) horizontal feed; open symbols (Δ, □) refer to co-current operation and fi lled ▲, ■) to counter current operation. The parabolic regression lines do not distinguish between co- and counter operation.
Residence time (s)
0 50 100 150 200
Net
ene
rgy
effic
ienc
y (%
)
-10
0
10
20
Figure 7.13. Net energy effi ciency as function of the residence time. Triangles (▲, Δ) indicate vertical and squares (■, □) horizontal fl ow; open symbols (Δ, □) refer to co-current operation and fi lled symbols (▲, ■) to counter current operation. The parabolic regression lines do not distinguish between co- and counter operation.

152
Chapter 7
As seen in Figure 7.12 and in Figure 7.13, the maxima for net energy effi ciency and for net power density were achieved at residence times between 100 and 130 s. This holds for horizontal as well as for vertical fl ow. The conclusion seems to be that optimizing with Pd-net as response parameter gives roughly the same results as optimizing using Ynet for that purpose. To get a fl exible design, suited on demand for power or for effi ciency, a useful response parameter might be the response product Rp = Pd-net ∙Ynet (Chapter 6).
7.4.7. Thermodynamic effi ciency of the large stackIn the theoretical section in this chapter, the thermodynamic effi ciency ηT was introduced and defi ned in Eq. (8). This variable is independent of hydrodynamic losses and also independent of electrode reactions because the stack voltage is measured using reference electrodes. Factors that aff ect ηT in a negative sense are fl uid leakage, co-ion transport (Chapter 6), osmosis (Chapter 6), electrical power dissipation and parasitic currents (Chapter 3). Leakage can occur through pinholes in the membranes and around inlet and outlet holes. Electrical energy can be dissipated in the resistive parts of the cell: the membranes and the water compartments, especially the river water compartments. If power is generated at conditions of maximal power, the electrical resistance of the external load is equal to the internal resistance and only 50% of the exergy can be harvested (Chapter 6).Figure 7.14 shows the thermodynamic effi ciency ηT (as defi ned in Eq. (7)) for the four
Residence time (s)
0 50 100 150 200
Ther
mod
ynam
ic e
ffici
ency
(%)
0
10
20
30
40
Figure 7.14. Thermodynamic effi ciency as function of the residence time. Triangles (▲, Δ) indicate vertical and squares (■, □) horizontal feed; open symbols (Δ, □) refer to co-current operation and fi lled symbols (▲, ■) to counter current operation.

153
The performance of a scaled-up reverse electrodialysis stack
diff erent cases. The value of ηT seems to be rather independent of fl ow direction and operational mode and is at lower residence times (tR<100 s) in most cases between 25% and 30%.
With the same Qianqiu homogeneous membranes we formerly measured a thermodynamic effi ciency of 21% in the small stack and the current data are consistent with this value. This is much less than the theoretical maximum of 50%. In the future, specially tailored membranes for RED should combine low electrical resistance with high permselectivity and low osmotic losses. If these membranes are combined with a thin, very open spacer for the river water compartment, is possible to achieve a higher thermodynamic effi ciency.
7.5. Conclusions and outlook
1. For the objective of SGP, using the RED technology, we studied the eff ect of increasing the membrane size from 10x10 cm2 to 25x75 cm2. The key parameter on power density proved to be the residence time. In larger cells, with longer fl ow pathways, the linear velocity should be increased in order to maintain the same residence time. The consequence is that the hydrodynamic losses are higher in the enlarged cell. Larger cells demand thicker spacers for optimal performance, but the therewith introduced larger electrical resistance results in a lower generated electrical power.
2. In the large stack it was possible to compare co-current and counter-current operation. It appeared that the stack generated more power in co-current mode. This is an important result for further development of the RED technique because in the co-current mode, local pressure diff erences between sea and river water compartments are much smaller. Therefore, leakage around the internal manifolds is expected to be less. The same holds for leakage through possibly existing pinholes in the membranes. Low pressure diff erences permit also the use of very thin membranes (with low electrical resistance) as may be manufactured in the future for RED purpose. Another advantage is that delicate spacers with a very open structure (with low hydrodynamic losses) can be applied without being distorted by high pressure diff erences.
3. The power density of the stack is increased by segmentation of the electrodes. However, the eff ect is marginal and it should be questioned if the eff orts made to do this, are economically justifi ed.
4. A large part of the hydrodynamic spacer resistance is due to the inlet and outlet system. Attention should be paid to a more effi cient system.

154
Chapter 7
5. The relative eff ect of spacer thickness and porosity on the pressure gradient can be explained by the Ergun equation. For spacers with the same porosity, the pressure gradient is inversely proportional to the square of the wire thickness. The Ergun relation forecasts an extreme reduction in pressure if more open spacers are applied.
6. Maximum net power density and net energy effi ciency are achieved with comparable residence times. A new response parameter (the response product) can be constructed by multiplying net power density and net energy effi ciency. If the design is optimized for this response product, the stack is fl exible enough to operate on demand for maximal net power density or for maximal energy effi ciency.
7. A thermodynamic effi ciency of about 20% - 30% has been measured, whereas 50% is the theoretical limit under conditions of maximal power. The low value can be ascribed to fl uid leakage (through pinholes in the membranes and around inlets and outlets), co-ion transport, osmosis, electrical power dissipation (in the membranes and compartments) and to parasitic currents.
RED is a rather complex process with various electrical and hydrodynamic aspects. The response variables (power, power density and energy effi ciency) are dependent on many input variables. In the next chapter, we will present a model which explains some of the properties and the behavior of the RED stack. With aid of such a model, it is possible to make a next step in the scaling-up process.
AcknowledgementThis work was performed in the TTIW-cooperation framework of Wetsus, centre of excellence for sustainable water technology (www.wetsus.nl). Wetsus is funded by the Dutch Ministry of Economic Aff airs, the European Union Regional Development Fund, the province of Fryslân, the city of Leeuwarden and the EZ/Kompas program of the “Samenwerkingsverband Noord-Nederland”. The fi rst author would like to thank the Noordelijke Hogeschool Leeuwarden who facilitated this research by detaching him to Wetsus and the participants of the theme “Energy” theme for their fruitful discussions and their fi nancial support. We thank the Redstack company for fi nancing the large stack, Jan Valk for the making the CAD-CAM drawings of the large stack, Feiko Reinalda, Reinald de Jong, Jan Jansen and Tiara Stoker for their help with the experiments and Bertus Nobach for making Figure 3.
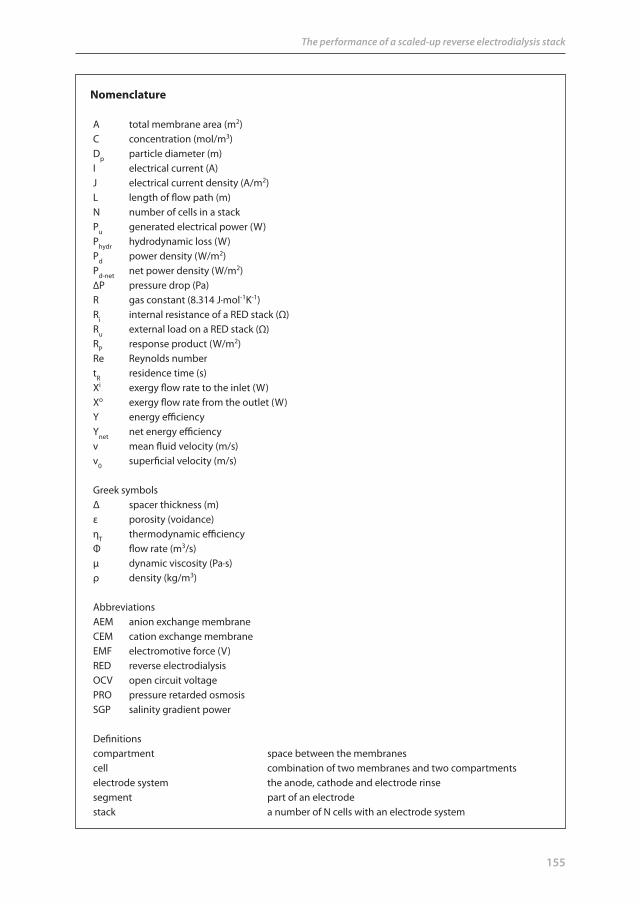
155
The performance of a scaled-up reverse electrodialysis stack
Nomenclature
A total membrane area (m2)C concentration (mol/m3)Dp particle diameter (m)I electrical current (A)J electrical current density (A/m2)L length of fl ow path (m)N number of cells in a stackPu generated electrical power (W)Phydr hydrodynamic loss (W)Pd power density (W/m2)Pd-net net power density (W/m2)ΔP pressure drop (Pa)R gas constant (8.314 J∙mol-1K-1)Ri internal resistance of a RED stack (Ω)Ru external load on a RED stack (Ω)RP response product (W/m2)Re Reynolds number tR residence time (s)Xi exergy fl ow rate to the inlet (W)Xo exergy fl ow rate from the outlet (W)Y energy effi ciencyYnet net energy effi ciencyv mean fl uid velocity (m/s)v0 superfi cial velocity (m/s)
Greek symbolsΔ spacer thickness (m)ε porosity (voidance)ηT thermodynamic effi ciencyΦ fl ow rate (m3/s)μ dynamic viscosity (Pa∙s)ρ density (kg/m3)
AbbreviationsAEM anion exchange membraneCEM cation exchange membraneEMF electromotive force (V)RED reverse electrodialysisOCV open circuit voltagePRO pressure retarded osmosisSGP salinity gradient power
Defi nitionscompartment space between the membranescell combination of two membranes and two compartmentselectrode system the anode, cathode and electrode rinsesegment part of an electrodestack a number of N cells with an electrode system

156
Chapter 7
References Chapter 7
1 G.L. Wick, W.R. Schmitt, Prospects for renewable energy from sea. Mar. Technol. Soc. J. 11 (1977) 16-21
2 J.W. Post, J. Veerman, H.V.M. Hamelers, G.J.W. Euverink, S.J. Metz, K. Nymeijer, C.J.N. Buisman, Salinity-gradient power: Evaluation of pressure-retarded osmosis and reverse electrodialysis. J. Membr. Sci. 288 (2007) 218-230
3 J.W. Post, H.V.M. Hamelers, C.J.N. Buisman, Energy recovery from controlled mixing salt and fresh water with a reverse electrodialysis system. Environ. Sci. Technol. 42 (2008), 5785-5790
4 J.W. Post, H.V.M. Hamelers, C.J.N. Buisman, Infl uence of multivalent ions on power production from mixing salt and fresh water with a reverse electrodialysis system. J. Membr. Sci. 330 (2009) 65-72
5 P. Długołęcki, K. Nymeijer, S.J. Metz, M. Wessling, Current status of ion exchange membranes for power generation from salinity gradients. J. Membr. Sc. 319 (2008) 214-222
6 P. Długołęcki, A.Gambier, K. Nijmeijer, M. Wessling, Practical potential of reverse electrodialysis as process for sustainable energy generation. Environ. Sci. Technol. 43 (2009) 6888-6894
7 M.H. Dirkse, W.P.K. van Loon, J.D. Stigter, J.W. Post, J. Veerman, G.P.A. Bot, Extending potential fl ow modelling of fl at-sheet geometries as applied in membrane-based systems. J. Membr. Sci. 325 (2008) 537 -545
8 C. Forgacs, Generation of electricity by reverse electrodialysis. BGUN-RDA – 178-78 Ben-Gurion University, Israel (1978)
9 C. Forgacs, R.N. O’Brien, Utilization of membrane processes in the development of non-conventional renewable energy sources. Chem. Can. 31 (1979) 19-21
10 W.J. Beek, K.M.K. Muttzall, J.W. van Heuven, Transport phenomena. John Wiley and Sons Ltd., (1999), 2nd ed.
157
Modeling the performance of a reverse electrodialysis stack*
AbstractReverse electrodialysis (RED) is a technology to generate electricity using the entropy of mixing of sea and river water. A model is made of the process and this model is validated experimentally with various laboratory scale stacks and for various feed fl ow directions (co-current, counter-current and cross-current) and related to segmentation of the electrodes (single electrodes and electrodes divided into a number of segments). Input parameters are salt content and fl ow rate of the sea and river input streams, thickness and lengths of the compartments and various membrane properties (area resistance, NaCl and H2O diff usion constants); response parameters are the delivered electrical power density and outlet concentrations. The model is in good agreement with the experiments.
The model is then used to design and optimize the RED process. The used response parameters for optimizing the cell dimensions and feed water fl ow rates are the net power density (the generated net power per m2
membrane in W/m2) and the net river water yield (the net amount of generated energy from 1 m3 river water and an optimal amount of sea water in J/m3).
The model predicts very small diff erences between counter- and co-current operation. It was decided to focus on co-current design because co-current operation causes smaller local pressure diff erences between the river and sea water compartments - hence smaller risk of leakages and the possibility to use very thin membranes with high fl uxes and very open spacer structures with low hydrodynamic resistance.
Segmentation of the electrodes proved to increase the power density by about 15% under realistic operational conditions. As segmentation of the electrodes requires complicated electrical provisions, it was decided to design a system with undivided electrodes.
The model shows that with smaller systems - in terms of length of the fl ow path - higher power densities are possible. This eff ect is rather dramatical and poses a challenge for designing improved RED stacks on large commercial scale. It is suggested to reduce the fl ow path length by applying a fractal structure design of the spacers. Such structures can be made by profi ling the membrane.
* Submitted in condensed form to the Chemical Engineering Journal as:J. Veerman, M. Saakes, S.J. Metz and G.J. HarmsenReverse electrodialysis: a validated process model for design and optimization
Chapter 8

158
Chapter 8
8.1. Introduction
Salinity gradient power using river and sea water is a clean and sustainable source of energy. The recommended technology for harvesting this energy is reverse electrodialysis (RED)1. In the previous chapters, we presented our lab scale e xperimental results with a small cell (10x10 cm2, 50 cells) (Chapters 3, 5 and 6) and with a large stack (25x75 cm2; 50 cells) (Chapter 7). In this chapter we describe a process model containing all key elements of hydrodynamics, membrane transport and the electrode system. This model is fi rst validated with the experimental data of our various test facilities for all key parameters and then it is used to design and optimize a commercial scale RED process.
To clarify the subject of investigation in this chapter, fi rst we will describe all essential elements. Figure 8.1a shows a RED stack, consisting (from left to right) of an anode, a number of alternately stacked anion exchange membranes (AEM) and cation exchange membranes (CEM), and a cathode. The compartments between the membranes are fed with sea and river water; the compartments between electrodes and outer membranes contain the electrode rinse solution which is circulated through anode and cathode compartments. The cells – consisting of an AEM, a sea water compartment, a CEM and a river water compartment - are the repeating units in a stack; the number of cells (N) may be small in a test setup or large (hundreds up to thousands) in a real economically operating stack. Cations from the sea water diff use through the CEMs to the river water compartment and build up a positive potential on the cathode. The anions from the sea water diff use through the AEMs to the river water compartment on the other side and cause a negative potential on the anode. Electrical power can be extracted from the system by an external circuit connected to the electrodes. The ionic current within the cells is then converted to an external electron current via redox reactions at the electrodes. These electrodes can be undivided as shown in Figure 8.1a or divided into some segments as shown in Figure 8.1b. With the undivided electrodes, there is only one load (i.e. an external resistance) Ru; in the system with the segmented electrodes, each electrode has its own load.
8.2. Process model description
8.2.1. Response variablesIn a RED stack, there are three key response parameters. The fi rst is the net produced powe r Pnet, being the produced electrical power Pu minus the hydrodynamic loss Phydr :
(1)hydrunet PPP
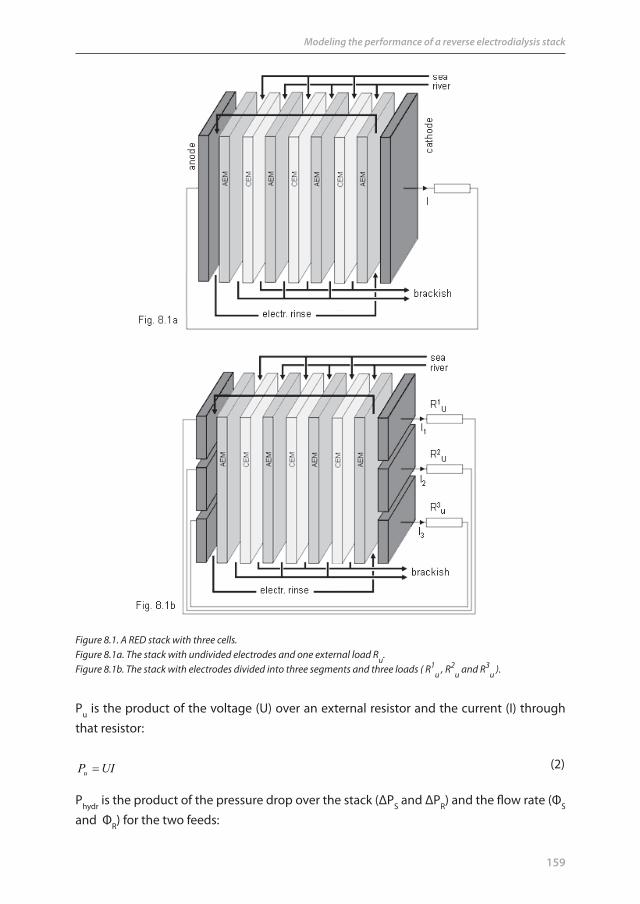
159
Modeling the performance of a reverse electrodialysis stack
Pu is the product of the voltage (U) over an external resistor and the current (I) through that resistor:
(2)
Phydr is the product of the pressure drop over the stack (ΔPS and ΔPR) and the fl ow rate (ΦS and ΦR) for the two feeds:
Fig ure 8.1. A RED stack with three cells.Figure 8.1a. The stack with undivided electrodes and one external load Ru.Figure 8.1b. The stack with electrodes divided into three segments and three loads ( R1
u , R2
u and R3u ).
UIPu

160
Chapter 8
(3)
The second important response parameter is the power density Pd, the produced electrical power divided by the total (AEM and CEM) membrane area Am. For the net power density Pd−net , this value is corrected for the hydrodynamic loss:
(4, 5)
Power density is an important parameter, because the membrane area is related to the total investment costs of a RED power plant.From the starting point that the availability of river water is the limiting factor, it is useful to defi ne an effi ciency measure directly from the consumed amount of river water. We call it ‘net river water yield’ (Znet).
(6)
Maximization of Znet may result to unpractical values: very long residence times in combination with low power densities. Therefore, we introduce the response product RPZ :
(7)
8.2.2. Overview of the modeling of mass and charge transport, equivalent electrical circuits of systems with undivided and with segmented electrodes.In order to simulate the performance of a RED stack, the transport of counter-ions through the membranes should be calculated: Na+ through the CEMs and Cl− through the AEMs from the sea water into the river water compartments. Two disturbing eff ects should be taken into account: co-ion transport (Na+ through the AEMs and Cl− through the CEMs) in the same direction and osmosis (H2O transport from the river water to the sea water compartments). Of special interest are the infl uence of the fl ow direction (co-current or counter-current) and the degree of segmentation of the electrodes (ne=1: undivided or ne>1: segmented). We will focus on a single RED cell; eff ects of parasitic currents - as can be found in stacks with more cells - are not included in this model but were object of a former study (Chapter 3). This and the following sections will describe the system and the equations used to defi ne the model and derive the properties of the model.
Figure 8.2 shows a single RED cell, consisting (from left to right) of an AEM, a sea water compartment, a CEM and a river water compartment. In the picture the AEM of the adjacent cell is drawn with dashed lines. The dimensions of the stack are described by
RRSShydr PPP
m
netnet-d
m
ud A
PP;
AP
P
R
netnet
PZ
netnetdPZ ZPR
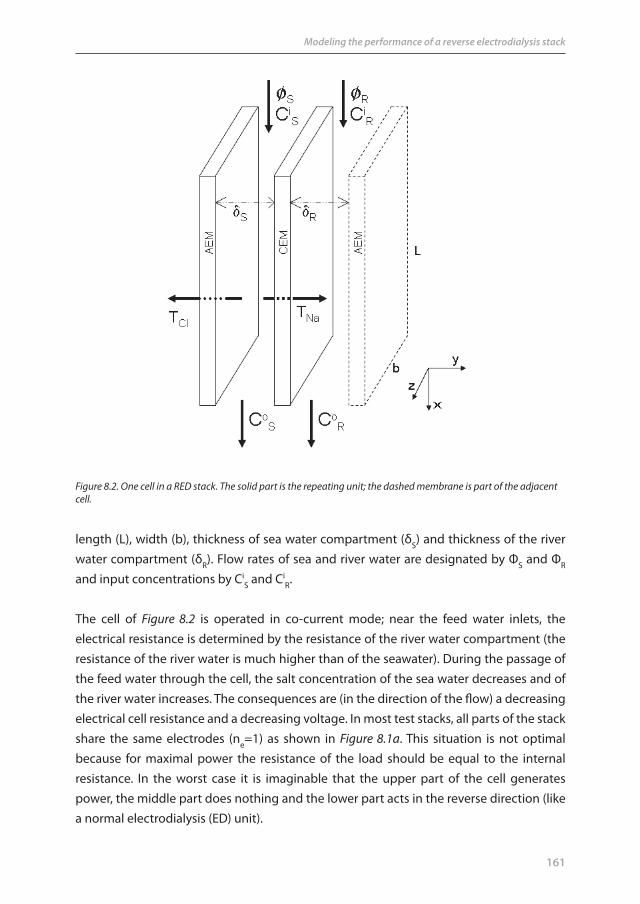
161
Modeling the performance of a reverse electrodialysis stack
length (L), width (b), thickness of sea water compartment (δS) and thickness of the river water compartment (δR). Flow rates of sea and river water are designated by ΦS and ΦR and input concentrations by Ci
S and CiR.
The cell of Figure 8.2 is operated in co-current mode; near the feed water inlets, the electrical resistance is determined by the resistance of the river water compartment (the resistance of the river water is much higher than of the seawater). During the passage of the feed water through the cell, the salt concentration of the sea water decreases and of the river water increases. The consequences are (in the direction of the fl ow) a decreasing electrical cell resistance and a decreasing voltage. In most test stacks, all parts of the stack share the same electrodes (ne=1) as shown in Figure 8.1a. This situation is not optimal because for maximal power the resistance of the load should be equal to the internal resistance. In the worst case it is imaginable that the upper part of the cell generates power, the middle part does nothing and the lower part acts in the reverse direction (like a normal electrodialysis (ED) unit).
Figure 8.2. One cell in a RED stack. The solid part is the repeating unit; the dashed membrane is part of the adjacent cell.

162
Chapter 8
In principle, the stack can be improved by electrode segmentation. In Figure 8.1b the electrode is divided into three parts (ne=3), each with its own load (Ru). Maximal power is generated if each load Ru equals the internal resistance Rcell of a specifi c part of the RED cell (Chapter 3). Theoretically, the more the electrode is segmented, the higher the effi ciency. In the following sections, a model is developed for both extreme cases: systems with unsegmented electrodes and systems with indefi nitely segmented electrodes. The equivalent electrical circuits of systems with undivided and with segmented electrodes are shown in Figure 8.3a and Figure 8.3b.
8.2.3. Modeling of the salt and charge transport in a system with infi nite segmented electrodesElectrodes can be undivided as in Figure 8.1a and Figure 8.3a or segmented into three parts as in Figure 8.1b and Figure 8.3b or segmented to another degree (ne). First we will present the theory for a system with an infi nite degree of segmentation (ne=∞), each segment with its own external load. This gives a simple continuous model by which several eff ects
Figure 8.3 a/b. A RED cell in co-current operation.Figure 8.3a With undivided electrodes and one external load Ru ,Figure 8.3b With 3 separate electrodes and 3 external loads, R1
u , R2
u and R3u. In the counter-current operation mode,
the direction of the river water (ΦR ) is inverted.

163
Modeling the performance of a reverse electrodialysis stack
of design variables on the response variables can be studied. The system of diff erential equations is programmed in Berkeley Madonna (Chapter 8: Appendix A). Section 8.2.5 explains how this program can be adapted to an undivided electrode system (ne=1). The extreme values of the segmentation number (ne=1 and ne=∞) are suffi cient for general conclusions concerning segmentation. In Section 8.3.2.3 the eff ect of intermediate values of the segmentation number (ne=1..7) on the power density is discussed.
In the fi rst order approximati on, it is assumed that the salt concentration in the compartments of the cell is uniform in the direction perpendicular to the membranes. Transport of salt from the seawater to the riverwater compartments is caused by diff usion of Na+-ions through the CEM and of Cl–-ions through the AEM. In real membranes there is also a small co-ion transport: the diff usion of the ions through the ‘wrong’ membranes.
We describe the performance of the RED cell with the following system of 11 equations. Most variables are dependent on the place in the cell, expressed by x (x=0..L). The fi rst of these equations (Eq. (8)) is the expression of the electromotive force of the cell (Ecell). This voltage is the sum of the Nernst potential diff erence over the CEM and over the AEM (Chapter 3).
(8)
In this expression, R is the gas constant (8.314 J∙mol-1K-1), T is the temperature and F is the Faraday number (96485 C mol−1); α is the permselectivity of the membrane, a measure for the specifi city of the membrane for the permeability of counter-ions. Concentrations (in mol/m3) are denoted by C and activity coeffi cients by γ. Subscripts S and R indicate ‘sea’ and ‘river’.
Activity coeffi cients are also dependent on the position in the cell and are obtained with the extended Debye-Hückel equation2:
(9)
where γ is the activity coeffi cient of the ion, μion the ion strength of the solution (mol/L), z the valency and A the eff ective hydrated ion radius in pm (ANa+=450 pm and ACl-=300 pm).
The ionic strength μ is calculated from the molar concentration Ci and the valency zi of
)()()()(ln
)()()()(ln)(
xCxxCx
FRT
xCxxCx
FRTxE
RClR
SClS
AEMR
NaR
SNaS
CEMcell
)x(305
A1
)x(z51.0))x(log(
ion
ion2

164
Chapter 8
each ion. Because pure NaCl solutions are studied, the value of the ion strength is equal to the concentration in mol/L (zi
2=1 for Na+ and Cl−). The factor 1000 is introduced to convert concentrations in mol/m3 into the standard unit of mol/L as used usually in the ion strength.
(10)
The method holds for solutions to about 500 mol/m3 (roughly the salt concentration in sea water).
From the molar conductivity Λm of a NaCl solution, the space dependent area resistances of the sea and river water compartments -Ra,S(x) and Ra,R(x)- are calculated. In fact, Λm is dependent on the concentration C, but if a correct value of Λm is used for low concentrations, the calculated resistance of the river water compartment is reliable; the resistance of the sea water compartment, being much lower, has less infl uence on the total resistance:
(11, 12)
In this equation δS and δR are the thicknesses of the sea and river water compartment (Figure 8.2). The obstruction factor f is a measure for the increase of the electrical resistance due to the negative eff ects of the spacer (tortuosity of the ion path, decrease of the amount conducting solution and shielding the membrane).
The area cell resistance is the sum of the compartment area resistances -Ra,S(x) and Ra,R(x)- and the membrane area resistances ( RAEM and RCEM ).
(13)
For maximal power, the external resistance (load) should be equal to the internal resistance. Because the internal resistance of the cell is space dependent, the load (Ra,u(x) ) should also be space dependent. This load − expressed in units of area resistance (Ωm2) − is varying continuously in the x-direction:
(14)
The current density (J) is now achieved with Ohm’s law:
1000)(
1000)(
21)( 2 xCxCzx
i
iiion
)()(;
)()( ,, xC
fxRxC
fxRRm
RRa
Sm
SSa
CEMAEMRaSacella RRxRxRxR )()()( ,,,
)()( ,, xRxR cellaua
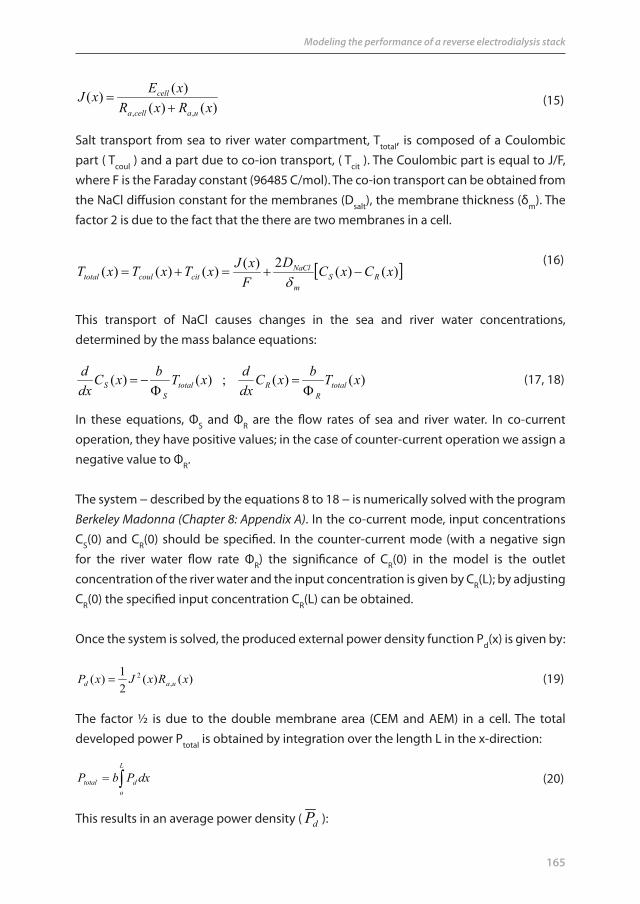
165
Modeling the performance of a reverse electrodialysis stack
(15)
Salt transport from sea to river water compartment, Ttotal, is composed of a Coulombic part ( Tcoul ) and a part due to co-ion transport, ( Tcit ). The Coulombic part is equal to J/F, where F is the Faraday constant (96485 C/mol). The co-ion transport can be obtained from the NaCl diff usion constant for the membranes (Dsalt), the membrane thickness (δm). The factor 2 is due to the fact that the there are two membranes in a cell.
(16)
This transport of NaCl causes changes in the sea and river water concentrations, determined by the mass balance equations:
(17, 18)
In these equations, ΦS and ΦR are the fl ow rates of sea and river water. In co-current operation, they have positive values; in the case of counter-current operation we assign a negative value to ΦR.
The system − described by the equations 8 to 18 − is numerically solved with the program Berkeley Madonna (Chapter 8: Appendix A). In the co-current mode, input concentrati ons CS(0) and CR(0) should be specifi ed. In the counter-current mode (with a negative sign for the river water fl ow rate ΦR) the signifi cance of CR(0) in the model is the outlet concentration of the river water and the input concentration is given by CR(L); by adjusting CR(0) the specifi ed input concentration CR(L) can be obtained.
Once the system is solved, the produced external power density function Pd(x) is given by:
(19)
The factor ½ is due to the double membrane area (CEM and AEM) in a cell. The total developed power Ptotal is obtained by integration over the length L in the x-direction:
(20)
This results in an average power density ( dP ):
)()()()(
,, xRxRxExJ
uacella
cell
)()(2)()()()( xCxCDFxJxTxTxT RS
m
NaClcitcoultotal
)()(;)()( xTbxCdxdxTbxC
dxd
totalR
RtotalS
S
)()(21)( ,
2 xRxJxP uad
dxPbPL
odtotal

166
Chapter 8
(21)
Supply of feed water is expressed as fl ow rates Ф (m3/s) or in velocities (m/s) or in the reverse unit residence time (tR). For a compartment with dimensions L, b and δ:
(22, 23)
8.2.4. Correction of the model for the eff ects of water fl ow through the membranes by osmosisOpposite to the salt fl ux, there is a water fl ux (Twater) due to osmosis (Chapter 6) of water from the river water compartment to the sea water compartment (analogous to the second term in Eq. (16) ):
(24)
Dwater stand for the diff usion constant of water in the membranes. The fl ux in Eq. (24) is expressed in mol∙m−2∙s−1. To convert this to a volumetric fl ux (T’water), a factor MH2O/ρH2O (molar mass over density) is added; in fact, this volumetric water fl ux is the superfi cial water velocity through the membrane.
(25)
The eff ect of salt transport on the concentrations in sea and river water is symmetric: If 0.1 gram NaCl is transported from 1 L sea water (30 g/L) to 1 L river water (1 g/L), the new concentrations are 29.9 and 1.1 g/L: the decrease in sea water equals the increase in river water. On the other hand, if 100 mL water is transported by osmosis in the opposite direction, the new concentrations are 30/1.1=27.3 and 1/0.9=1.11 g/L. In this case the concentration change in the sea water is much larger than in the river water.
Osmosis aff ects – in principle - salt concentrations as well as feed water fl ow rates. The impact of the concentration change on the stack performance is much larger. A typical value of the osmotic fl ux is about 10 mmol∙m-2∙s-1 (Figure 6.5 in Chapter 6), which is equivalent to a velocity of 2∙10-7 m∙s-1. The feed water velocities through the compartments are typical 0.01 m∙s-1, hence a factor 105 higher.
Therefore, we ignore the fl ow rate change during the passage of the cell and calculate
LbPP total
d
Lbtand
Lbv R
)()(2)( xCxCDxT RSm
waterwater
OH
OHRS
m
waterwater
MxCxCDxT2
2)()(2)('

167
Modeling the performance of a reverse electrodialysis stack
only the eff ect on the concentration.
Figure 8.4 shows the fl ow rate balance. The osmotic fl ow (dΦosm) from the river water compartment (left) is directed through a small area of membrane (dA = b∙dx) to the sea water compartment (right). The osmotic fl ow rate is:
(26)
Figure 8.4. Flow rate balance; an osmotic fl ow dΦosm is directed from the river water compartment (left) through the membrane to the sea water compartment (right).
The incoming salt fl ow rate is ΦSCS (mol/s). This amount of salt also leaves the slice. In this place the concentration is given by:
(27)
(28)
dx'Tbd waterosm
S
osmS
S
osmS
osmS
SSS
dxCdxCd
xCdxxC 1)(1
1)()()(
dxTbxCdxCxdCS
waterS
S
osmSS
')()()(

168
Chapter 8
For the increase of the salt content in the river water compartment, an analogous expression can be derived. To incorporate the eff ect of osmosis Eq. (25) should be added to the model (as described in 2.2.1) and Eq. (17) and Eq. (18) should be replaced by:
(29)
and by
(30)
8.2.5. Modeling of the system with undivided electrodesThe principle of this arrangement is shown in Figure 8.3a. The left electrode (anode) is grounded and the potential on the cathode (right) is assigned to be U volt. In this way, the current through the cells is determined, and also the current through the external load and the delivered power in that load. In the model U is adjusted manually to maximal power in the load. The used program is a modifi cation of the used program for an infi nite number of electrodes and presented in Chapter 8 - Appendix A. In the next section, the eff ect of segmentation on the performance of a RED stack will be shown.
8.2.6. Spatial eff ect within the cell: the eff ects of fl ow direction (co- or counter current) and segmentation (undivided or infi nite segmented)The power of the program as presented in Chapter 8 - Appendix A, is that several design options can be evaluated quickly, such as the eff ects of fl ow direction (co- or counter current) and segmentation (undivided or infi nite segmented). To give a fi rst impression of the behavior within a RED cell, the (not yet calibrated) model is used to simulate a small cell (10x10 cm2), equipped with Fumasep membranes (FAD and FKD). Used parameters as obtained from precious work (Chapter 6) include: obstruction factor: f=2, membrane area resistances: RCEM=5.90∙10−4 Ωm2 and RAEM=1.63∙10-4 Ωm2, permselectivity: α=0.88, spacer thickness (both compartments): δS=δR=200 μm and NaCl diff usion coeffi cient: Dsalt=0.13∙10−10 m2/s. Input salt contents are 30 g/L (512.8 mol/m3) for the sea wate r and 1 g/L (17.1 mol/m3) for the river water; residence time is 60 s for sea and for river water.
Figure 8.5 shows some variables in cells with: (a) segmented with an infi nite number of electrodes and co-current operation (b) undivided electrodes and co-current operation, c) segmented with an infi nite number of electrodes and counter-current operation, and d) undivided electrodes and counter-current operation. Plotted are local concentrations
S
waterStotal
SS
'Tb)x(C)x(Tb)x(Cdxd
R
waterRtotal
RR
'Tb)x(C)x(Tb)x(Cdxd

169
Modeling the performance of a reverse electrodialysis stack
in the sea (CS (x)) and in the river water compartments (CR(x)), together with local power density (Pd(x)), local open circuit voltage (E(x)) and local area resistance (Ra(x)). In each graph, the river water inlet is on the left side. In the co-current mode graphs (a and b) the sea water inlet is also on the left side. In the counter-current graphs (c and d), the sea water inlets are on the right side. Eff ects of osmosis are not incorporated in this model and therefore the graphs of the concentration in sea and river water (CR and CR) are symmetrical.
The graphs show the following aspects of the cell behavior; going from the river water inlet to the river water outlet (from left to right) we note:
Figure 8.5. Model predictions for a stack with Fumasep membranes. Dimensions of the stack: 10x10 cm2; spacer thickness 200 μm. A residence time of 60 seconds is used in the calculation. In each graph the following local values are shown: the salt concentration of sea water (CS ) and river water (CR ), both using the left axis, power density (Pd ), open circuit voltage (E) and area resistance (Ra ), all three using the right axis. The graphs show the eff ects of the relative fl ow direction and of the segmentation of the electrodes. The two left graphs (a and c) are related to systems with a high degree of segmentation of the electrodes; the right two graphs (b and d) to systems with undivided electrodes. The upper two graphs (a and b) describe the behavior of co-current feed and the lowest two (c and d) of counter-current feed.

170
Chapter 8
The salt concentrations in the sea and river water compartments (CS and CR) change more or less linearly.
The electrical resistance (Ra) decreases sharply in the fi rst quarter of the fl ow path and after that more slowly.
The cell voltage decreases smoothly to about half the initial value. The generated po wer density (Pd) is maximal close to the river water inlet. The reason
is that the input concentration of the river water is very low and the resulting high resistance limits the electrical current and thereby the power. In the models with undivided electrodes (plot b and d) this maximum is a bit delayed.
With the segmented electrodes (plot a and c) the power density is higher over the whole length of the cell than with the undivided electrodes (plot b and d).
8.3. Model calibration and validation with laboratory scale experimental set-ups
The electrical model (with osmosis correction) as defi ned in Sections 8 2.3 and 8.2.4 is calibrated and validated. In Section 8.3.1 we shall discuss the calibration of the model and in Section 8.3.2 the model is validated experimentally. Figure 8.6 shows the calibration and validation procedure. In the model, parameters are used without fi tting as much as possible. Fitting is restricted to some diffi cult accessible parameters (the obstruction factor f and the diff usion constants Dsalt and Dwater); this tuning process is called calibration. The relevant experiments with the small stack are described in Chapter 5; with the large stack in Chapter 7.
8.3.1. Calibration of the electrical modelFigure 8.7 shows the input variables and process parameters of the model. In general, most parameters are well defi ned but some are less reliable: the obstruction factor of the spacers (f ) and the diff usion constants for salt (Dsalt) and water (Dwater). These parameters are found by fi tting the model to experimental data. The obstruction factor describes the extra electrical resistance of the water compartments due to the infl uence of the spacer (Chapters 5 ;3,4,5). The eff ect includes: (i) the increase of the electrical resistance due to the tortuosity of the ion path, (ii) decrease of the amount conducting salt solution in the compartments and (iii) the shielding eff ect of the spacer on the membrane on the contact places. Dsalt and Dwater should only describe the diff usion of ions and water in the membrane; however in practice also leakage (around the inlet holes) can contribute to these diff usion constants.
For the calibration, we used three small stacks (10x10 cm2) with Qianqiu homogeneous membranes (25 cell, with cross current feed ). For the fi tting procedure the residue was
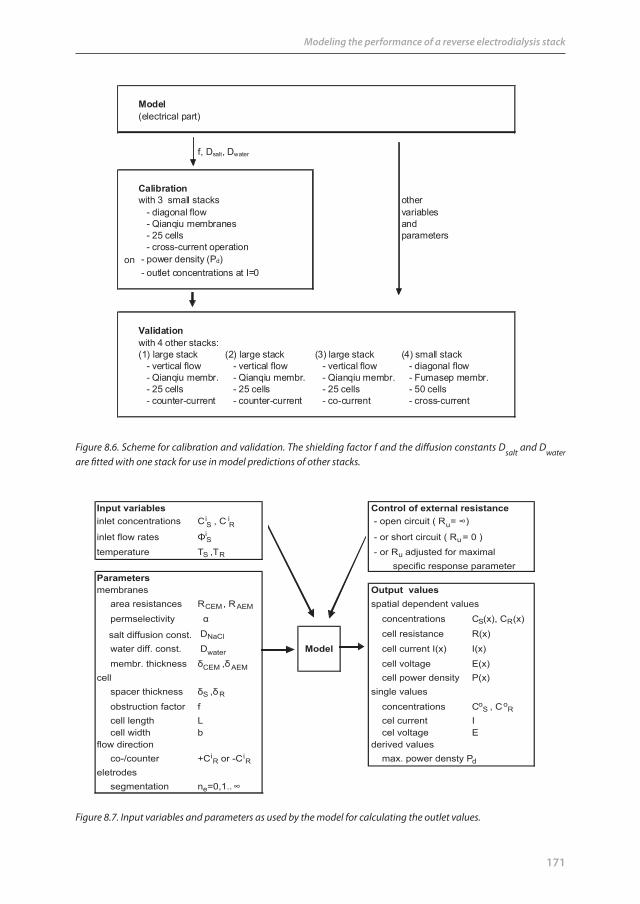
171
Modeling the performance of a reverse electrodialysis stack
Model(electrical part)
xxxxxxxxxxxx f, Dsalt, Dwater
Calibrationwith 3 small stacks other - diagonal flow variables - Qianqiu membranes and - 25 cells parameters - cross-current operation
on - power density (Pd) - outlet concentrations at I=0
Validationwith 4 other stacks: (1) large stack (2) large stack (3) large stack (4) small stack - vertical flow - vertical flow - vertical flow - diagonal flow - Qianqiu membr. - Qianqiu membr. - Qianqiu membr. - Fumasep membr. - 25 cells - 25 cells - 25 cells - 50 cells - counter-current - counter-current - co-current - cross-current
Figure 8.6. Scheme for calibration and validation. The shielding factor f and the diff usion constants Dsalt and Dwater are fi tted with one stack for use in model predictions of other stacks.
Input variables Control of external resistanceinlet concentrations Ci
S , C iR - open circuit ( Ru
inlet flow rates iS - or short circuit ( Ru
temperature TS ,TR - or Ru adjusted for maximal specific response parameter
Parametersmembranes Output values area resistances RCEM , RAEM spatial dependent values
permselectivity concentrations CS R
salt diffusion const. DNaCl cell resistance
water diff. const. Dwater Model membr. thickness CEM AEM cell voltagecell cell power density spacer thickness S R single values
obstruction factor f concentrations CoS , Co
R
cell length L cel current I cell width b cel voltage Eflow direction derived values co-/counter +Ci
R or -CiR max. power densty Pd
eletrodes segmentation ne=0,1..
Figure 8.7. Input variables and parameters as used by the model for calculating the outlet values.

172
Chapter 8
calculated from the maximal power density (Pd) and the outlet concentrations under open circuit conditions (no external load connected to the system) of the sea water(CS
open) and river water (CR
open):
(31)
In this equation, ΔPd,i is the diff erence of the measured and calculated power density etc. The parameters f, Dsalt and Dwater were adjusted until the minimal residue was achieved.
Figure 8.8 shows the measured values of the maximal power density and the outlet concentrations of the unloaded stacks together with the fi tted data.Fitted values are near to the formerly found data used as starting values. The following values are found: obstruction factor f=1.6 (starting value 1.7 from Chapter 5), salt diff usion constant Dsalt=2.5∙10-11 m2/s (starting value 3.2∙10-11 m2/s from Chapter 6) and water diff usion constant Dwater=3.5∙10-9 m2/s (starting value 7.9∙10-9 m2/s from Chapter 6). Both starting values and fi tted values are in the normal range of diff usion constants in ion exchange membranes (Chapter 6: Table 6.1).
0
100
200
300
400
500
0 10 20 30 40 50 60 70 80
Residence time (s)
Con
cent
ratio
n (m
ol/m
3 )
0.0
0.2
0.4
0.6
0.8
1.0
1.2
Pow
er d
ensi
ty (W
/m2 )
Pd
CSopen
CRopen
Figure 8.8. Calibration of the model. Computed (line) and measured (marked points) power densities and outlet concentrations of three small Qianqiu stacks of 25 cells as function of the residence time. Power densities (Pd ) are measured on maximal power conditions; outlet concentrations (CRopen and CSopen) were determined with open circuit (unloaded) stacks. Diff erent marks (□, Δ and ◊) refer to diff erent stacks.
2
i
openi,R
2
i
openi,S
i
2i,d )C()C()P(sidueRe

173
Modeling the performance of a reverse electrodialysis stack
To Figure 8.8 are added calculated outlet concentrations for stacks under condition of maximal power. In fact the model is developed for co- or counter-current operation and in contrast, in the small stack the relative directions of the sea and river water fl ows are perpendicular (cross-current operation). In Section 8.3.2.2 it will be shown that diff erences between co- and counter-current operation are small. Therefore, it is reasonable to use the model also for the small stack because cross-current operation can be seen as an intermediate form between the co- and counter-current modes.
8.3.2. Validation of the electrical modelWe have developed models for 4 diff erent modes: two electrode system (undivided and segmented electrodes) and for each electrode system two fl ow directions (co- and counter-current).
Calculated data of the calibrated model are compared with experimental data. Three diff erent aspects of the model are validated:- Generated power as function of the residence time (discussed in 8.3.2.1).- Eff ect of the fl ow direction (discussed in 8.3.2.2).- Eff ect of the segmentat ion of the electrodes (discussed i n 8.3.2.3).
8.3.2.1. Validation of the electrical model - Model for co-current and undivided electrodes: generated power as function of the residence timePower measurements were also made with the small stack equipped with Fumasep (FKD and FAD type) membranes (50 cells) and with the large stack with Qianqiu (homogeneous type) membranes in co-current mode (25 and 50 cells) and in counter-current mode (25 cells). Figure 8.9 shows only small diff erences in behavior of the two fl ow directions (co- and counter current). The model prediction from 8.3.1 (the line marked with ‘Pd’ in Figure 8.8) is added to Figure 8.9.
Figure 8.9 shows a discrepancy between model (solid line) and measured data of 0.1 W/m2. To investigate whether this could be due to diff erent values for the diff usion coeffi cients or to the obstruction factor f, the model was fi tted by adjusting Dwater=1.0∙10-8 m2/s, Dsalt=0.5∙10-10 m2/s and f=2.3, and resulting in the dotted line. Remarkable are the higher values of Dsalt (2 times higher) and Dwater (3 times higher). An explanation could be water leakage through pinholes in the membrane or along the inlets and outlets in the cells as used for validation (and resulted in the dashed line in Figure 8.9).
The diff erence between the dotted and the solid line in Figure 8.9 is independent of the residence time and apart from this off set, the calculated data fi t well to the experimental
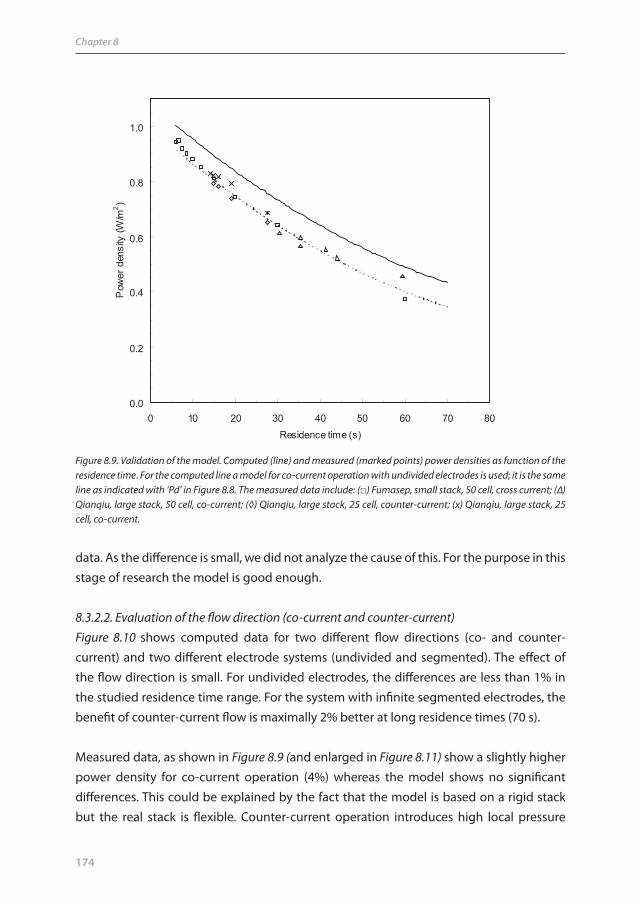
174
Chapter 8
0.0
0.2
0.4
0.6
0.8
1.0
0 10 20 30 40 50 60 70 80Residence time (s)
Pow
er d
ensi
ty (W
/m2)
Figure 8.9. Validation of the model. Computed (line) and measured (marked poin ts) power densities as function of the residence time. For the computed line a model for co-current operation with undivided electrodes is used; it is the same line as indicated with ‘Pd’ in Figure 8.8. The measured data include: (□) Fumasep, small stack, 50 cell, cross current; (Δ) Qianqiu, large stack, 50 cell, co-current; (◊) Qianqiu, large stack, 25 cell, counter-current; (x) Qianqiu, large stack, 25 cell, co-current.
data. As the diff erence is small, we did not analyze the cause of this. For the purpose in this stage of research the model is good enough.
8.3.2.2. Evaluation of the fl ow direction (co-current and counter-current) Figure 8.10 shows computed data for two diff erent fl ow directions (co- and counter-current) and two diff erent electrode systems (undivided and segmented). The eff ect of the fl ow direction is small. For undivided electrodes, the diff erences are less than 1% in the studied residence time range. For the system with infi nite segmented electrodes, the benefi t of counter-current fl ow is maximally 2% better at long residence times (70 s).
Measured data, as shown in Figure 8.9 (and enlarged in Figure 8.11) show a slightly higher power density for co-current operation (4%) whereas the model shows no signifi cant diff erences. This could be explained by the fact that the model is based on a rigid stack but the real stack is fl exible. Counter-current operation introduces high local pressure

175
Modeling the performance of a reverse electrodialysis stack
diff erences between sea- and river water compartments. This can result in local obstructions for the fl uid fl ow and in local deviations of the electrical conductivity (Chapter 7).
By taking into consideration that co-current operation causes smaller local pressure diff erences between the river and sea water compartments - hence smaller risk of leakages and the possibility to use very thin membranes with high fl uxes and very open spacer structures with low hydrodynamic resistance - it was decided to focus on co-current design.
8.3.2.3. Benefi t of the system with segmented electrodesExperime ntally, an increase of 11% is found (from 0.441 to 0.488 W/m2) by dividing the electrode in three independent segments, each loaded with its own optimal resistance (Chapter 70). As seen in Figure 8.10, the model forecasts also an increase of the power density by segmentation of the electrodes. The benefi t of a system with an infi nite segmentation and operated in the co-current mode, is (according to Figure 8.10 ) about 15% at a residence time of 70 s.
0
100
200
300
400
500
0 10 20 30 40 50 60 70 80
Residence time (s)
Con
cent
ratio
n (m
ol/m
3)
0.0
0.2
0.4
0.6
0.8
1.0
1.2
Pow
er d
ensi
ty (
W/m
2 )Pd
CR
CS
Figure 8.10. Computed values for diff erent fl ow directions (co-current and counter current) and diff erent electrodes (undivided and infi nitely segmented ). Solid lines stand for co-current and dashed line for counter current operation. Thin lines stand for undivided electrodes and thick lines for infi nitely segmented electrodes.
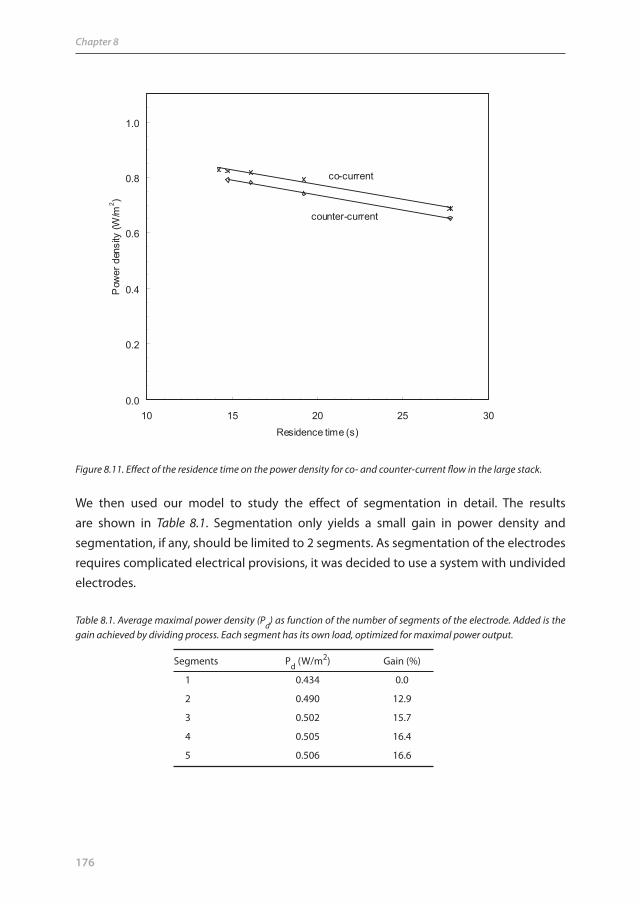
176
Chapter 8
We then used our model to study the eff ect of segmentation in detail. The results are shown in Table 8.1. Segmentation only yields a small gain in power density and segmentation, if any, should be limited to 2 segments. As segmentation of the electrodes requires complicated electrical provisions, it was decided to use a system with undivided electrodes.
Figure 8.11. Eff ect of the residence time on the power density for co- and counter-current fl ow in the large stack.
counter-current
co-current
0.0
0.2
0.4
0.6
0.8
1.0
10 15 20 25 30Residence time (s)
Pow
er d
ensi
ty (W
/m2 )
Table 8.1. Average maximal power density (Pd) as function of the number of segments of the electrode. Added is the gain achieved by dividing process. Each segment has its own load, optimized for maximal power output.
Segments Pd (W/m2) Gain (%)
1 0.434 0.0
2 0.490 12.9
3 0.502 15.7
4 0.505 16.4
5 0.506 16.6

177
Modeling the performance of a reverse electrodialysis stack
8.4. Optimization of the river feed water inlet concentration, thicknesses and lengths of the water compartments and of the resident times
Key parameters in the design of a RED stack are the thicknesses and the length of the sea and river water compartments. In most experiments with our small stack, we used a spacer thickness of 200 μm for both compartments. In this case the electrical cell resistance is mainly determined by the river water compartment; the hydrodynamical loss with the used spacers is about 20% (Chapter 5). With thinner spacers the electrical resistance (perpendicular on the spacers) decreases but at the cost of a higher hydrodynamical resistance in the lateral direction.
It is not self-evident that optimal performance is achieved with equally sized spacers for both compartments. It seems reasonable that the spacer thickness of the seawater compartment can be taken some (e.g. 5) times thicker than that of the river water compartment. In this case the total electrical cell resistance is hardly infl uenced; on the other hand the hydrodynamical resistance of the sea water compartment is much lower than that of the river water compartment. In this way the total hydrodynamic loss is reduced to about half. A thicker seawater compartment permits also the use of a sea water fl ow rate that is higher than the river water fl ow rate: the amount of harvested energy per m3 river water can increase from 1.8 MJ with a 1:1 ratio to 2.6 MJ with a large surplus of sea water (Chapter 5). However, a contraindication may be the increased parasitic ionic currents in the seawater system (Chapter 3).
A special property of the hydrodynamic loss is that it is aff ected by the length of the fl ow path L. If some ions diff use (and generate energy) only in the second part of the fl ow path, these ions (together with the accessory amount of water) have traveled the fi rst part in vain, only causing frictional losses there. Therefore L is a main design parameter.
The main fi nding in Section 8.3 was that a stack in co-current operation with undivided electrodes is a good choice. Based on this confi guration, we used the developed RED model for cells with two types of membranes and two spacer confi gurations. For each investigated cell we study the infl uence of the fl ow path length on the various response parameters, power density and energy effi ciency. For each length, thicknesses of both compartments and fl ow rates of both feeds are adjusted for maximal output of the diff erent response parameters.
In the following sections, we start in 8.4.1 with a brief discu ssion on the applied response parameters Pd−net and RPZ. In 8.4.2 the infl uence or the salt concentration of the river feed

178
Chapter 8
water is discussed. After that, we will discuss the contribution of de diff erent parts (spacers and membranes) of the cell. We will start in Section 8.4.3 with ideal membranes (no osmosis, no co-ion transport and no electrical resistance) with spacerless water compartments. To investigate the eff ect of spacers, in Section 8.4.4 the model is used with ideal membranes and real spacers. In Section 8.4.5 the model is applied to a cell with real membranes and with spacerless compartments and in Section 8.4.6 the behavior of the cell with real membranes in combination with real spacers are studied. Finally, in Section 8.4.7 we use the achieved information for new spacer concept: the fractal profi led membrane
8.4.1. Choice of response parameters for design and optimizationIn Section 8.2.1 we introduced various response parameters. They include net power density (Pd−net), the net river water yield Znet and the response product RPZ= Znet∙Pd−net. Each response parameter has its own characteristics. Net power density (Pd−net) describes the produced net power per square meter of installed membrane. If we assume that the area of installed membrane is proportional to the total investment costs of a RED plant, then Pd−net is a measure for the economical performance. However, under conditions of maximal Pd−net, the effi ciency of the used feed water is low. Therefore we introduced in Chapter 5 en 6 the ‘net energy effi ciency’ (Ynet). This is the gained net energy as fraction of the theoretical maximum from a given amount of sea and river water. Because normally there is no limit in the availability of sea water, we suggest the net river water yield (Znet) as a better alternative: the amount of energy generated from 1 m3 of river water and an arbitrary amount of sea water. However, maximization of Znet may result in extremely long residence times and very low power densities. A compromise between power density and effi ciency is the product of both: the response product RPZ= Znet∙Pd−net.
We used the model for four cell confi gurations:(A) without spacers and with ideal membranes(B) with real spacers and with ideal membranes(C) without spacers and with real membranes(D) with real spacers and with real membranes
The ideal membranes have no electrical resistance, no osmosis and no co-ion transport and a permselectivity α=1. The real membranes are the Qianqiu homogeneous membranes. For spacerless cells, it is supposed to exist a laminar fl ow between the membranes as will be explained in detail in Section 8.4.3. The real spacers are similar spacers to those studied in Section 8.3.1.
In order to compare the four cell confi gurations in a similar way, in each confi guration a

179
Modeling the performance of a reverse electrodialysis stack
obstruction factor f=1, a fl ow path length L=0.25 m and input concentrations CS=512.8 and CR=17.1 mol/m3 (i.e. 1 and 30 g/L) was used.
8.4.2. Optimization of the river feed water inlet concentrationThe salt concentration of the river feed water at the inlet of the RED stack is variable to a certain degree. The lower limit is the natural concentration; it can be increased somewhat by premixing with sea water. With a very low salt concentration in the river water, the cell resistance is high and the produced power low. However, If the salt concentration is too high, the Nernst voltage is low and again the produced power is low. Consequently, there is a optimum salt concentration in the river water.
In early experiments we used a salt concentration of 17.1 mol/m3 (1 g/L) for the river feed water inlet NaCl concentration. The main reason was that with this value a stable OCV (open circuit voltage) is achieved. We used the developed model for Qianqiu homogeneous membranes to investigate the eff ect of the river water inlet concentration. The net power density was maximized in a cell with a fi xed fl ow channel length (L=0.25 m) by adjusting the two spacer thicknesses and the two residence times. Figure 8.12 shows the net power density (Pd-net) and the net river water yield (Znet) as a function of the river water concentration. From this fi gure it follows that optimal performance is achieved at a
0.60
0.65
0.70
0.75
0.80
0.85
0 5 10 15 20 25 30 35 40
CRi (mol/m3)
Pd-
net (
W/m
2 )
0
50
100
150
200
250Z n
et (k
J/m
3 )
Figure 8.12. Calculated net power density (Pd-net ; □) and the net river water yield (Znet ; Δ) as function of the river water concentration in a Qianqiu cell with a fi xed length ( L=0.25 m).

180
Chapter 8
river feed water concentration between 0 mol/L (for maximal river water effi ciency) to 5 mol/m3 (=0.3 g/L) (for maximal power density).
8.4.3. Design optimization of fl ow channel dimensions without spacers and with ideal membrane s (c ell con fi guration A) Normally, spacers are used between the membranes. They are needed for mechanical stability and may furthermore promote mixing within the compartments, thereby reducing the diff usion layers. However, in our ideal hydrodynamic model we ignore the eff ect of spacers in the compartments. Reynolds numbers are achieved with:
(32)
where v is the mean velocity, D the hydraulic diameter, ρ the density of the feed water and μ the dynamic viscosity (0.9∙10-3 Pa∙s for pure water at 25 oC). For a fl ow between two parallel planes, the hydraulic diameter equals two times the distance between them. Applying Eq. (32) to a standard small cell as described in Chapter 7 (dimensions 0.1x 0.1 m2 with a compartment thickness of 200 μm), we obtain for a relative short residence time of 5 s (corresponding to a mean velocity of 2 cm/s) and a Reynolds number of 0.01, low enough to be sure of a laminar fl ow.
With a laminar fl ow between the membranes, the pressure drop over a compartment is:
(33)
The hydrodynamic power loss Phydr is then
(34)
The second assumed ideality of the cell is that they are equipped with membranes without electrical resistance and with permselectivity α=1 and no osmosis. Input concentrations are 1 g/L and 30 g/L (17.1 and 512.8 mol/m3), temperature is 25°C.
The eff ect of path length L was studied for maximal power density; for each value of L, the t hicknesses of the compartments (δS and δR ) and the residence times (δS and δR) were adjusted in such a way that maximal net power density (Pd−net) was obtained (α-mode) or maximal response product (RPZ) (β-mode). From these data were calculated the average fl uid velocities (vS and vR), concentration of the outgoing water (Co
S and CoR), the fl ow
rate ratio (ΦS/ΦR), electrical power density (Pd), hydrodynamical loss density (Pd-hydr) and
vD
Re
33
2;2
R
RR
S
SS b
LPbLP
RRSShydr PPP

181
Modeling the performance of a reverse electrodialysis stack
net power density (Pd−net), net energy effi ciency (Ynet), thermodynamical effi ciency (ηT), net river water yield (Znet), response product (RPZ) and the Reynolds number in both compartments (ReS and ReR) . The results for this cell confi guration A are summarized in Table 8.2, the upper part concerning the α-mode and the lower part the β-mode.
name maximization of α-mode power density (Pd−net) β-mode response product (RPZ)
Table 8.2 shows some remarkable facts:
(a) The most important conclusion is that short cells perform better than long cells on net power density (Pd−net). This holds for the α-mode (Table 8.2, upper part) as well for the β-mode (Table 8.2, lower part).There is a simple relation between net power density (Pd−net) and length of the fl ow path (L):
L δS δR tR,S tRR vS vR CoS Co
R ΦS/ΦR Pd Pd-hydr Pd-net Znet RPZ ReS ReR
m μm s cm/s mol/m3 W/m2 kJ/m3
α. M a x i m i z a t i o n o f Pd-net
0.010 19 9 0.04 0.03 25 35 456 100 2.8 75.2 15.0 60.2 371 22352 11 7
0.025 29 15 0.10 0.07 25 35 456 100 2.8 47.6 9.5 38.1 373 14202 17 11
0.050 42 21 0.20 0.14 25 35 456 100 2.8 33.7 6.8 26.9 373 10031 24 16
0.100 59 29 0.40 0.29 25 35 455 101 2.8 23.7 4.7 19.0 373 7091 33 23
0.250 93 46 0.99 0.71 25 35 455 100 2.8 15.1 3.0 12.0 372 4474 53 36
0.500 131 65 1.97 1.42 25 35 456 100 2.8 10.7 2.1 8.5 373 3173 75 51
1.000 185 92 3.95 2.84 25 35 455 100 2.8 7.5 1.5 6.0 373 2243 105 72
β. M a x i m i z a t i o n o f RPZ
0.010 23 9 0.04 0.05 23 21 471 138 2.4 58.0 6.4 51.6 557 28714 12 4
0.025 38 15 0.12 0.13 22 19 472 135 2.2 35.6 3.3 32.3 560 18064 19 6
0.050 52 20 0.22 0.24 23 21 471 137 2.4 26.0 2.9 23.1 556 12841 27 9
0.100 74 28 0.43 0.47 23 21 471 138 2.4 18.4 2.1 16.3 555 9080 38 13
0.250 117 45 1.08 1.21 23 21 472 138 2.4 11.6 1.3 10.3 558 5743 61 21
0.500 162 62 2.14 2.33 23 21 471 138 2.4 8.3 1.0 7.3 553 4059 30 30
1.000 232 89 4.31 4.75 23 21 471 137 2.4 5.8 0.7 5.2 555 2871 121 42
Table 8.2. Cell confi guration A: cell without spacers and with ideal membranes.Eff ect of the length of the fl ow path (L) on diff erent cell parameters. Ma ximized values (printed in bold) are the power density (Pd-net) in the upper part (α-mode) and the response product (RPZ ) in the lower part (β-mode). Adjusted values (italics) include: compartment thicknesses (δS and δR ) and residence times (tR,S and tR,R ). Normal printed values are calculated and include: linear average velocities (vS and vR ), outlet concentrations (Co
S and CoR ), fl ow rate ratio
(ΦS/ΦR ), electrical power density (Pd), hydrodynamic loss (Pd-hydr), net power density (Pd-net ), net river water yield (Znet ), response product (RPZ ) and the Reynolds numbers (ReS and ReR ).
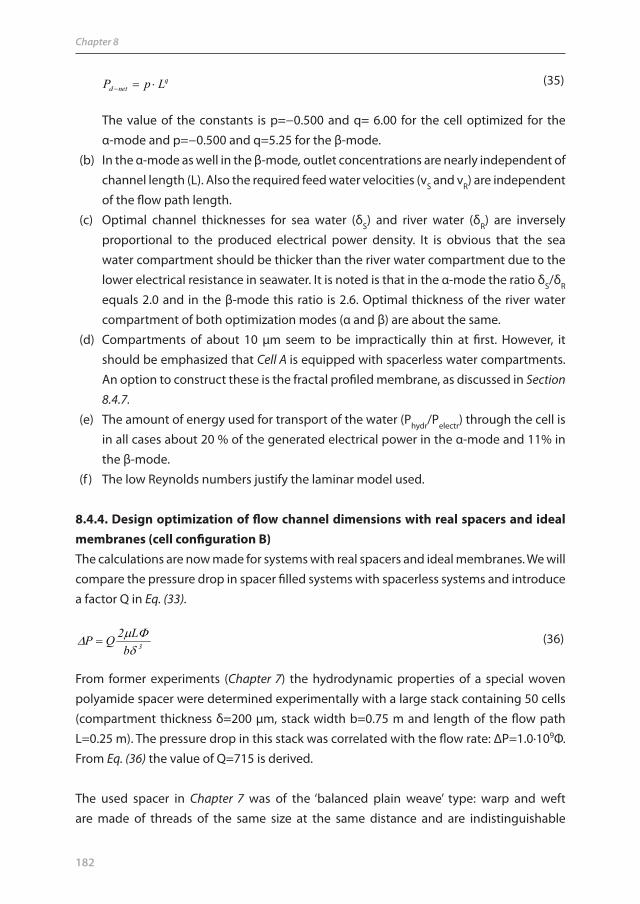
182
Chapter 8
(35)
The value of the constants is p=−0.500 and q= 6.00 for the cell optimized for the α-mode and p=−0.500 and q=5.25 for the β-mode.
(b) In the α-mode as well in the β-mode, outlet concentrations are nearly independent of channel length (L). Also the required feed water velocities (vS and vR) are independent of the fl ow path length.
(c) Optimal channel thicknesses for sea water (δS) and river water (δR) are inversely proportional to the produced electrical power density. It is obvious that the sea water compartment should be thicker than the river water compartment due to the lower electrical resistance in seawater. It is noted is that in the α-mode the ratio δS/δR equals 2.0 and in the β-mode this ratio is 2.6. Optimal thickness of the river water compartment of both optimization modes (α and β) are about the same.
(d) Compartments of about 10 μm seem to be impractica lly thin at fi rst. However, it should be emphasized that Cell A is equipped with spacerless water compartments. An option to construct these is the fractal profi led membrane, as discussed in Section 8.4.7.
(e) The amount of energy used for transport of the water (Phydr/Pelectr) through the cell is in all cases about 20 % of the generated electrical power in the α-mode and 11% in the β-mode.
(f ) The low Reynolds numbers justify the laminar model used.
8.4.4. Design optimization of fl ow channel dimensions with real spacers and ideal membranes (cell confi guration B)The calculations are now made for systems with rea l spacers and ideal membranes. We will compare the pressure drop in spacer fi lled systems with spacerless systems and introduce a factor Q in Eq. (33).
(36)
From former experiments (Chapter 7) the hydrodynamic properties of a special woven polyamide spacer were determined experimentally with a large stack containing 50 cells (compartment thickness δ=200 μm, stack width b=0.75 m and length of the fl ow path L=0.25 m). The pressure drop in this stack was correlated with the fl ow rate: ΔP=1.0∙109Φ. From Eq. (36) the value of Q=715 is derived.
The used spacer in Chapter 7 was of the ‘balanced plain weave’ type: warp and weft are made of threads of the same size at the same distance and are indistinguishable
qnetd LpP
3bL2QP

183
Modeling the performance of a reverse electrodialysis stack
in the fabric. We will restrict ourselves to similar spacers of this type, all with the same proportions between yarn diameter, mesh opening and thickness. It is then reasonable to assume that the resistance through the spacer in the lateral direction is – as in the case of the spacerless compartment– proportional to the third power of the thickness. Therefore, we can use Eq. (36) for the pressure drop over compartments with similar spacers with thickness δ. For pure water at 25 oC, Eq. (36) becomes:
(37)
With this pressure drop the calculations of Section 8.4.3 are repeated. In this cell confi guration (confi guration B) we use an “ideal membrane” and ignore also any shielding use in this cell confi guration value (f=1). The results are listed in Table 8.3.
The conclusions from Table 8.3 are mainly the same as from Table 8.2 except for the numerical values for the net power density and the δS/δR ratio.If Table 8.3 is compared with Table 8.2 there are two additional conclusions:(i) The net power density in Table 8.3 is decreased with a factor 5 with respect to Table 8. 2.(ii) The net river water yield is almost the same in Table 8.3 and Table 8.2.The diff erence between cell confi guration A (Table 8.2) and B (Table 8.3) is the use of real spacers in cell confi guration B. Consequently, we conclude that spacers aff ects only the net power density and not the river water yield.
L δS δR tR,S tRR vS vR CoS Co
R ΦS/ΦR Pd Pd-hydr Pd-net Znet RPZ
m μm s cm/s mol/m3 W/m2 kJ/m3
A. M a x i m i z a t i o n o f Pd-net
0.010 96 48 1.1 0.8 0.93 1.30 455 100 1.45 14.46 2.88 11.58 373 4319
0.025 152 76 2.7 1.9 0.94 1.30 456 100 1.45 9.16 1.83 7.32 372 2727
0.050 216 107 5.4 3.9 0.93 1.30 456 100 1.45 6.46 1.29 5.18 373 1929
0.100 305 151 10.7 7.7 0.93 1.30 456 100 1.45 4.57 0.91 3.66 373 1367
0.250 483 239 26.8 19.2 0.93 1.30 456 100 1.45 2.89 0.58 2.32 372 861
0.500 683 338 53.5 38.4 0.93 1.30 456 100 1.45 2.05 0.41 1.64 372 609
1.000 965 478 107 77 0.93 1.30 456 100 1.45 1.45 0.29 1.16 373 431
B. M a x i m i z a t i o n o f RPZ
0.010 121 46 1.2 1.3 0.85 0.78 471 137 2.89 11.18 1.24 9.95 555 5525
0.025 191 73 2.9 3.2 0.86 0.78 471 137 2.90 7.08 0.80 6.29 555 3494
0.050 271 103 5.8 6.5 0.86 0.78 471 138 2.91 5.00 0.56 4.45 556 2471
0.100 387 147 12 13 0.85 0.76 472 138 2.95 3.51 0.38 3.13 558 1747
0.250 606 232 29 33 0.86 0.77 471 137 2.91 2.23 0.24 1.99 556 1105
0.500 851 326 58 64 0.86 0.78 471 137 2.88 1.58 0.18 1.41 555 781
1.000 1200 461 116 128 0.86 0.78 471 137 2.87 1.12 0.13 1.00 554 552
Table 8.3. Cell confi guration B: cell with real spacer and ideal membranes (additional notes at Table 8.2).
33.1b
LP

184
Chapter 8
8.4.5. Design optimization of fl ow channel dimensions without spacers and with real membranes (cell confi guration C)To investigate the eff ect of the membranes, a confi guration is use d without spacers and with Qianqiu homogeneous membranes. Membrane values are used as described in Section 8.3.1. Again an obstruction factor f=1 is used. The results for this cell confi guration C are listed in Table 8.4.
The eff ect of fl o w channel length on net p ower density (Pd−net) is less extreme th an in the foregoing cell confi gurations. For the α-mode (maximization of Pd−net) the range is 2.43 to 1.27 for the investigated fl ow channel length; a factor of about 2 between the largest and smallest value. For the β-mode (maximization of the response product RPZ) this factor is only 1.5. In contrast to the cell confi gurations A (Table 8.2) and B (Table 8.3), now the river water yield (Znet) is strongly dependent on the fl ow channel length (L) in the α-mode and nearly independent from L in the β-mode. Te main conclusion is that short cells perform better than long cells
8.4.6. Design optimization of fl ow channel dimensions with real spacers and real membranes (cell confi guration D)Now the complete real cell confi guration is used: a cell with real spacers an d with Qianqiu
Table 8.4. Cell confi guration C: cell without spacers and with Qianqiu homogeneous membranes (additional notes at Table 8.2)
L δS δR tR,S tRR vS vR CoS Co
R ΦS/ΦR Pd Pd-hydr Pd-net Znet RPZ
m μm s cm/s mol/m3 W/m2 kJ/m3
α. M a x i m i z a t i o n o f Pd-net
0.010 56 29 0.5 0.2 2.0 5.3 504 23 0.75 2.52 0.09 2.43 32 77
0.025 78 40 0.9 0.4 2.7 6.8 502 25 0.77 2.35 0.11 2.24 41 93
0.050 101 51 1.5 0.6 3.3 8.1 499 26 0.80 2.20 0.12 2.08 51 105
0.100 132 66 2.5 1.1 4.0 9.4 497 29 0.84 2.04 0.13 1.91 61 117
0.250 188 93 4.9 2.2 5.1 11.5 493 33 0.90 1.80 0.14 1.66 77 128
0.500 248 121 6.1 3.8 8.2 13.2 489 37 1.27 1.60 0.14 1.46 91 133
1.000 331 160 13.4 6.7 7.5 15.0 485 41 1.03 1.41 0.14 1.27 105 133
β. M a x i m i z a t i o n o f RPZ
0.010 75 11 0.6 1.2 1.64 0.81 507 84 13.86 1.30 0.01 1.29 290 374
0.025 104 17 1.1 2.0 2.19 1.28 505 85 10.77 1.25 0.01 1.24 293 364
0.050 133 25 1.8 3.1 2.72 1.61 504 87 8.89 1.21 0.01 1.20 295 353
0.100 168 35 3.0 4.5 3.38 2.25 501 88 7.30 1.17 0.02 1.15 295 339
0.250 236 54 5.6 7.6 4.46 3.28 498 91 5.90 1.09 0.03 1.06 297 315
0.500 304 76 9.2 11.6 5.43 4.30 494 94 5.02 1.01 0.03 0.98 298 292
1.000 398 108 15 18 6.62 5.46 491 99 4.49 0.92 0.03 0.88 300 265

185
Modeling the performance of a reverse electrodialysis stack
homogeneous membranes. In fact, the cell confi gurations of Sections 8.4.4 and 8.4.5 are combined in this confi guration. The results for this cell confi guration D are tabulated in Table 8.5.
We repeated the optimization procedure of cell D by maximization of RPZ with fi xed spacer thicknesses as found at the maximization of Pd−net. Under these conditions we achieved a net power density Pd−net and a net river water yield Znet quite near the values achieved with optimized spacer thicknesses. This is an important fi nding. The conclusion is that a RED cell as designed for maximal net power output also can be used for maximal RPZ, only by adjusting the fl ow rates of the sea and river water.
Table 8.5 shows that in each cell confi guration, the optimal sea water compartment is thicker than the river water compartment. For fouling, the thinner river water compartment is thus more critical. Another fi nding is that in the α-mode river water compartments are thicker than in the β-mode. Therefore, it is advantageous to use the optimal spacer thicknesses as found for the α-mode.The main conclusions of Table 8.5 (real spacers with Qianqiu membranes) are:(i) Short cells perform better than long cells on power density and on river water yield.(ii) The Pd decreases continuously with increasing cell length for all cases.
L δS δR tR,S tRR vS vR CoS Co
R ΦS/ΦR Pd Pd-hydr Pd-net Znet RPZ
m μm s cm/s mol/m3 W/m2 kJ/m3
α. M a x i m i z a t i o n o f Pd-net
0.010 194 96 5.2 2.3 0.19 0.43 492 33 0.90 1.78 0.14 1.63 78 128
0.025 280 137 10.1 4.8 0.25 0.52 487 38 0.98 1.52 0.14 1.38 97 134
0.050 373 181 17.0 8.5 0.29 0.59 483 43 1.03 1.32 0.14 1.18 111 131
0.100 503 240 28.6 15.2 0.35 0.66 478 49 1.11 1.13 0.13 0.99 126 125
0.250 753 356 58.2 33.3 0.43 0.75 471 58 1.21 0.88 0.12 0.76 142 109
0.500 1030 486 100.3 60.7 0.50 0.82 466 65 1.28 0.71 0.11 0.61 151 91
1.000 1430 672 175 112 0.57 0.89 459 74 1.36 0.56 0.09 0.47 156 73
β. M a x i m i z a t i o n o f RPZ
0.010 240 54 5.9 7.7 0.17 0.13 497 92 5.76 1.08 0.03 1.05 298 313
0.025 341 88 11.4 14.1 0.22 0.18 493 96 4.79 0.97 0.03 0.94 300 281
0.050 448 124 18.8 22.1 0.27 0.23 489 101 4.25 0.88 0.04 0.84 300 252
0.100 590 175 31.3 35.5 0.32 0.28 485 106 3.82 0.78 0.04 0.74 299 220
0.250 863 274 62.6 68.0 0.40 0.37 478 114 3.42 0.64 0.04 0.59 294 174
0.500 1160 388 107 114 0.47 0.44 472 122 3.19 0.53 0.04 0.48 285 138
1.000 1590 553 186 196 0.54 0.51 466 130 3.03 0.43 0.04 0.38 272 104
Table 8.5. Cell confi guration D: cell with real spacers and real (Qianqiu homogeneous) membranes (additional notes at Table 8.2)

186
Chapter 8
(iii) The best cell dimensions are the achieved values from the maximization of the power density (the α-mode).
8.4.7. Novel compartment and cell designPost et al.6 showed that it is possible to generate energy from sea and river water with RED at a price comparable with the price of wind energy. They based their cal culations on the assumption of a power density of 2 W/m2 and an energy recovery of 70% (equivalent to a river water yield of 1.1 MJ/m3). Our values with real membranes and real spacers (cell confi guration D, Table 8.5) are much lower (1.6 W/m2 and 0.08 MJ/m3 in the α-mode or 1.1 W/m2 and 0.30 MJ/m3 in the β-mode) and it is obvious that the current spacers and membranes should be improved for use in economical operated RED stacks.
With the following reasoning, we arrived at the concept of fractal design. The reasoning points are:
(a) Compartments in current systems have two functions: they act as feed channels and as reactors. The fi rst function requires thick and the other thin compartments. Therefore, both functions should be decoupled by a spatial separation between the supply part and the reactor part.
(b) The electrical specifi c resistance of sea water is comparable with ion exchange membranes and the specifi c resistance of river water is much higher. Therefore the most profi ts are achievable by improving the river water compartment. This should be as thin as possible.
(c) Spacers are unwanted due to their large hydrodynamic resistance.(d) The shorter the channel length, the higher the produced power density.
These arguments lead to the concept of fractal profi led membranes. Figure 8.13 shows a complete RED cell with a profi led AEM (beneath; serving as sea water compartment) and a profi led CEM (above; serving as river water compartment). To form an idea, the following dimensions can be imagined: the membrane thickness is 0.5 m m, in the membranes are pressed the feed channels with a depth of 0.4 mm and the reactor cannels with a depth of 0.1 mm. In the river water compartment, the electrical resistance is decreased by the use of thin compartments (0.1) mm. The reactor channels are short, and spacerless, and have a low hydrodynamic resistance. Because of the low electrical resistance of the sea water, the reactor channels in the sea water compartment can be deeper. A patent with all details has been submitted.
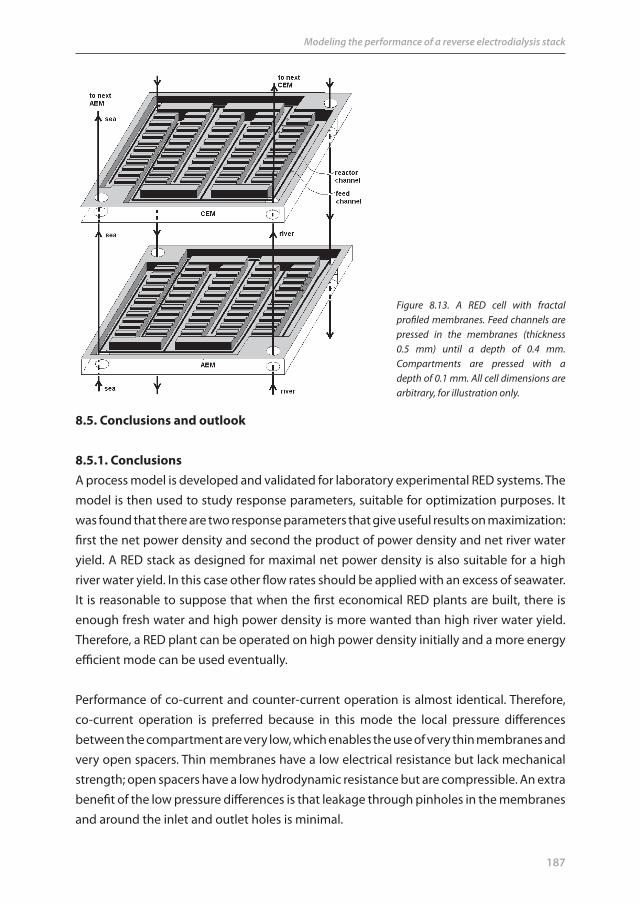
187
Modeling the performance of a reverse electrodialysis stack
8.5. Conclusions and outlook
8.5.1. ConclusionsA process model is developed and validated for laboratory experimental RED systems. The model is then used to study response parameters, suitable for optimization purposes. It was found that there are two response parameters that give useful results on maximization: fi rst the net power density and second the product of power density and net river water yield. A RED stack as designed for maximal net power density is also suitable for a high river water yield. In this case other fl ow rates should be applied with an excess of seawater. It is reasonable to suppose that when the fi rst economical RED plants are built, there is enough fresh water and high power density is more wanted than high river water yield. Therefore, a RED plant can be operated on high power density initially and a more energy effi cient mode can be used eventually.
Performance of co-current and counter-current operation is almost identical. Therefore, co-current operation is preferred because in this mode the local pressure diff erences between the compartment are very low, which enables the use of very thin membranes and very open spacers. Thin membranes have a low electrical resistance but lack mechanical strength; open spacers have a low hydrodynamic resistance but are compressible. An extra benefi t of the low pressure diff erences is that leakage through pinholes in the membranes and around the inlet and outlet holes is minimal.
Figure 8.13. A RED cell with fractal profi led membranes. Feed channels are pressed in the membranes (thickness 0.5 mm) until a depth of 0.4 mm. Compartments are pressed with a depth of 0.1 mm. All cell dimensions a re arbitrary, for illustration only.
188
Chapter 8
Segmentation of the electrodes can increase the power density with about 15%. If divided into two parts, most of this percentage is achieved. The same eff ect can be achieved with two separate RED modules; for an optimal result, the length of the fl ow channel of both stages should be half the length of the original stack. However, both parts demand their own electronics and it is questionable if segmentation or staging would be economically interesting.
The model showed the huge negative infl uence of channel length on power density, the need for thin membranes with a low electrical resistance and the requirement of spacers with a very open structure (or no spacers at all). Therefore, fractal profi led membranes are very promising. They do not require spacers, the membrane is locally very thin, and the fractal structure allows larger cell dimensions.
8.5.2. OutlookTo bring RED for river water with sea water to maturity and suitable for economical applications, there are some challenges remaining:
Membrane integrationIntegration of membranes, spacers and gaskets is the new chall enge. Advantages of integration are: a more simple construction of stacks and less leakage. A special way to integrate, is using profi led membranes. In this way the advantage of conducting spacers is used5. A next level of profi ling is the fractal profi ling.
Special membranes for REDUntil now, special commercial membranes are not available for RED. However, RED has other requirements than the usual electrodialysis techniques and therefore special membranes should be developed. These membranes should be suitable for the profi ling process.
Spiral wound RED stacksSpiral wound stacks may be easer to produce on large scale. However, making test modes is a special challenge.
New electrode systemsIn Chapter 4 of this thesis, a comparison is made between diff erent electrode systems. Especially the Fe2+/Fe3+ system should be tested to come to a decision about the best system.

189
Modeling the performance of a reverse electrodialysis stack
Prefi ltrationThe price of prefi ltration is a critical point. Moreover, prefi ltration gives a waste stream that generates new costs. Therefore, a RED system should be designed with very low prefi ltration needs.
Duration testsRED stacks should be subject to extended duration tests with real river and sea water. Fouling, stability of the electrode system and mechanical stability should be monitored.
Scale-upIn our experiments, we achieved specifi c power densities of about 4 kilowatt per cubic meter stack volume. That is exclusive of pumps and tubing. One approach of a commercial SGP power plant is using a modular system. One module is built in a sea container in this concept; the largest commercially available types (45 feet High Cube) have an internal volume of 87.7 m3. If this volume is used 100% with RED stacks, the power would be 350 KW. If tubing and pumps are located inside these containers, there is less room for the stack and the power is substantially less. It is clear that the development of systems with a higher specifi c power is welcome.
Power conversion and transport of the electrical powerThe power from a RED stack is of the DC (direct current) type. Conversion to AC (alternating current) can be done on modular level or central dependent on economical considerations.
Electrical safetyA RED stack with thousands of cells generates a voltage of some hundred volts. A complication is that the feed channels are connected to the electrical circuit. Therefore, a special study on the safety of a RED module should be done.
If all questions are answered, the RED technique may be fi nished, however, for the application of SGP it is the starting point! Finding good locations for SGP, achieving political commitment and social agreement with all stakeholders and public acceptance are the following steps. Now it is the time for civil engineers who are directing water streams to and from the RED power plants.In the beginning of a real SGP application, power density is the most important economical item. However, if the technique is proven and accepted, and more RED power is produced, there will be a time that the effi ciency of the process will be the most important item. That is the time when SGP has found a place between other forms of renewable energy: all these forms have their own niches and together they are an answer to exhaustion of fossil fuels and the increase of the CO2 content in the atmosphere.

190
Chapter 8
AcknowledgementThis work was performed in the TTIW-cooperation framework of Wetsus, centre of excellence for sustainable water technology (www.wetsus.nl). Wetsus is funded by the Dutch Ministry of Economic Aff airs, the European Union Regional Development Fund, the province of Fryslân, the city of Leeuwarden and the EZ/Kompas program of the “Samenwerkingsverband Noord-Nederland”. The fi rst author would like to thank the NHL Hogeschool who facilitated this research by detaching him to Wetsus and the participants of the theme “Energy” theme for their fruitful discussions and their fi nancial support.

191
Modeling the performance of a reverse electrodialysis stack
Nomenclature
A cell area (m2)Am total membrane area (m2)ANa+ eff ective hydrated ion radius of Na+ (pm)ACl− eff ective hydrated ion radius of Cl− (pm)b width of a cell (m)C concentration (mol/m3)D hydraulic diameter (m) Dsalt diff usion constant of NaCl (m2/s)Dwater diff usion constant of water (m2/s)E voltage (V)Ecell electromotive force of one cell (V)F Faraday constant (96485 C/mol)f obstruction factorI electrical current (A)J current density (A/m2)L length of a cell (m)MNaCl mass NaCl (0.05844 kg/mol)MH2O mol mass H2O (0.01805 kg/mol)N number of cells in a stackne degree of segmentation of electrodesOCV open circuit voltage (V)P power (W)Pd power density (W/m2)Pd−net net power density (W/m2)Phydr hydrodynamic power loss (W)Pi internal dissipated power (W)Pnet net produced power (W)Pu produced electrical power (W)ΔP pressure drop (Pa)Q pressure drop factorR gas constant (8.314 J∙mol−1K−1)Ra area resistance (Ωm2)RAEM area resistance of the AEM (Ωm2)RCEM area resistance of the CEM (Ωm2)Rcell cell resistance (Ω)Ru external resistance (Ω)RPZ response product (J2m5s−1)Re Reynolds number S salt content (kg/m3)T temperature (K)TNaCl fl ux of NaCl (mol∙s−1m−2)TNa, TCl fl ux of Na+, Cl− (mol∙s−1m−2)Twater molar fl ux of water (mol∙s−1m−2)T’water volumetric fl ux of water (m/s)tR residence time (s)T temperature (K)U voltage (V)v average velocity (m/s)

192
Chapter 8
x fl ow path direction (m)Znet net river water yield (J/m3)z valency of an ion
Greek symbolsα permselectivity of the ion exchange membraneγ activity coeffi cientδm membrane thickness (m)δR river water compartment thickness (m) δS sea water compartment thickness (m)δm membrane thickness (m)Λm molar conductivity (S∙m2/mol)ρH2O density of water (1000 kg/m3)μion ion strength of a solution (mol/L)μ dynamic viscosity (Pa∙s)Φ fl ow rate (m3/s)
Superscriptsi ino out
Subscriptscit co-ion transportcoul coulombicM equilibriumosm osmoticR riverS sea
AbbreviationsAEM anion exchange membraneCEM cation exchange membraneED electrodialysisOCV open circuit voltageRED reverse electrodialysis
Defi nitionsCompartment space between the membranescell combination of two membranes and two compartmentselectrode system the anode, cathode and electrode rinsestack a number of N cells with an electrode systemα-mode a system optimized for maximal electrical power density (Pd)β-mode a system optimized for maximal net river water yield (Znet)
193
Modeling the performance of a reverse electrodialysis stack
References Chapter 8
1 J.W. Post, J. Veerman, H.V.M. Hamelers, G.J.W. Euverink, S.J. Metz, K. Nymeijer, C.J.N. Buisman, Salinity-gradient power: Evaluation of pressure-retarded osmosis and reverse electrodialysis. J. Membr. Sci. 288 (2007) 218-230
2 D.C. Harris, Quantitative Chemical Analysis, 6th edition, W. H. Freeman & Company (2003)
3 J.W. Post, H.V.M. Hamelers, C.J.N. Buisman, Energy recovery from controlled mixing salt and fresh water with a reverse electrodialysis system. Environ. Sci. Technol. 42 (2008), 5785–5790
4 P. Długołęcki, A. Gambier, K. Nijmeijer, M. Wessling, Practical Potential of Reverse Electrodialysis As Process for Sustainable Energy Generation. Environ. Sci. Technol. 43 (2009) 6888-6894
5 P. Długołęcki, J. Dąbrowska, K. Nijmeijer, M. Wessling, Ion conductive spacers for increased power generation in reverse electrodialysis. J. Membr. Sci. 347 (2010) 1 01-107
6 J.W. Post, C.H. Goeting, J. Valk, S. Goinga, J. Veerman, H.V.M. Hamelers, P.J.F.M. Hack, Towards implementation of reverse electrodialysis for power generation from salinity gradients. Desalination and Water Treatment 16 (2010) 182–193

194
Chapter 8
Appendix A
Program of the developed model for two fl ow directions (co- and counter) and two degrees of segmentation (undivided and infi nitely segment ed)
The process model is programmed in Berkeley Madonna. Standard, the program calculates with time dependent diff erential equations, but in line 4, time is replaced by x, the travelled distance in the fl ow path. In line 44 and 45 the mean eff ective hydrated ion radius Amean=375 pm is used for both ions. In line 41 the mean permselectivity αmean is used for both membranes.
In the four diff erent modes, the program is used in the following way.a) Infi nite number of electrodes; co-current operation. Apply in line 16 the plus sign, activate line 57 and deactivate line 58. The program can be used directly. The constraint Re=Rcell (line 57) ensures that
maximal ou tput is gained by the RED process.b) Infi nite number of electrodes; counter-current operation. Apply in line 16 the plus minus, activate line 57 and deactivate line 58. In this operation mode ‘INIT Cr’ (line 40) refers to the outlet concentration of the river
water. A slider should be defi ned to adjust for the initial river water concentration (‘INIT Cr’). The input value of the salt concentration in the river water is seen as the last element of the Cr if the results are presented as a table. ‘INIT Cr’ is adjusted until the right input concentration is displayed.
c) Undivided electrodes; co-current operation. Apply in line 16 the plus sign, deactivate line 57 and activate line 58. A slider should be defi ned for the electrode potential (‘U’). The value of U is adjusted in
such a way that the concerning response variable is maximal.d) Undivided e lectrodes; counter-current operation. Apply in line 16 the plus minus sign, deactivate line 57 and activate line 58. Sliders
should be defi ned for the variables ‘INIT Cr’ and ‘U’. In a cyclic way, ‘INIT Cr’ and ‘U’ are adjusted until a proper values for the input concentration (the last element of Cr) and a maximum of the concerning response variable are achieved.
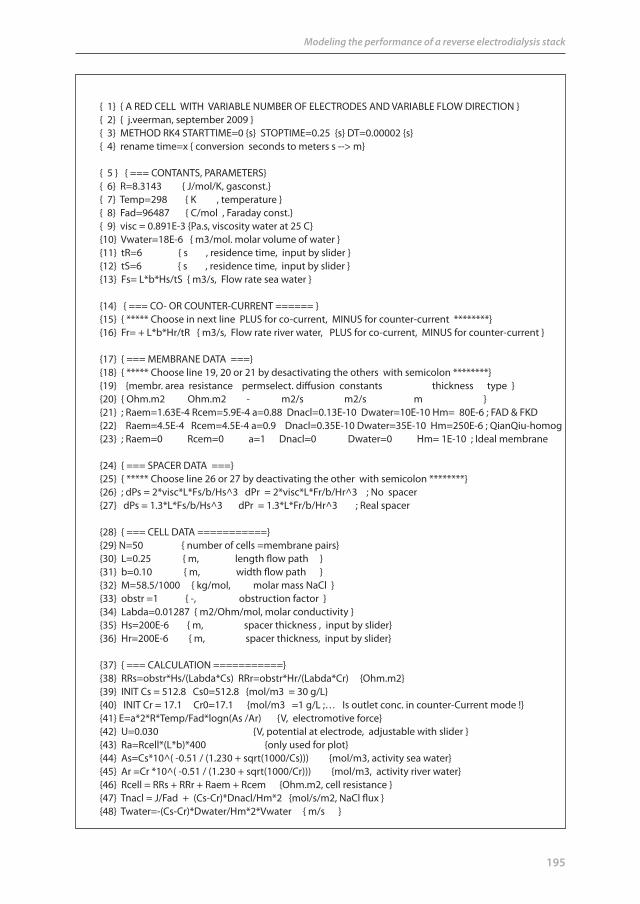
195
Modeling the performance of a reverse electrodialysis stack
{ 1} { A RED CELL WITH VARIABLE NUMBER OF ELECTRODES AND VARIABLE FLOW DIRECTION }{ 2} { j.veerman, september 2009 }{ 3} METHOD RK4 STARTTIME=0 {s} STOPTIME=0.25 {s} DT=0.00002 {s}{ 4} rename time=x { conversion seconds to meters s --> m}
{ 5 } { === CONTANTS, PARAMETERS}{ 6} R=8.3143 { J/mol/K, gasconst.}{ 7} Temp=298 { K , temperature }{ 8} Fad=96487 { C/mol , Faraday const.}{ 9} visc = 0.891E-3 {Pa.s, viscosity water at 25 C}{10} Vwater=18E-6 { m3/mol. molar volume of water }{11} tR=6 { s , residence time, input by slider }{12} tS=6 { s , residence time, input by slider }{13} Fs= L*b*Hs/tS { m3/s, Flow rate sea water }
{14} { === CO- OR COUNTER-CURRENT ====== }{15} { ***** Choose in next line PLUS for co-current, MINUS for counter-current ********}{16} Fr= + L*b*Hr/tR { m3/s, Flow rate river water, PLUS for co-current, MINUS for counter-current }
{17} { === MEMBRANE DATA ===} {18} { ***** Choose line 19, 20 or 21 by desactivating the others with semicolon ********} {19} {membr. area resistance permselect. diff usion constants thickness type }{20} { Ohm.m2 Ohm.m2 - m2/s m2/s m }{21} ; Raem=1.63E-4 Rcem=5.9E-4 a=0.88 Dnacl=0.13E-10 Dwater=10E-10 Hm= 80E-6 ; FAD & FKD{22} Raem=4.5E-4 Rcem=4.5E-4 a=0.9 Dnacl=0.35E-10 Dwater=35E-10 Hm=250E-6 ; QianQiu-homog{23} ; Raem=0 Rcem=0 a=1 Dnacl=0 Dwater=0 Hm= 1E-10 ; Ideal membrane
{24} { === SPACER DATA ===} {25} { ***** Choose line 26 or 27 by deactivating the other with semicolon ********}{26} ; dPs = 2*visc*L*Fs/b/Hs^3 dPr = 2*visc*L*Fr/b/Hr^3 ; No spacer{27} dPs = 1.3*L*Fs/b/Hs^3 dPr = 1.3*L*Fr/b/Hr^3 ; Real spacer
{28} { === CELL DATA ===========} {29} N=50 { number of cells =membrane pairs}{30} L=0.25 { m, length fl ow path }{31} b=0.10 { m, width fl ow path }{32} M=58.5/1000 { kg/mol, molar mass NaCl }{33} obstr =1 { -, obstruction factor }{34} Labda=0.01287 { m2/Ohm/mol, molar conductivity }{35} Hs=200E-6 { m, spacer thickness , input by slider}{36} Hr=200E-6 { m, spacer thickness, input by slider}
{37} { === CALCULATION ===========}{38} RRs=obstr*Hs/(Labda*Cs) RRr=obstr*Hr/(Labda*Cr) {Ohm.m2}{39} INIT Cs = 512.8 Cs0=512.8 {mol/m3 = 30 g/L}{40} INIT Cr = 17.1 Cr0=17.1 {mol/m3 =1 g/L ;… Is outlet conc. in counter-Current mode !}{41} E=a*2*R*Temp/Fad*logn(As /Ar) {V, electromotive force}{42} U=0.030 {V, potential at electrode, adjustable with slider }{43} Ra=Rcell*(L*b)*400 {only used for plot}{44} As=Cs*10^( -0.51 / (1.230 + sqrt(1000/Cs))) {mol/m3, activity sea water}{45} Ar =Cr *10^( -0.51 / (1.230 + sqrt(1000/Cr))) {mol/m3, activity river water}{46} Rcell = RRs + RRr + Raem + Rcem {Ohm.m2, cell resistance }{47} Tnacl = J/Fad + (Cs-Cr)*Dnacl/Hm*2 {mol/s/m2, NaCl fl ux }{48} Twater=-(Cs-Cr)*Dwater/Hm*2*Vwater { m/s }

196
Chapter 8
{49} Cs’ = - Tnacl/Fs*b + b*Twater*Cs/Fs { mol/m4 }{50} Cr’ = + Tnacl/Fr*b - b*Twater*Cr/Fr { mol/m4 }{51} INIT I=0 I’=J*b { A }{52} Pd=J*U/2 { W/m2 }{53} INIT Pd_el=0 Pd_el’ = Pd/L { W/m2 }{54} Ptotal=Pd_el*2*L*b*N { W/m2 }
{55} { === SEGMENTED OR UNDIVIDED ELECTRODES ===========}{56} { ***** Choose line 57 or 58 by desactivating the other with semicolon ********}{57} ; Re=Rcell J=E/(Rcell+Re) Pd=J*J*Re/2 { infi nitely segmented }{58} J=(E-U)/Rcell Re=U/(I+0.0000001) { undivided electrodes }
{59} Pd_hydr=(dPs*Fs+dPr*Fr)/2/L/b { W/m2, hydrodynamic loss per m2 membrane }{60} Pd_net=Pd_el - Pd_hydr { W/m2, net power density }{61} Cm = (Fs*Cs0+Fr*Cr0)/(Fs+Fr) { mol/m3, average concentration }{62} { === EXERGY FLOW RATE ===========}{63} Ex_in = (2*R*Temp*(Fr*Cr0*logn(Cr0/Cm) + Fs*Cs0*logn(Cs0/Cm)) )/(2*L*b) {W, in }{64} Ex_out = (2*R*Temp*(Fr*Cr *logn(Cr /Cm) + Fs*Cs *logn(Cs /Cm)) )/(2*L*b) {W, out}{65} Ex_cons = Ex_in - Ex_out {W, consumed}
{66} { === EFFICIENCY , RESPONSE PRODUCTS ========} {67} Eff En = 100* Pd_net/(Ex_in+0.000000001) { -, net energy effi ciency}{68} Eff Th = 100*Pd_el/(Ex_cons+0.000000001) { thermodynamic eff }{69} RP = Eff En*Pd_net {W/m2, response product}{70} XL = L XHs=Hs XHr=Hr XtS=tS XtR=tR { print variables }{71} WE =Pd_net*L*b*2/Fr/1000 { kJ/m3, river water yield}{72} WEP=Pd_net*WE { J2/m5/s, second response product }
{73} XL = L XHs=Hs XHr=Hr XtS=tS XtR=tR { print variables }
{Optimizing tS, tR, Hs, and Hr for maximal Pd-net (or other response variable)A) Infi nite segmented electrode + co-current a) Make sliders for: tS, tR, Hs and Hr b) Maximize Pd-net with tS, tR, Hs and HrB) Undivided electrode + co-current a) Make sliders for: tS, tR, Hs, Hr and U b) Maximize Pd-net with tS, tR, Hs, Hr and UC) Infi nite segmented electrode + counter-current a) Make sliders for: tS, tR, Hs, Hr and Cr b) Maximize Pd-net with tS, tR, Hs and Hr and adjust Cr to 17.1 (or other input value)D) Undivided electrode + counter-current a) Make sliders for: tS, tR, Hs, Hr, U and Cr b) Maximize Pd-net with tS, tR, Hs, Hr and U and adjust Cr to 17.1 (or other input value)}
Figure 8.14. Berkeley Madonna program listing for a RED cell.

197
Summary

198198
Summary
There is a great need for new energy sources that are clean and sustainable without thermal or chemical pollution and without emission of CO2. One of the potential sources is salinity gradient power (SGP), the power that can be generated from the reversible mixing of river water with sea water. The energy density of this ‘fuel’ is low compared to fossil fuels; nevertheless, the quantities involved are large and the total power – the product of energy density and quantity – is considerable. There are two main challenges: to fi nd suitable locations for SGP and to develop a suitable technique for the conversion of SGP into usable energy. Our objective was the second one.
When we started the project in 2005, the literature revealed two serious candidates: reverse electrodialysis (RED) and pressure-retarded osmosis (PRO). At that moment only six scientifi c articles describing real experiments on RED had been published and for PRO there was about the same amount of literature. All described experiments concerned small laboratory generators with a power output of less than 1 Watt. From the two candidate techniques, RED seemed to be more attractive experimentally because using this method the conversion is rather simple, without the requirement of high pressure set-ups, pressure exchangers and turbines. Therefore, the fi rst research question was:
Is RED better than PRO for generating energy from sea and river water?
In Chapter 2 of this thesis (Comparison of diff erent techniques for salinity gradient power), we proved that the amount of extractable energy using RED and PRO from specifi ed quantities of diluate and concentrate is theoretically the same. However, from practical considerations, based on membrane properties as published in literature, it was found that RED is more attractive for power generation using river and sea water and PRO is more attractive using concentrated saline brines.
When performing the fi rst experiments, we realized that there was energy loss due to three short circuits: the sea water feed channels, the river water channels and the electrode rinse solution. In principle parasitic currents can be prevented by the use of mechanical valves or air bubble injection, but it would be more practical to have a design with inherently low losses. Therefore, the next research question was:
Is it possible to manage power losses by ionic short-circuit through a proper stack design?
The positive answer is described in Chapter 3 (Reducing power losses caused by ionic shortcut currents in reverse electrodialysis stacks by a validated model). We made a model
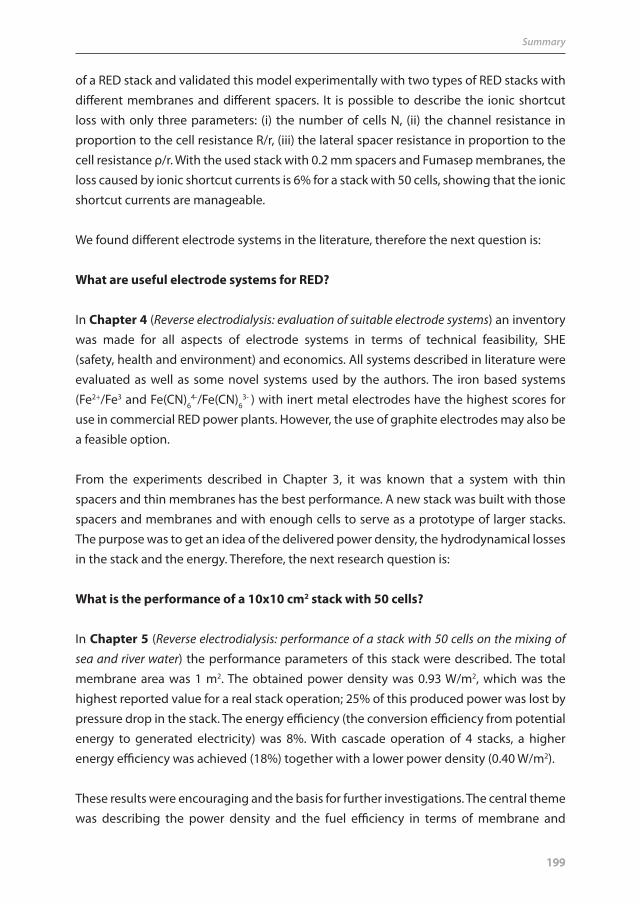
199199
Summary
of a RED stack and validated this model experimentally with two types of RED stacks with diff erent membranes and diff erent spacers. It is possible to describe the ionic shortcut loss with only three parameters: (i) the number of cells N, (ii) the channel resistance in proportion to the cell resistance R/r, (iii) the lateral spacer resistance in proportion to the cell resistance ρ/r. With the used stack with 0.2 mm spacers and Fumasep membranes, the loss caused by ionic shortcut currents is 6% for a stack with 50 cells, showing that the ionic shortcut currents are manageable.
We found diff erent electrode systems in the literature, therefore the next question is:
What are useful electrode systems for RED?
In Chapter 4 (Reverse electrodialysis: evaluation of suitable electrode systems) an inventory was made for all aspects of electrode systems in terms of technical feasibility, SHE (safety, health and environment) and economics. All systems described in literature were evaluated as well as some novel systems used by the authors. The iron based systems (Fe2+/Fe3 and Fe(CN)6
4-/Fe(CN)63- ) with inert metal electrodes have the highest scores for
use in commercial RED power plants. However, the use of graphite electrodes may also be a feasible option.
From the experiments described in Chapter 3, it was known that a system with thin spacers and thin membranes has the best performance. A new stack was built with those spacers and membranes and with enough cells to serve as a prototype of larger stacks. The purpose was to get an idea of the delivered power density, the hydrodynamical losses in the stack and the energy. Therefore, the next research question is:
What is the performance of a 10x10 cm2 stack with 50 cells?
In Chapter 5 (Reverse electrodialysis: performance of a stack with 50 cells on the mixing of sea and river water) the performance parameters of this stack were described. The total membrane area was 1 m2. The obtained power density was 0.93 W/m2, which was the highest reported value for a real stack operation; 25% of this produced power was lost by pressure drop in the stack. The energy effi ciency (the conversion effi ciency from potential energy to generated electricity) was 8%. With cascade operation of 4 stacks, a higher energy effi ciency was achieved (18%) together with a lower power density (0.40 W/m2).
These results were encouraging and the basis for further investigations. The central theme was describing the power density and the fuel effi ciency in terms of membrane and

200200
Summary
spacer properties, stack and cell dimensions, fl uid velocities and so on. The performance of a stack is aff ected by two kinds of losses: hydrodynamical and electrical. The fi rst are located in the manifolds and in the spacers, the second in the feed water supply (due to the parasitic currents as discussed in Chapter 3) and in the membranes. Membranes are of particular interest, because they include three sources of loss: osmosis, co-ion transport and membrane resistance. Therefore, it was time to have a closer look to the membranes:
What is the eff ect of osmosis, co-ion transport and membrane resistance on the generated power and effi ciency of diff erent membranes?
In Chapter 6 (Reverse electrodialysis: Comparison of six commercial membrane pairs on the thermodynamic effi ciency and power density) the experimental results are shown. It showed that the contribution of co-ion transport and of internal dissipation (due to the electrical resistance) on the total losses are comparable and the contribution of osmosis is much less. Introduced is the response product (RP), the product of the thermodynamic effi ciency and the power density as ranking parameter. It combines the benefi ts of high power density with high thermodynamic effi ciency and may be a useful ranking parameter. The highest RP was achieved with the Selemion membrane pair. However, the Qianqiu homogeneous membranes proved to be also rather good. That was good news, because their price was a factor ten lower than of the other membranes.
A new large stack was built with these Qianqiu membranes. The dimensions were 75x25 cm2 and the stack was equipped with 50 cells (each cell containing two membranes) and three separate electrode pairs. With a total active membrane area of 18.75 m2, it was the largest RED stack ever built. With this cell it was possible to study the eff ects of residence time, fl ow direction (co-current or counter-current), fl ow path length (75 cm at horizontal fl ow or 25 cm at vertical fl ow) and of electrode segmentation (undivided or separated in three segments). The research question was:
What is the eff ect of fl ow channel length, residence time, fl ow direction and of electrode segmentation on power density and effi ciency of a RED stack?
In Chapter 7 (The performance of a scaled-up reverse electrodialysis stack) the results of the concerning experiments are discussed. It proved that residence time is a key parameter for the stack performance. It turned out that a long fl ow path causes high hydrodynamic losses. Co-current fl ow appeared to result in higher power densities and the eff ect of segmentation of the electrodes is marginally positive.

201201
Summary
The experiments as described in Chapter 7 have provided much data and are useful for the validation of a RED model. Therefore, the next research questions were:
How to model the RED process and how to optimize the design with this model?
A model is presented in Chapter 8 (Modeling the performance of a reverse electrodialysis stack ). The model is validated and applied to diff erent stacks. The model confi rms the fi ndings of the experiments as described in Chapter 7. The most important is that long fl ow paths induce unacceptably high hydrodynamic losses. With short fl ow paths, high power densities and acceptable energy effi ciencies can be obtained but the total power production with such cells is inherently low. The conclusion is that the way to scale up of a RED stack is found by very short cells and by a fractal design of these cells. A patent has been applied for a fractal solution: an integration of spacers and membranes with a diverging system of fl ow channels. The required structures are pressed in the membrane.

202

203
Samenvatting

204204
Samenvatting
Er is een grote behoefte aan nieuwe energiebronnen die schoon en duurzaam zijn, geen thermische of chemische vervuiling geven en geen CO2-emissie veroorzaken. Een van de potentiële bronnen is zoutgradiënt energie (salinity gradient power, SGP), de energie die gegenereerd kan worden door reversibele menging van rivierwater met zeewater. De energiedichtheid van deze ‘brandstof‘ is laag vergeleken met die van fossiele brandstoff en; desalniettemin zijn er grote beschikbare hoeveelheden van en het totale vermogen – het product van energiedichtheid en hoeveelheid – is aanzienlijk. Er zijn twee belangrijke uitdagingen: het vinden van goede locaties voor de toepassing van SGP en de ontwikkeling van een geschikte techniek om die SGP om de zetten in een bruikbare energievorm. Ons doel was dit laatste.
Toen we het project startten in 2005, dienden zich twee serieuze kandidaten aan in de literatuur: omgekeerde elektrodialyse (reverse electrodialysis, RED) en drukvertraagde osmose (pressure-retarded osmosis, PRO). Toentertijd waren er slechts zes artikelen gepubliceerd die daadwerkelijke experimenten met RED beschreven; wat betreft PRO was er ongeveer dezelfde hoeveelheid literatuur. Van de twee kandidaat-technieken, leek RED experimenteel het meest aantrekkelijk omdat de conversie met deze techniek redelijk eenvoudig is, zonder dat er voorzieningen voor de hoge druk, drukwisselaars en turbines nodig zijn. Derhalve was de eerste onderzoeksvraag:
Is RED beter dan PRO voor de opwekking van energie uit zee- en rivierwater?
In Hoofdstuk 2 van dit proefschrift (Comparison of diff erent techniques for salinity gradient power) tonen we aan dat de hoeveelheid winbare energie met RED en met PRO met gespecifi ceerde hoeveelheden diluaat en concentraat theoretisch hetzelfde is. Vanuit praktische overwegingen echter, gebaseerd op membraan eigenschappen zoals gepubliceerd in de literatuur, werd er geconcludeerd dat RED de aangewezen techniek is al er rivier- en zeewater gebruikt wordt en dat PRO aantrekkelijker is als er geconcentreerde zoutoplossingen gebruikt worden.
Toen we de eerste experimenten uitvoerden, realiseerden we ons dat er energieverlies was door drie kortsluitcircuits: de toevoerkanalen voor zeewater, de toevoerkanalen voor rivierwater en de elektrodespoeling. In principe kunnen parasitaire stromen voorkomen worden door gebruik te maken van mechanische afsluiters of door luchtbel injectie, maar het zou praktischer zijn een ontwerp te hebben met inherent lage verliezen. Daarom luidde de volgende onderzoeksvraag:

205205
Samenvatting
Is het mogelijk het vermogensverlies door interne kortsluitstromen te beheersen door een adequaat ontwerp van de stack ?
Het bevestigende antwoord is beschreven in Hoofdstuk 3 (Reducing power losses caused by ionic shortcut currents in reverse electrodialysis stacks by a validated model). We maakten een model van een RED-stack en valideerden dit model experimenteel met twee types RED-stacks met verschillende membranen en verschillende spacers. Het is mogelijk de interne kortsluitstromen te beschrijven met slechts drie parameters: (i) het aantal cellen N, (ii) de verhouding van de weerstand van het voedingkanaal en de celweerstand R/r, (iii) verhouding van laterale spacer weerstand en de celweerstand ρ/r. Met de gebruikte stack met 0.2 mm spacers en Fumasep membranen, was het verlies door interne kortsluitstromen 6% voor een stack met 50 cellen, wat aantoont dat deze kortsluitstromen beheersbaar zijn.
In de literatuur vonden we verschillende elektrodesystemen, daarom is de volgende vraag:
Wat zijn bruikbare elektrodesystemen voor RED?
In Hoofdstuk 4 (Reverse electrodialysis: evaluation of suitable electrode) wordt een inventarisatie gemaakt van alle aspecten van elektrodesystemen in termen van technische haalbaarheid, SHE (safety, health and environment, ofwel veiligheid, gezondheid en milieu) en kostprijs. Alle in de literatuur beschreven systemen werden geëvalueerd alsmede enige nieuwe systemen die door de auteur gebruikt zijn. De op ijzer gebaseerde systemen (Fe2+/Fe3 and Fe(CN)6
4-/Fe(CN)63- ) met inerte metaalelektroden scoren het hoogst voor een
economisch bedreven RED-centrale. Echter lijkt het gebruik van grafi etelektroden ook een haalbare optie.
Uit experimenten zoals beschreven in Hoofdstuk 3 bleek dat systemen met dunne membranen en dunne spacers de beste prestaties leveren. Er werd een stack gebouwd met zulke spacers en membranen en met voldoende cellen om als prototype dienst te doen voor grotere stacks. Het doel was om een idee te krijgen van de geleverde vermogensdichtheid, de hydrodynamische verliezen in de stack en van de energie-effi ciëntie van het systeem:
Wat zijn de prestaties van een 10x10 cm2 stack met 50 cellen?

206206
Samenvatting
In Hoofdstuk 5 (Reverse electrodialysis: performance of a stack with 50 cells on the mixing of sea and river water) zijn de prestaties van deze stack beschreven. Het totale membraanoppervlak was 1 m2. De verkregen vermogensdichtheid was 0.93 W/m2, wat de hoogste waarde was ooit verkregen met een RED-stack; 25% van dit geproduceerde vermogen werd gebruikt door de drukval in de stack. De energie-effi ciëntie (de conversie-effi ciëntie van potentiële energie naar opgewekte elektriciteit) was 8%. Met een cascadeschakeling van 4 stacks werd een hogere energie-effi ciëntie verkregen (18%), echter met een lagere vermogensdichtheid. (0.40 W/m2).
Deze resultaten waren bemoedigend en de basis voor verder onderzoek. Het centrale thema is de beschrijving van vermogensdichtheid en de brandstofeffi ciëntie in termen van membraan- en spacereigenschappen, stack- en celafmetingen, vloeistofsnelheden enzovoorts. De prestaties van een stack worden beïnvloed door twee typen verliezen: hydrodynamisch en elektrische. De eerste zijn gelokaliseerd in de waterkanalen en in de spacers, de tweede in het watervoorzieningsysteem (wegens de in Hoofdstuk 3 besproken lekstromen) en in de membranen. Membranen zijn van bijzonder belang omdat hier drie bronnen van verlies aanwezig zijn: osmose, co-ion transport en membraanweerstand. Daarom was de tijd aangebroken om dieper op de membranen in te gaan:
Wat is het eff ect van osmose, co-ion transport en membraanweerstand op het opgewekte vermogen en op de effi ciëntie bij verschillende membranen?
In Hoofdstuk 6 (Reverse electrodialysis: Comparison of six commercial membrane pairs on the thermodynamic effi ciency and power density) werden de experimentele resultaten beschreven. Het blijkt dat de bijdrage van co-ion transport en van interne vermogensdissipatie (wegens de elektrische weerstand) aan de totale verliezen vergelijkbaar zijn en dat het aandeel van osmose veel minder groot is. Het begrip response product (RP), het product van thermodynamische effi ciëntie en van vermogensdichtheid, wordt geïntroduceerd als beoordelingsparameter. De hoogste RP-waarde werd bereikt met het Selemion membraan paar. Echter bleken de homogene membranen van Qianqiu ook vrij goed. Dat was goed nieuws omdat de prijs daarvan een factor 10 lager was dan van de andere membranen.
Er werd een nieuwe stack gebouwd met deze Qianqiu membranen. De afmetingen waren 75x25 cm2 en de stack werd voorzien van 50 cellen (elke cel met twee membranen) en drie afzonderlijke elektrodeparen. Met een totaal actief membraanoppervlak van 18.75 m2 was
het de grootste RED-stack die ooit gebouwd is. Met deze stack was het mogelijk de eff ecten te bestuderen van de verblijftijd, stroomrichting (mee- of tegenstroom), lengte van het

207207
Samenvatting
stroomtraject (75 cm bij horizontaal en 25 cm bij verticaal bedrijf ) en van de segmentatie van de elektrode (ongedeeld of gescheiden in drie segmenten). De onderzoeksvraag was:
Wat is het eff ect van de lengte van de stroomkanalen, verblijftijd, stroomrichting en van elektrode-segmentatie op de vermogensdichtheid en op de effi ciëntie van een RED-stack?
In Hoofdstuk 7 (The performance of a scaled-up reverse electrodialysis stack) worden de resultaten van de betreff ende experimenten besproken Het bleek dat de verblijftijd een sleutelrol speelt bij de prestaties van de stack. Verder bleek het dat een lang stroomtraject hoge hydrodynamische verliezen veroorzaakt. Meestroom bleek in hogere vermogensdichtheden te resulteren en het eff ect van de elektroden is marginaal.
De experimenten zoals beschreven in Hoofdstuk 7 hebben veel data opgeleverd en zijn nuttig voor de validatie van een RED model. Daarom waren de volgende onderzoeksvragen:
Hoe kan het RED proces gemodelleerd worden en hoe kan het ontwerp met dit model geoptimaliseerd worden?
In Hoofdstuk 8 (Modeling the performance of a reverse electrodialysis stack ) wordt een model van het RED-proces ontwikkeld. Het model is gevalideerd en toegepast op verschillende stacks. Het model bevestigt de resultaten van experimenten zoals beschreven in Hoofdstuk 7. Het belangrijkste is dat lange stromingstrajecten onacceptabel hoge hydrodynamisch verliezen veroorzaken. Met kortere trajecten kunnen er hogere vermogensdichtheden en acceptabele energie-effi ciëntie verkregen worden, maar de totale hoeveelheid geproduceerd vermogen is laag in zulke cellen. De conclusie is dat de weg naar opschaling verloopt door de cellen juist kleiner te maken en door een fractaal ontwerp van deze cellen. Er is een patent ingediend voor een fractale oplossing: een integratie van spacers en membranen met een divergerend systeem van voedingskanalen. De vereiste structuren worden in het membraan geperst.

208

209
Publications

210210
Publications
Scientifi c Publications
J. Veerman, J. W. Post, S.J. Metz, M. Saakes, G.J. Harmsen, Reducing power losses caused by ionic shortcut currents in reverse electrodialysis stacks by a validated model. J. Membr. Sci. 310 (2008) 418-430
J. Veerman, S.J. Metz, M. Saakes, G.J. Harmsen, Reverse electrodialysis: performance of a stack with 50 cells on the mixing of sea and river water.J. Membr. Sci. 327 (2009) 136-144
J. Veerman, R.M. de Jong, M. Saakes, S.J. Metz, G.J. Harmsen, Reverse electrodialysis: Comparison of six commercial membrane pairs on the thermodynamic effi ciency and power density. J. Membr. Sci. 343 (2009) 7–15
J. Veerman, M. Saakes, S.J. Metz, G.J. Harmsen, Reverse electrodialysis: evaluation of suitable electrode systems. J. Appl. Electrochem. 40 (2010) 1461-1474
J. Veerman, M. Saakes, S.J. Metz, G.J. Harmsen, Electrical power from sea and river water by reverse electrodialysis: a fi rst step from the laboratory to a real power plant Submitted to Environmental Science & Technology.
J. Veerman, M. Saakes, S.J. Metz, G.J. Harmsen, Reverse electrodialysis: a validated process model for design and optimization. Submitted to Chemical Engineering Journal.
J.W. Post, J. Veerman, H.V.M. Hamelers, G.J.W. Euverink, S.J. Metz, K. Nymeijer, C.J.N. Buisman, Salinity-gradient power: Evaluation of pressure-retarded osmosis and reverse electrodialysis. J. Membr. Sci. 288 (2007) 218–230

211211
Publications
M.H. Dirkse, W.P.K. van Loon, J.D. Stigter, J.W. Post, J. Veerman, G.P.A. Bot, Extending potential fl ow modelling of fl at-sheet geometries as applied in membrane-based systems. J. Membr. Sci. 325 (2008) 537-545
J.W. Post, C.H. Goeting, J. Valk, S. Goinga, J. Veerman, H.V.M. Hamelers, P.J.F.M. Hack, Towards implementation of reverse electrodialysis for power generation from salinity gradients. Desalination and Water Treatment 16 (2010) 182–193
Other publications
J. Veerman, Rijnwater ontzouten hoeft geen energie te kosten. Polytechnische Tijdschrift September 1994, 52-55
J. Veerman, J. Krijgsman, J.M. Nederend, G. Oudakker, Blauwe stroom kansrijk bij Afsluitdijk. Land en Water 8, September 2004, 28-29
J. Veerman, G.J. Harmsen, Blauwe elektriciteit, een uitdaging. NPT Procestechnologie 4, September 2007, 22-23
Patents
J. Veerman, A fractal spacer for an electrodialysis system and for a reverse electrodialysis system. Applied 2009

212

213
Dankwoord

214
Dankwoord
Ruim vier jaar ben ik betrokken geweest bij het Blue Energy project bij Wetsus. Reden voor een terugblik. Alle hieronder genoemde mensen wil ik bedanken voor de samenwerking, voor de steun, voor de hulp en inzet en voor de leerzame discussies.
Mijn eerste contacten met de membraanwereld was een cursus membraantechnologie in Wageningen in 1992. Reden voor mijn deelname was dat ook bij de NHL Hogeschool, waar ik als docent betrokken was, het vak membraantechnologie geïntroduceerd zou worden. Een van de onderwerpen was het gedrag van ionenwisselende membranen en de Maxwell-Stefan theorie die dat gedrag verklaarde. Dit bracht mij op het idee om brak water te ontzouten met behulp van zout water. Ik legde mijn idee uit aan Hans Wesselingh, een van de docenten. Na enig peinzen zei hij mij dat zoiets wel mogelijk moest zijn, maar raadde mij dringend aan eerst een en ander uit te rekenen alvorens met experimenten te starten. Die les heb ik ter harte genomen. Het proces bleek modelleerbaar met de MS theorie en een publicatie volgde in het PolyTechnisch Tijdschrift. Kortom, het was Hans Wesselingh die in mij het heilig vuur van de wetenschap wist te ontsteken.
De tweede persoon die dit vuur wist aan te wakkeren, was Gerrit Oudakker. Op zeker moment was er een bericht dat zijn aandacht trok: een Russisch onderzoeker, genaamd Victor Kniajev van het Institute of Marine Technoloy Problems in Vladivostok, was er in geslaagd energie uit zoet en zout water op te wekken in een installatie die groot genoeg was om een laptop van stroom te voorzien. Omstreeks het jaar 2000 werd ik opgebeld door Gerrit met de vraag of ik dat ook kon. “Natuurlijk kan ik dat”, zei ik. Omgekeerde elektrodialyse (reverse electrodialysis, RED) bleek echter toch meer haken en ogen te hebben dan ik eerst dacht. Na enig experimenteren bleek de zoutenergie beschikbaar te zijn met een spanningsverschil van anderhalf volt aan de elektroden. Ik was dan ook blij Gerrit te kunnen opbellen met het blijde bericht: “Het werkt, kom zo spoedig mogelijk kijken”. De machine bleek ca. 20 milliwatt te leveren aan een propeller.
Ondertussen was rond 2005 het instituut Wetsus gestart binnen de muren van het Van Hall instituut. Gerrit en ik demonstreerden de RED-generator aan Cees Buisman die direct overtuigd was. Wetsus ging aan de slag met Blue Energy. ‘Daar moet ik ook bij zijn’, was mijn eerste reactie, doch in welke vorm? Jan Steenmeijer, toentertijd directeur Life Sciences, was ook enthousiast en met hulp van Johannes Boonstra van Wetsus wist hij me voor drie dagen per week te detacheren bij Wetsus. Ik schreef een projectvoorstel en hoopte de 20 milliwatt waarmee ik begonnen was, elk jaar met twee nullen te kunnen uitbreiden.

215
Dankwoord
Aan de slag dus bij Wetsus. Projectleider (en later mijn co-promotor) was Sybrand Metz. Typerend waren zijn bemoedigende woorden als ik met praktische problemen bij hem kwam. “O wat leuk, zo’n probleem”, zei hij dan, “zoiets vraagt om een adequate oplossing”. En het is die visie die ik later in heel Wetsus tegenkwam: wetenschappelijk onderzoek kent alleen uitdagingen. Problemen zijn dingen voor mensen met psychische moeilijkheden of in het beste geval puzzels voor schakers. In een later stadium was het ook Maarten Biesheuvel die met gouden tips kwam om een rebutal kort, krachtig en kordaat te formuleren.
Gelijkertijd met mij begon ook Jan Post. Met aanvankelijk eenvoudige middelen en een elektrodialyse-apparaat gingen we aan de slag. Ondertussen doken we de literatuur in om onze omgekeerde elektrodialysie (RED) te vergelijken met de osmosetechniek die bekend stond als ‘pressure retarded osmosis’ (PRO). Uiteindelijk bleek het dat voor de combinatie zeewater met rivierwater onze eigen RED technieken de beste perspectieven bood en met hulp van Jan’ s begeleider Bert Hamelers, zijn promotor Cees Buisman, Gert-Jan Euvering en Kitty Nijmeijer, mondde dit uit in de eerste Wetsus-publicatie over Blue Energy. Die brede groep van auteurs was ook nuttig want het schiep een onderlinge band in een tijd dat het buiten onze groep nog geen uitgemaakte zaak was welke techniek - PRO of RED - de meeste perspectieven bood.
Ondertussen had ik een promotor bereid gevonden zijn vertrouwen in mij te stellen: Jan Harmsen die toen via de Hoogewerff leerstoel aan de Technische Universiteit Delft verbonden was. Jan had een open oor als het me niet mee zat en wist zijn luisteren zo nu en dan te onderbreken met een kritische vraag. Dan blijkt, dat je door het doen van je verhaal, je zelf ook eigenlijk al de oplossingen formuleert. Later vertrok Jan naar de Rijksuniversiteit Groningen en werd ons overleg meer gestructureerd, zeker in de laatste fase. En vooral wist Jan mijn gedachtestromen zodanig te kanaliseren dat deze – eenmaal op papier gezet – ook voor anderen begrijpelijk werden. Voor een artikel dat we een paar jaar geleden samen schreven voor het tijdschrift NPT procestechnologie, moesten we een foto insturen. Beiden bleken we een jeugdopname gebruikt te hebben.
Na korte tijd bij Wetsus werden onze gelederen versterkt door Piotr Długołęcki. Door Piotr hadden we nu ook de kennis en energie van zijn begeleidster Kitty Nijmeijer en zijn promotor Matthias Wessling verankerd binnen het Blue Energy project van Wetsus. We waren nu met drie promovendi en drie universiteiten klaar voor de grote stap voorwaarts. Piotr’s kerntaak lag in het zoeken naar de juiste membranen, Jan had de uitdaging alles wat met vervuiling te maken had naar behoren op te lossen en mijn taak was het ontwerp van de installatie. Later bleek dat onze afgebakende gebieden aan het vervloeien waren.

216
Dankwoord
Zoals al eerder genoemd, had ik ambitieuze plannen wat betreft het te genereren vermogen. De testopstelling moest uitgebreid worden en een energiek stagiair, Sjoerd Zijlstra, diende zich aan. Sjoerd ging voortvarend aan de slag en na enige maanden had hij een complete en grootschalige voeding voor mij en ook een voor Jan Post ontworpen en gebouwd, hierbij geholpen door Wim Borgonje, Harrie Bos en later ook door Harm van der Kooi. Met name Harrie heeft er erg veel tijd in deze apparaten gestopt.
Nieuwe stagiaires verschenen. Met Ynse Haitsma en Mark Hazenberg ben ik begonnen te zoeken naar het meest ideale elektrolyt. We concentreerden ons op het systeem rood en geel bloedloogzout in een bulk van natriumchloride en konden uiteindelijk de optimale concentraties vaststellen. Met Mariët Slagter maakte ik een nieuw ontwerp voor de kleine stack. We kochten een pers en konden zodoende voortaan zelf stacks bouwen. We waren nu in staat een stack te maken bestaande uit 50 cellen, die meer dan 1 Watt bleek te leveren, meer dan 50 maal de 20 milliwatt waar we ooit mee begonnen.
Op zeker moment kwam Michel Saakes in het team. Als echt elektrochemicus, gepokt en gemazeld in de wereld van de lithium-ion batterij, wist hij ons te overtuigen nieuwe meetmethoden te gebruiken en introduceerde hij moderne potentiostaten op het lab. Langzamerhand begon elektrochemie een belangrijk item te worden niet alleen voor ons maar ook voor de mensen van de biobrandstofcel. Dat was aanvankelijk vooral mijn kamergenoot Rene Rozendal, die met zijn enthousiasme en zijn fungeren als voortrekker uiteindelijk in drie thema’s van Wetsus zijn sporen wist achter te laten.
Met Martijn Dirkse uit Wageningen en de stagiairs Pieter van Norel en Rade Matic werd de hydrodynamica van het water in de spacerruimte onder de loep genomen. Met de stagiairs werden bij Wetsus experimenten uitgevoerd om de drukval in diverse celconfi guraties te meten. Verder maakten we fi lmopnames van geïnjecteerde hoeveelheden inkt in een doorzichtige cel.
Al snel in het begin van mijn promotieperiode werd het bedrijf REDstack opgericht, een samenwerking tussen diverse bedrijven die elkaar al kenden als participant van het thema energie. Pieter Hack was daar de bezielende directeur en Jan Post trad er als deeltijdwerknemer in dienst. Het was REDstack die een grote stack fi nancierde die meer mogelijkheden voor wetenschappelijk onderzoek dan de tot dan toe gebruikte kleine stacks. Jan Valk van Landustrie tekende voor het ontwerp. De bedoeling was dat de voeding zowel horizontaal als verticaal doorgeleid kon worden en dat de elektroden ook afzonderlijk belast konden worden.

217
Dankwoord
Het bouwen van de stack werd gedaan door drie stagiairs: Feiko Reinalda, Bertus Nobach en Wytze Kingma. Gedrieën hebben ze de stack gestapeld tot 25 celparen waarna Feiko de eerste experimenten ging uitvoeren met de stack. Reinald Mark de Jong zag kans de stack uit te breiden tot 50 cellen en er een aantal experimenten mee te doen. Verder maakte Reinald ook een start met metingen aan met zoutmengsels waarbij we voor de analyse dankbaar gebruik konden maken van de expertise van de mensen van het lab: Janneke Tempel, Jelmer Dijkstra en Pieter Wartena.
De grote stack had een oppervlak van achttien vierkante meter membraan en zou dus bijna twintig watt kunnen opleveren. Dat was duizend maal meer vermogen dan de twintig milliwatt waar drie jaar geleden mee begonnen werd en leidde tot de “RED-wet” die zegt dat het RED-vermogen zich elk jaar vertienvoudigt. Zo is in ieder geval makkelijk een antwoord te geven op de vraag hoe lang het nog duurt voordat er een installatie van tweehonderd megawatt in de Afsluitdijk komt: nog zeven nullen erbij dus nog zeven jaar opschalen.
De Rijksuniversiteit Groningen begon ook aandacht te krijgen voor het Blue Energy project. Bart Bouter maakte een scriptie over het onderwerp en Gijsbert Haaksman en Jeroen Bokhove gingen aan de slag met het design van een Blue Energy installatie. Simon Grasman begon in die tijd aan zijn afstudeeropdracht bij Wetsus, ongeveer tegelijkertijd met Piet Leijstra uit Twente. Beiden traden later in dienst bij REDstack en aldaar mocht ik weer met ze samenwerken.
Uit het bovenstaand overzicht blijkt dat stagiairs steeds een zeer belangrijke bijdrage hebben geleverde aan het welslagen van het Blue Energy project. In het laatste stadium waren dat Freerk Mellema, Jan Jansen, Daniël Beerlings en Tiara Stoker. Het waren vooral HBO-studenten die participeerden in ons Blue Energy team en het waren lieden van divers pluimage: werktuigbouwers, elektrotechnici, chemisch technologen, chemisch analisten en milieukundigen.
Natuurlijk waren mijn collega’s van Van Hall en de NHL ook dicht in de buurt en dat was vaak handig omdat dat een goudmijn is van kennis over de meest uiteenlopende vakgebieden. Met Jan van Delden ben ik doorgedrongen in de (on)mogelijkheden van DEA (Data Envelopment Analysis) en Piet Hofman’s willig oor heb ik gebruikt om mijn thermodynamische kennis te toetsen. Verder moet ik mijn beide steunpilaren voor het Engels bedanken: Folkert van Beijma en Yolanda Wijnsma.

218
Dankwoord
Eerdere promovendi konden nog iedereen bij Wetsus persoonlijk noemen in hun dankwoord. Maar Wetsus groeit exponentieel. In dit overzicht heb ik mij beperkt tot die mensen waarin ik direct te maken had met het onderwerp Blue Energy. Alle anderen waarmee ik gezellig een boterham gegeten heb, waar ik mee geboerengolfd heb of op andere wijze mee verpoosd heb wil ik ook bedanken voor de gezelligheid, het vertrouwen en de vriendschap tijdens de jaren bij Wetsus.
Rest mij nog te noemen de viermaandelijkse hoogtepunten: de themateam-bijeen-komsten. Het bijzondere daarvan is dat je ziet dat wetenschap serieus genomen wordt door de industrie. Het blikveld van de participanten is anders dan van de universitaire wereld. Daar waar de wetenschap houdt van diepgraverij, denkt de industrie aan expansie. Het was vooral Maarten van Riet die met zijn enthousiasme de bijeenkomsten een levendig verloop wist te geven. Daarnaast was het Pieter Hack die door zijn kennis van het zakenleven gestalte wist te geven aan de formele kanten van ons themateam en tevens de brug was naar REDstack. En Marcel Geers leerde ik kennen als iemand die onverzadigbaar was wat betreft alles wat we aan wetenschappelijk materiaal produceerden. Gelukkig voor hem is er een nieuw jong en krachtig Blue Energy team, bestaande uit het driemanschap Bruno Bastos, David Vermaas en Enver Guler, dat erg vernieuwend bezig is en in korte tijd op alle fronten forse resultaten heeft geboekt.
Zeer in het bijzonder wil ik de leden van de beoordelingscommissie, de hoogleraren Michèl Boesten, Freek Kapteijn en Matthias Wessling bedanken voor hun energie die ze gestoken hebben in het lezen van dit proefschrift en voor de daaruit voortvloeiende suggesties om de leesbaarheid van dit proefschrift te stroomlijnen. En verder beschouw ik het als een grote eer dat behalve deze genoemde drie ook de hoogleraren Martien Cohen Stuart, Ton Schoot Uiterkamp en Hans Wesselingh bereid zijn de oppositie te voeren. Een dergelijke krachtige oppositie is alleen het hoofd te bieden met tactische en bekwame hulp van geschoolde paranimfen en ik prijs mij gelukkig dat mijn dochteren Vera en Roos zich van deze taak willen kwijten.
Ten tenslotte: waarom doen we dit allemaal? Momenteel verstoken we per jaar een hoeveelheid fossiele brandstof waar de natuur bijna een miljoen jaar over gedaan heeft om die te vormen. Die voorraden zijn vooral in het Carboon aangelegd, een periode die zestig miljoen jaar duurde. De rekensom is dus dat we er nog zestig jaar verder mee kunnen. Daarbij komt dan nog het probleem van de klimaatsverandering door de opwarming van de aarde. Het is duidelijk dat er duurzame oplossingen moeten komen voor onze energievoorziening. Het is onze generatie die het meeste heeft opgesoupeerd van de bodemschatten. Het is dus ook onze generatie die naar alternatieven zal moeten

219
Dankwoord
zoeken. Ik ben blij daar een kleine rol in te hebben mogen spelen. Het geeft een goed gevoel mee hebben mogen werken aan het aanboren van een nieuwe energiebron die in principe schoon en duurzaam is.
Wergea, 20 augustus 2010 Joost Veerman


