return on investment
TRANSCRIPT

ROI Return on Investment
Abdul Gafoor
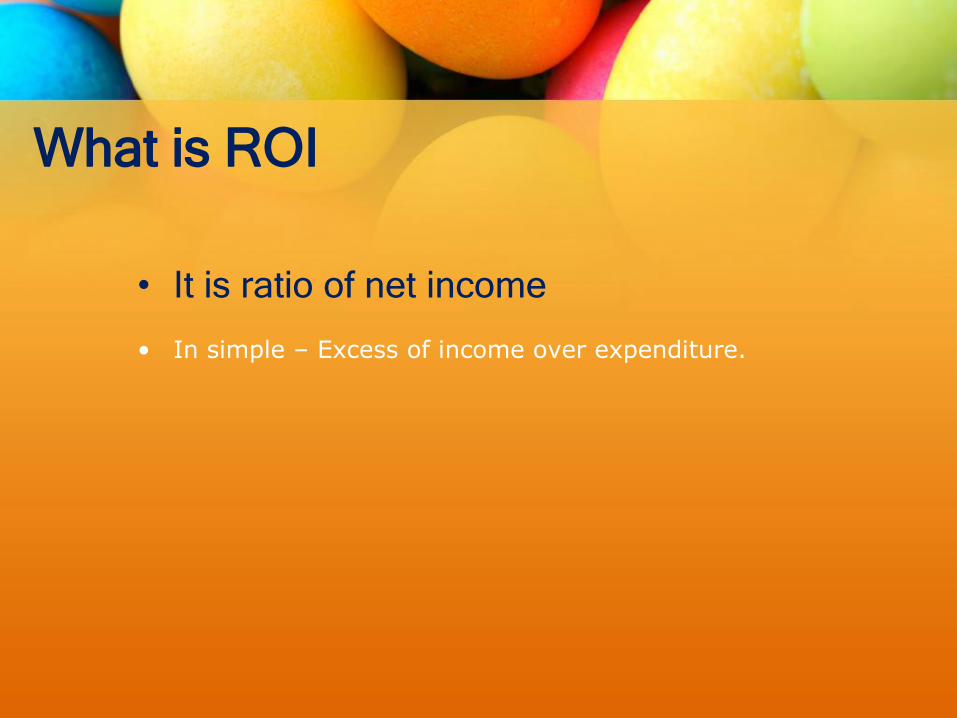
• It is ratio of net income
• In simple – Excess of income over expenditure.
What is ROI

Why Profits
• Reward for an entrepreneurs / Distributors. • Profits are indications of the efficiency of
utilization of the resources used in business. • To meet the expenditure. • For the purpose of plough backing.
Return on investment – Distributor point of view.
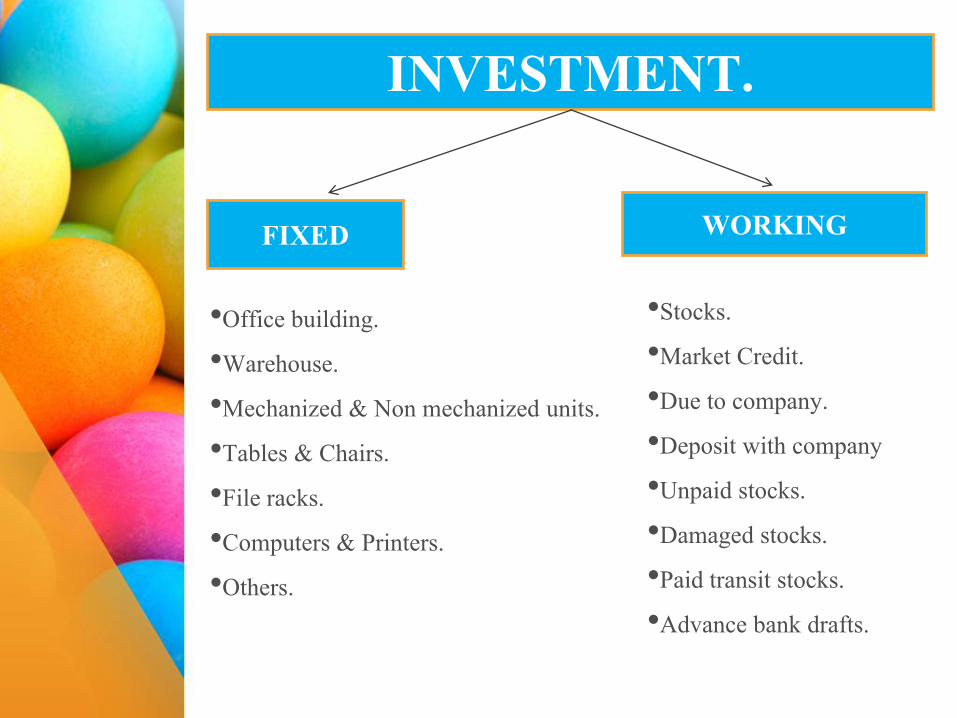
INVESTMENT.
WORKING FIXED
•Office building. •Warehouse. •Mechanized & Non mechanized units. •Tables & Chairs. •File racks. •Computers & Printers. •Others.
•Stocks. •Market Credit. •Due to company. •Deposit with company •Unpaid stocks. •Damaged stocks. •Paid transit stocks. •Advance bank drafts.
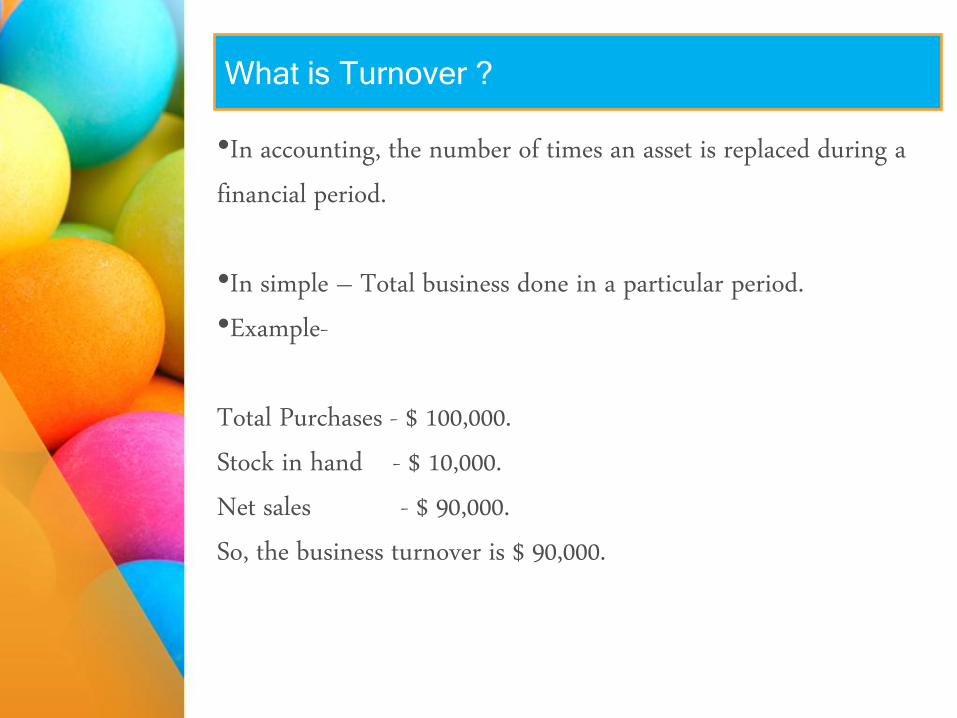
What is Turnover ?
•In accounting, the number of times an asset is replaced during a
financial period.
•In simple – Total business done in a particular period.
•Example-
Total Purchases - $ 100,000.
Stock in hand - $ 10,000.
Net sales - $ 90,000.
So, the business turnover is $ 90,000.

What is rate of turnover ?
•Rate of turnover is number of times the average stocks sold
during a period of time.
•Benefits of fast rate of turnover.
More rotations
More profits.
More return on investment.
Less capital.
More sales.
Fresh stocks in rotation.
Low interest amount.
Market credit control.
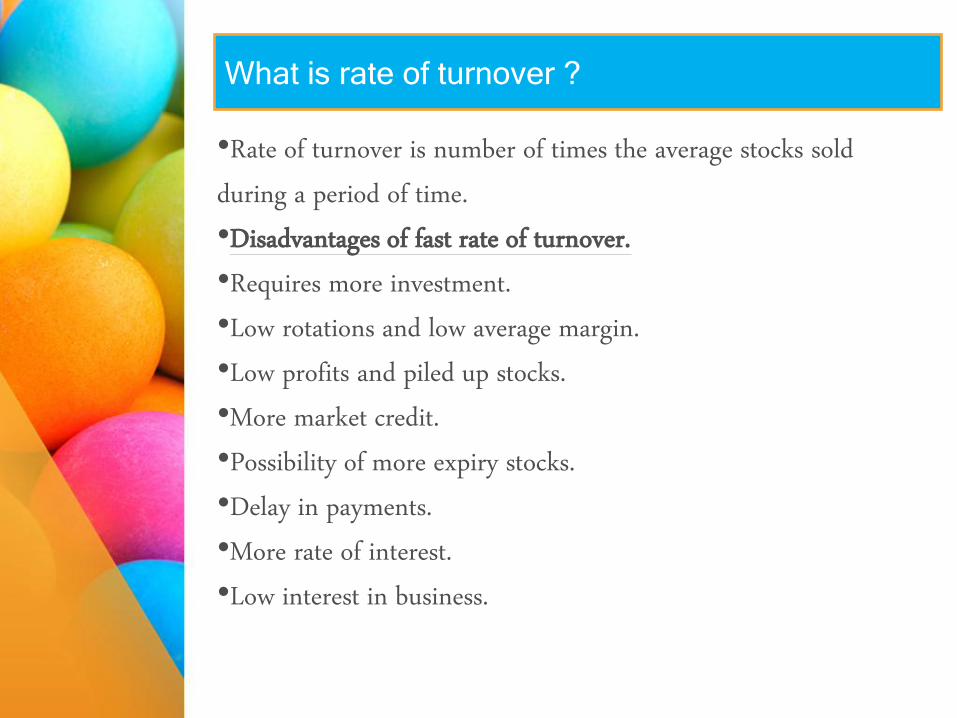
What is rate of turnover ?
•Rate of turnover is number of times the average stocks sold
during a period of time.
•Disadvantages of fast rate of turnover.
•Requires more investment.
•Low rotations and low average margin.
•Low profits and piled up stocks.
•More market credit.
•Possibility of more expiry stocks.
•Delay in payments.
•More rate of interest.
•Low interest in business.
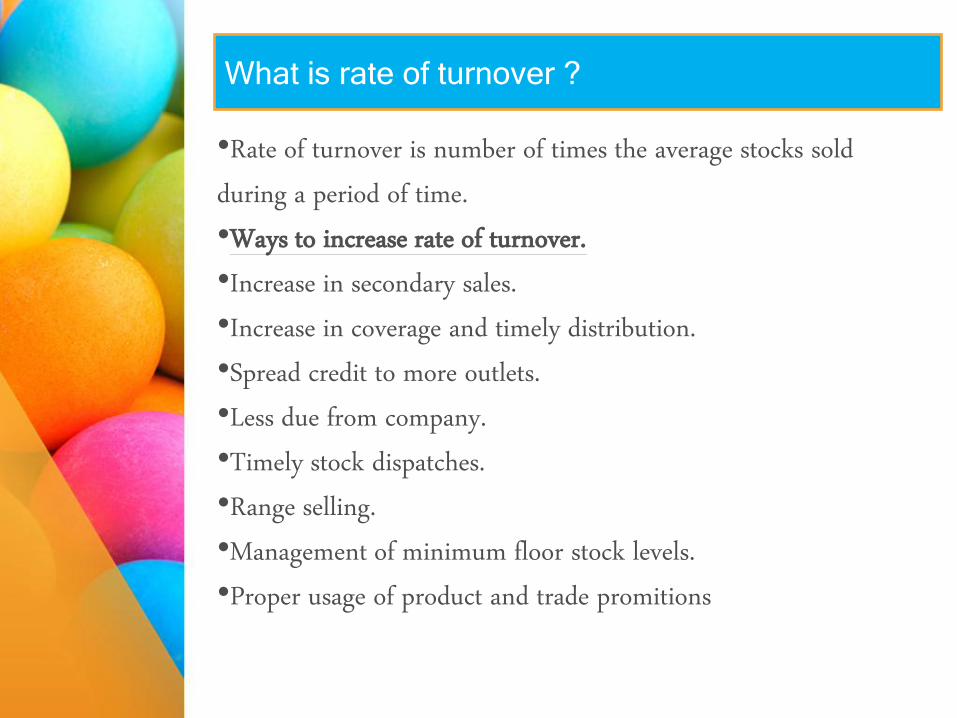
What is rate of turnover ?
•Rate of turnover is number of times the average stocks sold
during a period of time.
•Ways to increase rate of turnover.
•Increase in secondary sales.
•Increase in coverage and timely distribution.
•Spread credit to more outlets.
•Less due from company.
•Timely stock dispatches.
•Range selling.
•Management of minimum floor stock levels.
•Proper usage of product and trade promitions

Return on investment calculations
Example -1
Gross Profit : $ 2,000,000
Expenses: $1,000,000
Investment: $ 500,000
Solution: Gross Profit - Expenses = Net Profit. x 100
Investment
2,000,000 -1,000,000 x 100
500,000
Return on Investment: 200%
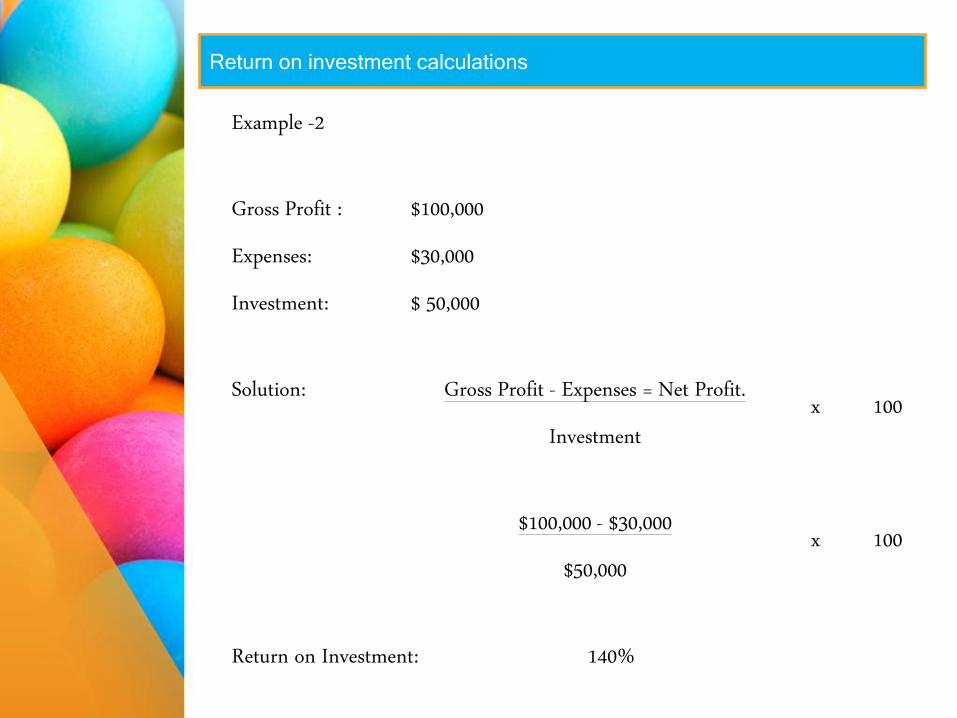
Return on investment calculations
Example -2
Gross Profit : $100,000
Expenses: $30,000
Investment: $ 50,000
Solution: Gross Profit - Expenses = Net Profit. x 100
Investment
$100,000 - $30,000 x 100
$50,000
Return on Investment: 140%

Return on investment calculations
Example -3
Gross Profit : $10,000
Expenses: $5,000
Investment: $ 25,000
Solution: Gross Profit - Expenses = Net Profit. x 100
Investment
$10,000 - $5,000 x 100
$25,000
Return on Investment: 20%

Return on investment calculations
Example -4
Stocks value : $20,000
Distributor margin : 5%
Expenses: $ 2,00
Solution:
Gross Profit: $952
Expenses: $200
Net Profit: $752
Solution: Net Profit. x 100
Investment
$752 x 100
$20,000
Return on Investment: 3.76%
Return on investment calculations
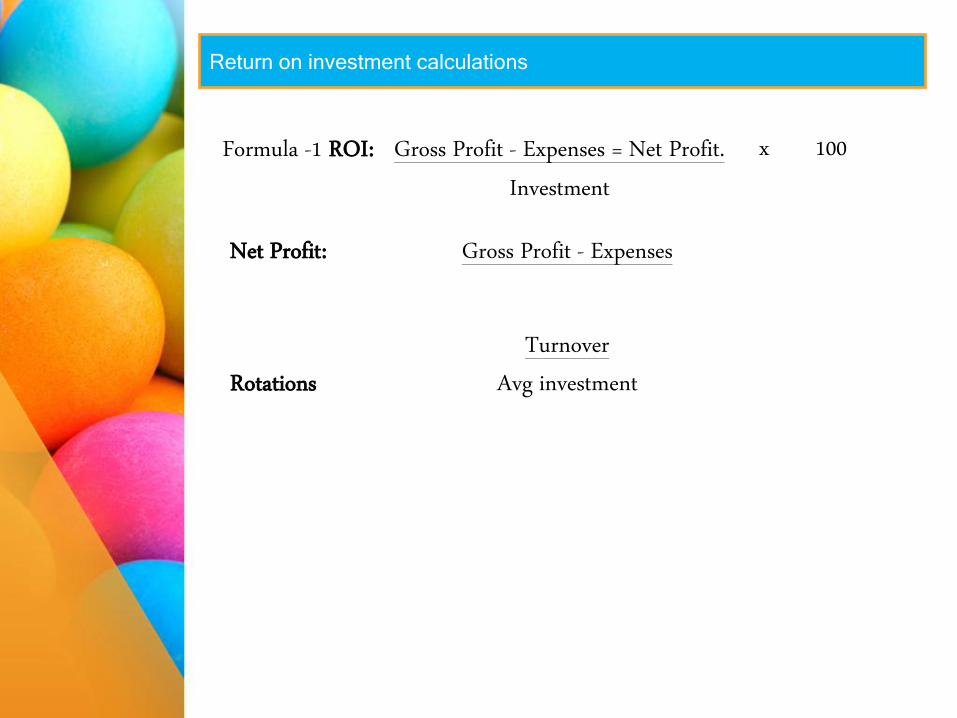
Formula -1 ROI: Gross Profit - Expenses = Net Profit. x 100
Investment
Net Profit: Gross Profit - Expenses
Rotations
Turnover
Avg investment
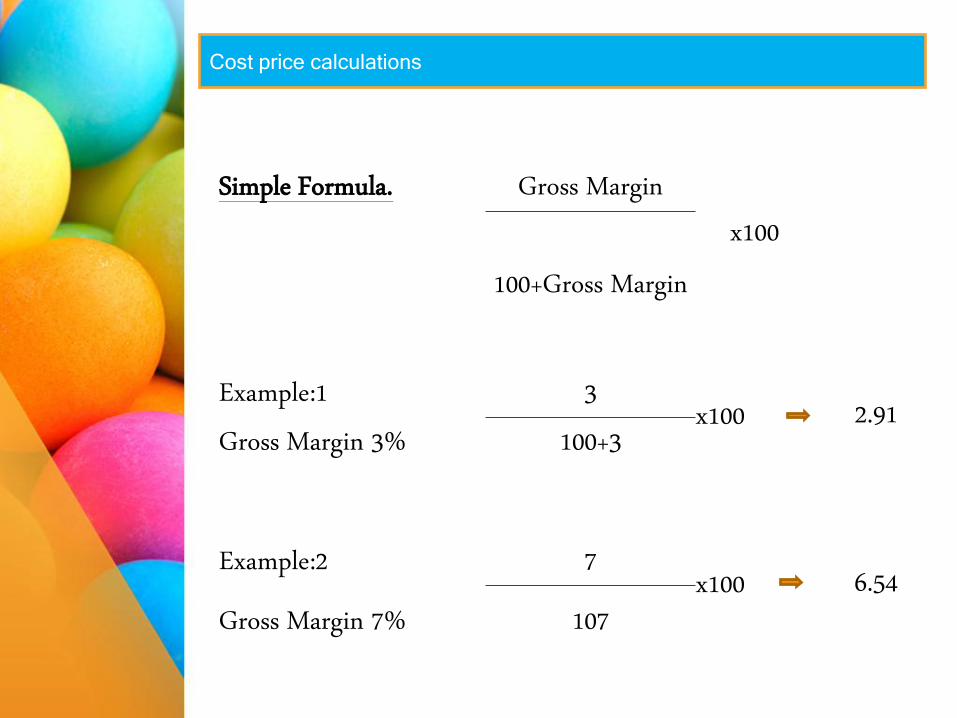
Cost price calculations
Simple Formula. Gross Margin
x100
100+Gross Margin
Example:1 3 x100 2.91
Gross Margin 3% 100+3
Example:2 7 x100 6.54
Gross Margin 7% 107
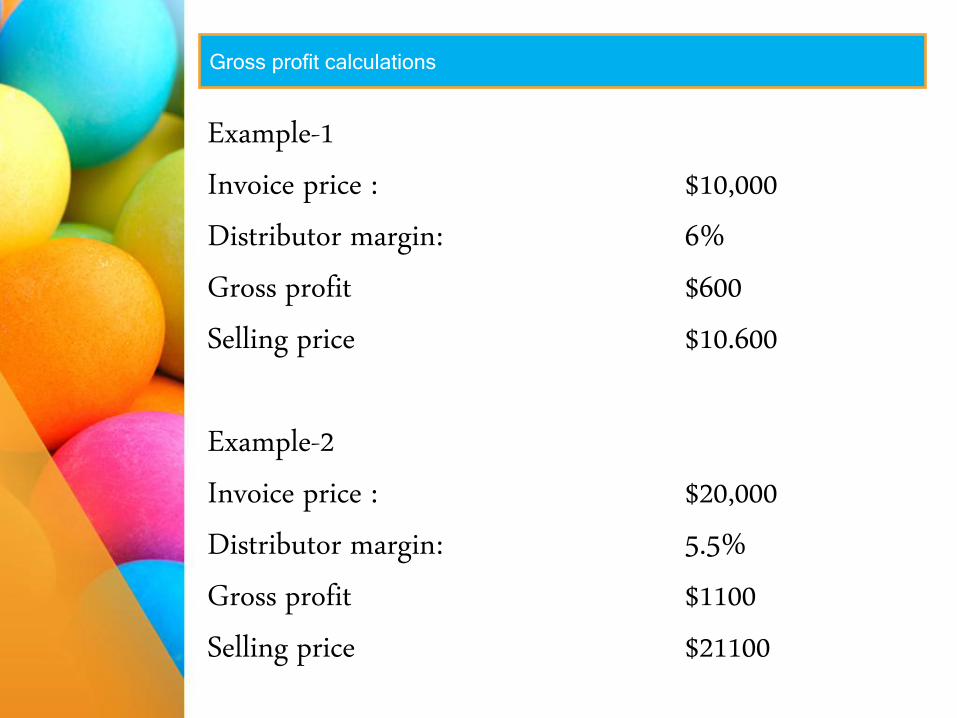
Gross profit calculations
Example-1
Invoice price : $10,000
Distributor margin: 6%
Gross profit $600
Selling price $10.600
Example-2
Invoice price : $20,000
Distributor margin: 5.5%
Gross profit $1100
Selling price $21100
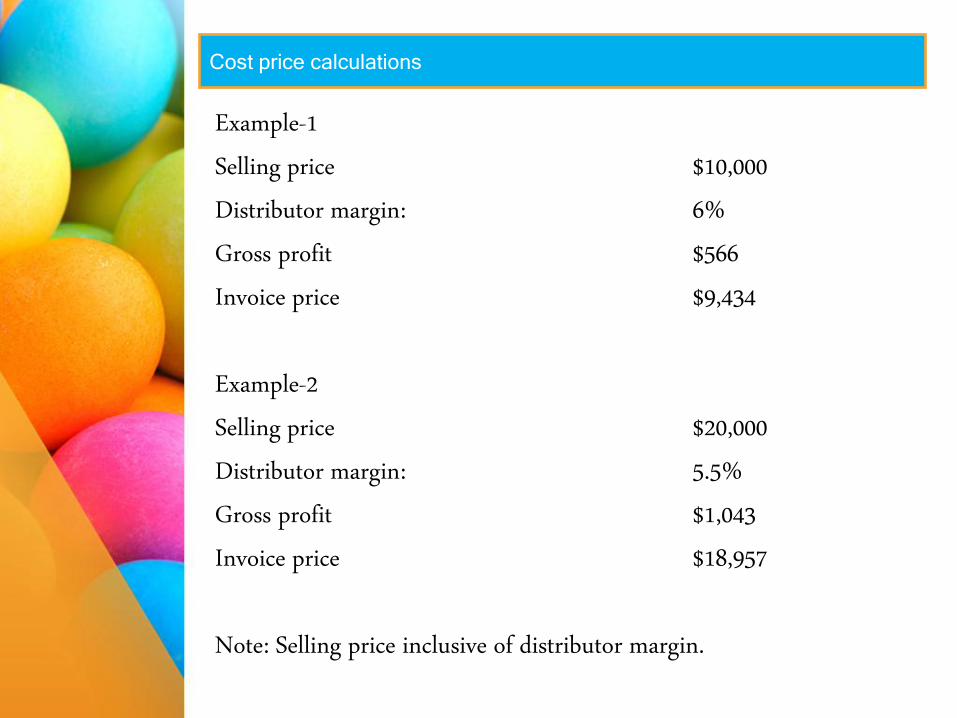
Cost price calculations
Example-1
Selling price $10,000
Distributor margin: 6%
Gross profit $566
Invoice price $9,434
Example-2
Selling price $20,000
Distributor margin: 5.5%
Gross profit $1,043
Invoice price $18,957
Note: Selling price inclusive of distributor margin.

Now you know how to calculate “Return on investment”

Step by step calculations
Problem-1
Invoice price $ 22,000
Distributor margin: 5%
Calculate selling price
Solution.
$22,000 x 5
100
Selling price: $23,100
Problem-2
Invoice price $ 46.300
Distributor margin: 5.76%
Calculate selling
price
Solution.
$46,300 x 5.76
100
Selling price: $48,967

Step by step calculations
Problem-3
Invoice price $ 22,000
Distributor margin: 5%
Calculate - GP & SP
Solution.
$22,000 x 5
100
Gross Profit: $1,100
Selling price: $23,100

Step by step calculations
Investment
Expenses
Rotations
Margins
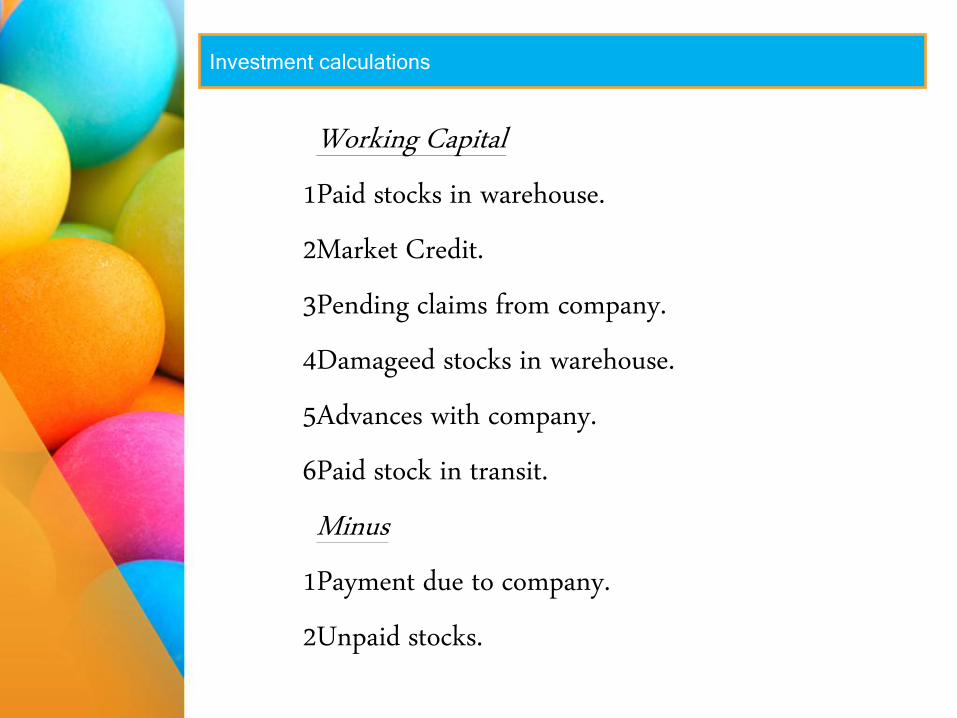
Investment calculations
Working Capital
1 Paid stocks in warehouse.
2 Market Credit.
3 Pending claims from company.
4 Damageed stocks in warehouse.
5 Advances with company.
6 Paid stock in transit.
Minus
1 Payment due to company.
2 Unpaid stocks.

Net profit calculations
Gross profit – Expenses = Net profit
Problem-1
A. Turnover $20,000
B. Gross Margin 5.77%
C. Expenses $800
Calculate net profit
A. Gross profit $1,091
B. Expenses $800
C. Net profit $291
( A-B=C)

Net margin calculations
Problem-1
A. Turnover $20,000
B. Gross profit $3500
C. Expenses $1100
Calculate net margin
A. Gross profit $3500
B. Expenses $1100
C. Net profit $2400
D. Net margin 12%
Formula Net profit/ Turnover x %
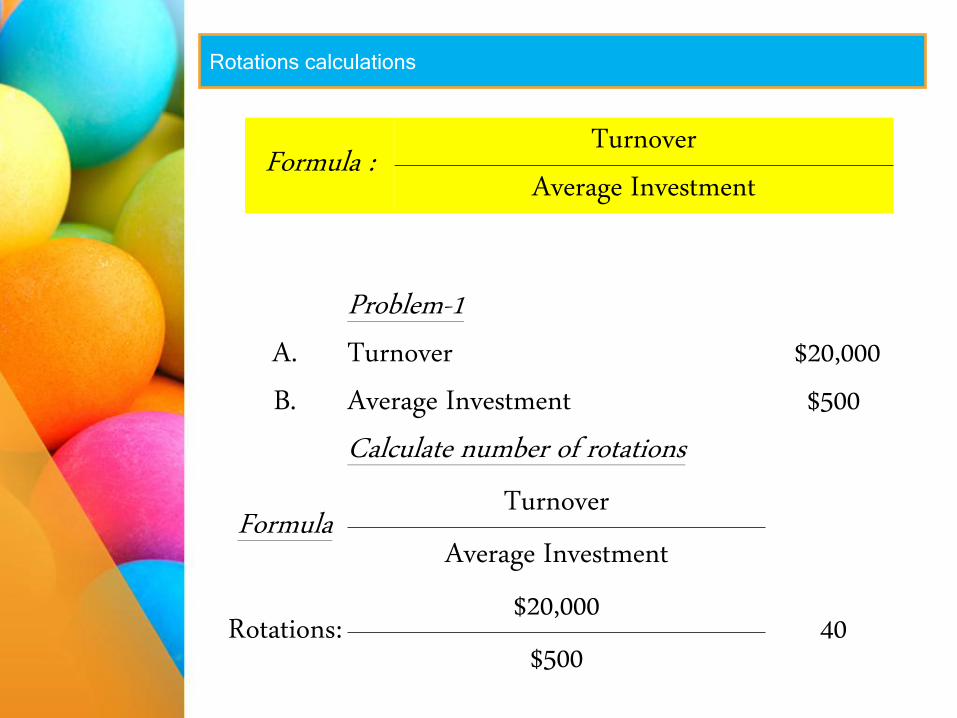
Rotations calculations
Formula : Turnover
Average Investment
Problem-1
A. Turnover $20,000
B. Average Investment $500
Calculate number of rotations
Formula Turnover
Average Investment
Rotations: $20,000
40 $500

Return on investment calculations
Formula : Gross profit- Expenses
x 100 Investment
or
Formula : Net profit
x 100 Investment
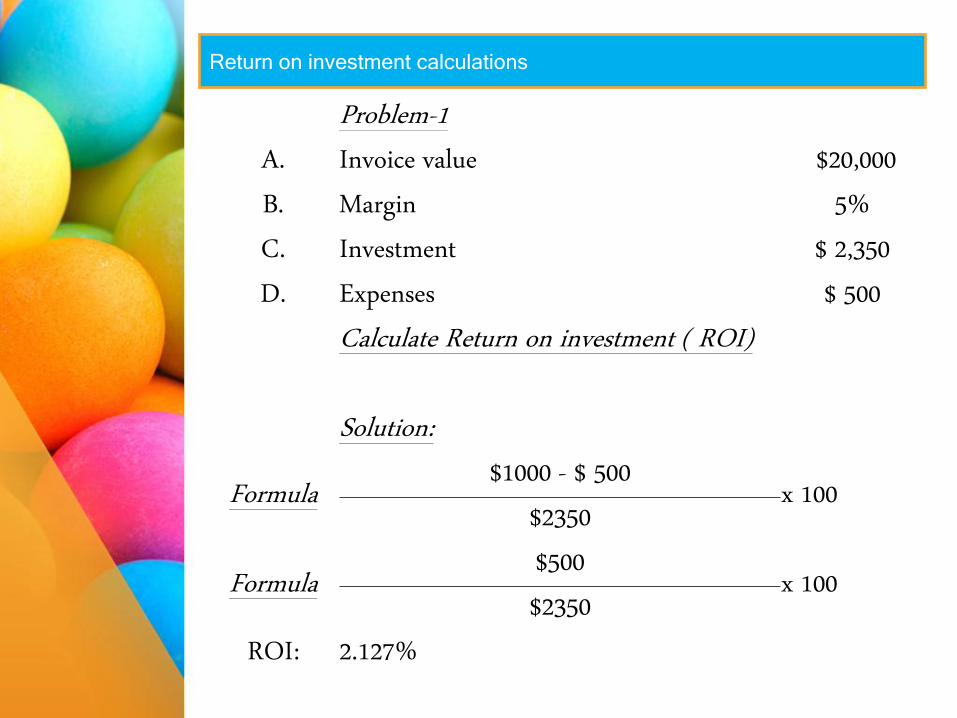
Return on investment calculations
Problem-1
A. Invoice value $20,000
B. Margin 5%
C. Investment $ 2,350
D. Expenses $ 500
Calculate Return on investment ( ROI)
Solution:
Formula $1000 - $ 500
x 100 $2350
Formula $500
x 100 $2350
ROI: 2.127%

Return on investment calculations
Problem-2
A. Turnover $30,000
B. Average stock value $ 1000
C. Average market credit $800
D. Pending claims from company $ 500
E. Due to company $ 300
F. Due from company $ 200
G. Distributor margin 5%
H. Salaries $ 300
I. Discounts $35
J. Fuel $30
K. Electricity $20
Calculate Return on investment ( ROI)
Return on investment calculations
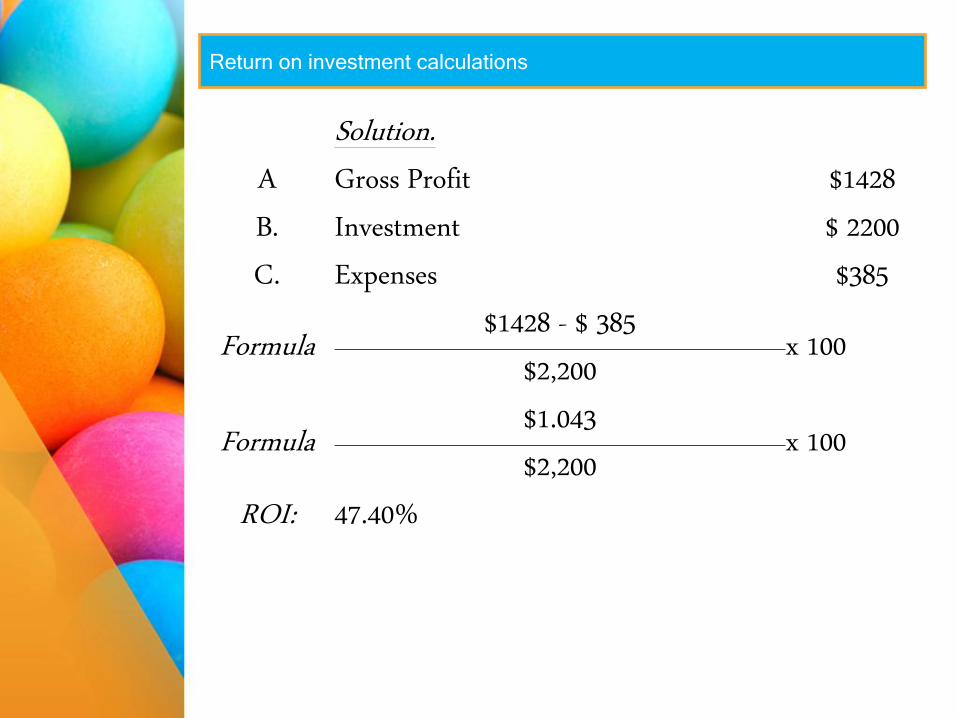
Solution.
A Gross Profit $1428
B. Investment $ 2200
C. Expenses $385
Formula $1428 - $ 385
x 100 $2,200
Formula $1.043
x 100 $2,200
ROI: 47.40%
Return on investment calculations
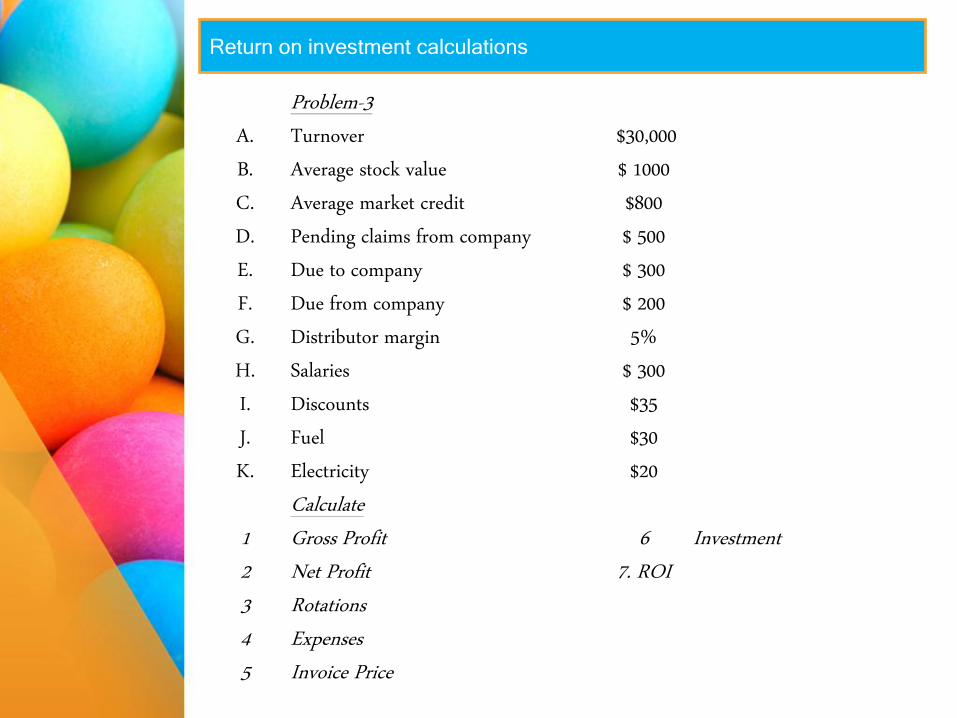
Problem-3
A. Turnover $30,000
B. Average stock value $ 1000
C. Average market credit $800
D. Pending claims from company $ 500
E. Due to company $ 300
F. Due from company $ 200
G. Distributor margin 5%
H. Salaries $ 300
I. Discounts $35
J. Fuel $30
K. Electricity $20
Calculate
1 Gross Profit 6 Investment
2 Net Profit 7. ROI
3 Rotations
4 Expenses
5 Invoice Price

Return on investment calculations
Solution
1 Gross Profit: Turnover x 4.76% :$ 1,428
2 Net Profit : Gross profit- Expenses :$ 1,043
3 Rotations: Turnover/ Investment : 13.63
4 Expenses: Expenses $385
5 Invoice price:
Turnover x 4.76% (-
T/O) $28,572
6 Investment: (b+c+d+f-e) $ 2,200
7 ROI
Net proft/ Investment
x% 47.40%

Return on investment calculations
Investment conversions
Problem-1
A. Average stock 10 days
B. Average market credit 6 days
C. Average pending from company 12 days
D. Turnover $100,000
Calculate investment in value($)
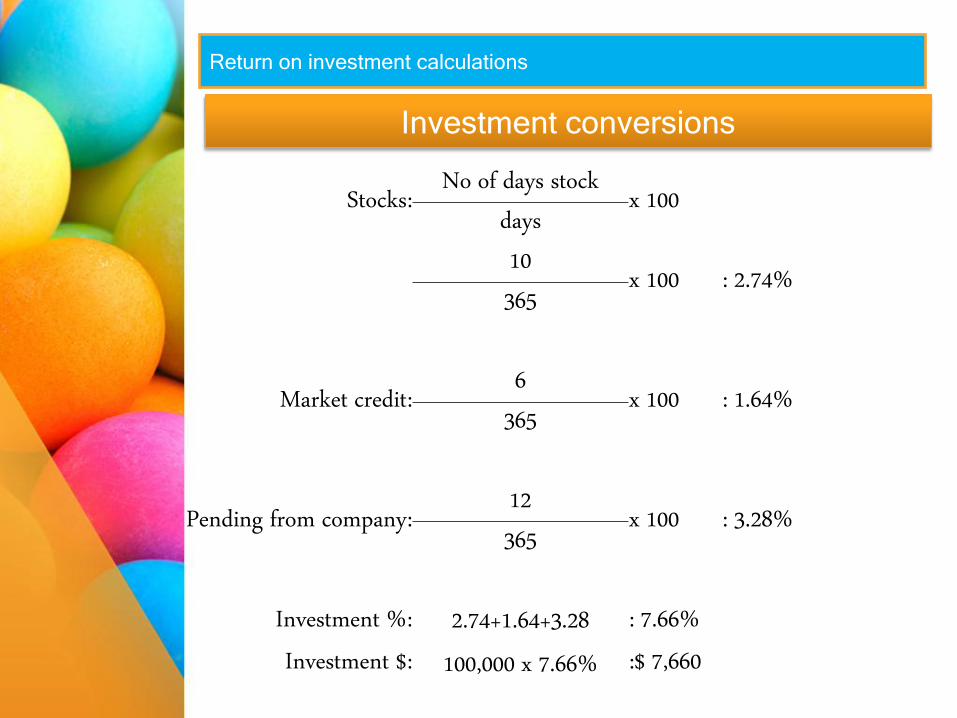
Return on investment calculations
Investment conversions
Stocks: No of days stock
x 100 days
10 x 100 : 2.74%
365
Market credit: 6
x 100 : 1.64% 365
Pending from company: 12
x 100 : 3.28% 365
Investment %: 2.74+1.64+3.28 : 7.66%
Investment $: 100,000 x 7.66% :$ 7,660

Return on investment calculations
Investment conversions
Problem-2
A. Turnover $100,000
B. Average stocks per day $ 340
C. Average market credit per day $230
D. Average pending claims per day $210
E. Average due from company per day $110
Convert the investment in %

Return on investment calculations
Investment conversions
Solution
Turnover in days: 100,000
: 273.97 365
Stocksin days: 340
: 1.24 273.97
Crediti in days: 230
:0.83 273.97
Pending in days : 210
:0.76 273.97
Due from in days: 110
:0.40 273.97
Total investment in days: 3.23

Return on investment calculations
Investment conversions
Stocks: 1.24
x 100 : 0.33% 365
Crediti : 0.83
x 100 :0.22% 365
Pending : 0.76
x 100 :0.20% 365
Due from : 0.40
x 100 :0.10% 365
Total investment % 0.85

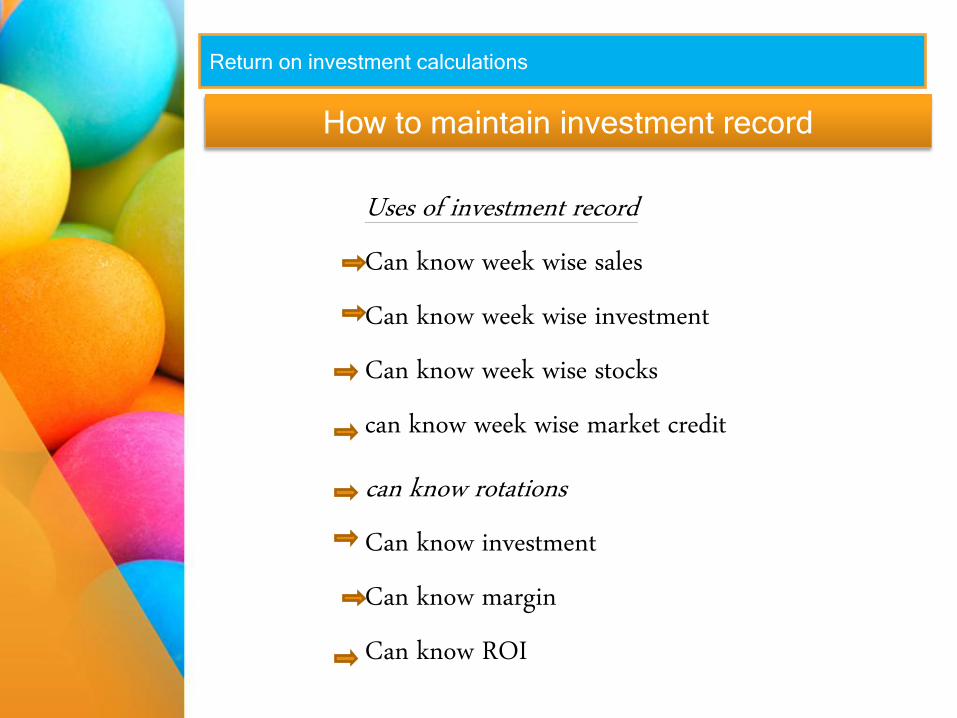
Return on investment calculations
How to maintain investment record
Investment record all $
Sales Investment
Rotations Week
This
week
Cumulativ
e week
Expecte
d sales
Stock
value
Market
credit
Due
from
company
Total
investme
nt
Investmen
t %
1 1.00 1.00 52.00 2.00 1.00 1.16 4.16 8.00 12.50
2 2.00 3.00 78.00 2.10 1.00 0.80 3.90 5.00 20.00
3 1.00 4.00 69.00 1.00 1.00 1.00 3.00 4.34 23.00
4 2.50 6.50 84.50 1.80 1.20 0.60 3.60 4.26 23.47
5 3.00 9.50 98.80 0.80 1.20 0.30 2.30 2.32 42.96
6 1.00 10.50 91.00 0.60 0.60 0.60 1.80 1.97 50.56
7 0.50 11.00 81.70 2.00 1.00 1.00 4.00 4.89 20.43
8 0.30 11.30 73.45 2.10 2.10 3.00 7.20 9.80 10.20
Return on investment calculations
How to maintain investment record
Uses of investment record
Can know week wise sales
Can know week wise investment
Can know week wise stocks
can know week wise market credit
can know rotations
Can know investment
Can know margin
Can know ROI
Thank you
very much
Abdul Gafoor