retrofittable dry low emissions combustor for 501-k ... · retrofittable dry low emissions...
TRANSCRIPT
THE AMERICAN SOCIETY OF MECHANICAL ENGINEERS 345 E. 47th St., New York, N.Y. 10017
The Society shall not be responsible for statements or opinions advanced In papers or discussion at meetings of the Society or of its Divisions or Sections, or printed In its publications. Discussion is printed only If the paper is pub-lished in an ASME Journal. Papers are available from ASME for 15 months after the meeting.
Printed in U.S.A.
94-GT-439
RETROFITTABLE DRY LOW EMISSIONS COMBUSTOR FOR 501-K INDUSTRIAL GAS TURBINE ENGINES
Mohan K. Razdan, Jacob T. McLeroy, and William E. Weaver Allison Engine Company
Indianapolis, Indiana
II11111111111,011111111
Abstract This paper describes progress in the development of a 25
ppm NOx combustor that requires no diluent injection or post-combustion treatment Thecombustor will beretrofittable in all existing Allison Model 501-K series industrial engines. The approach undertaken is based on lean-premix combus-tion design incorporating an efficient fuel and air pre-mixing, fuel staging, and advanced wall cooling.
Extensive use has been made of Computational Combus-tor Dynamics (CCD) codes in the design of the low NO x combustor. Experimental work in support of the present effort includes atmospheric bench scale testing and high pressure rig testing. The bench tests have been performed to evaluate several candidate designs, to gain better understand-ing of general lean pre-mixed combustor behavior, and to verify model predictions. The bench test results have indi-cated good fuel/air mixing performance of the lean pre-mixing domes. The high pressure simulated engine rig tests of the dry lean pre-mixed low emissions combustors using natural gas have demonstrated NO x levels less than 15 ppm vd (15% 02 corrected), well below the program goals.
Introduction Control methods are necessary today to meet the increas-
ingly stringent emissions requirements imposed by regula-tory agencies worldwide. To control emissions of oxides of nitrogen (N0x), current practices mostly include injection of large amounts of diluents such as water or steam, and in some cases use of selective catalytic reduction (SCR). These systems have specific limitations and problems including high installation cost, high operating cost, fuel consumption penalty, and poor reliability. The emissions of carbon mon-
oxide (CO) and unburned hydrocarbons (UHC) are also significantly increased with the use of water injection. Im-proved abatement methods are needed to meet the increas-ingly stringent emissions requirements.
Many of the current state-of-the-art gas turbine combus-tion liners operate under the diffusion flame mode of opera-tion in which fuel/air mixing and combustion processes take place simultaneously. The large regions of near stoichiomet-ric flame temperature in the primary zone of the liner are consistent with the diffusion flame design of the liner. This approach has historically worked well to control burnout of CO and UHC and optimize combustion efficiency, ignition, pattern factor, and lean blowout goals. However, the high temperature regions in the primary combustion zone are for the most pan responsible for the production of high thermal NOx which has an exponential dependency on temperature.
In recent years, several gas turbine manufacturers, in-cluding Allison, have aggressive programs to develop dry lean pre-mix (LPM) low NO combustors (Soh and Tuzson, 1993). In these combustors, fuel and air are pre-mixed ahead of the primary combustion zone to produce low equivalence ratios thereby limiting the primary zone temperature and the production of NOx (equivalence ratio is defined as actual fuel/air ratio divided by the stoichiometric fuel/air ratio). Allison is currently pursuing several dry low emissions devel-opment programs with increasingly stringent goals for NO x emissions. The 25 pprn NOx combustor development pro-gram is the subject of this paper. The development effort has been co-funded by Gas Research Institute (OR!) and Allison. The low NOx liner developed under this program will be retrofittable in existing Allison 501-K series industrial en-gines.
Presented at the International Gas Turbine and Aeroengine Congress and Exposition The Hague, Netherlands — June 13-16, 1994
Copyright © 1994 by ASME
Downloaded From: https://proceedings.asmedigitalcollection.asme.org/ on 06/21/2018 Terms of Use: http://www.asme.org/about-asme/terms-of-use

The goal of the present effort is to develop a cost effective low emissions combustion system. The emissions goals at 100% rated power for natural gas fueled 501-K gas turbine engine are:
• NOx: 25 ppmvd (15% 02 corrected) • CO:
50 ppmvd (15% 02 corrected) • UHC:
20 ppmvd (15% 02 corrected)
Current 501-K Combustion System The Allison Model 501-K gas turbine engine, with an
output ranging from 3000 to 8000 shp, is a compact, light-weight, industrial-derivative of the T56/501 aircraft engine, which has been in production since 1954. Most of the 501-K gas turbines power electric generators for either primary or standby electric installations, and many of them power units for driving pumps and compressors used in oil and gas recovery. The combustion system of the 501-K engine consists of six can-type combustion liners located in the annulus formed by the outer and inner engine casings. Each can is held at the inlet end by a fuel nozzle centered within a fitting in the combustor dome and at the exhaust end by the transition, which engages with the turbine inlet vane assem-blies. Crossover tubes interconnect the cans and provide flame transfer for starting. The six fuel nozzles are connected to a fuel manifold attached to the external surface of the engine outer case. Table 1 shows nominal specifications for the Model 501-KB5S industrial engine.
The standard 501-K combustor is a convection film-cooled, reverse-flow dome-type liner desigmated as low emis-sions (LE) II liner. Recently, Allison has introduced a new low emissions III combustion liner that reduces emissions of NOx by 30%-40% while maintaining low emissions of CO and UHC. The liner incorporates a simple design modifica-tion in which air is selectively introduced in the high tempera-ture regions of the combustor to quench the primary zone hot spots thereby reducing NO x emissions.
Lean Pre-Mix Combustion Approach There are two major challenges of the LPM operation of
a combustion system. First, the combustor must be operable throughout the gas turbine engine cycle from idle to 100% power. During the turndown operation of the combustion system, flame stability must be maintained for the lowest power operation when the fuel/air ratio is lowest. Second, during the lean low temperature reaction zone operation, the cooler combustor walls introduce quenching effects on the reactions involving CO and UHC, therefore resulting in increased emissions of these species.
These two challenges can be addressed by using any one or combination of the following: 1) fuel staging and 2) hot combustor wall design, 3) engine overboard air bleed, and 4) an active variable geometry.
TABLE 1. NOMINAL MAX POWER SPECIFICA- TIONS FOR THE 501-KB5S INDUSTRIAL ENGINE.
Air flow
33 pps Pressure ratio
10 Burner inlet temperature 650°F Burner outlet temperature
2,025°F Turbine inlet temperature
1,935°F Speed
14,200 rpm Engine output
5,500 shp
Fuel Staging Fuel staging is an effective way to control the combustor
stoichiometry. In a fuel staged, multiple injection concept, fuel is staged in several pre-mixing modules to selectively control combustion stoichiometry over the range of engine operation. A simple fuel staged concept utilizes a single pilot nozzle and a main lean pre-mix module. The pilot module•operates in a conventional diffusion flame mode of operation and is used for engine start-up and acceleration. The engine can be operated on the pilot fuel up to a part power point beyond which transition takes place to main lean pre-mix operation. Depending on the LPM design, a small amount of pilot fuel may be left on, providing the ignition source for the main LPM stage.
Hot Combustor Wall Design In the LPM combustion mode, while maintaining the
entire combustor volume at a high degree of uniformity in regards to fuel/air and temperature distribution, quenching effects from wall cooling air and dilution air must be mini-mized, and the combustor inside walls must be maintained at an elevated temperature. Maintaining the high combustor wall temperature also helps improve flame stability which in turn helps improve the range of turndown operation of the combustion system. Allison has demonstrated feasibility of several advanced cooling schemes for gas turbine combustors (Nealy, et al., 1985). These include enhanced convection film cooling techniques such as etched convective channels and impingement as well as other methods such as effusion cooling and transpiration cooling. Allison recently designed, fabricated, and tested a reverse flow annular combustor using complaint metal ceramic technology (Paskin, et al., 1990). All performance goals were met or exceeded while utilizing approximately 80% less cooling air than conventional film-cooled combustors. Allison has also successfully tested the ceramic thermal barrier coated effusion-cooled low emission hot wall liners as discussed later in this paper.
Engine Overboard Air Bleed The engine overboard bleed of air at low power operation
can be effectively used to control the minimum combustor
2 Downloaded From: https://proceedings.asmedigitalcollection.asme.org/ on 06/21/2018 Terms of Use: http://www.asme.org/about-asme/terms-of-use

MAIN FULL MANIFOLD PILOT/ STARTER
FUEL MANIFOLD
FUEL INJECTION HOLES
FUEL TOILS
zirasmil
Pre-Than) CaP
PILOT FUEL INJECTOR
initimanweava we' ==in !KWH WateeeltilWaWMW .
C /ITER SOOT
AXIAL TWIRLER
Fuagn CURVED VANE SWIRLIR PILOT FUEL
FUEL INJECTION MOUT
PILOT/ STARTER FUEL MANIFOLD
fuel/air ratio. A major penalty of its use is the loss of engine thermal efficiency during the bleed operation.
Active Variable Geometry In variable geometry operation, the portion of air intro-
duced into the pre-mixing and the primary combustion zones is adjusted with power level, thus maintaining a nearly constant fuel/air ratio throughout the engine turndown opera-tion. Allison has demonstrated active variable geometry control in several low emissions combustion applications (Ross, et al., 1983, and Novick and Troth, 1981 and 1982). However, use of an active variable geometry system in a gas turbine can introduce mechanical complexity and potential durability problems, and, therefore, its use is not preferred.
Lean Pro-Mix Combustor Configuration Design Allison is currently pursuing designs of several lean pre-
mix combustor configurations. Two such configurations, which have been tested under simulated engine conditions, are briefly described below.
A schematic of the LPM dome of Configuration 1 is shown in Figure 1. In this LPM design the fuel is divided into multiple, discrete locations evenly distributed across the dome air flow path into the mixing zone. Fuel is supplied from the outside of the engine to the main ring manifold. Oval shaped fuel tubes carry the fuel radially inward from the manifold. The fuel tubes are placed between each of the ten swifter vane passages just upstream of the swirler. Each fuel tube has six small holes which distribute the fuel into the air flowing into the mixing cup. The cavities in the main fuel ring manifold and the fuel tubes are designed to minimize pressure losses, and to distribute the fuel uniformly through the fuel holes. The spacing of the holes is optimized for maximum fuel/air mixing efficiency. This partly mixed fuel and air mixture then passes through a curved vane axial swirler. Further mixing is accomplished downstream of the swirler in the pre-mixing cup.
Configuration 2 is basically an extension of Configura-tion 1, with several refinements intended to further improve mixing. A schematic of its LPM dome is shown in Figure 2. In this design, the axial swirler is designed to have 12 airfoi l-shaped hollow vanes. Fuel is distributed to the fuel jets through the hollow cores of these vanes. The number of fuel jets in this design are about twice that of Configuration I. The airfoil shaped vanes reduce the total pressure loss through the swirler and simplify design by eliminating the need for fuel supply tubes. The airfoil design also prevents any flow separation from the vanes, thereby minimizing potential for establishing any self sustaining combustion within the pm-mixing cup. '
In both configurations, the pre-mixed fuel/air mixture exits through a throttling section formed by the centerbody and the pm-mixing cup. The purpose of the throttling section
FIGURE 1. LEAN PRE-MIX DOME FOR DRY LOW NOK CONFIGURATION 1.
FIGURE 2. LEAN PRE-MIX DOME FOR DRY LOW NO CONFIGURATION 2.
is to accelerate the flow for preventing flashback into the pre-mixing cup. The pre-mixing cup and the centerbody are designed such that there is no flow recirculation within the cup to stabilize combustion. The strong swirl introduced to the pre-mixed fuel/air flow by the axial swirler helps stabilize the flame just downstream from the LPM dome. Several small pilot fuel nozzles are located on the dome wall. The pilots are used during engine start-up and part power opera-tion. Ignition is accomplished using a single spark igniter plug located in the ferrule near the pilot nozzles.
The LPM dome is attached to the forward end of a combustion liner. A transition section, which engages with the turbine inlet vane assemblies, is attached to the aft end of the combustion liner. The liner is nominally 5.5 inches inner diameter and 11 inches long. A photograph of the dry low NOx combustor assembly is shown in Figure 3. The assembly shows the LPM dome, effusion-cooled combustor barrel, and the transition section.
The centerbody tip, dome wall, and liner wall are pro-tected from the high temperatures by an efficient effusion cooling design. In this design, air passes through several
3
Downloaded From: https://proceedings.asmedigitalcollection.asme.org/ on 06/21/2018 Terms of Use: http://www.asme.org/about-asme/terms-of-use

Liner transition
Main fuel inlet
Pilot fuel inlet
-
Effusion-cooled combustion liner
Igniter boss Dilution orifices
LPM dome
FIGURE 3. PHOTOGRAPH OF DRY LOW NOx COMBUSTOR ASSEMBLY.
thousand small holes drilled at shallow angles through the wall. These small holes provide a large surface area for heat transfer from the wall to the cooling air. Allison's LE III combustion liner, which was released for production in 1991 for both natural gas and liquid fuel applications, uses the effusion-cooled design and has accumulated several thou-sand hours of field engine testing, indicating significantly enhanced liner durability.
In addition, to maintain "hot" combustor inside walls, the centerbody tip, dome wall, and liner wall are coated with a thermal barrier ceramic (IBC) coating. Any remaining air not used in the primary combustion zone and for wall cooling passes through the dilution holes in the combustor. The airflow distribution in the liner is chosen to provide fuel-lean conditions in the primary combustion zone when operating at the maximum power condition. The equivalence ratio of the mixture exiting the LPM dome at maximum power is in the range of 0.45 to 0.65.
Computational Design Analyses The design of the low emissions combustors was guided
by Allison's two- and three-dimensional computational com-bustion dynamics (CCD) codes. Extensive use of these codes was made to I) provide design guidance in optimizing the fuel injection holes; 2) optimize recirculation strength in the primary combustion zone for improving stability; 3) ensure that there is no significant recirculation occurring in the mixing cup; 4) predict wall temperature and the effect of wall cooling on combustor performance; and 5) investigate fuel staging operation.
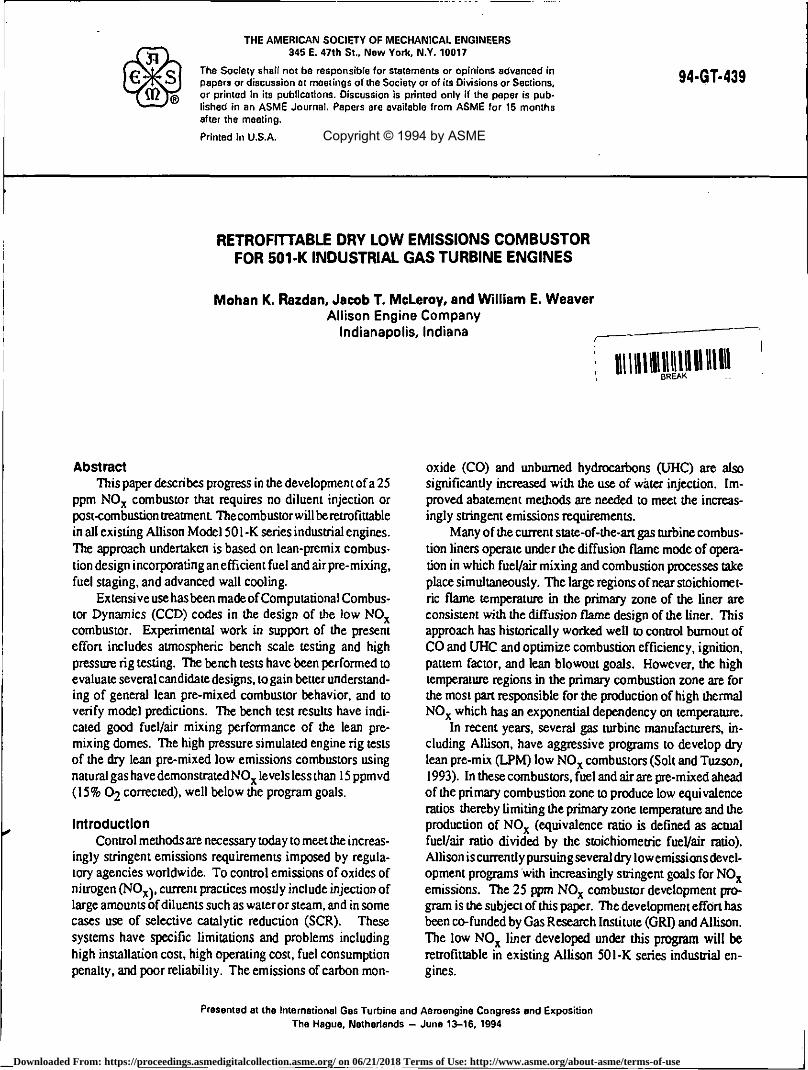
Figure 4 summarizes the results obtained from a simula-tion of dry low NO Configuration 2 using a three-dimen-sional computational combustion dynamics code. The pre-dicted velocity field (Figure 4a) indicates no flow separation or recirculation within the pre-mixing chamber of the LPM dome. Downstream from theLPM dome, a recirculation zone is established to provide combustion stability in the primary
combustion zone upstream of the dilution orifices. The fuel/ air m iiting efficiency is indicated by the predicted distribution of equivalence ratios throughout the combustor before igni-tion (Figure 4b). The predicted equivalence ratio at the exit of the LPM module is very uniform at a value of 0.5. Consistent with the equivalence ratio distribution, the pre-dicted temperature within the combustor (Figure 4c) shows a fairly uniform temperature distribution with no high tempera-ture peaks in the primary combustion zone. Finally, Figure 46 shows the predicted combustion efficiency throughout the combustor. The combustion efficiency is defined here as the predicted local temperature rise divided by adiabatic tem-perature rise. Nearly 100% combustion efficiency is pre-dicted at the exit of the combustor.
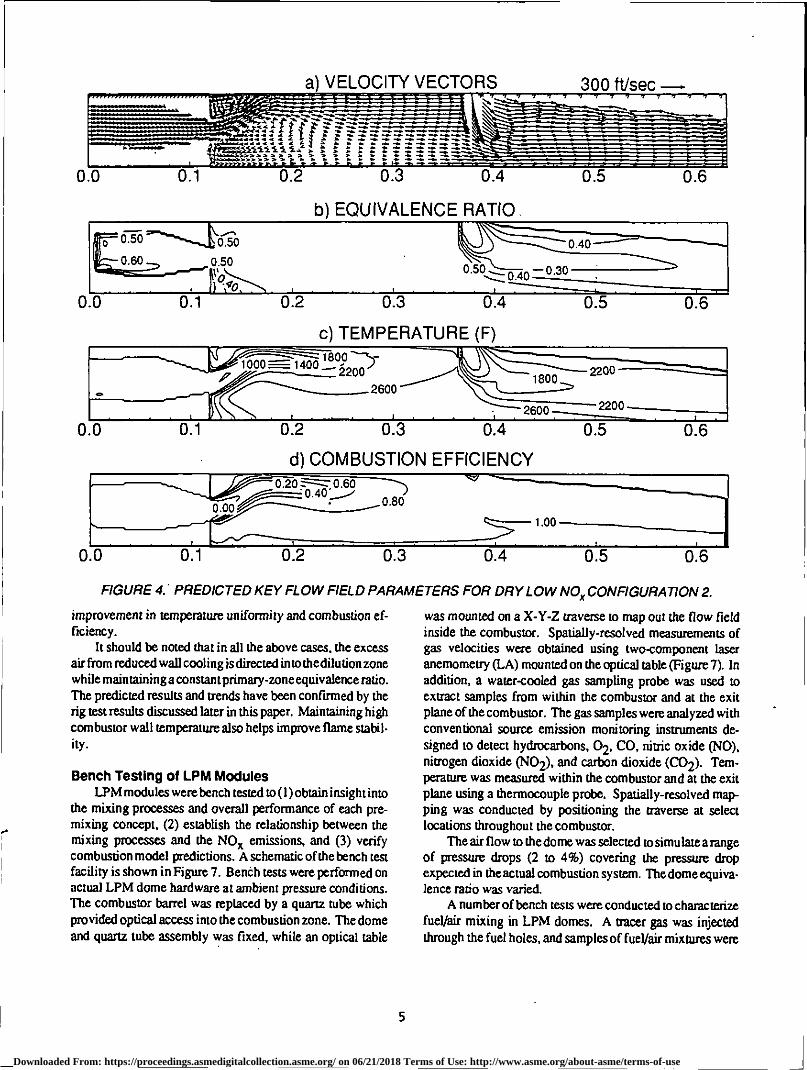
Figure 5 shows predicted effects of dome and combustor liner wall cooling flux (cooling air flow rate per unit surface area) on the temperature distribution within the combustor. The combustor dome and liner wall are cooled using an efficient effusion cooling design. About 20% of the available combustion air is used in the baseline cooling design (Figure 5a). However, relatively cooler (800 to 1200°F) near wall regions are predicted in the primary zone. These regions for the most part are responsible for introducing quenching effects on the reactions involving CO and UHC, resulting in increased emissions of these species. Figure 6 shows pre-dicted effects of wall cooling flux on combustion efficiencies. For the baseline wall cooling case (Figure 6a), the efficiency at the combustor exit is poor at no more than 90%. The effect of reducing the effusion cooling flux by 50% is significant as indicated by the results of Figures 5b and 6b. The temperature distribution is relatively uniform and the near wall cooling region is eliminated. The corresponding predicted combus-tion efficiency is much improved as shown in Figure 6b. Figures Sc and 6c show the results obtained when the effusion cooling flux is completely eliminated, and the liner cooling is solely dependent on the back side convective cooling and the liner inside wall is TBC coated. These results show further
4 Downloaded From: https://proceedings.asmedigitalcollection.asme.org/ on 06/21/2018 Terms of Use: http://www.asme.org/about-asme/terms-of-use
0.5 0.6
1.00
00 0.1 0.2 0.3 0.4
0.40 0 50
2200
b) EQUIVALENCE RATIO
c) TEMPERATURE (F) -------. -1800
1000 1400 - - 2200 2600
2600 -
0.2 0.3 0.4
d) COMBUSTION EFFICIENCY
0:1 00
2200 1800
0.5 0.6
0.50 0.60 0.50
0.1 0.2
0.50 40 -0.30
0.3 0.4 0.5 0.6 00
0.20 ,0.40: 0.60 0.80
r•••••
a) VELOCITY VECTORS 300 ft/sec
0 0 0.1 0.2 0.3 0.4
0.5
0.6
FIGURE 4. PREDICTED KEY FLOW nap PARAMETERS FOR DRY LOW NO CONFIGURATION 2.
improvement in temperature uniformity and combustion ef-ficiency.
It should be noted that in all the above cases, the excess air from reduced wall cooling is directed into the dilution zone while maintaining a constant primary-zone equivalence ratio. The predicted results and trends have been confirmed by the rig test results discussed later in this paper. Maintaining high combustor wall temperature also helps improve flame stabil-ity.
Bench Testing of LPM Modules LPM modules were bench tested to (1) obtain insight into
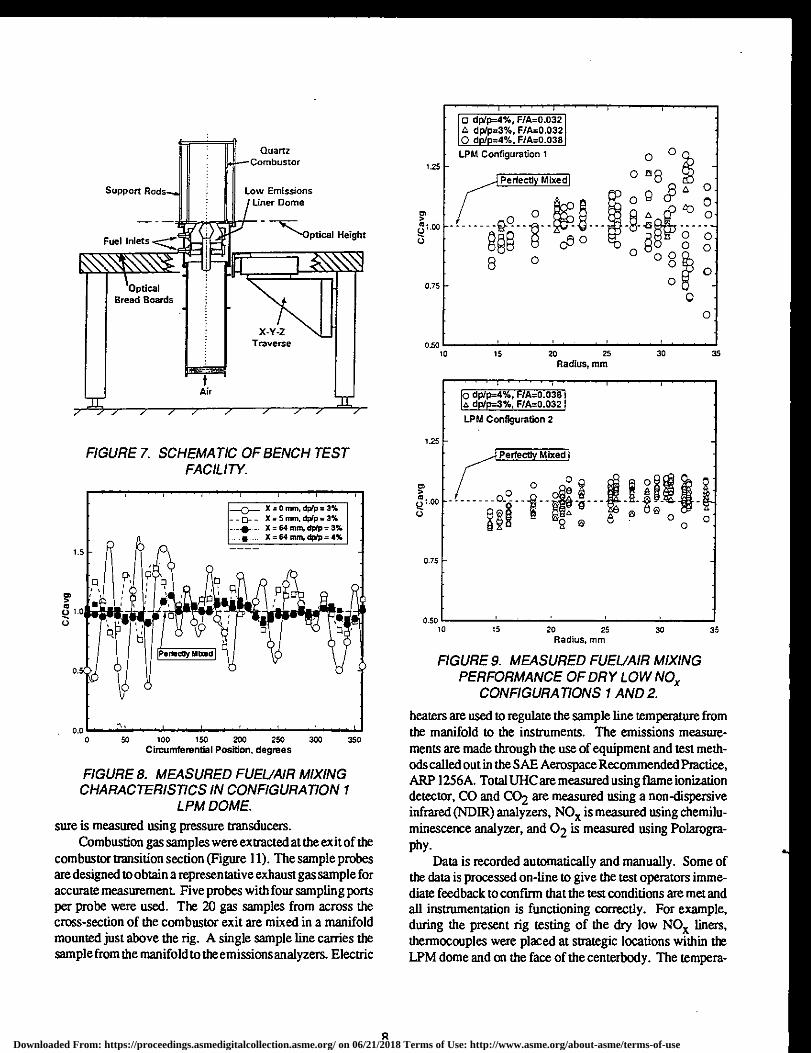
the mixing processes and overall performance of each pre-mixing concept, (2) establish the relationship between the mixing processes and the NOx emissions, and (3) verify combustion model predictions. A schematic of the bench test facility is shown in Figure 7. Berth tests were performed on actual LPM dome hardware at ambient pressure conditions. The combustor barrel was replaced by a quartz tube which provided optical access into the combustion zone. The dome and quartz tube assembly was fixed, while an optical table
was mounted on a X-Y-Z traverse to map out the flow field inside the combustor. Spatially-resolved measurements of gas velocities were obtained using two -component laser anemometry (LA) mounted on the optical table (Figure 7). In addition, a water-cooled gas sampling probe was used to extract samples from within the combustor and at the exit plane of the combustor. The gas samples were analyzed with conventional source emission monitoring instruments de-signed to detect hydrocarbons, 02, CO, nitric oxide (NO), nitrogen dioxide (NO2), and carbon dioxide (CO2). Tem-perature was measured within the combustor and at the exit plane using a thermocouple probe. Spatially-resolved map-ping was conducted by positioning the traverse at select locations throughout the combustor.
The air flow to the dome was selected to simulate a range of pressure drops (2 to 4%) covering the pressure drop expected in the actual combustion system. The dome equiva-lence ratio was varied.
A number of bench tests were conducted to characterize fuel/air mixing in LPM domes. A tracer gas was injected through the fuel holes, and samples of fuel/air mixtures were
5
Downloaded From: https://proceedings.asmedigitalcollection.asme.org/ on 06/21/2018 Terms of Use: http://www.asme.org/about-asme/terms-of-use

2200
0.00 0.05 0.10 0.15 0.20 0.25 0.30 0.35 0.40
0.00 0.05 0.10 0.15 0.20 0.25 0.30 0.35 0.40
HALF OF BASELINE DOME AND WALL COOLING
1400 206 1600) 2000 1600 1
800 2200
0 2400 2200
2200- 2000 -
2000-
c) NO DOME OR WALL COOLING AIR 2400
2200 657
1400 --- 1800 ) )
800 1000,-1600,")
2400 --
1800
1400 1400-7_, ,
0.35 0.40 . 2400
0.30 0.05 0.00 0.15 0.20 0.10 0.25
a) BASELINE DOME AND WALL COOLING
800 800 1200
1600 1000:1-1200
257 2
-
000 -
1800 1800
FIGURE 5. PREDICTED EFFECT OF WALL COOLING ON COMBUSTOR TEMPERATURE DISTRIBUTION.
1600
extracted using a 1/8-inch sampling probe. The samples were analyzed with a hydrocarbon analyzer. The tracer gas con-sisted of a known mixture of air and natural gas. Measure-ments were taken inside the dome as well as at the exit of the dome to study the progression of fuel/air mixing.
Figure 8 shows the fuel/air mixing characteristics of dry low NOx Configuration I. The measured local concentra-tions (C) of the tracer gas, normalized by the average concen-tration (Cavg), are plotted against circumferential position at a fixed radial location. The expected average concentration of the tracer gas is obtained from the measured LPM dome air flow rate and the flow rate of the tracer gas. For perfectly mixed tracer gas, C/Cavg is expected to be equal to 1. The tracer measurements were carried out within the dome at several axial locations downstream from the swirler vanes. For all circumferential positions, at x = 0 mm (swirler exit), measured concentrations in Figure 8 show maximum devia-tion from the perfectly mixed line. The peaks and valleys in the concentration profile correspond to the locations of the
sample point with respect to the fuel injection tubes for this configuration. Note that the magnitude of the peaks and valleys varies along the circumferential position. This is partly due to difficulty in maintaining the same relative radial position of the sampling probe while traversing in the circum-ferential direction. The results of Figure 8 indicate that substantial unmixedness of fuel and air remains at the exit of the individual swirler passages. However, a small distance downstream from the swirler at x = 5 mm, significant reduc-tion of the concentration peaks occurs. At the exit of the LPM dome (x = 64 mm), the concentration profile has significantly leveled off. The exit concentrations were measured at 3 and 4% dome air pressure drops. No significant impact of the pressure drop on the dome exit fuel/air mixing is noted.
Figure 9 compares the overall fuel/air mixing perfor-mance of the dry low NOx Configurations 1 and 2. The normalized measured concentrations are plotted against ra-dial location at the exit of the LPM domes, at several circum-ferential positions. The measurements were performed at
6 Downloaded From: https://proceedings.asmedigitalcollection.asme.org/ on 06/21/2018 Terms of Use: http://www.asme.org/about-asme/terms-of-use
0.60 0.80 1 00 0.90 020 --.0,40 0.30 ) ))
0.50 0.70 0.10
0.00 1.00
0.40
0.90
0.15 0.20 0.00 0.35 0.30 0.25 0.10 0.05
a) BASELINE DOME AND WALL COOLING
0.25 0.30 0.35 0.40
b HALF OF BASELINE DOME AND WALL COOLING
c) NO DOME OR WALL COOLING AIR
0.00 0.05 0.10 0.15 0.20 0.25 0.30 0.35 0.40
FIGURE 6. PREDICTED EFFECT OF WALL COOLING ON COMBUSTION EFFICIENCY.
dome fuel/air ratios of 0.032 and 0.038, and dome air pressure drops of 3 and 4%. No significant effect of the dome fuel/air ratio or dome air pressure drop is apparent from the results. However, due to improved design, the fuel/air mixing is more efficient for Configuration 2. The analysis of the data indicates that the standard deviation divided by the mean concentration for Configuration 1 is about 12% and that for Configuration 2 is 5.3%.
Measurements of axial and tangential velocity compo-nents were performed inside the combustor under ambient bench test conditions using a two-component laser anemom-etry (LA). The measurements are compared with predictions from a 2-D model in Figure 10. The comparison is shown at several axial locations, x/h (h is the dome exit annulus height, h =28 mm). The model predictions compare very well with the measurements. Both the measurements and the model predictions indicate a center recirculation established just downstream from the dome exit. As indicated earlier, an LPM dome design not only must be efficient in mixing fuel and air but also establish a sufficiently strong recirculation zone
down stream in the combustor to stabilize lean combustion.
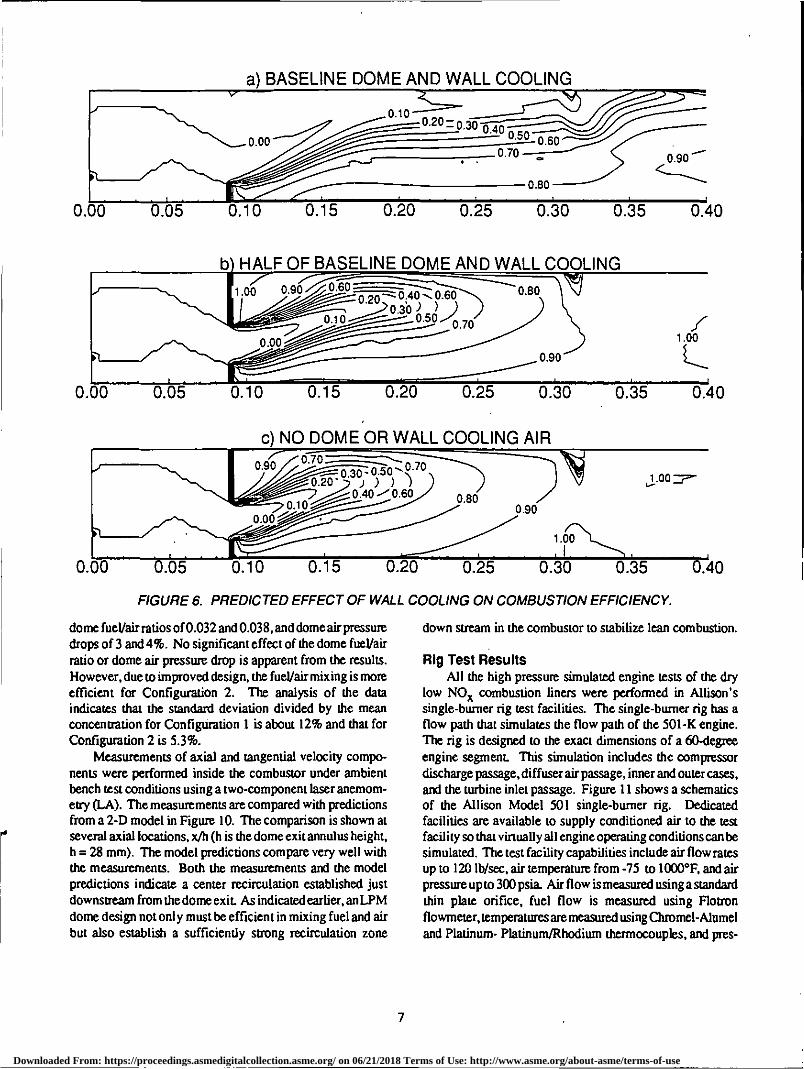
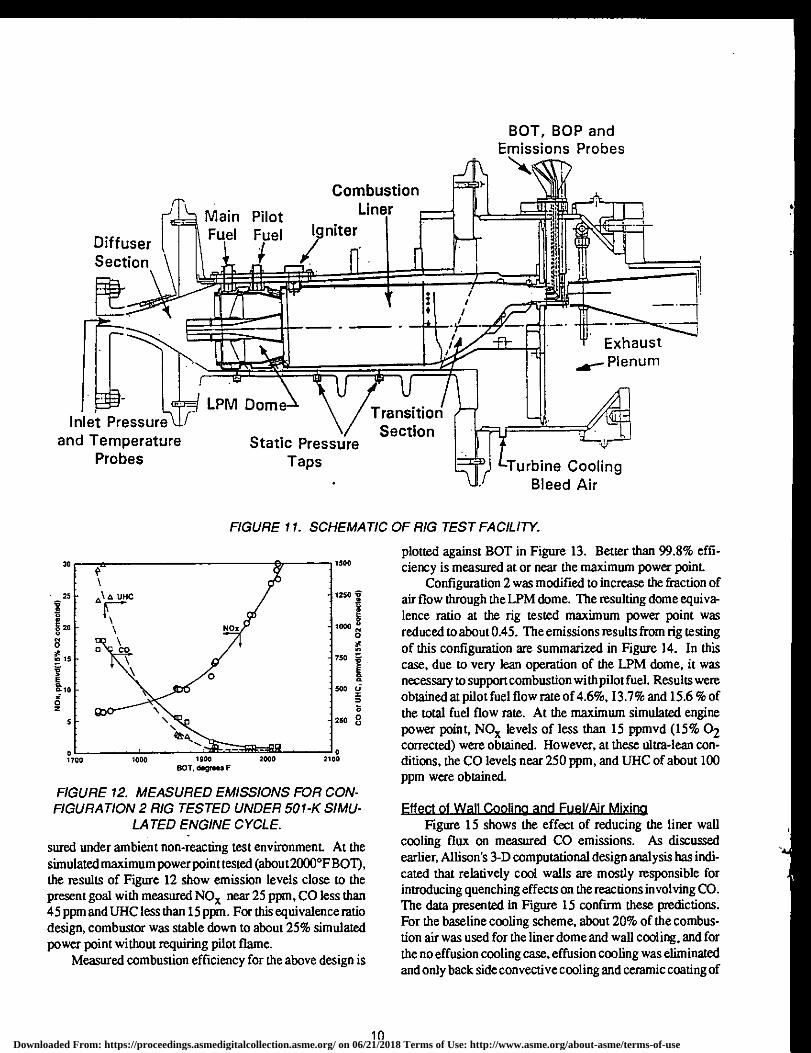
Rig Test Results All the high pressure simulated engine tests of the dry
low NOx combustion liners were performed in Allison's single-burner rig test facilities. The single-burner rig has a flow path that simulates the flow path of the 501-K engine. The rig is designed to the exact dimensions of a 60-degree engine segment. This simulation includes the compressor discharge passage, diffuser air passage, inner and outer cases, and the turbine inlet passage. Figure 11 shows a schematics of the Allison Model 501 single-burner rig. Dedicated facilities are available to supply conditioned air to the test facility so that virtually all engine operating conditions can be simulated. The test facility capabilities include air flow rates up to 120 lb/sec, air temperature from -75 to 1000°F, and air pressure up to 300 psia. Air flow is measured using a standard Min plate orifice, fuel flow is measured using Flotron flowmeter, temperatures are measured using Chromel-Alumel and Platinum- Platinum/Rhodium thermocouples, and pres-
7
Downloaded From: https://proceedings.asmedigitalcollection.asme.org/ on 06/21/2018 Terms of Use: http://www.asme.org/about-asme/terms-of-use
low Emissions liner Dome
Support Rods
ptical Height
Quartz Combustor
Optical Bread Boards 1 Air
Fuel Inlets •C
U
X-Y-Z Traverse
_0_ X = 0 mm. dpIP = 3 % - _ 0_ _ X = 5 mm. dP/I7 = 3 % - _. X = 64 mM, dISP = 3%
iv. X = 54 mm, dp/p = 4%
0.0
0 50 100 150 200 250 Circumferential Position, degrees
o dp/p=4%, F/A=0.032 dp/p=3%, F/A=0.032
0 dp/p=4%, F/A=0.038
LPM Configuration 1
0
0 "
FIGURE 7. SCHEMATIC OF BENCH TEST FACILITY.
FIGURE 8. MEASURED FUEL/AIR MIXING CHARACTERISTICS IN CONFIGURATION 1
LPM DOME. sure is measured using pressure transducers.
Combustion gas samples were extracted at the exit of the combustor transition section (Figure 11). The sample probes are designed to obtain a representative exhaust gas sample for accurate measurement. Five probes with four sampling ports per probe were used. The 20 gas samples from across the cross-section of the combustor exit are mixed in a manifold mounted just above the rig. A single sample line carries the sample from the manifold to the emissions analyzers. Electric
10 15 20 25
30
35 Radius, mm
1.25
01
(.1 1.00
0.75
0.50 10 15 20 25
30
35 Radius, mm
FIGURE 9. MEASURED FUEL/AIR MIXING PERFORMANCE OF DRY LOW NOx
CONFIGURATIONS 1 AND 2.
heaters are used to regulate the sample line temperature from the manifold to the instruments. The emissions measure-ments are made through the use of equipment and test meth-ods called out in the SAE Aerospace Recommended Practice, ARP 1256A. Total UHC are measured using flame ionization detector, CO and CO2 are measured using a non-dispersive infrared (NDIR) analyzers, NO x is measured using chemilu-minescence analyzer, and 02 is measured using Polarogra-phy.
Data is recorded automatically and manually. Some of the data is processed on-line to give the test operators imme-diate feedback to confirm that the test conditions are met and all instrumentation is functioning correctly. For example, during the present rig testing of the dry low NO x liners, thermocouples were placed at strategic locations within the LPM dome and on the face of the centerbody. The tempera-
1.25
01
4°1 00
0.75
050
8 Downloaded From: https://proceedings.asmedigitalcollection.asme.org/ on 06/21/2018 Terms of Use: http://www.asme.org/about-asme/terms-of-use

•
14 40 2
r 20
Ui 0
AAAAA • al -20 4.
40 •
• 45.•
4o 6 RADIUS (MM)
10
-20 -
5
40 -25 a 21
0
XJH 115 A MEASURED
- PREDICTED 60 - Ie 2
40 a
80
1 40
° 20 0
0
-20
80
ao
••••• 40
g 20
0 -a
.6 -20
-a 0 25 50
RADIUS (MM)
• • • • A
z° 40
UI 40
2
a- 20
-20
UI 0 z -40
La 40 44 2 4- 20
0 0
-a 'a -20
UI o 40
X41 = 3
• AL
•
•
40 -a
2 •
• •
• AAAAA
FIGURE 10. COMPARISON BETWEEN MEASURED AND PREDICTED VELOCITY PROFILES.
lure readings from these thermocouples were always dis-played and monitored during the tests so that any flame flashback into the LPM dome could be detected and correc-tive action taken.
Figure 12 shows the emissions results obtained for Con-figuration 2 which was rig tested under simulated 501-KC5 engine cycle conditions for burner inlet temperature (BIT= 655°F), and pressure (B1P = 150 psia). The measured NO R. CO, and UHC are presented in pans per million dry on volume basis (ppmvd) and are corrected to 15%02 [measured value
2
* (20.915)/(20.9-02 , measured)). The results are plotted against the burner outlet temperature (SOT) which was varied by varying the fuel flow rate. The BOT was calculated from the measured fuel and air flow rates. These results were obtained with LPM dome equivalence ratio estimated at the design point to be about 05. Note that the dome equivalence ratio is estimated from the measured fuel flow rate and the estimated dome air flow fraction. The dome air flow fraction is estimated from the measured effective flow areas of the combustion liner. The liner effective flow areas were mea-
9
Downloaded From: https://proceedings.asmedigitalcollection.asme.org/ on 06/21/2018 Terms of Use: http://www.asme.org/about-asme/terms-of-use
Diffuser Section
Main Pilot Fuel Fuel
Combustion Liner
Igniter
Exhaust Ar— Plenum
Inlet Pressure and Temperature
Probes
LPM Dome
Static Pressure Taps Turbine Cooling
Bleed Air
Transition Section
BOT, BOP and Emissions Probes
FIGURE 11.
1800
SCHEMATIC OF RIG TEST FACILITY.
1500
plotted against SOT in Figure 13. Better than 99.8% effi- ciency is measured at or near the maximum power point.
Configuration 2 was modified to increase the fraction of air flow through the LPM dome. The resulting dome equiva-lence ratio at the rig tested maximum power point was reduced to about 0.45. The emissions results from rig testing of this configuration are summarized in Figure 14. In this case, due to very lean operation of the LPM dome, it was necessary to support combustion with pilot fuel. Results were obtained at pilot fuel flow rate of 4.6%, 13.7% and 15.6% of the total fuel flow rate. At the maximum simulated engine power point, NOx levels of less than 15 ppmvd (15% 02 corrected) were obtained. However, at these ultra-lean con-ditions, the CO levels near 250 ppm, and UHC of about 100 ppm were obtained.
FIGURE 12. MEASURED EMISSIONS FOR CON- FIGURATION 2 RIG TESTED UNDER 501-K SIMU-
LATED ENGINE CYCLE.
sured under ambient non-reacting test environment. At the simulated maximum power point tested (about 2000°F BOT), the results of Figure 12 show emission levels close to the present goal with measured NO near 25 ppm, CO less than 45 ppm and UHC less than 15 ppm. For this equivalence ratio design, combustor was stable down to about 25% simulated power point without requiring pilot flame.
Measured combustion efficiency for the above design is
ElesitaWaLcacantanditeSALUmagi Figure 15 shows the effect of reducing the liner wall
cooling flux on measured CO emissions. As discussed earlier, Allison's 3-D computational design analysis has indi-cated that relatively cool walls are mostly responsible for introducing quenching effects on the reactions involving CO. The data presented in Figure 15 confirm these predictions. For the baseline cooling scheme, about 20% of the combus-tion air was used for the liner dome and wall cooling, and for the no effusion cooling case, effusion cooling was eliminated and only back side convective cooling and ceramic coating of
10 Downloaded From: https://proceedings.asmedigitalcollection.asme.org/ on 06/21/2018 Terms of Use: http://www.asme.org/about-asme/terms-of-use

1500 1900 SOT, dogma F
2100
• EFFUSION WALL COOLING NO EFFUSION WALL COOLING
1400
1200
1 1000
800
8
• SOO
I 400
200
1700 1600
0 O 15.6% Sotto&
4 13.7% pik4 fuel
• 4.6% pilot fuel 0
2CCO 2050 151:0
1950
1000 1050
DOT, dogroo8 F
40
so
40
• CONF2: 5.3% F/A $TD DEV • CONF1: 12% F/A $TD DEV
2300 2100 2200
60
an • 30
I 20
0
10
1700 1800 1900 2000 DOT, dogmas F
0 1600
vs 8 S 25
20
15
10
0
FIGURE 13. COMBUSTION EFFICIENCY OF DRY LOW NO CONFIGURATION 2.
FIGURE 15. EFFECT OF WALL COOLING ON CO EMISSIONS.
FIGURE 14. EMISSIONS RESULTS OF PILOT SUPPORTED ULTRA-LEAN COMBUSTION IN
CONFIGURATION 2.
the inside wall was used. The dilution orifices of the I iner were re-sized to accommodate additional air for the no effusion cooling case. For the same aerodynamic combustor design when wall cooling flux is reduced, about 50% reduction in CO results throughout the range of power points tested. Similar reductions were observed in UHC emissions.
Effect of fuel/air mixing on NOx emissions is shown in Figure 16. Configuration! has a pre-mixed fuel/air ratio with a standard deviation of 12% at the exit of the LPM dome while Configuration 2 has a pm-mixed fuel/air ratio with a standard deviation of 5.3%. The effect on NOx emissions is signifi-cant. At the maximum power point (about 2000 °F BOT),
FIGURE 16. EFFECT OF FUEL/AIR MIXING EFFI- CIENCY ON NO EMISSIONS.
NOx emissions for Configuration 2 are reduced by more than 60%.
Figure 17 shows effects of fuel/air mixing, wall cooling flux and increased swirl on the NO x versus CO tradeoff. The rig results clearly indicate significant reduction in not only NOx but also CO due to both better fuel/air mixing and operation with "hot" liner dome and wall.
CE121211g4alleLMaLEPAILMa= In addition to the low emissions performance, there are
other combustor performance parameters of interest for a successful and durable gas turbine combustion system. These
11
Downloaded From: https://proceedings.asmedigitalcollection.asme.org/ on 06/21/2018 Terms of Use: http://www.asme.org/about-asme/terms-of-use
50
• enEurir • RAPROnv mixina • ilamovED mama /Nor wsus • onnoven YOUNG ,1107- MALLS
OM INCREASED MAL
50
E 40
30
3
o. 20
10
PROGRAM GOALS
1.03 1.07 I." 1. 1
1.03
Production Liner
0.99 97
200
75
1 - - a - - Production Liner —4110- - Dry Low Emissions Liner
0 0 925 0.950 0.975 1.000 1.025
Average Radial Temperature/SOT (EfF)
25
500 1000 7500 CO, ppmvd (15% 02 corrected)
FIGURE 17. EFFECT OF FUEL/AIR MIXING EFFI- CIENCY AND WALL COOLING ON NO VS. CO
TRADEOFF.
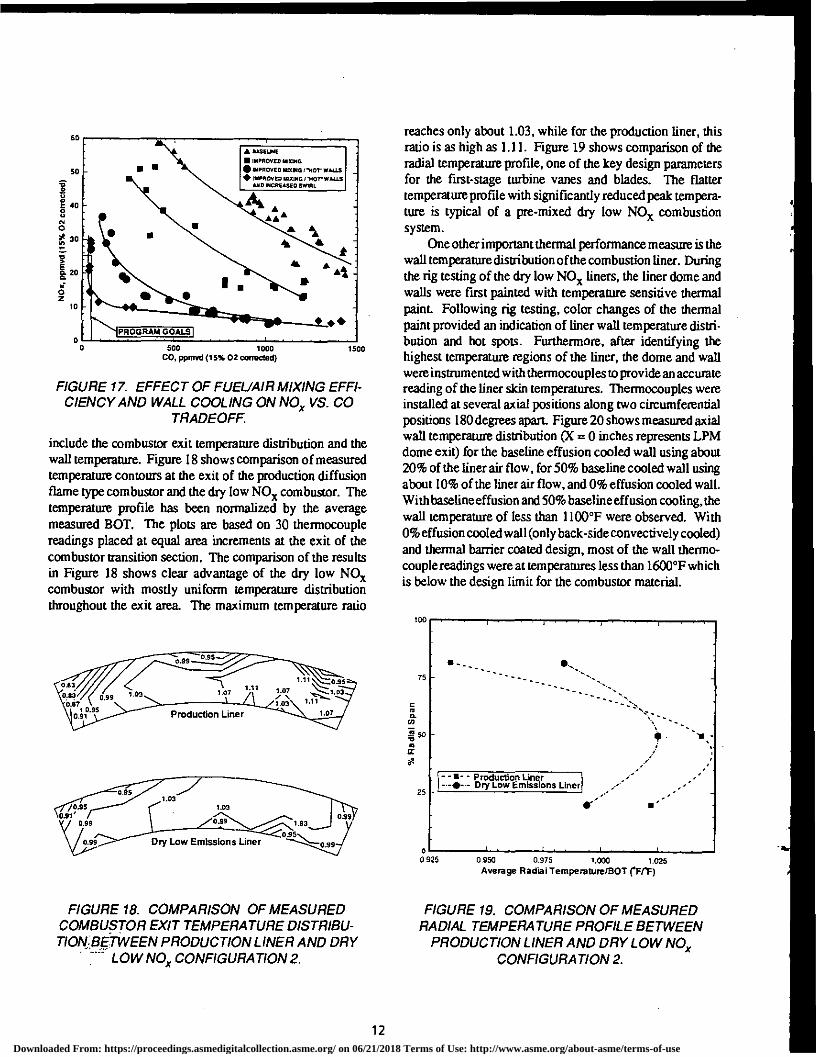
include the combustor exit temperature distribution and the wall temperature. Figure 18 shows comparison of measured temperature contours at the exit of the production diffusion flame type combustor and the dry low NO combustor. The temperature profile has been normalized by the average measured SOT. The plots are based on 30 thermocouple readings placed at equal area increments at the exit of the combustor transition section. The comparison of the results in Figure 18 shows clear advantage of the dry low NO x combustor with mostly uniform temperature distribution throughout the exit area. The maximum temperature ratio
FIGURE 18. COMPARISON OF MEASURED COMBUSTOR EXIT TEMPERATURE DISTRIBU- TIONBETWEEN PRODUCTION LINER AND DRY
LOW NOx CONFIGURATION 2.
reaches only about 1.03, while for the production liner, this ratio is as high as 1.11. Figure 19 shows comparison of the radial temperature profile, one of the key design parameters for the first-stage turbine vanes and blades. The flatter temperature profile with significantly reduced peak tempera-ture is typical of a pre-mixed dry low NO x combustion system.
One other important thermal performance measure is the wall temperature distribution of the combustion liner. During the rig testing of the dry low NO liners, the liner dome and walls were first painted with temperature sensitive thermal paint. Following rig testing, color changes of the thermal paint provided an indication of liner wall temperature distri-bution and hot spots. Furthermore, after identifying the highest temperature regions of the liner, the dome and wall were instrumented with thermocouples to provide an accurate reading of the liner skin temperatures. Thermocouples were installed at several axial positions along two circumferential positions 180 degrees apart. Figure 20 shows measured axial wall temperature distribution (X =0 inches represents LPM dome exit) for the baseline effusion cooled wall using about 20% of the liner air flow, for 50% baseline cooled wall using about 10% of the liner air flow, and 0% effusion cooled wall. With baseline effusion and 50% baseline effusion cooling, the wall temperature of less than 1100°F were observed. With 0% effusion cooled wall (only back-side convectively cooled) and thermal bather coated design, most of the wall thermo-couple readings were at temperatures less than 1600°F which is below the design limit for the combustor material.
FIGURE 19. COMPARISON OF MEASURED RADIAL TEMPERATURE PROFILE BETWEEN
PRODUCTION LINER AND DRY LOW NO CONFIGURATION 2.
12 Downloaded From: https://proceedings.asmedigitalcollection.asme.org/ on 06/21/2018 Terms of Use: http://www.asme.org/about-asme/terms-of-use

war
1600
1400
1200
1000
800
• A
A I • •
A /AC S.
•
• r r •
• *
. # •
• EFFUSION WALL COOLING • HALF EFFUSION WALL COOLING • NO EFFUSION WALL COOLING
1 0 AXIAL LOCATION (a)
FIGURE 20. MEASURED WALL TEMPERATURE FOR DIFFERENT LINER WALL COOLING FLOW
RATES.
Conclusions The high pressure rig tests of the dry lean pre-mixed low
NOx combustion liners have demonstrated emissions levels which meet the present goals. At the simulated maximum power point of a 501-K series engine, NO x levels of 25 ppm, CO less than 45 ppm and LTHC less than 15 ppm were measured. Better than 99.8% combustion efficiency was measured. For this design, combustor was stable down to about 25% of maximum power without requiring pilot flame.
The rig tests for an ultra-lean liner design demonstrated NOx levels lower than 15 ppmvd (15% 02 corrected), well below the goal, at the design point. The corresponding CO and UHC levels were, respectively, 250 ppm vd, and 100 ppmvd. Design improvements are underway to further im-prove the emissions of CO and UHC for this design.
Rig tests have shown uniform temperature distribution throughout the exit of the dry low NO x combustor. The exit radial temperature profile is much flatter with significantly reduced peak temperature than the production liner. Mea-sured liner wall temperatures ranged from 1100 to 1600°F for baseline effusion or 50% baseline effusion cooling design as well as with 0% effusion-cooled and TBC-coated design. These temperatures are below the design limit for the liner material.
The present design and development work is guided by advanced computational combustion dynamics models and ambient bench testing. The bench tests were used to charac-terize fuel/air mixing of the LPM domes. The mixing effi-ciency was not very sensitive to the dome fuel/air ratio or the dome pressure drop.
The 3-D computational design analyses have indicated that relatively cool walls and the amount of wall cooling air
are mostly responsible for introducing quenching effects on the reactions involving CO. The rig test results have con-firmed these predictions. For the same aerodynamic combus-tor design when wall cooling flux is reduced from 20% to no effusion cooling with only back side convective cooling, about 50% reduction results in CO emissions throughout the range of power points tested.
The fuel/air mixing efficiency has significant impact on NOx emissions. By improving the mixing from a fuel concentration with a standard deviation of 12% to 5.3%, a 60% reduction in NOx emissions at the maximum power point have been demonstrated. Improved fueVair mixing and "hot" liner wall design significantly improve NO x versus CO tradeoff.
Further refinements in the liner design are continuing in the present development effort to improve margin on emis-sions. Engine tests of the dry low NO x liners are scheduled for 1994.
Acknowledgement Allison would like to thank Gas Research Institute (OR!)
for its support of the present development effort_ The contri-butions of Mr. Larry Belna in directing the rig testing effort are appreciated. The authors would also like to acknowledge Energy Research Consultants (ERC) for conducting the bench testing phase of the present program.
References 1. Soh, J. C. and Tuzson, J., "Status of Low NO x Combus-
tor Development", ASME Paper 93-GT-270. 2. Nealy, D. A., Reider,S. B. and Mongia, H. C.,"Altemate
Cooling Configurations for Gas Turbine Combustion Systems," AGARD Conference Proceedings No. 390, 1985, pp 25-1 to 25-15.
3. Paslcin M., Ross, P., Mongia H. and Acosta, W., "Com-posite Matrix Cooling Scheme for Small Gas Turbine Combustors," AIAA/SAE/ASME/ASEE 26th Joint Pro-pulsion Conference, July 16-18, 1990, Orlando, FL., AMA Paper No. 90-2158.
4. -Ross P. T., Williams, J. R. and Anderson, D. N., "Com-bustor Development for AutomotiveGas Turbine,"Jour-nal of Energy, Vol. 7, No. 5, Sept.-Oct. 1983, pp 429- 435.
5. Novick, A. S. and Troth, D. L., "Low NOx Heay Fuel Combustor Concept Program," Detroit Diesel Allison Division, General Motors Corporation, October 1981, NASA CR-165367.
6. Novick, A. S. and Troth, D. L., "Low NO x Heay Fuel Combustor Concept Program Addendum: Low/Mid Heating Value Gaseous Fuel Evaluation," Detroit Diesel Allison Division, General Motors Corporation, April 1982, NASA CR-165615.
13
Downloaded From: https://proceedings.asmedigitalcollection.asme.org/ on 06/21/2018 Terms of Use: http://www.asme.org/about-asme/terms-of-use