retail banking and wealth management investor update · 2018-11-07 · retail banking and wealth...
TRANSCRIPT

Retail Banking and Wealth Management Investor Update

2
Forward-looking statements
This presentation and subsequent discussion may contain certain forward-looking statements with respect to the financial condition, results of operations and business of the Group. These forward-looking statements represent the Group’s expectations or beliefs concerning future events and involve known and unknown risks and uncertainty that could cause actual results, performance or events to differ materially from those expressed or implied in such statements. Additional detailed information concerning important factors that could cause actual results to differ materially is available in our Annual Report and Accounts. Past performance cannot be relied on as a guide to future performance. This presentation contains non-GAAP financial information. Reconciliation of non-GAAP financial information to the most directly comparable measures under GAAP are provided in the ‘Reconciliations of Non-GAAP financial measures’ constant currency and underlying reconciliations’ supplement available at www.hsbc.com.

3
HSBC’s four integrated Global Businesses RBWM is a significant component of the Group
Directional 2016 PBT contribution
RBWM
CMB
GBM
GPB
% of Group total
2016 target RoRWA2
%
30-40
25-35
25-35
3-5
2.2-2.5
5.0-5.53
2.0-2.2
Distribution of net operating income1, 2012, %
22%
RBWM
46%
4% 3% GPB
GBM
Other
CMB
25%
Notes: 1 On a reported basis and represents net operating income before loan impairment charges and other credit risk provisions. Intra-HSBC operating income has not been eliminated in the preparation of
these charts. Intra-HSBC operating income includes revenue between geographic regions and revenues between Global Businesses 2 Based on CRD IV end point 3 Excluding run-off. Including run-off, RoRWA target is 3.8%-4.3%
4
Agenda
RBWM 1Q 2013 Results
Strategic Execution
Summary
Growth priorities
I
II
III
IV
5
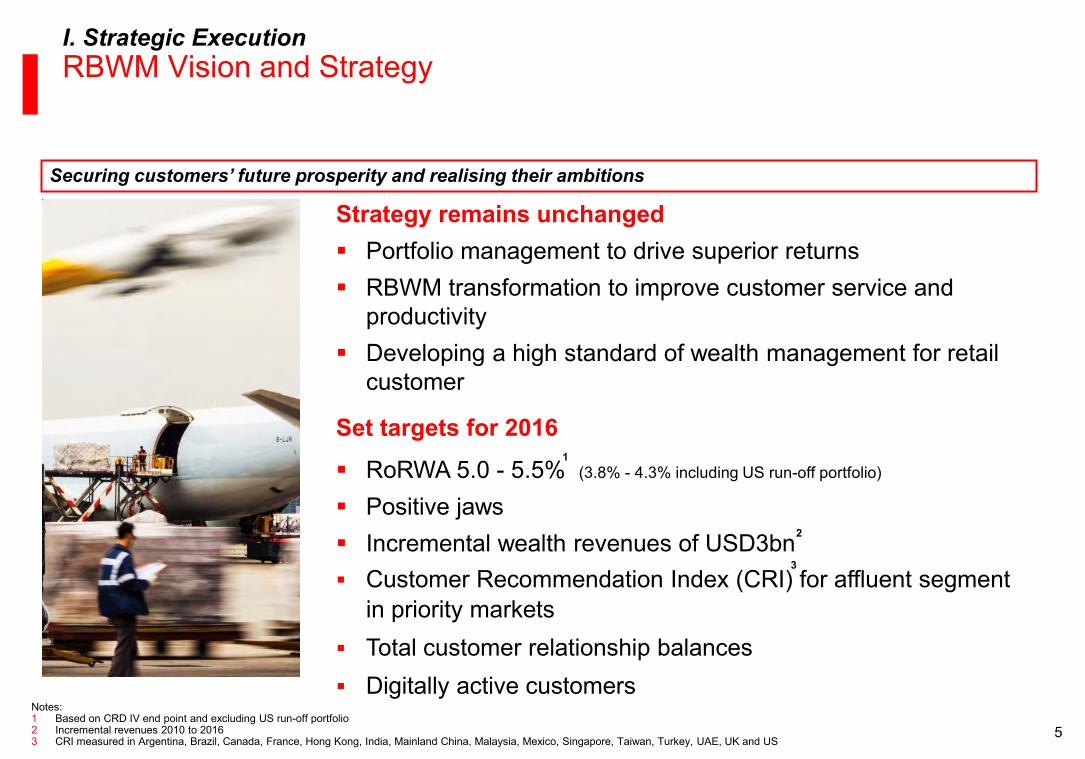
I. Strategic Execution RBWM Vision and Strategy
Securing customers’ future prosperity and realising their ambitions
Strategy remains unchanged Portfolio management to drive superior returns RBWM transformation to improve customer service and
productivity Developing a high standard of wealth management for retail
customer
Set targets for 2016
RoRWA 5.0 - 5.5% (3.8% - 4.3% including US run-off portfolio)
Positive jaws Incremental wealth revenues of USD3bn Customer Recommendation Index (CRI) for affluent segment
in priority markets Total customer relationship balances Digitally active customers
Notes: 1 Based on CRD IV end point and excluding US run-off portfolio 2 Incremental revenues 2010 to 2016 3 CRI measured in Argentina, Brazil, Canada, France, Hong Kong, India, Mainland China, Malaysia, Mexico, Singapore, Taiwan, Turkey, UAE, UK and US
1
2
3

6
I. Strategic Execution Portfolio Management Cohesive portfolio of markets
Small markets
Network Leverage host market management efficiencies Maintain connectivity in key wealth corridors
Adopt standard products and services and drive efficiency
Build scale and/or
capture wealth opportunity
Differentiate to target segments
Funding Maintain simplified RBWM business to support funding / liquidity dependency
‘Home markets’
Priority Growth markets
Hong Kong and Rest of Asia Pacific
North America
Latin America
Hong Kong1
Middle East and North Africa Europe
United Kingdom2
Egypt Saudi Arabia UAE
France Germany3 Switzerland3 Turkey
Canada USA
Australia Mainland China India Indonesia Malaysia Singapore Taiwan Vietnam
Argentina Brazil Mexico
RBWM Strategy
Note: 1 Includes Hang Seng Bank 2 Includes first direct, M&S Money 3 Group priority growth markets but not for RBWM
7
Line of Business exits announced Market exits announced Announced Acquisitions •
•
•
• •
• •
•
• •
• • •
• •
• •
•
• •
• •
• •
•
•
•
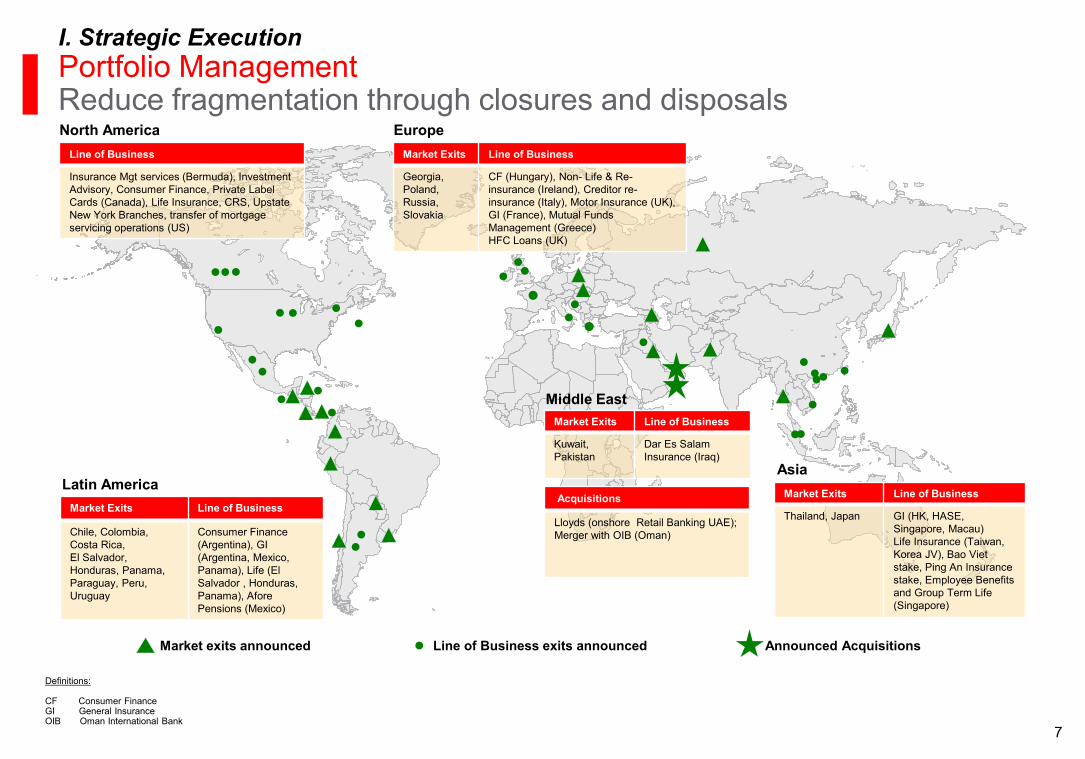
Market Exits Line of Business
Thailand, Japan GI (HK, HASE, Singapore, Macau) Life Insurance (Taiwan, Korea JV), Bao Viet stake, Ping An Insurance stake, Employee Benefits and Group Term Life (Singapore)
Market Exits Line of Business
Kuwait, Pakistan
Dar Es Salam Insurance (Iraq)
Middle East
Market Exits Line of Business
Georgia, Poland, Russia, Slovakia
CF (Hungary), Non- Life & Re-insurance (Ireland), Creditor re-insurance (Italy), Motor Insurance (UK), GI (France), Mutual Funds Management (Greece) HFC Loans (UK)
Europe
Market Exits Line of Business
Chile, Colombia, Costa Rica, El Salvador, Honduras, Panama, Paraguay, Peru, Uruguay
Consumer Finance (Argentina), GI (Argentina, Mexico, Panama), Life (El Salvador , Honduras, Panama), Afore Pensions (Mexico)
Latin America
Line of Business
Insurance Mgt services (Bermuda), Investment Advisory, Consumer Finance, Private Label Cards (Canada), Life Insurance, CRS, Upstate New York Branches, transfer of mortgage servicing operations (US)
North America
Acquisitions
Lloyds (onshore Retail Banking UAE); Merger with OIB (Oman)
Asia
• •
•
•
•
Definitions: CF Consumer Finance GI General Insurance OIB Oman International Bank
I. Strategic Execution Portfolio Management Reduce fragmentation through closures and disposals

8
PBT>USD100m pa1 PBT<USD100m pa1
Most RBWM businesses generating strong returns and building scale in target segments
Continue to invest in key emerging economies (Turkey, Vietnam and China)
Well established businesses in France, Canada, Brazil and the UK undergoing re-engineering programmes to improve efficiency and operating capabilities
US divestments completed to allow re-focusing
I. Strategic Execution Portfolio Management Home and Priority markets
Note: 1 On full year 2012 reported results 2 Reported PBT for the USA was USD254m. This includes gains on disposal of Upstate New York Branches of USD587m
Hong Kong
UK
Singapore
Mexico Malaysia
Argentina
Australia UAE
Brazil
USA2
Taiwan
Saudi Arabia
India
Egypt
Indonesia
France
Canada
Turkey Vietnam Mainland China Management’s area of focus
Steady progression
Invest for medium to long term
Fix and re-focus
Re-engineer

9
I. Strategic Execution RBWM Transformation Improving efficiency and customer experience
Identify inconsistent processes
Define customer journey and benchmark performance
Design/select standardised approach
Build and roll out across the network prioritised by opportunity
Approach Examples
Redesigning customer journeys, including account opening and complaints handling, to improve customer experience and efficiency whilst reducing risk
RBWM re-engineering
Documents, cash and cheques
Establish globally consistent operating models for Cash Processing, Document Management, Cheque Processing, Transaction Print and Logistics
Use Global Standards programme to drive global consistency, removing duplications and improving efficiency
Global Standards

10
Mobile
I. Strategic Execution RBWM Transformation Execution example: Distribution evolution
Customer behaviour increasingly shifting from branch-based to multiple channel service and distribution
we are driving this migration
reviewing our physical footprint to make fit-for-new-purpose over the long term
Network plan targeting:
decrease in total branch floor space per active customer
more efficient use of branch space
optimising critical mass in target segment locations and format for wealth management
fit for purpose formats to be employed focusing on local demographics
Self Service Branch
Customer Service Unit
Full Service Branch RM Centre
Contact Centre

11
I. Strategic Execution RBWM Transformation Execution example: Other specific initiatives
Supplied Services: Establish global supplied
services structure
UK Mortgage Re-engineering:
Delivering simultaneous improvements in:
– Customer experience – Revenues – Risk – Costs
Global Card Operations: minimum standards for
reducing cost and improving customer
experience
Operating benefits from single platform infrastructure
Achieved savings in 2012 through leveraging best practices
Align 2 Home and 18 Priority markets in 2013 and 2014 to achieve additional sustainable saves
Established 15 process improvement initiatives in 10 markets
Reduced number of suppliers
Competitively tendered out cash handling service, document storage and transaction printing
Launched new online illustration tools and application process
Delivered "mortgage switcher" functionality in the UK
Launched "live underwriting" enabling referred customers to get an immediate credit decision via phone or branch
5% of new business, nearly 10% of internal re-mortgage business now carried out on-line
Appropriate graphic

12
Products Range Review
Deliver a simple and consistent set of products
Making it easier for our customers to do business with us
Reducing complexity for our sales staff Facilitating opportunity for greater system
standardisation e.g. Cards Reduce product management maintenance
costs and indirectly reduce service delivery costs from common operating model
Reduce inherent risk from ‘off-sale’ products
Local flexibility maintained through simple operating variants and local customer offers
Rationalisation to be progressed through 2014
I. Strategic Execution RBWM Transformation Execution example: Driving simplicity and consistency
Organisational Blueprint Consistent design deployed globally
– Globally set standards and policies
– Local business management and implementation focus
– Customer value management as key driver Benefits
– Reduce management layers
– Increase spans of control
– Customer rather than product driven Implementation
– implemented in home markets and 17 out of 18 priority markets (excludes Saudi Arabia)
– All other markets now being implemented
13
200
225
250
275
80
100
120
1Q11
2Q11
3Q11
4Q11
1Q12
2Q12
3Q12
4Q12
FTE Rev / FTE
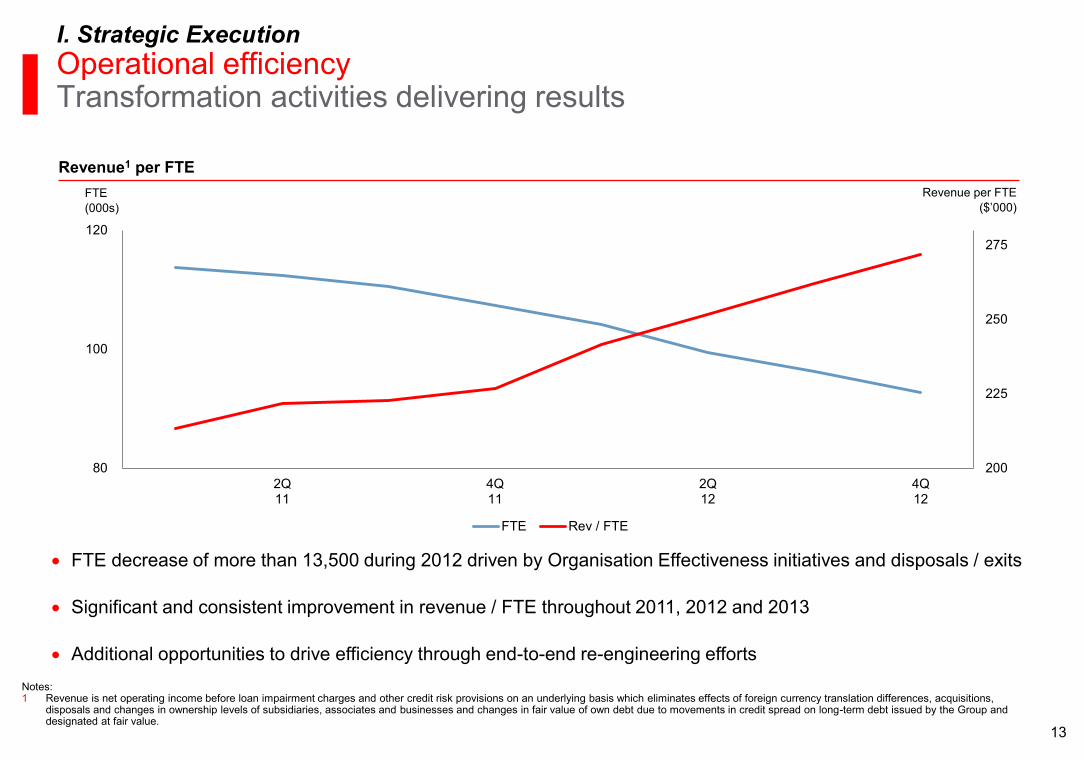
I. Strategic Execution Operational efficiency Transformation activities delivering results
Revenue1 per FTE Revenue per FTE
($’000) FTE (000s)
FTE decrease of more than 13,500 during 2012 driven by Organisation Effectiveness initiatives and disposals / exits
Significant and consistent improvement in revenue / FTE throughout 2011, 2012 and 2013
Additional opportunities to drive efficiency through end-to-end re-engineering efforts
Notes: 1 Revenue is net operating income before loan impairment charges and other credit risk provisions on an underlying basis which eliminates effects of foreign currency translation differences, acquisitions,
disposals and changes in ownership levels of subsidiaries, associates and businesses and changes in fair value of own debt due to movements in credit spread on long-term debt issued by the Group and designated at fair value.

14
II. Growth priorities RBWM growth priorities
Securing customers’ future prosperity and realising their ambitions
2016 targets Growth priorities to 2016 Growth in priority markets Grow number of customers in target segments
Deepen customer relationships Acquiring new wealth in faster growing markets and
consolidating wealth in developed markets Grow relationship-led lending
Distribution Accelerate digital Selectively improve geographic coverage
Financial
Non-financial
RoRWA1, %
Customer Recommendation Index (CRI) for affluent segment in priority markets3
Total customer relationship balances Digitally active customers
3.8-4.3
Incremental wealth revenues2 USD3bn
RoRWA1, excl. run-off, % 5.0-5.5
Note: 1 CRD IV end point basis 2 Incremental revenues 2010 to 2016 3 CRI measured in Argentina, Brazil, Canada, France, Hong Kong, India, Mainland China, Malaysia, Mexico, Singapore, Taiwan, Turkey, UAE, UK and US

15 DRAFT
Example investments
Mobile
Tablet
Mobile Banking App – iOS and Android versions
Mobile Payments – Progressive deployment of simple and secure contactless payments
Advanced capabilities – Mobile stock and FX Trading
Customer-Facing – Mobile features optimised for tablet devices
Staff-Facing – Tablet-based tools for front-line staff to support discussions with customers
II. Growth priorities RBWM growth priorities Execution example: Distribution evolution and digital solution

16
Wealth target Material progress
5.5 5.5 5.8 5.8 6.4 6.4 0.3
0.6
2010 2011 2012 2016e
II. Growth priorities Wealth management Building our Wealth business
Wealth revenues comprise: ‒ Investments ‒ Life insurance ‒ FX ‒ But exclude deposits
Modest progress of USD0.9bn incremental revenues since 2010
Change in context since 2011 ‒ Fundamental change in wealth distribution
model ‒ More challenging macro environment
“Future of Retirement” awarded Gold Award,
2012 (International
Business Awards)
Emerging Markets Manager of the Year
(UK Pension Awards 2013)
Asian Asset Management Best of the Best, 2008-
2010, 2012 (Regional Asian bond
house)
Significant platform upgrading in terms of customer self-service solutions and RM platform
Building out managed solutions Developing RMB offerings Making it easier for our customers to access
FX services

17
II. Growth priorities Premier “Flagship” proposition with strong contribution to revenues
Home and priority markets represent 64% of the total Global Financial Wealth Management Market1
Premier generates significantly higher revenue per customer than other RBWM segments
Growth opportunities in Premier through deepening customer relationships and increase market penetration
Note: 1 Source: Credit Suisse Wealth Databook 2011 2 Total market data source: Data-monitor Global Wealth Market Analytics. Includes customers with liquid assets >USD100,000. Vietnam, Saudi Arabia and Egypt excluded due to unavailability of comparable market data
Opportunity for Growth
Progress
Changed focus of customer acquisition and retention from quantity to quality
Improved proposition for our top Premier customers by enhancing service levels and financial solutions
HSBC market penetration by
customer numbers2
Deepen customer relationships Grow market penetration and
deepen customer relationships
0%
80%
18
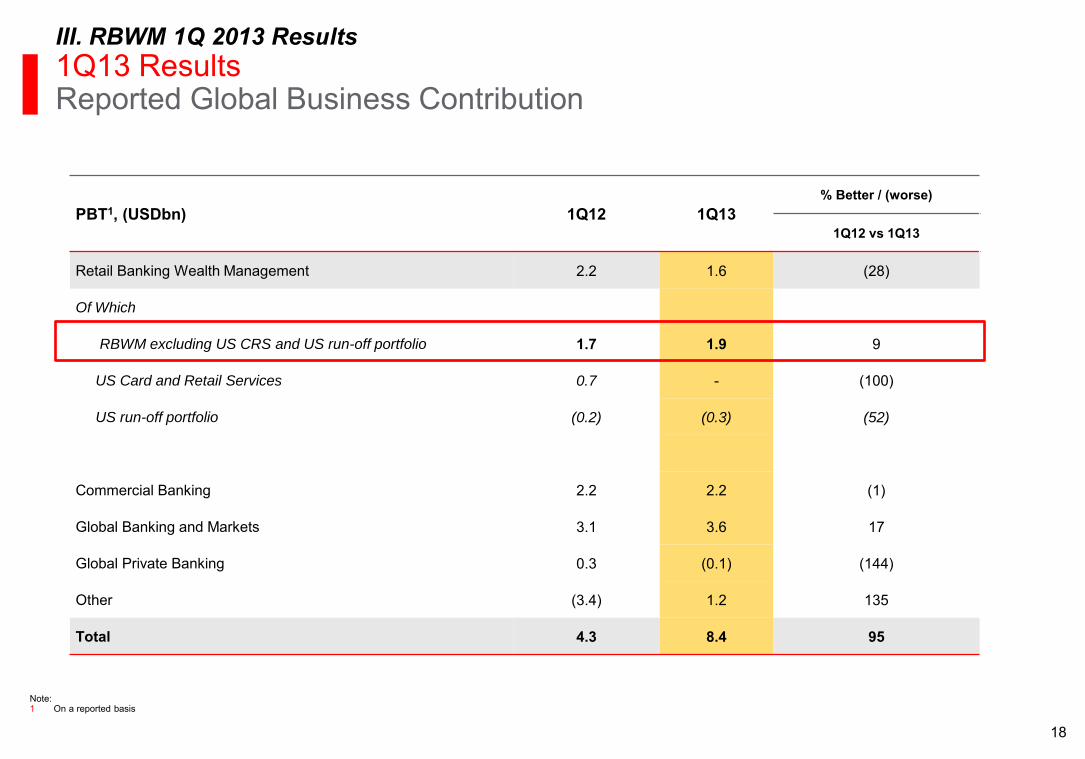
PBT1, (USDbn) 1Q12 1Q13 % Better / (worse)
1Q12 vs 1Q13
Retail Banking Wealth Management 2.2 1.6 (28)
Of Which
RBWM excluding US CRS and US run-off portfolio 1.7 1.9 9
US Card and Retail Services 0.7 - (100)
US run-off portfolio (0.2) (0.3) (52)
Commercial Banking 2.2 2.2 (1)
Global Banking and Markets 3.1 3.6 17
Global Private Banking 0.3 (0.1) (144)
Other (3.4) 1.2 135
Total 4.3 8.4 95
Note: 1 On a reported basis
III. RBWM 1Q 2013 Results 1Q13 Results Reported Global Business Contribution
19
(USDbn)
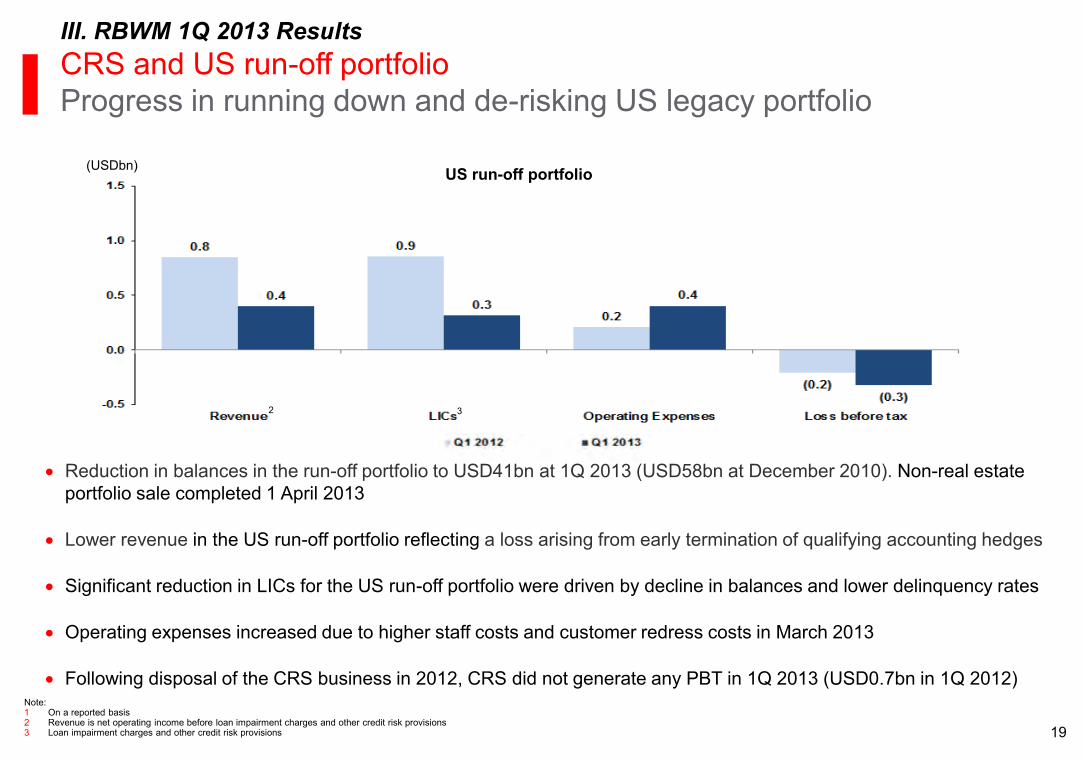
III. RBWM 1Q 2013 Results CRS and US run-off portfolio
Progress in running down and de-risking US legacy portfolio
Reduction in balances in the run-off portfolio to USD41bn at 1Q 2013 (USD58bn at December 2010). Non-real estate portfolio sale completed 1 April 2013
Lower revenue in the US run-off portfolio reflecting a loss arising from early termination of qualifying accounting hedges
Significant reduction in LICs for the US run-off portfolio were driven by decline in balances and lower delinquency rates
Operating expenses increased due to higher staff costs and customer redress costs in March 2013
Following disposal of the CRS business in 2012, CRS did not generate any PBT in 1Q 2013 (USD0.7bn in 1Q 2012)
Note: 1 On a reported basis 2 Revenue is net operating income before loan impairment charges and other credit risk provisions 3 Loan impairment charges and other credit risk provisions
2 3
US run-off portfolio

20
0.0
0.5
1.0
1.5
2.0
Q1 2012 Q1 2013
III. RBWM 1Q 2013 Results RBWM excluding US CRS and US run-off portfolio
Management actions delivering results
Increase in Europe and North America driven by lower customer redress (USD0.1bn in Q1 2013 compared to USD0.5bn Q1 2012)
Improvement in faster growing regions driven by revenue growth
Well diversified revenue base
Faster growing markets represent 62% of RBWM2,3 revenues
Note: 1 On an underlying basis which eliminates effects of foreign currency translation differences, acquisitions, disposals and changes in ownership levels of subsidiaries, associates and businesses and changes in the fair value of own debt due to
movements in credit spread on long-term debt issued by the Group and designated at fair value. 2 Excluding US CRS in Q1 2012 and the US run-off portfolio 3 On a reported basis
1
2 Asia, Latam, MENA Europe + North America Total RBWM
(USDbn) Profit before tax
2
Europe
Hong Kong
ROAP
MENA
North America
Latam
Q1 2013 Revenue3 split by region
2
(on an underlying basis)

21
I. Strategic Execution RBWM Vision and Strategy
Securing customers’ future prosperity and realising their ambitions
Strategy remains unchanged Portfolio management to drive superior returns RBWM transformation to improve customer service and
productivity Developing a high standard of wealth management for retail
customer
Set targets for 2016
RoRWA 5.0 - 5.5% (3.8% - 4.3% including US run-off portfolio)
Positive jaws Incremental wealth revenues of USD3bn Customer Recommendation Index (CRI) for affluent segment
in priority markets Total customer relationship balances Digitally active customers
Notes: 1 Based on CRD IV end point basis 2 Incremental revenues 2010 to 2016 3 CRI measured in Argentina, Brazil, Canada, France, Hong Kong, India, Mainland China, Malaysia, Mexico, Singapore, Taiwan, Turkey, UAE, UK and US
1
2
3