results q1 2019 schaeffler ag
TRANSCRIPT

Results Q1 2019 Schaeffler AG
dbAccess Berlin Conference 2019

Disclaimer
2
This presentation contains forward-looking statements. The words “anticipate”, “assume”, “believe”, “estimate”, “expect”, “intend”, “may”, “plan”, “project”,“should” and similar expressions are used to identify forward-looking statements. Forward-looking statements are statements that are not historical facts;they include statements about Schaeffler Group’s beliefs and expectations and the assumptions underlying them. These statements are based on plans,estimates and projections as they are currently available to the management of Schaeffler AG. Forward-looking statements therefore speak onlyas of the date they are made, and Schaeffler Group undertakes no obligation to update any of them in light of new information or future events.
By their very nature, forward-looking statements involve risks and uncertainties. These statements are based on Schaeffler AG management’s currentexpectations and are subject to a number of factors and uncertainties that could cause actual results to differ materially from those described in theforward-looking statements. Actual results may differ from those set forth in the forward-looking statements as a result of various factors (including,but not limited to, future global economic conditions, changed market conditions affecting the automotive industry, intense competition in the marketsin which we operate and costs of compliance with applicable laws, regulations and standards, diverse political, legal, economic and other conditionsaffecting our markets, and other factors beyond our control).
This presentation is intended to provide a general overview of Schaeffler Group’s business and does not purport to deal with all aspects and detailsregarding Schaeffler Group. Accordingly, neither Schaeffler Group nor any of its directors, officers, employees or advisers nor any other person makesany representation or warranty, express or implied, as to, and accordingly no reliance should be placed on, the accuracy or completeness of the informationcontained in the presentation or of the views given or implied. Neither Schaeffler Group nor any of its directors, officers, employees or advisors norany other person shall have any liability whatsoever for any errors or omissions or any loss howsoever arising, directly or indirectly, from any useof this information or its contents or otherwise arising in connection therewith.
The material contained in this presentation reflects current legislation and the business and financial affairs of Schaeffler Group which are subjectto change.

Overview
Business Highlights Q1 2019
Financial Results Q1 2019
Outlook
1234
Agenda
3

Q1 2019 with mixed results – Market environment still subdued1 Overview
Sales growth1
+0.4%EUR 3,622 mn
Gross margin
25.2%EUR 913 mn
Free Cash Flow3
EUR -235 mnEBIT margin2
7.5%EUR 272 mn
Key messages
Group sales growth1 of +0.4% with an expected slow start into theyear, Auto OEM Outperformance of 500 bps
Gross margin 25.2% (Q1’18: 27.0%), down y-o-y in Automotivedivisions, up in Industrial
EBIT margin2 7.5% (Q1’18: 11.0%), sequentially stabilized vs. Q4’18(6.5%)
Free Cash Flow3 of EUR -235 mn due to lower profitability andhigher Capex
Transformation continues – Acquisition of XTRONIC, consolidationof European plant footprint
Guidance 2019 confirmed on Group and divisional level
1
2
3
4
5
6
1 FX-adjusted | 2 Before special items | 3 Before cash in- and outflows for M&A activities
4

Schaeffler Group Q1 2019 – Highlights and lowlights1 Overview
Weak Automotive OEM business in Greater China(-14.5%2) and Europe (-3.3%2)
Automotive Aftermarket sales impacted by weak OESbusiness and pricing pressure from customerconsolidation in Europe
Gross margin still negatively impacted by higherproduction costs, overhead costs continued to growfaster than sales
Capex to Sales ratio temporary over 10% driven bypayouts of investments decided in H2 2018
Automotive OEM: LVP1 outperformance of 500 bpsdriven by strong growth in Americas (+12.4%2)
Strong growth in Industrial division (+6.9%2) with allregions contributing, especially Greater China (+14.1%2)
EBIT margin3 sequentially improved by 100 bps mainlydriven by Automotive OEM
Refinancing: Successful placement of EUR 2.2bnInvestment Grade bonds
5
1 Light Vehicle Production | 2 FX-adjusted | 3 Before special items
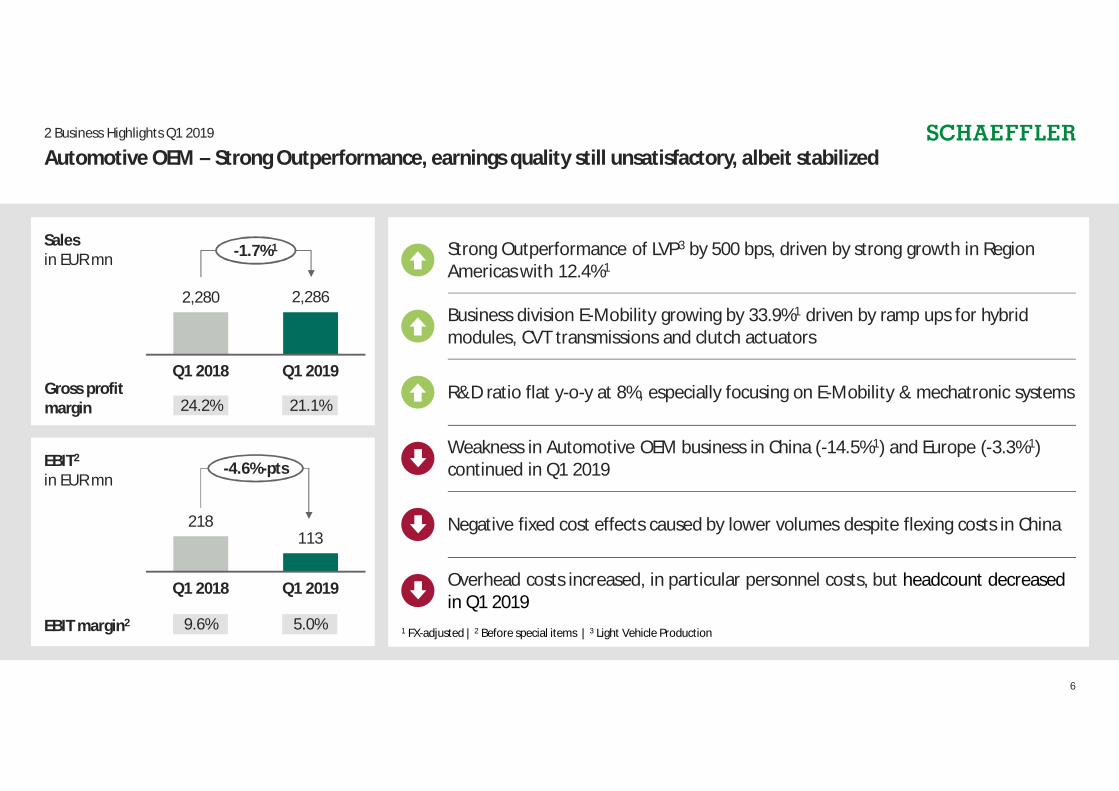
Automotive OEM – Strong Outperformance, earnings quality still unsatisfactory, albeit stabilized2 Business Highlights Q1 2019
Salesin EUR mn
EBIT2
in EUR mn
Weakness in Automotive OEM business in China (-14.5%1) and Europe (-3.3%1)continued in Q1 2019
Negative fixed cost effects caused by lower volumes despite flexing costs in China
Overhead costs increased, in particular personnel costs, but headcount decreasedin Q1 2019
Strong Outperformance of LVP3 by 500 bps, driven by strong growth in RegionAmericas with 12.4%1
Business division E-Mobility growing by 33.9%1 driven by ramp ups for hybridmodules, CVT transmissions and clutch actuators
R&D ratio flat y-o-y at 8%, especially focusing on E-Mobility & mechatronic systems
1 FX-adjusted | 2 Before special items | 3 Light Vehicle Production
24.2% 21.1%
-1.7%1
-4.6%-pts
6
9.6% 5.0%
Gross profitmargin
EBIT margin2
2,280 2,286
Q1 2018 Q1 2019
218113
Q1 2018 Q1 2019
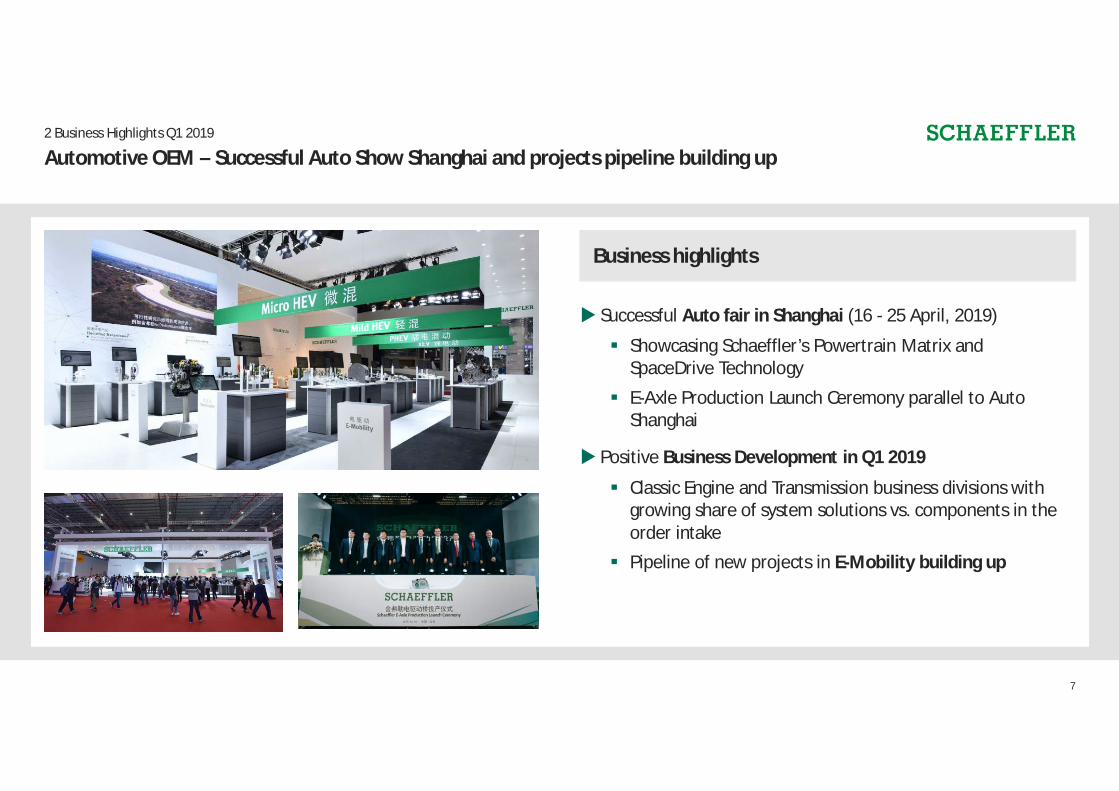
Automotive OEM – Successful Auto Show Shanghai and projects pipeline building up2 Business Highlights Q1 2019
7
Business highlights
u Successful Auto fair in Shanghai (16 - 25 April, 2019)
§ Showcasing Schaeffler’s Powertrain Matrix andSpaceDrive Technology
§ E-Axle Production Launch Ceremony parallel to AutoShanghai
u Positive Business Development in Q1 2019
§ Classic Engine and Transmission business divisions withgrowing share of system solutions vs. components in theorder intake
§ Pipeline of new projects in E-Mobility building up

Automotive Aftermarket – Slow start with mixed sales and lower EBIT margin2 Business Highlights Q1 2019
Salesin EUR mn
EBIT2
in EUR mn
-1.1%1
-3.7%-pts
8
1 FX-adjusted | 2 Before special items
35.6% 33.7%Gross profitmargin
EBIT margin2 18.1% 14.4%
Price pressure due to customer consolidation in European markets
Good growth in Independent Aftermarket with +3.0%1, driven by strongperformance in Region Americas (in particular South America)
Price increases for selected parts of the product portfolio implemented
Demand in OES business in Region Europe showing temporary decline
1 FX-adjusted | 2 Before special items
447 441
Q1 2018 Q1 2019
81 64
Q1 2018 Q1 2019
Lower gross margin due to higher product costs and negative price impact,efficiency measures (in particular on SG&A) initiated to compensate headwinds

Automotive Aftermarket – Chassis Specialist and additional NAPA business2 Business Highlights Q1 2019
9
Portfolio re-positioning:FAG brand, the chassis specialist
Portfolio expansion:Entering the North American bearings & seals business
Steering &suspension
Wheel bearings &modules
Strutmountings
Drive shaftassemblies
u Re-positioning of RUVILLE steeringportfolio under FAG brand
u Upgrade of product quality andpositioning as premium brand
u Market launch in Europe on June 1,2019 and global roll-out until 2021
u Bearings & seals program started inNorth America in Q2/18
u Product catalogue is expanding -currently covering more than9,000 parts and 1.1 million referencedapplications
u Continued ramp-up of sales volumeresults in up to 7 EUR mn ofincremental sales in Q1/19
u Steady improvements in profitability as a result of additional fixedcost coverage, as well as purchasing productivity
NAPA

Industrial – Strong growth and slightly lower earnings quality2 Business Highlights Q1 2019
Salesin EUR mn
EBIT2
in EUR mn
+6.9%1
-0.6%-pts
10
1 FX-adjusted | 2 Before special items
30.2% 31.6%Gross profitmargin
11.2% 10.6%EBIT margin21 FX-adjusted | 2 Before special items
Growth momentum declining, industrial production forecast lowered to 2% (Prior:2.6%)
Above average sales growth with positive contribution from all regions (China+14.1%1)
Gross margin increased due to positive volume development and favorable pricingmore than offsetting an increase in production costs
Continued double digit growth in Wind, Raw Materials and Railway sector clusters
1 FX-adjusted | 2 Before special items
824 895
Q1 2018 Q1 2019
92 95
Q1 2018 Q1 2019
Higher logistic costs driven by increase of special freights, full ramp up of ourEuropean distribution center and remaining costs in replenishment centers
Higher overhead costs in all functional areas overcompensated positive price andmargin evolution, program FIT to support earnings quality going forward

Industrial – Continued growth in key sectors2 Business Highlights Q1 2019
11
u Significant sales growth with key customer for multi-megawatt turbinesin China
u Local production ramp-up of large size bearings in Nanjing, China
u New orders with large railway OEM in Eastern Europe
u Supply of broad product range including spherical, ball and axle boxbearings
u Orders secured with key customers in Asia-Pacific and China
u New large size bearing contract for cement industry, renewed contractwith partners in the pulp and paper industry and new major order forcontinuous caster bearings in China
u Mitsubishi Electric Corporation and Schaeffler entered into a globalstrategic partnership
u Target is to boost connectivity and to create Industry 4.0 solutions thatreduce machine downtime and maximize productivity for the customer
Sector Ind. Automation
Sector Raw Materials
Sector Rail
Sector Wind
Further localization &growth in China
Rail growth inEastern Europe
Raw Materials growth inAsia-Pacific and China
Industry 4.0partnership

Investment1) allocation | in EUR mn
Capital allocation – Focus increased and discipline strengthened2 Business Highlights Q1 2019
12
FY 2017 FY 2018 Q1 2018 Q1 2019
Automotive OEM 1,006 970 181 225
AutomotiveAftermarket 33 64 18 40
Industrial 248 241 35 30
Schaeffler Group 1,287 1,275 234 296
Capex ratio2) 9.1% 8.7% 8.6% 10.3%
1 Additions to intangible assets and property, plant and equipment| 2 Capex in % of sales
Mid-term target:Capex ratio: 6-8%2)
Investment priorization going forward
u Automotive OEM: Strategic growth fields E-Mobility and ChassisMechatronics – clearly linked to our EUR 1.5-2.0 bn p.a. order intaketarget of program RACE
u Automotive Aftermarket: Expansion of our logistics network in allregions to increase speed and reliability of our delivery process
u Industrial: Improve our technological expertise in future growth fieldsIndustry 4.0 and Mechatronics
Strengthened Capex discipline – Actions taken in Q1
u Capex ratio2 Q1 temporarily increased due to Q4 investment payoutsand higher spending for AKO Europe
u Capex Committee started in Q1 with tightened hurdle rates and stricterapproval levels
u Capex budgets further reduced in non-strategic areas

Transformation continues – XTRONIC and European footprint2 Business Highlights Q1 2019
13
Acquisition of XTRONIC Divestment of Barden plant, UK
u Signing of agreement to sell The Barden Corporation (UK), Plymouthto HQW Holding, a UK affiliate of HQW Precision GmbH
u Divestment is part of Schaeffler‘s UK realignment activitiesannounced last November and the company´s „Global Footprint“initiative
u Divestment of Barden plant is another step to make Schaeffler‘sfootprint in Europe more efficient
u Backward integration for recently acquiredParavan technology for autonomous driving
u Strengthen software competence for existingmechatronic projects and enable more advancedsolutions going forward
u Key leadership personnel committed to continueto work for the company
u Fully consistent with our M&A radar priorities
AutomotiveOEM
u Integration of XTRONIC will further support position of Schaeffler aspartner for mechatronics and future mobility solutions
Industrial

in EUR mn Q1 2018 Q1 2019Q1 2019
vs. Q1 2018
Sales 3,551 3,622 +2.0%+0.4%1
Gross ProfitGross Margin
96027.0%
91325.2%
-47 mn-1.8%-pts.
EBIT2
EBIT Margin2391
11.0%272
7.5%-119 mn
-3.5%-pts.
Net income3 238 137 -101 mn
EPS4 (in EUR) 0.36 0.21 -0.15
Schaeffler Value Added5 743 421 -322 mn
ROCE6 19.3% 15.0% -4.3%-pts.
Free Cash Flow7 -69 -235 -166 mn
Capex 306 373 +67 mn
Net financial debt 2,439 2,805 +366 mn
Gearing ratio8 87.8% 88.5% +0.7%-pts.
Key figures Q1 20193 Financial Results Q1 2019
1 FX-adjusted | 2 Before special items | 3 Attributable to shareholders of the parent company | 4 Earnings per common non-voting share | 5 Defined as EBIT before special items minus Cost of Capital(10% × Ø Capital Employed) | 6 Before special items and based on LTM | 7 Before cash in-and outflows for M&A activities | 8 Ratio of net financial debt to equity incl. non-controlling interests
1
2
3
4
6
7
14
4
5

Sales by region Q1 2019Y-o-y growth w/o FX effects
Sales | in EUR mn
3,551 3,642 3,521 3,527 3,622
Q1 18 Q2 18 Q3 18 Q4 18 Q1 19
Sales growth – Region Americas with double-digit growth rates3 Financial Results Q1 2019
FX-adjusted+3.9% +7.9% +3.7% +0.3% +0.4%
Reported
-0.6% +4.9% +2.5% -0.4% +2.0%
14,241
Key aspects
u Group sales up by +0.4%1 (Q1’18: +3.9%1)
u Sales growth1 mainly driven by Americas (+11.9%), offsetting negativegrowth in Greater China (-8.0%) and Europe (-1.5%)
u Strong growth1 in Americas driven by all divisions (Auto OEM: +12.4%,Auto AM: +14.1%, Industrial: +9.1%)
Greater China
+2.8%
Europe
Americas +11.9%
-1.5%-8.0%
1
Asia/Pacific
51%
23%
16%
10%
+0.4%1
15
Sales growth
1 FX-adjusted

Gross Profit – Gross margin lower on negative price, mix and higher production costs3 Financial Results Q1 2019
Gross Profit Q1 2018 vs. Q1 2019 | in EUR mn
Gross margin development
27.0% -0.8%-pts +0.3%-pts -0.8%-pts -1.7%-pts +1.2%-pts 25.2%
960
-20 +8 -20-44 +31
-2
913
Gross ProfitQ1 2019
OthersGross ProfitQ1 2018
Volume MixPrice Productioncosts
Key aspects
2
FX effect
-0.0%-pts
11
23
2
3
Negative price effect driven by continued price pressure in majorAOEM end markets, especially in China; Industrial division withfavorable pricingNegative mix effect driven by AOEM, due to adverse customer andproduct mix in classic product lines and negative regional mix (mainlyChina)Higher production costs in all divisions mainly due to higher inputcosts (raw materials and personnel costs)
16
Actions
u Additional closing days
u Further reduction of number of temporary workers
u Hiring freeze in all indirect areas

EBIT1 | in EUR mn
391 4042 3553 2314 2725
Q1 18 Q2 18 Q3 18 Q4 18 Q1 19
EBIT margin – Sequential improvement, but still subdued earnings quality3 Financial Results Q1 2019
Key aspects
u Even if sequentially improving, Automotive OEM division’s Q1 2019EBIT margin is the main driver of the Group’s EBIT margin y-o-y erosion
u Automotive Aftermarket EBIT margin affected by market consolidationin Western Europe
u Industrial EBIT margin slightly lower y-o-y as ongoing positive volumeand price effects could not fully offset higher production and logisticcosts
EBIT margin1
EBIT margin1
11.0% 11.1% 10.1% 6.5% 7.5%
1,381
5 Reported EBIT of EUR 230 mn including EUR 55 mn restructuring expenses in connection with theprogram RACE and a EUR 13 mn refund of a penalty paid in 2015 in the Industrial division in connectionwith antitrust proceedings in South Korea
9.7%FY EBIT margin1
1 Before special items | 2 Reported EBIT of EUR 382 mn including EUR 22 mn restructuring expensesrelated to the integration of the internal supplier BCT | 3 Reported EBIT of EUR 376 mn including EUR 21mn positive special item | 4 Reported EBIT of EUR 205 mn including EUR 4 mn restructuring expensesrelated to the integration of the internal supplier BCT and 22 mn restructuring expenses forreorganization of UK business activities
in EUR mn Q1 18 Q1 19Q1 19
vs. Q1 18
Auto OEM 9.6% 5.0% -4.6%-pts.
Aftermarket 18.1% 14.4% -3.7%-pts.
Industrial 11.2% 10.6% -0.6%-pts.
Group 11.0% 7.5% -3.5%-pts.
3
-119 mn
17
7.5%
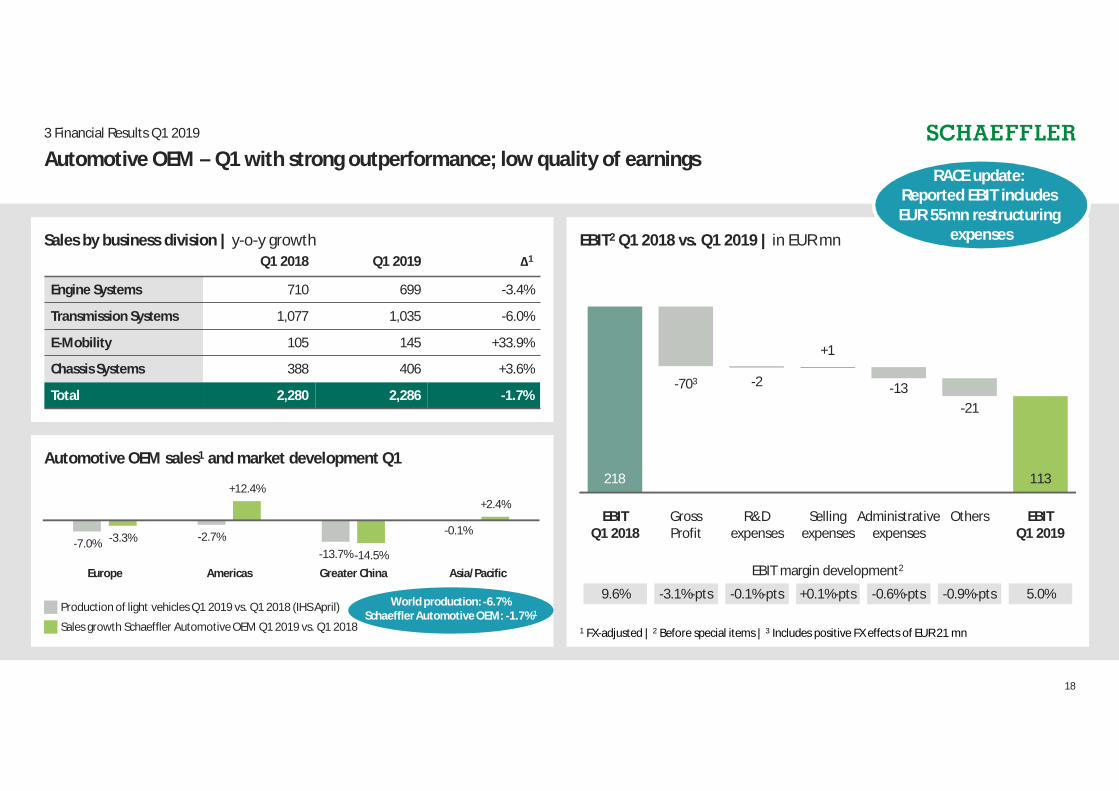
Automotive OEM – Q1 with strong outperformance; low quality of earnings3 Financial Results Q1 2019
Sales by business division | y-o-y growth
Automotive OEM sales1 and market development Q1
Q1 2018 Q1 2019 ∆1
Engine Systems 710 699 -3.4%
Transmission Systems 1,077 1,035 -6.0%
E-Mobility 105 145 +33.9%
Chassis Systems 388 406 +3.6%
Total 2,280 2,286 -1.7%
Production of light vehicles Q1 2019 vs. Q1 2018 (IHS April)
Sales growth Schaeffler Automotive OEM Q1 2019 vs. Q1 2018
World production: -6.7%Schaeffler Automotive OEM: -1.7%1
EBIT2 Q1 2018 vs. Q1 2019 | in EUR mn
EBIT margin development2
9.6% -3.1%-pts -0.1%-pts +0.1%-pts -0.6%-pts -0.9%-pts 5.0%
218
-703 -2
+1
-13-21
113
EBITQ1 2019
OthersEBITQ1 2018
R&Dexpenses
Sellingexpenses
GrossProfit
Administrativeexpenses
1 FX-adjusted | 2 Before special items | 3 Includes positive FX effects of EUR 21 mn
18
-7.0% -2.7%-13.7%
-0.1%-3.3%
+12.4%
-14.5%
+2.4%
Europe Americas Greater China Asia/Pacific
RACE update:Reported EBIT includesEUR 55mn restructuring
expenses

Automotive Aftermarket sales growth by channel1
IAM2
OES3
Total
Automotive Aftermarket – Slow start driven by weaker OES business and higher product costs3 Financial Results Q1 2019
EBIT4 Q1 2018 vs. Q1 2019 | in EUR mn
4 Before special items | 5 Includes negative FX effects of EUR 1 mn
EBIT margin development4
18.1% -1.8%-pts +0.1%-pts -0.4%-pts -0.4%-pts -1.2%-pts 14.4%
81
-105
+0
-1 -2-4
64
EBITQ1 2019
OthersEBITQ1 2018
R&Dexpenses
Sellingexpenses
GrossProfit
Administrativeexpenses
Sales by region | y-o-y growthQ1 2018 Q1 2019 ∆1
Europe 338 321 -4.2%
Americas 78 88 +14.1%
Greater China 19 20 +1.1%
Asia/Pacific 12 11 -9.6%
Total 447 441 -1.1%
Q1 2019Q1 2018
-15% -10% -5% 0% 5%
1 FX-adjusted | 2 Independent Aftermarket | 3 Original Equipment Service
19

Industrial – Q1 with continued growth momentum, gross margin increase offset byhigher overhead costs
3 Financial Results Q1 2019
Industrial sales growth by sector cluster Q1 20191
Sales by region | y-o-y growthQ1 2018 Q1 2019 ∆1
Europe 482 501 +4.4%
Americas 141 162 +9.1%
Greater China 131 155 +14.1%
Asia/Pacific 70 77 +6.3%
Total 824 895 +6.9%
EBIT2 Q1 2018 vs. Q1 2019 | in EUR mn
1 FX-adjusted | 2 Before special items | 3 Includes positive FX effects of EUR 11 mn
EBIT margin development2
11.2% +1.4%-pts -0.2%-pts -0.2%-pts -0.4%-pts -1.2%-pts 10.6%
92
+333
-4-10
-6-10
95
EBITQ1 2019
OthersEBITQ1 2018
R&Dexpenses
Sellingexpenses
GrossProfit
Administrativeexpenses
20
-5% 5% 15% 25%
Raw MaterialsRailway
Power TransmissionTwo-Wheelers
WindIndustrial Automation
AerospaceOffroad
Industrial Distribution

Net income1 Q1 2019 EUR 137 mn – EPS Q1 2019 at EUR 0.21 (PY: EUR 0.36)3 Financial Results Q1 2019
Key aspects
u Net income decreased to EUR 137 mn (Q1’18: EUR 238 mn)
u Decrease driven by lower EBIT
u EPS decreased to EUR 0.21 (Q1’18: EUR 0.36)
Net income1 | in EUR mn
Schaeffler Value Added3 | in EUR mn
1 Attributable to the shareholders of the parent company | 2 Earnings per common non-voting share 3 Defined as EBIT before special items minus Cost of Capital (10% × Ø Capital Employed)
238 268 256 119 137
Q1 18 Q2 18 Q3 18 Q4 18 Q1 19
EPS2 | in EUR0.36 0.41 0.38 0.18 0.21
881
1.33
902 952 939 787 556 421
23.7% 23.1% 22.3% 19.9% 16.7%15.0%
2014 2015 2016 2017 2018 Q1 2019(LTM)
ROCE before special items
4
-42.4%
21

FCF Details | in EUR mn
Free Cash Flow before M&A1 FY at EUR -235 mn (PY: EUR -69 mn) – Capex Ratio Q1 19 at 10.3%3 Financial Results Q1 2019
Key aspects
u FCF before M&A decreased to EUR -235mn (PY: EUR -69mn)
u Lower profitability and higher Capex
u FCF before M&A impacted by strategic investments, e.g. AKO Europe –Underlying FCF before M&A at EUR -173 mn
Free Cash Flow before M&A1 | in EUR mn
1 Before cash in- and outflows for M&A activities2 LTM FCF before M&A divided by EBITDA before special items | 3 Capex in % of sales
Capex ratio3
Q12018
Q12019
∆ Q118/19
FCF as reported (71) (300) (229)Non recurring items4 33 11 (22)Investments5 19 51 32M&A 2 65 63Receivable Sale Program 0 0 0
(17) (173) (156)
4 Including payments for legal cases and restructuring measures | 5 Capex in major strategic projects,e.g. Agenda 4 plus One (AKO Europe, EDC, Focus)
-71 -5 202 96
8.6% 7.9% 7.4% 10.6%
-300
10.3%
FCF Conversion ratio2
24% 22% 17% 17% 10%
FCF reported
-166 mn
22
-69 -5
201 257
-235
Q1 18 Q2 18 Q3 18 Q4 18 Q1 19
5

Working Capital ratio 18.0% – Capex ratio 10.3% in Q13 Financial Results Q1 2019
Capex3 | in EUR mnWorking capital1 | in EUR mn
1 According to balance sheet; figures as per the end of period2 At December 31st, 2018, trade receivables with a carrying amount of EUR 166 mn(net of retained default risks had been sold under the ABCP program 3 Cash view
in % of sales (LTM)18.4% 19.3% 18.7% 15.6%2 18.0%
15.6%2
in % of sales8.6% 7.9% 7.4% 10.6% 10.3%
8.7%
2,575 2,737 2,672 2,219 2,579
Q1 18 Q2 18 Q3 18 Q4 18 Q1 19
306 289 262 375 373
Q1 18 Q2 18 Q3 18 Q4 18 Q1 19
1,232
6
23

Net debt of EUR 2,805 mn – Gearing ratio1 at 89%3 Financial Results Q1 2019
Key aspects
u Net debt increased slightly to EUR 2,805 mn (FY’18: EUR 2,547 mn) dueto seasonally negative FCF; Net leverage ratio2 at 1.3x
u Successful placement of Investment Grade bonds to refinance existingindebtedness
u Early Repayment of the three Schaeffler Finance B.V. bonds scheduledfor May 15, 2019
Net financial debt and Gearing ratio | in EUR mn
1 Gearing ratio: Ratio of net financial debt to equity incl. non-controlling interests in %
Gearing ratio1
2,439 2,833 2,644 2,547 2,805
Q1 18 Q2 18 Q3 18 Q4 18 Q1 19
3,111 3,340 3,375 3,348
88% 106% 90% 83%
4,876
89%
Cash & cash equivalents672 507 731 801 2,071
Gross debt
7
24
Net debt development | in EUR mn
2 Leverage Ratio: Net financial debt to EBITDA ratio before special items
Leverage Ratio2
5,778 4,889 2,636 2,370 2,547 2,805
2.62.1
1.1 1.0 1.2 1.3
2014 2015 2016 2017 2018 Q1 2019

Group Guidance
1 FX-adjusted | 2 Before special items3 Before cash in- and outflows for M&A activities
Divisional Guidance
25
AutomotiveOEM
AutomotiveAftermarket Industrial
ActualsQ1 2019
GuidanceFY 2019
ActualsQ1 2019
GuidanceFY 2019
ActualsQ1 2019
GuidanceFY 2019
-1.7% 1 - 3% -1.1% 1 - 3% +6.9% 1 - 3%
5.0% 6 - 7% 14.4% 15 - 16% 10.6% 10 - 11%
Guidance 2019 confirmed on Group and divisional level4 Outlook
Market assumptions 2019
u Automotive OEM: Decrease of global passenger car productionof around minus 1%
u Automotive Aftermarket: Slower growth in the global vehicle populationand a nearly unchanged average vehicle age
u Industrial: Growth of industrial production of approximately 2%(Prior4: 2.6%)
4 At March 6th 2019
Actuals
Q1 2019
Guidance
FY 2019
Sales growth1 +0.4% 1 - 3%
EBIT margin2 7.5% 8 - 9%
Free Cash Flow3 EUR -235 mn ~ EUR 400 mn

Conclusion & Outlook – Full focus on cost and capex discipline, cash generation and transformation4 Outlook
Adapting executionto a more complex
market environment
Q1 sales development impacted by subdued market conditions, better secondhalf expected in the Automotive divisions, but visibility remains low
Automotive OEM: Program RACE on track, on top, additional measures to reduceproduction costs
Automotive Aftermarket: SG&A efficiency measures to compensate forheadwinds
Industrial: Gross margin increased in Q1, program FIT to support earnings qualitygoing forward
1
Capex budgets further reduced in non-strategic areas, hurdle rates tightened,stricter approval levels. Overhead cost discipline enforced across the board
2
3
4
5
26

Financial calendar 2019 – CMD 2019 moved to September 11th, 20194 Outlook
Roadshows Regular capital market communication
May 9th
May 10th
May 16th
May 8th
Aug 6th
Nov 5th
Sep 11th
London
Frankfurt
Paris
Q1 2019 Earnings Release
Q2 2019 Earnings Release
Q3 2019 Earnings Release
Capital Markets Day 2019, Deutsche Bank IAAConference
May 23rd Toronto
27

IR ContactInvestor RelationsPhone: + 49 9132 82 4440Email: [email protected]: www.schaeffler.com/ir

Business and Strategic Update
Automotive OEM
Automotive Aftermarket
Industrial
A1A2A3A4
Appendix
29
BackupA5

Transformation continues – Environment to remain challengingA1: Business and Strategic Update
Today
“One Schaeffler” “Agenda 4 plus One” 2016 – 2020
VisionMissionValues
IPO
Mobility fortomorrow
1 Bearing & Components Technologies
2012 – 2016 2021 and beyond2016 – 2020
30
New strategy cycle
u Environment remains challengingw Subdued growth, low visibilitywMacroeconomic and geopolitical risksw Technological changes
uWe concentrate on our strengthsw Automotive and Industrial supplier with global
customer basew Technology & Industrialization excellencew Strong balance sheet
uWe take actionw Executing existing efficiency initiatives / Agenda 4 plus
OnewNew program RACE in Automotive OEMw Increased cost and Capex discipline
1
2
3BCT1

Agenda 4 plus One – Progressing on schedule with completion ratio of 60%A1: Business and Strategic Update
31
Initiatives► Customer Excellence► E-Mobility► Industry 4.0► Quality for Tomorrow► Global Footprint► Factory for Tomorrow► Shared Services► Process Excellence► Working Capital► Leadership & Corp. Values► Qualification for Tomorrow► New Work► Program CORE► Digital Agenda► IT 2020► Global Branding► Global Supply Chain► Auto. Kitting Operations► Global Reporting► Focus
45678
123
9
15
17
1920
1011
1312
14
16
18
Initiate Plan Implement Close
10% 25% 95% 100%
Ø 60%
1
70%
60%
60%
50%
65%
60%
60%
40%
100%
65%
60%
75%
100%
40%
25%
70%
40%
55%
50%
40%

Drive continuous improvement – Execution of efficiency initiatives progressingA1: Business and Strategic Update
A
Overview initiatives
StartDate
CostEfficiency
Target
HCO1
ReductionTarget
RestructuringCost
FullFinancial
Impact FocusCompletion
Ratio at CMD2Completion
Ratio now
CORE I 10/2015 ~ EUR 40 mn ~ 500 EUR 36 mn3 12/2018 Industrial 100% 100%
CORE II 10/2016 ~ EUR 90 mn ~ 400 EUR 45 mn4 12/2019 Industrial >50% 100%
Shared Services 10/2017 ~ EUR 25 mn ~ 100 EUR 39 mn5 12/2022 Group 35% 55%
BCT6 5/2018 ~ EUR 60 mn ~ 950 EUR 26 mn7 12/2021 Auto OEM/Industrial 5% 20%
New program RACE in Automotive OEM
1 HCO = Headcount | 2 20th of September 2018 | 3 Booked in 2015 | 4 Booked in 2016 | 5 Booked in 2017 | 6 Bearing & Components Technologies | 7 Booked in 2018
+
32
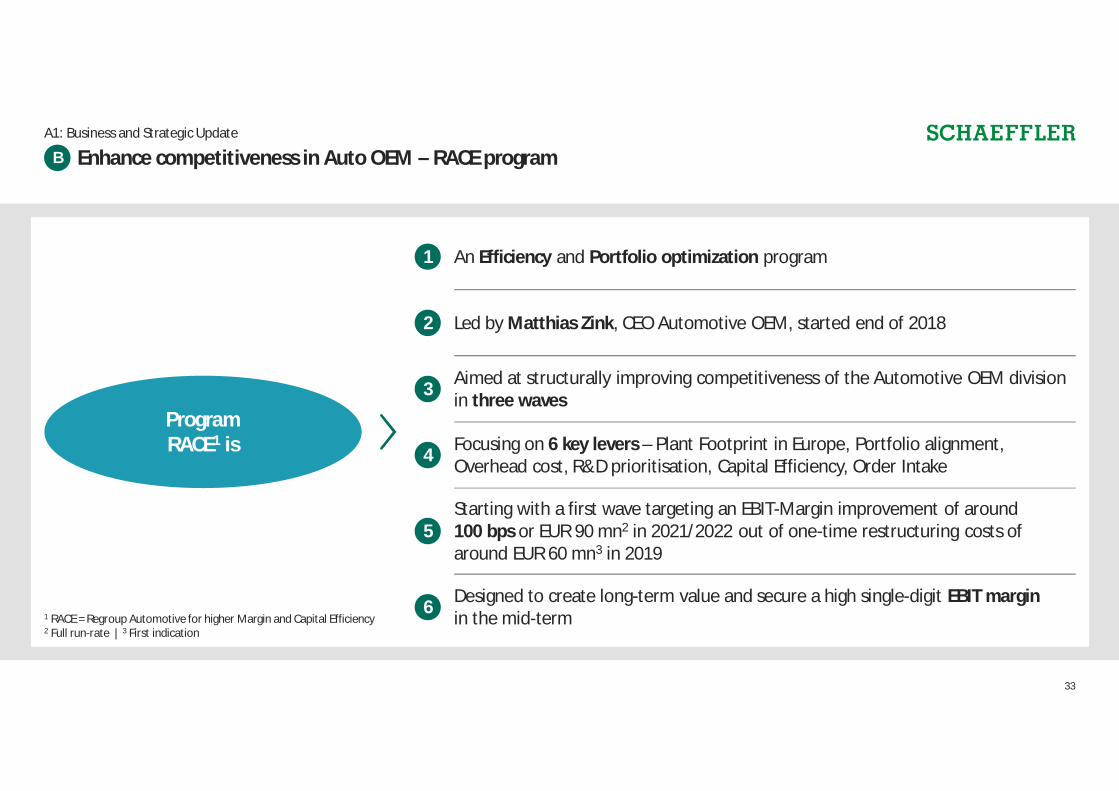
Enhance competitiveness in Auto OEM – RACE programA1: Business and Strategic Update
B
ProgramRACE1 is
An Efficiency and Portfolio optimization program
Led by Matthias Zink, CEO Automotive OEM, started end of 2018
Aimed at structurally improving competitiveness of the Automotive OEM divisionin three waves
Focusing on 6 key levers – Plant Footprint in Europe, Portfolio alignment,Overhead cost, R&D prioritisation, Capital Efficiency, Order Intake
1
Starting with a first wave targeting an EBIT-Margin improvement of around100 bps or EUR 90 mn2 in 2021/2022 out of one-time restructuring costs ofaround EUR 60 mn3 in 2019
2
3
4
5
Designed to create long-term value and secure a high single-digit EBIT marginin the mid-term6
1 RACE = Regroup Automotive for higher Margin and Capital Efficiency2 Full run-rate | 3 First indication
33

Business portfolio | Automotive OEM Execution | Program RACE
Efficiency and Portfolio Optimization – Execution in three wavesA1: Business and Strategic Update
B
Impact
2019 2020 2021 2022 2023and beyond
Mid-term
Time
Core business
New business
CapitalEfficiency
Wave 1
+Wave 3
Growth
34
Wave 2

RACE Wave 1 – 100 bps EBIT margin improvementA1: Business and Strategic Update
B
Financial impact | in EUR mnWave 1 – Levers and Targets
Key assumptions
u Continuation of volatile and uncertain environment
u Neither severe recession nor strong recovery
u Measures aligned in consultation with workers’councils
1 Including allocated Capex | 2 Full run rate | 3 First indication to be further validated4 Percentage of full financial impact achieved
Consolidate up to five Automotive plant locations in Europe
Reduce around 900 jobs, thereof around 700 in Germany
Divest/exit selected non-core businesses in particular withinbusiness divisions Engine/ Transmission systems and reinvestproceeds in strategic growth areasR&D/sales ratio for Automotive OEM to be restricted to8.0% - 8.5% in 2019 and 2020 with ongoing shift towardsstrategic growth areas
Reduce Capex to below EUR 900 mn1 p.a. for Automotive OEMand strengthen capital discipline
Increase order intake in E-Mobility and Chassis Mechatronics byEUR 1.5 - 2.0 bn p.a. in the next 3 years
1
2
3
4
5
6
2019 2020 2021 2022EUR -60 mn3
90%4 100%4
35
FootprintEurope
Costefficiency
Portfolioadjustment
R&D priori-tisation
Capitalefficiency
Orderintake
EUR 90 mn2

Program RACE – Growth prospects, order intake and outperformanceA1: Business and Strategic Update
36
Key aspects
u Technological competence and innovative strength complemented viabolt-on acquisitions
u High Potential in E-mobility from Electrification / Hybridization and in ChassisMechatronics
u Continuously improving Order Intake (2018: EUR 12.6 bn vs. EUR 11.3 bn 2017)and Book-to-Bill Ratio (1.4x in 2018 vs 1.3x in 2017)
u Long-term outperformance of the market by around 4%-pts2020 2025 2030
102 110 117
Hybrid ElectricVehicle
Combustion Engine
Electric Vehicle30%
40%
30%
Vision Chassis1
Vision Powertrain
≤ L2Partially automatedor less
L3 Highly automatedL4 Fully automatedL5 Autonomous
2025 2030 2035
96% 81%59%
13%
14%
110 117 117
18%9%
World Light Vehicle Production in mn
World Light Vehicle Production in mn
1 Source: IHS Autonomy and McKinsey / Values based on Light Vehicles < 6 tons only
B

We take action – Improve cost and Capex discipline, optimize portfolioA1: Business and Strategic Update
C
Capex discipline
u Capex to sales ratio limited to 6-8% of sales, stricter allocation togrowth areas (“earn the right to grow”-logic)
u Capex Committee strengthened, hurdle rates (Gross Profit, NPV, IRR)tightened
u Strict target set for the Short Term Bonus (20% share) to incentivizemore proactive cashflow management (zero bonus in case targetis missed)
Cost discipline
u Overhead cost to be harmonized with sales growth development
u Hiring freeze1 for all overhead and indirect functions
u Additional measures to be introduced to improve productivity in plants
37
1 Except for high growth areas
M&A radar with 7 search fields
Acquisitions/Divestments 2016 - 2018 Acquisitions/Divestments/Exits going forward
Compact Dynamics
Schaeffler Paravan JV
Elmotec Statomat 2018
Schaeffler Motorenelemente
Schaeffler Suisse – Hydrel
2018
2017
2016
2016
Portfolio optimization
Technology-oriented,bolt-on acquisitionsEUR 100 - 500 mn
in
out out
in
Assets under review,Non strategic business within
Engine/Transmission

Automotive OEM – FY 2018 overviewA2: Automotive OEM
Sales by business division | in EUR mn
Automotive OEM sales and market development 2018
FY 2017 FY 2018 ∆1
Engine Systems 2,786 2,783 +2.1%
Transmission Systems 4,204 4,170 +1.4%
E-Mobility 416 486 +18.1%
Chassis Systems 1,585 1,558 +0.1%
Total 8,991 8,997 +2.1%
Production of light vehicles 2018 vs. 2017 (IHS)
Sales growth Schaeffler Automotive OEM 2018 vs. 2017
World production: -1.1%Schaeffler Automotive OEM: +2.1%1
-0.5% -0.1%-3.8%
+1.0%+0.9%
+5.6%+1.2% +2.3%
Europe Americas Greater China Asia/Pacific
EBIT2 2017 vs. 2018 | in EUR mn
EBIT margin development2
10.8% -2.9%-pts +0.1%-pts -0.1%-pts -0.4%-pts +0.2%-pts 7.7%
973
-2583 6 -14 -30 16
693
EBITFY 2018
OthersEBITFY 2017
R&Dexpenses
Sellingexpenses
GrossProfit
Administrativeexpenses
1 FX-adjusted | 2 Before special items | 3 Includes negative FX effects of EUR -64 mn
38

Product portfolio – Broad drivetrain know-howA2: Automotive OEM
39
of Automotive OEM sales in 2018
Engine systems31%
of Automotive OEM sales in 2018
Transmission systems46%
of Automotive OEM sales in 2018
Chassis systems17%
of Automotive OEM sales in 2018
E-Mobility5%
u Valve train components &systems
u Variable camshaft timer
u Belt & chain drive systems
u Thermal managementmodules
u Clutch systems, E-clutches
u Damping technology(e.g. dual mass flywheels)
u Double-clutch transmissions
u Torque converter
u Chassis bearings
u Wheel bearings
u Ball screw drives for steeringsystems
u Active mechatronic roll control
u Hybrid modules
u E-Axles
u Actuators, CVT technologies
u Wet double clutches

Vision Powertrain – Market moving towards the accelerated scenarioA2: Automotive OEM
Accelerated ScenarioGlobal vehicle production (in mn units)
Regionalized Accelerated Scenario 2030Global vehicle production (in mn units)
ICE HEV BEV
Source: IHS and Schaeffler Assumptions / Values based on Light Vehicles < 6 tons only, ICE =Internal Combustion Engine; HEV = Hybrid Electric Vehicles ranging from 48V Mild Hybrid to PHEV,BEV = Battery Electric Vehicles (incl. Fuel Cell Electric Vehicles)
2020e20152010 2030e2025e
101
89
74
120
111CAGR 2010/2030
ICE HEV BEV
EMEA NorthAmerica
SouthAmerica
India SEAJapanKoreaGreaterChina
43%
96%
20
19%41%
35%
36%
37%
5
24%
29
45%6
57%
15% 58%
9
28%
33%
26%
9
20% 75%
3%
22%
38
52%22%
4
9%2%2%99%
97% 85%
50%30%
13%
35%
40%
30%15%2%
40

Vision Chassis – Market shifting towards autonomyA2: Automotive OEM
41
Vision ChassisGlobal vehicle production (in mn units)
Steer-By-Wire SystemsKey growth technology for automated vehiclesby allowing the steering wheel to disappearconditionally or being eliminated entirely
Auto
mat
ion
Leve
l
Definition Fitment rateSteer-by-Wire
Autonomous 100 %
Fullyautomated 20 - 30%
Highlyautomated 20 - 30%
L5
L4
L32020 e 2025 e 2030 e 2035 e
100% 96%81%
59%
13%
14%
102110
117 1174%
18%
9%
≤L2 L3 L4 L5
Source: IHS Autonomy and McKinsey / Values based on Light Vehicles < 6 tons onlyL0 = No Automation, L1 = Driver Assistance, L2 = Partial Automation, L3 = Conditional Automation, L4 = High Automation, L5 = Full Automation

Content per Vehicle1
in EUR
E-Mobility – Content per vehicleA2: Automotive OEM
42
1 Average Schaeffler Content per light vehicles produced world wide (excluding Aftermarket, Heavy Duty & Motorcycles content) | 2 according to Schaeffler Accelerated Scenario3 Market Growth 2016-2025: 1.8% (Source: IHS; July 2017) + Content per Vehicle growth ~4%
excl. Aftermarket, HeavyDuty & Motorcycles
Average Content per Vehicle 2025~EUR 130 2
~6% CAGR 3
1 ICE 2 HEV 3 BEV
2016 2025 2016 2025 2016 2025
~90
~125
~60
~150
~25
~100
90 mn 56 mn 3 mn 39 mn 0.5 mn 16 mn
x 1.5 x 2.5x 4.0
No. of light vehicles2

Schaeffler e-Axle transmission is driving the brand new Audi eTron QuattroA2: Automotive OEM
43
u Schaeffler supplies both E-AxleTransmissions for the new Audi eTronQuattro
u Both E-Axles are based on Schaeffler‘spatented Lightweight Differentialtechnology
u The rear axle is build in coaxial design andsets a new benchmark in power density(230 Nm/kg).
u The front axle is build in parallel designand includes a parking lock with electro-mechanical actuator
Best-in classpower density for
E-Axle transmissions:230 Nm/kg
2018 Schaeffler‘s new Lightweight E-Axle Transmissions for the Audi eTron Quattro
SOP Q3/2018
Front:Parallel design 1-speed E-AxleTransmission withintegrated electr.mech. parking lock
Rear:Coaxial design1-speed E-AxleTransmission
Power Electronics
Actuators
Software
E-Machines
E-Axle Transmission
E-Axle subsystems

Stator Manufacturing Processes
E-Mobility – Production technology gap closedA2: Automotive OEM
44
E-M
otor
with
wav
e-w
indi
ngte
chno
logy
Rotor Manufacturing Processesin series production at Schaeffler today
prototyping machines available at Schaeffler
ext. supplier technology as of today
Production Technology Elmotec Statomat
Schaeffler already covered the majority of the E-Motor production processes
With this acquisition we are closing now the last remaining production technology gap
Ready to produce by 2020

Automotive Aftermarket sales growth by channel 20181
IAM2
OES3
Total
Automotive Aftermarket – FY 2018 overviewA3: Automotive Aftermarket
EBIT4 2017 vs. 2018 | in EUR mn
4 Before special items | 5 Includes negative FX effects of EUR -27 mn
EBIT margin development4
19.0% -1.4-pts 0%-pts -1.1%-pts -0.3%-pts +0.8%-pts 17.0%
358
-325
0 -19-6 15
316
EBITFY 2018
OthersEBITFY 2017
R&Dexpenses
Sellingexpenses
GrossProfit
Administrativeexpenses
Sales by region | y-o-y growthFY 2017 FY 2018 ∆1
Europe 1,375 1,393 +2.5%
Americas 403 340 -5.2%
Greater China 57 76 +36.5%
Asia/Pacific 45 50 +12.5%
Total 1,880 1,859 +2.2%
FY 2018FY 2017
-15% -10% -5% 0% 5% 10% 15% 20%
1 FX-adjusted | 2 Independent Aftermarket | 3 Original Equipment Service
45
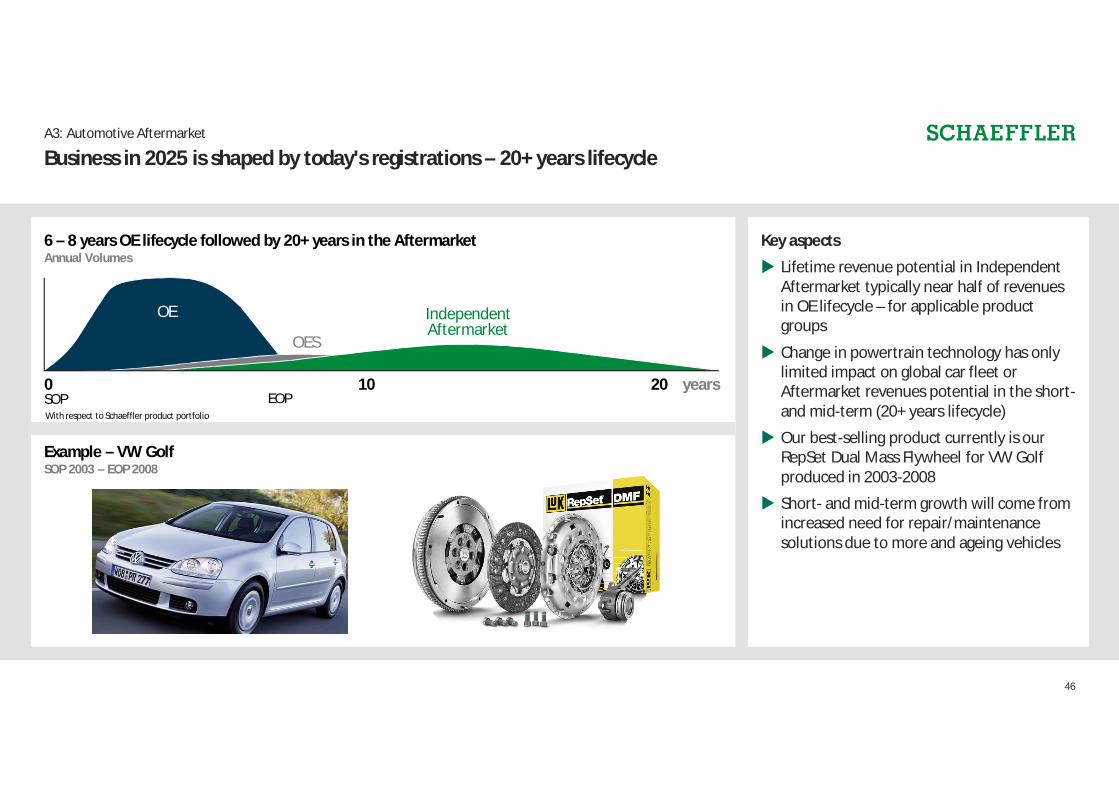
Business in 2025 is shaped by today's registrations – 20+ years lifecycleA3: Automotive Aftermarket
46
6 – 8 years OE lifecycle followed by 20+ years in the AftermarketAnnual Volumes
Example – VW GolfSOP 2003 – EOP 2008
With respect to Schaeffler product portfolio
0 10 20SOP EOP
years
OE
OES
IndependentAftermarket
Key aspects
u Lifetime revenue potential in IndependentAftermarket typically near half of revenuesin OE lifecycle – for applicable productgroups
u Change in powertrain technology has onlylimited impact on global car fleet orAftermarket revenues potential in the short-and mid-term (20+ years lifecycle)
u Our best-selling product currently is ourRepSet Dual Mass Flywheel for VW Golfproduced in 2003-2008
u Short- and mid-term growth will come fromincreased need for repair/maintenancesolutions due to more and ageing vehicles

Our markets continue to grow – Great potential in ChinaA3: Automotive Aftermarket
47
Vehicle populationMillion units (PC/LCV)
Key growth drivers
u Global vehicle fleet will grow at 3.2% CAGR2017-2023
u Vehicle age will continue to grow, especially inChina
u Total aftermarket revenues globally will growfrom EUR 803 bn to EUR 1,196 bn (+3.1% CAGR2017/2030)
Total aftermarket revenuesin EUR bn
+3.1%CAGR
Global
China1,196803
91 233
2017 2030 2017 2030
+7.5%CAGR
Source: McKinsey “Ready for Inspection - the Automotive Aftermarket in 2030” - Jul 18
Vehicle ageAverage age in years (PC/LCV)
1.3� 1.6 bn2017 2023
9.7� 10.0 years
531.2420.2
200.3 175.9
619.7
453.3
331.4
196.9
Europe Americas Greater China AsiaPacific
11.510.2
5.2
8.5
12.010.4
6.5
9.0
Europe Americas Greater China AsiaPacific Source: IHS; Feb 19
Source: IHS; Feb 19
2017 2023

Components
u Traditional business with replacements parts
u Growing with global vehicle fleet
u Growing with average vehicle age
Growth drivers in the Independent Aftermarket – Components and SolutionsA3: Automotive Aftermarket
48
Solutions
u Complete sets and kits forplug n' play repair solutions
u Increasing vehicle complexity leads toincreasing need for informationon workshop level
u Total repair costs are dominatedby labour costs, driving more and morecomprehensive, all-in-one quality repairs
Outlook
u Trends in OEM business fuel futureAftermarket potential
u Repair solutions will remain core growthdriver going forward
u Additional aftermarket potential fromintelligent repair solutionsfor E-axles and hybrid modules

Industrial – FY 2018 overviewA4: Industrial
Industrial sales growth by sector cluster 20181
Sales by region | y-o-y growthFY 2017 FY 2018 ∆1
Europe 1,804 1,906 +7.3%
Americas 575 596 +9.7%
Greater China 472 575 +25.4%
Asia/Pacific 299 308 +5.6%
Total 3,150 3,385 +10.1%
0% 10% 20% 30%
Raw MaterialsRailway
Power TransmissionTwo-Wheelers
WindIndustrial Automation
AerospaceOffroad
Industrial Distribution
EBIT2 2017 vs. 2018 | in EUR mn
1 FX-adjusted | 2 Before special items | 3 Includes negative FX effects of EUR -42 mn
EBIT margin development2
8.0% +1.8%-pts +0.1%-pts +0.9%-pts -0.1%-pts +0.3%-pts 11.0%
253
1273
-7 -1 -9 9
372
EBITFY 2018
OthersEBITFY 2017
R&Dexpenses
Sellingexpenses
GrossProfit
Administrativeexpenses
49

Industrial portfolio – Broad range of standard and customized productsA4: Industrial
50
Ball Bearings CylindricalRoller Bearings
SphericalRoller Bearings
TaperedRoller Bearings
Needle RollerBearings
LinearTechnology
Plain bearings
Ball bearing(DGBB)
Needle rollerbearing (NRB)
Cylindrical rollerbearing (CRB)
Spherical rollerbearing (SRB)
Tapered rollerbearing (TRB)
Linear guides Plain bearing
Standard product businessMechatronics
VarioSenseand SmartCheck
Housing
Customized product business
Mechatronics
Cronitect-hybridbearing – Bicycle
Heavy duty CRB –Construction Machin.
Coated SRB –Windpower rotor
bearing
Wheelset bearing –Highspeed trains
Six-row linearrecirculating ball
bearing –Machine Tool
"Slimline" drawn cupNRB – Gearbox
Spherical plainbearing with special
coating - Marine
Sensorized rotarytable bearing &
sensorized linear guideRUE 4.0 – Machine Tool
Linear System –Industrial
Automation
Systems

Portfolio evolution – From components to Industry 4.0A4: Industrial
51
Asia Pacific
GreaterChina
Americas
Europe
Distribution
OEM & MRO
IndustrialAutomation
PowerTransmission
TwoWheelers
Offroad
Railway
Aerospace
RawMaterials
Wind
Portfolio Region Sector split Channel

Automotive Aftermarket | in EUR mnGroup | in EUR mn
Industrial | in EUR mnAutomotive OEM | in EUR mn
1 FX-adjusted
Key figures by Group and divisionA5: Backup
Q1’18 Q2’18 Q3’18 Q4’18 Q1’19Sales 3,551 3,642 3,521 3,527 3,622Sales Growth1 +3.9% +7.9% +3.7% +0.3% +0.4%EBIT Reported 391 382 376 205 230EBIT bsi 391 404 355 231 272EBIT bsi margin 11.0% 11.1% 10.1% 6.5% 7.5%
Q1’18 Q2’18 Q3’18 Q4’18 Q1’19Sales 2,280 2,307 2,191 2,218 2,286Sales Growth1 +3.2% +6.5% +3.2% -4.2% -1.7%EBIT Reported 218 193 181 70 59EBIT bsi 218 203 168 84 113EBIT bsi margin 9.6% 8.8% 7.7% 3.8% 5.0%
Q1’18 Q2’18 Q3’18 Q4’18 Q1’19Sales 447 480 476 459 441Sales Growth1 -4.4% +12.3% -3.0% +5.0% -1.1%EBIT Reported 81 96 88 76 64EBIT bsi 81 96 85 76 64EBIT bsi margin 18.1% 20.0% 17.9% 16.6% 14.4%
Q1’18 Q2’18 Q3’18 Q4’18 Q1’19Sales 824 855 854 850 895Sales Growth1 +10.8% +9.3% +9.4% +11.0% +6.9%EBIT Reported 92 93 107 59 108EBIT bsi 92 105 102 71 95EBIT bsi margin 11.2% 12.3% 11.9% 8.4% 10.6%
52
Adjusted comparativefigures 2018

Automotive OEM Outperformance by quartersA5: Backup
IHS1 Auto OEM2Outper-
formanceWorld -6.7% -1.7% +5.0pp
Americas -2.7% +12.4% +15.1pp
Europe -7.0% -3.3% +3.7pp
Greater China -13.7% -14.5% -0.8pp
Asia/Pacific -0.1% +2.4% +2.5pp
Q1 19
1 LVP Growth according to IHS Markit (April 2019) | 2 FX-adjusted Sales Growth Automotive OEM division
Q1 18 Q2 18 Q3 18 Q4 18
53
IHS1 Auto OEM2Outper-
formanceWorld -0.1% +3.2% +3.3pp
Americas -1.4% +3.7% +5.1pp
Europe +2.4% +0.4% -2.0pp
Greater China -1.6% +12.4% +14.0pp
Asia/Pacific -0.7% +0.5% +1.2pp
IHS1 Auto OEM2Outper-
formance+4.7% +6.5% +1.8pp
-0.7% +3.7% +4.4pp
+6.6% +4.6% -2.0pp
+10.5% +14.5% +4.0pp
-0.4% +7.6% +8.0pp
IHS1 Auto OEM2Outper-
formance-2.7% +3.2% +5.9pp
+1.9% +9.9% +8.0pp
-4.0% +1.6% +5.6pp
-4.5% +2.5% +7.0pp
-3.0% -0.7% +2.3pp
IHS1 Auto OEM2Outper-
formance-5.6% -4.2% +1.4pp
+1.0% +5.1% +4.1pp
-6.7% -2.7% +4.0pp
-15.5% -17.4% -1.9pp
+8.0% +2.1% -5.9pp
FY 19 (YTD)Outperformance: +5.0pp
FY 18Outperformance: +3.1pp

Impact of IFRS 16 accounting standardA5: Backup
IFRS 16
u IFRS 16 – Leases is a new financial reporting standardfor the accounting of lease agreements
u As of January 1st, 2019, Schaeffler has to capitalizeall affected monthly lease payments
u Examples of relevant contracts are all rental agreementsfor buildings, lease agreements for cars, lease contracts fortransportation equipment and other miscellaneous equipment
Implications for Schaeffler
u Visible impact on the balance sheet due to the initial recognitionof the right of use assets and lease liabilities
u Lease expenses will be shown as depreciation and interest.Overall very limited impact on income statement
u Visible impact on the cash flow statement due to the shiftof the lease expenses from the cash flows of operating activitiesto the cash flows used in financing activities (IAS 7, IFRS 16)
u No impact on Net debt
Definition of Free cash flow (FCF) after IFRS 16
u Modification of FCF definition to keep comparability to FCF usedunder IFRS 15 and before
u New definition includes principal portion of the lease liabilitiesfrom Cash flows now used in financing activities
Before IFRS 16
Cash flows used ininvesting activities
Free cash flow
IFRS 16
Cash flows fromoperating activities
Cash flows used ininvesting activities
Free cash flow
Cash flows fromoperating activities
Incl. lease expenses
Principal portion of the lease liability cash flows
+
=
+
+
=
54

Overview Corporate and Financing StructureA5: Backup
Financing structure | as of March 31, 2019Corporate structure (simplified) | as of March 31, 2019
1 EUR/USD = 1.1235 | 2 After redemption of called bonds: 2.02%; incl. commitment and utilization fees3 Bonds issued by Schaeffler Finance B.V., guaranteed by Schaeffler AG4 Bonds have been called for redemption and will be redeemed in full on 15th May 2019
Debt instrumentNominal
(USD mn)Nominal
(EUR1 mn) Interest MaturityRating
(Fitch/Moody’s/S&P)
Loans Term loan (EUR) - 500 E+0.80% Sep-23 Not rated
RCF (EUR 1,500 mn) - - E+0.50% Sep-23 Not rated
Investment Facility (EUR 250 mn) - 184 E+1.00% Dec-22 Not ratedBonds 2.50% SNs 2020 (EUR) - SFBV3 - 400 2.50% May-20 4 BBB-/Baa3/BBB-
3.50% SNs 2022 (EUR) - SFBV3 - 500 3.50% May-22 4 BBB-/Baa3/BBB-
4.75% SNs 2023 (USD) - SFBV3 600 534 4.75% May-23 4 BBB-/Baa3/BBB-1.125% SNs 2022 (EUR) - 750 1.125% Mar-22 BBB-/Baa3/BBB-
1.875% SNs 2024 (EUR) - 800 1.875% Mar-24 BBB-/Baa3/BBB-3.25% SNs 2025 (EUR) - SFBV3 - 600 3.25% May-25 BBB-/Baa3/BBB-
2.875% SNs 2027 (EUR) - 650 2.875% Mar-27 BBB-/Baa3/BBB-
Total Schaeffler Group 4,918 Ø 2.50%2
Debt instrumentNominal
(USD mn)Nominal
(EUR1 mn) Interest MaturityRating
(Fitch/Moody’s/S&P)
Loans Term loan (EUR) - 750 E+2.25% Dec-22 Not ratedRCF (EUR 250 mn) - 8 E+2.25% Dec-22 Not rated
Bonds 2.75% SSNs 2021 (EUR) - 750 2.75% Sep-21 BB+/Ba1/BB+
4.125% SSNs 2021 (USD) 500 437 4.125% Sep-21 BB+/Ba1/BB+3.25% SSNs 2023 (EUR) - 750 3.25% Sep-23 BB+/Ba1/BB+
4.50% SSNs 2023 (USD) 500 437 4.50% Sep-23 BB+/Ba1/BB+3.75% SSNs 2026 (EUR) - 750 3.75% Sep-26 BB+/Ba1/BB+
4.75% SSNs 2026 (USD) 500 437 4.75% Sep-26 BB+/Ba1/BB+
Total IHO Verwaltungs GmbH 4,318 Ø 3.49%2
IHO Verwaltungs GmbH
Schaeffler AG
IHO Beteiligungs GmbH
Continental AGSchaeffler AG
Freefloat
36.0%
INA-Holding SchaefflerGmbH & Co. KG
Freefloat
IHO Verwaltungs GmbH
54.0%75.1%24.9%
100%
100%
10.0%
55
A
B
A
B