results of the public opinion survey conducted in macedonia
TRANSCRIPT

The publication is supported by the EU.
The European Union’s “Civil Society Facility” programfor civil society organizations associations
THE CITIZENS’ OPINION OF THE POLICE
www.POINTPuLSE.NET
Results of the Public Opinion Survey Conducted in Macedonia
REPORT
September, 2017

THE CITIZENS’ OPINION OF THE POLICEResults of the Public Opinion Survey Conducted in Macedonia
PuBLISHERAnalyticaAlbert Švajcer 6, Skopje, MacedoniaTel: +389 23 151 948E-mail: [email protected]
AuTHORMagdalena Lembovska
EDITORSaša Djordjević
TRANSLATIONAlisa Koljenšić Radić
DESIGN AND LAYOuTDTP
Skopje, 2017

3
TABLE OF CONTENTSLIST OF CHARTS AND TABLES ........................................................................4
ABOuT THE SuRVEY ....................................................................................6
SuMMARY..................................................................................................7
TRuST IN INSTITuTIONS ..............................................................................8
The Police Are No Longer the First to Trust ......................................................................................................................................8
Low Levels of Trust in Judiciary ....................................................................................................................................................12
PERCEPTION OF THE POLICE .......................................................................15
Positive Attitude Toward Policewomen and Policemen ................................................................................................................15
Police Officers are Employed through Political Connections and They Protect the Interests of Political Parties .............................16
High Influence of Politicians on the Operative Work of the Police .................................................................................................19
PERCEPTION OF CORRuPTION ....................................................................21
Judiciary Is the Most Corrupt Institution ......................................................................................................................................21
Traffic Police and Minister’s Closest Associates Are the Most Corrupt Parts of the Police ...............................................................25
FIGHT AGAINST CORRuPTION .....................................................................27
Macedonian Citizens are Willing to Report Police Corruption .......................................................................................................27
The Local Police Station is the First Choice for Reporting Police Corruption ..................................................................................29
Motivating Citizens to Report Police Corruption is the Most Needed Measure ..............................................................................30
NGOs Should Collaborate with the State in the Fight against Corruption .....................................................................................32
METHODOLOGY FRAMEwORK .....................................................................34

4
LIST OF CHARTS AND TABLESChart 1: Trust in the Macedonian police .........................................................................................................................................9
Chart 2: Gender differences in the perception of the police ..........................................................................................................10
Chart 3: Age differences in the perception of the police ...............................................................................................................10
Chart 4: Ethnic differences in the perception of the police ...........................................................................................................11
Chart 5: Educational differences in the perception of the police ...................................................................................................12
Chart 6: Occupational variances in the perception of the police ...................................................................................................12
Chart 7: Territorial differences in the perception of the police ......................................................................................................13
Chart 8: Urban-rural differences in the perception of the police ...................................................................................................13
Table 1: The level of trust in Macedonian institutions ...................................................................................................................14
Chart 9: Ranking list: trust in the institutions in Macedonia .........................................................................................................15
Chart 10: Description of a female police officer (first answer) ......................................................................................................16
Chart 11: Description of a typical police officer in Macedonia (first answer).................................................................................17
Chart 12: Selection of candidates and employment in the police (multiple responses) ................................................................17
Chart 13: In whose interest the police operate the most ..............................................................................................................18
Chart 14: In whose interest the police operate the least ...............................................................................................................18
Chart 15: Age differences – In whose interest the police operate the most ..................................................................................19
Chart 16: Occupational differences - In whose interest the police operate the most ....................................................................19
Chart 17: Ethnic differences - In whose interest the police operate the most ...............................................................................20
Chart 18: Political influence on operational work of the police.....................................................................................................20
Chart 19: Ethnic differences in the perception of political influence on operational police work ..................................................21
Table 2: Prevalence of corruption in Macedonian institutions ......................................................................................................22

5
Chart 20: Perception of corruption in Macedonian institutions (3+4) ..........................................................................................23
Chart 21: Perception of corruption in Macedonian institutions (1+2) ..........................................................................................24
Chart 22: Gender differences in the perception of police corruption .............................................................................................24
Chart 23: Ethnic differences in the perception of police corruption .............................................................................................25
Chart 24: Age differences in the perception of police corruption ..................................................................................................25
Table 3: Perception of corruption in different police force units ....................................................................................................26
Chart 26: Perception of corruption in different units of the police force (3+4) .............................................................................27
Chart 27: Reporting police corruption in Macedonia ....................................................................................................................28
Chart 28: Reporting police corruption anonymously in Macedonia .............................................................................................28
Chart 29: Ethnic differences in the perceptions regarding reporting police corruption .................................................................29
Chart 30: Gender differences in perceptions regarding reporting police corruption .....................................................................29
Chart 31: Options for reporting police corruption (first answer) ..................................................................................................30
Chart 32: Options for reporting police corruption (multiple responses) .......................................................................................31
Chart 33: Most important measures for preventing police corruption ..........................................................................................31
Chart 34: Ethnic differences in the perception of the measures that are the most important for preventing police corruption ....32
Chart 35: Institution that should lead the fight against police corruption ....................................................................................33
Chart 36: The role of NGOs in the fight against corruption ............................................................................................................33
Chart 37: Ethnic differences regarding the role of NGOs in the fight against corruption ..............................................................34

6
ABOuT THE SuRVEYThe third round of the public opinion survey "The Citizens’ Opinion of the Police Force" was conduct-ed in Albania, Bosnia and Herzegovina, Montenegro, Kosovo, Macedonia and Serbia. The question-naire based on which the public opinion survey was conducted was devised by the regional network POINTPULSE to provide answers concerning the citizens’ opinion of the police. The questionnaire included six groups of questions:
1. The level of citizens’ trust and confidence in institutions;2. The perception of the police as an institution, but also of policemen and policewomen as in-
dividuals;3. The perception of corruption in the society and the police force;4. Opinions of citizens regarding the fight against corruption;5. Opinions of citizens on the work of civil society organisations;6. Demographics.
The research in Macedonia was conducted in July 2017 by IPSOS Strategic Marketing, on a represen-tative sample of 1,000 adult citizens of Macedonia. A questionnaire was used as a research instrument and interviews were conducted using the computer-assisted telephone interviewing (CATI) technique.
The report was published as part of the project titled "Western Balkans Pulse for Police Integrity and Trust", which aims to contribute to increasing the trust and confidence in the police by promoting its accountability and strengthening its integrity. For this reason, the following seven civil society organ-isations from the region came together to form the POINTPULSE network: Analytica from Skopje, Belgrade Centre for Security Policy (BCSP) and Balkan Investigative Reporting Network (BIRN) from Belgrade, Centre for Security Studies (CSS) from Sarajevo, Institute Alternative (IA) from Podgorica, Institute for Democracy and Mediation (IDM) from Tirana, and the Kosovo Centre for Security Stud-ies (KCSS) from Pristina.
The project is supported by the European Union through the programme “Civil Society Facility” un-der the Instrument for Pre-Accession Assistance (IPA). The content of this report is the sole respon-sibility of the Analytica and the views expressed in this document are not necessarily those of the European Union.
The project is supported by the European Union through the programme “Civil Society Facility” un-der the Instrument for Pre-Accession Assistance (IPA). The content of this report is the sole respon-sibility of the Analytica and the views expressed in this document are not necessarily those of the European Union.

7
SuMMARYThe police force is the second most trusted institution in Macedonia among those selected for this public opinion survey, preceded only by the education system. More than half the population (55%) show trust in the police, but almost one quarter (23%) still don’t trust it at all. The survey showed a positive perception of police officers among the population, especially when it came to policewomen. This should be taken into consideration by the Ministry of Interior when developing communication strategies for building public trust. Also, the Ministry should work harder to gain the trust of unem-ployed persons, students and young people in general, as the levels were lower in these categories.
Private sector employees exhibit the highest trust in the police, followed by those working in the pub-lic sector and the pensioners. The level of trust in the police among the ethnic Albanians has increased in 2017, which a positive trend given that it used to be much lower than that of ethnic Macedonians. Currently, there are no significant differences between these ethnic groups.
The survey showed that citizens believe that politics play an important role in police work – starting with employment practices that are viewed as dependent on the political connections of the candi-date, but also on the operational level. Citizens mainly see the police as a means for protection of the interests of political parties or other particular groups. In line with this, most of the citizens perceive a high level of influence of politicians on operative police work. Therefore, the Ministry of Interior needs to make a considerable effort to depoliticise the police and ensure the implementation of pro-fessional standards at all levels within this institution.
Even though public trust in the police is relatively high, there is also a perception of widespread cor-ruption which indicates high tolerance of corruption within the Macedonian society. Still, it is en-couraging to see that the vast majority (70%) of the citizens would be willing to report police corrup-tion even if they were required to reveal their personal data. Moreover, around half of them would change their minds and report such a case if they could do so anonymously. In addition, there is a wide consensus that motivating citizens to report corrupt police officers is the most necessary action for preventing corruption. Therefore, the stakeholders should focus on promoting the application of mechanisms for oversight and control. If citizens believed that their complaints would indeed be taken seriosly and that corrupt police officers would be held responsible for their deeds, they would be better encouraged to report cases of corruption.
Going to the local police station is the first choice for reporting police corruption, while the internal control unit – which is actually responsible for such cases – Is not a very popular choice. Still, most of the respondents think that control within the police force should be first to fight police corruption. It is also interesting to note that one quarter of the citizens would report a case of corruption to a friend working in the police force, meaning that citizens often prefer more informal channels and would rather refer to people than institutions. Therefore, all the employees within the Ministry should be trained to handle such situations. Also, it is espeically important that the staff working at local police stations is properly trained in receiving and proceeding with reports on police corruption.
8
Public trust in institutions is important for establishing their legitimacy. Given that the police force is one of the crucial institutions responsible for security and safety, which also has the “monopoly on violence”, public trust in this institution is of particular importance.
The Police Are No Longer the First to Trust
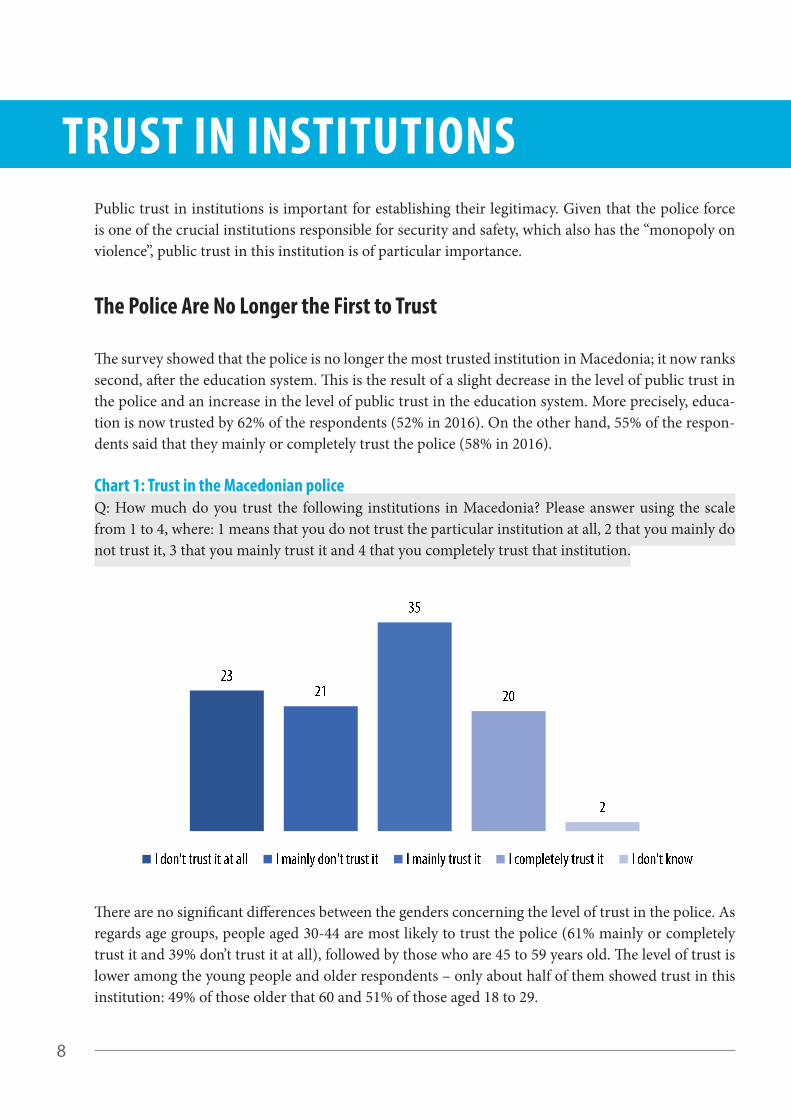
The survey showed that the police is no longer the most trusted institution in Macedonia; it now ranks second, after the education system. This is the result of a slight decrease in the level of public trust in the police and an increase in the level of public trust in the education system. More precisely, educa-tion is now trusted by 62% of the respondents (52% in 2016). On the other hand, 55% of the respon-dents said that they mainly or completely trust the police (58% in 2016).
Chart 1: Trust in the Macedonian policeQ: How much do you trust the following institutions in Macedonia? Please answer using the scale from 1 to 4, where: 1 means that you do not trust the particular institution at all, 2 that you mainly do not trust it, 3 that you mainly trust it and 4 that you completely trust that institution.
There are no significant differences between the genders concerning the level of trust in the police. As regards age groups, people aged 30-44 are most likely to trust the police (61% mainly or completely trust it and 39% don’t trust it at all), followed by those who are 45 to 59 years old. The level of trust is lower among the young people and older respondents – only about half of them showed trust in this institution: 49% of those older that 60 and 51% of those aged 18 to 29.
TRuST IN INSTITuTIONS

9
Chart 2: Gender differences in the perception of the policeQ: How much do you trust the following institutions in Macedonia? Please answer using the scale from 1 to 4, where: 1 means that you do not trust the particular institution at all, 2 that you mainly do not trust it, 3 that you mainly trust it and 4 that you completely trust that institution.
Chart 3: Age differences in the perception of the policeQ: How much do you trust the following institutions in Macedonia? Please answer using the scale from 1 to 4, where: 1 means that you do not trust the particular institution at all, 2 that you mainly do not trust it, 3 that you mainly trust it and 4 that you completely trust that institution.

10
Contrary to the previous year’s results, when the level of trust was much higher among the ethnic Macedonians than among the ethnic Albanians, there are now no significant differences between these ethnic groups. This is the result of an increase in the level of trust in the police by the ethnic Albanians and a drop in the levels of trust among the ethnic Macedonians. In 2016, 63% of the ethnic Macedonians and 41% of the ethnic Albanians responded positively, while 37% of the ethnic Mace-donians and 59% of the ethnic Albanians responded negatively. This year, the research showed a com-pletely different picture. The numbers are almost equal: 54% of the ethnic Macedonians and 54% of the ethnic Albanians say they trust the police, while 44% of the ethnic Macedonians and 46% of the ethnic Albanians say the opposite.
Chart 4: Ethnic differences in the perception of the police Q: How much do you trust the following institutions in Macedonia? Please answer using the scale from 1 to 4, where: 1 means that you do not trust the particular institution at all, 2 that you mainly do not trust it, 3 that you mainly trust it and 4 that you completely trust that institution.
People with lower levels of education trust the police more: 60% of those with unfinished elementary education responded positively, as did 51% of those with finished elementary education. When data is viewed from the standpoint of occupation, students evidently have the lowest level of trust, and more than half of them responded that they don’t trust the police (56% don’t trust it and 44% trust it). They are followed by the currently unemployed, who happen to be divided (50% don’t trust it and 50% trust it). It is important to note that almost one third of the currently unemployed persons said that they don’t trust the police at all. On the other side, the level of trust is the highest among those employed in the private sector (60% trust it and 39% don’t), next are those employed in the public sector (55% trust it and 45% don’t trust it), while the pensioners are somewhere in the middle (53% trust it and 41% don’t trust it).

11
Chart 5: Educational differences in the perception of the policeQ: How much do you trust the following institutions in Macedonia? Please answer using the scale from 1 to 4, where: 1 means that you do not trust the particular institution at all, 2 that you mainly do not trust it, 3 that you mainly trust it and 4 that you completely trust that institution.
Chart 6: Occupational variances in the perception of the policeQ: How much do you trust the following institutions in Macedonia? Please answer using the scale from 1 to 4, where: 1 means that you do not trust the particular institution at all, 2 that you mainly do not trust it, 3 that you mainly trust it and 4 that you completely trust that institution
Citizens from the Southwestern part of Macedonia have the most positive view of the police, with 57% stating that they trust this institution. They are followed by the citizens of North-West Macedonia (including Kumanovo). The respondents from Skopje and those from East and Cental Macedonia have more similar views, with approximately 52-53% of the respondents showing trust. In addition, those living in urban areas have slightly higher trust than those from the rural areas. However, the difference is very small: 55% of those in urban areas and 53% in rural areas showed trust in the police.

12
Chart 7: Territorial differences in the perception of the policeQ: How much do you trust the following institutions in Macedonia? Please answer using the scale from 1 to 4, where: 1 means that you do not trust the particular institution at all, 2 that you mainly do not trust it, 3 that you mainly trust it and 4 that you completely trust that institution.
Chart 8: urban-rural differences in the perception of the policeQ: How much do you trust the following institutions in Macedonia? Please answer using the scale from 1 to 4, where: 1 means that you do not trust the particular institution at all, 2 that you mainly do not trust it, 3 that you mainly trust it, and 4 that you completely trust that institution.
Low Levels of Trust in Judiciary
Apart from the education system and the police, which were analysed above, the only other sector that has gained the trust of more than 50% of the population is health care, which is mainly or completely trusted by 50% of the population. All the other institutions yielded less than 50% trust.

13
Table 1: The level of trust in Macedonian institutionsQ: How much do you trust the following institutions in Macedonia? Please answer using the scale from 1 to 4, where: 1 means that you do not trust the particular institution at all, 2 that you mainly do not trust it, 3 that you mainly trust it, and 4 that you completely trust that institution.
I don’t trust it at all
I mainly don’t trust it
I mainly trust it
I completely trust it Don’t know
Sum - (1+2)
Sum +(3+4)
Customs 24.8 24.7 31.6 14.5 04.5 49.5 46.0Education 16.3 19.9 34.8 27.3 01.7 36.2 62.1Healthcare 24.5 25.1 33.3 17.0 00.1 49.6 50.3Judiciary 45.8 22.0 20.3 10.1 01.7 67.8 30.4Commercial inspetorates
32.5 25.0 27.4 10.8 04.4 57.5 38.2
Police 23.3 20.7 34.6 19.9 01.5 44.0 54.5Municipal City authorities
27.0 23.4 33.1 14.9 01.5 50.5 48.0
Parliament 39.5 21.9 23.8 12.6 02.2 61.4 36.4Media 27.3 23.6 35.3 12.0 01.8 50.9 47.3NGOs 30.4 17.7 31.5 15.7 04.7 48.1 47.2Anti-corruption Agency 47.1 22.6 18.3 09.9 02.1 69.8 28.1Prosecutors 44.0 20.2 21.6 11.9 02.3 64.2 33.5
The least trusted institution is the Anti-Corruption Agency, regarding which almost 70% of the citi-zens provided a negative opinion (23% completely don’t trust it and a whopping 47% don’t trust it at all). Only 10% of those surveyed completely trust this institution, while 19% mainly trust it. Worry-ingly, judiciary and prosecution are also among the least trusted institutions: 68% negative perception and only 30% positive for the judiciary and 64% negative and 34% positive for the prosecutors. These results show that citizens don’t exhibit much trust in either the criminal justice system or the indepen-dent control mechanisms. Since these institutions are the ones that should be leading the fight against corruption, low levels of trust indicate that they have failed to establish themselves as such.
Another institution that scored negatively is the Parliament, with 61% of the population showing mistrust and only 36% responding that they mainly or completely trust it. These results were to be expected, given the political context in Macedonia. The Macedonian Parliament was not constituted for several months after the early parliamentary elections in December 2016. Also, constitution of the Parliament was conducted in a very tense atmosphere, which involved an attack on the MPs by an external crowd and problematic behaviour of the police and some other stakeholders.

14
Chart 9: Ranking list: trust in the institutions in MacedoniaQ: How much do you trust the following institutions in Macedonia? Please answer using the scale from 1 to 4, where: 1 means that you do not trust the particular institution at all, 2 that you mainly do not trust it, 3 that you mainly trust it and 4 that you completely trust that institution.

15
Positive Attitude Toward Policewomen and Policemen
Citizens normally use positive adjectives to describe female police officers. Their first that come to their minds are: goodness (12%), ‘like everybody else’ or ‘doing their job’ (7%), correctness (6%), kind-ness, culture and decency (6%), seriousness, responsibility and consciousness (5%), courage or bold-ness (4%), and finally friendliness, helpfulness or communicativeness, and ‘working in compliance with the law’ (3%). Some citizens describe them in terms of beauty, or good looks and charm (3%). If we make the calculation based on multiple answers, positive adjectives still prevail.
The only negative perception associated with female police officer is that of being not adequately fit – physically, bad equipment (4%), while other negative adjectives (such as arrogance, incorrectness, impoliteness etc.) are mentioned only rarely.
Chart 10: Description of a female police officer (first answer)Q: When you think of a female police officer, the one in direct contact with the citizens, how would you describe her? Please, state several characteristics (adjectives) that, in your opinion, best describe an average female police officer in Macedonia.
When the police officer’s gender was not specified, the first word to describe an officer was again goodness (12%), followed by ‘like everyone else/doing their job’ (8%) and kindness, culture or decency (7%). However, citizens were also using negative adjectives such as impoliteness, lack of culture and poor manners (6%) and corruptedness (3%). If we analyse the responses as multiple answers, positive adjectives still prevail.
PERCEPTION OF THE POLICE

16
Chart 11: Description of a typical police officer in Macedonia (first answer)Q: And when you think about a typical police officer in Macedoinia, police officer who is in direct contact with the citizens, how would you describe him? Please specify several attributes (adjectives, words) which, in your opinion, best describe the typical police officer in Macedonia.
Police Officers are Employed through Political Connections and They Protect the Interests of Political Parties
Almost half the population (44%) believes that police officers are selected and employed through their political connections, while 18% of the citizens think that this is done by pulling strings with friends and relatives. Only 13% of those surveyed believe that employment is gained through public competi-tions. A small number of citizens (4%) think that this is achieved by bribing someone influential. One third of the respondents said something else or refused to answer.
Chart 12: Selection of candidates and employment in the police (multiple responses)Q: In your opinion, how are the candidates for police force selected and employed?

17
Citizens agree that police force operates as a means for the protection of various groups: all 36% of them believe that the police serve to protect the interests of political parties, 22% that they protect the Government’s interests, and 15% that they operate as means for the protection of interests of the people in the highest ranks of the police force. Only a little above one quarter (27%) of those surveyed are of the opinion that the police act as a service of the citizens.
Chart 13: In whose interest the police operate the mostQ: In which of the following capacities does the police force in your country operate the most?
When asked the opposite question: “In which of the following capacities does the police force in your country operate the least”, 62% of the respondents answered that it serves the least as a service of the citizens, 15% that it operates the least as a means for the protection of interests of political parties, 11% that it protects the Governments’ interest, and 11% answered that the police operate the least as a means for the protection of interests of highest ranking police officials.
Chart 14: In whose interest the police operate the leastQ: In which of the following capacities does the police force in your country operate the least?

18
Respondents older than 60 years of age were most likely to believe that the police operate as a service to the citizens (28% provided this answer), while those aged 15 to 59 were most likely to think that the police serve as a means for the protection of interests of political parties (41%). Analysed by oc-cupation, those employed in the public sector tend to be the ones who believe that the police operate as a service to the citizens, while the currently unemployed mainly believe that the police serves the intersts of political parties (41% gave this answer).
Chart 15: Age differences – In whose interest the police operate the mostQ: In which of the following capacities does the police force in your country operate the most?
Chart 16: Occupational differences - In whose interest the police operate the most Q: In which of the following capacities does the police force in your country operate the most?
Most significant differences can be observed between the ethnic groups. Ethnic Albanians are less likely to see the police as a service of the citizens (only 17% do), and their perception is much lower than that of ethnic Macedonians, where 29% of the citizens share this view. On the other side, almost half (48%) the ethnic Albanian population sees the police as a means for protection of interests of po-litical parties. The percentage of ethnic Macedonians who gave this answer was 34%.

19
Chart 17: Ethnic differences - In whose interest the police operate the mostQ: In which of the following capacities does the police force in your country operate the most?
High Influence of Politicians on the Operative work of the Police
There is a general perception of high levels of influence of politicians on the operational work of the police force: 61% agree on this. Out of this number, 37% think that politicians’ influence is pretty high, and 25% that they completely influnce the work of the police. Also, there has been an increase com-pared to last year (55% answered using the terms ‘completely’ or ‘to a pretty high extent’). Only 12% of the respondents (compared to 16% in 2016) think that there is no ifnluence at all.
Chart 18: Political influence on operational work of the policeQ: In your opinion, to what extent do politicians have influence on operating work of police force?

20
It is interesting to note that ethnic Macedonians perceive a higher level of influence of politicians than ethnic Albanians: 41% of the ethnic Macedonians and 25% of the ethnic Albanians said that the politicians’ influence is present to a pretty high extent, while 26% ethnic Macedonians and 23% ethnic Albanians felt that they completely influence the work of the police. On the other hand, 20% of the ethnic Albanians and only 9% of the ethnic Macedonians said that there was no influence at all.
Chart 19: Ethnic differences in the perception of political influence on operational police workQ: In your opinion, to what extent do politicians have influence on operating work of police force?

21
Judiciary Is the Most Corrupt Institution
Respondents were given a list of institutions, and were asked about their opinion on how widespread corruption is in each of them. Unfortunately, citizens percieve corruption as widespread in all the in-stititutions, and every single institution scored above 50%. Non-governmental organisations (NGOs) are percieved as least corrupt: 50% of the citizens believe that corruption in NGOs is somewhat wide-spread or widespread to the highest extant, while 40% think that corruption is not widespread at all or only to a small extent.
Table 2: Prevalence of corruption in Macedonian institutionsQ: How widespread is the corruption in the following institutions? Please answer using the scale from 1 to 4, where 1 means that it is not widespread at all, 2 means that widespread to a little extent, 3 means that it is somewhat widespread, and 4 means that it is widespread to the highest extent.
Not widespread
at all
widespread to a little
extentSomewhat
widespread
widespread to the
highest extent
Don’t know Sum - (1+2) Sum + (3+4)
Customs 09.2 19.8 33.8 30.3 07.0 29.0 64.0Education 13.1 28.7 35.9 18.4 03.9 41.8 54.3Health 11.0 21.3 36.9 28.9 01.9 32.3 65.8Judiciary 07.8 17.2 28.8 41.4 04.8 25.0 70.2Commercial inspectorates
08.6 22.4 35.1 28.2 05.6 31.0 63.4
Police 08.5 23.7 33.3 29.3 05.2 32.2 62.6Municipal/City authorities
12.1 23.2 33.8 25.8 05.2 35.3 59.6
Parliament 12.6 20.7 26.3 28.8 11.6 33.3 55.1Media 10.8 22.5 35.4 25.7 05.6 33.3 61.1NGOs 15.3 25.0 26.0 23.7 10.0 40.3 49.7Anti-corruption Agency 14.5 21.5 28.9 26.3 08.7 36.0 55.2Prosecutors 11.6 17.9 29.7 35.1 05.8 29.5 64.7
Macedonian citizens perceive the judiciary to be the most corrupted institution in Macedonia. A whopping 70% of those surveyed said that corruption is somewhat widespread or widespread to the highest extent (29% said that it was somewhat widespread and 41% that it was widespread to the highest extent). On the other side, only 8% of the citizens believe that corruption within the judiciary is not widespead at all.
PERCEPTION OF CORRuPTION

22
Next on the list is the health system (66% answered that corruption is widespread somewhat or to the highest extent), followed by the Prosecutor’s Office, customs, commercial inspectorates, the police, and finally the media. All of these institutions scored above 60%. As for the rest of them (the education system, municipal/city authorities, and the Anti-Corruption agency, they are considered by 50-60% of the citizens to have corruption that is widespread somewhat or to the highest extent.
It is interesting to note that perception of corruption is very high even when it comes to institutions that enjoy higher levels of trust of the population. This means that corruption is tolerated and accepted by the citizens. Moreover, there is a high level of perceived corruption in all the institution within the criminal justice system. These results are worrysome because the judiciary, the prosecution and the police should be first in line in the fight against any form of corruption. This goes hand in hand with the very low levels of trust in the judiciary and the prosecution shown by this survey.
Chart 20: Perception of corruption in Macedonian institutions (3+4)Q: How widespread is the corruption in the following institutions? Please answer using the scale from 1 to 4, where 1 means that it is not widespread at all, 2 means that widespread to a little extent, 3 means that it is somewhat widespread, and 4 means that it is widespread to the highest extent.
As regards perception of police corruption, men are somewhat more likely to see this institution as corrupted than women (65% male and 60% female respondents answered that corruption in police is widespread somewhat or to the highest extent). Results are similar when divided along the ethnic lines – 66% of ethnic Albanians and 60% of ethnic Macedonians responded the same way.
When data are analysed by age group, young people have the highest level of perception of police cor-ruption: 70% of the repondents aged 18-29 think that corruption in the police is widespread somewhat or to the highest extent. On the other side are the elderly (60+), who see police as less corrupt: 53% of them said that corruption is widespread somewhat or to the highest extent, whereas 35% believe that corruption is not widespread at all or to a small extent. However, this is also the age group with the highest percentage of respondents who didn’t know how to answer this question. Citizens aged 30-44 and 45-59 had similar responses and their level of perceived corruption stands at about 63-64%.

23
Chart 21: Perception of corruption in Macedonian institutions (1+2)Q: How widespread is the corruption in the following institutions? Please answer using the scale from 1 to 4, where 1 means that it is not widespread at all, 2 means that widespread to a little extent, 3 means that it is somewhat widespread, and 4 means that it is widespread to the highest extent.
Citizens of Skopje have the highest level of perception of police corruption – 67% responded positive-ly, followed by the citizens of Northwestern Macedonia (including Kumanovo) where the percentage was 65. Citizens of other parts of Macedonia have mutually similar views: 59% of the population in Southwestern, Eastern and Cental Macedonia sees corruption in the police as widespread somewhat or to the highest extent.
Chart 22: Gender differences in the perception of police corruptionQ: How widespread is the corruption in the following institutions? Please answer using the scale from 1 to 4, where 1 means that it is not widespread at all, 2 means that widespread to a little extent, 3 means that it is somewhat widespread, and 4 means that it is widespread to the highest extent.

24
Chart 23: Ethnic differences in the perception of police corruption Q: How widespread is the corruption in the following institutions? Please answer using the scale from 1 to 4, where 1 means that it is not widespread at all, 2 means that widespread to a little extent, 3 means that it is somewhat widespread, and 4 means that it is widespread to the highest extent.
Chart 24: Age differences in the perception of police corruptionQ: How widespread is the corruption in the following institutions? Please answer using the scale from 1 to 4, where 1 means that it is not widespread at all, 2 means that widespread to a little extent, 3 means that it is somewhat widespread, and 4 means that it is widespread to the highest extent.

25
Chart 25: Geographical differences in the perception of police corruptionQ: How widespread is the corruption in the following institutions? Please answer using the scale from 1 to 4, where 1 means that it is not widespread at all, 2 means that widespread to a little extent, 3 means that it is somewhat widespread, and 4 means that it is widespread to the highest extent.
Traffic Police and Minister’s Closest Associates Are the Most Corrupt Parts of the Police
Those who believed that corruption in the police was widespread were also asked to assess corrup-tion in specific police force units. The most corrupt unit is considered to be the traffic police (62% widespread and 35% not widespread), but the Minister’s closest associates are viewd in the same light (61% widespread and 28% not widespread). Only 8-9% of the citizens believe that corruption is not widespread at all within these categories.
Table 3: Perception of corruption in different police force unitsQ: How widespread is corruption in the following police force units? Please use the scale from 1 to 4, where 1 stands for Not widespread at all, 2 Slightly widespread, 3 Somewhat widespread, and 4 Widespread to the highest level.
Not widespread
at all
widespread to a little
extentSomewhat
widespread
widespread to the
highest extent
Don’t know Sum - (1+2) Sum + (3+4)
Border police 09.9 24.7 36.1 21.0 08.1 34.7 57.2Special police force units
21.9 25.2 24.5 17.3 11.2 47.1 41.8
Administrative tasks (issuing personal docu-ments)
21.6 31.4 27.3 16.6 03.2 53.0 43.8
Traffic police 08.2 26.6 34.5 27.2 03.4 34.9 61.7

26
Police officers respon-sible for public law and order
15.6 30.3 30.5 18.4 05.2 45.9 49.0
Criminal police 12.7 23.6 29.6 20.9 13.1 36.4 50.5Minister's closest associates
09.1 19.3 29.9 30.6 11.1 28.4 60.5
Next is the border police, with 57% of the citizens saying that corruption in this segment is widespread and 35% stating the opposite. On the other side, the least corrupted are considered to be those respon-sible for administrative tasks (issuing personal documents): 53% of those surveyed say that corrup-tion is not widespread and 44% believe that it is. Also, special police forces are believed to be corrupt by 42% and not corrupt by 47% of the respondents. Approximately half the respondents believe that corruption is widespread both among the criminal police and the police officers responsible for public peace and order, where the latter group scored better because the percentage of those who gave the oposite answer was higher.
Still, for some of the categories, the percentage of those who did not know how to answer the question was quite high: this is especially the case with regard to the criminal police (13%), special police units (11%) and the Minister’s closest associates (11%). This was to be expected, given the nature of their work and the fact that their activities are normally not disclosed to the public.
Chart 26: Perception of corruption in different units of the police force (3+4)Q: How widespread is corruption in the following police force units? Please use the scale from 1 to 4, where 1 stands for Not widespread at all, 2 Slightly widespread, 3 Somewhat widespread, and 4 Widespread to the highest level.

27
Macedonian Citizens are willing to Report Police Corruption
A vast majority of the citizens of Macedonia are willing to report police corruption. More specifically, 71% of the citizens would report such a case (being asked for a bribe) even if they were required to reveal their personal data. Moreover, around half of those who are unwilling to report cases of corrup-tion because they don’t want their personal information known (49%) would change their minds and report such cases if they were allowed to do so anonymously. This is an encouraging finding, which should be used in the fight against police corruption. If citizens are already willing to report cases of corruption, then more efforts should be put in increasing their trust in the institutional anti-corrup-tion mechanisms. If a citizen believes that a reported case is going to be resolved by the institutions, s/he becomes an important ally in identifying corrupt police officers.
Chart 27: Reporting police corruption in MacedoniaQ: Would you report a case of corruption in the police force (being asked for bribe), if you were required to reveal your personal data (personal identification number, address etc.)?
Chart 28: Reporting police corruption anonymously in Macedonia Q: Would you report a case of corruption in the police force if you were not required to reveal your personal data?
FIGHT AGAINST CORRuPTION

28
However, there are significant differences along the ethnic lines when it comes to willingness to report police corruption. While 76% of the ethnic Macedonians said that they would indeed report such cases, the same answer was given by only 58% of the ethnic Albanians answered. While the latter percentage is high, it nevertheless lags behind the national average. Additionally, there is a decrease in the willingness of ethnic Albanians to report police corruption in comparison with the previous year (2016), when 69% of them were willing to report it.
Also, there are some slight differences between the genders in regard to this question; women are more willing to report cases of police corruption (being asked for a bribe) than men.
Chart 29: Ethnic differences in the perceptions regarding reporting police corruptionQ: Would you report a case of corruption in the police force (being asked for bribe), if you were required to reveal your personal data (personal identification number, address etc.)?
Chart 30: Gender differences in perceptions regarding reporting police corruptionQ: Would you report a case of corruption in the police force (being asked for bribe), if you were required to reveal your personal data (personal identification number, address etc.)?

29
The Local Police Station is the First Choice for Reporting Police Corruption
The local police station is the first address of choice for one third of the citizens that are willing the report cases of police corruption.. Others are divided between: the Anti-Corruption Agency (15%), the police station chief (15%), internal police control (13%) and a friend working in the police force (12%). Some of the citizens would go to the media first (7%), and a few would report such a case to an NGO (3%).
In addition to their first choice, the participants in the survey were asked to also name other insti-tutions to which they would report a case of police corruption. Police stations were again the most popular choice, as they were mentioned by half (50%) of the respondents. Next was the police station chief (37%), which suggests that citizens would go to the police station first, but would specifically ask to talk to the chief in order to report their case. Therefore, the MoI should develop clear guidance for police stations and organise training for their staff on how to handle such situations.
The internal control unit, which is actually responsible for fighting police corruption, is not a very popular choice. Only one quarter (26%) of the citizens would choose this unit to report a case of corruption in the police. Also, the percentage of respondents who mentioned this unit is now even smaller than last year (in 2016 it was 32%). This means that additional efforts are needed to promote the work of this internal control body, but also to increase its effectiveness and efficiency in order to gain the citizens’ trust.
It is also interesting to note that one quarter of the respondents would report such a case to a friend who works in the police force. This suggests that citizens sometimes prefer more informal channels, and they they would rather turn to people than institutions. Therefore, the MoI should make sure that its employees are well aware of the institutional mechanisms for fighting police corruption, and should act as promoters of these mechanisms in their community.
Chart 31: Options for reporting police corruption (first answer) Q: Who would be the first in the list that you would report a case of corruption in the police force to? Who else?

30
Chart 32: Options for reporting police corruption (multiple responses) Q: Who would be the first in the list that you would report a case of corruption in the police force to? Who else?
Motivating Citizens to Report Police Corruption is the Most Needed Measure
People believe that motivating citizens to report police corruption is the measure that is most nec-essary for preventing corruption in the police force. The same response was provided by 25% of the respondents. Increasing police officers’ salaries as the most important measure comes to mind first in 14% of those surveyed, while 13% demand additional sanctions for corrupt police force officials. The solution, according to 10% of them, lies in the establishment of a new agency for prevention of cor-ruption in the police force, while others are divided between the strict sanctioning of offenders (9%), political will of the Minister and the police management to solve the problem (8%), strengthening the powers of internal police control, stronger stimulation of police officers to report cases of corruption (6%) and other solutions.
Chart 33: Most important measures for preventing police corruptionQ: What do you consider most necessary for preventing corruption in the police force?

31
Some differences have been noted in the perceptions of respondents based on their ethnicity. Apart from the fact that motivation of citizens to report police corruption is the most popular choice of eth-nic Macedonians (25%), they are also more likely to demand additional sanctions for corrupt police force officials (15% of ethnic Macedonians as opposed to 7% of ethnic Albanians) and strict punishing of offenders (11% of ethnic Macedonians as opposed to 8% of ethnic Albanians). On the other side, ethnic Albanians opt for increasing police officers’ salaries (25% of ethnic Albanians compared to 9% of ethnic Macedonians), but also for the establishment of a new agency for prevention of corruption in the police (18% of ethnic Albanians sompared to 7% of ethnic Macedonians). In other words, ethnic Macedonians tend to request additional repressive measures against the phenomenon of police cor-ruption, while ethnic Albanians opt for preventive measures.
Chart 34: Ethnic differences in the perception of the measures that are the most important for pre-venting police corruptionQ: What do you consider most necessary for preventing corruption in the police force?
The respondents were also asked to look at a list of institutions and answer which of them should be in charge of preventing corruption in the police force. Most of the citizens perceive police corruption as an issue that should be tackled internally within the police itself. Almost one quarter of the respon-dents think that this is primarily the role to be played by the internal police control , while 12% believe that the Minister of Interior should come first in preventing police corruption. Also, 9% of the popula-tion thinks that police officers themselves should be the ones fighting police corruption. However, the Government and the Parliament also received relatively high scores (12% suggested the Government and 9% the Parliament as the most important institutions), and so did the Anti-Corruption Agency (11%). Other answers included: the Prosecutor’s Office (6%), the international community (4%), the police union (4%), NGOs (2%) or something else. Director of Police force is the last instance that comes to citizens’ minds as an important stakeholder in the prevention of police corruption – he is viewed as most important by only 2% of the population.

32
Chart 35: Institution that should lead the fight against police corruptionQ: Please look at the following list of institutions and tell me which institution should be the first to fight corruption in the police force.
NGOs Should Collaborate with the State in the Fight against Corruption
Macedonian citizens expect NGOs to play the role of the state’s partner in the battle against corrup-tion. Namely, 42% of the repondents said that the role of NGOs in the fight against corruption should be collaboration with the state in these efforts. One fifth of the citizens want them to take active part in the fight against corruption, while 12% believe that NGOs should seek and suggest recommendations. Provision of assistance to the victims of corruption was viewed by 9% of the respondents as a proper role for the NGOs, while 7% said that they should promote ethical activities of public institutions.
Chart 36: The role of NGOs in the fight against corruptionQ: People have different opinions on the role of NGOs in the fight against corruption. Bearing this in mind, what role do you think NGOs should have in the fight against corruption?

33
No significant differences have been noted between the ethnic groups in terms of their views of the role of NGOs in the fight against corruption - 43% of ethnic Albanians and 41% of ethnic Macedo-nians believe that NGOs should fight corruption in collaboration with the stateHowever, the percent-age of ethnic Albanians that think that NGOs should take active role in the fight against corruption is higher than the percentage of ethnic Macedonians that took this view (26% of ethnic Albanians against 18% of ethnic Macedonians).
Chart 37: Ethnic differences regarding the role of NGOs in the fight against corruption Q: People have different opinions on the role of NGOs in the fight against corruption. Bearing this in mind, what role do you think NGOs should have in the fight against corruption?

34
Location MacedoniaTime July 2017Data collection method Computer assisted telephone interviewing (CATI)Sampling frame Male and female citizens of Macedonia 18 years of age and over, who
permanently resided in the territory of Macedonia at the time of the survey
Size of sample 1,000Type of sample Three-stage random representative stratified sampleStratification Performed by region, type of settlement, gender, age and level of educa-
tionSampling error ±3.31%
METHODOLOGY FRAMEwORK

www.pointpulse.nettwitter.com/POINTPULSEnet
facebook.com/POINTPULSEnet/
Civil society network dedicated to oversight of police integrity.