results of 3 layer reservoir simulation study – schaben
TRANSCRIPT
Results of 3 Layer Reservoir Simulation Study – Schaben Field, Ness County, Kansas
Saibal Bhattacharya Paul Gerlach
Open File Report – 2000-78 Kansas Geological Survey

1
Results of 3 Layer Reservoir Simulation Study – Schaben Field, Ness County, Kansas
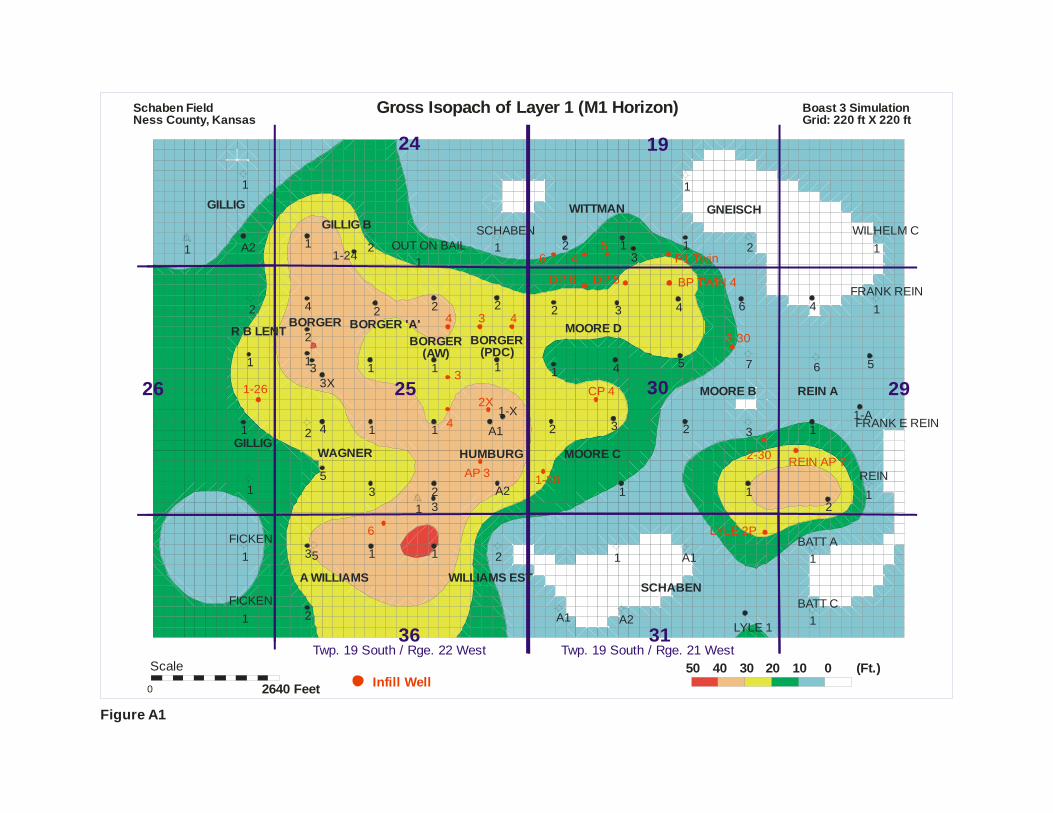
The Schaben field is located in Ness County, Kansas. A detailed reservoir characterization and simulation study was carried out in the northern part of the field under a project funded by DOE’s Class 2 program (under contract DE-FC22-93BC14987). The Schaben demonstration site consists of 1720 contiguous acres within the Schaben field and spreads over Sections 19, 29, 30, 31 and 32 in Range 21W/Township 19S and over Sections 23, 24, 25, 26, 35 and 36 in Range 22W/Township 19S (Figure A1, Appendix A). The objective of this study was to improve reservoir performance of mature oil fields, located in shallow shelf carbonate reservoirs of the Midcontinent, by demonstrating the application of cost-effective tools and techniques to characterize and simulate the reservoir. The initial study included analyses and integration of geologic data, production data, and petrophysical log and core data to develop a reservoir geomodel. This geomodel formed the basis for a two-layer reservoir simulation study using DOE’s BOAST3 simulator. Results of this study available over the Internet at http://www.kgs.ukans.edu/Class2/index.html and http://www.kgs.ukans.edu/DPA/Schaben/schabenMain.html. This initial study was followed by second simulation study (using DOE’s BOAST4 simulator) where the reservoir was described by two layers with an underlying bottom aquifer forming the third layer. Background of the simulation study A sedimentologic and diagenetic study1, using cores from the Schaben field, revealed that the reservoir-strata were deposited on a ramp. The basal stratum (MO) consists of normal to somewhat restricted marine strata. The MO stratum has an abundance of echinoderm-rich facies with a diverse fauna. The upper strata (M1) was mainly made up of sponge spicule-rich facies that contained silicified original evaporite minerals. An internal unconformity, a subaerial exposure event, separates MO strata from M1. The post Mississippian unconformity caps the entire sequence. The best reservoir was found to be the sponge spicule-rich wackestone/packstone facies (SWP) with replaced evaporites. Echinoderm-rich wacke-packstones (EWPG) were also found to form locally important reservoir facies. However, EWPG facies that are dominant in the MO unit are not likely to result in favorable reservoirs because processes associated with M1 unit lead to the occlusion of its porosity. The reservoir volume constructed for the simulation study was therefore made up of two layers, layer 1 conforming to M1 strata and layer 2 conforming to the MO strata. Within the simulation input-data, the major difference in petrophysical properties for layers 1 and 2 was in their respective net to gross ratio. The ratio-value assigned to layer 1 was 0.8 while that for layer 2 was 0.5. During the course of history matching, the net to gross
2
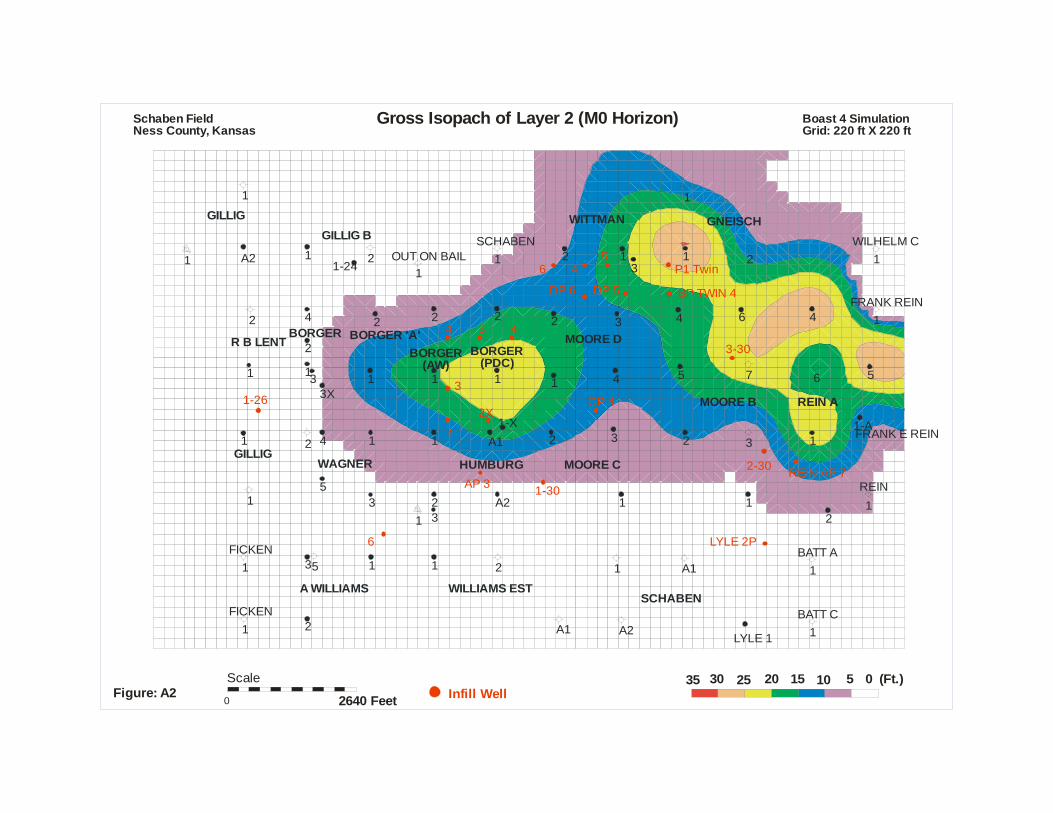
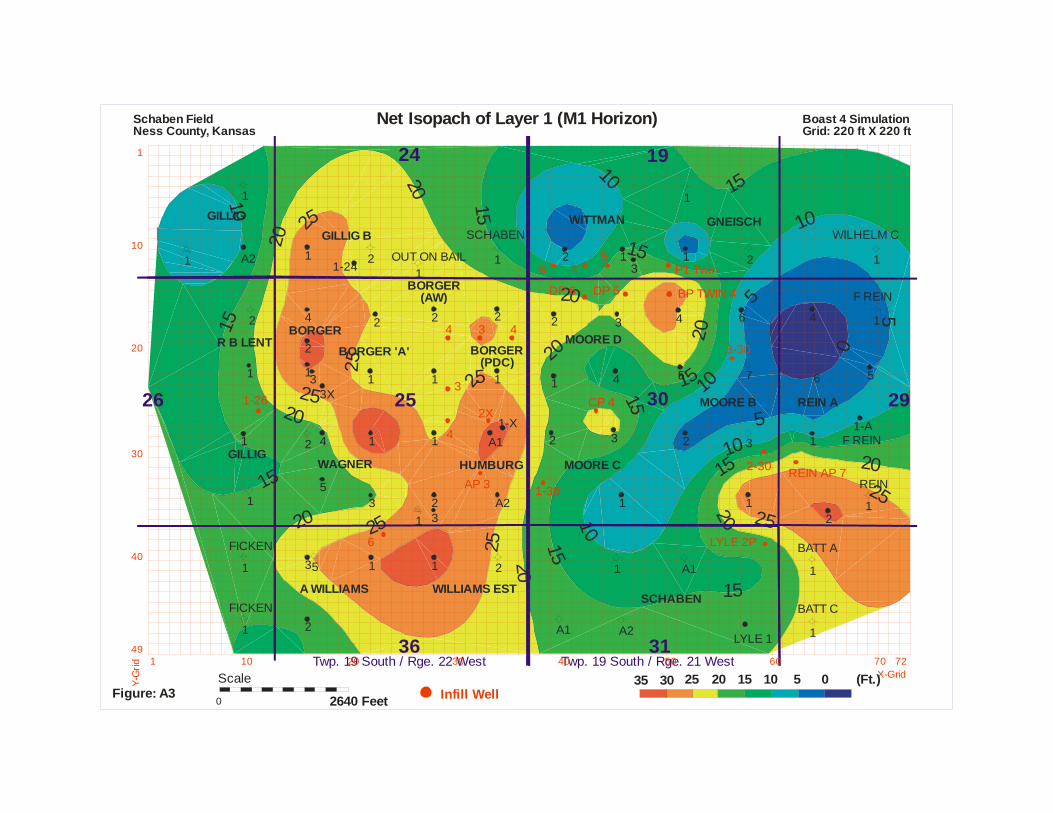
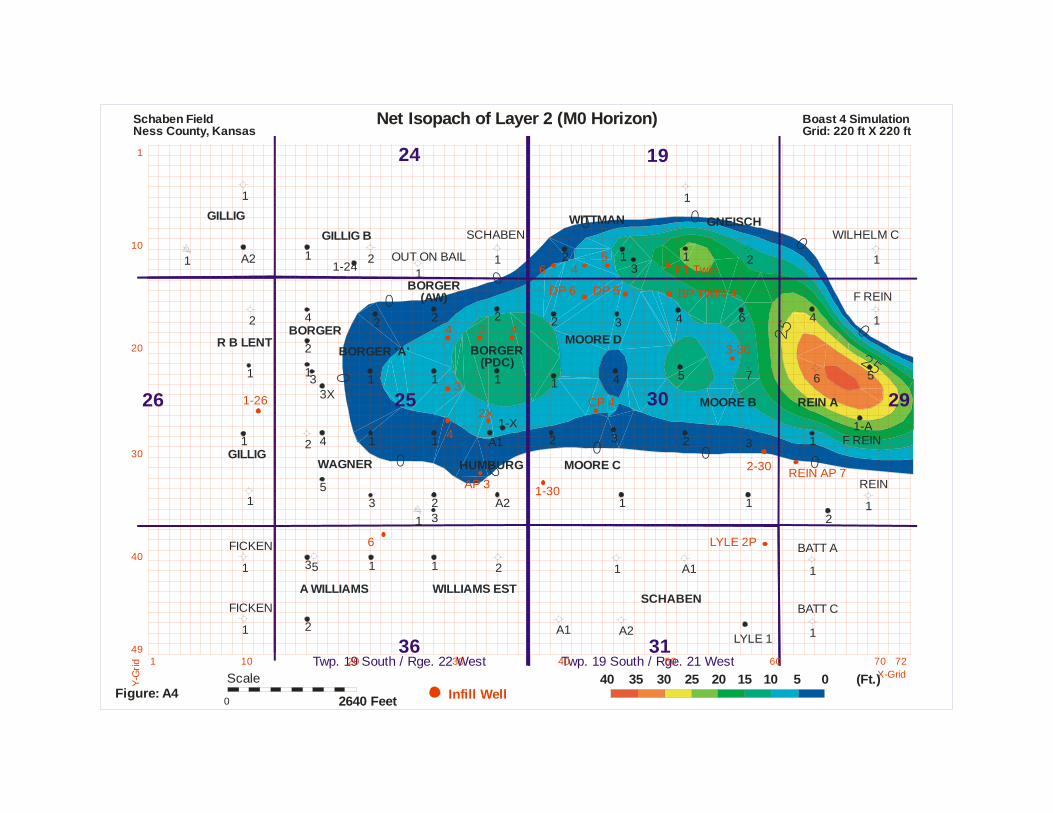
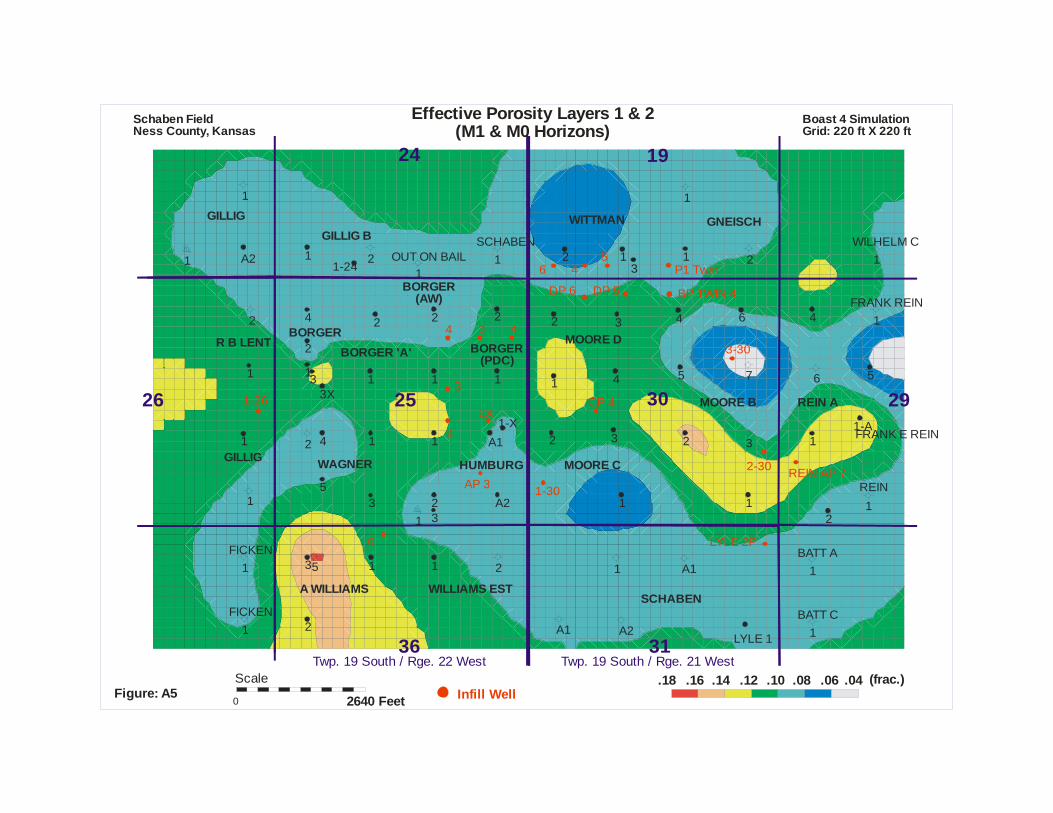
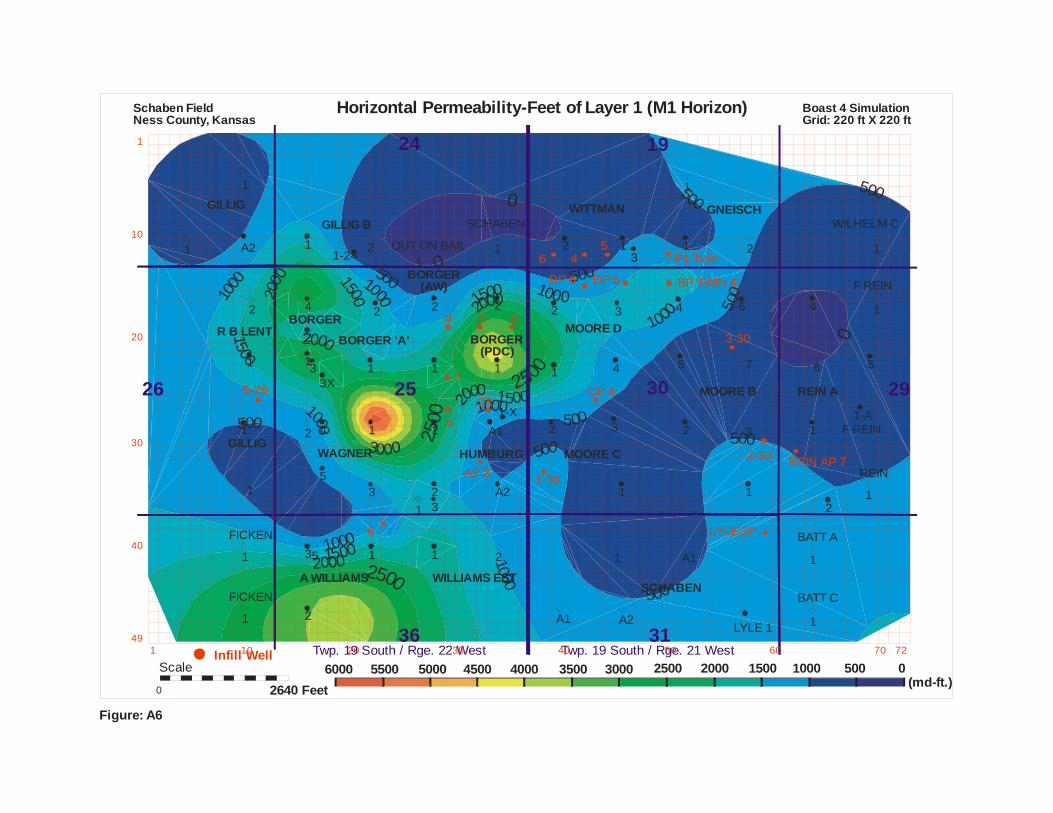
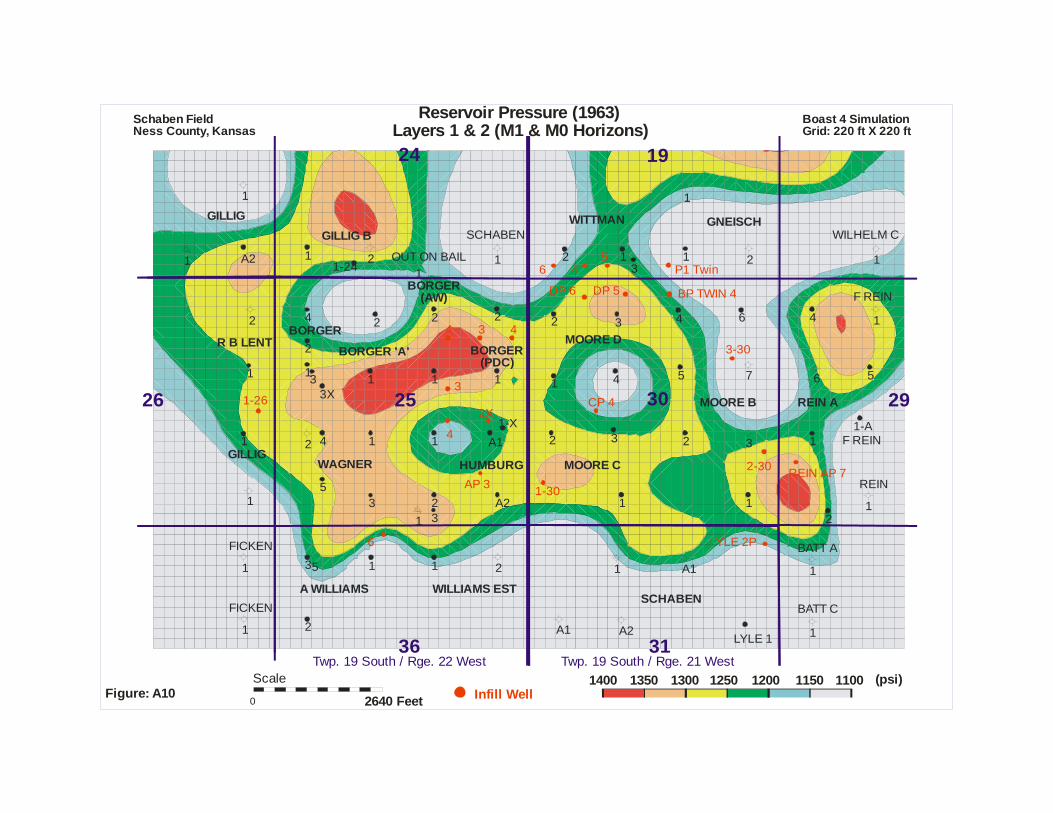
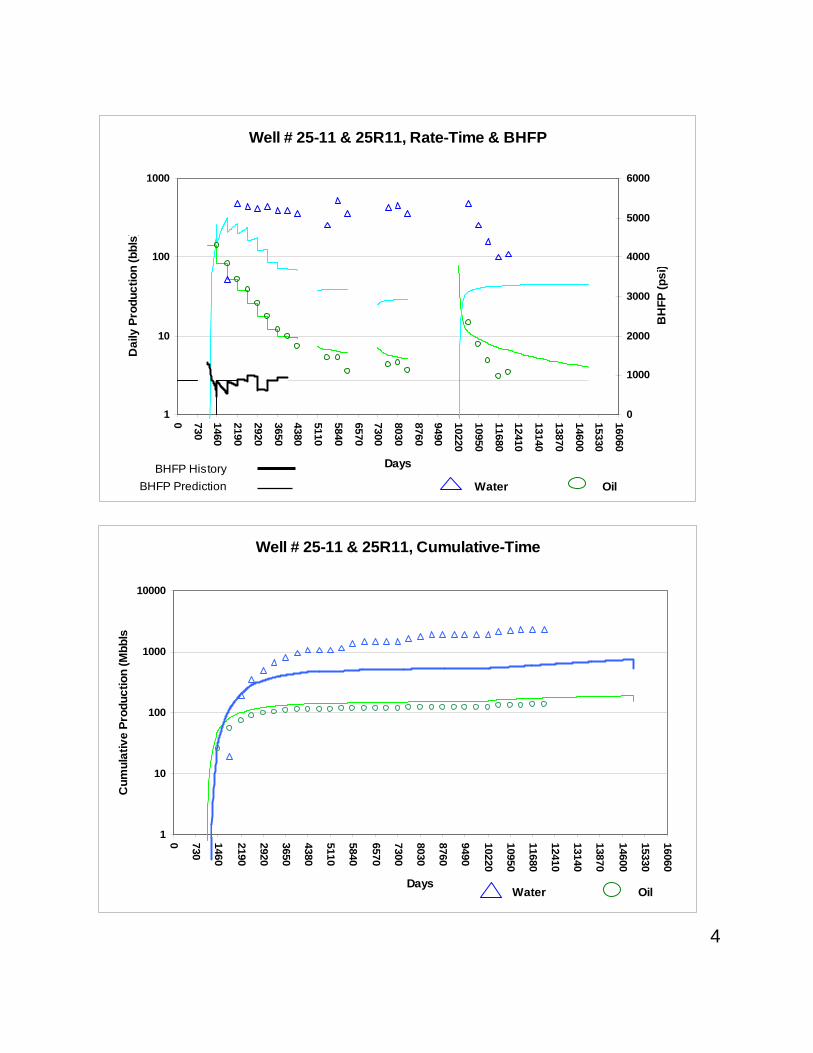
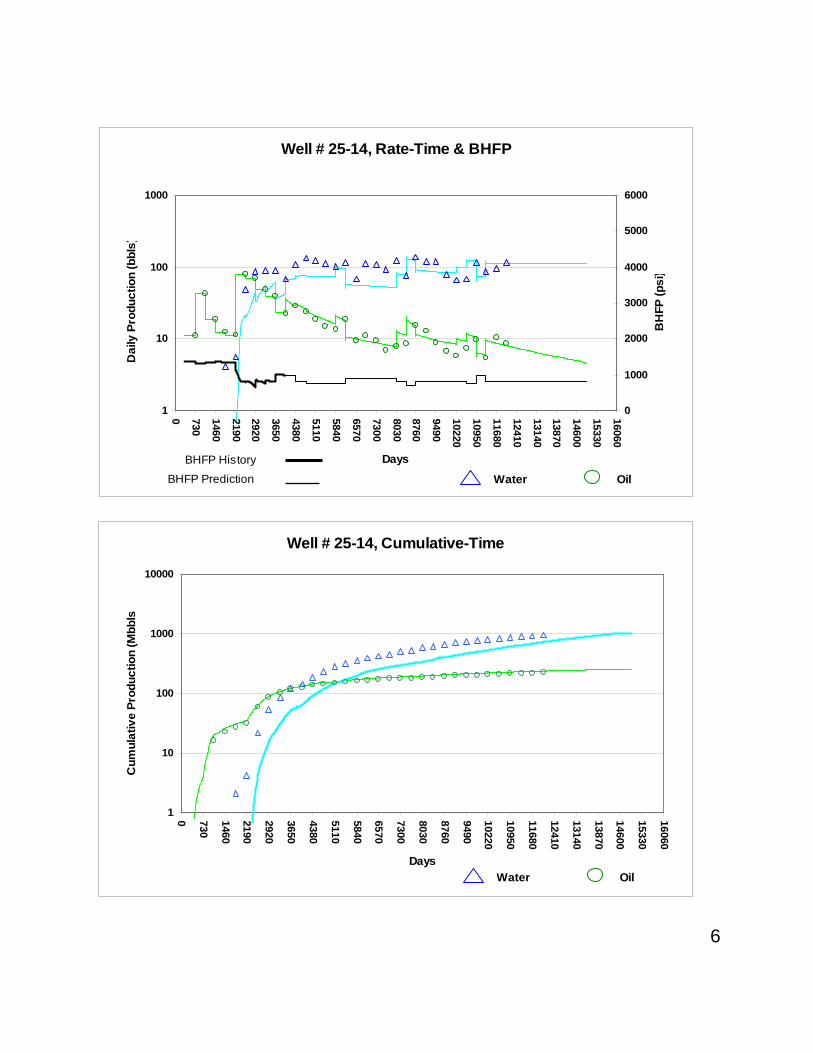
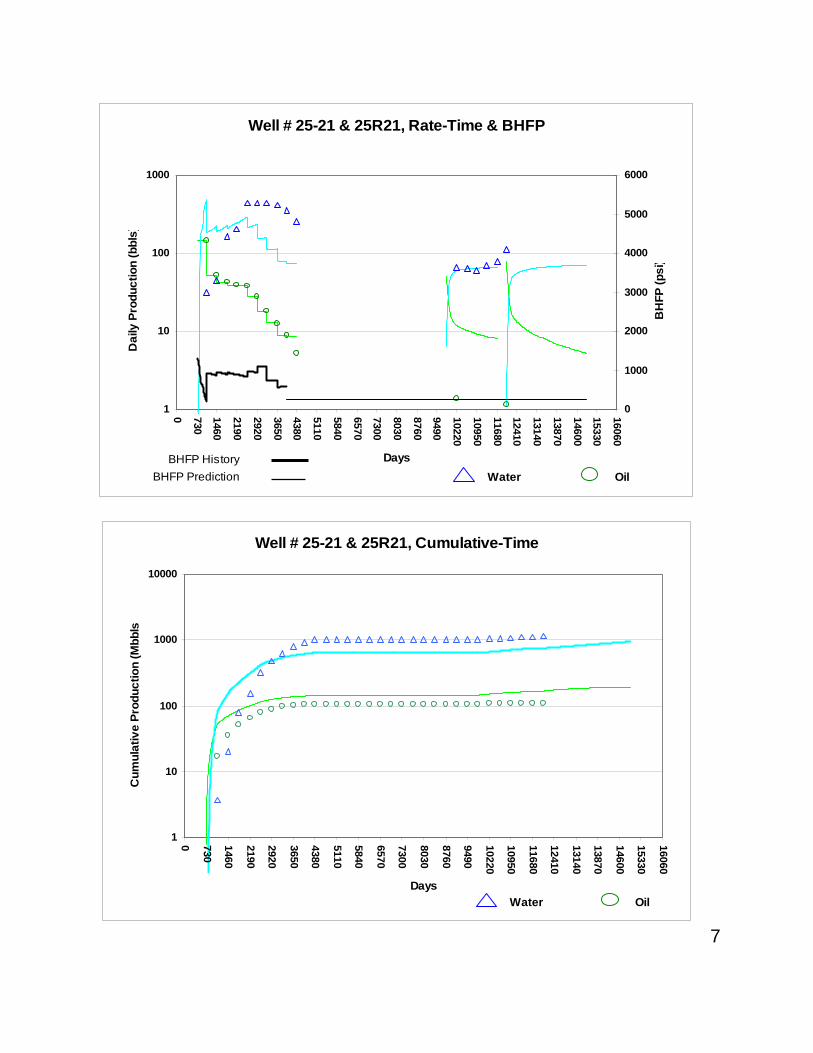
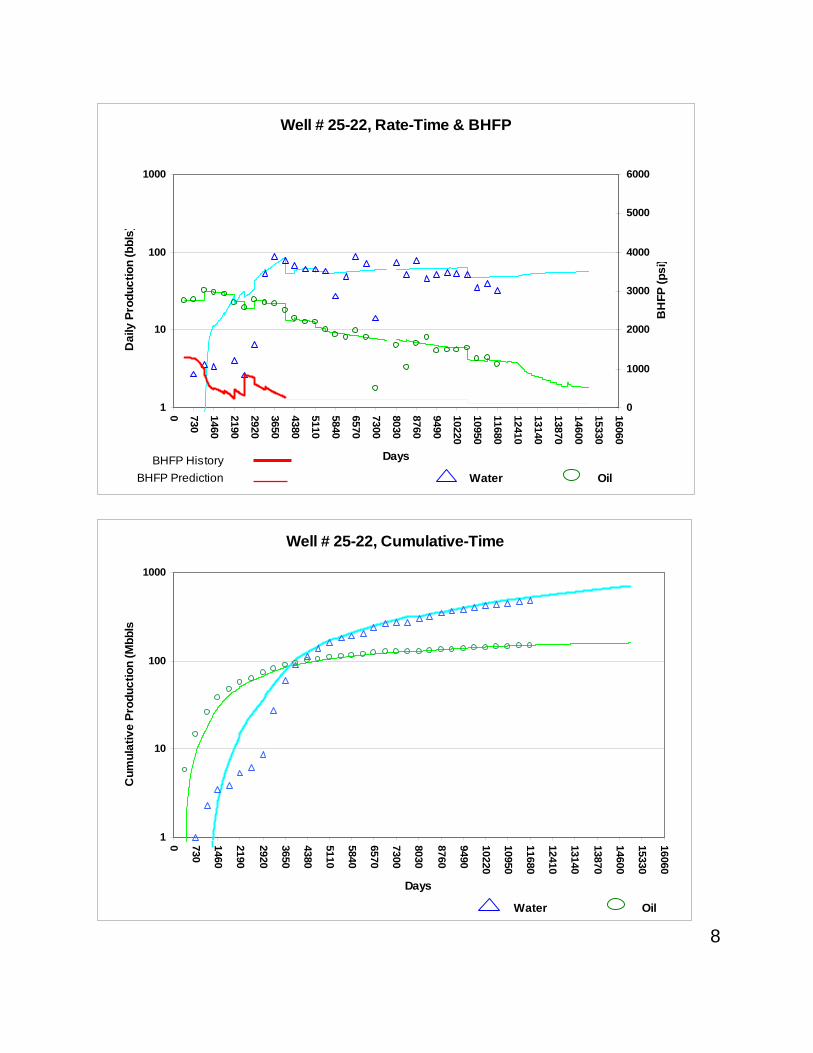
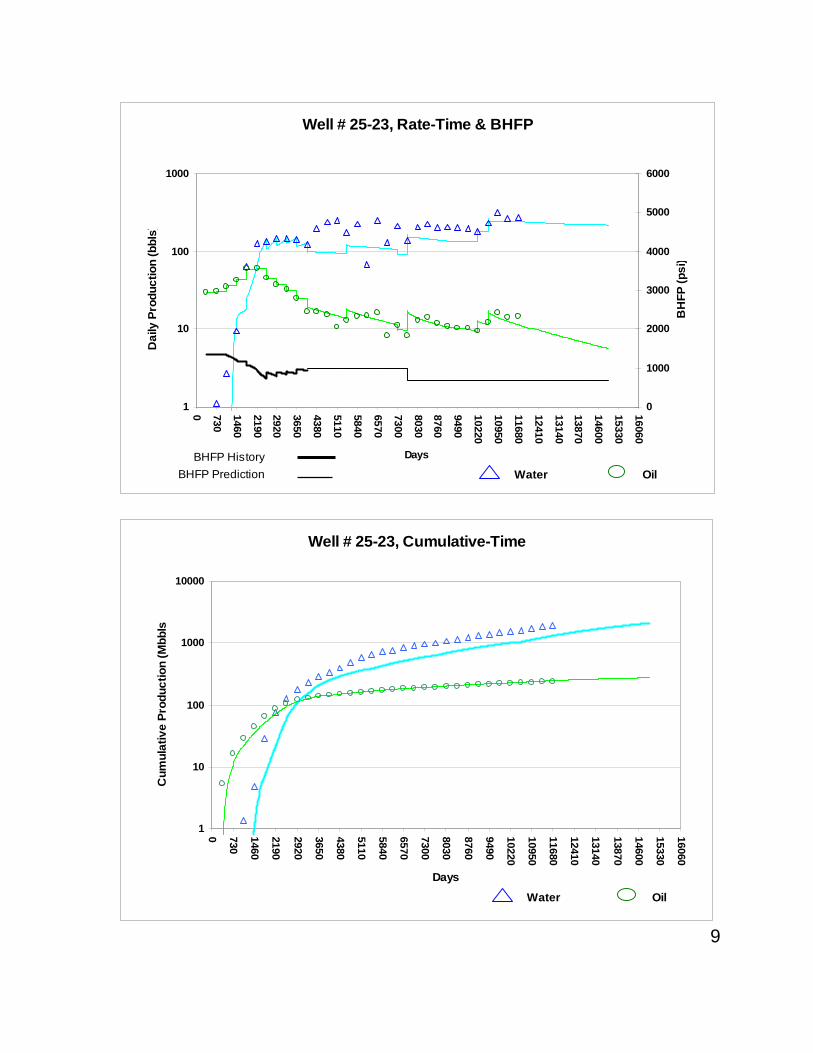
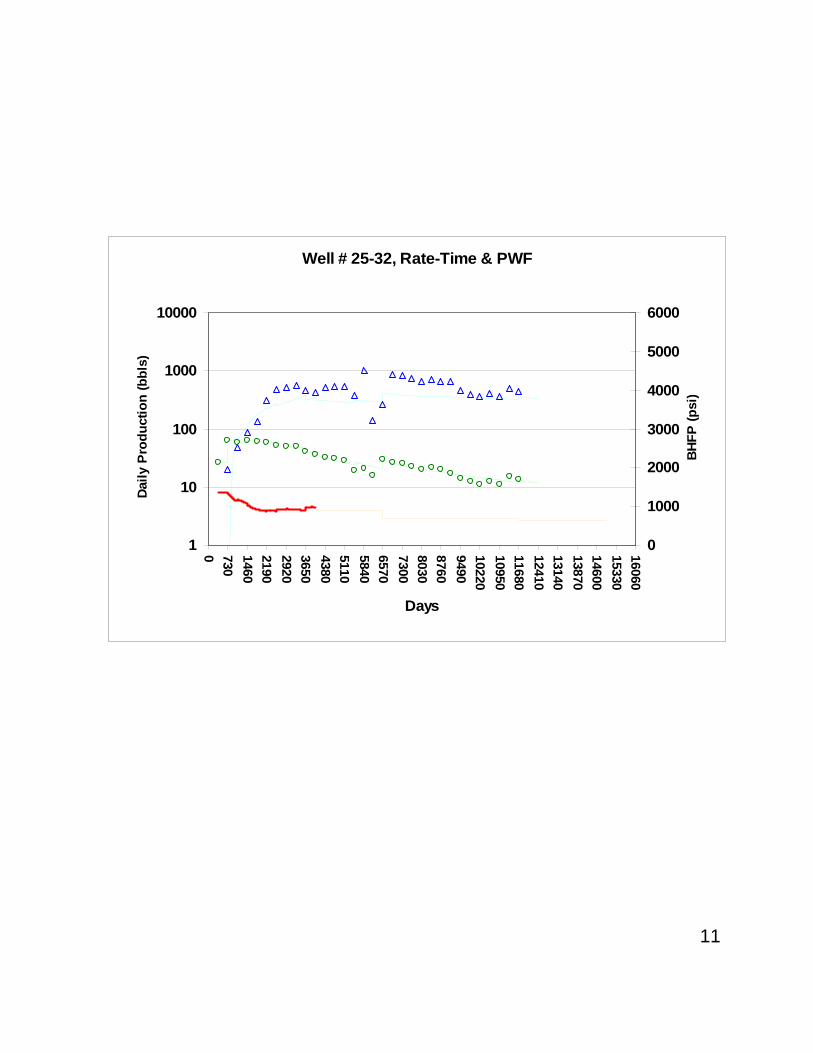
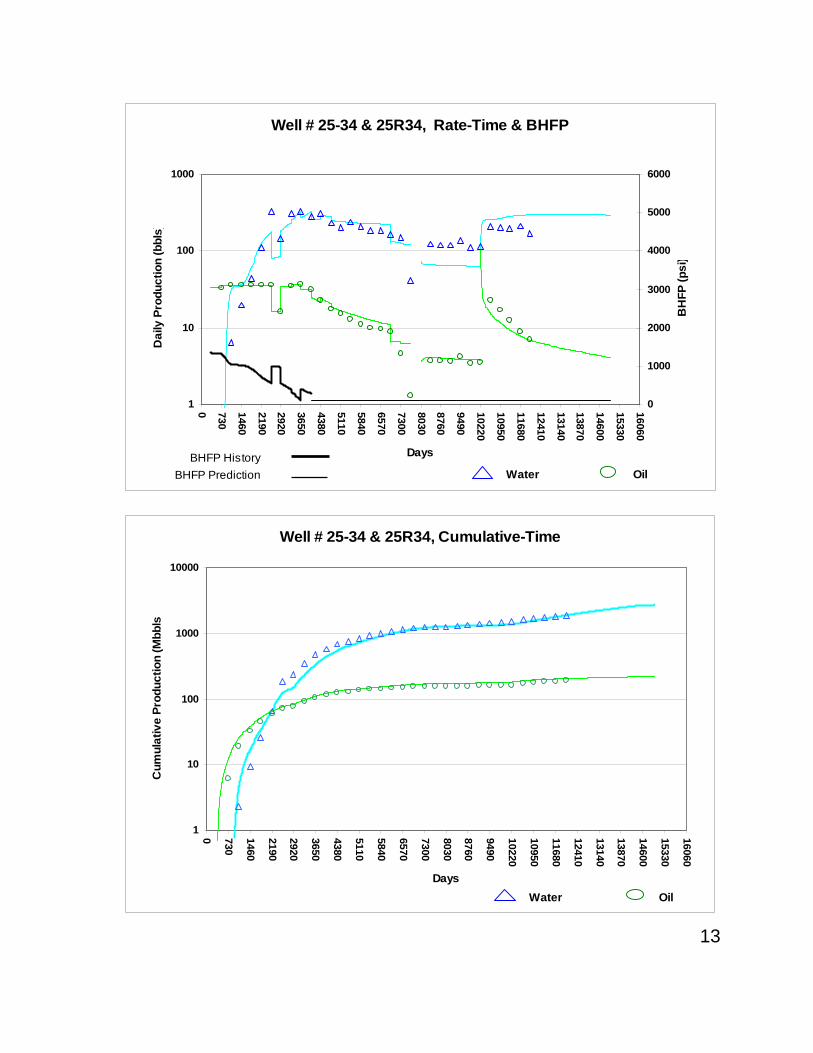
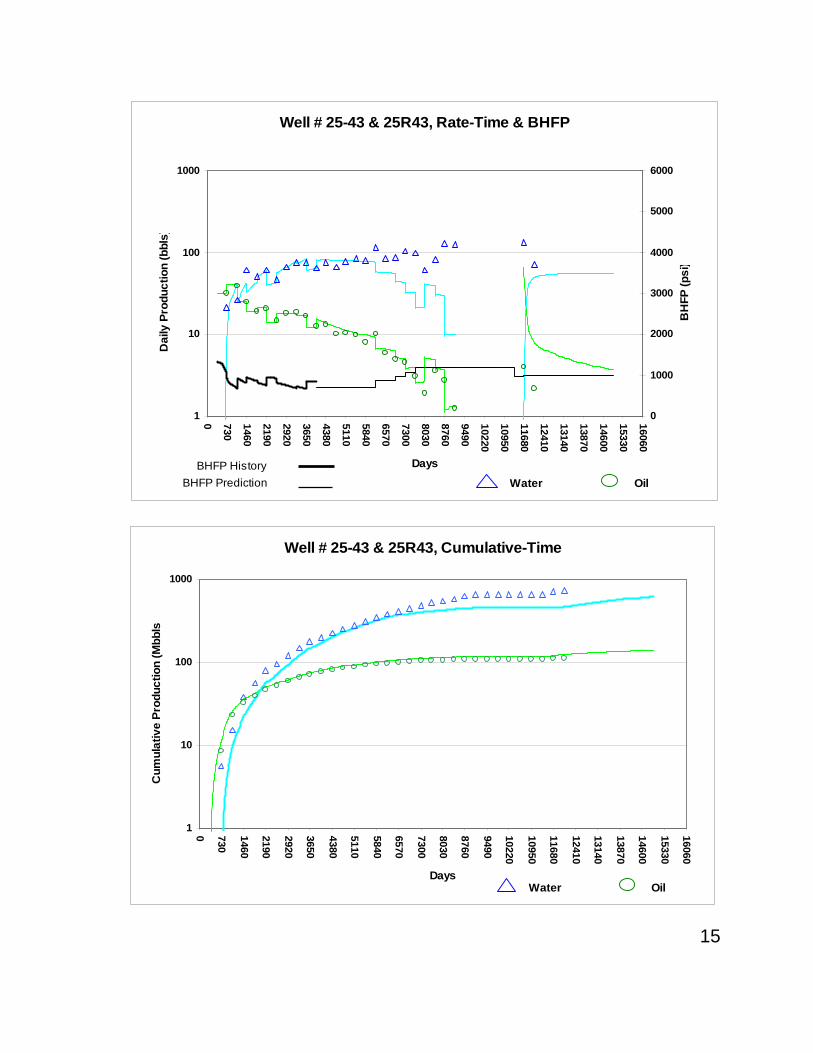
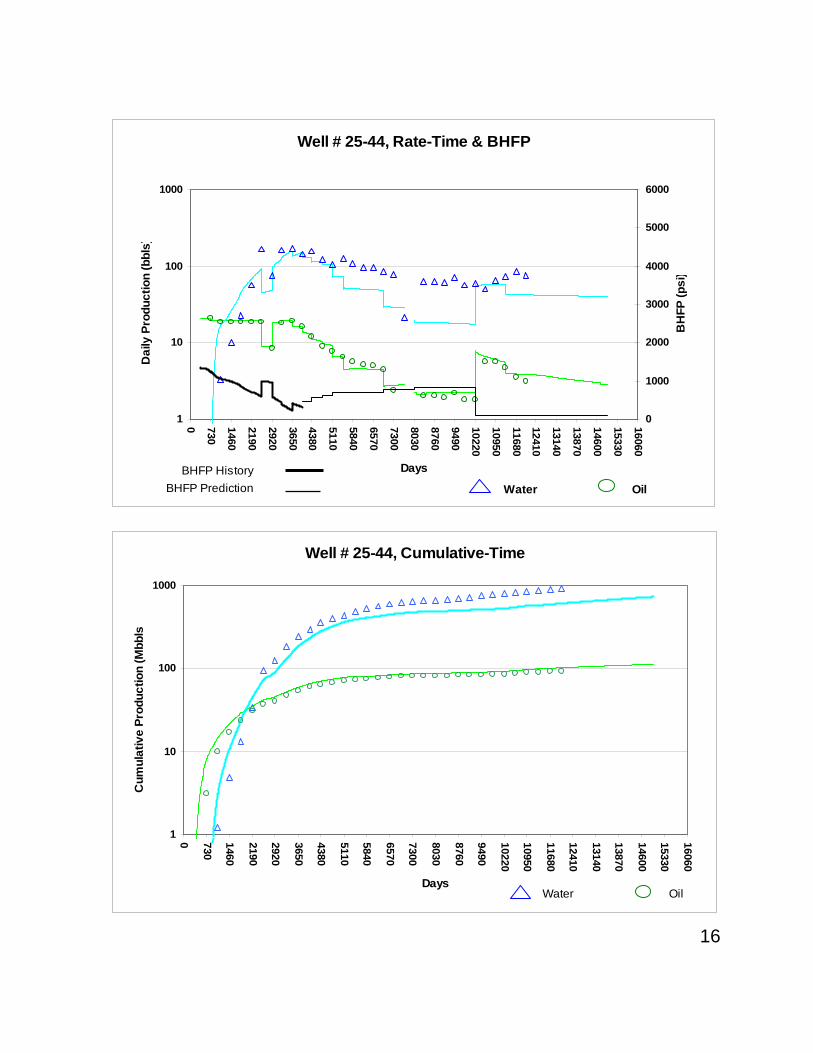
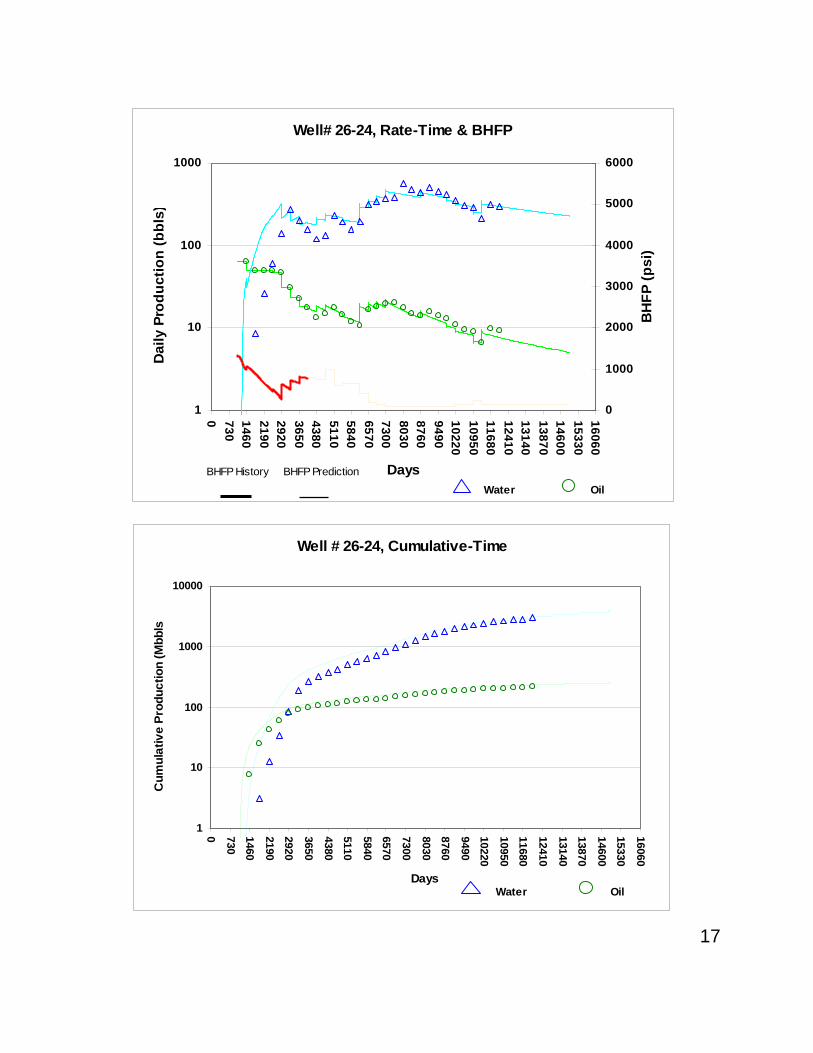
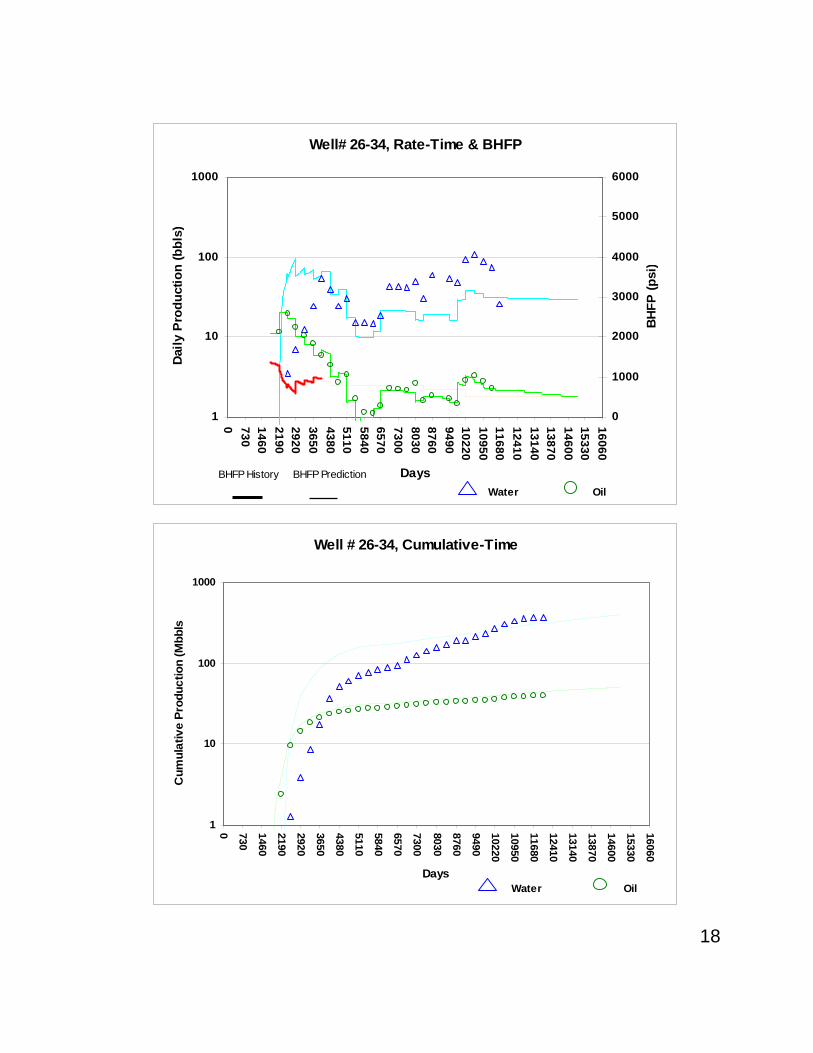
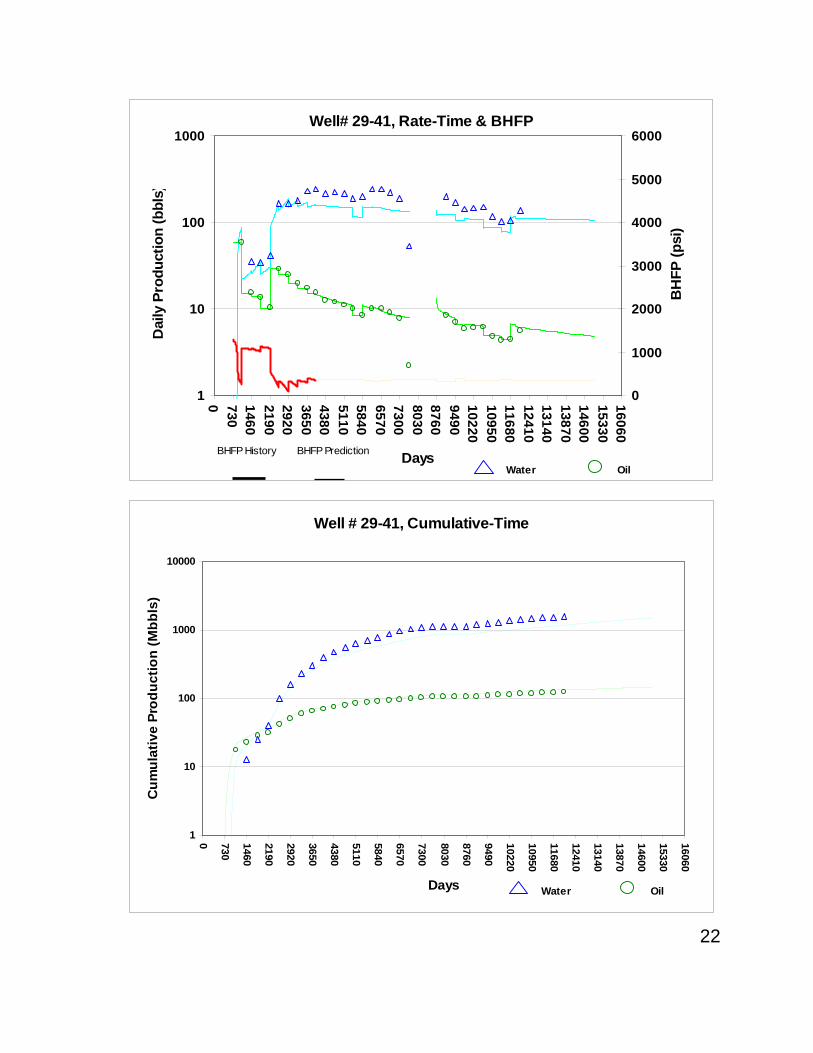
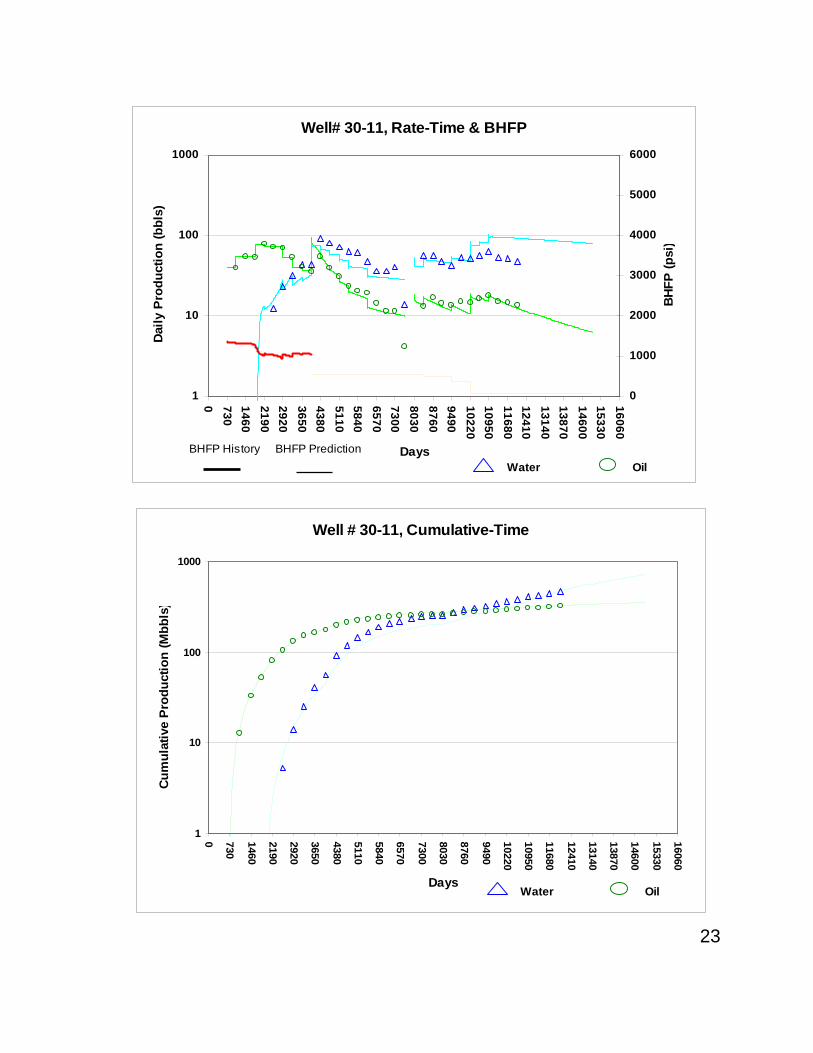
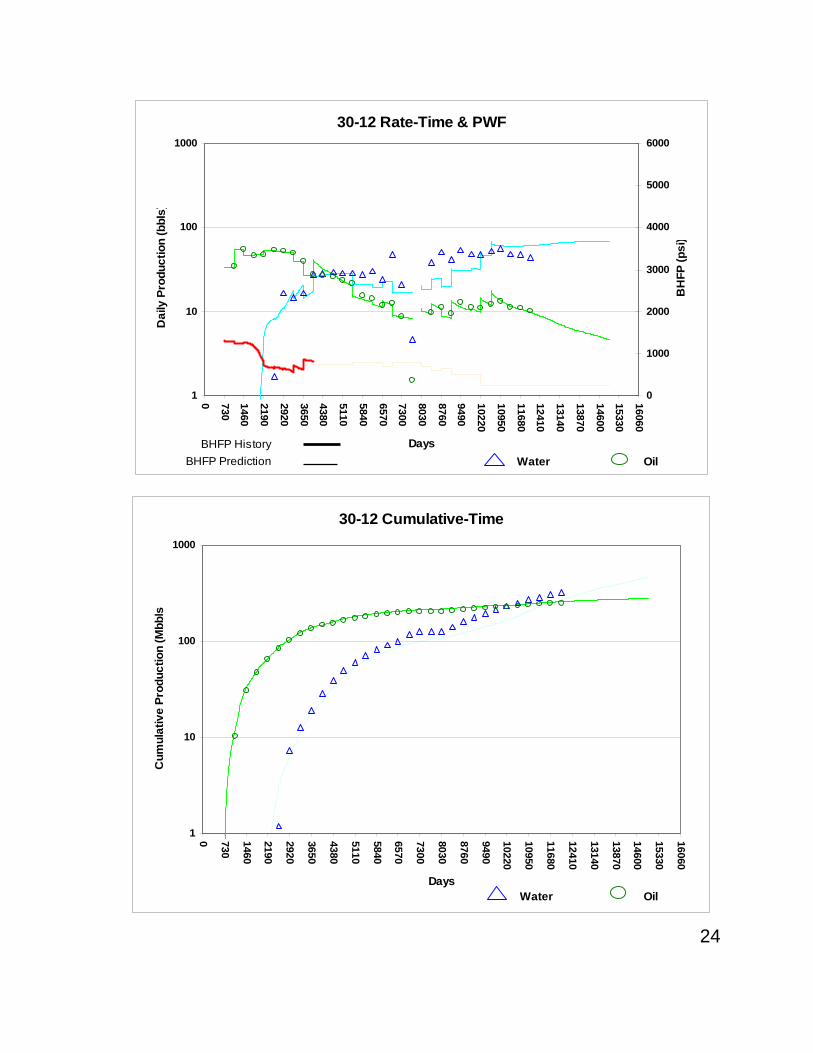
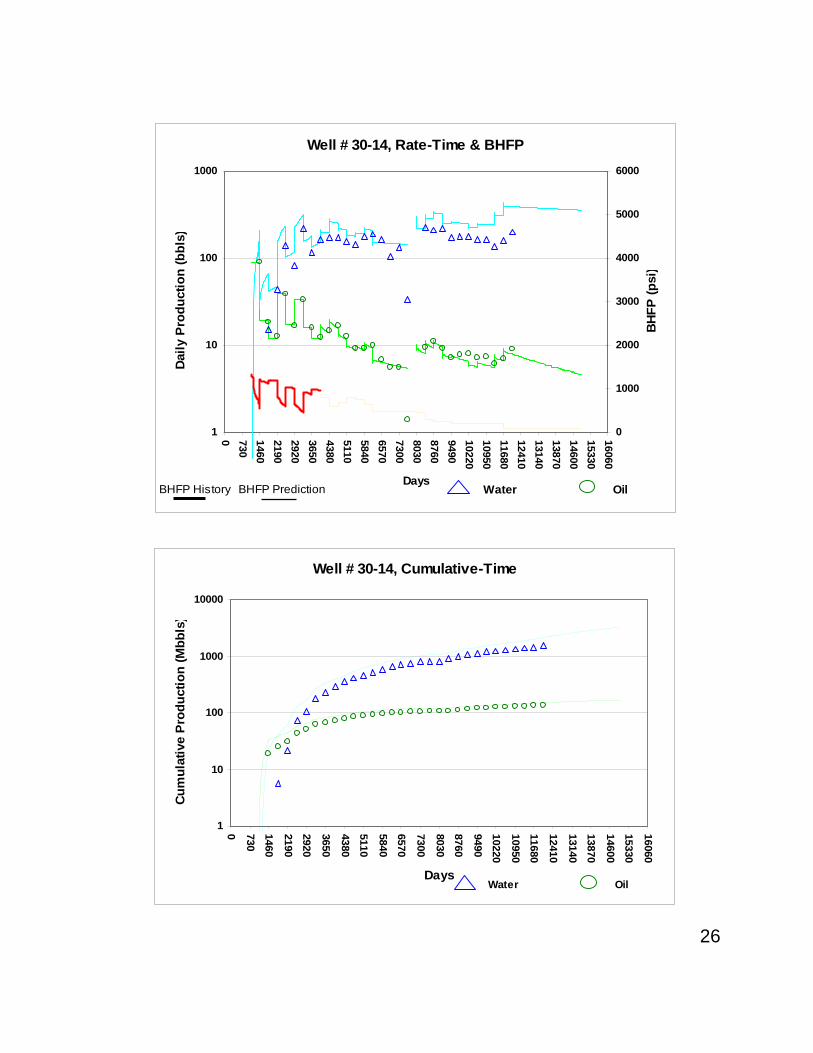
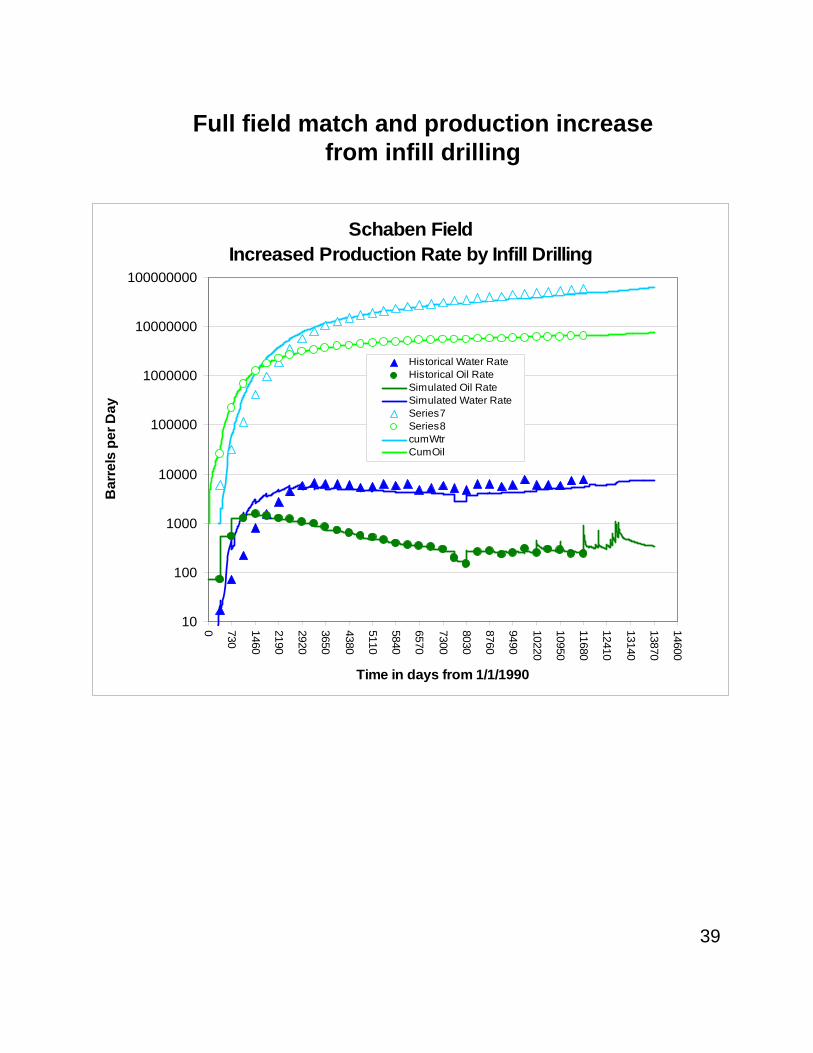
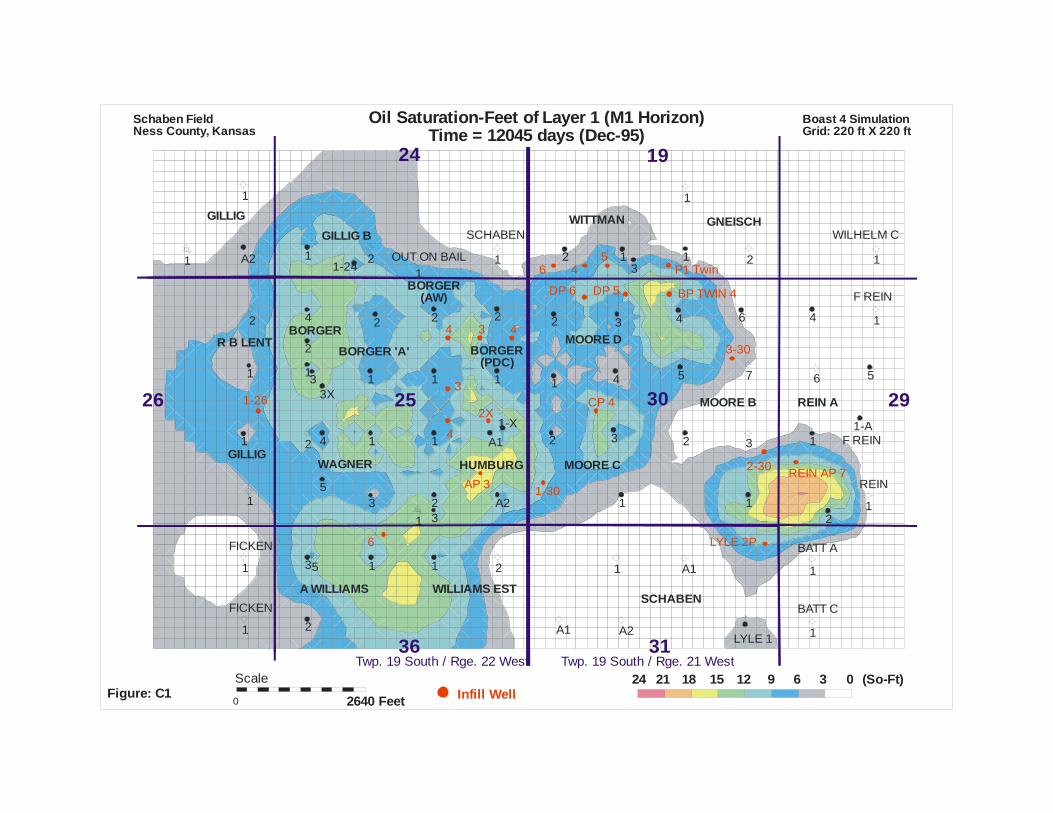
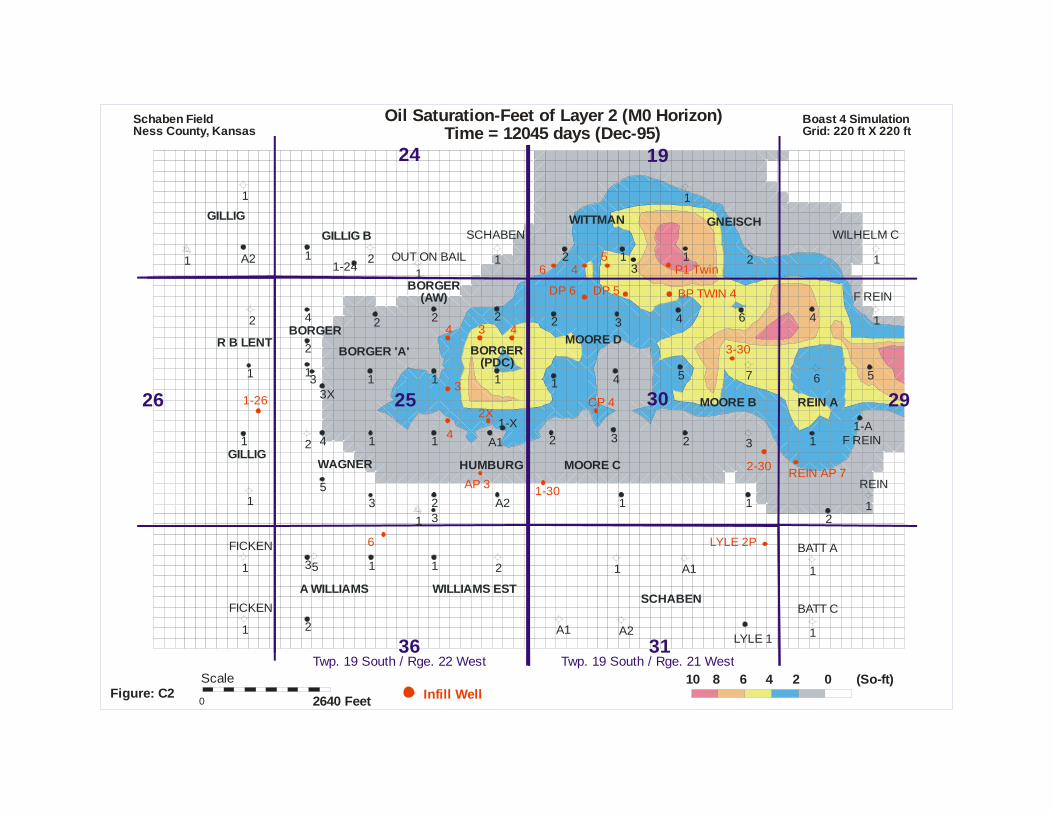
ratio for some of the wells had to be changed from this initial assumption to obtain a reasonable match with the production/pressure history. Input data Figure A1 shows the study-area (Schaben field) that was simulated in BOAST4 along with the location of the wells. The grid cell dimensions used was 220 ft by 220 ft. Table 1 shows the cell addresses related to each well within the study area and also the corresponding name given for each well to display the output results from the simulation. Appendix A contains plots showing the distribution of various gridded parameters that were used in this simulation study. Figures A1 and A2 show the gross isopachs maps of layer 1 and layer 2. Figures A3 and A4 show the final net isopach maps obtained at the end of the history matching. In the absence of additional data, the effective porosity for both M1 and MO was assumed to be the same (Figure A5). The distribution of horizontal permeability-feet for layers M1 and MO is shown in Figures A6 and A7, while the vertical permeability for these two layers are displayed in Figures A8 and A9. The distribution of initial reservoir pressure (1963) is shown in Figure A10. Initial oil saturation (1963) within the effective porosity of M1 and MO is shown in Figures A11. The PVT data, relative permeability and capillary pressure data and the well data entered into the input file were the same as used in the two layer simulation study2 in BOAST3. Results of history matching Appendix B shows the results of the history match that was obtained at each well. The oil production at each well was entered into the simulator for the first 11 years and the simulator calculated the corresponding water production during this time and also calculated the corresponding bottom hole pressure. This calculated bottom hole pressure, at the end of the 11th year, was input for each well for the simulator to calculate both the oil and water production during the remaining period of the production life of each well (till December 1995). Current fluid level data was available for most wells and was used to calculate the current bottom hole pressure. In the absence of a recorded history of pressure measurements, the bottom pressure was varied between that at the end of the 11th year and the current pressure to attaining a history match at each well. Appendix C consists of maps showing the distribution of remaining potential in Schaben field as of 1995. Figures C1 and C2 show the residual oil saturation (December 1995), obtained from the simulation output after the history match at the well level, in M1 and MO. Figure C3 maps the remaining areas with the best potential, as of December 1995, for infill drilling in the Schaben field. The areas shown in color on the map have remaining oil saturation of at least 40% and a net pay greater than 20 feet. Based on the remaining potential map, the various operators of the Schaben field drilled 22 infill wells between 1996 and 1998.

3
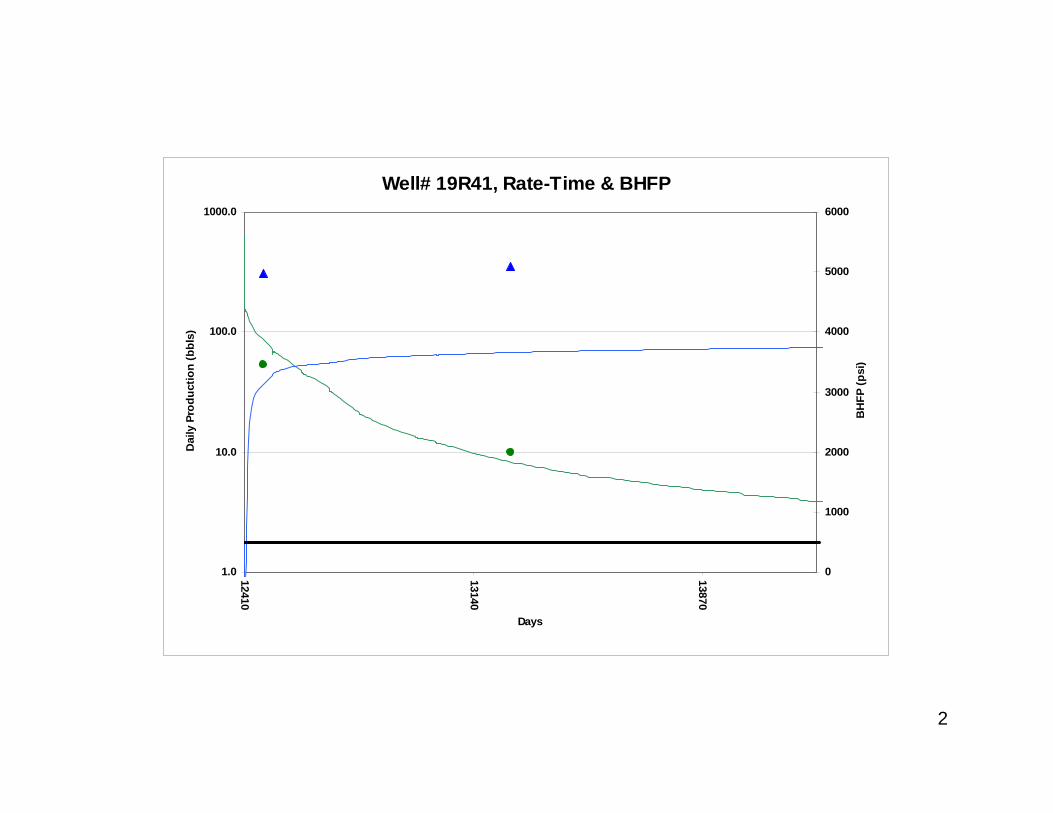
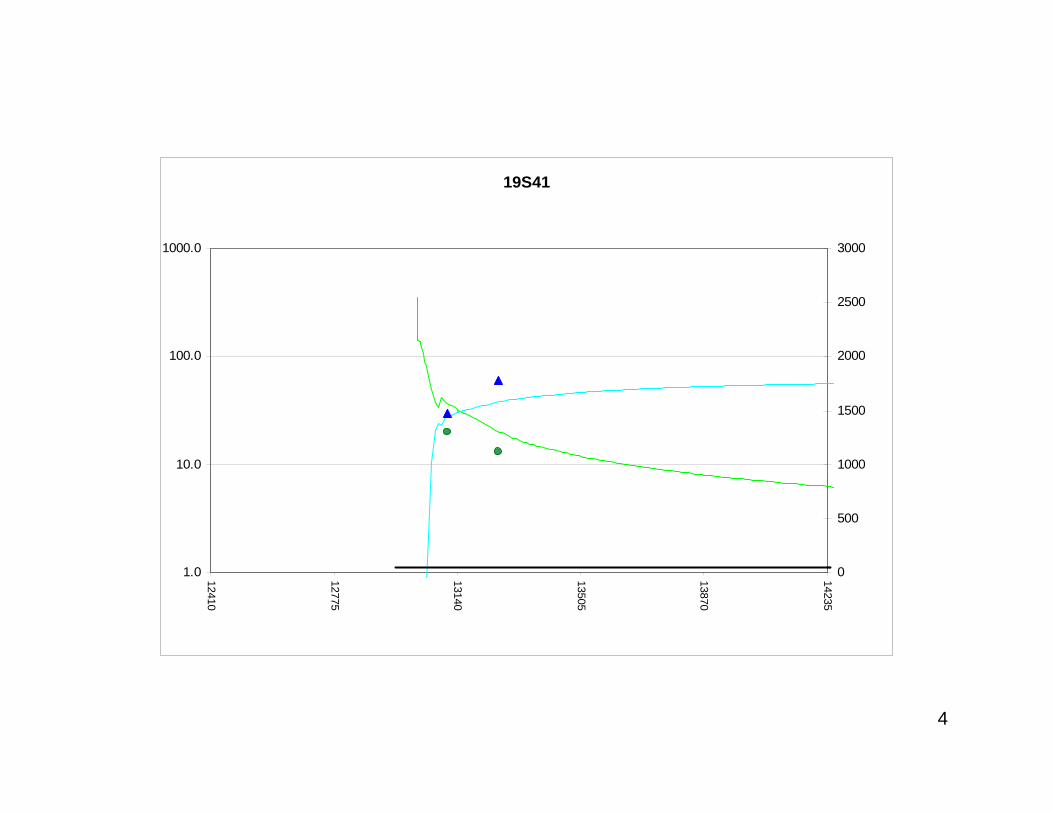
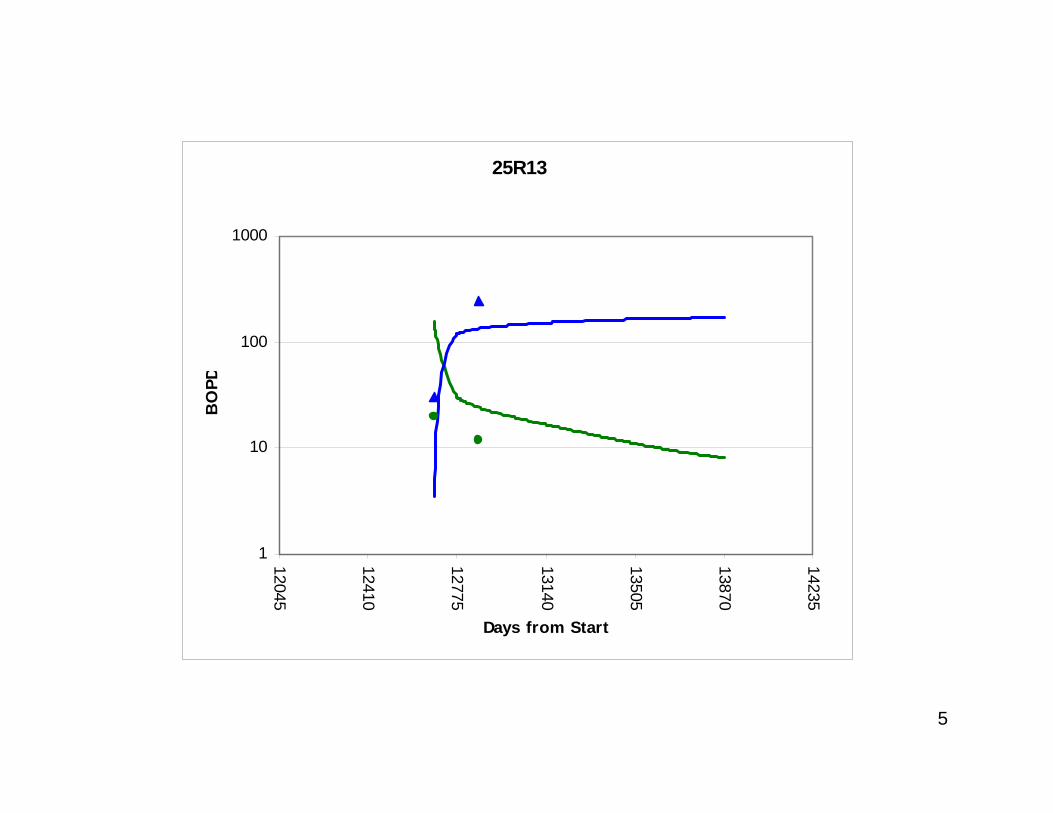
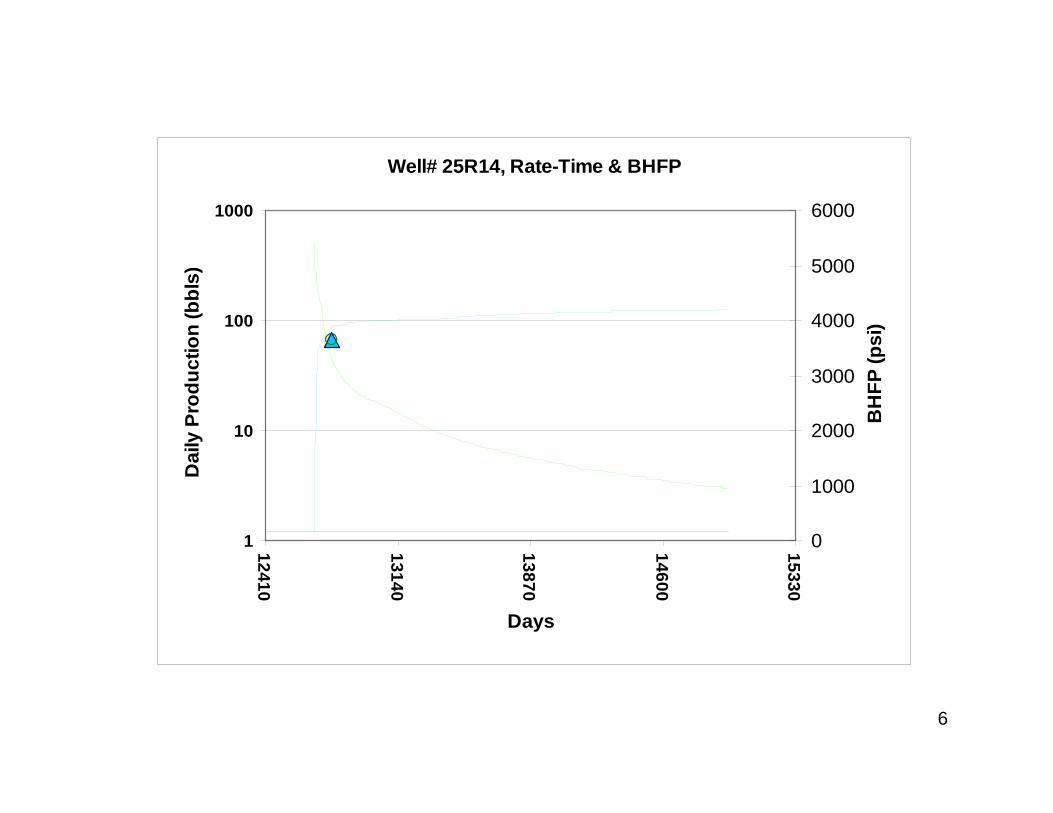
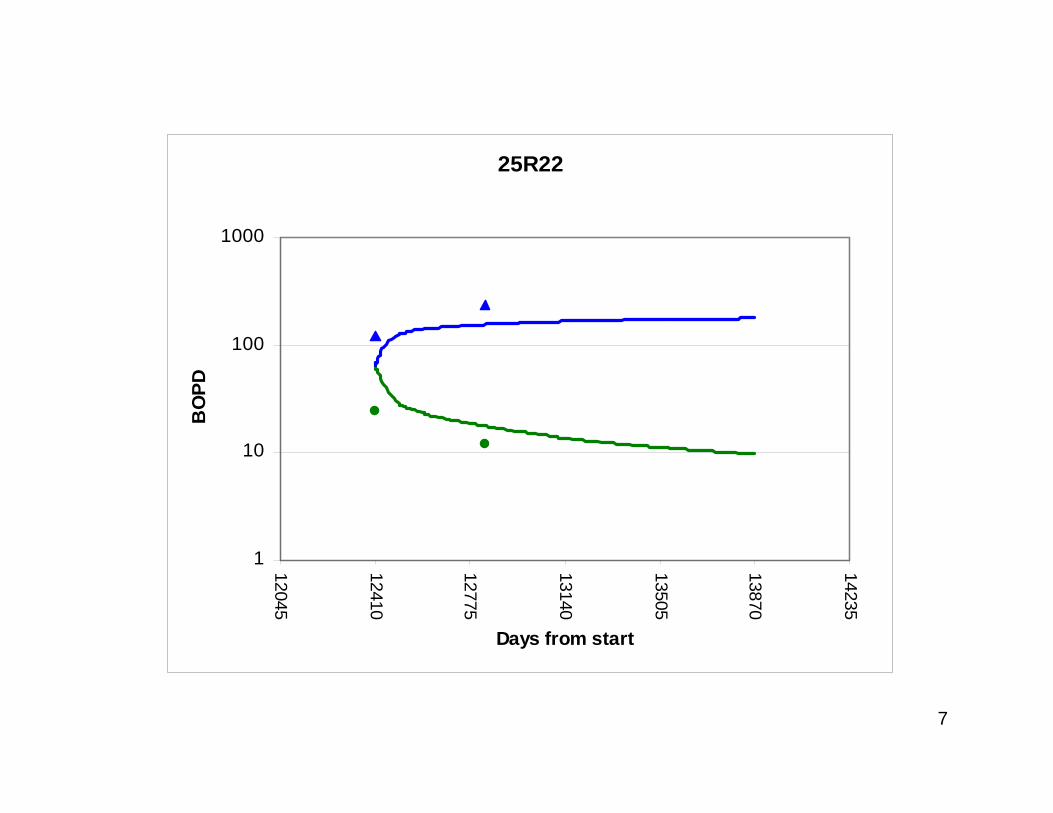
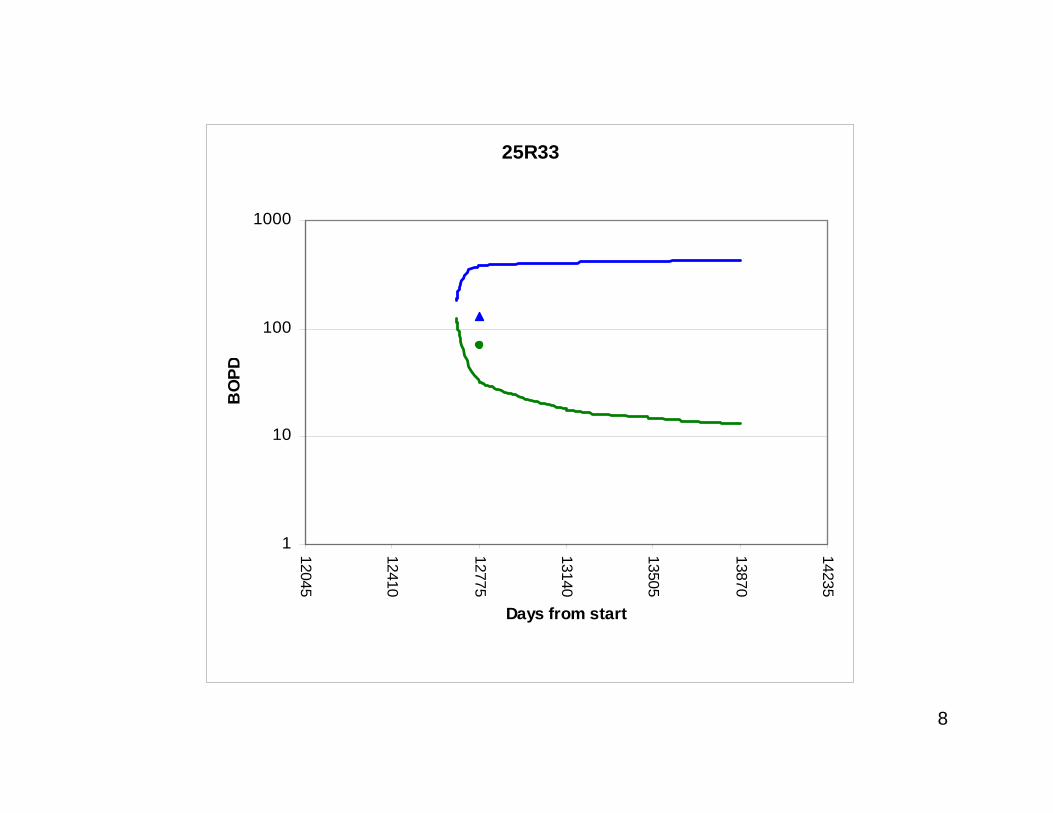
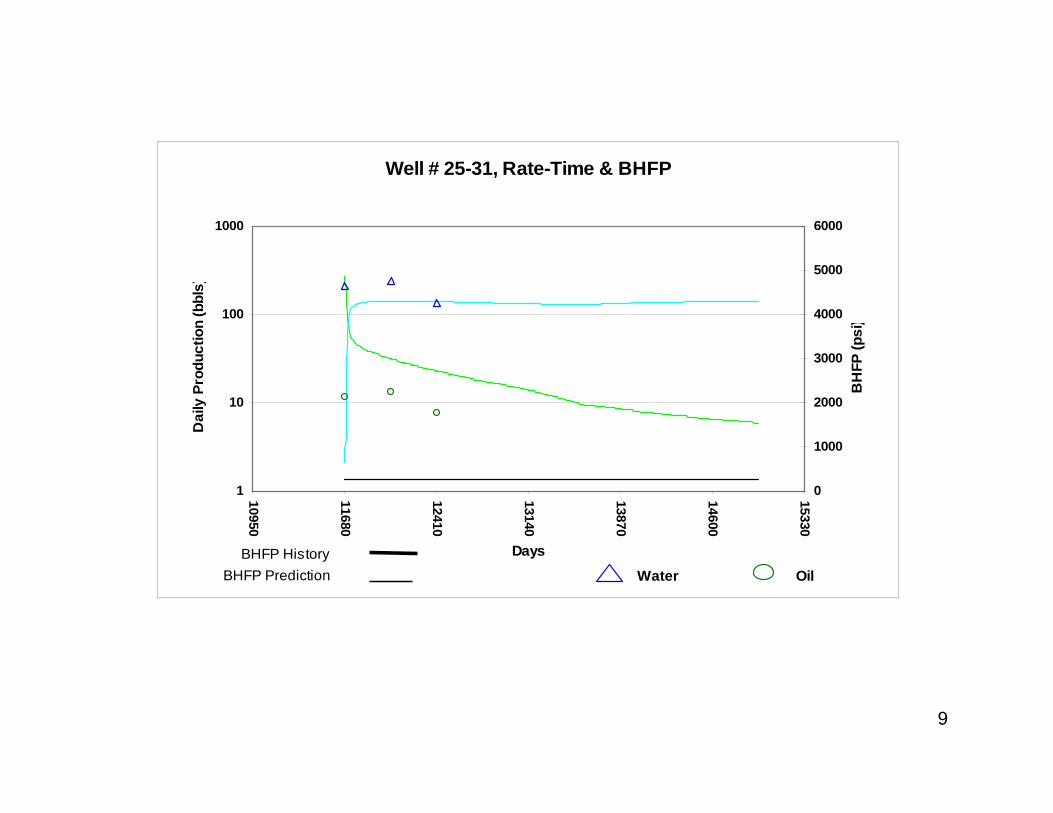
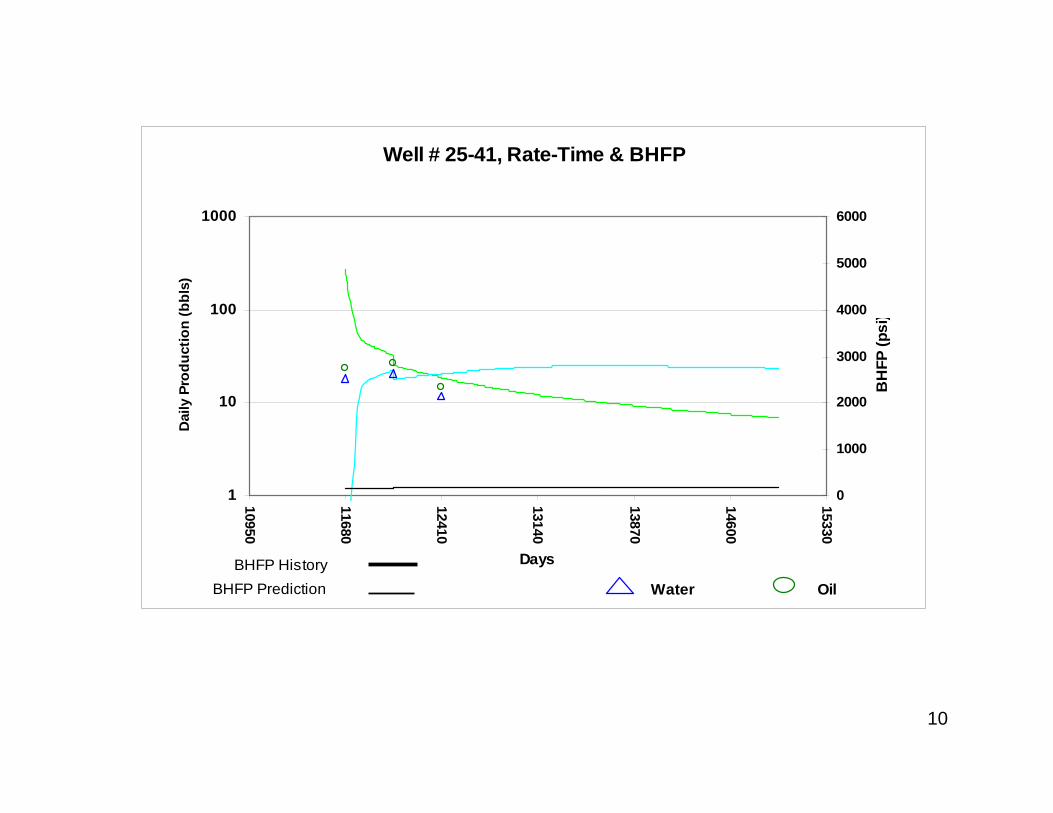
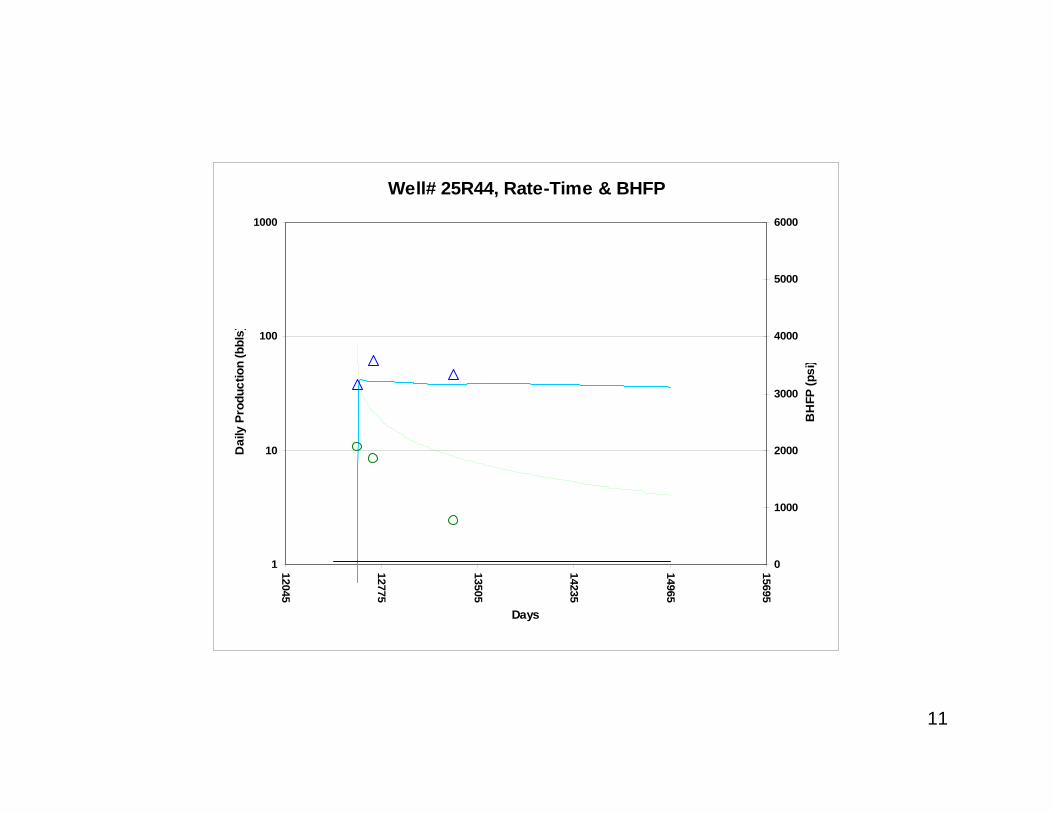
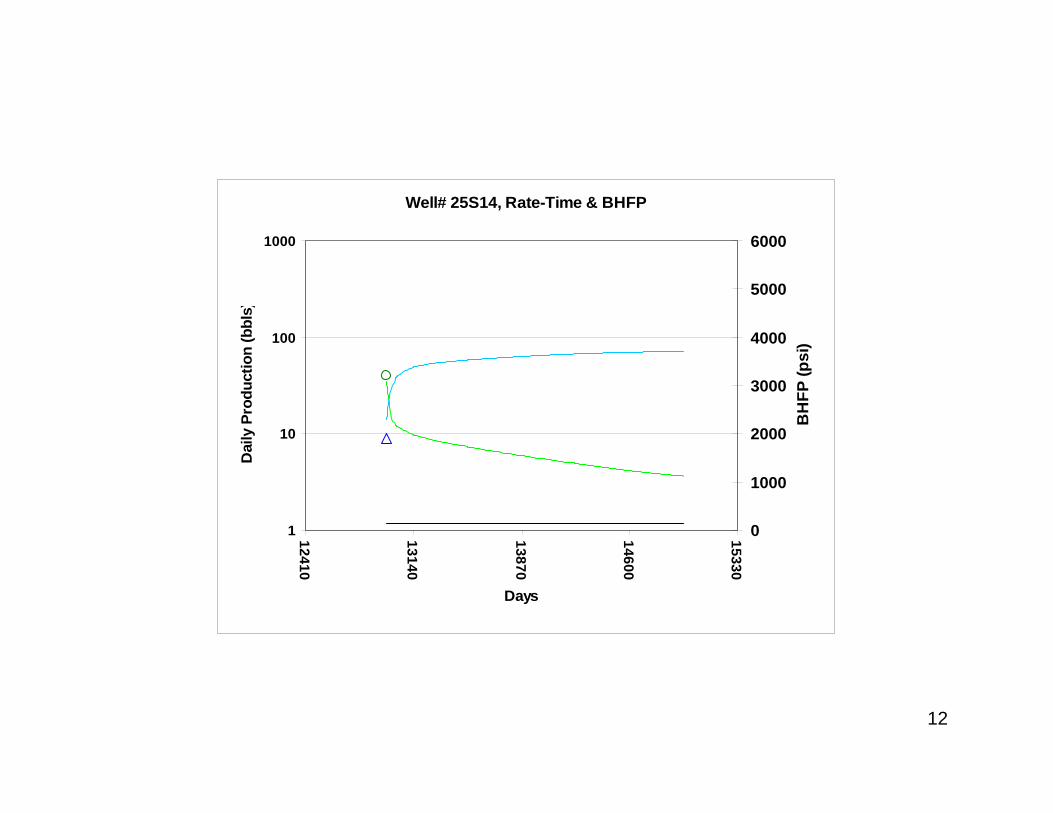
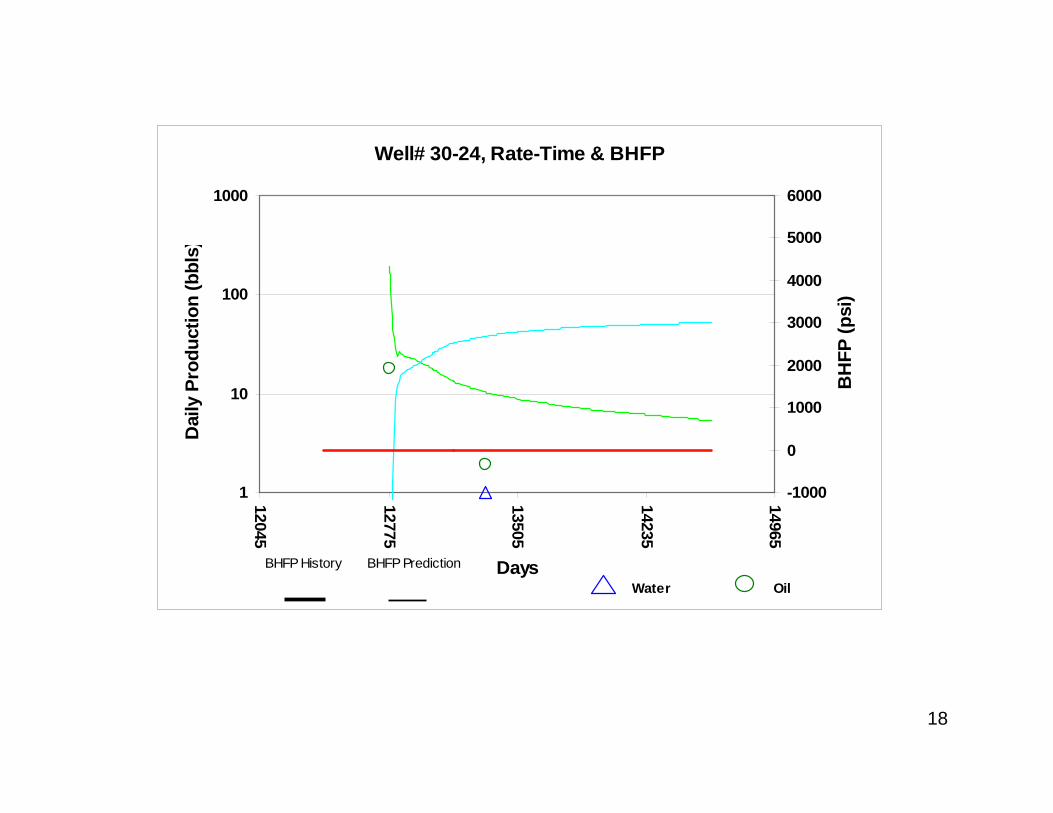
Results of performance prediction of infill wells Appendix C compares the performance, as predicted by the simulation model, of the infill wells with the production data recorded at each of the infill well during the first few months of their lives.
4
References: 1) Improved Oil Recover in Mississippian Carbonate Reservoirs of Kansas – Near Term
– Class 2. DOE/BC/14987-12. Annual Report – January 1, 1998 to December 31, 1998 by Carr. T.R., Green, D.W., and Willhite, G.P.
2) Improved Oil Recover in Mississippian Carbonate Reservoirs of Kansas – Near Term – Class 2. DOE/BC/14987-10. Annual Report – September 18, 1994 to March 15, 1997 by Carr. T.R., Green, D.W., and Willhite, G.P.

Table 1Name code Well name Well No Cell Address - X Cell Address - Y'19-41' Witman 2 26 40 10'19-42' Witman 1 28 46 10'19-43' Gneich 1 20 52 10'19R41' Wittman 4 66 42 12'19R42' Wittman 5 67 44 12'19R43' Gneich P1 Twin 65 50 12'19S41' Wittman 6 (add correction reqd) 70 39 12'23-44' Gillig A2 37 10 10'24-41' Gillig B1 33 16 10'24-42' Gillig 1-24 44 20 12'25-11' Borger 4 35 16 16'25-12' Borger A2 19 22 17'25-13' Borger 2 13 28 16'25-14' Borger 2 18 34 16'25-21' Borger 1 & 3 31 16 22'25-22' Borger A1 8 22 22'25-23' Borger 1 9 28 22'25-24' Borger 1 17 34 22'25-31' Wagner 4 46 17 28'25-32' Dora Wagner 1 6 22 28'25-33' Humburg 1 5 28 28'25-34' Humburg A1 10 33 28'25-41' Wagner 5 47 17 33'25-42' Dora Wagner 3 11 22 34'25-43' Humburg 2 7 28 34'25-44' Humburg 2A 14 34 34'25R11' Borger 2 42 16 19'25R13' Borger 4 59 29 19'25R14' Borger 3 (one up) 55 32 18'25R21' Borger 3 48 17 24'25R23' Borger 3 62 29 24'25R33' Humburg 4 54 29 27'25R34' Humburg 1-X 43 34 28'25R43' Humburg 3 45 28 36'25R44' Humburg AP 3 53 32 32'25S14' Borger 4 63 35 20'25S34' Humburg 2X 64 32 27'26-24' Robert B Lent 1 38 10 22'26-34' Gillig 1 40 10 28'26R34' Gillig 1-26 68 11 26'29-11' Rein A4 36 64 16'29-22' Rein A5 39 69 22'29-31' Rein A1 4 64 28'29-41' Rein A2 23 65 36'29R31' Rein AP 7 56 62 31'30-11' Moore D2 21 39 17'30-12' Moore D3 22 45 17'30-13' Moore B4 25 51 16'30-14' Moore B6 34 57 16'30-21' Moore D1 15 39 23'30-22' Moore D4 27 45 22'30-23' Moore B5 29 51 22'30-24' Moore 3-30 60 56 21'30-31' Moore C2 16 39 28'30-32' Moore C3 41 45 28'30-33' Moore B2 3 51 28'30-34' Moore B3 51 59 30'30-41' Moore 1-30 61 38 33'30-42' Moore C1 2 45 34'30-44' Moore B1 1 57 34'30R11' Moore DP 6 52 42 15'30R12' Moore DP 5 57 46 15'30R13' Moore BP Twin - to right 49 51 16'30S32' Moore CP 4 58 43 26'31-14' Lyle Schaben 2P 50 59 39'36-11' Anna Williams 3 32 16 40'36-12' Anna Williams 1 24 22 40'36-13' HL Williams Est 1 12 28 40'36-21' Anna Williams 2 30 16 46'36R12' William 6 69 23 38

Appendix A
Results of 3 Layer Reservoir Simulation Study – Schaben Field, Ness County, Kansas
Open File Report – 2000-78
24
292526
36 31
19
30
Twp. 19 South / Rge. 21 WestTwp. 19 South / Rge. 22 West
WITTMAN
2 1 1
GNEISCH
1
2WILHELM C
1
5
FRANK E REIN1-A
REIN1
2
REIN A
1
FRANK REIN1
6
4
2
1 4
3MOORE D
2
5
MOORE C
3 2
1
3
1
7
6
MOORE B
4
SCHABEN
1
A1
A1
LYLE 1A2
BATT C1
BATT A1
1 A2
GILLIG1
1-242
GILLIG B1
SCHABEN1OUT ON BAIL
1
1
1-X
2
3
2 1
2
1
2
HUMBURG
2
1
1A2
A1
1
BORGERBORGER
(AW)BORGER
(PDC)
4
13
BORGER 'A'2
GILLIG1
2
R B LENT
1
1
FICKEN1
FICKEN1 1
A WILLIAMS
2
35
WILLIAMS EST
21
3
WAGNER
4
5
3X
3
1-26
465
P1 Twin
2X
6
AP 3REIN AP 7
3
1-30
3-30
4
CP 4
3 4
4
DP 6
2-30
LYLE 2P
BP TWIN 4DP 5
Boast 3 SimulationGross Isopach of Layer 1 (M1 Horizon) Grid: 220 ft X 220 ft
Schaben Field
0 2640 Feet
Scale
Ness County, Kansas
01020304050 (Ft.)Infill Well
Figure A1
WITTMAN
2 1 1
GNEISCH
1
2WILHELM C
1
5
FRANK E REIN1-A
REIN1
2
REIN A
1
FRANK REIN1
6
4
2
1 4
3MOORE D
2
5
MOORE C
3 2
1
3
1
7
6
MOORE B
4
SCHABEN
1
A1
A1
LYLE 1A2
BATT C1
BATT A1
1 A2
GILLIG1
1-242
GILLIG B1
SCHABEN1OUT ON BAIL
1
1
1-X
2
3
2 1
2
1
2
HUMBURG
2
1
1A2
A1
1
BORGERBORGER
(AW)BORGER
(PDC)
4
13
BORGER 'A'2
GILLIG1
2
R B LENT
1
1
FICKEN1
FICKEN1 1
A WILLIAMS
2
35
WILLIAMS EST
21
3
WAGNER
4
5
3X
3
1-26
465
P1 Twin
2X
6
AP 3REIN AP 7
3
1-30
3-30
4
CP 4
3 4
4
DP 6
2-30
LYLE 2P
BP TWIN 4DP 5
Boast 4 SimulationGross Isopach of Layer 2 (M0 Horizon) Grid: 220 ft X 220 ft
Schaben Field
0 2640 Feet
Scale
Ness County, Kansas
0525 152030 1035 (Ft.)Infill WellFigure: A2
0
5 5
501
01
10
10
10
10
15
15
51
51
51
51
15
51
51
51
20
02
20
20
20
02
02
2002
20
5225
25
52
25
52
25
52
35 30
24
292526
36 31
19
30
Twp. 19 South / Rge. 21 WestTwp. 19 South / Rge. 22 West
Y-G
rid
X-Grid
1
1 10 20 30 40 50 60 70 72
10
20
30
40
49
WITTMAN
2 1 1
GNEISCH
1
2
WILHELM C
1
5
F REIN1-A
REIN
12
REIN A
1
F REIN
1
6
4
2
1 4
3MOORE D
2
5
MOORE C
3 2
1
3
1
7
6
MOORE B
4
SCHABEN
1
A1
A1
LYLE 1A2
BATT C
1
BATT A
1
1 A2
GILLIG1
1-242
GILLIG B1
SCHABEN
1OUT ON BAIL1
1
1-X
2
3
2 1
2
1
2
HUMBURG
2
1
1A2
A1
1
BORGER
BORGER(AW)
BORGER(PDC)
4
13
BORGER 'A'
2
GILLIG1
2
R B LENT
1
1
FICKEN
1
FICKEN
1 1
A WILLIAMS
2
35
WILLIAMS EST
21
3
WAGNER
4
5
3X
3
1-26
465
P1 Twin
2X
6
AP 3REIN AP 7
3
1-30
3-30
4
CP 4
3 4
4
DP 6
2-30
LYLE 2P
BP TWIN 4DP 5
Boast 4 SimulationNet Isopach of Layer 1 (M1 Horizon) Grid: 220 ft X 220 ft
Schaben Field
0 2640 Feet
Scale
Ness County, Kansas
0510152025 (Ft.)Infill WellFigure: A3
0000
0
0
00
0 00
025
25
24
292526
36 31
19
30
Twp. 19 South / Rge. 21 WestTwp. 19 South / Rge. 22 West
Y-G
rid
X-Grid
1
1 10 20 30 40 50 60 70 72
10
20
30
40
49
WITTMAN
2 1 1
GNEISCH
1
2
WILHELM C
1
5
F REIN1-A
REIN
12
REIN A
1
F REIN
1
6
4
2
1 4
3MOORE D
2
5
MOORE C
3 2
1
3
1
7
6
MOORE B
4
SCHABEN
1
A1
A1
LYLE 1A2
BATT C
1
BATT A
1
1 A2
GILLIG1
1-242
GILLIG B1
SCHABEN
1OUT ON BAIL1
1
1-X
2
3
2 1
2
1
2
HUMBURG
2
1
1A2
A1
1
BORGER
BORGER(AW)
BORGER(PDC)
4
13
BORGER 'A'
2
GILLIG1
2
R B LENT
1
1
FICKEN
1
FICKEN
1 1
A WILLIAMS
2
35
WILLIAMS EST
21
3
WAGNER
4
5
3X
3
1-26
465
P1 Twin
2X
6
AP 3REIN AP 7
3
1-30
3-30
4
CP 4
3 4
4
DP 6
2-30
LYLE 2P
BP TWIN 4DP 5
Boast 4 SimulationNet Isopach of Layer 2 (M0 Horizon) Grid: 220 ft X 220 ft
Schaben Field
0 2640 Feet
Scale
Ness County, Kansas
0510152025303540 (Ft.)Infill WellFigure: A4
24
292526
36 31
19
30
Twp. 19 South / Rge. 21 WestTwp. 19 South / Rge. 22 West
WITTMAN
2 1 1
GNEISCH
1
2WILHELM C
1
5
FRANK E REIN1-A
REIN1
2
REIN A
1
FRANK REIN1
6
4
2
1 4
3MOORE D
2
5
MOORE C
3 2
1
3
1
7
6
MOORE B
4
SCHABEN
1
A1
A1
LYLE 1A2
BATT C1
BATT A1
1 A2
GILLIG1
1-242
GILLIG B1
SCHABEN1OUT ON BAIL
1
1
1-X
2
3
2 1
2
1
2
HUMBURG
2
1
1A2
A1
1
BORGER
BORGER(AW)
BORGER(PDC)
4
13
BORGER 'A'
2
GILLIG1
2
R B LENT
1
1
FICKEN1
FICKEN1 1
A WILLIAMS
2
35
WILLIAMS EST
21
3
WAGNER
4
5
3X
3
1-26
465
P1 Twin
2X
6
AP 3REIN AP 7
3
1-30
3-30
4
CP 4
3 4
4
DP 6
2-30
LYLE 2P
BP TWIN 4DP 5
Boast 4 SimulationEffective Porosity Layers 1 & 2(M1 & M0 Horizons) Grid: 220 ft X 220 ft
Schaben Field
0 2640 Feet
Scale
Ness County, Kansas
.04.06.08.10.12.18 .16 .14 (frac.)Infill WellFigure: A5
0
0
0
005
005
005
500
500
500
500 500
005
500
1000
0001
1000 1000 1000
0001
0001
10001500
0051
1500 1500
0051
2000
2000
2000
2000
0002
2500
0052
0052
0003
24
292526
36 31
19
30
Twp. 19 South / Rge. 21 WestTwp. 19 South / Rge. 22 West
1
1 10 20 30 40 50 60 70 72
10
20
30
40
49
WITTMAN
2 1 1
GNEISCH
1
2
WILHELM C
1
5
F REIN1-A
REIN
12
REIN A
1
F REIN
1
6
4
2
1 4
3MOORE D
2
5
MOORE C
3 2
1
3
1
7
6
MOORE B
4
SCHABEN
1
A1
A1
LYLE 1A2
BATT C
1
BATT A
1
1 A2
GILLIG1
1-242
GILLIG B1
SCHABEN
1OUT ON BAIL1
1
1-X
2
3
2 1
2
1
2
HUMBURG
2
1
1A2
A1
1
BORGER
BORGER(AW)
BORGER(PDC)
4
13
BORGER 'A'
2
GILLIG1
2
R B LENT
1
1
FICKEN
1
FICKEN
1 1
A WILLIAMS
2
35
WILLIAMS EST
21
3
WAGNER
4
5
3X
3
1-26
465
P1 Twin
2X
6
AP 3REIN AP 7
3
1-30
3-30
4
CP 4
3 4
4
DP 6
2-30
LYLE 2P
BP TWIN 4DP 5
Boast 4 SimulationHorizontal Permeability-Feet of Layer 1 (M1 Horizon) Grid: 220 ft X 220 ft
Schaben Field
0 2640 Feet
Scale
Ness County, Kansas
05001000150020003000350040004500500055006000 2500(md-ft.)
Infill Well
Figure: A6

005
500500
5001000 1000
0051
24
292526
36 31
19
30
Twp. 19 South / Rge. 21 WestTwp. 19 South / Rge. 22 WestX-Grid
1
1 10 20 30 40 50 60 70 72
10
20
30
40
49
WITTMAN
2 1 1
GNEISCH
1
2
WILHELM C
1
5
F REIN1-A
REIN
12
REIN A
1
F REIN
1
6
4
2
1 4
3MOORE D
2
5
MOORE C
3 2
1
3
1
7
6
MOORE B
4
SCHABEN
1
A1
A1
LYLE 1A2
BATT C
1
BATT A
1
1 A2
GILLIG1
1-242
GILLIG B1
SCHABEN
1OUT ON BAIL1
1
1-X
2
3
2 1
2
1
2
HUMBURG
2
1
1A2
A1
1
BORGER
BORGER(AW)
BORGER(PDC)
4
13
BORGER 'A'
2
GILLIG1
2
R B LENT
1
1
FICKEN
1
FICKEN
1 1
A WILLIAMS
2
35
WILLIAMS EST
21
3
WAGNER
4
5
3X
3
1-26
465
P1 Twin
2X
6
AP 3REIN AP 7
3
1-30
3-30
4
CP 4
3 4
4
DP 6
2-30
LYLE 2P
BP TWIN 4DP 5
Boast 4 SimulationHorizontal Permeability-Feet of Layer 2 (M0 Horizon) Grid: 220 ft X 220 ft
Schaben Field
0 2640 Feet
Scale
Ness County, Kansas
05001000150020003000350040004500500055006000 2500(md-ft.)
Infill Well
Figure: A7

10
10
01
01
10
01
20
02
20
30
30
04
24
292526
36 31
19
30
Twp. 19 South / Rge. 21 WestTwp. 19 South / Rge. 22 West
1
1 10 20 30 40 50 60 70 72
10
20
30
40
49
WITTMAN
2 1 1
GNEISCH
1
2
WILHELM C
1
5
F REIN1-A
REIN
12
REIN A
1
F REIN
1
6
4
2
1 4
3MOORE D
2
5
MOORE C
3 2
1
3
1
7
6
MOORE B
4
SCHABEN
1
A1
A1
LYLE 1A2
BATT C
1
BATT A
1
1 A2
GILLIG1
1-242
GILLIG B1
SCHABEN
1OUT ON BAIL1
1
1-X
2
3
2 1
2
1
2
HUMBURG
2
1
1A2
A1
1
BORGER
BORGER(AW)
BORGER(PDC)
4
13
BORGER 'A'
2
GILLIG1
2
R B LENT
1
1
FICKEN
1
FICKEN
1 1
A WILLIAMS
2
35
WILLIAMS EST
21
3
WAGNER
4
5
3X
3
1-26
465
P1 Twin
2X
6
AP 3REIN AP 7
3
1-30
3-30
4
CP 4
3 4
4
DP 6
2-30
LYLE 2P
BP TWIN 4DP 5
Boast 4 SimulationVertical Permeability of Layer 1 (M1 Horizon) Grid: 220 ft X 220 ft
Schaben Field
0 2640 Feet
Scale
Ness County, Kansas
020405060708090 1030(md)Infill Well
Figure: A8

0
0
0
01
1 0
10
01
10
10
10
10
01
10
02
02
20 02
20
20
2020
3030
30
30
03
03
40
40
40
4050
50
06
60
07
07
24
292526
36 31
19
30
Twp. 19 South / Rge. 21 WestTwp. 19 South / Rge. 22 West
1
1 10 20 30 40 50 60 70 72
10
20
30
40
49
WITTMAN
2 1 1
GNEISCH
1
2
WILHELM C
1
5
F REIN1-A
REIN
12
REIN A
1
F REIN
1
6
4
2
1 4
3MOORE D
2
5
MOORE C
3 2
1
3
1
7
6
MOORE B
4
SCHABEN
1
A1
A1
LYLE 1A2
BATT C
1
BATT A
1
1 A2
GILLIG1
1-242
GILLIG B1
SCHABEN
1OUT ON BAIL1
1
1-X
2
3
2 1
2
1
2
HUMBURG
2
1
1A2
A1
1
BORGER
BORGER(AW)
BORGER(PDC)
4
13
BORGER 'A'
2
GILLIG1
2
R B LENT
1
1
FICKEN
1
FICKEN
1 1
A WILLIAMS
2
35
WILLIAMS EST
21
3
WAGNER
4
5
3X
3
1-26
465
P1 Twin
2X
6
AP 3REIN AP 7
3
1-30
3-30
4
CP 4
3 4
4
DP 6
2-30
LYLE 2P
BP TWIN 4DP 5
Boast 4 SimulationVertical Permeability of Layer 2 (M0 Horizon) Grid: 220 ft X 220 ft
Schaben Field
0 2640 Feet
Scale
Ness County, Kansas
020405060708090100110120130140140 1030(md)Infill Well
Figure: A9
24
292526
36 31
19
30
Twp. 19 South / Rge. 21 WestTwp. 19 South / Rge. 22 West
WITTMAN
2 1 1
GNEISCH
1
2
WILHELM C
1
5
F REIN1-A
REIN
12
REIN A
1
F REIN
1
6
4
2
1 4
3MOORE D
2
5
MOORE C
3 2
1
3
1
7
6
MOORE B
4
SCHABEN
1
A1
A1
LYLE 1A2
BATT C
1
BATT A
1
1 A2
GILLIG1
1-242
GILLIG B1
SCHABEN
1OUT ON BAIL1
1
1-X
2
3
2 1
2
1
2
HUMBURG
2
1
1A2
A1
1
BORGER
BORGER(AW)
BORGER(PDC)
4
13
BORGER 'A'
2
GILLIG1
2
R B LENT
1
1
FICKEN
1
FICKEN
1 1
A WILLIAMS
2
35
WILLIAMS EST
21
3
WAGNER
4
5
3X
3
1-26
465
P1 Twin
2X
6
AP 3REIN AP 7
3
1-30
3-30
4
CP 4
3 4
4
DP 6
2-30
LYLE 2P
BP TWIN 4DP 5
Boast 4 SimulationReservoir Pressure (1963)Layers 1 & 2 (M1 & M0 Horizons) Grid: 220 ft X 220 ft
Schaben Field
0 2640 Feet
Scale
Ness County, Kansas
1200 110011501250130013501400 (psi)Infill WellFigure: A10

24
292526
36 31
19
30
Twp. 19 South / Rge. 21 WestTwp. 19 South / Rge. 22 West
WITTMAN
2 1 1
GNEISCH
1
2
WILHELM C
1
5
F REIN1-A
REIN
12
REIN A
1
F REIN
1
6
4
2
1 4
3MOORE D
2
5
MOORE C
3 2
1
3
1
7
6
MOORE B
4
SCHABEN
1
A1
A1
LYLE 1A2
BATT C
1
BATT A
1
1 A2
GILLIG1
1-242
GILLIG B1
SCHABEN
1OUT ON BAIL1
1
1-X
2
3
2 1
2
1
2
HUMBURG
2
1
1A2
A1
1
BORGER
BORGER(AW)
BORGER(PDC)
4
13
BORGER 'A'
2
GILLIG1
2
R B LENT
1
1
FICKEN
1
FICKEN
1 1
A WILLIAMS
2
35
WILLIAMS EST
21
3
WAGNER
4
5
3X
3
1-26
465
P1 Twin
2X
6
AP 3REIN AP 7
3
1-30
3-30
4
CP 4
3 4
4
DP 6
2-30
LYLE 2P
BP TWIN 4DP 5
Boast 4 SimulationOil Saturation in Effective Porosity (1963)Layers 1 & 2 (M1 & M0 Horizons) Grid: 220 ft X 220 ft
Schaben Field
0 2640 Feet
Scale
Ness County, Kansas
50566272 6880 (%)Infill WellFigure: A11

Appendix B
Results of 3 Layer Reservoir Simulation Study – Schaben Field, Ness County, Kansas
Open File Report – 2000-78

1
Well # 19-42, Rate Time & BHFP
1
10
100
1000
10000
0 730
1460
2190
2920
3650
4380
5110
5840
6570
7300
8030
8760
9490
10220
10950
11680
12410
13140
13870
14600
15330
16060
Days
Dai
ly P
rodu
ctio
n (b
bls)
0
1000
2000
3000
4000
5000
6000
BH
FP (p
si)
Water OilBHFP
BHFP
Well # 19-42, Cumulative-Time
1
10
100
1000
10000
0 730
1460
2190
2920
3650
4380
5110
5840
6570
7300
8030
8760
9490
10220
10950
11680
12410
13140
13870
14600
15330
16060
Days
Cum
ulat
ive
Prod
uctio
n (M
bbls
Water Oil

2
Well # 19-43, Rate-Time & BHFP
1
10
100
1000
0 730
1460
2190
2920
3650
4380
5110
5840
6570
7300
8030
8760
9490
10220
10950
11680
12410
13140
13870
14600
15330
16060
Days
Dai
ly P
rodu
ctio
n (b
bls)
0
1000
2000
3000
4000
5000
6000
BH
FP (p
si)
Water OilBHFP History
BHFP Prediction
Well # 19-43, Cumulative-Time
1
10
100
1000
10000
0 730
1460
2190
2920
3650
4380
5110
5840
6570
7300
8030
8760
9490
10220
10950
11680
12410
13140
13870
14600
15330
16060
Days
Cum
ulat
ive
Prod
uctio
n (M
bbls
Water Oil

3
Well # 24-41, Rate-Time & BHFP
1
10
100
1000
0 730
1460
2190
2920
3650
4380
5110
5840
6570
7300
8030
8760
9490
10220
10950
11680
12410
13140
13870
14600
15330
16060
Days
Dai
ly P
rodu
ctio
n (b
bls)
0
1000
2000
3000
4000
5000
6000
BH
FP (p
si)
Water OilBHFP History
BHFP Prediction
Well # 24-41, Cumulative-Time
1
10
100
1000
10000
0 730
1460
2190
2920
3650
4380
5110
5840
6570
7300
8030
8760
9490
10220
10950
11680
12410
13140
13870
14600
15330
16060
Days
Cum
ulat
ive
Prod
uctio
n (M
bbls
Water Oil
4
Well # 25-11 & 25R11, Rate-Time & BHFP
1
10
100
1000
0 730
1460
2190
2920
3650
4380
5110
5840
6570
7300
8030
8760
9490
10220
10950
11680
12410
13140
13870
14600
15330
16060
Days
Dai
ly P
rodu
ctio
n (b
bls)
0
1000
2000
3000
4000
5000
6000
BH
FP (p
si)
Water OilBHFP History
BHFP Prediction
Well # 25-11 & 25R11, Cumulative-Time
1
10
100
1000
10000
0 730
1460
2190
2920
3650
4380
5110
5840
6570
7300
8030
8760
9490
10220
10950
11680
12410
13140
13870
14600
15330
16060
Days
Cum
ulat
ive
Prod
uctio
n (M
bbls
Water Oil

5
Well 25-12, Rate-Time & BHFP
1
10
100
1000
0 730
1460
2190
2920
3650
4380
5110
5840
6570
7300
8030
8760
9490
10220
10950
11680
12410
13140
13870
14600
15330
16060
Days
Dai
ly P
rodu
ctio
n (b
bls)
0
1000
2000
3000
4000
5000
6000
BH
FP (p
si)
Water OilBHFP History
BHFP Prediction
Well # 25-12, Cumulative-Time
1
10
100
1000
10000
0 730
1460
2190
2920
3650
4380
5110
5840
6570
7300
8030
8760
9490
10220
10950
11680
12410
13140
13870
14600
15330
16060
Days
Cum
ulat
ive
Prod
uctio
n (M
bbls
Water Oil
6
Well # 25-14, Rate-Time & BHFP
1
10
100
1000
0 730
1460
2190
2920
3650
4380
5110
5840
6570
7300
8030
8760
9490
10220
10950
11680
12410
13140
13870
14600
15330
16060
Days
Dai
ly P
rodu
ctio
n (b
bls)
0
1000
2000
3000
4000
5000
6000
BH
FP (p
si)
Water OilBHFP History
BHFP Prediction
Well # 25-14, Cumulative-Time
1
10
100
1000
10000
0 730
1460
2190
2920
3650
4380
5110
5840
6570
7300
8030
8760
9490
10220
10950
11680
12410
13140
13870
14600
15330
16060
Days
Cum
ulat
ive
Prod
uctio
n (M
bbls
Water Oil
7
Well # 25-21 & 25R21, Rate-Time & BHFP
1
10
100
1000
0 730
1460
2190
2920
3650
4380
5110
5840
6570
7300
8030
8760
9490
10220
10950
11680
12410
13140
13870
14600
15330
16060
Days
Dai
ly P
rodu
ctio
n (b
bls)
0
1000
2000
3000
4000
5000
6000
BH
FP (p
si)
Water OilBHFP History
BHFP Prediction
Well # 25-21 & 25R21, Cumulative-Time
1
10
100
1000
10000
0 730
1460
2190
2920
3650
4380
5110
5840
6570
7300
8030
8760
9490
10220
10950
11680
12410
13140
13870
14600
15330
16060
Days
Cum
ulat
ive
Prod
uctio
n (M
bbls
Water Oil
8
Well # 25-22, Rate-Time & BHFP
1
10
100
1000
0 730
1460
2190
2920
3650
4380
5110
5840
6570
7300
8030
8760
9490
10220
10950
11680
12410
13140
13870
14600
15330
16060
Days
Dai
ly P
rodu
ctio
n (b
bls)
0
1000
2000
3000
4000
5000
6000
BH
FP (p
si)
Water OilBHFP History
BHFP Prediction
Well # 25-22, Cumulative-Time
1
10
100
1000
0 730
1460
2190
2920
3650
4380
5110
5840
6570
7300
8030
8760
9490
10220
10950
11680
12410
13140
13870
14600
15330
16060
Days
Cum
ulat
ive
Prod
uctio
n (M
bbls
Water Oil
9
Well # 25-23, Rate-Time & BHFP
1
10
100
1000
0 730
1460
2190
2920
3650
4380
5110
5840
6570
7300
8030
8760
9490
10220
10950
11680
12410
13140
13870
14600
15330
16060
Days
Dai
ly P
rodu
ctio
n (b
bls)
0
1000
2000
3000
4000
5000
6000
BH
FP (p
si)
Water OilBHFP History
BHFP Prediction
Well # 25-23, Cumulative-Time
1
10
100
1000
10000
0 730
1460
2190
2920
3650
4380
5110
5840
6570
7300
8030
8760
9490
10220
10950
11680
12410
13140
13870
14600
15330
16060
Days
Cum
ulat
ive
Prod
uctio
n (M
bbls
Water Oil

10
Well # 25-24, Rate-Time & BHFP
1
10
100
1000
0 730
1460
2190
2920
3650
4380
5110
5840
6570
7300
8030
8760
9490
10220
10950
11680
12410
13140
13870
14600
15330
16060
Days
Dai
ly P
rodu
ctio
n (b
bls)
0
1000
2000
3000
4000
5000
6000
BH
FP (p
si)
Water OilBHFP History
BHFP Prediction
Well # 25-24, Cumulative-Time
1
10
100
1000
10000
0 730
1460
2190
2920
3650
4380
5110
5840
6570
7300
8030
8760
9490
10220
10950
11680
12410
13140
13870
14600
15330
16060
Days
Cum
ulat
ive
Prod
uctio
n (M
bbls
)
Water Oil
11
Well # 25-32, Rate-Time & PWF
1
10
100
1000
10000
0 730146021902920365043805110584065707300803087609490102201095011680124101314013870146001533016060
Days
Daily
Pro
duct
ion
(bbl
s)
0
1000
2000
3000
4000
5000
6000
BHFP
(psi
)

12
Well # 25-33, Rate-Time & BHFP
1
10
100
1000
0 730
1460
2190
2920
3650
4380
5110
5840
6570
7300
8030
8760
9490
10220
10950
11680
12410
13140
13870
14600
15330
16060
Days
Dai
ly P
rodu
ctio
n (b
bls)
0
1000
2000
3000
4000
5000
6000
BH
FP (p
si)
Water OilBHFP History
BHFP Prediction
Well # 25-33, Cumulative-Time
1
10
100
1000
10000
0 730
1460
2190
2920
3650
4380
5110
5840
6570
7300
8030
8760
9490
10220
10950
11680
12410
13140
13870
14600
15330
16060
Days
Cum
ulat
ive
Prod
uctio
n (M
bbls
)
Water Oil
13
Well # 25-34 & 25R34, Rate-Time & BHFP
1
10
100
1000
0 730
1460
2190
2920
3650
4380
5110
5840
6570
7300
8030
8760
9490
10220
10950
11680
12410
13140
13870
14600
15330
16060
Days
Dai
ly P
rodu
ctio
n (b
bls)
0
1000
2000
3000
4000
5000
6000
BH
FP (p
si)
Water OilBHFP History
BHFP Prediction
Well # 25-34 & 25R34, Cumulative-Time
1
10
100
1000
10000
0 730
1460
2190
2920
3650
4380
5110
5840
6570
7300
8030
8760
9490
10220
10950
11680
12410
13140
13870
14600
15330
16060
Days
Cum
ulat
ive
Prod
uctio
n (M
bbls
Water Oil

14
Well # 25-42, Rate-Time & BHFP
1
10
100
1000
0 730
1460
2190
2920
3650
4380
5110
5840
6570
7300
8030
8760
9490
10220
10950
11680
12410
13140
13870
14600
15330
16060
Days
Dai
ly P
rodu
ctio
n (b
bls)
0
1000
2000
3000
4000
5000
6000
BH
FP (p
si)
Water OilBHFP History
BHFP Prediction
Well # 25-42, Cumulative-Time
1
10
100
1000
10000
0 730
1460
2190
2920
3650
4380
5110
5840
6570
7300
8030
8760
9490
10220
10950
11680
12410
13140
13870
14600
15330
16060
Days
Cum
ulat
ive
Pro
duct
ion
(Mbb
ls)
Water Oil
15
Well # 25-43 & 25R43, Rate-Time & BHFP
1
10
100
1000
0 730
1460
2190
2920
3650
4380
5110
5840
6570
7300
8030
8760
9490
10220
10950
11680
12410
13140
13870
14600
15330
16060
Days
Dai
ly P
rodu
ctio
n (b
bls)
0
1000
2000
3000
4000
5000
6000
BH
FP (p
si)
Water OilBHFP History
BHFP Prediction
Well # 25-43 & 25R43, Cumulative-Time
1
10
100
1000
0 730
1460
2190
2920
3650
4380
5110
5840
6570
7300
8030
8760
9490
10220
10950
11680
12410
13140
13870
14600
15330
16060
Days
Cum
ulat
ive
Prod
uctio
n (M
bbls
Water Oil
16
Well # 25-44, Rate-Time & BHFP
1
10
100
1000
0 730
1460
2190
2920
3650
4380
5110
5840
6570
7300
8030
8760
9490
10220
10950
11680
12410
13140
13870
14600
15330
16060
Days
Dai
ly P
rodu
ctio
n (b
bls)
0
1000
2000
3000
4000
5000
6000
BH
FP (p
si)
Water OilBHFP History
BHFP Prediction
Well # 25-44, Cumulative-Time
1
10
100
1000
0 730
1460
2190
2920
3650
4380
5110
5840
6570
7300
8030
8760
9490
10220
10950
11680
12410
13140
13870
14600
15330
16060
Days
Cum
ulat
ive
Prod
uctio
n (M
bbls
Water Oil
17
Well# 26-24, Rate-Time & BHFP
1
10
100
1000
0 730146021902920365043805110584065707300803087609490102201095011680124101314013870146001533016060
Days
Dai
ly P
rodu
ctio
n (b
bls)
0
1000
2000
3000
4000
5000
6000
BH
FP (p
si)
BHFP History BHFP Prediction
Water Oil
Well # 26-24, Cumulative-Time
1
10
100
1000
100000 7301460
21902920
3650
43805110
58406570
7300
80308760
949010220
1095011680
12410
1314013870
1460015330
16060
Days
Cum
ulat
ive
Prod
uctio
n (M
bbls
Water Oil
18
Well# 26-34, Rate-Time & BHFP
1
10
100
1000
0 730146021902920365043805110584065707300803087609490102201095011680124101314013870146001533016060
Days
Daily
Pro
duct
ion
(bbl
s)
0
1000
2000
3000
4000
5000
6000
BHFP
(psi
)
BHFP History BHFP Prediction
Water Oil
Well # 26-34, Cumulative-Time
1
10
100
10000 730
1460
2190
2920
3650
4380
5110
5840
6570
7300
8030
8760
9490
10220
10950
11680
12410
13140
13870
14600
15330
16060
Days
Cum
ulat
ive
Prod
uctio
n (M
bbls
Water Oil
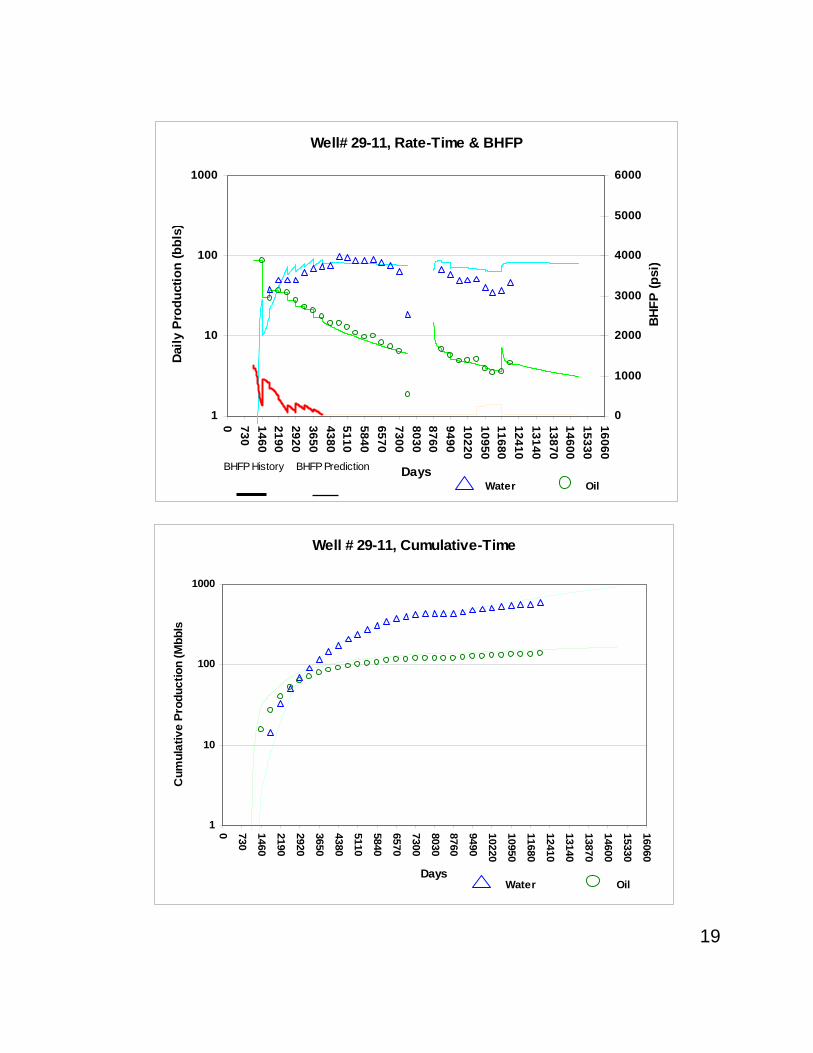
19
Well# 29-11, Rate-Time & BHFP
1
10
100
1000
0 730146021902920365043805110584065707300803087609490102201095011680124101314013870146001533016060
Days
Dai
ly P
rodu
ctio
n (b
bls)
0
1000
2000
3000
4000
5000
6000
BH
FP (p
si)
BHFP History BHFP Prediction
Water Oil
Well # 29-11, Cumulative-Time
1
10
100
10000 730
1460
2190
2920
3650
4380
5110
5840
6570
7300
80308760
9490
10220
10950
11680
12410
13140
13870
14600
15330
16060
Days
Cum
ulat
ive
Prod
uctio
n (M
bbls
Water Oil
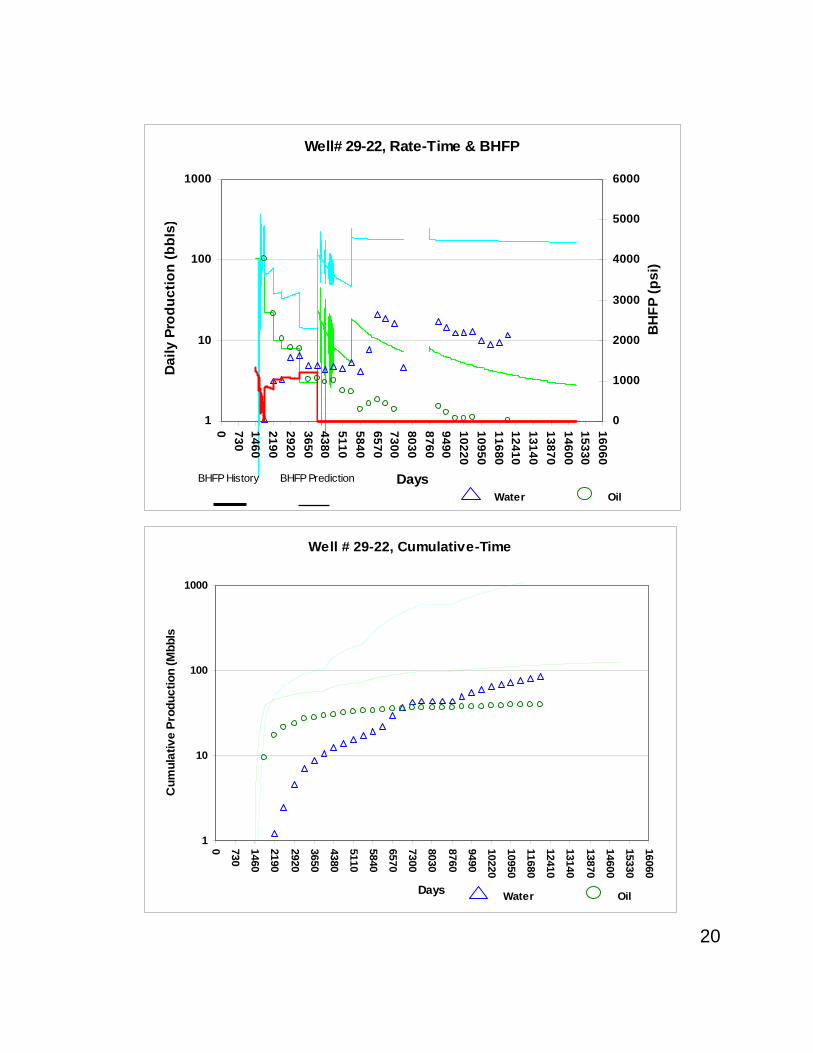
20
Well# 29-22, Rate-Time & BHFP
1
10
100
1000
0 730146021902920365043805110584065707300803087609490102201095011680124101314013870146001533016060
Days
Dai
ly P
rodu
ctio
n (b
bls)
0
1000
2000
3000
4000
5000
6000
BH
FP (p
si)
BHFP History BHFP Prediction
Water Oil
Well # 29-22, Cumulative-Time
1
10
100
10000 730
1460
2190
2920
3650
4380
5110
5840
6570
7300
8030
8760
9490
10220
10950
11680
12410
13140
13870
14600
15330
16060
Days
Cum
ulat
ive
Prod
uctio
n (M
bbls
Water Oil
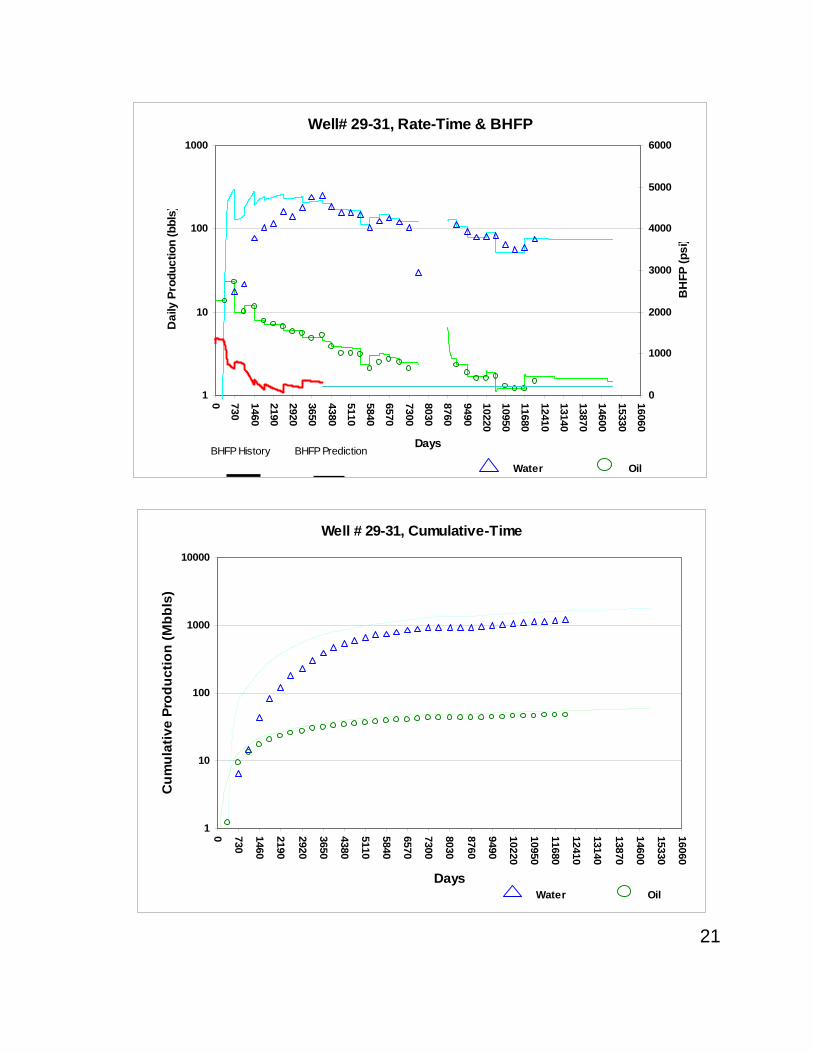
21
Well# 29-31, Rate-Time & BHFP
1
10
100
1000
0 730
1460
2190
2920
3650
4380
5110
5840
6570
7300
8030
8760
9490
10220
10950
11680
12410
13140
13870
14600
15330
16060
Days
Dai
ly P
rodu
ctio
n (b
bls)
0
1000
2000
3000
4000
5000
6000
BH
FP (p
si)
BHFP History BHFP Prediction
Water Oil
Well # 29-31, Cumulative-Time
1
10
100
1000
10000
0 730
1460
2190
2920
3650
4380
5110
5840
6570
7300
8030
8760
9490
10220
10950
11680
12410
13140
13870
14600
15330
16060
Days
Cum
ulat
ive
Prod
uctio
n (M
bbls
)
Water Oil
22
Well# 29-41, Rate-Time & BHFP
1
10
100
1000
0 730146021902920365043805110584065707300803087609490102201095011680124101314013870146001533016060
Days
Dai
ly P
rodu
ctio
n (b
bls)
0
1000
2000
3000
4000
5000
6000
BH
FP (p
si)
BHFP History BHFP Prediction
Water Oil
Well # 29-41, Cumulative-Time
1
10
100
1000
10000
0 730
1460
2190
2920
3650
4380
5110
5840
6570
7300
8030
8760
9490
10220
10950
11680
12410
13140
13870
14600
15330
16060
Days
Cum
ulat
ive
Prod
uctio
n (M
bbls
)
Water Oil
23
Well# 30-11, Rate-Time & BHFP
1
10
100
1000
0 730146021902920365043805110584065707300803087609490102201095011680124101314013870146001533016060
Days
Daily
Pro
duct
ion
(bbl
s)
0
1000
2000
3000
4000
5000
6000
BHFP
(psi
)
Water OilBHFP History BHFP Prediction
Well # 30-11, Cumulative-Time
1
10
100
1000
0 730
1460
2190
2920
3650
4380
5110
5840
6570
7300
8030
8760
9490
10220
10950
11680
12410
13140
13870
14600
15330
16060
Days
Cum
ulat
ive
Prod
uctio
n (M
bbls
)
Water Oil
24
30-12 Rate-Time & PWF
1
10
100
1000
0 730
1460
2190
2920
3650
4380
5110
5840
6570
7300
8030
8760
9490
10220
10950
11680
12410
13140
13870
14600
15330
16060
Days
Dai
ly P
rodu
ctio
n (b
bls)
0
1000
2000
3000
4000
5000
6000
BH
FP (p
si)
Water OilBHFP History
BHFP Prediction
30-12 Cumulative-Time
1
10
100
1000
0 730
1460
2190
2920
3650
4380
5110
5840
6570
7300
8030
8760
9490
10220
10950
11680
12410
13140
13870
14600
15330
16060
Days
Cum
ulat
ive
Prod
uctio
n (M
bbls
Water Oil

25
Well # 30-13, Rate-Time & BHFP
1
10
100
1000
0 730
1460
2190
2920
3650
4380
5110
5840
6570
7300
8030
8760
9490
10220
10950
11680
12410
13140
13870
14600
15330
16060
Days
Dai
ly P
rodu
ctio
n (b
bls)
0
1000
2000
3000
4000
5000
6000
BHFP
(psi
)
Water OilBHFP History BHFP Prediction
Well # 30-13, Cumulative-Time
1
10
100
1000
10000
0 730
1460
2190
2920
3650
4380
5110
5840
6570
7300
8030
8760
9490
10220
10950
11680
12410
13140
13870
14600
15330
16060
Days
Cum
ulat
ive
Prod
uctio
n (M
bbls
)
Water Oil
26
Well # 30-14, Rate-Time & BHFP
1
10
100
1000
0 730146021902920365043805110584065707300803087609490102201095011680124101314013870146001533016060
Days
Daily
Pro
duct
ion
(bbl
s)
0
1000
2000
3000
4000
5000
6000
BHFP
(psi
)
BHFP History BHFP Prediction Water Oil
Well # 30-14, Cumulative-Time
1
10
100
1000
100000 7301460
21902920
3650
43805110
58406570
7300
80308760
949010220
1095011680
12410
1314013870
1460015330
16060
Days
Cum
ulat
ive
Prod
uctio
n (M
bbls
)
Water Oil
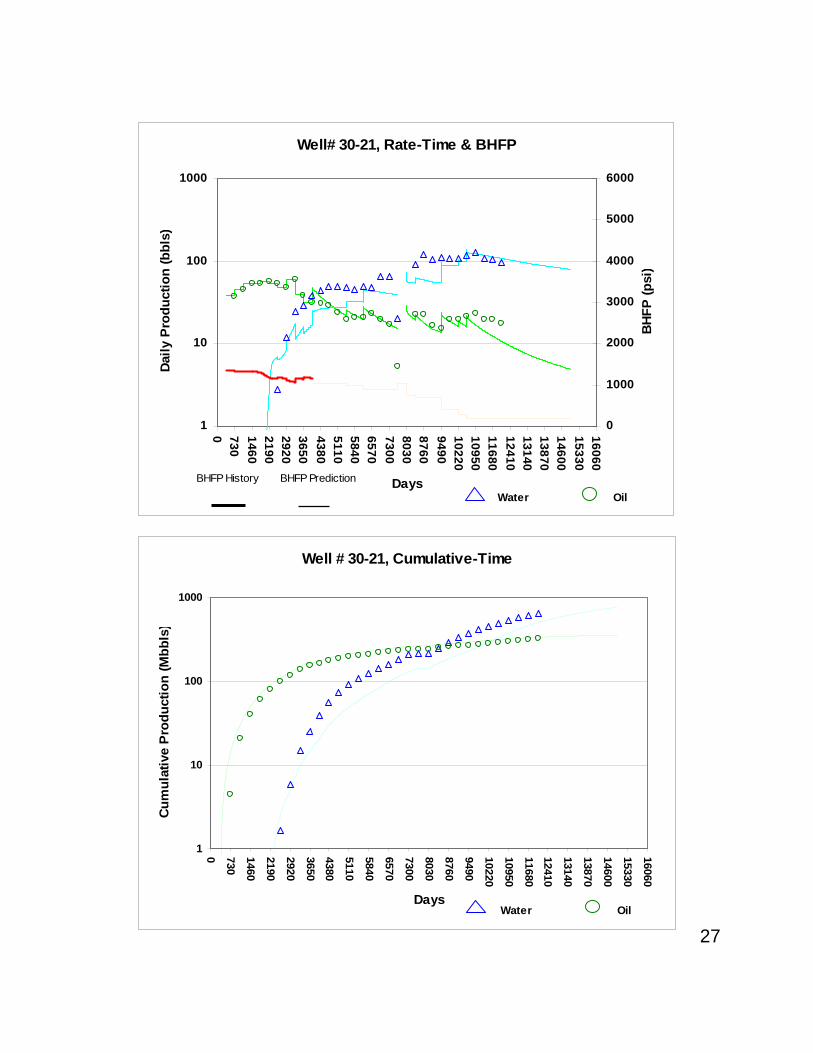
27
Well# 30-21, Rate-Time & BHFP
1
10
100
1000
0 730146021902920365043805110584065707300803087609490102201095011680124101314013870146001533016060
Days
Daily
Pro
duct
ion
(bbl
s)
0
1000
2000
3000
4000
5000
6000
BHFP
(psi
)
BHFP History BHFP Prediction
Water Oil
Well # 30-21, Cumulative-Time
1
10
100
10000 730
1460
2190
2920
36504380
5110
5840
6570
7300
8030
8760
9490
10220
10950
1168012410
13140
13870
14600
15330
16060
Days
Cum
ulat
ive
Pro
duct
ion
(Mbb
ls)
Water Oil
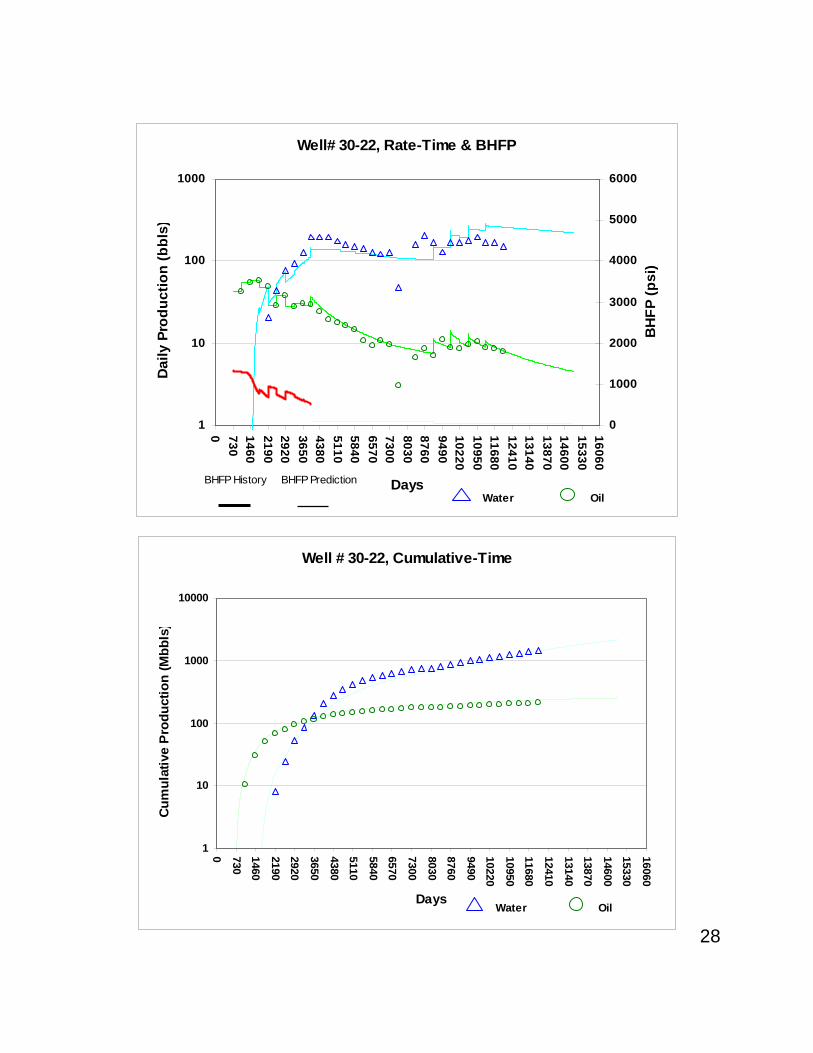
28
Well# 30-22, Rate-Time & BHFP
1
10
100
1000
0 730146021902920365043805110584065707300803087609490102201095011680124101314013870146001533016060
Days
Dai
ly P
rodu
ctio
n (b
bls)
0
1000
2000
3000
4000
5000
6000
BH
FP (p
si)
BHFP History BHFP Prediction
Water Oil
Well # 30-22, Cumulative-Time
1
10
100
1000
100000 7301460
21902920
3650
43805110
58406570
7300
80308760
949010220
1095011680
12410
1314013870
1460015330
16060
Days
Cum
ulat
ive
Pro
duct
ion
(Mbb
ls)
Water Oil
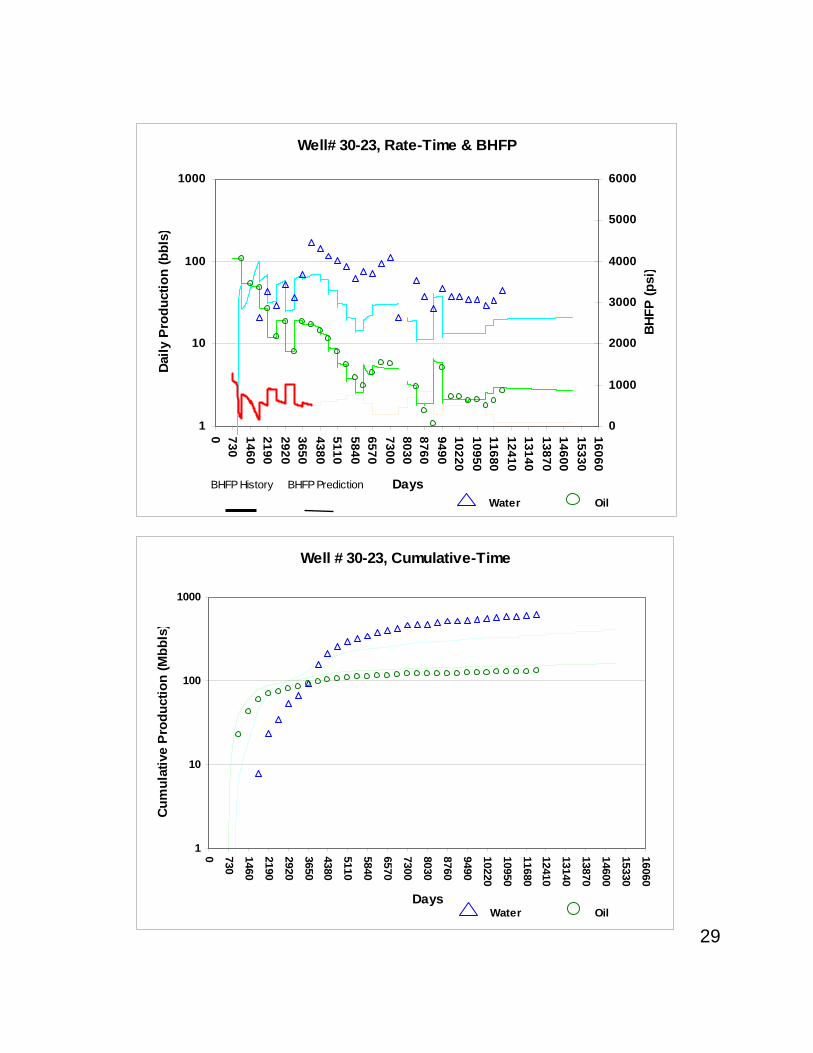
29
Well# 30-23, Rate-Time & BHFP
1
10
100
1000
0 730146021902920365043805110584065707300803087609490102201095011680124101314013870146001533016060
Days
Daily
Pro
duct
ion
(bbl
s)
0
1000
2000
3000
4000
5000
6000
BHFP
(psi
)
BHFP History BHFP Prediction
Water Oil
Well # 30-23, Cumulative-Time
1
10
100
10000 730
1460
2190
2920
36504380
5110
5840
6570
7300
8030
8760
9490
10220
10950
1168012410
13140
13870
14600
15330
16060
Days
Cum
ulat
ive
Pro
duct
ion
(Mbb
ls)
Water Oil

30
Well# 30-31, Rate-Time & BHFP
1.0
10.0
100.0
1000.0
0 730146021902920365043805110584065707300803087609490102201095011680124101314013870146001533016060
Days
Dai
ly P
rodu
ctio
n (b
bls)
0
1000
2000
3000
4000
5000
6000
BH
FP (p
si)
BHFP History BHFP Prediction
Water Oil
Well # 30-31, Cumulative-Time
1
10
100
1000
100000 730
1460
2190
2920
3650
4380
5110
5840
6570
7300
8030
8760
9490
10220
10950
11680
12410
13140
13870
14600
15330
16060
Days
Cum
ulat
ive
Pro
duct
ion
(Mbb
ls)
Water Oil
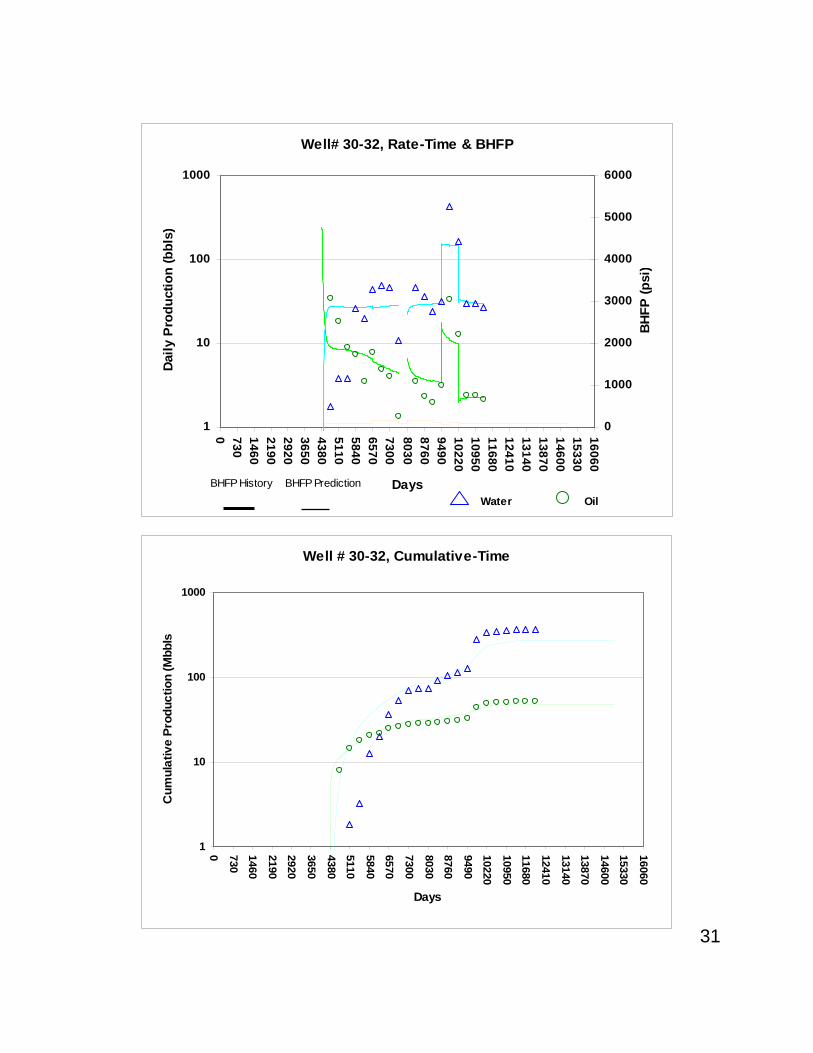
31
Well# 30-32, Rate-Time & BHFP
1
10
100
1000
0 730146021902920365043805110584065707300803087609490102201095011680124101314013870146001533016060
Days
Daily
Pro
duct
ion
(bbl
s)
0
1000
2000
3000
4000
5000
6000
BHFP
(psi
)
BHFP History BHFP Prediction
Water Oil
Well # 30-32, Cumulative-Time
1
10
100
10000 7301460
21902920
3650
43805110
58406570
7300
80308760
949010220
1095011680
12410
1314013870
1460015330
16060
Days
Cum
ulat
ive
Prod
uctio
n (M
bbls
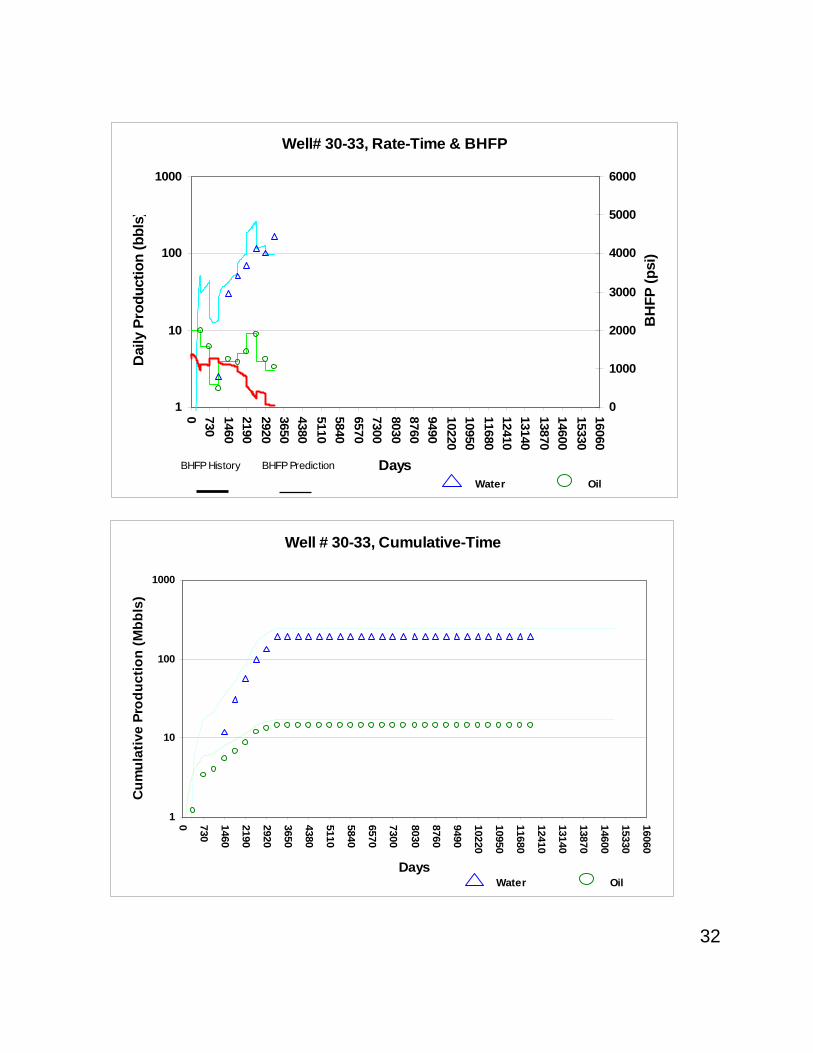
32
Well# 30-33, Rate-Time & BHFP
1
10
100
1000
0 730146021902920365043805110584065707300803087609490102201095011680124101314013870146001533016060
Days
Dai
ly P
rodu
ctio
n (b
bls)
0
1000
2000
3000
4000
5000
6000
BH
FP (p
si)
BHFP History BHFP Prediction
Water Oil
Well # 30-33, Cumulative-Time
1
10
100
1000
0 730
1460
2190
2920
3650
4380
5110
5840
6570
7300
8030
8760
9490
10220
10950
11680
12410
13140
13870
14600
15330
16060
Days
Cum
ulat
ive
Prod
uctio
n (M
bbls
)
Water Oil
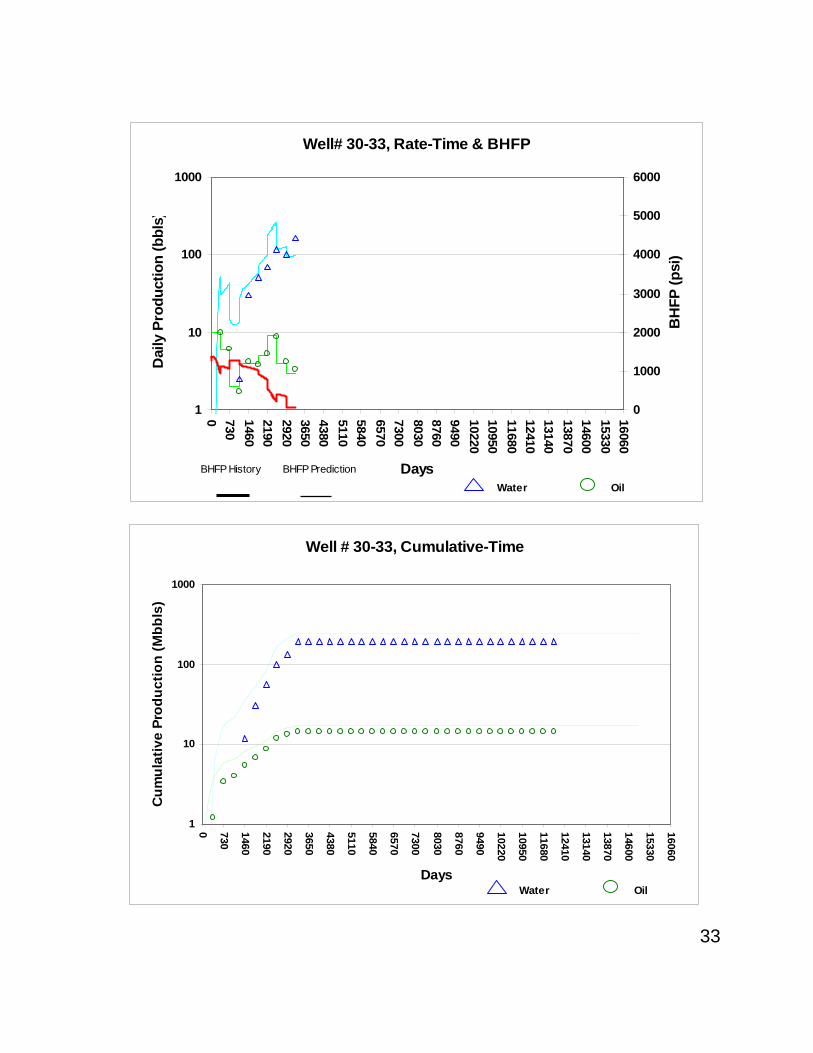
33
Well# 30-33, Rate-Time & BHFP
1
10
100
1000
0 730146021902920365043805110584065707300803087609490102201095011680124101314013870146001533016060
Days
Dai
ly P
rodu
ctio
n (b
bls)
0
1000
2000
3000
4000
5000
6000
BH
FP (p
si)
BHFP History BHFP Prediction
Water Oil
Well # 30-33, Cumulative-Time
1
10
100
1000
0 730
1460
2190
2920
3650
4380
5110
5840
6570
7300
8030
8760
9490
10220
10950
11680
12410
13140
13870
14600
15330
16060
Days
Cum
ulat
ive
Prod
uctio
n (M
bbls
)
Water Oil
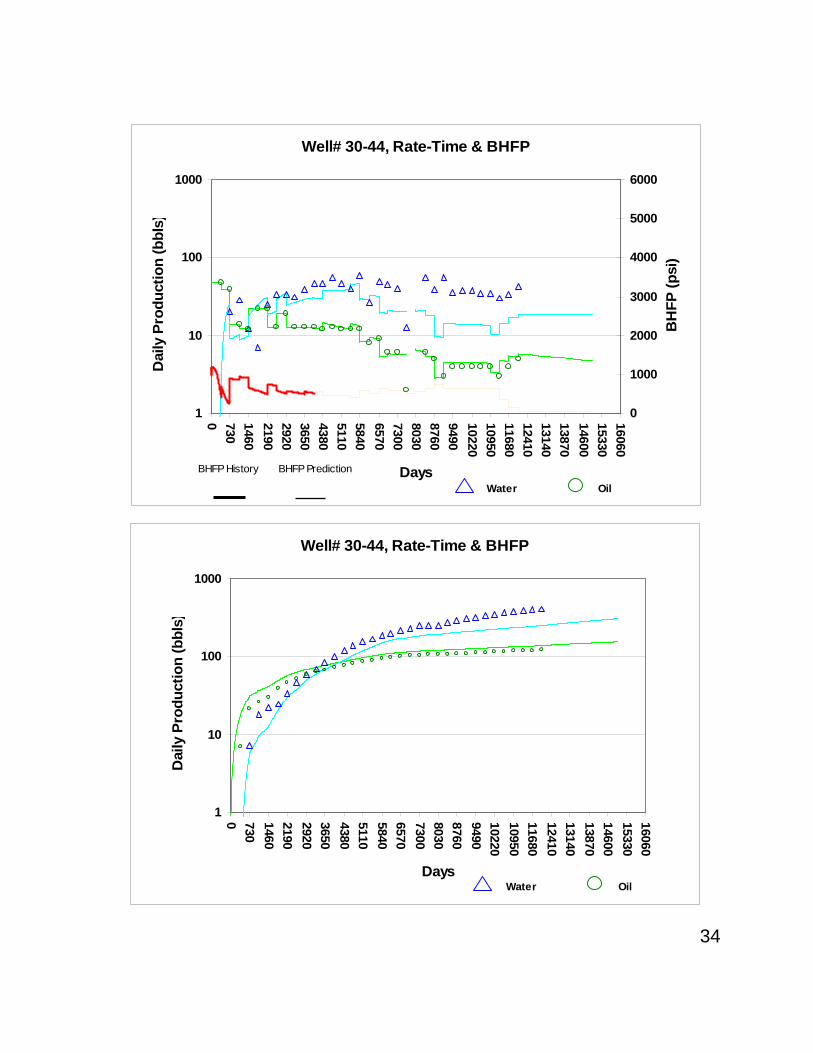
34
Well# 30-44, Rate-Time & BHFP
1
10
100
1000
0 730146021902920365043805110584065707300803087609490102201095011680124101314013870146001533016060
Days
Dai
ly P
rodu
ctio
n (b
bls)
0
1000
2000
3000
4000
5000
6000
BH
FP (p
si)
BHFP History BHFP Prediction
Water Oil
Well# 30-44, Rate-Time & BHFP
1
10
100
10000 730146021902920365043805110584065707300803087609490102201095011680124101314013870146001533016060
Days
Dai
ly P
rodu
ctio
n (b
bls)
Water Oil
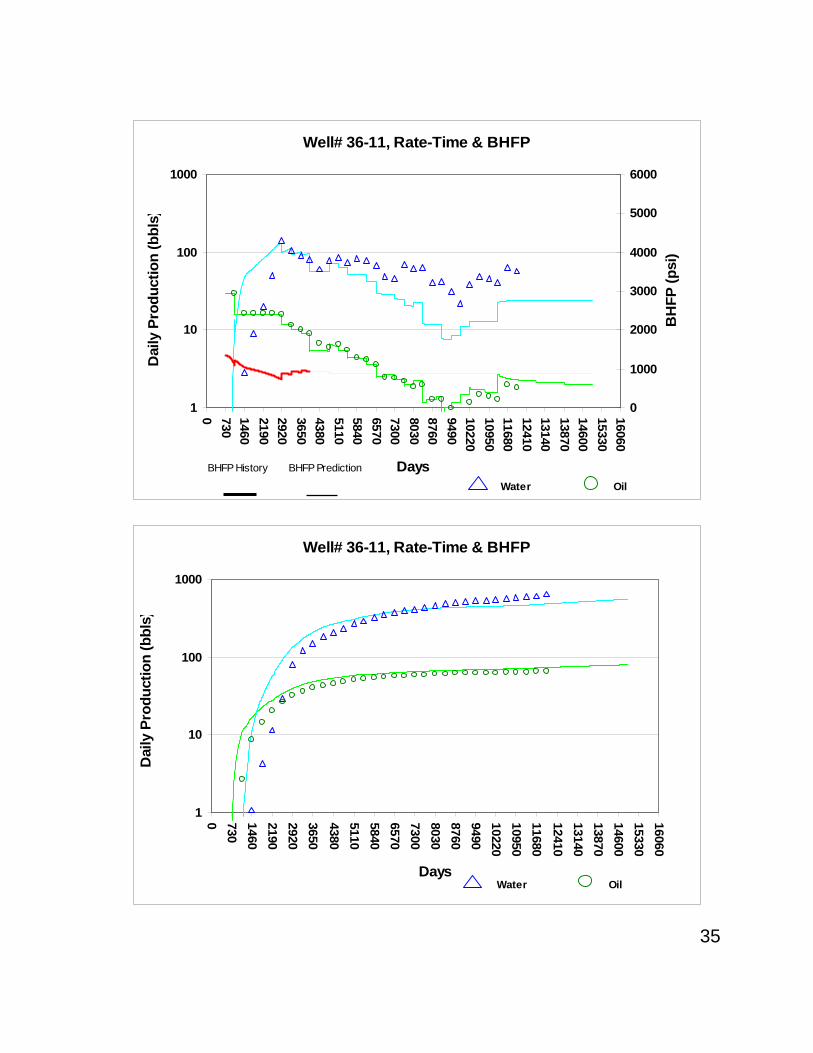
35
Well# 36-11, Rate-Time & BHFP
1
10
100
1000
0 730146021902920365043805110584065707300803087609490102201095011680124101314013870146001533016060
Days
Dai
ly P
rodu
ctio
n (b
bls)
0
1000
2000
3000
4000
5000
6000
BH
FP (p
si)
BHFP History BHFP Prediction
Water Oil
Well# 36-11, Rate-Time & BHFP
1
10
100
1000
0 730146021902920365043805110584065707300803087609490102201095011680124101314013870146001533016060
Days
Dai
ly P
rodu
ctio
n (b
bls)
Water Oil

36
Well# 36-12, Rate-Time & BHFP
1
10
100
1000
0 730146021902920365043805110584065707300803087609490102201095011680124101314013870146001533016060
Days
Dai
ly P
rodu
ctio
n (b
bls)
0
1000
2000
3000
4000
5000
6000
BH
FP (p
si)
BHFP History BHFP Prediction
Water Oil
Well # 36-12, Cumulative-Time
1
10
100
1000
10000
0 730
1460
2190
2920
3650
4380
5110
5840
6570
7300
8030
8760
9490
10220
10950
11680
12410
13140
13870
14600
15330
16060
Days
Cum
ulat
ive
Prod
uctio
n (M
bbls
)
Water Oil
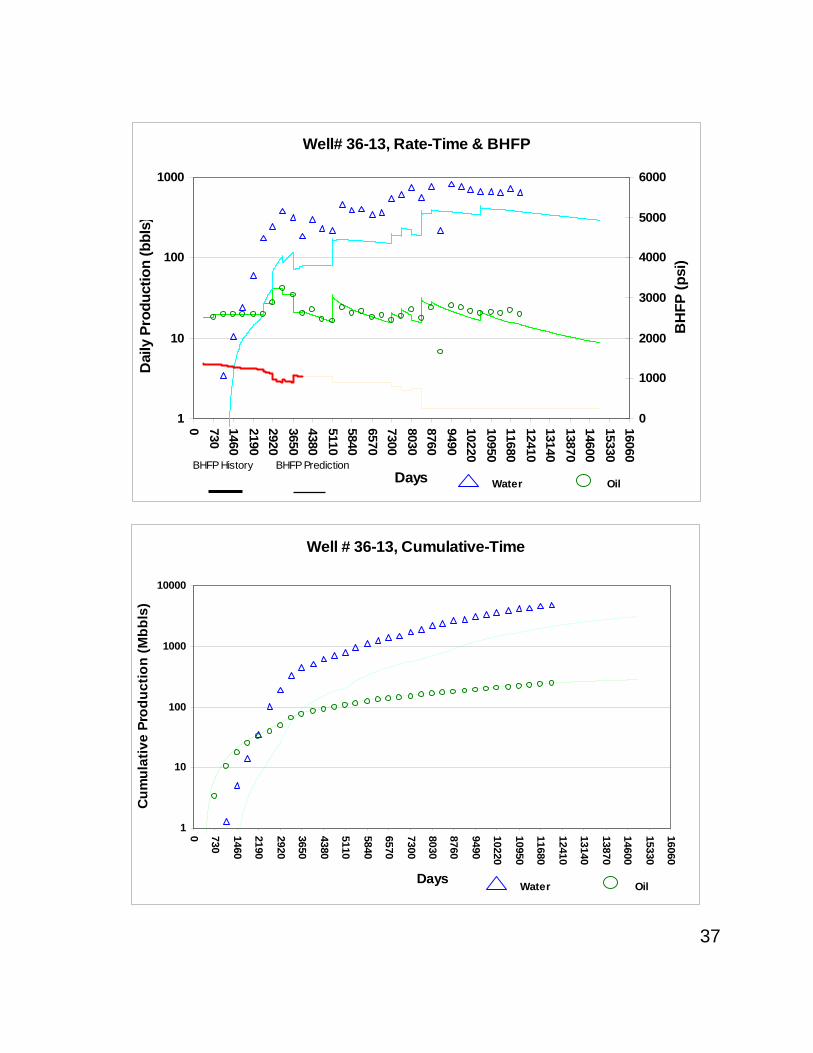
37
Well# 36-13, Rate-Time & BHFP
1
10
100
1000
0 730146021902920365043805110584065707300803087609490102201095011680124101314013870146001533016060
Days
Dai
ly P
rodu
ctio
n (b
bls)
0
1000
2000
3000
4000
5000
6000
BH
FP (p
si)
BHFP History BHFP Prediction
Water Oil
Well # 36-13, Cumulative-Time
1
10
100
1000
10000
0 730
1460
2190
2920
3650
4380
5110
5840
6570
7300
8030
8760
9490
10220
10950
11680
12410
13140
13870
14600
15330
16060
Days
Cum
ulat
ive
Prod
uctio
n (M
bbls
)
Water Oil

38
Well# 36-21, Rate-Time & BHFP
1
10
100
1000
0 730146021902920365043805110584065707300803087609490102201095011680124101314013870146001533016060
Days
Dai
ly P
rodu
ctio
n (b
bls)
0
1000
2000
3000
4000
5000
6000
BH
FP (p
si)
BHFP History BHFP Prediction
Water Oil
Well # 36-21, Cumulative-Time
1
10
100
1000
10000
0 730
1460
2190
2920
3650
4380
5110
5840
6570
7300
8030
8760
9490
10220
10950
11680
12410
13140
13870
14600
15330
16060
Days
Cum
ulat
ive
Prod
uctio
n (M
bbls
)
Water Oil
39
Schaben FieldIncreased Production Rate by Infill Drilling
10
100
1000
10000
100000
1000000
10000000
100000000
0 730
1460
2190
2920
3650
4380
5110
5840
6570
7300
8030
8760
9490
10220
10950
11680
12410
13140
13870
14600
Time in days from 1/1/1990
Bar
rels
per
Day
Historical Water RateHistorical Oil RateSimulated Oil RateSimulated Water RateSeries7Series8cumWtrCumOil
Full field match and production increase from infill drilling
Appendix C
Results of 3 Layer Reservoir Simulation Study – Schaben Field, Ness County, Kansas
Open File Report – 2000-78
24
292526
36 31
19
30
Twp. 19 South / Rge. 21 WestTwp. 19 South / Rge. 22 West
WITTMAN
2 1 1
GNEISCH
1
2
WILHELM C
1
5
F REIN1-A
REIN
12
REIN A
1
F REIN
1
6
4
2
1 4
3MOORE D
2
5
MOORE C
3 2
1
3
1
7
6
MOORE B
4
SCHABEN
1
A1
A1
LYLE 1A2
BATT C
1
BATT A
1
1 A2
GILLIG1
1-242
GILLIG B1
SCHABEN
1OUT ON BAIL1
1
1-X
2
3
2 1
2
1
2
HUMBURG
2
1
1A2
A1
1
BORGER
BORGER(AW)
BORGER(PDC)
4
13
BORGER 'A'
2
GILLIG1
2
R B LENT
1
1
FICKEN
1
FICKEN
1 1
A WILLIAMS
2
35
WILLIAMS EST
21
3
WAGNER
4
5
3X
3
1-26
465
P1 Twin
2X
6
AP 3REIN AP 7
3
1-30
3-30
4
CP 4
3 4
4
DP 6
2-30
LYLE 2P
BP TWIN 4DP 5
Boast 4 SimulationOil Saturation-Feet of Layer 1 (M1 Horizon) Time = 12045 days (Dec-95) Grid: 220 ft X 220 ft
Schaben Field
0 2640 Feet
Scale
Ness County, Kansas
03691215182124 (So-Ft)Infill WellFigure: C1
24
292526
36 31
19
30
Twp. 19 South / Rge. 21 WestTwp. 19 South / Rge. 22 West
WITTMAN
2 1 1
GNEISCH
1
2
WILHELM C
1
5
F REIN1-A
REIN
12
REIN A
1
F REIN
1
6
4
2
1 4
3MOORE D
2
5
MOORE C
3 2
1
3
1
7
6
MOORE B
4
SCHABEN
1
A1
A1
LYLE 1A2
BATT C
1
BATT A
1
1 A2
GILLIG1
1-242
GILLIG B1
SCHABEN
1OUT ON BAIL1
1
1-X
2
3
2 1
2
1
2
HUMBURG
2
1
1A2
A1
1
BORGER
BORGER(AW)
BORGER(PDC)
4
13
BORGER 'A'
2
GILLIG1
2
R B LENT
1
1
FICKEN
1
FICKEN
1 1
A WILLIAMS
2
35
WILLIAMS EST
21
3
WAGNER
4
5
3X
3
1-26
465
P1 Twin
2X
6
AP 3REIN AP 7
3
1-30
3-30
4
CP 4
3 4
4
DP 6
2-30
LYLE 2P
BP TWIN 4DP 5
Boast 4 SimulationOil Saturation-Feet of Layer 2 (M0 Horizon) Time = 12045 days (Dec-95) Grid: 220 ft X 220 ft
Schaben Field
0 2640 Feet
Scale
Ness County, Kansas
0246810 (So-ft)Infill WellFigure: C2

24
292526
36 31
19
30
Twp. 19 South / Rge. 21 WestTwp. 19 South / Rge. 22 West
WITTMAN
2 1 1
GNEISCH
1
2
WILHELM C
1
5
F REIN1-A
REIN
12
REIN A
1
F REIN
1
6
4
2
1 4
3MOORE D
2
5
MOORE C
3 2
1
3
1
7
6
MOORE B
4
SCHABEN
1
A1
A1
LYLE 1A2
BATT C
1
BATT A
1
1 A2
GILLIG1
1-242
GILLIG B1
SCHABEN
1OUT ON BAIL1
1
1-X
2
3
2 1
2
1
2
HUMBURG
2
1
1A2
A1
1
BORGER
BORGER(AW)
BORGER(PDC)
4
13
BORGER 'A'
2
GILLIG1
2
R B LENT
1
1
FICKEN
1
FICKEN
1 1
A WILLIAMS
2
35
WILLIAMS EST
21
3
WAGNER
4
5
3X
3
1-26
465
P1 Twin
2X
6
AP 3REIN AP 7
3
1-30
3-30
4
CP 4
3 4
4
DP 6
2-30
LYLE 2P
BP TWIN 4DP 5
Boast 4 SimulationGrid Cells with Best Infill Potential (Dec-95) So > 40% & Net Pay > 20 ft Grid: 220 ft X 220 ft
Schaben Field
0 2640 Feet
Scale
Ness County, Kansas
04812162024 (So-ft)Infill WellFigure: C3

Appendix D
Results of 3 Layer Reservoir Simulation Study – Schaben Field, Ness County, Kansas
Open File Report – 2000-78
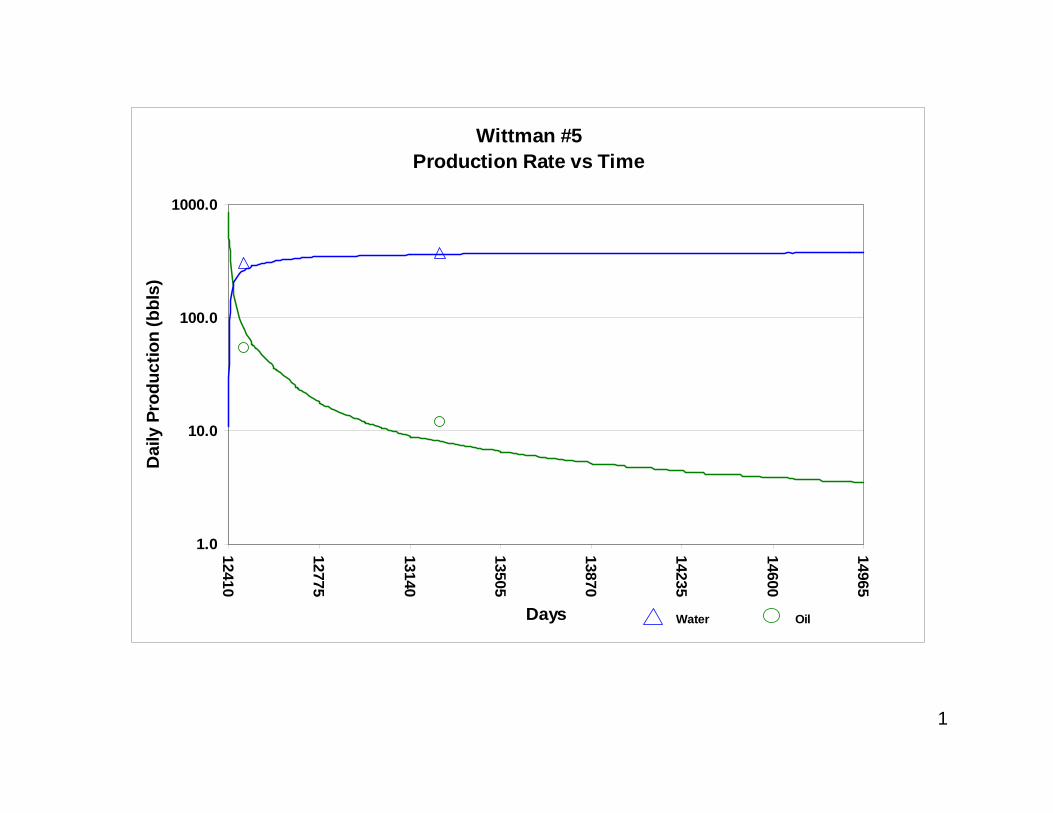
1
Wittman #5Production Rate vs Time
1.0
10.0
100.0
1000.0
12410
12775
13140
13505
13870
14235
14600
14965
Days
Dai
ly P
rodu
ctio
n (b
bls)
Water Oil
2
Well# 19R41, Rate-Time & BHFP
1.0
10.0
100.0
1000.0
12410
13140
13870
Days
Dai
ly P
rodu
ctio
n (b
bls)
0
1000
2000
3000
4000
5000
6000
BH
FP (p
si)

3
Well# 19R43, Rate-Time & BHFP
1
10
100
1000
11680
12410
13140
13870
14600
15330
Days
Dai
ly P
rodu
ctio
n (b
bls)
0
1000
2000
3000
4000
5000
6000
BH
FP (p
si)
4
19S41
1.0
10.0
100.0
1000.0
12410
12775
13140
13505
13870
14235
0
500
1000
1500
2000
2500
3000
5
25R13
1
10
100
1000
12045
12410
12775
13140
13505
13870
14235
Days from Start
BO
PD
6
Well# 25R14, Rate-Time & BHFP
1
10
100
1000
12410
13140
13870
14600
15330
Days
Dai
ly P
rodu
ctio
n (b
bls)
0
1000
2000
3000
4000
5000
6000
BH
FP (p
si)
7
25R22
1
10
100
1000
12045
12410
12775
13140
13505
13870
14235
Days from start
BO
PD
8
25R33
1
10
100
1000
12045
12410
12775
13140
13505
13870
14235
Days from start
BO
PD
9
Well # 25-31, Rate-Time & BHFP
1
10
100
1000
10950
11680
12410
13140
13870
14600
15330
Days
Dai
ly P
rodu
ctio
n (b
bls)
0
1000
2000
3000
4000
5000
6000
BH
FP (p
si)
Water OilBHFP History
BHFP Prediction
10
Well # 25-41, Rate-Time & BHFP
1
10
100
1000
10950
11680
12410
13140
13870
14600
15330
Days
Dai
ly P
rodu
ctio
n (b
bls)
0
1000
2000
3000
4000
5000
6000
BH
FP (p
si)
Water OilBHFP History
BHFP Prediction
11
Well# 25R44, Rate-Time & BHFP
1
10
100
1000
12045
12775
13505
14235
14965
15695
Days
Dai
ly P
rodu
ctio
n (b
bls)
0
1000
2000
3000
4000
5000
6000
BH
FP (p
si)
12
Well# 25S14, Rate-Time & BHFP
1
10
100
1000
12410
13140
13870
14600
15330
Days
Dai
ly P
rodu
ctio
n (b
bls)
0
1000
2000
3000
4000
5000
6000
BH
FP (p
si)
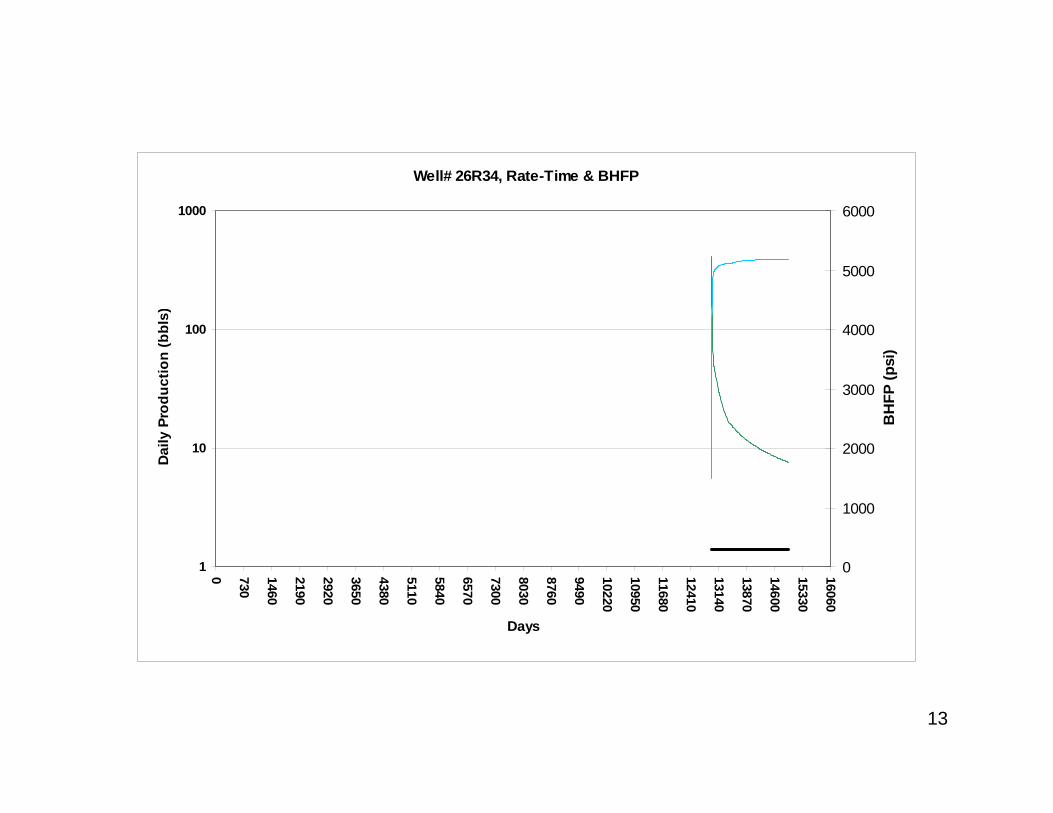
13
Well# 26R34, Rate-Time & BHFP
1
10
100
1000
0 730
1460
2190
2920
3650
4380
5110
5840
6570
7300
8030
8760
9490
10220
10950
11680
12410
13140
13870
14600
15330
16060
Days
Dai
ly P
rodu
ctio
n (b
bls)
0
1000
2000
3000
4000
5000
6000
BH
FP (p
si)
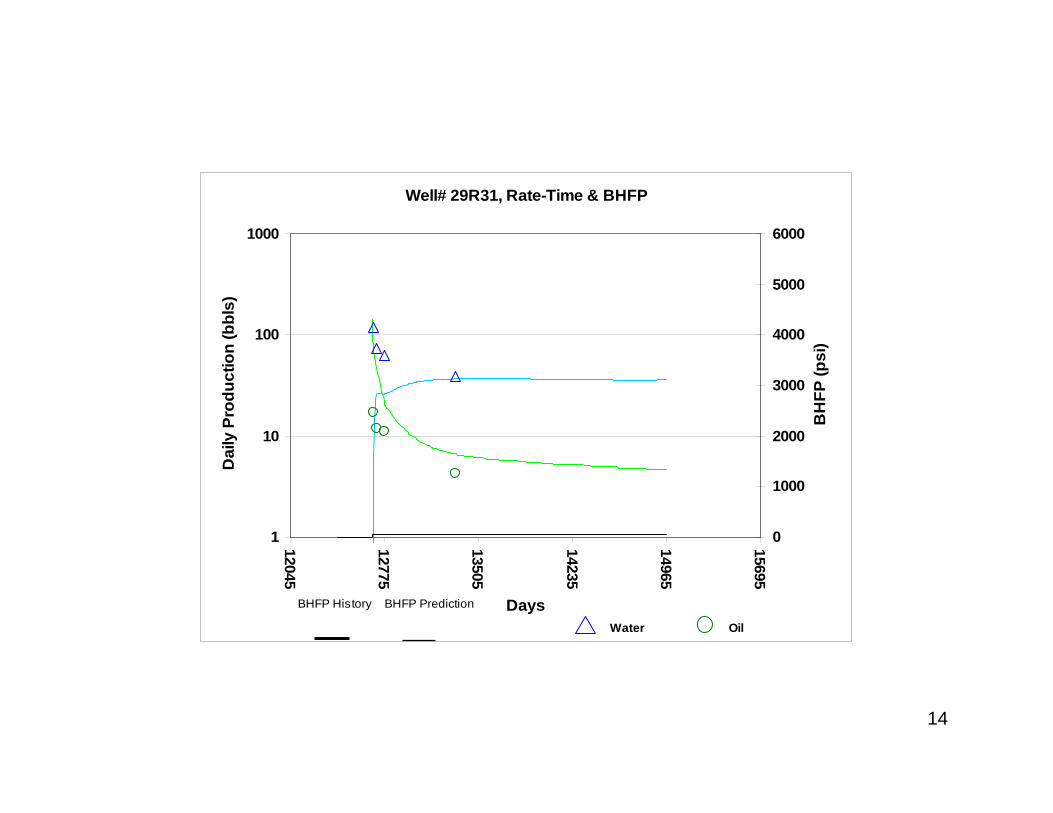
14
Well# 29R31, Rate-Time & BHFP
1
10
100
1000
12045
12775
13505
14235
14965
15695
Days
Dai
ly P
rodu
ctio
n (b
bls)
0
1000
2000
3000
4000
5000
6000
BH
FP (p
si)
BHFP History BHFP Prediction
Water Oil

15
Well# 30R11, Rate-Time & BHFP
1
10
100
1000
12405
13135
13865
14595
15325
Days
Dai
ly P
rodu
ctio
n (b
bls)
0
1000
2000
3000
4000
5000
6000
BH
FP (p
si)
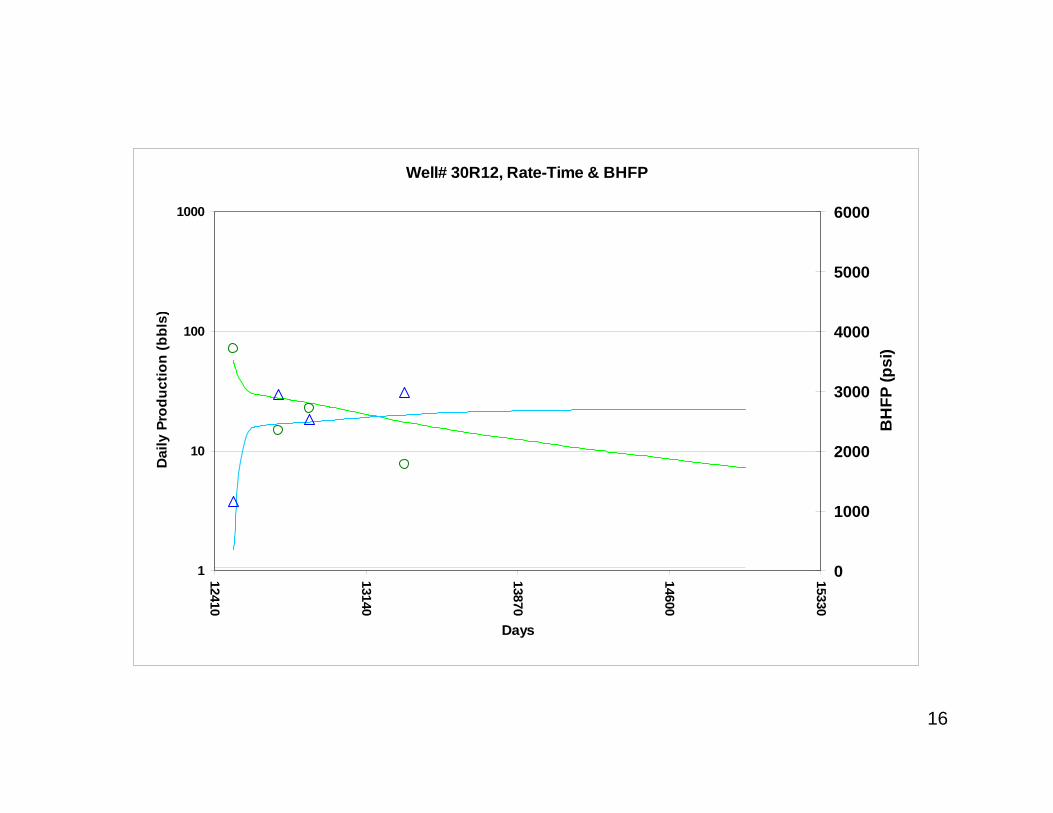
16
Well# 30R12, Rate-Time & BHFP
1
10
100
1000
12410
13140
13870
14600
15330
Days
Dai
ly P
rodu
ctio
n (b
bls)
0
1000
2000
3000
4000
5000
6000
BH
FP (p
si)
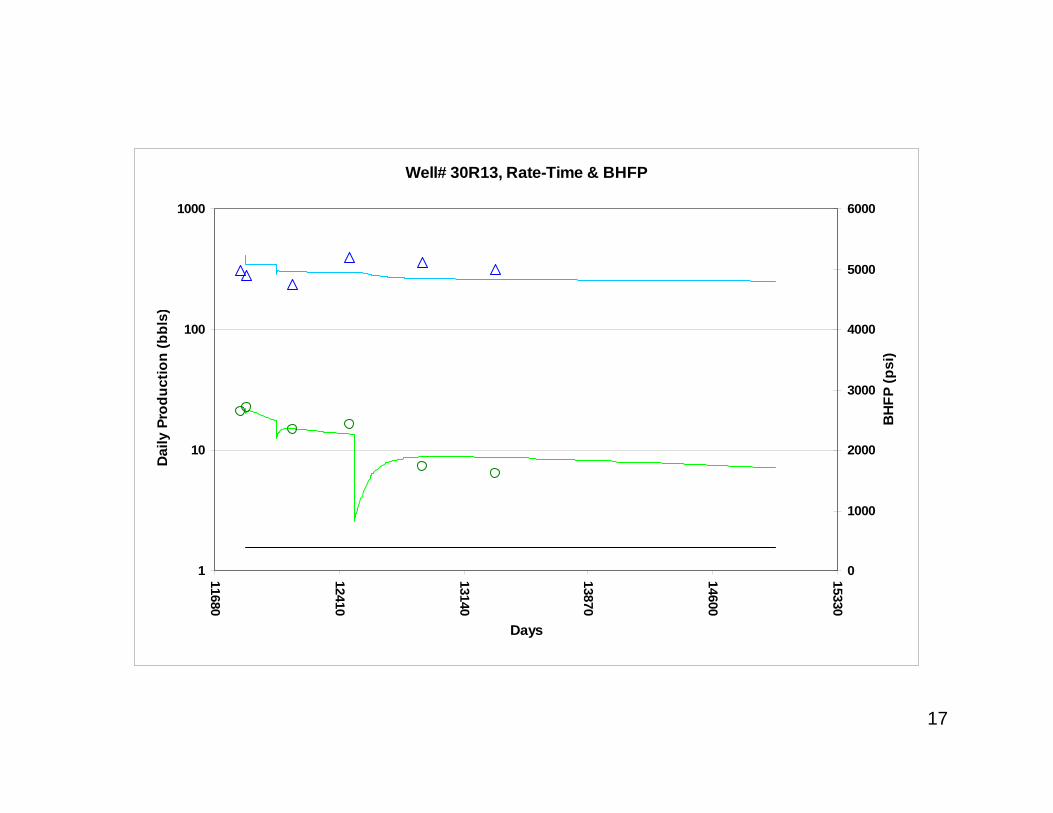
17
Well# 30R13, Rate-Time & BHFP
1
10
100
1000
11680
12410
13140
13870
14600
15330
Days
Dai
ly P
rodu
ctio
n (b
bls)
0
1000
2000
3000
4000
5000
6000
BH
FP (p
si)
18
Well# 30-24, Rate-Time & BHFP
1
10
100
1000
12045
12775
13505
14235
14965
Days
Dai
ly P
rodu
ctio
n (b
bls)
-1000
0
1000
2000
3000
4000
5000
6000
BH
FP (p
si)
BHFP History BHFP Prediction
Water Oil
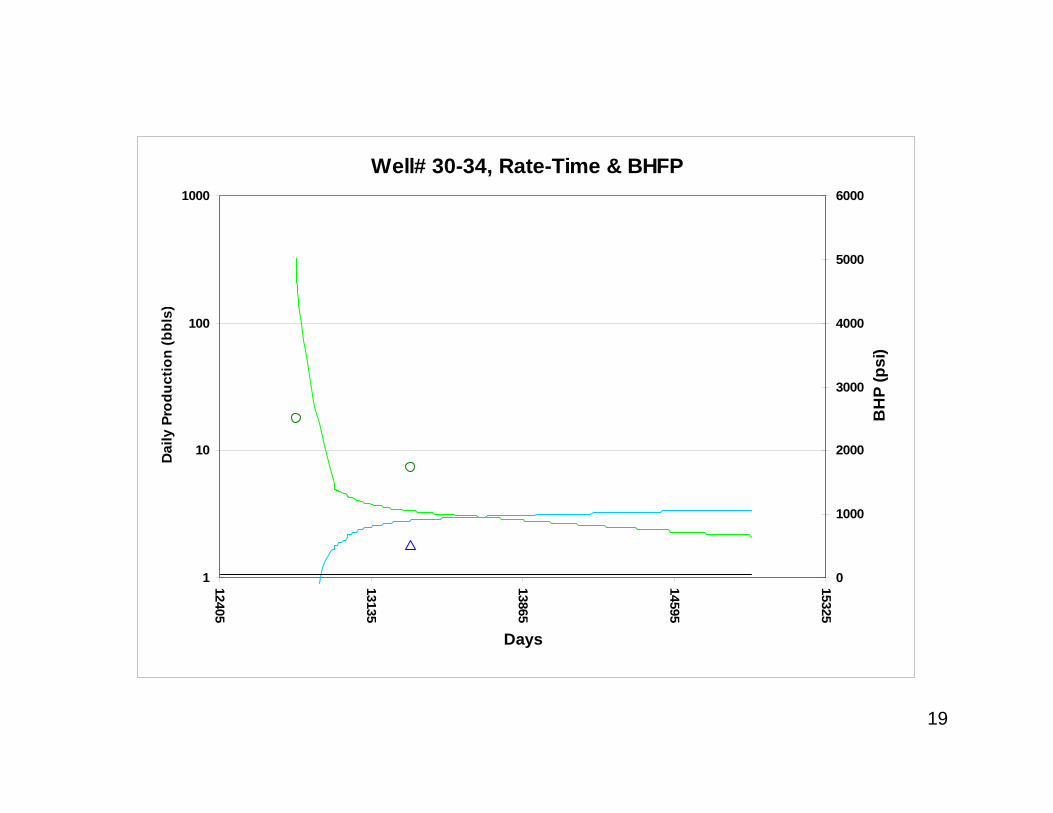
19
Well# 30-34, Rate-Time & BHFP
1
10
100
1000
12405
13135
13865
14595
15325
Days
Dai
ly P
rodu
ctio
n (b
bls)
0
1000
2000
3000
4000
5000
6000
BH
P (p
si)
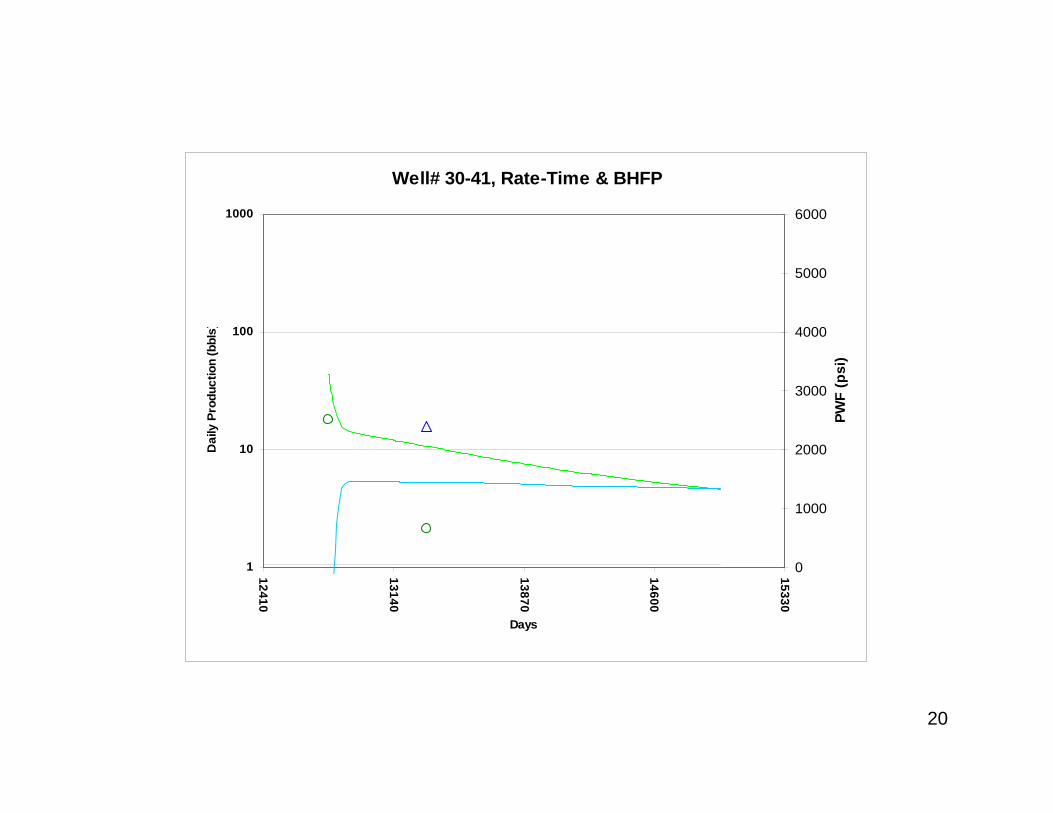
20
Well# 30-41, Rate-Time & BHFP
1
10
100
1000
12410
13140
13870
14600
15330
Days
Dai
ly P
rodu
ctio
n (b
bls)
0
1000
2000
3000
4000
5000
6000
PWF
(psi
)
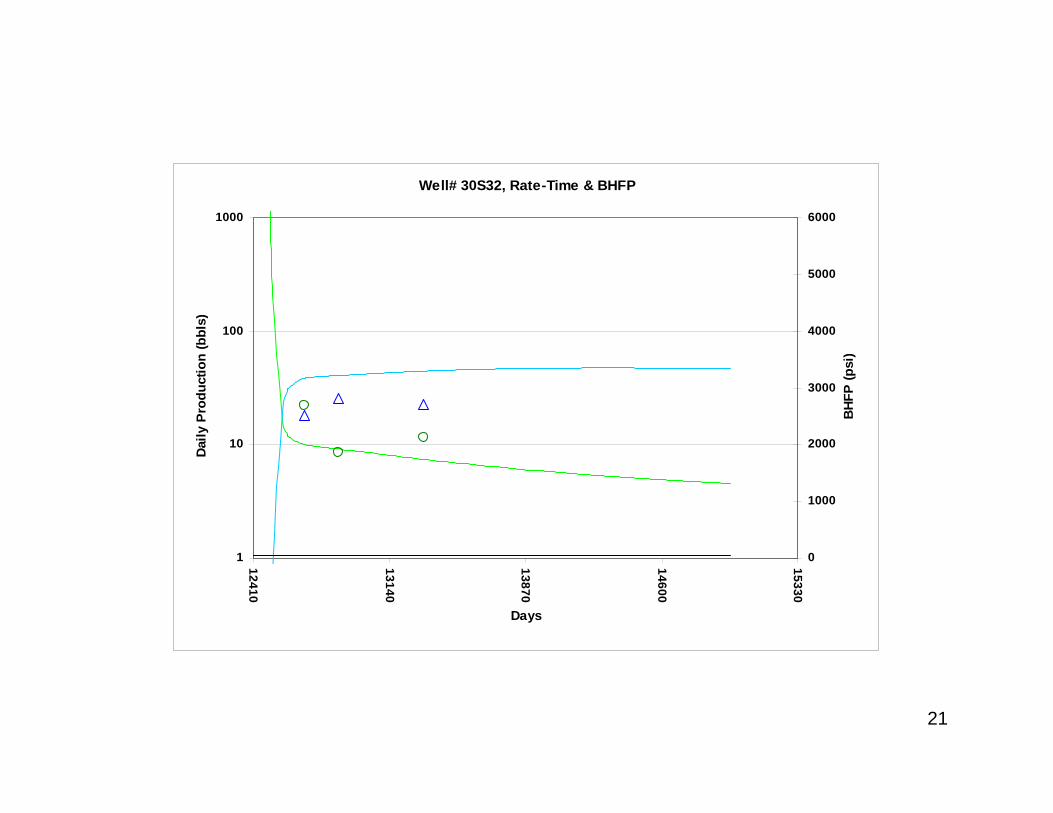
21
Well# 30S32, Rate-Time & BHFP
1
10
100
1000
12410
13140
13870
14600
15330
Days
Dai
ly P
rodu
ctio
n (b
bls)
0
1000
2000
3000
4000
5000
6000
BHF
P (p
si)
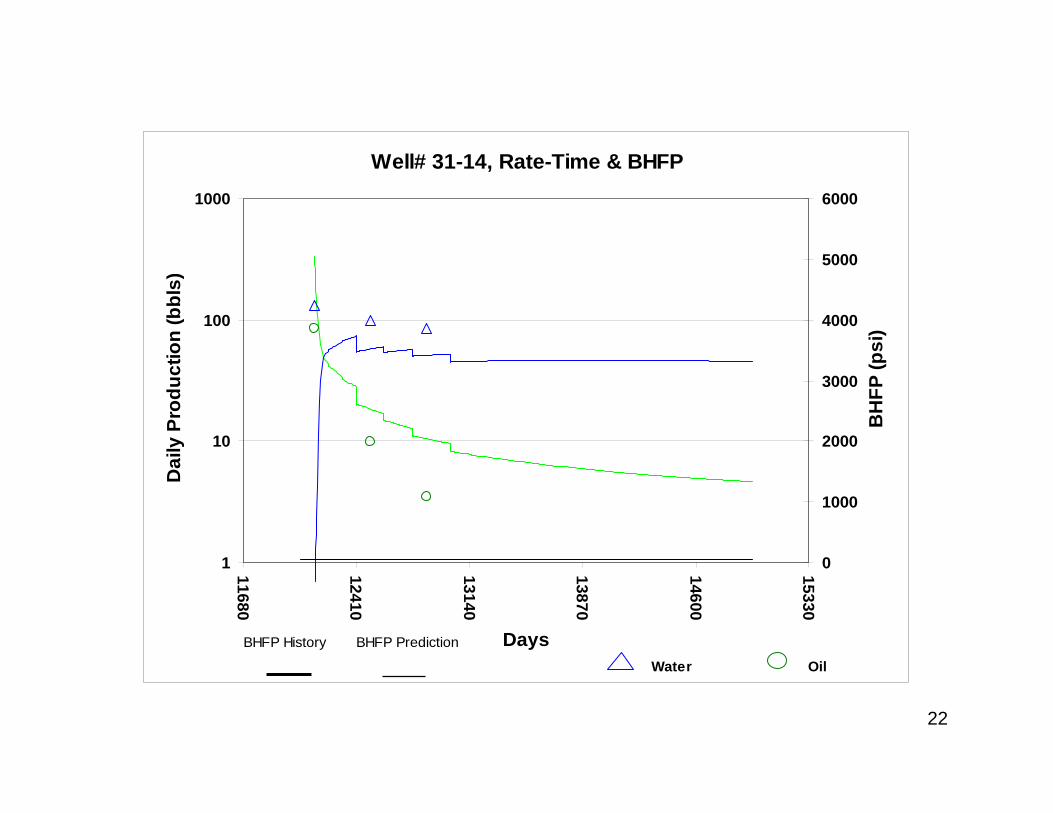
22
Well# 31-14, Rate-Time & BHFP
1
10
100
1000
11680
12410
13140
13870
14600
15330
Days
Dai
ly P
rodu
ctio
n (b
bls)
0
1000
2000
3000
4000
5000
6000
BH
FP (p
si)
BHFP History BHFP Prediction
Water Oil
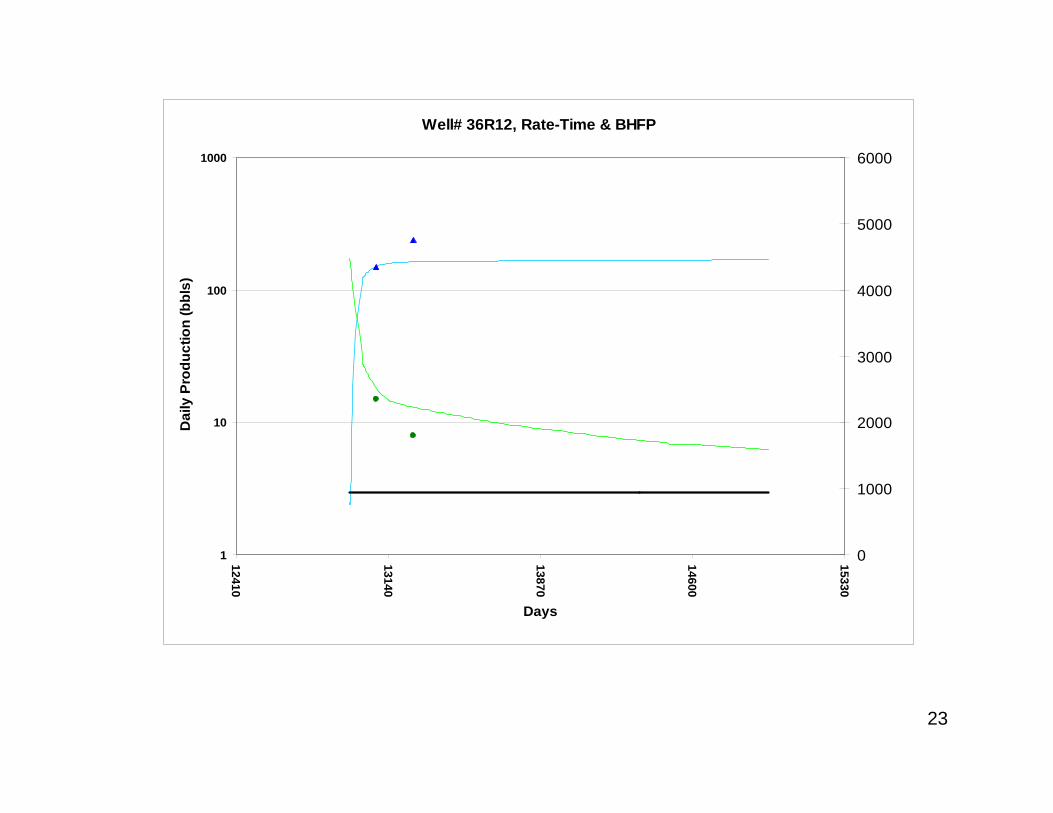
23
Well# 36R12, Rate-Time & BHFP
1
10
100
1000
12410
13140
13870
14600
15330
Days
Dai
ly P
rodu
ctio
n (b
bls)
0
1000
2000
3000
4000
5000
6000