results for quarter i fy 2011 - 12...14th july 2011 109 207 246 dark 1 255 255 255 light 1 131 56...
TRANSCRIPT

14th July 2011
109207246
Dark 1
255255255
Light 1
13156155
Dark 2
099190
Light 2
8516528
Accent 1
2147342
Accent 2
185175164
Accent 3
151757
Accent 4
1931870
Accent 5
25522162
Accent 6
255255255
Hyperlink
23613729
Followed Hyperlink
127175221
Tata Blue 50%
203215238
Tata Blue 25%
179149197
Purple 50 %
212195223
Purple 25 %
255242171
Yellow 50 %
255249213
Yellow 25 %
229205186
Brown 50 %
248241235
Brown 25 %
180213154
Green 50 %
214231200
Green 25 %
241240202
Light Green 50%
251251241
Light Green 25%
Title and Content
14th July 2011
Results for Quarter I FY 2011 - 12

14th July 2011
Disclaimer
Certain statements in this release concerning our future prospects are forward-lookingstatements. Forward-looking statements by their nature involve a number of risks anduncertainties that could cause actual results to differ materially from market expectations.These risks and uncertainties include, but are not limited to our ability to manage growth,intense competition among Indian and overseas IT services companies, various factorswhich may affect our cost advantage, such as wage increases or an appreciating Rupee,our ability to attract and retain highly skilled professionals, time and cost overruns onfixed-price, fixed-time frame contracts, client concentration, restrictions on immigration,our ability to manage our international operations, reduced demand for technology in ourkey focus areas, disruptions in telecommunication networks, our ability to successfullycomplete and integrate potential acquisitions, liability for damages on our servicecontracts, the success of the companies in which TCS has made strategic investments,withdrawal of governmental fiscal incentives, political instability, legal restrictions onraising capital or acquiring companies outside India, unauthorized use of our intellectualproperty and general economic conditions affecting our industry. TCS may, from time totime, make additional written and oral forward-looking statements, including our reportsto shareholders. These forward-looking statements represent only the Company’s currentintentions, beliefs or expectations, and any forward-looking statement speaks only as ofthe date on which it was made. The Company assumes no obligation to revise or updateany forward-looking statements.
2
Highlights

14th July 2011
Indian GAAP Growth Summary
8,217
9,286 9,663
10,157
10,797
7,000
8,000
9,000
10,000
11,000
Q1 FY11 Q2 FY11 Q3 FY11 Q4 FY11 Q1 FY12
Revenue`
Cro
re
2,410
2,776 2,900
3,093 3,033
2,000
2,500
3,000
3,500
Q1 FY11 Q2 FY11 Q3 FY11 Q4 FY11 Q1 FY12
PBIDT (before Other Income)
`C
rore
1,906
2,169 2,370
2,623 2,415
1,500
2,000
2,500
3,000
Q1 FY11 Q2 FY11 Q3 FY11 Q4 FY11 Q1 FY12
Profit After Tax
`C
rore
4
6.2%
13.0%
4.1%5.1% 6.3%
14.0%
24.9% 26.3%31.3% 31.4%
0%
10%
20%
30%
40%
Q1 FY11 Q2 FY11 Q3 FY11 Q4 FY11 Q1 FY12
Q-o-Q Revenue Growth Y-o-Y Revenue Growth
3.0%
15.2%
4.4%6.7%
-1.9%
22.6%
31.1%27.6%
32.2%25.9%
-10%
0%
10%
20%
30%
40%
Q1 FY11 Q2 FY11 Q3 FY11 Q4 FY11 Q1 FY12
Q-o-Q PBIDT Growth Y-o-Y PBIDT Growth
-4.7%
13.8% 9.2%10.7%
-7.9%
24.3%32.1% 29.9% 31.1% 26.7%
-30%
-15%
0%
15%
30%
45%
Q1 FY11 Q2 FY11 Q3 FY11 Q4 FY11 Q1 FY12
Q-o-Q PAT Growth Y-o-Y PAT Growth

14th July 2011
IFRS Revenue Growth
74,920 83,648 87,738 92,588 97,887
7,252 9,216 8,896 8,987 10,084 82,173
92,864 96,633 101,575 107,970
10,000
30,000
50,000
70,000
90,000
110,000
Q1 FY11 Q2 FY11 Q3 FY11 Q4 FY11 Q1 FY12
Revenue Mix
International Revenue India Revenue
`M
illio
n
6.3%11.6%
4.9% 5.5% 5.7%
14.4%
22.4% 25.3%31.4% 30.7%
0%
10%
20%
30%
40%
50%
Q1 FY11 Q2 FY11 Q3 FY11 Q4 FY11 Q1 FY12
International Revenue
Q-0-Q Growth Y-0-Y Growth
6.2%
13.0%
4.1%5.1% 6.3%
14.0%
24.9% 26.3%31.3% 31.4%
0%
10%
20%
30%
40%
Q1 FY11 Q2 FY11 Q3 FY11 Q4 FY11 Q1 FY12
Revenue Growth
Q-0-Q Growth Y-0-Y Growth
5.3%
27.1%
-3.5%1.0%
12.2%9.8%
53.5%
37.2%30.5%
39.0%
-20%
0%
20%
40%
60%
Q1 FY11 Q2 FY11 Q3 FY11 Q4 FY11 Q1 FY12
India Revenue
Q-0-Q Growth Y-0-Y Growth
5

14th July 2011
IFRS Growth Summary
36,942
41,757 43,880
46,370 47,795
35,000
40,000
45,000
50,000
Q1 FY11 Q2 FY11 Q3 FY11 Q4 FY11 Q1 FY12
Gross Income
`M
illio
n
22,579
26,115 27,318
28,757 28,261
20,000
23,000
26,000
29,000
Q1 FY11 Q2 FY11 Q3 FY11 Q4 FY11 Q1 FY12
Operating Income
`M
illio
n
24,154
27,775 29,175
30,880 30,309
22,000
26,000
30,000
34,000
Q1 FY11 Q2 FY11 Q3 FY11 Q4 FY11 Q1 FY12
EBITDA
`M
illio
n
18,632 21,263
23,460 23,809 23,803
15,000
20,000
25,000
Q1 FY11 Q2 FY11 Q3 FY11 Q4 FY11 Q1 FY12
Net Income
`M
illio
n12.5%
22.7% 23.5% 28.1% 29.4%
2.0% 13.0%5.1% 5.7% 3.1%
-20%
0%
20%
40%
Q1 FY11 Q2 FY11 Q3 FY11 Q4 FY11 Q1 FY12
Y-o-Y Growth Q-o-Q Growth
26.2%33.7% 30.8% 35.1%
25.2%
6.1%15.7%
4.6% 5.3% -1.7%
-20%
0%
20%
40%
Q1 FY11 Q2 FY11 Q3 FY11 Q4 FY11 Q1 FY12
Y-o-Y Growth Q-o-Q Growth
23.1%30.1% 28.4% 33.6%
25.5%
4.5%
15.0% 5.0% 5.8% -1.8%
-20%
0%
20%
40%
Q1 FY11 Q2 FY11 Q3 FY11 Q4 FY11 Q1 FY12
Y-o-Y Growth Q-o-Q Growth
22.6%30.9% 30.5%
22.2% 27.8%
-4.3%14.1% 10.3%
1.5% 0.0%
-20%
0%
20%
40%
Q1 FY11 Q2 FY11 Q3 FY11 Q4 FY11 Q1 FY12
Y-o-Y Growth Q-o-Q Growth
6

Operational Performance

14th July 2011
52.9%
3.1%
15.3%
9.9%
9.3%
7.3% 2.2%North America
Latin America
UK
Continental Europe
India
Asia Pacific
MEA
Growth by Market
Americas
North America 52.9 53.4
Latin America 3.1 3.2
Europe
UK 15.3 15.5
Continental Europe 9.9 9.9
India 9.3 8.8
Asia Pacific 7.3 7.2
MEA 2.2 2.0
Total 100.0 100.0
Geography (% ) Q1 FY12 Q4 FY11
8

14th July 2011
43.3%
11.7%
11.6%
7.6%
5.8%
5.2%3.7%
3.8%2.2% 5.1%
BFSI
Telecom
Retail & Distribution
Manufacturing
Hi-Tech
Life Sciences & Healthcare
Travel & Hospitality
Energy & Utilities
Media & Entertainment
Others
Growth by Domain
BFSI 43.3 44.0
Telecom 11.7 11.0
Retail & Distribution 11.6 11.2
Manufacturing 7.6 7.5
Hi-Tech 5.8 5.4
Life Sciences & Healthcare 5.2 5.3
Travel & Hospitality 3.7 3.9
Energy & Utilities 3.8 4.6
Media & Entertainment 2.2 2.3
Others 5.1 4.8
Total 100.0 100.0
Q1 FY12IP Revenue (%) Q4 FY11
9

14th July 2011
Growth by Service Line
46.2%
4.9%10.8%
7.3%
4.6%
9.5%
2.2%3.6%
10.9% Application Development & Maint.
Business Intelligence
Enterprise Solutions
Assurance Services
Engineering & Industrial Services
Infrastructure Services
Global Consulting
Asset Leverage Solutions
Business Process Outsourcing
SP Revenue (%) Q1 FY12 Q4 FY11
IT Solutions and Services
Application Development & Maint. 46.2 46.1
Business Intelligence 4.9 4.9
Enterprise Solutions 10.8 10.8
Assurance Services 7.3 7.0
Engineering & Industrial Services 4.6 4.8
Infrastructure Services 9.5 9.1
Global Consulting 2.2 2.1
Asset Leverage Solutions 3.6 3.6
Business Process Outsourcing 10.9 11.6
Total 100.0 100.0
10

14th July 2011
Client Parameters
11
Clients Contribution *
Revenue %
Top 1 7.1 7.4
Top 5 20.7 21.4
Top 10 28.9 29.6
US$ 1 mln Clients 473 458
US$ 5 mln Clients 219 208
US$ 10 mln Clients 148 143
US$ 20 mln Clients 91 81
US$ 50 mln Clients 33 27
US$ 100 mln Clients 10 8
* Last Twelve Months
Q1 FY12 Q4 FY11

14th July 2011
Operational Parameters
12
Onsite 44.8 44.7
GDC/RDC 4.6 5.0
Offshore 50.6 50.3
Time & Material 50.3 50.5
Fixed Price & Time 49.7 49.5
* Excluding Domestic Clients
Revenue % Q1 FY12 Q4 FY11
Contract Type
Delivery Location*

14th July 2011
Client Acquisition and Expansion
13
Particulars Q1 FY12 Q4 FY11
Active Clients 959 969
New Clients 24 39
Revenue % from Repeat Business 99.8 97.1
Revenue % from New Business * 0.2 2.9
* Reset at the beginning of Financial Year

14th July 2011
Key Wins
14
A large US Insurance company has selected TCS as a strategic partner in their
initiative to transform their entire personal lines.
A leading North American bank has selected TCS as their strategic partner for
providing end to end solutions for their wealth management portfolio.
One of North Americas large banks has chosen TCS as its business operations
partner for providing BPO services for its mortgages and lending operations.
TCS has been selected by a Middle East government organization to develop
their application system and support their BPO operations.
One of the largest Japanese banking group has selected TCS Bancs Corporate
Actions for its US operations.

14th July 2011
Key Wins (cont..)
15
One of the world' leading pharmaceutical company has selected TCS for
quality assurance & process compliance services.
A leader in the energy products and services market in North America has
selected TCS as a strategic partner for its application management and
development services.
A leading US healthcare organization has entered into a multi-year multi-
million dollar outsourcing deal with TCS to provide IT & Assurance services for
its care delivery and regional business applications portfolio.
A leading European apparel retailer has selected TCS as a strategic partner
for application development and testing services.
TCS has been selected as the implementation partner for a region under the
Restructured Accelerated Power Development and Reform Program being run
by Ministry of Power.

Human Resources

14th July 2011
Total Employee Base
* CMC, e-Serve & Diligenta
TCS Employees : 202,190 (consolidated)
Subsidiaries* : 24,275
17

14th July 2011
Q1 Excluding Subsidiaries - Gross Additions 9,817 & Net Additions 2,542
Gross Additions:
• 2,411 Trainees & 7,752 Laterals in India
• 1,825 employees overseas Attrition*:
• 14.8% (LTM), including BPO
• IT Services: 13.56% (LTM)
• BPO: 25.49% (LTM)
Utilization Rate*:
• 83.2% (excluding Trainees)
• 76.2% (including Trainees)
* Excluding Subsidiaries: CMC, e-Serve & Diligenta
Q1 Consolidated - Gross Additions 11,988 & Net Additions 3,576
18

14th July 2011
• 30.1% of our workforce are women
• 59.7% of our associates have more than 3 years of work experience
• Associates from 100 nationalities
Indians93.2%
Others6.8%
British17.3%
Chilean9.3%
Hungarian4.2%
Ecuadorian11.3%
Uruguayan6.7%
Brazilian3.0%
Chinese9.4%
American14.7%
Mexican7.8%
Others16.3%
TCS Consolidated (Including Subsidiaries CMC, e-Serve & Diligenta)
Composition of International Workforce (Consolidated)
Diversity
19

Annexure

14th July 2011
Indian GAAP Income Statement - Consolidated
INCOME
a) IT & Consultancy Services 10,444 9,847 7,967 96.73 96.95 96.95
b) Manufacturing, Sale of equipment and Licences 353 310 250 3.27 3.05 3.05
Total Income 10,797 10,157 8,217 100.00 100.00 100.00
EXPENDITURE
a ) Salaries & Wages 4,206 3,724 3,039 38.95 36.66 36.98
b ) Overseas business expenditure 1,547 1,479 1,253 14.33 14.56 15.25
c) Other operating expenses 2,011 1,861 1,515 18.63 18.33 18.44
Total Expenditure 7,764 7,064 5,807 71.91 69.55 70.67
Profit Before Interest, Depreciation, Taxes
& Other Income 3,033 3,093 2,410 28.09 30.45 29.33
Interest 5 3 3 0.04 0.03 0.03
Depreciation 208 213 162 1.93 2.10 1.97
Profit Before Taxes & Other Income 2,820 2,877 2,245 26.12 28.32 27.33
Other income (expense), net 294 243 95 2.72 2.40 1.16
Profit Before Taxes 3,114 3,120 2,340 28.84 30.72 28.49
Provision For Taxes 673 464 402 6.24 4.57 4.90
Profit After Taxes From Operations 2,441 2,656 1,938 22.60 26.15 23.59
Minority Interest (26) (33) (32) (0.24) (0.33) (0.38)
Net Profit 2,415 2,623 1,906 22.36 25.82 23.21
Consolidated Indian GAAP ` Crore % of Total Income
Q1 FY12 Q4 FY11 Q1 FY11 Q1 FY12 Q4 FY11 Q1 FY11
21

14th July 2011
Indian GAAP Balance Sheet - Consolidated
22
30-Jun-11 31-Mar-11 30-Jun-11 31-Mar-11
Source of Funds
Shareholders' Funds 26,300 24,505 96.39 96.23
Minority Interest 485 458 1.78 1.80
Loan Funds 39 69 0.14 0.27
Deferred Tax Liability 136 109 0.50 0.43
Non Current Liabilities 325 322 1.19 1.27
Total Liabilities 27,285 25,464 100.00 100.00
Application of Funds
Fixed Assets (net) 5,653 5,441 20.72 21.37
Goodwill 3,248 3,232 11.90 12.69
Deferred Tax Asset 195 160 0.72 0.63
Investments 1,955 1,763 7.17 6.92
Cash and Bank Balance 7,339 7,378 26.90 28.97
Current Assets, Loans and Advances 13,977 11,692 51.22 45.92
Current Liabilities and Provisions 8,301 7,188 30.42 28.23
Net Current Assets 13,015 11,882 47.70 46.66
Non Current Assets 3,219 2,986 11.79 11.73
Total Assets 27,285 25,464 100.00 100.00
Consolidated Indian GAAP` Crore %
14th July 2011
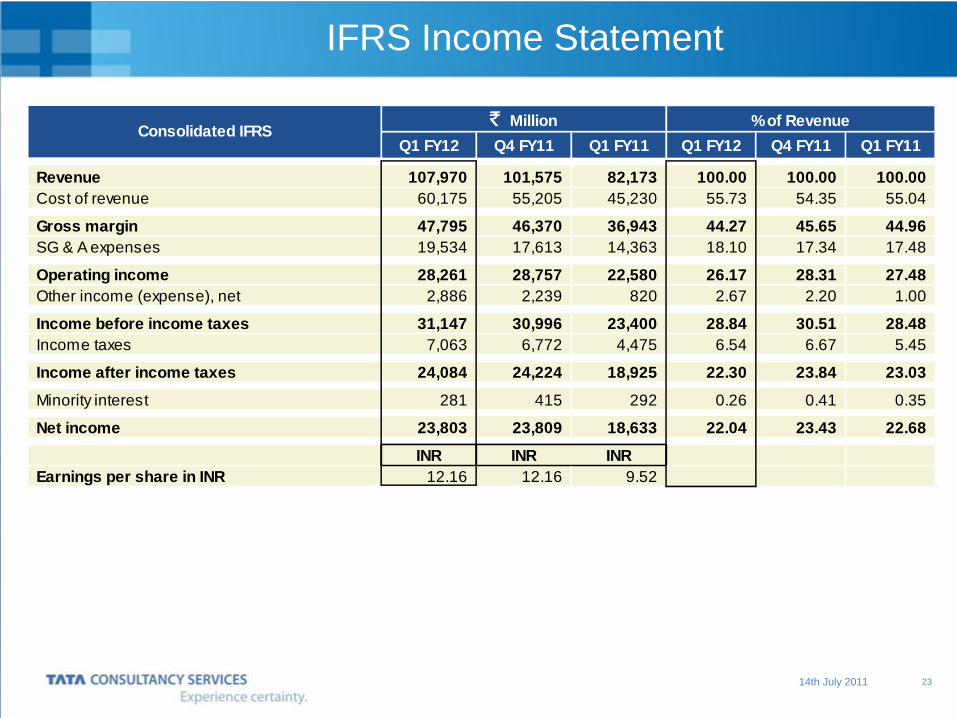
Q1 FY12 Q4 FY11 Q1 FY11 Q1 FY12 Q4 FY11 Q1 FY11
Revenue 107,970 101,575 82,173 100.00 100.00 100.00
Cost of revenue 60,175 55,205 45,230 55.73 54.35 55.04
Gross margin 47,795 46,370 36,943 44.27 45.65 44.96
SG & A expenses 19,534 17,613 14,363 18.10 17.34 17.48
Operating income 28,261 28,757 22,580 26.17 28.31 27.48
Other income (expense), net 2,886 2,239 820 2.67 2.20 1.00
Income before income taxes 31,147 30,996 23,400 28.84 30.51 28.48
Income taxes 7,063 6,772 4,475 6.54 6.67 5.45
Income after income taxes 24,084 24,224 18,925 22.30 23.84 23.03
Minority interest 281 415 292 0.26 0.41 0.35
Net income 23,803 23,809 18,633 22.04 23.43 22.68
INR INR INR
Earnings per share in INR 12.16 12.16 9.52
Consolidated IFRS` Million % of Revenue
IFRS Income Statement
23

14th July 2011
COR – SG&A Details
24

14th July 2011
` Million % ` Million %
Assets
Cash and cash equivalents 14,913 4.20 15,539 4.74
Accounts receivable 90,932 25.57 82,007 25.01
Unbilled revenues 16,373 4.61 13,490 4.11
Other current financial assets 56,254 15.83 39,335 12.00
Other non current financial assets 27,969 7.87 33,096 10.09
Property and equipment 54,168 15.24 51,996 15.86
Intangible assets and Goodwill 33,845 9.52 33,791 10.31
Investments 20,472 5.76 18,390 5.61
Other current assets 15,560 4.38 14,485 4.42
Other non current assets 24,969 7.02 25,754 7.85
Total assets 355,455 100.00 327,883 100.00
Liabilities and Shareholders' Equity
Current liabilities 60,949 17.15 58,335 17.79
Short term borrowings 17 0.00 328 0.10
Redeemable preference shares 1,000 0.28 1,000 0.30
Long term borrowings 40 0.01 56 0.02
Other non-current liabilities 11,644 3.28 10,973 3.35
Minority interest 3,274 0.92 3,147 0.96
Shareholders' Funds 278,531 78.36 254,044 77.48
Total Liabilities 355,455 100.00 327,883 100.00
Consolidated IFRS30-Jun-11 31-Mar-11
IFRS Balance Sheet
25

14th July 2011
Q1 FY12 Q4 FY11 Q1 FY11 Q1 FY12 Q4 FY11 Q1 FY11
Revenue 2,412 2,244 1,794 100.00 100.00 100.00
Cost of revenue 1,344 1,219 987 55.73 54.33 55.04
Gross margin 1,068 1,025 807 44.27 45.67 44.96
SG & A expenses 437 389 314 18.10 17.34 17.48
Operating income 631 636 493 26.17 28.33 27.48
Other income (expense), net 65 49 18 2.67 2.20 1.00
Income before income taxes 696 685 511 28.84 30.53 28.48
Income taxes 158 149 97 6.54 6.66 5.42
Income after income taxes 538 536 414 22.30 23.87 23.06
Minority Interest 6 9 7 0.26 0.41 0.37
Net Income 532 526 407 22.04 23.46 22.69
USD USD USD
Earnings Per Share in USD 0.27 0.27 0.21
$ Million % of RevenueConsolidated IFRS
IFRS Income Statement – In USD
26

14th July 2011
COR – SG&A Details – In USD
27
14th July 2011
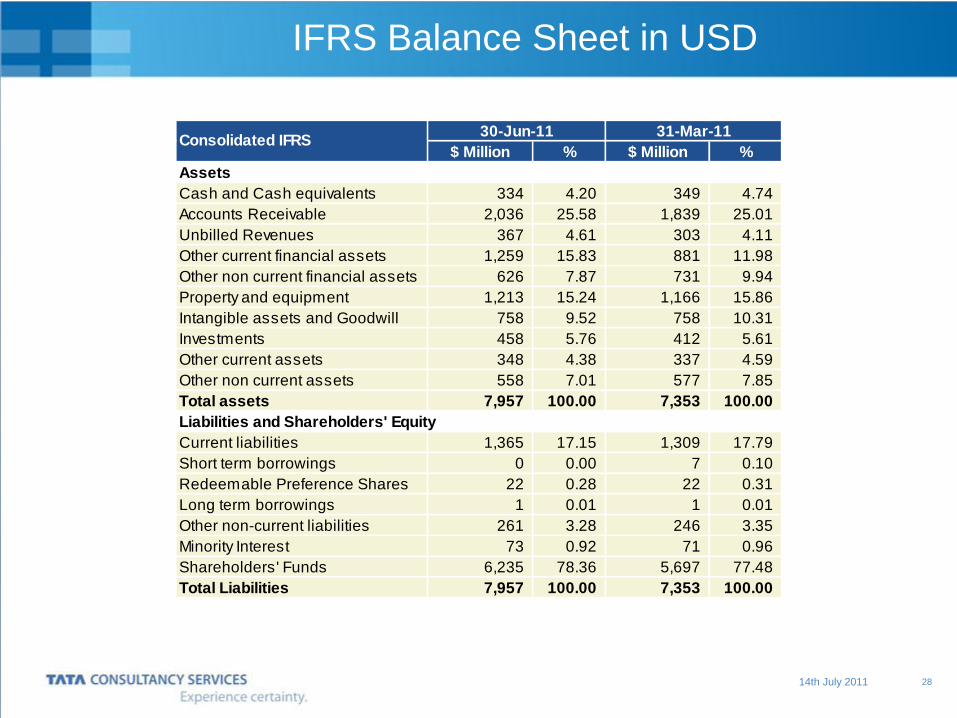
IFRS Balance Sheet in USD
$ Million % $ Million %
Assets
Cash and Cash equivalents 334 4.20 349 4.74
Accounts Receivable 2,036 25.58 1,839 25.01
Unbilled Revenues 367 4.61 303 4.11
Other current financial assets 1,259 15.83 881 11.98
Other non current financial assets 626 7.87 731 9.94
Property and equipment 1,213 15.24 1,166 15.86
Intangible assets and Goodwill 758 9.52 758 10.31
Investments 458 5.76 412 5.61
Other current assets 348 4.38 337 4.59
Other non current assets 558 7.01 577 7.85
Total assets 7,957 100.00 7,353 100.00
Liabilities and Shareholders' Equity
Current liabilities 1,365 17.15 1,309 17.79
Short term borrowings 0 0.00 7 0.10
Redeemable Preference Shares 22 0.28 22 0.31
Long term borrowings 1 0.01 1 0.01
Other non-current liabilities 261 3.28 246 3.35
Minority Interest 73 0.92 71 0.96
Shareholders' Funds 6,235 78.36 5,697 77.48
Total Liabilities 7,957 100.00 7,353 100.00
Consolidated IFRS30-Jun-11 31-Mar-11
28
Thank YouThank You