results as at 31 march 2004 - bnp paribas to generate a sharp rise in consumer lending (+14.1%...
TRANSCRIPT

Paris, 6 May 2004,
SHARP RISE IN RESULTS:
GROSS OPERATING INCOME: �������������� �OPERATING INCOME: �������������� �
NET INCOME GROUP SHARE: �������������� �
RISE IN THE RESULTS OF ALL THE CORE BUSINESSES
INTERNAL GROWTH:
NET BANKING INCOME: ������������ �
+4.5% AT CONSTANT SCOPE AND EXCHANGE RATES
EXPANSION DRIVE:
ACQUISITIONS AND PARTNERSHIP ALLIANCES IN EUROPE AND IN THE US
ACCELERATED PACE OF CUSTOMER BASE GROWTH IN RETAIL BANKING
CONSOLIDATED POSITIONSAS ONE OF EUROPE’S LEADING CORPORATE & INVESTMENT BANKING GROUPS
ResultsAs at 31 March 2004

�������������������������������� ��
2
On 5 May 2004, BNP Paribas’ Board of Directors, chaired by Michel Pébereau, reviewed the Group’s results for the firstthree months of the year.
� ��������������
The first quarter 2004 saw the continuation of thecontrasting economic and financial trends from the end of2003 – a clear recovery in the United States but weakgrowth in Europe, rising equity markets but a weaker dollarexchange rate as compared with the beginning of 2003.
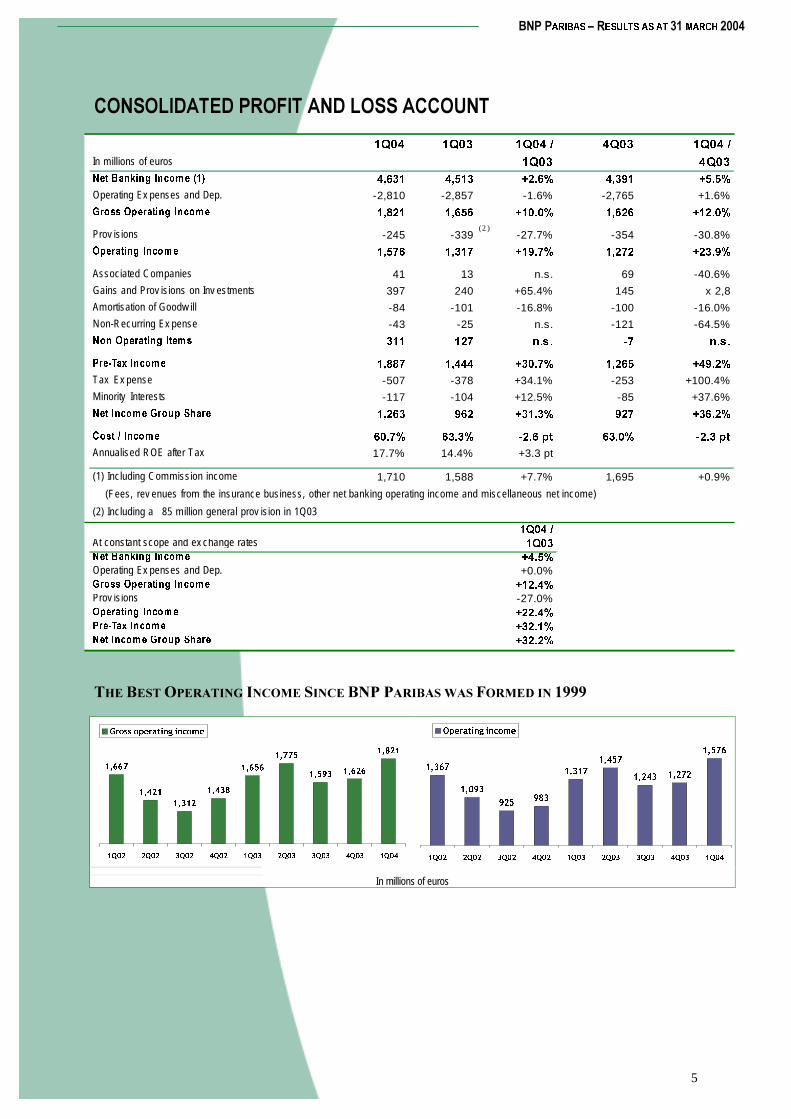
BNP Paribas capitalised on this mixed environment andposted EUR 4,631 million in quarterly net banking income,up 2.6% compared with the first quarter 2003. Thedollar/euro exchange rate, down 13% compared to the firstquarter 2003, obviously weighed in on this trend. Atconstant scope and exchange rates, net banking incomegrew 4.5%.
Operating expenses and depreciation remained undercontrol, declining 1.6% compared to the first quarter 2003(0.0% at constant scope and exchange rates).
Gross operating income thus came to EUR 1,821 million,the highest level since BNP Paribas was formed in 1999,and up 10.0% compared to the first quarter 2003 (+12.4%at constant scope and exchange rates). The cost/incomeratio, at 60.7%, improved 2.6 points and confirmed theGroup’s highly competitive position in the Eurozone.
The net addition to provisions (EUR 245 million) was 27.7%less than in the first quarter 2003.
Operating income for the quarter thus totalled EUR 1,576million, up 19.7% (+22.4% at constant scope and exchangerates) compared to the first quarter 2003. This is also aquarterly record for the Group.
The context of recovering equity markets over the past yearhelped generate a sharp rise in capital gains (EUR 397million) compared to the first quarter 2003 (EUR 240million).
At EUR 1,263 million, net income group share jumped31.3% compared to the first quarter 2003 (+32.2% atconstant scope and exchange rates).
Annualised return on equity was 17.7%. The Tier one ratiowas estimated to be 8.9% as at 31 March 2004 and thebook value per share was EUR 32.4.
All the Group’s core businesses contributed to thisperformance.
�
� �
��� ������������������������������������������������������ ��������������
������� !���"# "$
The net banking income of the Retail Banking businessesrose a fresh 2.2% compared to the first quarter 2003, atEUR 2,420 million (+3.8% at constant scope and exchangerates). Gross operating income (EUR 915 million)surpassed the first quarter 2003 level by 4.5% and pre-taxincome came to EUR 697 million (+7.9% and +9.8% atconstant scope and exchange rates).
%&�"'(����� !���"# "$�)%��*
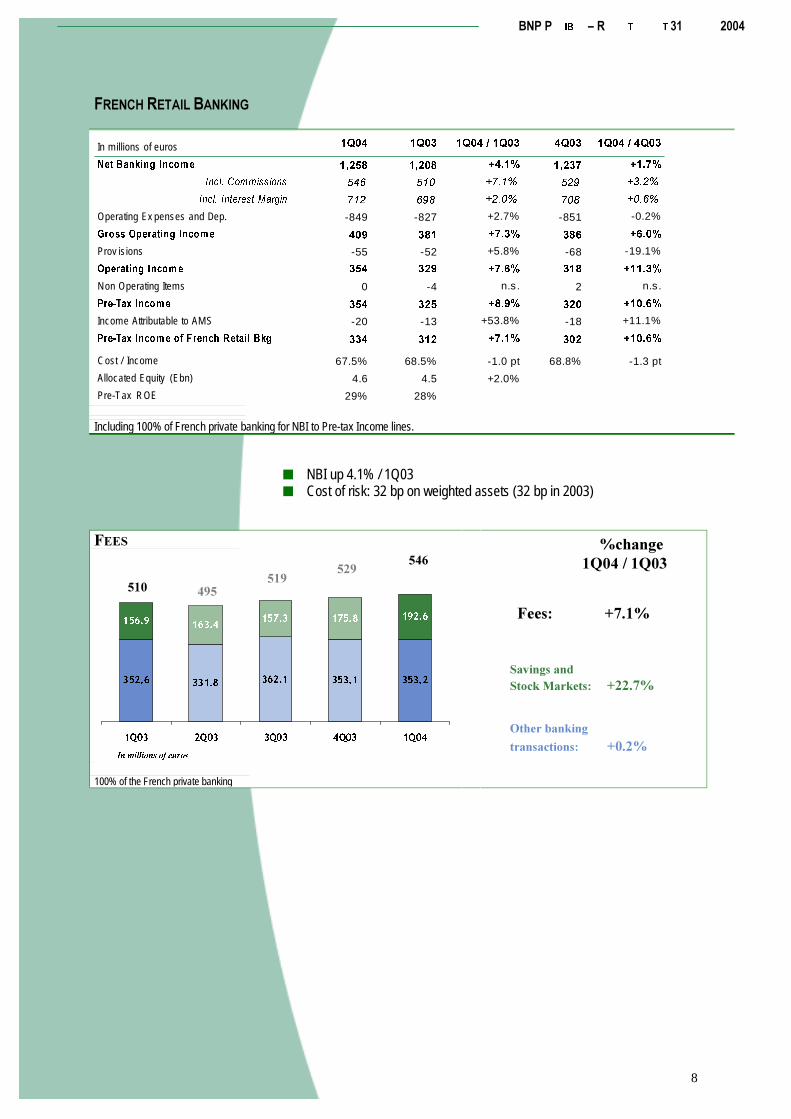
In the French Retail Banking branch network(1), net bankingincome was up 4.1% at EUR 1,258 million compared to thefirst quarter 2003. Net interest revenue edged up 2.0% toEUR 712 million and fees rose 7.1% to EUR 546 milliondue to the growth in fees from financial savings. Controlledoperating expenses and depreciation (+2.7%) helped pushgross operating income up 7.3%. The cost/income againimproved at 67.5% (compared to 68.5% in the first quarter2003). Pre-tax income (EUR 354 million) rose 8.9%.
1 ) Including 100% of Private Banking in France.
After allocating one-third of French Private Banking incometo AMS, French Retail Banking’s pre-tax income was up7.1% at EUR 334 million.
The core business achieved excellent performance insavings inflows (life insurance and savings accounts). Itcontinued to generate a sharp rise in consumer lending(+14.1% compared to the first quarter 2003). Corporatelending rose compared to the fourth quarter 2003 (+1.4%)despite a sluggish market. The pace of the growth in thenumber of individual cheque and deposit accounts was onthe rise (+28,400 as compared to +23,000 in the firstquarter 2003).

�������������������������������� ��
3
�"��&"�� +"�!� ���� !� ��"# "$� �",� % "�"' �!� ��&- '�.)��%�*
The fall in the dollar/euro exchange rate in the first quartercompared to the first quarter 2003 weighed in on the IRFSbusinesses’ results. Net banking income rose a mere 0.8%to EUR 1,204 million, operating expenses and depreciationfell 1.2% to EUR 678 million and gross operating incomeedged up 3.3% to EUR 526 million.
Despite the fall in the dollar, the business’ pre-tax incomedid nevertheless rise 8.7% to EUR 363 million.
The cost/income ratio (56.3%) improved 1.1 pointscompared to the first quarter 2003.
At constant scope and exchange rates, the rises betterreflect underlying economic trends: net banking incomerose 3.8%, operating expenses and depreciation edged up0.8% and gross operating income grew 8.0%. Lastly, pre-tax income soared 12.4%.
BancWest boosted its pre-tax income by 0.7% but by12.7% at constant scope and exchange rates. Net bankingincome in dollars rose 2.9% as the continued diminution ofthe interest margin due to low interest rates reduced theeffects of the substantial growth in outstanding loans anddeposits (+9.0% and +9.9% respectively).
The acquisitions currently under way of Community Firstand Union Safe Deposit, banks based in the western regionof the United States, mark a new significant phase inBancWest’s continued growth strategy in this fast-growingregion of the United States.
Cetelem continued its robust growth. Pre-tax income grew12.8% (+11.9% at constant scope and exchange rates), netbanking income rose 11%, helped in particular by the fullconsolidation of the subsidiaries in Poland and Brazil(+7.1% at constant scope and exchange rates). Growth inoutstanding loans was 7.0% compared to the first quarter2003, driven by new loans in France (in particular its own-account business: +7%) as well as abroad (+24%).
BNP Paribas Lease Group, UCB and Arval PHH continuedtheir expansion across Europe with the launch of UCB inGreece and Arval PHH's purchase of Arma, which adds20,000 vehicles to the fleet managed in The Netherlandsand in Belgium.
The businesses in the emerging and overseas marketsmaintained their high level of profitability despite difficultbusiness conditions. The Group acquired a further 10%stake in the Moroccan Bank of Commerce and Industry,bringing its equity holding to 63%.
����..�����"�$�/�"���",���&- '�.�)���*
In a context of more positive equity markets, the AMS corebusiness grew its net banking income 18.0%, compared tothe first quarter 2003, to EUR 688 million. This growth ispartly the result of an expanding of the scope to includereal estate services. At constant scope and exchangerates, net banking income rose 12.2%.
Operating expenses and depreciation were under control(+5.0%, or +1.1% at constant scope and exchange rates),such that gross operating income, EUR 248 million, rosesharply compared to the first quarter 2003 (+51.2%, or40.1% at constant scope and exchange rates).
Pre-tax income (EUR 224 million) jumped 62.3% (+49.5%at constant scope and exchange rates).
The Group's total assets under management grew to EUR287 billion thanks in particular to EUR 4.3 billion in newcash inflows during the quarter.
Revenues from 0��!�(�1��..�����"�$�/�"� grew 15.1%at constant scope and exchange rates. Cortal Consors,Europe's number one online brokerage and savingsservices provider, with over 1 million customers, acquired22,500 new direct customers during the quarter. PrivateBanking is expanding its business in the United States,taking over Sudamaris' customers in Miami and starting upbusiness operations in India. Asset Management took overthe management of one of ZCM Investor Capital's funds ofhedge funds and successfully launched its first fund inChina.
Real Estate Services, now part of Wealth & AssetManagement, will see substantial development of itsbusiness in 2004 with the acquisition of Atis RealInternational, a leading player in corporate and institutionalreal estate management services and transactions inEurope. In the first quarter 2004, BNP Paribas introducedthe French market's first Robien SCPI (unquoted taxincentivised real estate investment fund).
The �".2&�"'� business line grew its net banking income20.1% compared to the first quarter 2003 due to acontinued buoyant business development and very steadygrowth in the individual savings business in France. As aresult of the pension-related investment schemesintroduced by the French Retail Banking branch network,100,000 financial savings were sold this quarter, mostly inthe form of life-insurance policies.
The ��'2& � �.���&- '�. business line, whose margins arestill under pressure, continued its business developmentefforts (assets under custody grew 9% during the quarterand assets under management 8%), stabilised its netbanking income (+0.7% compared to the first quarter 2003)and reduced its operating expenses and depreciation(- 4.1%), which helped produce a clear rebound in itsperformance.

�������������������������������� ��
4
�����+&3+&�����",��"-�.�/�"����"# "$�)���*
Corporate and Investment Banking’s businesses postedEUR 1,495 million in net banking income, close to the veryhigh level in the first quarter 2003 (-4.0%, or -1.0% atconstant scope and exchange rates).
Compared to this same quarter, the business cut itsoperating expenses and depreciation 8.1% (-4.4% atconstant scope and exchange rates), such that grossoperating income rose 1.5% to EUR 670 million (+3.5% atconstant scope and exchange rates).
The cost of risk fell sharply (-67.2% at EUR 57 million) andcontinues to remain significant only in Europe. In Asia andthe United States, the economic recovery combined withthe Group’s selective credit policy led to a very limited netincrease in provisions.
Corporate and Investment Banking’s pre-tax income thusrose 27.1% to EUR 614 million.
The ��3 ��!� ��&#��. businesses boasted a number ofcommercial successes: in the equity markets, Sanofi-Synthélabo mandated BNP Paribas as its co-advisor in itsbid to buy Aventis; in the bond markets, BNP Paribashandled Tokyo Electric Power's benchmark bond issue ineuros, Diageo's bond-issue in the US market and, for thefirst time, a bond-issue in sterling pounds for a Britishissuer (Bradford and Bingley), thus confirming its pan-European leadership. The magazine Euromoney rankedBNP Paribas global number 1 for investment-grade bondresearch.
Market risk has remained close to its 2003 level. TheCapital Markets business line's net banking income totalledEUR 913 million, down 14.0% compared to the first quarter2003. Both the Fixed Income and Equity Derivatives
business lines performed well, even though FixedIncome's revenues were down compared to the very highlevel of the first quarter 2003.
The % "�"' "$� 42. "�.. ! "�. also showed soundbusiness performances, which, for example, ranked BNPParibas as Europe's number 1 syndicated loan arranger forthe quarter (source: IFR). Outside Europe, the Groupconfirmed its position as a global leader in the Energy,Commodities, Export and Project Financing business line.The Group arranged the financing of Deer Park's refinery inthe United States and BLCP Power's electrical power plantin Thailand. Given the good level of business andexceptionally high capital gains, revenues from theFinancing business lines reached an exceptionally highlevel this quarter–EUR 582 million (+17.3%).
������& 4�.���3 ��!
BNP Paribas Capital's quarterly pre-tax income totalledEUR 308 million compared to EUR 292 million in the firstquarter 2003.
As part of the strategy to achieve an optimised reduction inits direct investments portfolio, BNP Paribas Capital madesubstantial divestments this quarter, selling in particular a10% block of Eiffage shares. Moreover, Private Equityfunds, now valued using a practice that is in line with thevaluation practice used for directly held equity investments(+EUR 112 million effect), also posted substantial gains.
Despite realising these capital gains, the portfolio'sestimated value rose to EUR 4.1 billion, including EUR 1.3billion in unrealised capital gains (EUR 1.2 billion as at 31December 2003).
�
� �
Commenting on these results at the Board meeting, Baudouin Prot, Chief Executive Officer of BNP Paribas said, "During thecourse of the first quarter, BNP Paribas posted a sharp rise in its operating income as compared to the already high level ofthe first quarter 2003.
The beginning of the year is marked by an expansion drive: Corporate and Investment Banking has reinforced its leadingposition in Europe; Retail Banking and Asset Management Services have considerably expanded their customer bases;furthermore, the acquisitions under way in the United States and in Europe will expand the Group's scope, in accordancewith its growth targets."
�������������������������������� ��
5
� �� ���������� %�������� ������ ���
���� ���� ������ ���� ������
In millions of euros ���� ����
������������� ������ ����� ����� ��� ����� ���
Operating Ex penses and Dep. -2,810 -2,857 -1.6% -2,765 +1.6%
�� �������������� �� ����� ����� �� ����� ���
Prov isions -245 -339 -27.7% -354 -30.8%
����������� �� ����� ����� ���� ����� ����
Associated Companies 41 13 n.s. 69 -40.6%
Gains and Prov isions on Inv estments 397 240 +65.4% 145 x 2,8
Amortisation of Goodw ill -84 -101 -16.8% -100 -16.0%
Non-Recurring Ex pense -43 -25 n.s. -121 -64.5%
� ��������������� ��� ��� �� �� ��
����������� �� ����� ����� �� � ����� ����
Tax Ex pense -507 -378 +34.1% -253 +100.4%
Minority Interests -117 -104 +12.5% -85 +37.6%
������� ����� �������� ����� ��� ���� ��� ����
� �������� �� � � ��� ��� �� �� ��� ��
Annualised ROE after Tax 17.7% 14.4% +3.3 pt
(1) Including Commission income 1,710 1,588 +7.7% 1,695 +0.9%
(Fees, rev enues from the insurance business, other net banking operating income and miscellaneous net income)
(2) Including a 85 million general prov ision in 1Q03
(2)
������At constant scope and ex change rates ����������������� ��� ���Operating Ex penses and Dep. +0.0%�� �������������� �� �����Prov isions -27.0%����������� �� ���������������� �� ������������ ����� �������� �����
��������������� ���������������������������������������
�����
�����
�����
�����
����
����
��� �����
�����
���� ���� ���� ���� ���� ���� ���� ���� ����
�� ��� ������������ ��
�����
�����
����
�����
����
����� �����
����
���� ���� ���� ���� ���� ���� ���� ���� ����
� ��������������
In millions of euros

�������������������������������� ��
6
����5���������� �������������������
In millions of euros�������
����
� ���������
�������
������������
��������������
������
��������� �����
������������� ��� ����� ��� ���� �� � �����
Change/1Q03 +2.2% +18.0% -4.0% -14.8% +64.5% +2.6%
Change/4Q03 -1.1% +6.0% +12.7% -14.8% n.s . +5.5%Operating Ex penses and Dep. -1,505 -440 -825 -9 -31 -2,810
Change/1Q03 +0.9% +5.0% -8.1% +12.5% -22.5% -1.6%
Change/4Q03 -1.1% +4.3% +9.9% -10.0% -49.2% +1.6%�� �������������� �� �� ��� ��� �� �� �����
Change/1Q03 +4.5% +51.2% +1.5% -8.6% n.s . +10.0%
Change/4Q03 -1.2% +9.3% +16.5% -13.5% n.s . +12.0%Prov isions -179 -6 -57 2 -5 -245
Change/1Q03 +6.5% n.s . -67.2% n.s . n.s . -27.7%
Change/4Q03 -12.3% n.s . -61.7% n.s . n.s . -30.8%����������� �� ��� ��� ��� �� � ����
Change/1Q03 +4.0% +50.3% +26.1% -14.3% n.s . +19.7%
Change/4Q03 +1.9% +12.0% +43.9% -25.0% n.s . +23.9%Associated Companies 25 0 3 0 13 41Capital Gains -5 -1 -5 339 69 397Amortisation of Goodw ill -61 -16 -2 -2 -3 -84Other Items 2 -1 5 1 -50 -43����������� �� ��� ��� ��� ��� �� �����
Change/1Q03 +7.9% +62.3% +27.1% +5.5% n.s . +30.7%
Change/4Q03 +3.3% +10.3% +45.5% n.s . n.s . +49.2%
In millions of euros�������
����
� ���������
�������
������������
��������������
������
��������� �����
������������� ��� ����� ��� ���� �� � �����
1Q03 2,368 583 1,558 -27 31 4,5134Q03 2,447 649 1,326 -27 -4 4,391
Operating Ex penses and Dep. -1,505 -440 -825 -9 -31 -2,810
1Q03 -1,492 -419 -898 -8 -40 -2,857
4Q03 -1,521 -422 -751 -10 -61 -2,765�� �������������� �� �� ��� ��� �� �� �����
1Q03 876 164 660 -35 -9 1,656
4Q03 926 227 575 -37 -65 1,626Prov isions -179 -6 -57 2 -5 -245
1Q03 -168 -3 -174 0 6 -339
4Q03 -204 -11 -149 -3 13 -354����������� �� ��� ��� ��� �� � ����
1Q03 708 161 486 -35 -3 1,317
4Q03 722 216 426 -40 -52 1,272Associated Companies 25 0 3 0 13 41
1Q03 4 2 0 0 7 13
4Q03 30 18 1 0 20 69Capital Gains -5 -1 -5 339 69 397
1Q03 12 -2 -9 330 -91 240
4Q03 0 -2 34 50 63 145Goodw ill -61 -16 -2 -2 -3 -84
1Q03 -74 -18 -5 -3 -1 -101
4Q03 -68 -21 -3 -4 -4 -100Other Items 2 -1 5 1 -50 -43
1Q03 -4 -5 11 0 -27 -25
4Q03 -9 -8 -36 -1 -67 -121����������� �� ��� ��� ��� ��� �� �����
1Q03 646 138 483 292 -115 1,444
4Q03 675 203 422 5 -40 1,265�� ������������� �� � � �� �� ���
Tax Ex pense -507������� ������ �������� �����

�������������������������������� ��
7
��������������
In m illions of euros ���� ���� ����������� ���� �����������
������������� ��� ���� ��� �� �� ���� �� ��
Operating Ex penses and Dep. -1,505 -1,492 +0.9% -1,521 -1.1%�� �������������� �� ��� �� �� �� �� �� ��
Prov is ions -179 -168 +6.5% -204 -12.3%����������� � � �� ��� �� �� ��� �� ��
Amortisation of Goodw ill -61 -74 -17.6% -68 -10.3%Other Non Operating Items 22 12 +83.3% 21 +4.8%����������� �� �� � �� �� �� �� ��
Cost / Income 62.2% 63.0% -0.8 pt 62.2% +0.0 pt
Allocated Equity (Ebn) 9.5 9.4 1.0%
Pre-Tax ROE 29% 28%
At constant scope and exchange rates �����������
������������� ��� ���
Operating Expenses and Dep. +1.8%�� �������������� �� ����
Provisions +4.4%����������� �� ���
����������� �� � �
����� �� ���� � � � ����� ��
8
%��������������������
In m illions of euros ���� ���� ����������� ���� �����������
������������� ��� ��� ���� �� �� ���� �� ��
��� �� ����������� � ��� ��� ���� �� ���
� �� � � �� ������ ��� � ����������� � �� �� ��� �� ����
Operating Ex penses and Dep. -849 -827 +2.7% -851 -0.2%
�� �������������� �� ��� ��� �� �� ��� �� ��
Prov is ions -55 -52 +5.8% -68 -19.1%
����������� �� �� �� �� �� ��� ��� ��
Non Operating Items 0 -4 n.s. 2 n.s.
����������� �� �� � �� �� �� ��� ��
Income Attributable to AMS -20 -13 +53.8% -18 +11.1%
����������� ��� ����������������� ��� �� �� �� �� ��� ��#N/A
Cost / Income 67.5% 68.5% -1.0 pt 68.8% -1.3 pt
Allocated Equity (Ebn) 4.6 4.5 +2.0%
Pre-Tax ROE 29% 28%
Including 100% of French private banking for NBI to Pre-tax Income lines.
■ NBI up 4.1% / 1Q03■ Cost of risk: 32 bp on weighted assets (32 bp in 2003)
����
����� ����� ����� �����
����� ��������� ��� �����
����
���� ���� ���� ���� ����
���
������������������
���
������
���
100% of the French private banking
���������� �!"#$���%$&!�'�����(��)*+
�!,&%�-��$���
!%����#!�"��'��������(�)�+
�&&�'�������������(*)�+
+#,���&��.���/��.�0

����� �� ���� � � � ����� ��
9
1���2��������������3����3������ �����
���� ��� �����������
�����������
�� �
������
�����
�� ���� �
������
������� �
�� ���� �
����������
Total Loans 72.6 +1.1% +2.3%
Individual Customers 35.1 +14.1% +3.5%
Incl. Mortgages 28.7 +16.7% +4.3%
Incl. Consumer Lending 6.3 +3.8% +0.0%
Corporates 34.3 -9.1% +1.4%
��!���"�����#$������ 72.1 +7.0% +0.4%
Cheque and Current Accounts 29.5 +7.8% +0.1%
Savings Accounts 35.2 +14.3% +5.0%
Market Rate Deposits 7.5 -19.7% -15.6%
%&���&���'(#�#��(��"�)
Life Insurance 37.2 +12.6% +3.7%
Mutual Funds (3) 59.9 +11.9% +3.7%
(1) Av erage cash Outstandings (2) Outstandings at the end of the period
(3) These statistics do not include mutual funds assets located in Lux embourg (PARVEST)
■ Gross interest margin: 3.75%* (3.74%* in 4Q03, +14 bp in one year)��������������� ����
����4��31��3������
��������������� ����������������������������������������
���� ���� ���� ���� ����
������
�������
�������
�����
��������
��������������� ���� ������������� ������ ���������������
Continued to Expand the Customer Base
�����.3�������'��� �1� ���
■ Savings: Very Good Performance• Life insurance: +60% new money compared to 1Q03
− 100,000 Financial Savings Plans opened in connection with pension-relatedinvestment schemes, mainly in the form of life insurance policies
• Savings accounts: assets +14.3% compared to 1Q03
■ Lending to individuals: continued sharp rise in outstandings: +14.1%compared to 1Q03• Mortgages: +16.7%• Consumer lending: +3.8%
■ Corporate lending: slight rise in outstandings (+1.4% compared to 4Q03)despite a sluggish market• Continue to expand cross-selling with Corporate & Investment Banking’s
specialised business lines

����� �� ���� � � � ����� ��
10
��������� �����������������������%�����������������
In m illions of euros ���� ���� ����������� ���� �����������
������������� ��� ���� ���� �� �� ���� �� ��
Operating Ex penses and Dep. -678 -686 -1.2% -693 -2.2%
�� �������������� �� �� �� �� �� ��� �� ��
Prov isions -124 -116 +6.9% -136 -8.8%
����������� � � �� �� � �� � �� ��
Amortisation of Goodw ill -61 -74 -17.6% -68 -10.3%
Other Non Operating Items 22 15 +46.7% 19 +15.8%
����������� �� ��� ��� �� �� ��� � ��#N/A
Cost / Income 56.3% 57.4% -1.1 pt 55.4% +0.9 pt
Allocated Equity (Ebn) 4.9 4.9 0%
Pre-Tax ROE 30% 27%
At constant scope and ex change rates �����������
������������� ��� ���
Operating Ex penses and Dep. +0.8%
�� �������������� �� ���
Prov is ions +3.7%
����������� �� ����
����������� �� �� ��
�������
In m illions of euros ���� ���� ����������� ���� �����������
������������� ��� ��� ��� ����� ��� �����
Operating Ex penses and Dep. -175 -202 -13.4% -176 -0.6%
�� �������������� �� ��� ��� � ��� ��� �����
Prov is ions -15 -21 -28.6% -12 25.0%
����������� �� ��� ��� ����� ��� � ���
Amortisation of Goodw ill -33 -40 -17.5% -34 -2.9%
Other Non Operating Items 0 1 n.s. -1 n.s.
!���"�#���� �� ��� ��� ���� � � � ���
Cost / Income 47.2% 49.4% -2.2 pt 46.3% +0.9 pt
Allocated Equity (Ebn) 1.5 1.6 -10.4%
Pre-Tax ROE 41% 36%
At constant scope and ex change rates �����������
������������� ��� � ��
Operating Ex penses and Dep. -0.9%
�� �������������� �� ����
Prov is ions -16.9%
����������� �� ����
����������� �� �� ��
■ Growth in Revenues and Income in Dollars■ NBI: +2.9% compared to 1Q03
• Strong growth in Outstanding Loans +9.0% and Deposits +9.9%• Deterioration of the margin due to lower interest rates: 3.98% compared to 4.49% in
1Q03 and 4.18% in 4Q03■ High quality portfolio: NPLs/Loans ratio 0.58% at the end of March 2004 as
compared with 0.59% at the end of December 2003■ Community First and Union Safe Deposit acquisitions* currently under way
����������������������������������������������

����� �� ���� � � � ����� ��
11
����1��
In m illions of euros ���� ���� ����������� ���� �����������
������������� ��� ��� ��� ����� ��� �����
Operating Ex penses and Dep. -214 -191 12.0% -217 -1.4%
�� �������������� �� ��� �� ���� �� �����
Prov is ions -96 -82 17.1% -92 4.3%
����������� �� �� �� ���� ��� �����
Amortisation of Goodw ill -11 -13 -15.4% -13 -15.4%
Other Non Operating Items 24 17 41.2% 29 -17.2%
!���"�#���� �� ��� �� � ��� ��� �����
Cost / Income 53.1% 52.6% +0.5 pt 53.1% +0.0 pt
Allocated Equity (Ebn) 1.5 1.4 7.4%
Pre-Tax ROE 28% 27%
At constant scope and ex change rates �����������
������������� ��� ����
Operating Ex penses and Dep. +4.9%
�� �������������� �� ����
Prov is ions +9.9%
����������� �� ����
����������� �� �����
■ New loans: +13% compared to 1Q03 (outstandings: +7%):• Strong growth in the number of new loans in French own account business: +7%• Continued sharp growth outside France: +24%
■ Cost of risk: scope effect due to the full consolidation of subsidiaries in newcountries (Poland and Brazil), whose income was previously booked under theequity method
������� �1� ��
■ ������& 4�.����.���&+23• New leases up in France (+12%) as well as abroad (+13%) / 1Q03• Buoyant growth of outstandings abroad and slight decline in France
■ ���• Business still fast-growing in 1Q04
− New mortgages: +40% in France and +25% outside France• Started up operations in Greece
■ �&-�!����• Bought ARMA, which is present in The Netherlands and in Belgium: manages
�������������� �������������������������
■ �/�&$ "$��",� -�&.��.���&#��.• Morocco: bought a 10% equity investment in BMCI, raising the group’s equity
investment to 63%• Maintained a high level of profitability despite difficult business conditions

����� �� ���� � � � ����� ��
12
������1���4�����5��� ����3������� �
In billions of euros �������� �������
����� �
������
�������� �����
����� �
���������
������
������� ���� ���� ���� ���� ����
France 17.9 17.9 -0.0% 17.9 -0.2%
Outside France 11.5 9.6 +20.1% 11.0 +4.5%
������ ������������ ���� ���� ���� ���� ����
France 12.4 12.9 -3.5% 12.4 -0.0%
Europe (outs ide France) 3.4 3.1 +8.4% 3.3 +3.3%
������������� ���� ���� ���� ���� ���
France Indiv iduals 9.3 8.8 +4.9% 9.2 +0.9%
Europe (outs ide France) 7.2 5.7 +26.0% 6.5 +11.5%
�������������������������� ��� ��� ���� ��� ����
France (1) 1.6 1.7 -4.5% 1.6 +0.8%Europe (outs ide France) 3.3 2.9 +14.4% 3.1 +6.7%
!" �#�$$
���������"�������%����������& ��� �� ���� ��� ����
inc ludind financed v ehic les 411 353 +16.4% 387 +6.4%
(1) +1.6% March 04/March 03 method unchanged

����� �� ���� � � � ����� ��
13
�����������������������������
In m illions of euros ���� ���� ����������� ���� �����������
������������� ��� � � ���� ��� ����
Operating Ex penses and Dep. -440 -419 +5.0% -422 +4.3%
�� �������������� �� �� ��� ���� ��� ����
Prov is ions -6 -3 n.s. -11 n.s.
����������� �� ��� ��� ���� ��� �����
Amortisation of Goodw ill -16 -18 -11.1% -21 -23.8%
Other Non Operating Items -2 -5 -60.0% 8 n.s.
����������� �� ��� �� ����� ��� �����
Cost / Income 64.0% 71.9% -7.9 pt
Allocated Equity (Ebn) 3.1 2.9 6.5%
At constant scope and ex change rates �����������
������������� ��� ���
Operating Ex penses and Dep. +1.1%
�� �������������� �� �����
Prov is ions n.s.
����������� �� �����
����������� �� ��� �
Scope effect: consolidated the Group’s real estate businesses, previously reflected in "other businesses" operations (NBI: +������andOperating Expenses and Depreciation: +������
���������������������
������
������
-30
20
70
120
170
220
270
320
370
420
-100
400
900
1400
1900
2400
2900
3400
3900
GOI Euro Stoxx 50 (end of month)
������������������
Real estate servicesconsolidated as part ofAMS in 1Q04
��� ��� ��� ��� ��6 ��� ��* �0����
��
����������������� �������������������������������������������������� ��������������������������������������������� ���
���������������������
������������������
�*�
��
���
�������� ��������
+4.3
�6*
���
����
�����������
������ ��� ����� ���
+6.7
Total private banking assetsTotal other net assets (Asset Management + Cortal Consors + Insurance net, of double accounting)
Net assets gathered 1Q04: +�������(+6.2%* of assets under management)���������������

����� �� ���� � � � ����� ��
14
0��������������������������Wealth and Asset Management = Private Banking + Asset Management + Cortal Consors + Real Estate Services
In m illions of euros ���� ���� ����������� ���� �����������
������������� ��� ��� ��� ����� �� ����
Operating Ex penses and Dep. -229 -210 +9.0% -214 +7.0%
�� �������������� �� ��� �� ���� �� �����
Prov is ions -5 -3 n.s. -6 n.s.
����������� �� ��� � ���� ����
Amortisation of Goodw ill -9 -9 +0.0% -11 -18.2%
Other Non Operating Items 0 -3 n.s. 0 n.s.
����������� �� � � ����� �� �����
Cost / Income 67.2% 77.8% -10.6 pt 70.2% -3.0 pt
Allocated Equity (Ebn) 0.9 0.9 +10%
At constant scope and ex change rates �����������
������������� ��� ����
Operating Ex penses and Dep. +0.7%
�� �������������� �� �����
Scope effect: consolidated the Group’s real estate businesses, previously reflected in "other businesses" operations (NBI: +������ ���� ���� ��Expenses and Depreciation: +������
�����������������������5�������������3�0�/�0/��0�/�0/�0
���������
���������
� ������
� ������
�������������
�����������
��
�����������������������
�
�����������������������
�
�������
�������
��������
��
� ����
��
�����������
��
�������������
������������
�������
■ Cortal Consors: #1 in the European Market• Accelerated growth in the customer base
− 22,500 new direct customers in 1Q04− 1,060,000 customers as at 31 March 04
• Sustained expansion of stock market and savings operations− 2.2 million orders executed: +43%/1Q03− new savings money: +27%/1Q03− AUM: ��������������� ���Cortal Consors
■ Private Banking• Signed a deal with Banca Intesa to take over Sudameris’ customers in Miami
($700mn in assets)• Started up a business in India Private Banking

����� �� ���� � � � ����� ��
15
■ Asset Management• Acquired Javelin, the ZCM Investor Capital’s funds of hedge funds
management business ($650mn assets under management), increasingBNP PAM’s funds under management in this business to $2 bn
• Started up the joint-venture with Shenyin & Wanguo in China: the new fundShengli Elite rose $823mn on a single month
■ Real Estate services• Acquired Atis Real International* which has a presence in:
− France: AUGUSTE THOUARD− UK: WEATHERALLS− Germany: MÜLLER− Spain and Benelux
• Introduced the French market’s first Robien SCPI (unquoted real estateinvestment fund)
�������������� ������ ����������������� � ���������� ���������������
���������
In m illions of euros ���� ���� ����������� ���� �����������
������������� ��� �� �� ��� �� ��� �� ��
Operating Ex penses and Dep. -94 -87 +8.0% -91 +3.3%
�� �������������� �� ��� ��� �� ��� � ��
Prov is ions -1 0 n.s. -5 -80.0%
����������� �� ��� ��� �� ��� �� ��
Non Operating Items -4 -1 n.s. 10 n.s.
����������� �� �� ��� �� ��� ��� ��
Cost / Income 47.7% 53.0% -5.3 pt 45.3% +2.4 pt
Allocated Equity (Ebn) 2.0 1.8 +12.5%
■ 44% rise in gross premium inflows (���������compared with 1Q03■ France
• Sharp rise in new money put into individual savings (+52%/1Q03)• Share of unit-linked insurance products (28%) still higher than the market
average (22%)■ Outside France
• New money inflows up 23% as compared with 1Q03

����� �� ���� � � � ����� ��
16
�������������������
In m illions of euros ���� ���� ����������� ���� �����������
������������� ��� ��� ��� �� � ��� �� ��
Operating Ex penses and Dep. -117 -122 -4.1% -117 +0.0%
�� �������������� �� �� � ��� �� � �� ��
Prov is ions 0 0 n.s. 0 n.s.
����������� �� �� � ��� �� � �� ��
Amortisation of Goodw ill -4 -6 -33.3% -6 -33.3%
Other Non Operating Items -1 -4 -75.0% -6 n.s.
����������� �� �� � �� � �� ���� ��
Cost / Income 78.0% 81.9% -3.9 pt 81.8% -3.8 pt
Allocated Equity (Ebn) 0.2 0.3 -38.2%
■ Sustained sales and marketing drive• Assets under custody: +9% as compared to 31.12.2003• Assets under management: +8% as compared to 31.12.2003• Number of transactions: +13% as compared with 4Q03
■ Operating expenses and depreciation under control: -4.1% as comparedwith 1Q03 and flat compared to 4Q03
������������������7&� �"8�!,&�9&%�" :������������������
�����
����������
�����
����
����������
�
���
�����
�����
�����
�����
���� ���� ���� ���� ���� ���� ����
��� ������������������ ����������������������
���
��� ���
��� ���
�����
������
����
����
����
����
����
����
����
����
����
Netting in Germany starting in mid-April 2003

����� �� ���� � � � ����� ��
17
� �� ���������������������������
In m illions of euros ���� ���� ����������� ���� �����������
������������� ��� ��� ��� �� �� ����� ��� ��
��� �� ������� �������� ��� ��� ������ �� ����
Operating Ex penses and Dep. -825 -898 -8.1% -751 +9.9%
�� �������������� �� ��� ��� �� � � ��� �
Prov is ions -57 -174 -67.2% -149 -61.7%
����������� � � ��� ��� ��� �� ��� ��� �
Non Operating Items 1 -3 n.s. -4 n.s.
����������� �� ��� ��� ��� �� ��� �� �
Cost / Income 55.2% 57.6% -2.4 pt 56.6% -1.4 pt
Allocated Equity (Ebn) 6.5 7.1 -8.5%
Pre-Tax ROE 38% 27%
* Including customer activ ity and related rev enues
**Including a 70 m illion general prov ision in1Q03
**
At constant scope and ex change rates �����������
������������� ��� ���
Operating Ex penses and Dep. -4.4%
�� �������������� �� ���
Prov is ions -65.4%
����������� �� � ��
����������� �� � �
�������������� �������
In m illions of euros ���� ���� ����������� ���� �����������
������������� ��� ��� ��� ��� �� ��� ��� ��
Operating Ex penses and Dep. -587 -661 -11.2% -494 +18.8%
�� �������������� �� �� ��� ��� �� ��� �� ��
Prov is ions 1 8 -87.5% -9 n.s.
����������� �� ��� ��� ��� �� ��� �� ��
Non Operating Items -4 6 n.s. -6 -33.3%
����������� �� ��� ��� ��� �� ��� �� �
Cost / Income 64.3% 62.2% +2.1 pt 59.7% +4.6 pt
Allocated Equity (Ebn) 2.5 2.6 -4.2%
■ Drop in the fixed income business and decline in revenues as comparedwith the very high level in 1Q03
■ Good performance in equity derivatives■ Average VaR for the quarter: ������compared to ������������and
������ ��average for 2003

���������������������������� �����
18
���������������
In m illions of euros ���� ���� ����������� ���� �����������
������������� ��� � ��� ����� ��� �����
Operating Ex penses and Dep. -238 -237 +0.4% -257 -7.4%
�� �������������� �� ��� �� ��� � ����
Prov is ions -58 -182 -68.1% -140 -58.6%
����������� �� � �� ����� �� ���
Non Operating Items 5 -9 n.s. 2 x 2.5
����������� �� �� � ���� ��� ���
Cost / Income 40.9% 47.8% -6.9 pt 51.5% -10.6 pt
Allocated Equity (Ebn) 4.0 4.5 -11.0%
■ Revenues up 17.3%• Good business in Structured Finance, especially in Europe• ��������������������������Leveraged Finance businesses
■ Sharp decline in the cost of risk• The general provision set aside for Europe in 2003 (of which ������� �� �
1Q03) was not used• $9mn of the general provision set aside in 1999 for the US was used
������������������������������� !
In millions of euros "�#$�%#&� '�#���#&' '(#)*+�#&' "&#����#&' "�#$�%#&' "�#���#&" "&#)*+�#&" "&#����#&" "�#$�%#&" "�#���#&,
Commodities 1 1 1 1 2 3 3 3 2 2
Change 8 3 4 3 3 2 1 2 3 2
Equities 10 7 26 33 27 21 12 17 13 14
Interest rate 35 58 26 36 24 25 43 23 26 18
Credit 13 14
Netting -17 -13 -25 -33 -28 -28 -21 -23 -35 -25
���-���� ". /0 "' ,& '( '" "( '' '' '/
Last market trading day of the periodInclusion in 4Q03 of "credit" risk, previously included and netted in the "interest rate" risk

���������������������������� �����
19
������������� ��
In millions of euros ���� ���� ����
���������������� ��� ��� ��
Other Net Income -22 -30 -35
Operating Ex penses and Dep. -9 -8 -10
������������� ��� � �
Allocated Equity (Ebn) 1.1 1.3 1.1
■ Continued to divest directly held equity investments:• In particular, sale of a 10% equity holding in Eiffage
■ Capital gains realised on Private Equity funds:• Sales of Antargaz (PAI Europe III) and of Ipsen (PAI LBO Fund)• Change in the way capital gains realised by private equity funds are taken
into account in order to bring it in line with how directly held investments arehandled (effect totalling +�������
■ Rise in the portfolio value• Estimated value: ������������������at 31/12/03)• Unrealised capital gains*: ������������������at 31/12/03)
������������������������������ ���

���������������������������� �����
20
���������� � ���
In billions of euros ��������� ��������
Shareholders Equity , Group Share 27.4 27.1
Total Capital ratio 12.2% 12.9%
Tier One ratio 8.9% 9.4%
Net Unrealised Capital Gains (1) 2.3 2.1
Doubtful Customers 14.1 14.1
Specific Prov isions 9.4 9.4
Specific Prov isions/ Doubtful Customers (2) 67% 67%
Reserv es for Country Risks 1.8 1.8
Reserv e for General Banking Risks 0.8 0.8
In millions of euros � �
�������������� ���������� �������� � 25 22
�������������������������������� �������� 31 34(1) Cobepa goodwill deducted (E0.1 bn)
(2) T he calculation o f the Coverage rate takes into account only S pecific P rovis ions , excluding General P rovis ions ,
R es erve for Country ris ks and R es erve for General B anking R is k
a) E s timates
b) B as ed on es timated R is k Weighted As s ets o f E289.9 bn as at 31 March 2004
a
a,b
a,b
�������������
in millions ���� ����
Number of Shares (end of period) 903.2 903.6Number of Shares ex cluding Treasury Shares (end of period) 858.4 845.6Av erage number of Shares outstanding ex cluding Treasury Shares 872.0 855.9
����� ����������� (in euros)
���� ��������
����
������ ���
��������
��������
��������
��������
��������
��������
��������
* Book value (not re-evaluated and after dividends) divided bythe numbers of shares outstanding
����� �������� (in euros)
��������
����
����
����
����
����
����
��� ����
����
���
����
������
����
����
����
����
* Before restructuring provisions.
�� ���
Moodys Aa2 Stable Outlook Rating upgraded to Aa2 on 19/02/2002
Fitch AA Stable Outlook Rating upgraded to AA on 28/11/2001
S&P AA- ��� ����� Outlook Positive outlook ����� �� ����������

���������������������������� �����
21
����� ��� ����� ���������������
In millions of euros ���� ���� ���� ���� ����
�����������
� �������������� �� ���� ���� ���� ����� �����
Operating Ex penses and Dep. -1,492 -1,489 -1,509 -1,521 -1,505
����������� ��������� � �� � �� �� ��
Prov isions -168 -193 -189 -204 -179
����� ��������� � �� ��� ��� ��� ���
Non Operating Items -62 -57 -57 -47 -39
������������� � ��� ��� �� ��� ��
��������� ������������ ����!"����#$%��&����'� �������������������(
� �������������� �� ����� ���� ���� ���� �����
Operating Ex penses and Dep. -806 -805 -827 -828 -827
����������� ��������� � ��� ��� �� �� �
Prov isions -52 -57 -48 -68 -55
����� ��������� � ��� ��� ��� ��� ���
Non Operating Items -3 -2 1 2 0
������������� � ��� ��� ��� ��� ���
�� ���� �������� ��������������"�����������)��'����
� �������������� �� ���� ����� ����� ����� �����
Operating Ex penses and Dep. -686 -684 -682 -693 -678
����������� ��������� � �� ��� ��� �� ���
Prov isions -116 -136 -141 -136 -124
����� ��������� � �� �� ��� ��� ���
Non Operating Items -59 -55 -58 -49 -39
������������� � ��� �� ��� ��� ���
*� ����
� �������������� �� ��� �� ��� �� ���
Operating Ex penses and Dep. -191 -200 -203 -217 -214
����������� ��������� � ��� �� � �� �
Prov isions -82 -89 -98 -92 -96
����� ��������� � � ��� ��� ��� �
Non Operating Items 4 3 11 16 13
������������� � � ��� ��� ��� ���
����+��
� �������������� �� �� �� �� �� ���
Operating Ex penses and Dep. -202 -195 -191 -176 -175
����������� ��������� � ��� ��� ��� ��� ��
Prov isions -21 -20 -22 �� ��
����� ��������� � �� �� �� �� ��
Non Operating Items -39 -39 -41 -35 -33
������������� � ��� ��� ��� ��� ��

���������������������������� �����
22
In millions of euros ���� ���� ���� ���� ����
������������������������ ��
������������������� ��� �� �� � ��
Operating Ex penses and Dep. -419 -416 -416 -422 -440
���������������������� �� �� ��� ��� ���
Prov isions -3 0 -2 -11 -6
���������������� �� �� ��� �� ���
Non Operating Items -23 -21 -7 -13 -18
�������������� ��� ��� ��� ��� ���
��!�"���#�����������������$
������������������� ��� ��� �� ��� ���
Operating Ex penses and Dep. -210 -211 -210 -214 -229
���������������������� � � �� � ���
Prov isions -3 0 -3 -6 -5
���������������� �� � �� �� ���
Non Operating Items -12 -12 -1 -11 -9
�������������� �� �� � �� �
���%�����
������������������� �� ��� ��� ��� ��
Operating Ex penses and Dep. -87 -86 -88 -91 -94
���������������������� �� � ��� ��� ���
Prov isions 0 0 1 -5 -1
���������������� �� � ��� ��� ���
Non Operating Items -1 3 2 10 -4
�������������� � � ��� ��� �
���%����������&����
������������������� �� �� �� ��� ���
Operating Ex penses and Dep. -122 -119 -118 -117 -117
���������������������� �� �� �� � ��
Prov isions 0 0 0 0 0
���������������� �� �� �� � ��
Non Operating Items -10 -12 -8 -12 -5
�������������� �� �� �� �� ��
* Inc luding real estate serv ices from 1Q04

���������������������������� �����
23
In millions of euros ���� ���� ���� ���� ����
��������������� ����������
������������������ ���� ����� ��� ����� ����
��� �� ������� �������� ��� ��� ��� ��� ���
Operating Ex penses and Dep. -898 -925 -810 -751 -825
���������������������� ��� ��� �� ��� ���
Prov isions -174 -142 -168 -149 -57
���������������� �� �� ��� ��� ���
Non Operating Items -3 -3 88 -4 1
������ ������� �� ��� � ��� ���
�!"����#���!�������$��������
������������������ ����� ����� � �� ��
Operating Ex penses and Dep. -661 -684 -568 -494 -587
���������������������� ��� ��� ��� ��� ���
Prov isions 8 0 1 -9 1
���������������� �� ��� ��� ��� ���
Non Operating Items 6 -3 105 -6 -4
������ ������� ��� �� �� �� ���
%����������&��������
������������������ �� �� � � ��
Operating Ex penses and Dep. -237 -241 -242 -257 -238
���������������������� �� �� ��� ��� ���
Prov isions -182 -142 -169 -140 -58
���������������� �� ��� � ��� ��
Non Operating Items -9 0 -17 2 5
������ ������� � ��� �� ��� ��
* Inc luding customer activ ity and related rev enues

���������������������������� �����
24
In millions of euros ���� ���� ���� ���� ����
����������������
������������������� ��� � � ��� ���
Operating Ex penses and Dep. -8 -11 -10 -10 -9
�������������������� �� � �� ��� ���
Prov isions 0 0 0 -3 2
���������������� �� � �� ��� ���
Non Operating Items 327 65 135 45 338
�������������� ��� �� ��� ���
�������������� �!
������������������� �� �� ��� �� �
Operating Ex penses and Dep. -40 -35 -42 -61 -31
�������������������� �� �� ���� � ��
Prov isions 6 17 9 13 -5
���������������� �� ��� �� �
Non Operating Items -112 18 16 12 29
�������������� ��� �� ��� ��� ��
���"�
������������������� � �� � � � ��� � ��� � ��
Operating Ex penses and Dep. -2,857 -2,876 -2,787 -2,765 -2,810
�������������������� � � �� � �� � � � ���
Prov isions -339 -318 -350 -354 -245
���������������� � ��� � �� � ��� � ��� � �
Non Operating Items 127 2 175 -7 311
�������������� � ��� � �� � ��� � � � ���
* ex cluding real estate serv ices from 1Q04
���������������������������� �����
25
�� �
����� �������� ������������������������������������
�������� ������� ����������� �������������������������������������������������������������������
������� ���������������������� � ������������������������������������������������������������������� !
�� �������� ��������������������������������������������������������������������������������������������������������������������� "
��������������������������������������������������������������������������������������������������������������������������������������������������������� ���������������������������������
���� ������� ���������� ������������������������������������������������������������������������������� ��
������������������������� ��������������������������������������������������������������������������������� ���������������������������������������������������������������������������������������������������������������������������� ��� �����������������������������������������������������������������������������������������������
������� ������� �� ������������������������������������������������������������������������������ �"
�� ������������������������������������������������������������������������������������������������� ������������������������������������������������������������������������������������������������������������
������������� ����������������������������������������������������������������������������������������������������������� �#
���������� � ����������������������������������������������������������������������������������������������������������� ��
�� ������������������������������������������������������������������������������������������������������������������������������������� ��
����� ��� ����� ��������������������������������������������������������������������������������� ��