the euro area bank lending survey - third quarter of 2015
TRANSCRIPT

The euro area bank lending survey Third quarter of 2015
October 2015

Contents
Introduction 3
1 Overview of the results 4
2 Developments in credit standards, terms and conditions and net demand for loans in the euro area 8
2.1 Enterprises 8
2.2 Households 13
3 Ad hoc questions 22
3.1 Banks’ access to retail and wholesale funding 22
3.2 The impact of the ECB’s expanded asset purchase programme 23
Annex 1 Results for the standard questions 28
Annex 2 Results for the ad hoc questions 41
Glossary 44

The euro area bank lending survey, October 2015 3
Introduction
The results reported in the October 2015 bank lending survey (BLS) relate to changes during the third quarter of 2015 and expectations of changes in the fourth quarter of 2015. The survey was conducted between 15 and 30 September 2015. The response rate was 100%. In addition to the results for the euro area as a whole, the report contains the results for the five largest euro area countries.1
A number of ad hoc questions were included in the October 2015 survey round. The first ad hoc question addressed the impact of the situation in financial markets on banks’ access to retail and wholesale funding. The second, third and fourth questions were aimed at gauging the impact of the ECB’s expanded asset purchase programme (APP).
1 The five largest euro area countries in terms of gross domestic product are Germany, France, Italy,
Spain and the Netherlands.

The euro area bank lending survey, October 2015 4
1 Overview of the results
According to the October 2015 bank lending survey (BLS), changes in credit standards and loan demand continue to support a recovery in loan growth, particularly for enterprises. During the third quarter of 2015, credit standards on loans to enterprises eased further, while credit standards on loans to households for house purchase tightened. Banks reported marginally deteriorated access to retail deposits, but improved access to funding for all other main market instruments.
Banks reported a further net easing of credit standards on loans to enterprises in the third quarter of 2015 (-4%, after -3% in the previous quarter; see Table A), which was stronger than the previous survey round’s expectations. However, credit standards on loans to households for house purchase tightened measurably (5%, from -9% in the previous quarter). Standards on consumer credit and other lending to households continued to ease (-3%, from -4%). For loans to households for house purchase, the net percentage change in credit standards in the third quarter of 2015 is in line with historical averages calculated over the period since the start of the survey in 2003, while the net percentage change in credit standards on loans to enterprises and consumer credit remains below the historical average. For the fourth quarter of 2015, banks expect a further net easing in credit standards on loans to enterprises (-6%). For households, credit standards on housing loans are expected to be broadly unchanged and a slight net easing is expected for consumer credit (-2%).
Among the factors affecting banks’ credit standards, competition was the main driver of banks’ easing of credit standards for loans to enterprises. Banks’ risk perceptions also had an easing impact on credit standards on loans to enterprises. For loans to households for house purchase, while competition contributed to an easing in standards, the tightening in credit standards was driven by a noticeable worsening in “other factors” reported by banks, in particular relating to national regulation.
Banks continued to ease their terms and conditions on new loans across all categories, and particularly for enterprises. The margin on average loans continues to drive the easing across all categories of lending. As with credit standards, competition continues to contribute most to the net easing of terms and conditions.
In terms of the rejection rate for loan applications, banks reported a decreased share of rejected applications for loans to enterprises and loans to households for house purchase, while the share of rejections increased for consumer credit.
Net demand for loans to enterprises continued to increase (to 16%, from 13%; see Table A) and banks expect a further considerable increase in demand from enterprises in the fourth quarter of 2015. Net demand increased for housing loans (33%, after 49% in the previous quarter), and it also increased for consumer credit (19%, from 41%). For loans to enterprises, most factors contributed to an increase in demand, in particular the general level of interest rates. Likewise, for housing loans most factors had a positive effect on demand, and the low level of interest rates and

The euro area bank lending survey, October 2015 5
housing market prospects were the main contributors. However, the regulatory and fiscal regime reportedly had a dampening impact.
Table A Latest developments in BLS results in the largest euro area countries
(net percentages of banks reporting tightening credit standards or positive loan demand)
Notes: AVG stands for historical averages, which are calculated over the period since the beginning of the survey, excluding the most recent round. For France, Malta, Slovakia and the Netherlands net percentages are weighted based on the amounts outstanding of loans of the individual banks in the respective national samples.
Credit standards on loans to enterprises eased further in Italy and remained unchanged in Germany, Spain and the Netherlands, while banks in France reported that credit standards had tightened in net terms. For housing loans, a substantial net percentage of banks in the Netherlands reported a tightening in credit standards. Banks in Germany and France also reported a tightening, albeit to a lesser extent, and banks in Spain and Italy reported a net easing in credit standards (see Table A).
This survey round also included some ad hoc questions. Access to funding improved in the third quarter of 2015 for all main market instruments, with the exception of retail funding which deteriorated slightly.
Regarding the impact of the ECB’s expanded asset purchase programme (APP), banks reportedly used additional liquidity from the programme to grant loans over the past six months. The APP had a net easing impact on credit standards and particularly on credit terms and conditions; this easing impact was greatest for loans to enterprises.
The impact of the APP on banks’ profitability over the past six months has reflected two opposing effects: a positive effect in terms of capital gains and a negative effect from the tightening of net interest margins. Overall, a slightly positive net percentage of banks report an increase in profitability over the past six months, as a result of the APP, though a marginally negative effect is expected over the next six months.
Box 1 General notes
The bank lending survey (BLS) is addressed to senior loan officers of a representative sample of euro area banks. In the current survey round, the sample group of banks participating in the survey comprises 141 banks, representing all of the euro area countries, and takes into account the
Country15Q2 15Q3 AVG 15Q2 15Q3 AVG 15Q2 15Q3 AVG 15Q2 15Q3 AVG 15Q2 15Q3 AVG 15Q2 15Q3 AVG
EURO AREA -3 -4 12 13 16 -6 -9 5 8 49 33 -1 -4 -3 6 41 19 -3
Germany 3 0 5 6 13 2 3 7 2 45 41 8 -3 0 0 29 23 8
Spain 0 0 12 20 0 -4 0 -11 20 0 22 -13 -10 0 10 60 30 -12
France -2 4 9 -6 8 -17 -15 2 4 53 -9 6 1 0 -2 76 0 -4
Italy -25 -38 20 38 38 0 -38 -13 4 88 75 9 -13 -25 10 50 38 10
Netherlands 0 0 12 40 55 -7 0 62 19 100 98 -16 0 0 15 0 31 -22
CONSUMER CREDIT
Credit standards Demand
ENTERPRISES
Credit standards Demand
HOUSE PURCHASE
Credit standards Demand

The euro area bank lending survey, October 2015 6
characteristics of their respective national banking structures. The main purpose of the BLS is to enhance the understanding of bank lending behaviour in the euro area.2
The questions distinguish between three loan categories: loans or credit lines to enterprises; loans to households for house purchase; and consumer credit and other lending to households. For all three categories, questions are asked on credit standards for approving loans, credit terms and conditions on new loans, credit demand, the factors affecting loan supply and demand conditions and the share of loan rejections.
The survey questions are generally phrased in terms of changes over the past three months (in this case in the third quarter of 2015) or expectations of changes over the next three months (i.e. in the fourth quarter of 2015).
The responses to questions related to credit standards are analysed in this report by focusing on the difference (“net percentage”) between the share of banks reporting that credit standards applied to the loan approval have been tightened and the share of banks reporting that they have been eased. A positive net percentage indicates that a larger proportion of banks has tightened credit standards (“net tightening”), whereas a negative net percentage indicates that a larger proportion of banks has eased credit standards (“net easing”). Likewise, the term “net demand” refers to the difference between the share of banks reporting an increase in loan demand (i.e. in bank loan financing needs) and the share of banks reporting a decline. Net demand will therefore be positive if a larger proportion of banks has reported an increase in loan demand, whereas negative net demand indicates that a larger proportion of banks has reported a decline in loan demand.
In order to describe the developments in survey replies over time, the report refers to changes in the “net tightening” or “net easing” of credit standards from one survey round to another. For example, a lower net percentage of banks tightening their credit standards between two survey waves would be referred to as a “decline in net tightening”. Similarly, higher net percentages of banks indicating a decline in loan demand between two survey waves would be referred to as a “more pronounced net decline in demand”.
In addition, an alternative measure of the responses to questions related to changes in credit standards and net demand is included. This measure is the weighted difference (“diffusion index”) between the share of banks reporting that credit standards have been tightened and the share of banks reporting that they have been eased. Likewise, regarding the demand for loans, the diffusion index refers to the weighted difference between the share of banks reporting an increase in loan demand and the share of banks reporting a decline. The diffusion index is constructed in the following way: lenders who have answered “considerably” are given a weight twice as high (score of 1) as lenders having answered “somewhat” (score of 0.5). The interpretation of the diffusion indices follows the same logic as the interpretation of net percentages.
The results of the individual banks participating in the BLS sample are aggregated in two steps: in a first step, individual bank results are aggregated to national results for the euro area countries, and in a second step, the national BLS results are aggregated to euro area BLS results. In the first step, banks’ replies can either be aggregated to national results by applying an implicit weighting through
2 For more detailed information on the bank lending survey, see the article entitled “A bank lending
survey for the euro area”, Monthly Bulletin, ECB, April 2003, and Berg J. et al., “The bank lending survey for the euro area”, Occasional Paper Series, No 23, ECB, 2005.

The euro area bank lending survey, October 2015 7
the sample selection or, alternatively, banks’ replies can be aggregated by applying an explicit weighting scheme based on the amounts outstanding of loans to non-financial corporations and households of the individual banks in the respective national samples. In the second step, since the number of banks in the national samples differs considerably and does not always reflect the respective share in lending to euro area non-financial corporations and households, the national survey results are aggregated to euro area BLS results by applying an explicit weighting scheme based on the national shares in the amounts outstanding of loans to euro area non-financial corporations and households.
For France, Malta, the Netherlands and Slovakia net percentages are weighted based on the amounts outstanding of loans of the individual banks in the respective national samples.
Detailed tables and charts based on the responses are provided in Annex 1 for the standard questions and in Annex 2 for the ad hoc questions.
A copy of the questionnaire can be found at http://www.ecb.europa.eu/stats/money/surveys/lend/html/index.en.html

The euro area bank lending survey, October 2015 8
2 Developments in credit standards, terms and conditions and net demand for loans in the euro area
2.1 Enterprises
2.1.1 Credit standards for loans to enterprises eased further in the third quarter of 2015
In the third quarter of 2015, credit standards on loans to enterprises eased further, thereby supporting the recovery of loan growth.
Banks reported a further net easing of credit standards on loans to enterprises in the third quarter of 2015 (of -4%, after -3% in the previous quarter; see Chart 1 and Table A), which was stronger than expected in the previous survey round.3 Across firm size, credit standards were eased mainly on loans to small and medium-sized enterprises (SMEs) and were broadly unchanged for large firms. Credit standards on loans to enterprises improved in Italy, remained unchanged in Germany, Spain and the Netherlands and tightened in France.
Looking ahead to the fourth quarter of 2015, euro area banks expect a further net easing of credit standards on loans to enterprises.
3 Net percentages are defined as the difference between the sum of the percentages of banks
responding “tightened considerably” and “tightened somewhat” and the sum of the percentages of banks responding “eased somewhat” and “eased considerably”. The net percentages for responses to questions related to the factors are defined as the difference between the percentage of banks reporting that the given factor contributed to a tightening and the percentage reporting that it contributed to an easing. In order to describe the developments in survey replies over time, the report refers to changes (i.e. decline or increase) in the “net tightening” or “net easing” of credit standards from one survey round to another. For example, a lower net percentage of banks tightening their credit standards between two survey waves would be referred to as a “decline in net tightening”.

The euro area bank lending survey, October 2015 9
Chart 1 Changes in credit standards applied to the approval of loans or credit lines to enterprises and contributing factors
(net percentages of banks reporting tightening credit standards and contributing factors)
Notes: “Actual” values are changes that have occurred, while “expected” values are changes anticipated by banks. Net percentages are defined as the difference between the sum of the percentages of banks responding “tightened considerably” and “tightened somewhat” and the sum of the percentages of banks responding “eased somewhat” and “eased considerably”. The net percentages for responses to questions related to the factors are defined as the difference between the percentage of banks reporting that the given factor contributed to a tightening and the percentage reporting that it contributed to an easing. “Cost of funds and balance sheet constraints” are an unweighted average of “cost related to capital position”, “access to market financing” and “liquidity position”; “risk perceptions” are an unweighted average of “general economic situation and outlook”, “industry or firm-specific situation and outlook/borrower’s creditworthiness” and “risk on collateral demanded”; “competition” is an unweighted average of “bank competition”, “non-bank competition” and “competition from market financing”. “Risk tolerance” was introduced in Q1 2015.
Competition continues to drive banks’ easing of credit standards on loans to enterprises, while banks’ cost of funds and balance sheet constraints and banks’ risk perceptions also contributed to the easing (see Chart 1 and Table 1).4
Across the five largest euro area countries, banks’ competitive pressures contributed to an easing in standards in France, Italy and the Netherlands while the impact was unchanged in Germany and Spain. Cost of funds and balance sheet constraints contributed to an easing in Italy, while there was broadly no change for this factor for the other largest countries. The effect of risk perceptions contributed to an easing of standards across all of the five largest
countries bar Germany, where it was unchanged. With regard to the impact of risk tolerance, banks in Germany reported that it tightened marginally; banks in Italy reported that it eased and it was reportedly unchanged in the other largest countries.
4 The calculation of a simple average for aggregating some factors to main categories assumes that all
factors have the same importance for the banks. This partly explains some inconsistencies in the respective charts between the development of credit standards and the development of the main underlying factor categories.
Table 1 Factors contributing to the net tightening of credit standards on loans or credit lines to enterprises
(net percentages)
Note: See note to Chart 1.
Country 2015Q2 2015Q3 2015Q2 2015Q3 2015Q2 2015Q3 2015Q2 2015Q3
Euro area -3 -1 -6 -7 -3 -3 4 0
DE 0 0 0 0 2 0 3 3
ES 0 0 0 0 -7 -3 0 0
FR -1 1 -9 -10 -7 -4 21 0
IT -17 -13 -8 -13 -4 -13 -13 -13
NL 0 0 -14 -25 0 -8 0 0
Banks' risk tolerance
Cost of funds and balance sheet constraints
Pressure from competition
Perception of risk

The euro area bank lending survey, October 2015 10
2.1.2 Terms and conditions for loans to enterprises improved in the third quarter of 2015
During the third quarter of 2015, overall terms and conditions that banks apply when granting new loans to enterprises continued to ease (see Chart 2 and Table 2), which suggests a continued improvement in financing conditions for loans to enterprises.
Chart 2 Changes in terms and conditions for loans or credit lines to enterprises
(net percentages of banks reporting tightening terms and conditions)
Notes: “Margins” are defined as the spread over a relevant market reference rate. “Other terms and conditions” are an unweighted average of “non-interest rate charges”, “size of the loan or credit line”, “loan covenants” and “maturity”. “Overall terms and conditions” were introduced in Q1 2015.
Looking at the largest euro area countries, terms and conditions eased in all of them, with the exception of the Netherlands, where no change was reported.
The net percentage of euro area banks reporting a narrowing of their margins on average loans to enterprises continued to increase, while margins on riskier loans to enterprises were broadly unchanged. Other terms and conditions on loans or credit lines, such as non-interest rate charges, size, collateral and maturity, continued to ease during the third quarter of 2015.
Table 2 Changes in terms and conditions for loans or credit lines to enterprises
(net percentage changes)
Note: See note to Chart 2.
Country 2015Q2 2015Q3 2015Q2 2015Q3 2015Q2 2015Q3
Euro area -14 -10 -32 -32 -6 1
DE -9 -15 -26 -12 -12 3
ES -60 -20 -80 -60 -10 0
FR -6 -5 -17 -27 -4 0
IT -13 -13 -38 -63 0 0
NL 0 0 -19 -25 0 0
Overall terms and conditions
Banks' margins on average loans
Banks' margins on riskier loans

The euro area bank lending survey, October 2015 11
In all of the largest euro area countries, and in particular in Spain and Italy, banks continued to report a narrowing of the margins on average loans in net terms. Across all five countries, banks reported that margins for riskier loans were unchanged in net terms, with the exception of Germany where they marginally increased.
In terms of the factors affecting credit terms and conditions, competition contributed most to the easing. All of the largest euro area countries reported an easing impact from competitive pressures (see Table 3).
2.1.3 Rejection rate for loans to enterprises has decreased
In terms of the change in euro area banks’ rejection rates for loan applications (i.e. the difference between the sum of the percentages of banks reporting an increase and that of banks reporting a decline in the share of loan rejections), the net share of rejected applications for loans to enterprises decreased in the third quarter of 2015 (to -4%, from 1%; see Chart 3).
Among the largest euro area countries, the rejection rate declined in Italy and Germany, whereas it remained unchanged in Spain, France and the Netherlands.
2.1.4 Increase in net demand for loans to enterprises
Net demand for loans to enterprises (i.e. the difference between the sum of the percentages of banks reporting an increase and that of banks reporting a decline in
demand) increased (see Chart 4 and Table A).5 The net percentage of banks reporting an increase in demand was 16%, up from 13% in the previous quarter. While this was below banks’ expectations, they expect a further considerable increase in demand for loans to enterprises in the fourth quarter of 2015. 5 Net percentages for the questions on demand for loans are defined as the difference between the sum
of the percentages of banks responding “increased considerably” and “increased somewhat” and the sum of the percentages of banks responding “decreased somewhat” and “decreased considerably”. The net percentages for responses to questions related to each factor are defined as the difference between the percentage of banks reporting that the given factor contributed to increasing demand and the percentage reporting that it contributed to decreasing demand. In order to describe the developments in survey replies over time, the report refers to changes in the “net demand” for loans from one survey round to another. For instance, higher net percentages of banks indicating a decline in loan demand between two survey waves would be referred to as a “more pronounced net decline in demand”.
Table 3 Factors contributing to the net tightening of terms and conditions for loans or credit lines to enterprises
(net percentages of banks reporting tightening terms and conditions)
Chart 3 Change in the share of rejected applications for loans to enterprises
(net percentages of banks reporting an increase in the share of rejections)
Notes: Share of loan rejections relative to the volume of all loan applications in that loan category.
Country 2015Q2 2015Q3 2015Q2 2015Q3 2015Q2 2015Q3 2015Q2 2015Q3
Euro area -8 -2 -24 -36 -4 -4 -1 0
DE -3 0 -15 -21 0 -9 0 -6
ES -40 -10 -60 -50 -20 -10 0 0
FR 2 4 -6 -39 -9 0 0 0
IT -25 -13 -25 -50 0 0 -13 0
NL 0 0 -23 -25 0 -25 0 0
Cost of funds and balance sheet constraints
Banks' risk tolerance
Pressure from competition
Perception of risk

The euro area bank lending survey, October 2015 12
Chart 4 Changes in demand for loans or credit lines to enterprises and contributing factors
(net percentages of banks reporting positive demand and contributing factors)
Notes: “Actual” values are changes that have occurred, while “expected” values are changes anticipated by banks. Net percentages for the questions on demand for loans are defined as the difference between the sum of the percentages of banks responding “increased considerably” and “increased somewhat” and the sum of the percentages of banks responding “decreased somewhat” and “decreased considerably”. The net percentages for responses to questions related to each factor are defined as the difference between the percentage of banks reporting that the given factor contributed to increasing demand and the percentage reporting that it contributed to decreasing demand. “Other financing needs” are an unweighted average of “M&A and corporate restructuring” and “debt refinancing/restructuring and renegotiation”; “use of alternative finance” is an unweighted average of “internal financing”, “loans from other banks”, “loans from non-banks”, “issuance/redemption of debt securities” and “issuance/redemption of equity”. “General level of interest rates” was introduced in Q1 2015.
All of the largest euro area countries reported an increase in demand in the third quarter of 2015, with the exception of Spain where banks reported unchanged demand.
Most factors contributed to the increased demand for loans to enterprises (see Chart 4 and Table 4). The general level of interest rates contributed most, while fixed investment, inventories and working capital and other financing needs also supported demand.6 The latter reflect the demand for debt refinancing and renegotiation and the financing needs for M&A activities. The use of alternative finance continued to have a dampening effect on the net demand for loans to euro area enterprises. In particular, the issuance of debt securities by enterprises and loans from other banks contributed negatively to loan demand.
6 The calculation of a simple average for aggregating some factors to main categories assumes that all
factors have the same importance for the banks. This partly explains some inconsistencies between the development of demand for loans and the development of the main underlying factor categories.

The euro area bank lending survey, October 2015 13
Across the largest euro area countries, the low level of interest rates contributed to increased loan demand in all countries. Financing needs related to fixed investment increased in all countries with the exception of Spain. Financing needs for inventories and working capital contributed positively to loan demand in Spain, Italy and the Netherlands; in France and Germany the effect on loan demand was negative. Banks in Germany, Spain and Italy report a negative impact on loan demand from availability of alternative finance.
2.2 Households
2.2.1 Credit standards for loans to households for house purchase tightened in net terms in the third quarter of 2015
For loans to households for house purchase, banks reported a tightening in their credit standards in net terms (5%, from -9%; see Chart 5 and Table A), which is broadly in line with the historical average calculated over the period since the start of the survey in 2003. The net tightening in the third quarter is also broadly in line with banks’ expectations in the previous survey round.
Of the largest countries, the tightening in credit standards on loans for house purchase is driven by the Netherlands, and, to a lesser extent, Germany and France. Credit standards eased in Spain and Italy. Looking ahead, euro area banks expect that credit standards will remain broadly unchanged in the fourth quarter of 2015.
The tightening in credit standards on loans for house purchase was driven by “other factors” reported by banks, in particular relating to national regulation. Competition continued to contribute most to an easing in credit standards on housing loans (see Chart 5 and Table 5).
Table 4 Factors contributing to net demand for loans or credit lines to enterprises
(net percentages)
Note: See note to Chart 4.
Country 2015Q2 2015Q3 2015Q2 2015Q3 2015Q2 2015Q3 2015Q2 2015Q3 2015Q2 2015Q3
Euro area 11 11 10 12 12 12 21 19 -2 -2
DE 0 15 -3 -9 9 12 21 24 -5 -8
ES 10 -10 30 20 -10 -15 20 10 -2 -2
FR 5 5 0 -4 3 12 13 7 4 2
IT 38 25 25 50 13 13 38 38 -5 -3
NL 0 29 0 30 60 40 19 25 4 15
General level of interest rates
Inventories and working capital
Use of alternative finance
Fixed investment
Other financing needs

The euro area bank lending survey, October 2015 14
Chart 5 Changes in credit standards applied to the approval of loans to households for house purchase and contributing factors
(net percentages of banks reporting tightening credit standards and contributing factors)
Notes: See the notes to Chart 1. “Risk perceptions” are an unweighted average of “general economic situation and outlook”, “housing market prospects including expected house price developments” and “borrower’s creditworthiness” (the latter from Q1 2015 onwards); “competition” is an unweighted average of “competition from other banks” and “competition from non-banks”. “Risk tolerance” was introduced in Q1 2015. *“Other factors” are provided by banks when none of the above factors are applicable. They are shown as a memo item for Q3 2015, where they include, in particular, changes in regulation and legislation at the national level.
Among the largest euro area countries, the effect from other factors reported by banks was strongest in the Netherlands – where a change in regulation impacted standards – and in Germany, although to a lesser extent. The tightening impact from cost of funds and balance sheet constraints was also strong in the Netherlands. Competition continued to have an easing effect in Italy, the Netherlands and, to a lesser extent, France, while there was no change in the impact on standards in Germany and Spain. The easing effect on credit standards of banks’ risk perceptions increased in Spain and the Netherlands, and remained broadly unchanged elsewhere. Banks’ risk tolerance contributed to an easing in credit standards in Spain, to a tightening in Germany, and its impact was relatively
unchanged elsewhere.
2.2.2 Terms and conditions for loans to households for house purchase continued to improve
Banks’ overall terms and conditions applied when granting new housing loans eased in the third quarter of 2015 (see Chart 6 and Table 6).
Table 5 Factors contributing to the net tightening of credit standards on loans to households for house purchase
(net percentages)
Note: See note to Chart 5.
Country 2015Q2 2015Q3 2015Q2 2015Q3 2015Q2 2015Q3 2015Q2 2015Q3
Euro area -2 0 -5 -4 -1 -1 -1 0
DE 3 0 1 0 3 0 3 3
ES 0 0 0 0 -3 -7 0 -10
FR 2 2 -11 -2 0 1 2 0
IT -13 0 -19 -13 0 0 -13 0
NL 0 22 0 -7 0 -5 0 0
Perception of risk
Banks' risk tolerance
Pressure from competition
Cost of funds and balance sheet constraints

The euro area bank lending survey, October 2015 15
Chart 6 Changes in terms and conditions for loans to households for house purchase
(net percentages of banks reporting tightening terms and conditions)
Notes: “Margins” are defined as the spread over a relevant market reference rate. “Other terms and conditions” are an unweighted average of “loan-to-value ratio”, “other loan size limits” (the latter from Q1 2015 onwards), “non-interest rate charges” and “maturity”. “Overall terms and conditions” were introduced in Q1 2015.
A substantial net percentage of euro area banks continued to report a decrease in the margins on average housing loans, while margins on riskier loans remained unchanged. Non-price terms and conditions had a slight tightening effect, mainly driven by other loan size limits.
Of the largest euro area countries, Germany, Spain and France reported an easing of overall terms and conditions, Italy reported no change and banks in the Netherlands reported a tightening. All of the largest countries, with the exception of the Netherlands, reported a decrease in the margins on average loans. With regard to riskier loans, however, banks in the Netherlands reported an easing in terms and conditions, banks in Germany reported a marginal tightening and there was no change in the other largest
countries. The effect of non-price terms and conditions was broadly unchanged in all of the largest countries, with the exception of the Netherlands where other terms and conditions, and specifically other loan size limits, contributed to a tightening.
Table 6 Changes in terms and conditions for loans to households for house purchase
(net percentage changes)
Note: See note to Chart 6.
Country 2015Q2 2015Q3 2015Q2 2015Q3 2015Q2 2015Q3
Euro area -6 -1 -27 -17 0 0
DE 0 -6 -21 -9 -12 3
ES -30 -10 -50 -30 10 0
FR 7 -5 5 -17 -2 0
IT -25 0 -75 -50 0 0
NL 0 23 -23 22 0 -23
Overall terms and conditions
Banks' margins on average loans
Banks' margins on riskier loans

The euro area bank lending survey, October 2015 16
With regard to the factors affecting terms and conditions, competition was the main factor behind the easing, while banks’ funding conditions and balance sheet constraints also contributed to an easing. Risk tolerance and risk perceptions overall had no impact on changes in terms and conditions (see Table 7).
In all of the five largest euro area countries except for the Netherlands, competition contributed to an easing of credit terms and conditions, particularly in Italy, Spain and France. Banks’ cost of funds contributed to an easing in Italy and Spain, no change in Germany and France and had a tightening effect in the
Netherlands. Banks’ risk perceptions led to an easing of terms and conditions in Spain and a tightening in France, and their impact was unchanged in Germany, Italy and the Netherlands. Banks’ risk tolerance had no effect on terms and conditions.
2.2.3 Rejection rate for loans to households for house purchase declined
In the third quarter of 2015, euro area banks in net percentage terms reported that the share of rejected loan applications decreased for housing loans to -3%, from 0% in the second quarter of 2015 (see Chart 7).
Across the largest euro area countries, there were heterogeneous developments. The rejection rate for housing loans declined in Spain and Italy, increased in Germany and the Netherlands, and remained unchanged in France.
2.2.4 Continued increase in net demand for housing loans
In the third quarter of 2015, banks continued to report a net increase in demand for housing loans (33%, after 49% in the previous quarter; see Chart 8 and Table A). The increase in demand remains above the historical average change in demand and again exceeded banks’
expectations from the previous survey round.
Table 7 Factors contributing to the net tightening of terms and conditions for loans to households for house purchase
(net percentage changes)
Chart 7 Change in the share of rejected applications for loans to households for house purchase
(net percentages of banks reporting an increase in the share of rejections)
Note: Share of loan rejections relative to the volume of all loan applications in that loan category.
Country 2015Q2 2015Q3 2015Q2 2015Q3 2015Q2 2015Q3 2015Q2 2015Q3
Euro area -7 -2 -23 -17 -5 0 0 0
DE -3 0 -3 -9 0 0 0 0
ES -20 -10 -30 -20 -20 -10 0 0
FR 7 0 -42 -17 0 2 2 0
IT -25 -13 -50 -38 -13 0 -13 0
NL 0 22 0 0 0 0 0 0
Cost of funds and balance sheet constraints
Pressure from competition
Perception of risk
Banks' risk tolerance

The euro area bank lending survey, October 2015 17
Chart 8 Changes in demand for loans to households for house purchase and contributing factors
(net percentages of banks reporting positive demand and contributing factors)
Notes: See the notes to Chart 4. “Other financing needs” are an unweighted average of “debt refinancing/restructuring and renegotiation” and “regulatory and fiscal regime of housing markets” (both from Q1 2015 onwards); “use of alternative finance” is an unweighted average of “internal financing out of savings/down payment” (from Q1 2015 onwards), “household savings” (until Q4 2014), “loans from other banks” and “other sources of external finance”. “General level of interest rates” was introduced in Q1 2015.
All of the five largest euro area countries reported an increase in net demand for housing loans, with the exception of France where demand decreased somewhat. The net percentage increase in demand continues to be highest in the Netherlands, followed by Italy.
The low level of interest rates and housing market prospects were the main factors contributing to increased demand for housing loans in the euro area. Consumer confidence also continued to be an important factor for the increased demand for housing loans (see Chart 8). Among the largest euro area countries, these three factors continued to contribute to the increase in demand across all countries and were particularly strong in the Netherlands and Italy.
Looking ahead, in the fourth quarter of 2015 euro area banks expect demand to continue increasing.
2.2.5 Continued net easing of credit standards for consumer credit and other lending to households
In the third quarter of 2015, euro area banks continued to ease their credit standards for consumer credit and other lending to households (-3%, after -4% in the previous quarter; see Chart 9 and Table A), remaining below the historical average. The net easing was less pronounced than banks expected in the previous survey round.
Table 8 Factors contributing to net demand for loans to households for house purchase
(net percentage changes)
Note: See note to Chart 8.
Country 2015Q2 2015Q3 2015Q2 2015Q3 2015Q2 2015Q3 2015Q2 2015Q3 2015Q2 2015Q3
Euro area 25 31 20 26 4 -2 45 35 1 1
DE 32 32 15 21 4 -1 38 29 -5 0
ES 0 30 20 30 0 0 10 10 -7 -3
FR 2 1 2 0 2 1 31 10 2 0
IT 38 50 25 50 6 13 88 75 4 4
NL 91 98 98 98 11 -34 98 98 14 15
Consumer confidence
General level of interest rates
Other financing needs
Housing market prospects
Use of alternative finance
The euro area bank lending survey, October 2015 18
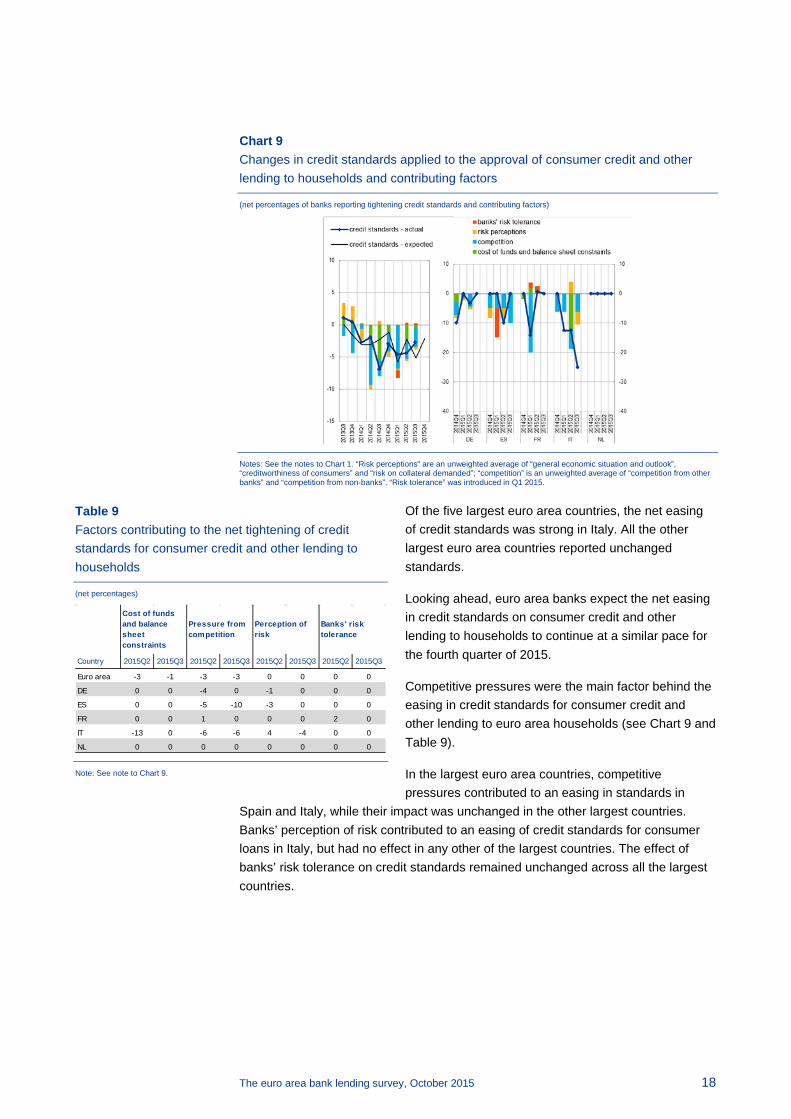
Chart 9 Changes in credit standards applied to the approval of consumer credit and other lending to households and contributing factors
(net percentages of banks reporting tightening credit standards and contributing factors)
Notes: See the notes to Chart 1. “Risk perceptions” are an unweighted average of “general economic situation and outlook”, “creditworthiness of consumers” and “risk on collateral demanded”; “competition” is an unweighted average of “competition from other banks” and “competition from non-banks”. “Risk tolerance” was introduced in Q1 2015.
Of the five largest euro area countries, the net easing of credit standards was strong in Italy. All the other largest euro area countries reported unchanged standards.
Looking ahead, euro area banks expect the net easing in credit standards on consumer credit and other lending to households to continue at a similar pace for the fourth quarter of 2015.
Competitive pressures were the main factor behind the easing in credit standards for consumer credit and other lending to euro area households (see Chart 9 and Table 9).
In the largest euro area countries, competitive pressures contributed to an easing in standards in
Spain and Italy, while their impact was unchanged in the other largest countries. Banks’ perception of risk contributed to an easing of credit standards for consumer loans in Italy, but had no effect in any other of the largest countries. The effect of banks’ risk tolerance on credit standards remained unchanged across all the largest countries.
Table 9 Factors contributing to the net tightening of credit standards for consumer credit and other lending to households
(net percentages)
Note: See note to Chart 9.
Country 2015Q2 2015Q3 2015Q2 2015Q3 2015Q2 2015Q3 2015Q2 2015Q3
Euro area -3 -1 -3 -3 0 0 0 0
DE 0 0 -4 0 -1 0 0 0
ES 0 0 -5 -10 -3 0 0 0
FR 0 0 1 0 0 0 2 0
IT -13 0 -6 -6 4 -4 0 0
NL 0 0 0 0 0 0 0 0
Banks' risk tolerance
Cost of funds and balance sheet constraints
Perception of risk
Pressure from competition

The euro area bank lending survey, October 2015 19
2.2.6 Terms and conditions for consumer credit and other lending to households continue to improve
Euro area banks reported a continued net improvement in the terms and conditions on consumer credit and other lending to households in the third quarter of 2015. This was driven by a narrowing of margins on average loans (see Chart 10).
Chart 10 Changes in terms and conditions for consumer credit and other lending to households
(net percentages of banks reporting tightening terms and conditions)
Notes: “Margins” are defined as the spread over a relevant market reference rate. “Other terms and conditions” are an unweighted average of “size of the loan” (from Q1 2015 onwards), “non-interest rate charges” and “maturity”. “Overall terms and conditions” were introduced in Q1 2015.
Non-price terms and conditions, such as collateral requirements, loan size and non-interest charges, remained unchanged.
Across all the five largest euro area countries, margins on average loans narrowed, with the exception of the Netherlands, where they were unchanged, as in the last quarter. The margins on riskier loans narrowed marginally only in Germany, and were unchanged in the other largest countries.
Regarding banks’ assessment of the factors impacting the change in credit terms and conditions on new loans, competitive pressures and, to a lesser extent, banks’ cost of funds and balance sheet constraints contributed most to an easing. The effects of both banks’ risk perceptions and risk tolerance were broadly
unchanged (see Table 11).
Table 10 Changes in terms and conditions for consumer credit and other lending to households
(net percentage changes)
Note: See note to Chart 10.
Country 2015Q2 2015Q3 2015Q2 2015Q3 2015Q2 2015Q3
Euro area -7 -3 -24 -10 -4 0
DE -6 -3 -26 -6 -18 -3
ES -40 -20 -60 -30 0 0
FR 1 -1 -16 -7 -2 0
IT 0 0 -25 -13 0 0
NL 0 0 0 0 0 0
Overall terms and conditions
Banks' margins on average loans
Banks' margins on riskier loans

The euro area bank lending survey, October 2015 20
Table 11 Factors contributing to the net tightening of terms and conditions on consumer credit and other lending to households
(net percentage changes)
Across the largest euro area countries, competitive pressures contributed to the easing of terms and conditions in all countries except the Netherlands, where banks reported no change in the effect of this factor. Banks in Spain reported that the cost of funds and balance sheet constraints eased terms and conditions while the effect of this factor remained
unchanged elsewhere. There was no change reported in any of the five largest countries with respect to the effect on credit terms and conditions from banks’ perception of risk or risk tolerance.
2.2.7 Rejection rate for consumer credit and other lending to households increased slightly
According to euro area banks, the net share of rejected applications for consumer credit and other lending to households increased in the third quarter of 2015 (to 4%, from 1% in the previous survey round; see Chart 11).
Across the largest euro area countries there were divergent developments, with the rejection rate remaining unchanged in Germany and the Netherlands, increasing in Spain and France and decreasing in Italy.
2.2.8 Continued increase in net demand for consumer credit and other lending to households
According to euro area banks, net demand for consumer credit and other lending to households increased during the third quarter (19%, after 41%; see Chart 12 and Table A), remaining above its historical average.
Across the largest euro area countries, net demand increased in all countries with the exception of France, where it remained unchanged.
Country 2015Q2 2015Q3 2015Q2 2015Q3 2015Q2 2015Q3 2015Q2 2015Q3
Euro area -7 -2 -10 -9 -3 1 1 0
DE -6 0 -9 -3 -3 0 0 0
ES -20 -10 -30 -30 -10 0 0 0
FR 0 0 0 -6 0 0 2 0
IT -13 0 -13 -13 0 0 0 0
NL 0 0 0 0 0 0 0 0
Cost of funds and balance sheet constraints
Pressure from competition
Perception of risk
Banks' risk tolerance
Chart 11 Change in the share of rejected applications for consumer credit and other lending to households
(net percentages of banks reporting an increase in the share of rejections)
Notes: Share of loan rejections relative to the volume of all loan applications in that loan category. The first data point is for Q1 2015.

The euro area bank lending survey, October 2015 21
Among the factors underlying demand at the euro area level, financing needs for spending on durable consumer goods continued to contribute to increased demand (see Chart 12). Consumer confidence is also driving demand, as well as the low level of interest rates.
Chart 12 Changes in demand for consumer credit and other lending to households and contributing factors
(net percentages of banks reporting positive demand and contributing factors)
Notes: See the notes to Chart 4. “Use of alternative finance” is an unweighted average of “internal financing out of savings” (from Q1 2015 onwards), “household savings” (until Q4 2014), “loans from other banks” and “other sources of external finance”. “Consumption exp. (real estate)” denotes “consumption expenditure financed through real estate-guaranteed loans”. “General level of interest rates” and “consumption expenditure financed through real estate-guaranteed loans” were introduced in Q1 2015.
Across all the largest euro area countries, spending on durable goods and consumer confidence contributed positively to demand. The general level of interest rates also had a strong positive effect on demand in all countries except the Netherlands.
For the fourth quarter of 2015, euro area banks expect a continued net increase in demand for consumer credit and other lending to households.
Table 12 Factors contributing to net demand for consumer credit and other lending to households
(net percentage changes)
Note: See note to Chart 12.
Country 2015Q2 2015Q3 2015Q2 2015Q3 2015Q2 2015Q3 2015Q2 2015Q3 2015Q2 2015Q3
Euro area 36 25 19 23 0 1 15 22 0 -2
DE 21 15 21 18 0 3 21 18 -2 0
ES 50 30 60 40 0 0 30 20 0 0
FR 67 29 0 29 0 0 7 29 0 -4
IT 38 50 25 25 0 0 13 38 4 -8
NL 0 31 0 31 0 0 0 0 0 0
Consumer confidence
Use of alternative finance
Spending on durable goods
General level of interest rates
Consumption exp. (real estate)

The euro area bank lending survey, October 2015 22
3 Ad hoc questions
3.1 Banks’ access to retail and wholesale funding
As in previous survey rounds, the October 2015 survey questionnaire included a question to assess the extent to which the situation in financial markets affected banks’ access to retail and wholesale funding.7
Table 13 Banks’ assessment of funding conditions and the ability to transfer credit risk off balance sheet
(net percentages of banks reporting deteriorated market access)
Note: See note to Chart 13.
For the third quarter of 2015, euro area banks reported a marginal net deterioration in retail funding, while access to the other main sources of funds, namely money markets, debt issuance and securitisation, improved (see Chart 13).8
Looking ahead, for the fourth quarter of 2015 euro area banks expect unchanged access to overall retail funding and an easing with regard to access to all other sources.
7 The results shown are calculated as a percentage of the number of banks which did not reply “not
applicable”. 8 However, for the results on securitisation, there are a large number of banks that replied “not
applicable” as this source of funding is not relevant for them (around 45% in the third quarter of 2015).
Retail fundingInterbank unsecured money market
Wholesale debt securities
Securitisation
2015Q2 4 -2 12 -10
2015Q3 1 -8 -4 -1
Chart 13 Banks’ assessment of funding conditions and the ability to transfer credit risk off balance sheet
(net percentages of banks reporting deteriorated market access)
Notes: The net percentages are defined as the difference between the sum of the percentages for “deteriorated considerably” and “deteriorated somewhat” and the sum of the percentages for “eased somewhat” and “eased considerably”. “RDS” denotes short-term deposits, “RLS” denotes long-term deposits and other retail funding instruments, “MMV” denotes very short-term money market, “MMS” denotes short-term money market, “DSS” denotes short-term debt securities, “DSM” denotes medium to long-term debt securities, “SCL” denotes securitisation of corporate loans, “SHL” denotes securitisation of loans for house purchase, and “TCR” denotes ability to transfer credit risk off the balance sheet.

The euro area bank lending survey, October 2015 23
3.2 The impact of the ECB’s expanded asset purchase programme
The October 2015 survey questionnaire included for the second time (after the April 2015 round) three ad hoc questions aimed at gauging the impact of the ECB’s expanded asset purchase programme (APP). Banks were asked to consider both direct and indirect effects of the APP, as there may be indirect effects on banks’ financial situation and asset allocation even if the respective bank has not been involved in any direct asset sales vis-à-vis the Eurosystem. Banks reported the impact of the APP on their financial situation. In addition, banks were asked about the purposes for which they did or will use the additional liquidity arising from the expanded APP, either due to banks’ sales of marketable assets or due to an increase in customer deposits. Finally, banks provided an assessment of the impact of the APP on their lending conditions.
3.2.1 Impact of the ECB’s expanded asset purchase programme on banks’ financial situation
This section reports on banks’ responses regarding the impact of the APP on banks’ assets, their liquidity situation, market financing conditions, bank profitability and banks’ capital and leverage ratio and compares them to the previous survey responses on the APP reported in the April 2015 BLS. In general, banks reported an overall improvement of their financial situation over the past six months due to the APP (see Chart 14). Banks also broadly expect their financial situation to improve in the next six months, due to the APP. However, banks reported in net terms that they expect profitability to decrease over the next 6 months, due to the APP.
With regard to changes in total assets, around 10% (from 11% in the previous survey) of banks in net terms reported an increase in their total assets over the past six months (see Chart 14), which is in line with expectations from the previous APP ad hoc question. Banks report that they expect a continued increase in their total assets (net percentage of banks: 15%).
Chart 14 Overview of the impact of the expanded APP on euro area banks’ financial situation
(net percentage of respondents)
Notes: The net percentages are defined as the difference between the sum of the percentages for “increased/improved considerably” and “increased/improved somewhat” and the sum of the percentages for “decreased/deteriorated somewhat” and “decreased/deteriorated considerably”. The results shown are calculated as a percentage of the number of banks which did not reply “not applicable”.

The euro area bank lending survey, October 2015 24
Regarding the impact of the APP on banks’ liquidity situation, in net terms, 23% of euro area banks reported that their liquidity situation improved considerably over the past six months (from 20% in the previous survey round) and expect this development to continue over the next six months (25% of the banks in net terms), mainly owing to an increase in deposits from enterprises and households, but also owing to their sales of marketable assets.
Euro area banks reported an improvement in their market financing conditions as a result of the APP (net percentage of 30%, from 47% in the previous survey), in particular for their financing via covered bonds and equity issuance (see Chart 15). For the banks with asset-backed securities (ABS) business (about 65% of the euro area banks in the BLS sample), this financing source also improved. Banks expect the improvement in their market financing conditions related to the APP to continue also for the next six months (in net terms 24%).
Related to the counteracting forces of the APP affecting bank profitability – specifically, a generally negative impact on bank profitability from the low level of interest rates and from the flattening of the term structure of interest rates, countered by the positive impact on bank profitability from capital gains – in net terms, 2% of euro area banks reported that the APP had a positive impact on profitability over the past six months (from 3% in the previous round) (see Chart 16). Over the next six months, banks reported that they expect profitability to decrease as a result of the
APP (in net terms: -1%). With regard to banks’ capital and leverage ratio, a slightly positive net percentage of banks indicated a positive APP impact for the past and next six months (see Chart 16).
3.2.2 Purposes for which banks use the additional liquidity from the ECB’s expanded asset purchase programme
The additional liquidity resulting from the APP may either stem from banks’ sales of marketable assets or from an increase in customer deposits. Banks can use the additional liquidity stemming from either of the two sources for refinancing purposes, for granting loans or for purchasing assets. The first part of this section reports for which purposes banks have used or intend to use the additional liquidity resulting from their sales of marketable assets, while the second part deals with
Chart 15 Impact of the expanded APP on euro area banks’ market financing conditions
(net percentage of respondents)
Note: See note to Chart 14.
Chart 16 Impact of the expanded APP on euro area banks’ profitability and capital position
(net percentage of respondents)
Note: See note to Chart 14.

The euro area bank lending survey, October 2015 25
the purposes for which banks have used or intend to use the additional liquidity resulting from an increase in customer deposits. Banks responses will also be compared with responses from the April BLS on the effects of the APP.
Euro area banks indicated that they have used the additional liquidity from their sales of marketable assets related to the APP over the past six months in particular for granting loans and purchasing assets (see Chart 17). Specifically, 39% of euro area banks indicated that they have used the funds for granting loans to enterprises (after 32% in the previous survey), while 14% and 36% respectively indicated that they have used the funds for granting housing loans and consumer credit and other lending to households (after 17% and 18% respectively in the last survey round) (see Chart 18). Over the coming six months, this pattern is expected to continue as the percentage of banks intending to use the APP liquidity from their sales of marketable assets for granting loans increases
in all three loan categories (loans to enterprises: 42%, housing loans: 15%, consumer credit and other lending to households: 37%; see Chart 18). These results confirm that the APP continues to support lending to the euro area.
On average 12% of euro area banks reported that they used the liquidity from the sales of marketable assets to some extent also for refinancing over the past six months (after 9% in the previous survey) (see Chart 17). This percentage is expected to remain similar over the next six months (13%). In detail, euro area banks indicated
that they used the additional liquidity from their APP-related sales of marketable assets mainly for substituting maturing debt (21% of the banks) and for substituting deposit shortfalls (14%). The substitution of Eurosystem liquidity operations (8%) and the substitution of interbank lending (6%) were mentioned by a lower net percentage of banks at the euro area level (see Chart 19). A similar importance is also allocated to these components over the next six months.
With regard to evidence for portfolio rebalancing, on average 21% of the euro area banks used the liquidity from the sales of marketable assets for purchasing marketable assets over the past six months (see Chart 17), up from 4% in the previous survey and higher than was expected for this period in the previous survey. This percentage is expected to remain broadly unchanged over the next six months (20%).
Chart 17 Purposes for which euro area banks use the additional liquidity from the expanded APP – overview
(average percentage of respondents per category)
Notes: The percentages are defined as the sum of the percentages for “has contributed (will contribute) considerably to this purpose” and “has contributed (will contribute) somewhat to this purpose”. The results shown are calculated as a percentage of the number of banks which did not reply “not applicable”.
Chart 18 Purposes for which euro area banks use the additional liquidity from the expanded APP – granting loans
(percentage of respondents)
Note: See note to Chart 17.

The euro area bank lending survey, October 2015 26
Euro area banks were also asked for which purposes they have used the additional liquidity related to the APP from an increase in deposits of households and enterprises.
First, banks report that they used the additional APP-related liquidity from an increase in customer deposits mainly for granting loans (23%, from 26% in the previous survey) (see Chart 17) and the effect is broadly balanced across lending to enterprises and lending to households for house purchase and consumer credit (percentage of banks for loans to enterprises: 25%; housing loans: 22%; consumer credit: 22%) (see Chart 18). Banks intend to continue do so over the coming six months (loans to enterprises: 29%; housing loans: 26%; consumer credit: 26%).
Second, with respect to refinancing purposes, a positive net percentage of euro area banks indicated that the increase in customer deposits was used over the past six months for refinancing purposes (16%, after 12% in the previous survey); a similar net percentage of banks (14%) reported that they intend to use this liquidity for refinancing purposes over the next six months (Chart 17). Banks also reported a broadly equal distribution of the use of APP-related liquidity from an increase in customer deposits across refinancing categories over the past six months, i.e. for substituting maturing debt (17%), interbank lending (16%) and Eurosystem liquidity operations (15%) (see Chart 19). A similar effect is expected over the next six months.
Third, with respect to purchasing marketable assets out of the additional APP liquidity from increased customer deposits, on average 12% of euro area banks (from 5% in the previous survey) indicated that they have done so over the past six months (see Chart 17). The assessment by euro area banks remains broadly unchanged also for the next six months.
Chart 20 Impact of the expanded APP on bank lending conditions
(net percentage of respondents)
Notes: The net percentages are defined as the difference between the sum of the percentages for “tightened considerably” and “tightened somewhat” and the sum of the percentages for “eased somewhat” and “eased considerably”. The results shown are calculated as a percentage of the number of banks which did not reply “not applicable”.
Chart 19 Purposes for which euro area banks use the additional liquidity from the expanded APP – refinancing
(percentage of respondents)
Note: See note to Chart 17.

The euro area bank lending survey, October 2015 27
3.2.3 Impact of the ECB’s expanded asset purchase programme on banks’ lending conditions
Finally, euro area banks indicated a net easing impact of the APP on their credit standards over the past six months (loans to enterprises: -4%, housing loans: -2%, consumer credit and other lending to households: -1%; see Chart 20), which is very similar to the results from the past survey round (loans to enterprises: -3%, housing loans: -2%, consumer credit and other lending to households: -1%). Over the next six months, banks expect a continued easing impact on credit standards for loans to enterprises (-2%), while the effect on credit standards on housing loans and consumer credit is expected to remain broadly unchanged. In line with banks’ indication that they use the additional APP-related liquidity mainly for loans to enterprises, they also indicated that the largest impact of the APP is on credit standards for loans to enterprises.
The effects of the APP appear to be stronger when looking at the impact on credit terms and conditions (loans to enterprises: -29%, housing loans: -13%, consumer credit and other lending to households: -22%; see Chart 20), and the reported easing in terms and conditions for enterprises is generally greater than reported in the previous survey round (loans to enterprises: -19%, housing loans: -15%, consumer credit and other lending to households: -8%). This favourable impact is expected to continue over the next six months (loans to enterprises: -25%, housing loans: -10%, consumer credit and other lending to households: -18%).

The euro area bank lending survey, October 2015 28
Annex 1 Results for the standard questions9
Loans or credit lines to enterprises
Question 1 Over the past three months, how have your bank’s credit standards as applied to the approval of loans or credit lines to enterprises changed? Please note that we are asking about the change in credit standards, rather than about their level.
(in percentages, unless otherwise stated)
Notes: The net percentage is defined as the difference between the sum of the percentages for “tightened considerably” and “tightened somewhat”, and the sum of the percentages for “eased somewhat” and “eased considerably”. The diffusion index is defined as the net percentage weighted according to the intensity of the response, giving lenders who have answered “considerably” a weight twice as high (score of 1) as lenders having answered “somewhat” (score of 0.5). The mean is calculated by attributing the values 1 to 5 to the first possible answer and consequently for the others.
9 Figures in the tables in the annexes 1 and 2 may deviate slightly from those in the text due to rounding.
Jul 15 Oct 15 Jul 15 Oct 15 Jul 15 Oct 15 Jul 15 Oct 15 Jul 15 Oct 15
Tightened considerably 0 0 0 0 0 0 0 0 0 0Tightened somewhat 3 3 2 2 3 3 3 2 3 3Remained basically unchanged 91 90 92 92 90 93 91 91 91 90Eased somewhat 6 7 6 6 7 4 6 6 6 7Eased considerably 1 0 0 0 0 0 0 0 1 0Total 100 100 100 100 100 100 100 100 100 100Net percentage -3 -4 -4 -5 -3 -1 -4 -4 -3 -4Diffusion index -2 -2 -2 -2 -2 0 -2 -2 -2 -2Mean 3.04 3.00 3.04 3.01 3.03 2.97 3.04 3.01 3.04 3.00Number of banks responding 136 135 131 131 132 131 136 134 136 135
Long-term loansOverallLoans to small and
medium-sized enterprises
Loans to large enterprises Short-term loans

The euro area bank lending survey, October 2015 29
Question 2 Over the past three months, how have the following factors affected your bank’s credit standards as applied to the approval of loans or credit lines to enterprises?
(in percentages, unless otherwise stated)
NA = not available; NetP = net percentage; DI = diffusion index. Notes: The net percentage is defined as the difference between the sum of banks responding “- -” (contributed considerably to tightening) and “-” (contributed somewhat to tightening), and the sum of banks responding “+” (contributed somewhat to easing) and “+ +” (contributed considerably to easing). “°” means “contributed to basically unchanged credit standards”. The diffusion index is defined as the net percentage weighted according to the intensity of the response, giving lenders who have answered “considerably” a weight twice as high (score of 1) as lenders having answered “somewhat” (score of 0.5). The mean is calculated by attributing the values 1 to 5 to the first possible answer and consequently for the others.
OVERALL
Jul 15 Oct 15 Jul 15 Oct 15 Jul 15 Oct 15A) Cost of funds and balance sheet constraintsCosts related to your bank's capital position 0 2 93 2 0 3 -2 -1 -1 0 3.02 2.97Your bank's abil ity to access market financing 1 1 91 2 0 6 -2 -1 -1 0 3.01 2.97Your bank's l iquidity position 1 1 88 3 0 7 -5 -1 -2 0 3.04 2.97B) Pressure from competitionCompetition from other banks 0 0 80 14 2 3 -10 -16 -7 -9 3.14 3.13Competition from non-banks 0 0 91 3 0 6 -3 -3 -2 -2 3.02 2.98Competition from market financing 0 0 91 3 0 6 -4 -3 -2 -2 3.03 2.98C) Perception of riskGeneral economic situation and outlook 0 3 87 9 0 2 -4 -6 -2 -3 3.04 3.00Industry or firm-specific situation and outlook/borrower's creditworthiness 0 2 85 12 0 2 -5 -9 -3 -5 3.05 3.04Risk related to the collateral demanded 0 3 95 1 0 2 0 2 0 1 3.00 2.94D) Your bank's risk toleranceYour bank's risk tolerance 0 2 92 2 0 3 4 0 2 0 2.95 2.96
SMALL AND MEDIUM-SIZED ENTERPRISES
Jul 15 Oct 15 Jul 15 Oct 15 Jul 15 Oct 15
A) Cost of funds and balance sheet constraintsCosts related to your bank's capital position 0 1 78 10 0 11 -3 -9 -1 -4 3.03 3.08Your bank's abil ity to access market financing 1 1 75 10 0 14 -2 -9 -1 -4 3.02 3.08Your bank's l iquidity position 1 1 78 11 0 11 -5 -10 -2 -5 3.05 3.09B) Pressure from competitionCompetition from other banks 0 0 74 14 3 9 -8 -17 -6 -10 3.12 3.17Competition from non-banks 0 0 81 8 0 12 -2 -8 -2 -4 3.03 3.04Competition from market financing 0 0 83 8 0 10 -3 -8 -2 -4 3.04 3.05C) Perception of riskGeneral economic situation and outlook 0 2 77 14 0 7 -4 -12 -2 -6 3.04 3.08Industry or firm-specific situation and outlook/borrower's creditworthiness 0 2 73 18 0 7 -6 -16 -3 -8 3.06 3.13Risk related to the collateral demanded 0 2 82 8 0 7 1 -6 0 -3 2.99 3.04D) Your bank's risk toleranceYour bank's risk tolerance 0 1 77 10 0 12 3 -8 1 -4 2.96 3.08
LARGE ENTERPRISES
Jul 15 Oct 15 Jul 15 Oct 15 Jul 15 Oct 15
A) Cost of funds and balance sheet constraintsCosts related to your bank's capital position 0 2 86 3 0 10 -2 -1 -1 0 3.02 2.96Your bank's abil ity to access market financing 1 1 84 2 0 13 -1 -1 0 0 3.01 2.96Your bank's l iquidity position 1 1 86 3 0 10 -5 -1 -3 0 3.05 2.96B) Pressure from competitionCompetition from other banks 0 0 76 14 0 10 -12 -14 -7 -7 3.16 3.09Competition from non-banks 0 0 86 3 0 11 -3 -3 -2 -2 3.02 2.97Competition from market financing 0 0 85 4 0 11 -4 -4 -2 -2 3.04 2.98C) Perception of riskGeneral economic situation and outlook 0 2 84 5 0 9 -4 -3 -2 -1 3.04 2.98Industry or firm-specific situation and outlook/borrower's creditworthiness 0 2 84 6 0 9 -3 -4 -1 -2 3.03 2.99Risk related to the collateral demanded 0 2 88 1 0 9 0 1 0 1 3.00 2.94D) Your bank's risk toleranceYour bank's risk tolerance 0 2 87 0 0 10 0 2 0 1 3.00 2.93
Mean
NANetP DI Mean
Mean
-- - ° +
-- - ° +
-- - °
++
+ ++ NANetP DI
++ NANetP DI

The euro area bank lending survey, October 2015 30
Question 3 Over the past three months, how have your bank’s terms and conditions for new loans or credit lines to enterprises changed?
(in percentages, unless otherwise stated)
NA = not available; NetP = net percentage; DI = diffusion index. Notes: The net percentage is defined as the difference between the sum of banks responding “- -” (tightened considerably) and “-” (tightened somewhat), and the sum of banks responding “+” (eased somewhat) and “+ +” (eased considerably). “°” means “basically unchanged credit standards”. The diffusion index is defined as the net percentage weighted according to the intensity of the response, giving lenders who have answered “considerably” a weight twice as high (score of 1) as lenders having answered “somewhat” (score of 0.5). The mean is calculated by attributing the values 1 to 5 to the first possible answer and consequently for the others.
OVERALL
Jul 15 Oct 15 Jul 15 Oct 15 Jul 15 Oct 15
A) Overall terms and conditionsOverall terms and conditions 0 3 83 13 0 2 -14 -10 -7 -5 3.14 3.07B) MarginsYour bank's margin on average loans 0 4 58 36 0 2 -32 -32 -18 -16 3.35 3.28Your bank's margin on riskier loans 0 4 91 3 0 2 -6 1 -4 1 3.08 2.95C) Other conditions and termsNon-interest rate charges 0 2 91 5 0 2 -5 -2 -2 -1 3.05 2.99Size of the loan or credit l ine 0 3 89 7 0 2 -2 -4 -1 -2 3.03 3.00Collateral requirements 0 2 92 4 0 2 -5 -2 -2 -1 3.04 2.97Loan covenants 0 2 90 6 0 2 -6 -5 -4 -2 3.08 3.00Maturity 0 3 86 9 0 2 -8 -6 -4 -3 3.07 3.02
SMALL AND MEDIUM-SIZED ENTERPRISES
Jul 15 Oct 15 Jul 15 Oct 15 Jul 15 Oct 15
A) Overall terms and conditionsOverall terms and conditions 0 3 83 9 0 5 -12 -7 -6 -3 3.12 3.03B) MarginsYour bank's margin on average loans 0 4 58 32 0 5 -30 -28 -16 -14 3.33 3.25Your bank's margin on riskier loans 0 4 88 3 0 5 -5 0 -3 0 3.06 2.96C) Other conditions and termsNon-interest rate charges 0 2 90 4 0 5 -6 -2 -4 -1 3.07 2.98Size of the loan or credit l ine 0 2 88 5 0 5 -4 -3 -2 -2 3.04 2.99Collateral requirements 0 2 92 1 0 5 -2 0 -1 0 3.02 2.96Loan covenants 0 1 93 1 0 5 -4 0 -2 0 3.05 2.96Maturity 0 1 88 6 0 5 -7 -5 -4 -2 3.08 3.01
LARGE ENTERPRISES
Jul 15 Oct 15 Jul 15 Oct 15 Jul 15 Oct 15
A) Overall terms and conditionsOverall terms and conditions 0 3 79 9 0 9 -11 -7 -5 -3 3.12 3.03B) MarginsYour bank's margin on average loans 0 3 58 30 0 9 -29 -27 -15 -13 3.32 3.23Your bank's margin on riskier loans 0 5 83 2 0 9 -5 3 -3 2 3.07 2.93C) Other conditions and termsNon-interest rate charges 0 2 85 4 0 9 -5 -2 -2 -1 3.05 2.97Size of the loan or credit l ine 0 2 83 7 0 9 -3 -5 -1 -2 3.03 3.00Collateral requirements 0 2 85 4 0 9 -3 -2 -2 -1 3.04 2.97Loan covenants 0 4 82 6 0 9 -4 -2 -2 -1 3.05 2.98Maturity 0 3 81 7 0 9 -7 -4 -3 -2 3.07 3.00
-- - ° +
Mean
- ° + ++ NA
++ NANetP DI Mean
-- - ° + ++ NANetP DI
NetP DI Mean--

The euro area bank lending survey, October 2015 31
Question 4 Over the past three months, how have the following factors affected your bank’s credit terms and conditions as applied to new loans or credit lines to enterprises?
(in percentages, unless otherwise stated)
NA = not available; NetP = net percentage; DI = diffusion index. Notes: The net percentage is defined as the difference between the sum of banks responding “- -” (contributed considerably to tightening) and “-” (contributed somewhat to tightening), and the sum of banks responding “+” (contributed somewhat to easing) and “+ +” (contributed considerably to easing). “°” means “contributed to basically unchanged credit standards”. The diffusion index is defined as the net percentage weighted according to the intensity of the response, giving lenders who have answered “considerably” a weight twice as high (score of 1) as lenders having answered “somewhat” (score of 0.5). The mean is calculated by attributing the values 1 to 5 to the first possible answer and consequently for the others.
Question 5 Over the past three months (apart from normal seasonal fluctuations), has the share of enterprise loan applications that were completely rejected by your bank increased, remained unchanged or decreased (loan volume, relative to the total volume of loan applications in that loan category)?
(in percentages, unless otherwise stated)
Notes: The net percentage is defined as the difference between the sum of the percentages for “increased considerably” and “increased somewhat”, and the sum of the percentages for “decreased somewhat” and “decreased considerably”. The diffusion index is defined as the net percentage weighted according to the intensity of the response, giving lenders who have answered “considerably” a weight twice as high (score of 1) as lenders having answered “somewhat” (score of 0.5). The mean is calculated by attributing the values 1 to 5 to the first possible answer and consequently for the others.
OVERALL IMPACT ON YOUR BANK'S CREDIT TERMS AND CONDITIONS
Jul 15 Oct 15 Jul 15 Oct 15 Jul 15 Oct 15
A) Cost of funds and balance sheet constraints Cost of funds and balance sheet constraints 0 4 89 6 0 2 -8 -2 -4 -1 3 2.99B) Pressure from competitionPressure from competition 0 1 56 34 2 7 -24 -36 -13 -19 3 3.36C) Perception of risk Perception of risk 0 2 89 6 0 2 -4 -4 -2 -2 3 2.99D) Your bank's risk tolerance Your bank's risk tolerance 0 2 95 1 0 2 -1 0 0 0 3 2.96
IMPACT ON YOUR BANK'S MARGINS ON AVERAGE LOANS
Jul 15 Oct 15 Jul 15 Oct 15 Jul 15 Oct 15
A) Cost of funds and balance sheet constraints Cost of funds and balance sheet constraints 0 3 86 8 0 3 -10 -5 -5 -2 3 3.01B) Pressure from competitionPressure from competition 0 1 60 33 3 4 -26 -35 -15 -19 3 3.34C) Perception of risk Perception of risk 0 2 88 6 0 3 -5 -3 -2 -2 3 2.99D) Your bank's risk tolerance Your bank's risk tolerance 0 1 93 3 0 3 -2 -2 -1 -1 3 2.98
IMPACT ON YOUR BANK'S MARGINS ON RISKIER LOANS
Jul 15 Oct 15 Jul 15 Oct 15 Jul 15 Oct 15
A) Cost of funds and balance sheet constraints Cost of funds and balance sheet constraints 0 2 93 0 0 5 -2 2 -1 1 3 2.95B) Pressure from competitionPressure from competition 0 1 85 9 0 5 -12 -8 -6 -4 3 3.06C) Perception of risk Perception of risk 0 2 91 2 0 5 0 0 0 0 3 2.97D) Your bank's risk tolerance Your bank's risk tolerance 0 4 90 1 #N/A 5 2 4 1 2 3 2.94
NANetP DI Mean
-- - ° + ++
-- - ° + ++ NANetP DI Mean
NANetP DI Mean
-- - ° + ++
Jul 15 Oct 15
Decreased considerably 1 0Decreased somewhat 5 7Remained basically unchanged 88 90Increased somewhat 6 3Increased considerably 0 0Total 100Net percentage 1 -4Diffusion index 0 -2Mean 3.00 2.92Number of banks responding 133 133
Share of rejected applications

The euro area bank lending survey, October 2015 32
Question 6 Over the past three months (apart from normal seasonal fluctuations), how has the demand for loans or credit lines to enterprises changed at your bank? Please refer to the financing need of enterprises independent of whether this need will result in a loan or not.
(in percentages, unless otherwise stated)
Notes: The net percentage is defined as the difference between the sum of the percentages for “increased considerably” and “increased somewhat”, and the sum of the percentages for “decreased somewhat” and “decreased considerably”. The diffusion index is defined as the net percentage weighted according to the intensity of the response, giving lenders who have answered “considerably” a weight twice as high (score of 1) as lenders having answered “somewhat” (score of 0.5). The mean is calculated by attributing the values 1 to 5 to the first possible answer and consequently for the others.
Question 7 Over the past three months, how have the following factors affected the overall demand for loans or credit lines to enterprises?
(in percentages, unless otherwise stated)
NA = not available; NetP = net percentage; DI = diffusion index. Notes: The net percentage is defined as the difference between the sum of banks responding “+” (contributed somewhat to increasing demand) and “+ +” (contributed considerably to increasing demand) and the sum of banks responding “- ” (contributed somewhat to lowering demand) and “--” (contributed considerably to lowering demand). “°” means “contributed to basically unchanged demand”. The diffusion index is defined as the net percentage weighted according to the intensity of the response, giving lenders who have answered “considerably” a weight twice as high (score of 1) as lenders having answered “somewhat” (score of 0.5). The mean is calculated by attributing the values 1 to 5 to the first possible answer and consequently for the others.
Jul 15 Oct 15 Jul 15 Oct 15 Jul 15 Oct 15 Jul 15 Oct 15 Jul 15 Oct 15
Decreased considerably 0 0 0 1 0 0 0 0 0 1Decreased somewhat 10 10 8 8 12 10 7 12 6 7Remained basically unchanged 66 64 70 64 64 72 72 69 65 60Increased somewhat 23 26 21 26 23 18 19 19 27 32Increased considerably 1 0 1 1 0 0 1 0 1 0Total 100 100 100 100 100 100 100 100 100 100Net percentage 13 16 14 18 11 8 13 7 23 24Diffusion index 7 8 7 9 6 4 7 3 12 12Mean 3.12 3.11 3.15 3.11 3.09 3.03 3.12 3.02 3.22 3.18Number of banks responding 135 133 130 129 129 129 135 133 135 133
Long-term loansOverallLoans to small and
medium-sized enterprises
Loans to large enterprises Short-term loans
Jul 15 Oct 15 Jul 15 Oct 15 Jul 15 Oct 15
A) Financing needs/underlying drivers or purpose of loan demandFixed investment 1 9 62 20 1 7 11 11 6 5 3.12 3.07Inventories and working capital 0 7 67 19 0 8 10 12 5 6 3.10 3.08Mergers/acquisitions and corporate restructuring 0 3 75 14 1 7 11 12 6 6 3.09 3.09General level of interest rates 0 1 74 17 2 6 21 19 12 10 3.23 3.16Debt refinancing/restructuring and renegotiation 0 3 75 13 2 6 13 11 7 7 3.14 3.09B) Use of alternative financeInternal financing 0 4 87 3 0 6 -5 -1 -3 -1 2.94 2.94Loans from other banks 0 9 80 5 0 6 -3 -3 -1 -2 2.97 2.93Loans from non-banks 0 1 92 2 0 5 2 1 1 1 3.01 2.96Issuance/redemption of debt securities 0 4 87 0 0 10 -4 -4 -2 -2 2.95 2.91Issuance/redemption of equity 0 2 88 0 0 10 0 -2 0 -1 3.00 2.93
-- - ° + ++ NANetP DI Mean

The euro area bank lending survey, October 2015 33
Question 8 Please indicate how you expect your bank’s credit standards as applied to the approval of loans or credit lines to enterprises to change over the next three months. Please note that we are asking about the change in credit standards, rather than about their level.
(in percentages, unless otherwise stated)
Notes: The net percentage is defined as the difference between the sum of the percentages for “tighten considerably” and “tighten somewhat”, and the sum of the percentages for “ease somewhat” and “ease considerably”. The diffusion index is defined as the net percentage weighted according to the intensity of the response, giving lenders who have answered “considerably” a weight twice as high (score of 1) as lenders having answered “somewhat” (score of 0.5). The mean is calculated by attributing the values 1 to 5 to the first possible answer and consequently for the others.
Question 9 Please indicate how you expect demand for loans or credit lines to enterprises to change at your bank over the next three months (apart from normal seasonal fluctuations)? Please refer to the financing need of enterprises independent of whether this need will result in a loan or not.
(in percentages, unless otherwise stated)
Notes: The net percentage is defined as the difference between the sum of the percentages for “increase considerably” and “increase somewhat”, and the sum of the percentages for “decrease somewhat” and “decrease considerably”. The diffusion index is defined as the net percentage weighted according to the intensity of the response, giving lenders who have answered “considerably” a weight twice as high (score of 1) as lenders having answered “somewhat” (score of 0.5). The mean is calculated by attributing the values 1 to 5 to the first possible answer and consequently for the others.
Jul 15 Oct 15 Jul 15 Oct 15 Jul 15 Oct 15 Jul 15 Oct 15 Jul 15 Oct 15
Tighten considerably 0 0 0 0 0 0 0 0 0 0Tighten somewhat 2 2 2 1 2 3 2 2 2 3Remain basically unchanged 96 90 95 92 96 90 95 90 95 89Ease somewhat 2 8 3 7 2 7 3 8 3 8Ease considerably 0 0 0 0 0 0 0 0 0 0Total 100 100 100 100 100 100 100 100 100 100Net percentage 0 -6 -1 -7 0 -4 -1 -6 0 -5Diffusion index 0 -3 -1 -3 0 -2 0 -3 0 -2Mean 3.00 3.02 3.01 3.03 3.00 3.00 3.01 3.02 3.00 3.01Number of banks responding 136 135 131 131 130 130 136 135 136 135
Long-term loansOverallLoans to small and
medium-sized enterprises
Loans to large enterprises Short-term loans
Jul 15 Oct 15 Jul 15 Oct 15 Jul 15 Oct 15 Jul 15 Oct 15 Jul 15 Oct 15
Decrease considerably 0 0 0 0 0 0 0 0 0 1Decrease somewhat 3 2 3 1 3 1 3 1 3 1Remain basically unchanged 63 63 53 63 70 72 66 69 62 64Increase somewhat 34 35 44 36 28 27 32 30 35 34Increase considerably 0 0 0 0 0 0 0 0 0 0Total 100 100 100 100 100 100 100 100 100 100Net percentage 31 34 41 35 25 26 29 29 32 32Diffusion index 15 17 21 17 13 13 15 14 16 16Mean 3.30 3.26 3.40 3.26 3.25 3.21 3.28 3.21 3.34 3.24Number of banks responding 136 134 131 131 130 130 136 135 136 135
Short-term loansOverallLoans to small and
medium-sized enterprises
Loans to large enterprises Long-term loans

The euro area bank lending survey, October 2015 34
Loans to households
Question 10 Over the past three months, how have your bank’s credit standards as applied to the approval of loans to households changed? Please note that we are asking about the change in credit standards, rather than about their level.
(in percentages, unless otherwise stated)
Notes: The net percentage is defined as the difference between the sum of the percentages for “tightened considerably” and “tightened somewhat”, and the sum of the percentages for “eased somewhat” and “eased considerably”. The diffusion index is defined as the net percentage weighted according to the intensity of the response, giving lenders who have answered “considerably” a weight twice as high (score of 1) as lenders having answered “somewhat” (score of 0.5). The mean is calculated by attributing the values 1 to 5 to the first possible answer and consequently for the others.
Question 11 Over the past three months, how have the following factors affected your bank’s credit standards as applied to the approval of loans to households for house purchase?
(in percentages, unless otherwise stated)
NA = not available; NetP = net percentage; DI = diffusion index. Notes: The net percentage is defined as the difference between the sum of banks responding “- -” (contributed considerably to tightening) and “-” (contributed somewhat to tightening), and the sum of banks responding “+” (contributed somewhat to easing) and “+ +” (contributed considerably to easing). “°” means “contributed to basically unchanged credit standards”. The diffusion index is defined as the net percentage weighted according to the intensity of the response, giving lenders who have answered “considerably” a weight twice as high (score of 1) as lenders having answered “somewhat” (score of 0.5). The mean is calculated by attributing the values 1 to 5 to the first possible answer and consequently for the others.
Jul 15 Oct 15 Jul 15 Oct 15
Tightened considerably 0 0 0 1
Tightened somewhat 2 11 1 1
Remained basically unchanged 88 84 94 95
Eased somewhat 11 6 5 4Eased considerably 0 0 0 0Total 100 100 100 100Net percentage -9 5 -4 -3Diffusion index -4 2 -2 -1Mean 3.09 2.95 3.04 2.98Number of banks responding 130 130 132 132
Loans for house purchase
Consumer credit and other lending
Jul 15 Oct 15 Jul 15 Oct 15 Jul 15 Oct 15
A) Cost of funds and balance sheet constraintsCost of funds and balance sheet constraints 0 2 83 2 0 12 -2 0 -1 0 3.01 2.97B) Pressure from competitionCompetition from other banks 0 1 79 8 0 12 -9 -7 -5 -4 3.09 3.05Competition from non-banks 0 0 86 1 0 13 -2 0 -1 0 3.01 2.97C) Perception of riskGeneral economic situation and outlook 0 1 84 3 0 12 -2 -2 -1 -1 3.03 2.99Housing market prospects, including expected house price developments 0 1 87 0 0 12 1 0 0 0 2.99 2.96Borrower’s creditworthiness 0 0 85 2 0 12 0 -2 0 -1 3.00 2.99D) Your bank's risk toleranceYour bank's risk tolerance 0 1 92 1 0 6 -1 0 -1 0 3.01 2.97
NANetP DI Mean
-- - ° + ++

The euro area bank lending survey, October 2015 35
Question 12 Over the past three months, how have your bank’s terms and conditions for new loans to households for house purchase changed?
(in percentages, unless otherwise stated)
NA = not available; NetP = net percentage; DI = diffusion index. Notes: The net percentage is defined as the difference between the sum of banks responding “- -” (tightened considerably) and “-” (tightened somewhat), and the sum of banks responding “+” (eased somewhat) and “+ +” (eased considerably). “°” means “basically unchanged credit standards”. The diffusion index is defined as the net percentage weighted according to the intensity of the response, giving lenders who have answered “considerably” a weight twice as high (score of 1) as lenders having answered “somewhat” (score of 0.5). The mean is calculated by attributing the values 1 to 5 to the first possible answer and consequently for the others.
Question 13 Over the past three months, how have the following factors affected your bank’s credit terms and conditions as applied to new loans to households for house purchase?
(in percentages, unless otherwise stated)
NA = not available; NetP = net percentage; DI = diffusion index. Notes: The net percentage is defined as the difference between the sum of banks responding “- -” (contributed considerably to tightening) and “-” (contributed somewhat to tightening), and the sum of banks responding “+” (contributed somewhat to easing) and “+ +” (contributed considerably to easing). “°” means “contributed to basically unchanged credit standards”. The diffusion index is defined as the net percentage weighted according to the intensity of the response, giving lenders who have answered “considerably” a weight twice as high (score of 1) as lenders having answered “somewhat” (score of 0.5). The mean is calculated by attributing the values 1 to 5 to the first possible answer and consequently for the others.
Jul 15 Oct 15 Jul 15 Oct 15 Jul 15 Oct 15
A) Overall terms and conditionsOverall terms and conditions 0 4 86 5 0 6 -6 -1 -3 -1 3.06 2.98B) MarginsYour bank’s loan margin on average loans 0 6 66 23 0 6 -27 -17 -13 -8 3.28 3.15Your bank’s loan margin on riskier loans 0 3 88 3 0 6 0 0 0 0 3.00 2.94C) Other terms and conditionsCollateral requirements 0 1 93 0 0 6 0 1 0 1 3.00 2.95"Loan-to-value" ratio 0 1 85 2 0 12 -2 -1 -1 0 3.02 2.97Other loan size l imits 0 6 88 0 0 6 0 6 0 3 3.00 2.93Maturity 0 0 92 1 0 7 -1 0 -1 0 3.01 2.97Non-interest rate charges 0 0 93 0 0 7 -1 0 -1 0 3.01 2.96
-- - ° + ++ NANetP DI Mean
OVERALL IMPACT ON YOUR BANK'S CREDIT TERMS AND CONDITIONS
Jul 15 Oct 15 Jul 15 Oct 15 Jul 15 Oct 15
A) Cost of funds and balance sheet constraints Cost of funds and balance sheet constraints 0 3 86 5 0 6 -7 -2 -3 -1 3 2.99B) Pressure from competitionPressure from competition 0 0 77 17 0 6 -23 -17 -11 -8 3 3.14C) Perception of risk Perception of risk 0 1 91 2 0 6 -5 0 -2 0 3 2.97D) Your bank's risk tolerance Your bank's risk tolerance 0 0 94 0 0 6 0 0 0 0 3 2.96
IMPACT ON YOUR BANK'S MARGINS ON AVERAGE LOANS
Jul 15 Oct 15 Jul 15 Oct 15 Jul 15 Oct 15
A) Cost of funds and balance sheet constraints Cost of funds and balance sheet constraints 0 3 83 7 0 6 -8 -4 -4 -2 3 3.01B) Pressure from competitionPressure from competition 0 1 71 21 0 7 -24 -21 -12 -11 3 3.19C) Perception of risk Perception of risk 0 2 89 4 0 6 -6 -2 -3 -1 3 2.98D) Your bank's risk tolerance Your bank's risk tolerance 0 0 93 0 0 6 -3 0 -1 0 3 2.96
IMPACT ON YOUR BANK'S MARGINS ON RISKIER LOANS
Jul 15 Oct 15 Jul 15 Oct 15 Jul 15 Oct 15
A) Cost of funds and balance sheet constraints Cost of funds and balance sheet constraints 0 1 92 0 0 7 -1 1 0 1 3 2.94B) Pressure from competitionPressure from competition 0 0 92 1 0 7 -6 -1 -3 0 3 2.97C) Perception of risk Perception of risk 0 1 92 0 0 7 1 1 0 1 3 2.95D) Your bank's risk tolerance Your bank's risk tolerance 0 0 93 0 0 7 1 0 1 0 3 2.96
NANetP DI Mean
-- - ° + ++
NANetP DI Mean
-- - ° + ++ NANetP DI Mean
-- - ° + ++

The euro area bank lending survey, October 2015 36
Question 14 Over the past three months, how have the following factors affected your bank’s credit standards as applied to the approval of consumer credit and other lending to households?
(in percentages, unless otherwise stated)
NA = not available; NetP = net percentage; DI = diffusion index. Notes: The net percentage is defined as the difference between the sum of banks responding “- -” (contributed considerably to tightening) and “-” (contributed somewhat to tightening), and the sum of banks responding “+” (contributed somewhat to easing) and “+ +” (contributed considerably to easing). “°” means “contributed to basically unchanged credit standards”. The diffusion index is defined as the net percentage weighted according to the intensity of the response, giving lenders who have answered “considerably” a weight twice as high (score of 1) as lenders having answered “somewhat” (score of 0.5). The mean is calculated by attributing the values 1 to 5 to the first possible answer and consequently for the others.
Question 15 Over the past three months, how have your bank’s terms and conditions for new consumer credit and other lending to households changed?
(in percentages, unless otherwise stated)
NA = not available; NetP = net percentage; DI = diffusion index. Notes: The net percentage is defined as the difference between the sum of banks responding “- -” (tightened considerably) and “-” (tightened somewhat), and the sum of banks responding “+” (eased somewhat) and “+ +” (eased considerably). “°” means “basically unchanged credit standards”. The diffusion index is defined as the net percentage weighted according to the intensity of the response, giving lenders who have answered “considerably” a weight twice as high (score of 1) as lenders having answered “somewhat” (score of 0.5). The mean is calculated by attributing the values 1 to 5 to the first possible answer and consequently for the others.
Jul 15 Oct 15 Jul 15 Oct 15 Jul 15 Oct 15
A) Cost of funds and balance sheet constraintsCost of funds and balance sheet constraints 0 0 95 1 0 5 -3 -1 -1 0 3.03 2.97B) Pressure from competitionCompetition from other banks 0 0 90 6 0 5 -5 -6 -2 -3 3.05 3.02Competition from non-banks 0 0 92 0 0 8 -1 0 0 0 3.01 2.96C) Perception of riskGeneral economic situation and outlook 1 0 93 2 0 4 -3 -2 -2 -1 3.03 2.97Creditworthiness of consumers(1) 0 0 96 0 0 4 1 0 1 0 2.99 2.96Risk on the collateral demanded 0 0 92 0 0 8 0 0 0 0 2.99 2.95D) Your bank's risk tolerance Your bank's risk tolerance 0 0 95 0 0 4 0 0 0 0 3.00 2.96
-- - ° + ++ NANetP DI Mean
Jul 15 Oct 15 Jul 15 Oct 15 Jul 15 Oct 15
A) Overall terms and conditionsOverall terms and conditions 0 2 84 4 0 10 -7 -3 -4 -1 3.08 2.98B) MarginsYour bank’s loan margin on average loans 0 1 83 11 1 4 -24 -10 -12 -6 3.25 3.08Your bank’s loan margin on riskier loans 0 1 93 1 1 4 -4 0 -2 -1 3.05 2.97C) Other terms and conditionsCollateral requirements 0 0 87 0 0 13 -1 0 0 0 3.00 2.95Size of the loan 0 0 89 0 0 10 -1 0 0 0 3.01 2.96Maturity 0 0 90 0 0 10 0 0 0 0 3.00 2.96Non-interest rate charges 0 0 89 0 0 11 -1 0 -1 0 3.01 2.96
NANetP DI Mean
-- - ° + ++

The euro area bank lending survey, October 2015 37
Question 16 Over the past three months, how have the following factors affected your bank’s credit terms and conditions as applied to new consumer credit and other lending to households?
(in percentages, unless otherwise stated)
NA = not available; NetP = net percentage; DI = diffusion index. Notes: The net percentage is defined as the difference between the sum of banks responding “- -” (contributed considerably to tightening) and “-” (contributed somewhat to tightening), and the sum of banks responding “+” (contributed somewhat to easing) and “+ +” (contributed considerably to easing). “°” means “contributed to basically unchanged credit standards”. The diffusion index is defined as the net percentage weighted according to the intensity of the response, giving lenders who have answered “considerably” a weight twice as high (score of 1) as lenders having answered “somewhat” (score of 0.5). The mean is calculated by attributing the values 1 to 5 to the first possible answer and consequently for the others.
Question 17 Over the past three months (apart from normal seasonal fluctuations), has the share of household loan applications that were completely rejected by your bank increased, remained unchanged or decreased (loan volume, relative to the total volume of loan applications in that loan category)?
(in percentages, unless otherwise stated)
Notes: The net percentage is defined as the difference between the sum of the percentages for “increased considerably” and “increased somewhat”, and the sum of the percentages for “decreased somewhat” and “decreased considerably”. The diffusion index is defined as the net percentage weighted according to the intensity of the response, giving lenders who have answered “considerably” a weight twice as high (score of 1) as lenders having answered “somewhat” (score of 0.5). The mean is calculated by attributing the values 1 to 5 to the first possible answer and consequently for the others.
OVERALL IMPACT ON YOUR BANK'S CREDIT TERMS AND CONDITIONS
Jul 15 Oct 15 Jul 15 Oct 15 Jul 15 Oct 15
A) Cost of funds and balance sheet constraints Cost of funds and balance sheet constraints 0 1 86 3 0 10 -7 -2 -3 -1 3 2.98B) Pressure from competitionPressure from competition 0 0 80 9 0 11 -10 -9 -5 -5 3 3.06C) Perception of risk Perception of risk 0 1 88 0 0 10 -3 1 -1 0 3 2.95D) Your bank's risk tolerance Your bank's risk tolerance 0 0 89 0 0 10 1 0 1 0 3 2.96
IMPACT ON YOUR BANK'S MARGINS ON AVERAGE LOANS
Jul 15 Oct 15 Jul 15 Oct 15 Jul 15 Oct 15
A) Cost of funds and balance sheet constraints Cost of funds and balance sheet constraints 0 1 92 3 0 5 -6 -2 -3 -1 3 2.98B) Pressure from competitionPressure from competition 0 0 84 11 0 5 -15 -11 -8 -6 3 3.08C) Perception of risk Perception of risk 0 1 94 0 0 5 -4 1 -2 1 3 2.95D) Your bank's risk tolerance Your bank's risk tolerance 0 0 95 0 0 5 1 0 0 0 3 2.96
IMPACT ON YOUR BANK'S MARGINS ON RISKIER LOANS
Jul 15 Oct 15 Jul 15 Oct 15 Jul 15 Oct 15
A) Cost of funds and balance sheet constraints Cost of funds and balance sheet constraints 0 1 94 0 0 5 -1 1 -1 1 3 2.94B) Pressure from competitionPressure from competition 0 0 93 2 0 5 -6 -2 -3 -1 3 2.98C) Perception of risk Perception of risk 0 1 95 0 0 5 -1 1 -1 0 3 2.95D) Your bank's risk tolerance Your bank's risk tolerance 0 1 95 0 0 5 1 1 0 0 3 2.95
NANetP DI Mean
-- - ° + ++ NANetP DI Mean
-- - ° + ++
-- - ° + ++ NANetP DI Mean
Jul 15 Oct 15 Jul 15 Oct 15
Decreased considerably 0 0 0 0Decreased somewhat 5 8 3 6Remained basically unchanged 89 86 93 84Increased somewhat 6 5 4 10Increased considerably 0 0 0 0Total 100 100Net percentage 0 -3 1 4Diffusion index 0 -2 0 2Mean 3.00 2.92 3.01 3.00Number of banks responding 124 125 127 128
Loans for house purchase
Consumer credit and other lending

The euro area bank lending survey, October 2015 38
Question 18 Over the past three months (apart from normal seasonal fluctuations), how has the demand for loans to households changed at your bank? Please refer to the financing need of households independent of whether this need will result in a loan or not.
(in percentages, unless otherwise stated)
Notes: The net percentage is defined as the difference between the sum of the percentages for “increased considerably” and “increased somewhat”, and the sum of the percentages for “decreased somewhat” and “decreased considerably”. The diffusion index is defined as the net percentage weighted according to the intensity of the response, giving lenders who have answered “considerably” a weight twice as high (score of 1) as lenders having answered “somewhat” (score of 0.5). The mean is calculated by attributing the values 1 to 5 to the first possible answer and consequently for the others.
Question 19 Over the past three months, how have the following factors affected the demand for loans to households for house purchase?
(in percentages, unless otherwise stated)
NA = not available; NetP = net percentage; DI = diffusion index. Notes: The net percentage is defined as the difference between the sum of banks responding “+” (contributed somewhat to increasing demand) and “+ +” (contributed considerably to increasing demand) and the sum of banks responding “- ” (contributed somewhat to lowering demand) and “--” (contributed considerably to lowering demand). “°” means “contributed to basically unchanged demand”. The diffusion index is defined as the net percentage weighted according to the intensity of the response, giving lenders who have answered “considerably” a weight twice as high (score of 1) as lenders having answered “somewhat” (score of 0.5). The mean is calculated by attributing the values 1 to 5 to the first possible answer and consequently for the others.
Jul 15 Oct 15 Jul 15 Oct 15
Decreased considerably 0 1 0 1Decreased somewhat 5 6 1 5Remained basically unchanged 42 53 57 70Increased somewhat 49 33 40 23Increased considerably 4 7 2 2Total 100 100 100 100Net percentage 49 33 41 19Diffusion index 26 20 22 10Mean 3.53 3.33 3.43 3.15Number of banks responding 129 129 131 133
Loans for house purchase
Consumer credit and other lending
Jul 15 Oct 15 Jul 15 Oct 15 Jul 15 Oct 15
A) Financing needs/underlying drivers or purpose of loan demandHousing market prospects, including expected house price developments
0 1 55 31 1 12 25 31 13 16 3.25 3.28
Consumer confidence 1 3 61 29 0 6 20 26 10 13 3.19 3.21General level of interest rates 0 0 52 30 5 13 45 35 24 20 3.50 3.37Debt refinancing/restructuring and renegotiation
0 1 82 5 0 12 5 4 2 2 3.05 3.01
Regulatory and fiscal regime of housing markets 0 9 84 1 0 7 3 -8 2 -4 3.03 2.91
B) Use of alternative sources for housing finance
Internal finance of house purchase out of savings/down payment
0 3 90 1 0 6 -3 -2 -1 -1 2.97 2.94
Loans from other banks 0 2 80 5 0 13 2 3 1 2 3.01 2.99Other sources of external finance 0 0 91 2 0 7 2 2 1 1 3.01 2.97
++ NANetP DI Mean
-- - ° +

The euro area bank lending survey, October 2015 39
Question 20 Over the past three months, how have the following factors affected the demand for consumer credit and other lending to households?
(in percentages, unless otherwise stated)
NA = not available; NetP = net percentage; DI = diffusion index. Notes: The net percentage is defined as the difference between the sum of banks responding “+” (contributed somewhat to increasing demand) and “+ +” (contributed considerably to increasing demand) and the sum of banks responding “- ” (contributed somewhat to lowering demand) and “--” (contributed considerably to lowering demand). “°” means “contributed to basically unchanged demand”. The diffusion index is defined as the net percentage weighted according to the intensity of the response, giving lenders who have answered “considerably” a weight twice as high (score of 1) as lenders having answered “somewhat” (score of 0.5). The mean is calculated by attributing the values 1 to 5 to the first possible answer and consequently for the others.
Question 21 Please indicate how you expect your bank’s credit standards as applied to the approval of loans to households to change over the next three months. Please note that we are asking about the change in credit standards, rather than about their level.
(in percentages, unless otherwise stated)
Notes: The net percentage is defined as the difference between the sum of the percentages for “tighten considerably” and “tighten somewhat”, and the sum of the percentages for “ease somewhat” and “ease considerably”. The diffusion index is defined as the net percentage weighted according to the intensity of the response, giving lenders who have answered “considerably” a weight twice as high (score of 1) as lenders having answered “somewhat” (score of 0.5). The mean is calculated by attributing the values 1 to 5 to the first possible answer and consequently for the others.
Jul 15 Oct 15 Jul 15 Oct 15 Jul 15 Oct 15
A) Financing needs/underlying drivers or purpose of loan demandSpending on durable consumer goods 1 1 69 25 1 3 36 25 18 13 3.38 3.21Consumer confidence 1 3 68 26 0 3 19 23 9 11 3.19 3.18General level of interest rates 0 0 75 22 0 3 15 22 8 11 3.16 3.19Consumption expenditure financed through real-estate guaranteed loans
0 0 86 1 0 12 0 1 0 1 3.00 2.96
B) Use of alternative financeInternal finance out of savings 0 3 93 1 0 3 -1 -2 -1 -1 2.99 2.95Loans from other banks 0 2 95 0 0 3 1 -2 0 -1 3.01 2.94Other sources of external finance 0 3 93 0 0 4 0 -3 0 -2 3.00 2.93
++ NANetP DI Mean
-- - ° +
Jul 15 Oct 15 Jul 15 Oct 15
Tighten considerably 0 0 0 0
Tighten somewhat 9 3 2 1
Remain basically unchanged 88 95 91 95
Ease somewhat 2 1 7 3Ease considerably 0 1 0 0Total 100 100 100 100Net percentage 7 1 -5 -2Diffusion index 3 0 -3 -1Mean 2.96 2.96 3.05 2.98Number of banks responding 129 129 131 131
Loans for house purchase
Consumer credit and other lending

The euro area bank lending survey, October 2015 40
Question 22 Please indicate how you expect demand for loans to households to change over the next three months at your bank (apart from normal seasonal fluctuations). Please refer to the financing need of households independent of whether this need will result in a loan or not.
(in percentages, unless otherwise stated)
Notes: The net percentage is defined as the difference between the sum of the percentages for “increase considerably” and “increase somewhat”, and the sum of the percentages for “decrease somewhat” and “decrease considerably”. The diffusion index is defined as the net percentage weighted according to the intensity of the response, giving lenders who have answered “considerably” a weight twice as high (score of 1) as lenders having answered “somewhat” (score of 0.5). The mean is calculated by attributing the values 1 to 5 to the first possible answer and consequently for the others.
Jul 15 Oct 15 Jul 15 Oct 15
Decrease considerably 0 0 0 0
Decrease somewhat 5 4 3 3
Remain basically unchanged 62 68 72 67
Increase somewhat 32 27 25 29Increase considerably 0 0 0 0Total 100 100 100 100Net percentage 27 23 21 26Diffusion index 13 12 11 13Mean 3.26 3.19 3.21 3.19Number of banks responding 129 129 132 131
Loans for house purchase
Consumer credit and other lending

The euro area bank lending survey, October 2015 41
Annex 2 Results for the ad hoc questions
Question A1 As a result of the situation in financial markets(1), has your market access changed when tapping your usual sources of wholesale and retail funding and/or has your ability to transfer risk changed over the past three months, or are you expecting this access/activity to change over the next three months?1
(in percentages unless otherwise stated)
(1) Please also take into account any effect of state guarantees vis-à-vis debt securities and recapitalisation support. (2) Please select "N/A" (not applicable) if and only if the source of funding is not relevant for your bank. (3) Usually involves on-balance sheet funding. (4) Usually involves the sale of loans from banks’ balance sheets, i.e. off-balance sheet funding (5) Usually involves the use of credit derivatives, with the loans remaining on banks’ balance sheets. Notes: “- -“ = deteriorated considerably/will deteriorate considerably; “-“ = deteriorated somewhat/will deteriorate somewhat; “o”= remained unchanged/will remain unchanged; “+” = eased somewhat/will ease somewhat; “++” = eased considerably/will ease considerably. The mean and standard deviation are calculated by attributing the values 1 to 5 to the first possible answer and consequently for the others. Figures may not exactly sum up due to rounding.
-- - ○ + + + NetP Mean Standard deviation
-- - ○ + + + NetP Mean Standard deviation
Short-term deposits (up to one year) 2 3 85 10 1 -6 3.02 0.51 1 2 89 7 1 -5 3.02 0.44 5Long-term (more than one year) deposits and other retail funding instruments
2 11 84 4 0 9 2.86 0.49 1 7 89 3 0 5 2.91 0.40 5
Very short-term money market (up to 1 w eek) 2 3 81 13 1 -10 3.06 0.57 1 1 90 7 1 -8 3.05 0.45 5Short-term money market (more than 1 w eek) 2 3 85 10 0 -6 3.00 0.49 1 1 89 10 0 -9 3.04 0.40 5
Short-term debt securities (e.g. certif icates of deposit or commercial paper)
1 4 85 10 0 -4 2.99 0.50 0 4 84 12 0 -8 3.04 0.45 17
Medium to long term debt securities (incl. covered bonds) 1 10 73 16 0 -5 3.00 0.60 0 11 76 12 1 -2 3.00 0.55 8
Securitisation of corporate loans 4 3 83 9 0 -1 2.92 0.63 1 1 88 10 0 -9 3.04 0.47 46Securitisation of loans for house purchase 7 6 67 20 0 -7 2.96 0.86 1 1 77 21 0 -20 3.16 0.52 45
Ability to transfer credit risk off balance sheet 1 4 94 0 0 6 2.88 0.39 0 1 97 2 0 0 2.96 0.28 57
N/A(2)Over the past three months Over the next three months
A) Retail funding
B) Inter-bank unsecured money market
C) Wholesale debt securities(3)
D) Securitisation(4)
E) Ability to transfer credit risk off balance sheet(5)
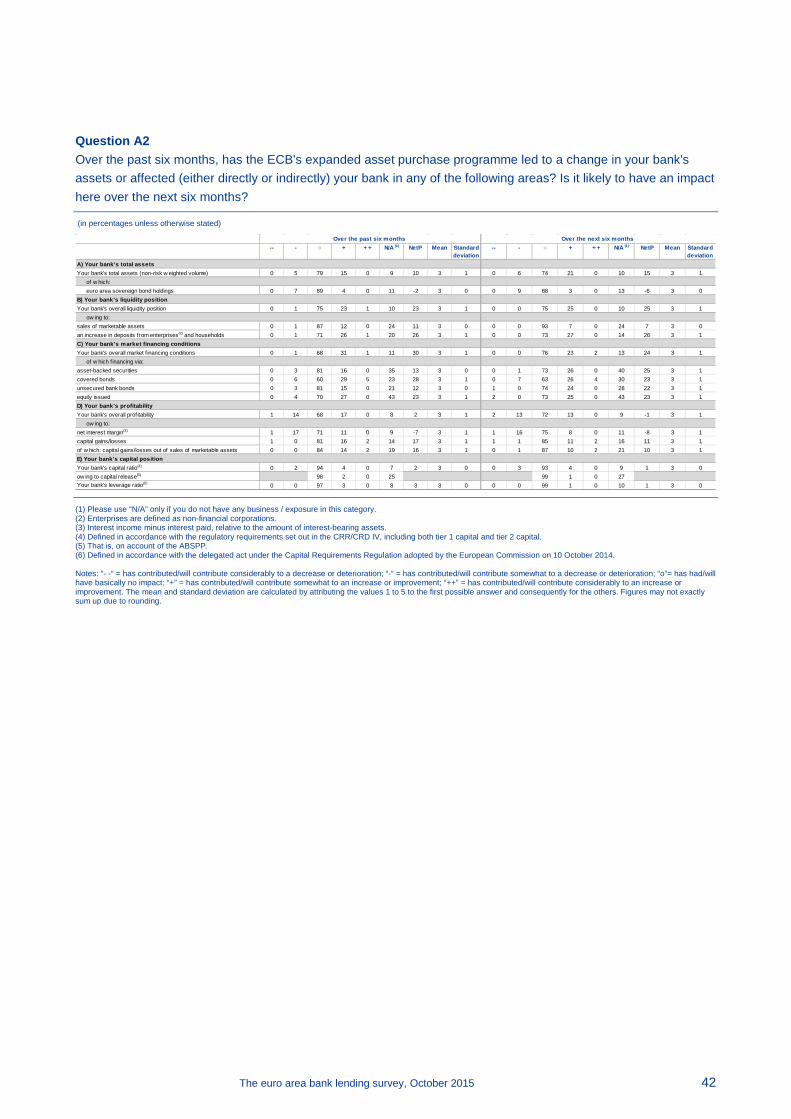
The euro area bank lending survey, October 2015 42
Question A2 Over the past six months, has the ECB's expanded asset purchase programme led to a change in your bank's assets or affected (either directly or indirectly) your bank in any of the following areas? Is it likely to have an impact here over the next six months?
(in percentages unless otherwise stated)
(1) Please use “N/A” only if you do not have any business / exposure in this category. (2) Enterprises are defined as non-financial corporations. (3) Interest income minus interest paid, relative to the amount of interest-bearing assets. (4) Defined in accordance with the regulatory requirements set out in the CRR/CRD IV, including both tier 1 capital and tier 2 capital. (5) That is, on account of the ABSPP. (6) Defined in accordance with the delegated act under the Capital Requirements Regulation adopted by the European Commission on 10 October 2014. Notes: “- -“ = has contributed/will contribute considerably to a decrease or deterioration; “-“ = has contributed/will contribute somewhat to a decrease or deterioration; “o”= has had/will have basically no impact; “+” = has contributed/will contribute somewhat to an increase or improvement; “++” = has contributed/will contribute considerably to an increase or improvement. The mean and standard deviation are calculated by attributing the values 1 to 5 to the first possible answer and consequently for the others. Figures may not exactly sum up due to rounding.
-- - ○ + + + N/A (1) NetP Mean Standard deviation
-- - ○ + + + N/A (1) NetP Mean Standard deviation
Your bank's total assets (non-risk w eighted volume) 0 5 79 15 0 9 10 3 1 0 6 74 21 0 10 15 3 1
euro area sovereign bond holdings 0 7 89 4 0 11 -2 3 0 0 9 88 3 0 13 -6 3 0
Your bank's overall liquidity position 0 1 75 23 1 10 23 3 1 0 0 75 25 0 10 25 3 1
sales of marketable assets 0 1 87 12 0 24 11 3 0 0 0 93 7 0 24 7 3 0an increase in deposits from enterprises(2) and households 0 1 71 26 1 20 26 3 1 0 0 73 27 0 14 26 3 1
Your bank's overall market f inancing conditions 0 1 68 31 1 11 30 3 1 0 0 76 23 2 13 24 3 1
asset-backed securities 0 3 81 16 0 35 13 3 0 0 1 73 26 0 40 25 3 1covered bonds 0 6 60 29 5 23 28 3 1 0 7 63 26 4 30 23 3 1unsecured bank bonds 0 3 81 15 0 21 12 3 0 1 0 74 24 0 28 22 3 1equity issued 0 4 70 27 0 43 23 3 1 2 0 73 25 0 43 23 3 1
Your bank's overall profitability 1 14 68 17 0 8 2 3 1 2 13 72 13 0 9 -1 3 1
net interest margin(3) 1 17 71 11 0 9 -7 3 1 1 16 75 8 0 11 -8 3 1capital gains/losses 1 0 81 16 2 14 17 3 1 1 1 85 11 2 16 11 3 1of w hich: capital gains/losses out of sales of marketable assets 0 0 84 14 2 19 16 3 1 0 1 87 10 2 21 10 3 1
Your bank's capital ratio(4) 0 2 94 4 0 7 2 3 0 0 3 93 4 0 9 1 3 0ow ing to capital release(5) 98 2 0 25 99 1 0 27Your bank's leverage ratio(6) 0 0 97 3 0 8 3 3 0 0 0 99 1 0 10 1 3 0
E) Your bank's capital position
of w hich f inancing via:
D) Your bank's profitability
ow ing to:
B) Your bank's liquidity position
ow ing to:
C) Your bank's market financing conditions
A) Your bank's total assets
of w hich:
Over the past six months Over the next six months

The euro area bank lending survey, October 2015 43
Question A3 Over the past six months, for what purposes has your bank used the additional liquidity arising from the ECB's expanded asset purchase programme? And for what purposes will such liquidity be used over the next six months?
(in percentages unless otherwise stated)
(1) Please use “N/A” only if you do not have any business / exposure in this category or if you did not have any additional liquidity. (2) Enterprises are defined as non-financial corporations.
Question A4 Over the past six months, how has the ECB's expanded asset purchase programme affected your bank's lending behaviour? And what will be its impact on lending behaviour over the next six months?
(in percentages unless otherwise stated)
(1) Please use “N/A” only if you do not have any business / exposure in this category. Notes: “- -“ = has contributed/will contribute considerably to tightening credit standards/terms and conditions; “-“ = has contributed/will contribute somewhat to tightening credit standards/terms and conditions; “o”= has had/will have basically no impact on credit standards/terms and conditions; “+” = has contributed/will contribute somewhat to easing credit standards/terms and conditions; “++” = has contributed/will contribute considerably to easing credit standards/terms and conditions. The mean and standard deviation are calculated by attributing the values 1 to 5 to the first possible answer and consequently for the others. Figures may not exactly sum up due to rounding.
Has contributed
considerably to this
purpose
Has contributed somewhat
to this purpose
Has had basically no
impact
N/A 1) Mean Standard deviation
Will contribute
considerably to this
purpose
Will contribute somewhat
to this purpose
Will basically have no impact
N/A 1) Mean Standard deviation
For substituting deposit shortfalls 13 1 86 60 3.19 0.78 13 6 81 50 3.25 0.80
For substituting maturing debt 13 9 79 60 3.27 0.81 13 5 82 51 3.24 0.80
For substituting interbank lending 0 6 94 60 2.99 0.44 0 4 95 51 2.98 0.41
For substituting Eurosystem liquidity operations 4 4 92 60 3.05 0.58 2 7 91 50 3.04 0.53
Loans to non-financial corporations 6 33 61 53 3.37 0.76 6 35 58 46 3.40 0.77
Loans to households for house purchase 0 14 86 55 3.06 0.50 0 15 85 45 3.07 0.51
Consumer credit and other lending to households 0 36 64 53 3.30 0.61 0 37 63 45 3.31 0.61
Euro area marketable assets, excluding sovereign bonds 0 23 77 55 3.19 0.54 0 21 79 46 3.17 0.52
Non-euro area marketable assets 0 19 80 55 3.12 0.54 0 19 81 55 3.11 0.53
For substituting maturing debt 1 15 83 44 3.11 0.58 2 16 82 34 3.12 0.61
For substituting interbank lending 1 14 84 44 3.09 0.56 1 11 89 35 3.04 0.50
For substituting Eurosystem liquidity operations 0 15 85 46 3.08 0.52 0 13 87 37 3.05 0.50
Loans to non-financial corporations 3 22 75 43 3.20 0.65 2 27 71 32 3.24 0.66
Loans to households for house purchase 0 22 78 45 3.18 0.53 0 26 74 34 3.22 0.55
Consumer credit and other lending to households 0 22 78 45 3.18 0.53 0 26 74 34 3.22 0.56
Euro area marketable assets, excluding sovereign bonds 0 14 86 46 3.10 0.47 0 15 85 37 3.11 0.48
Non-euro area marketable assets 0 9 91 47 3.02 0.46 0 9 91 38 3.02 0.46
Over the past six months Over the next six months
A) Increased liquidity resulting from your bank's sales of marketable assets
For refinancing:
For granting loans:
For purchasing assets:
B) Increased liquidity owing to an increase in customer deposits from enterprises(2) and households
For refinancing:
For granting loans:
For purchasing assets:
-- - ○ + + + N/A (1) NetP Mean Standard deviation
-- - ○ + + + N/A (1) NetP Mean Standard deviation
For loans to enterprises 1 0 94 5 0 11 -4 3 0 1 0 96 3 0 13 -2 3 0For loans to households for house purchase 1 0 97 2 0 15 -2 3 0 1 0 99 0 0 17 0 3 0For consumer credit and other lending to households 1 0 98 2 0 13 -1 3 0 1 0 99 0 0 16 0 3 0
For loans to enterprises 0 0 71 29 1 11 -29 3 1 0 0 75 24 1 13 -25 3 1For loans to households for house purchase 0 0 87 13 0 15 -13 3 0 0 0 90 10 0 17 -10 3 0For consumer credit and other lending to households 0 0 78 21 1 13 -22 3 0 0 0 82 17 1 15 -18 3 0
Over the past six months
A) Credit standards
B) Terms and conditions
Over the next six months

The euro area bank lending survey, October 2015 44
Glossary
To assist respondent banks in filling out the questionnaire, this glossary defines the most important terminology used in the bank lending survey. This glossary has been revised together with the introduction of the enhanced bank lending survey questionnaire in April 2015.
Capital Defined in accordance with the regulatory requirements set out in the CRR/CRD IV, which transposes the global standards on bank capital (i.e. the Basel III agreement) into the EU legal framework and entered into force on 1 January 2014. It includes both tier 1 capital and tier 2 capital (supplementary capital).
Collateral The security given by a borrower to a lender as a pledge for the repayment of a loan. This could include certain financial securities, such as equity or debt securities, real estate or compensating balances. A compensating balance is the minimum amount of a loan that the borrower is required to keep in an account at the bank.
Consumer confidence Consumers’ assessments of economic and financial trends in a particular country and/or in the euro area. They include assessments of the past and current financial situation of households and resulting (income) prospects for the future, assessments of the past and current general political and economic situation and resulting prospects for the future and assessments of the advisability of making residential investments (question 19), particularly in terms of affordability, and/or major purchases of durable consumer goods (question 20). In this sense, an increase in consumer confidence would tend to lead to an increase in the demand for loans.
Consumer credit and other lending Consumer credit is defined as loans granted for mainly personal consumption of goods and services. Typical examples of loans in this category are loans granted for the financing of motor vehicles, furniture, domestic appliances and other consumer durables, holiday travel, etc. Overdrafts and credit card loans also typically belong in this category. "Consumer credit and other lending" to households also includes loans to sole proprietors and partnerships (see 16. Households). Loans included in this category may or may not be collateralised by various forms of security or guarantee.
Consumption expenditure financed through real-estate guaranteed loans “Consumption expenditure financed through real-estate guaranteed loans” should be treated as consumer credit, even though such loans are guaranteed by real estate assets, as the purpose of these loans is consumption. Consumption expenditure financed through real-estate guaranteed loans represents mortgage equity withdrawal, leading to higher non-housing related consumption.
Cost of funds and balance sheet constraints The bank’s capital and the cost related to the bank’s capital position can become a
The euro area bank lending survey, October 2015 45
balance sheet constraint that may inhibit the expansion of its lending. For a given level of capital, the bank’s loan supply could be affected by its liquidity position and its access to money and debt markets. Similarly, a bank could abstain from granting a loan, or be less willing to lend, if it knows that it will not be able subsequently to transfer the risk (synthetic securitisation) or the entire asset (true-sale securitisation) off its balance sheet. Moreover, risks related to non-performing loans may be reflected not only in the bank's risk perceptions, but also in its cost of funds and balance sheet constraints.
Covenant A covenant is an agreement or stipulation expressed in loan contracts, particularly contracts with enterprises, by which the borrower pledges to take certain action (an affirmative covenant) or refrain from taking certain action (a negative covenant), and is consequently part of the terms and conditions of a loan.
Credit line A credit line is a facility with a stated maximum amount which an enterprise is entitled to borrow from a bank at any given time. In the survey, a broad definition of credit lines should be applied, in which the information on the demand for new credit lines, and also on the use of credit lines previously granted, but not yet used, would be taken into account in assessing developments of loan demand.
Credit standards Credit standards are the internal guidelines or loan approval criteria of a bank. They are established prior to the actual loan negotiation on the terms and conditions and the actual loan approval/rejection decision. They define the types of loan a bank considers desirable and undesirable, the designated sectoral or geographic priorities, the collateral deemed acceptable and unacceptable, etc. Credit standards specify the required borrower characteristics (e.g. balance sheet conditions, income situation, age, employment status) under which a loan can be obtained. In the survey, both changes in written loan policies and their application should be considered. Credit standards may change owing to changes in the bank’s cost of funds and balance sheet situation, changes in competition, changes in the bank’s risk perception, changes in the bank’s risk tolerance or regulatory changes, for instance.
Credit terms and conditions Credit terms and conditions refer to the conditions of a loan that a bank is willing to grant, i.e. to the terms and conditions of the loan actually approved as laid down in the loan contract which was agreed between the bank (the lender) and the borrower. They generally consist of the agreed spread over the relevant reference rate, the size of the loan, the access conditions and other terms and conditions in the form of non-interest rate charges (i.e. fees), collateral or guarantees which the respective borrower needs to provide (including compensating balances), loan covenants and the agreed loan maturity. Credit terms and conditions are conditional on the borrower’s characteristics and may change in parallel with credit standards or independently of them. For instance, an increase in the bank’s funding cost or a deterioration in the general economic outlook can lead to both a tightening in the approval criteria (credit standards) and a tightening of the terms and conditions on those loans that the bank is willing to approve and its customers are willing to accept.

The euro area bank lending survey, October 2015 46
Alternatively, the bank may only change its credit terms and conditions (e.g. increasing the required spread to compensate for the additional cost/risk) and leave credit standards unchanged.
Debt refinancing/restructuring and renegotiation “Debt refinancing/restructuring and renegotiation” as a factor for loan demand refers to loan refinancing, loan restructuring and/or loan renegotiations that lead to an increase or prolongation of the amount borrowed. This includes the use of debt restructuring to avoid defaulting on existing debt (the avoidance of default being interpreted as an increase in demand), for instance via extending the maturity of the loan to avoid possible payment difficulties at maturity. At the same time, for assessing changes in loan demand, it should not include loan refinancing, restructuring and/or loan renegotiations which lead only to a change in the terms and conditions of the loan other than the loan size or the maturity of the loan.
Debt restructuring should not be interpreted as the switching between different types of debt (such as loans from monetary financial institutions (MFIs) and debt securities; this is already captured under the factor "Issuance/redemption of debt securities”), capital restructuring (substitution between debt and equity) or share buy-backs (already captured under the factor “Issuance/redemption of equity”). Meanwhile, debt restructuring in the form of inter-company loans is already covered by the factor “Loans from non-banks”.
Demand for loans Loan demand refers to gross demand for loans from enterprises or households, including loan rollovers, but apart from normal seasonal fluctuations. It refers to the bank loan financing need of enterprises and households, independent of whether this need will result in a loan or not. Banks should assess the evolution of the bank loan financing need of enterprises and households in nominal terms (i.e. independent of price-level developments) and with reference to the financing need prevailing in the previous quarter (i.e. banks should not assess the evolution of financing needs relative to historical averages or other reference values such as sales targets). Demand for loans can change either due to a shift of the demand curve (while the price remains constant) or due to a movement along the demand curve (i.e. because of a change in the price).
Down payment The down payment captures the share of internal finance in a household’s real estate investment, i.e. the share financed via the household’s own funds, and is thus one factor determining the demand for loans to households for house purchase. The higher the household’s internal finance out of its wealth, the higher the down payment and the smaller the household’s demand for loans for house purchase.
Diffusion index The diffusion index is defined as the difference between the weighted sum of the percentages of banks responding “tightened considerably” and “tightened somewhat”, and the weighted sum of the percentages of banks responding “eased considerably” and “eased somewhat”. Regarding demand for loans, the diffusion index is defined as the difference between the weighted sum of the percentages of

The euro area bank lending survey, October 2015 47
banks responding “increased considerably” and “increased somewhat”, and the weighted sum of the percentages of banks responding “decreased considerably” and “decreased somewhat”. The diffusion index is weighted according to the intensity of the response, giving lenders who have answered “considerably” a weight twice as high (score of 1) as lenders having answered “somewhat” (score of 0.5).
Enterprises In this context, enterprises are non-financial corporations, i.e., in line with the Eurostat definition, institutional units whose distributive and financial transactions are distinct from those of their owners and which are market producers, whose principal activity is the production of goods and non-financial services. These can be public and private corporations, as well as quasi-corporations. Quasi-corporations have no independent legal status, but keep a complete set of accounts and have an economic and financial behaviour that is different from that of their owners and similar to that of corporations. Sole proprietorships and partnerships are included in the household sector (see 16. Households).
Enterprise size The distinction between large and small and medium-sized enterprises is based on annual net turnover. A firm is considered large if its annual net turnover is more than €50 million.
Households In line with the Eurostat definition, households are individuals or groups of individuals acting as consumers and possibly also as entrepreneurs producing market goods and non-financial and financial services (market producers) provided that, in the latter case, the corresponding activities are not those of separate entities treated as quasi-corporations (i.e. sole proprietorships and partnerships). Non-profit institutions serving households are included in the household sector.
Housing market prospects, including expected house price developments In question 11, “housing market prospects, including expected house price developments” refers to the risk related to the collateral demanded. In question 19, it refers to expected developments in the housing market, including an increase (decrease) in demand for housing loans owing to an expected increase (decrease) in the cost of buying a house and/or in the perceived returns from investing in property.
Loans The loans covered by the bank lending survey are those granted to euro area residents by domestic branches, including loans or credit lines to enterprises, loans to households for house purchase, and consumer credit and other lending to households.
The definition of loans is that given in Regulation (EU) No 1071/2013 of the ECB of 24 September 2013 concerning the balance sheet of the monetary financial institutions sector (recast) (ECB/2013/33). However, interbank loans should be excluded. Following this definition, financial (but not operating) leases granted by an MFI are to be recorded as loans. For the purposes of the survey, factoring, if

The euro area bank lending survey, October 2015 48
provided by an MFI, should also be treated as a loan. Financial leasing and factoring offered by institutions other than MFIs should not be included.
Loan application Ideally, loan applications should cover formal loan applications as well as any informal loan requests which have not yet reached the stage of a formal loan application. If information on informal loan requests cannot be obtained, the bank's response should at least refer to all formal loan applications. It should be referred to the volume of loan applications. Loan applications can be from both new and existing bank clients. However, applications from existing clients should be included only if the volume of an ongoing loan increases or a new loan is granted.
Loan rejection "Loan rejection" refers to the rejection (as opposed to the approval) of the volume of formal loan applications or of loan requests. If information on the latter is unavailable, the bank's response should at least refer to all formal loan applications which have been rejected. It should be referred to the volume of loan rejections relative to the volume of loan applications/requests. Loan rejections do not include cases in which the borrower withdraws a loan application/request because the bank's conditions are considered unfavourable.
Loan margin/spread over a relevant market reference rate The loan margin of a bank should be understood as the spread over a relevant market reference rate (e.g. EURIBOR, LIBOR or the interest rate swap of a corresponding maturity for fixed rate loans), depending on the characteristics of the loan. Such a spread would capture changes in the bank’s lending rates related to changes in the bank’s funding cost as well as in borrower risk, i.e. changes in the bank’s lending rates which are not related to variations of market rates (like EURIBOR or LIBOR). In detail, the spread would capture changes in the bank’s risk premium in its own market-based funding cost (e.g. in bank bond yields), changes in the bank’s deposit funding cost, changes in the bank’s risk assessment of borrowers, as well as changes in any other add-on factor not related to variations of market rates.
Loan-to-value ratio The ratio of the amount borrowed to the appraisal or market value of the underlying collateral, usually taken into consideration in relation to loans used for real estate financing.
Marketing campaigns Marketing campaigns should be interpreted as a factor affecting loan supply only when credit standards or credit conditions change. If this is not the case, marketing campaigns may be understood as a factor with a possible impact on loan demand. In this instance, respondents should indicate the role of marketing campaigns under “Other factors” in questions 7, 19 and 20 on the factors affecting loan demand.
Maturity The concept of maturity used in questions 1, 6, 8 and 9 of the bank lending survey is original maturity, and only two different types are used, i.e. short-term and long-term.

The euro area bank lending survey, October 2015 49
Short-term loans are loans with an original maturity of one year or less and, consequently, long-term loans are loans that have an original maturity of more than one year.
Net percentage (or balance) In the context of credit standards, the net percentage is defined as the difference between the sum of the percentages of banks responding “tightened considerably” and “tightened somewhat”, and the sum of the percentages of banks responding “eased considerably” and “eased somewhat”. Regarding demand for loans, the net percentage is defined as the difference between the sum of the percentages of banks responding “increased considerably” and “increased somewhat”, and the sum of the percentages of banks responding “decreased considerably” and “decreased somewhat”.
Non-banks In general, these are non-monetary financial corporations. More specifically, they include insurance corporations and pension funds, financial auxiliaries and other financial intermediaries.
Non-interest rate charges These are various kinds of fees which can be part of the pricing of a loan, such as commitment fees on revolving loans, administration fees (e.g. document preparation costs) and charges for enquiries, guarantees and credit insurance.
Perception of risk and risk tolerance Perception of risk refers to the bank's perception of actual risk and its reaction to developments related to the general economic situation and outlook, the industry or firm-specific situation and outlook, the borrower's creditworthiness, as well as the collateral demanded (demand-side factors). By contrast, risk tolerance refers to the risk tolerance of the bank in its lending policy, which may alter due to changes in the bank's underlying business strategy (supply-side factors). Banks' perception of actual risk and their risk tolerance may either change in line with each other or move in different directions.
© European Central Bank, 2015
Postal address 60640 Frankfurt am Main, Germany Telephone +49 69 1344 0 Website www.ecb.europa.eu
All rights reserved. Reproduction for educational and non-commercial purposes is permitted provided that the source is acknowledged.
ISSN 1830-5989 (online) EU catalogue No QB-BA-15-003-EN-N (online)