results 2002 - annual report
TRANSCRIPT

Results 2002Annual Report

Deutsche BankThe Group at a glance
2002 2001
Share price high ¤ 82.65 ¤ 105.64
Share price low ¤ 35.60 ¤ 43.20
Dividend per share (proposed for 2002) ¤ 1.30 ¤ 1.30
Basic earnings per share ¤ 0.64 ¤ 0.27
Modified basic earnings per share1 ¤ 5.16 ¤ 3.51
Return on average total shareholders’ equity (RoE)2 1.1% 2.3%
Adjusted return on average active shareholders’ equity1, 3 10.2% 7.1%
Cost/income ratio4 78.8% 87.6%
¤ m. ¤ m.
Total revenues 26,547 29,541
Provision for loan losses 2,091 1,024
Total noninterest expenses 20,907 26,714
Income before income tax expense (benefit)
and cumulative effect of accounting changes 3,549 1,803
Net income 397 167
Dec 31, 2002 Dec 31, 2001
¤ m. ¤ m.
Total assets 758,355 918,222
Loans (before allowance for loan losses) 171,620 265,423
Shareholders’ equity 29,991 40,193
BIS core capital ratio 9.6% 8.1%
Number Number
Branches 1,711 2,099
thereof in Germany 936 1,254
Employees (full-time equivalent) 77,442 86,524
thereof in Germany 33,807 41,191
Long-term rating
Moody’s Investors Service, New York Aa3 Aa3
Standard & Poor’s, New York AA– AA
Fitch Ratings, New York AA– AA
1 Net income used for this calculation is adjusted for the income tax expense from the change in effective tax rate and the reversing effect,
for the effect of accounting changes, and in 2001, adjusted for the amortization of goodwill and other intangible assets.2 Net income in 2001 is adjusted for amortization of goodwill and other intangible assets.3 We calculate this adjusted measure of our return on average total shareholders’ equity to make it easier to compare us to our competitors. We
refer to this adjusted measure as our “average active equity”. However, this is not a measure of performance under U.S. GAAP and you should
not compare our ratio to other companies’ ratios without considering the differences in calculation of the ratios. The principal items for which
we adjust our ratio are the aggregate unrealized gains and losses in our portfolio of shareholdings in publicly-listed industrial companies and the
related tax effect. We include realized gains and losses and the related tax effect in “average active equity” from the time the shareholdings are
sold and the related gains are employed by our businesses. In addition we adjust our average total shareholders’equity for the effect of our
paying a dividend once a year following its approval by the general shareholders’ meeting.4 Total noninterest expenses (excluding amortization of goodwill and other intangible assets in 2001) as a percentage of net interest revenues
before provision for loan losses plus noninterest revenues (excluding amortization of negative goodwill in 2001).

2 Our identity3 Leading to results –
Spokesman’s letter8 Group Executive Committee
10 Corporate profile15 Corporate governance –
a part of our identity19 Creating value for our partners
Shareholders 25 Deutsche Bank shares follow the downwardtrend of the German stock market
Customers 31 Corporate and Investment Bank37 Private Clients and Asset Management43 Corporate Investments46 DB Services47 Corporate Center
Staff 49 Responsibility as a global employer
Society 53 Commitment to society
Management Discussion, 57 ContentConsolidated Financial Statements
and Risk Report
Confirmations and 245 Statement by the Board of Managing DirectorsManagement Bodies 246 Report of the Supervisory Board
250 Supervisory Board251 Advisory Board252 Board of Managing Directors
Supplementary Information 253 Group Five-Year Record254 Declaration of Backing255 Glossary261 Impressum/Publications
Deutsche Bank Group
Stakeholders
Consolidated Financial Statements
Further Information

2
Our identityA clear mission
Deutsche Bank aspires to be a leading global provider of integrated
financial solutions for demanding clients and the pre-eminent bank in
Germany generating exceptional value for its shareholders and people.
Customer focus. We place customers at the center of our activities and
they drive all that we do.
Teamwork. We benefit from the diversity of our people and our business
by working together to achieve success.
Innovation. We are constantly challenging conventional wisdom and
developing new solutions to meet customer requirements.
Performance. We are committed to a result oriented culture.
Trust. We behave reliably, fairly and honestly.

The year 2002 confronted Deutsche Bank Group – and the entire financial
industry – with enormous challenges. The extremely difficult world
economic environment burdened the capital markets. A series of financial
scandals shook investor confidence. Additionally, the threat of terrorist
attacks and possible military action spread uncertainty. Against this back-
drop the lending environment continued to get worse.
Despite these adverse conditions, Deutsche Bank’s earning power
proved robust. For 2002 your company reports income before income tax
expense of ¤ 3.5 billion (previous year: ¤1.8 billion). Allowing for special
effects – in particular gains from divestments and write-downs of our
industrial shareholdings – our income before income tax expense was
¤1.9 billion. This almost matched the previous year’s figure of ¤ 2.2 billion.
The world economic situation led to great caution among our institutional
and private clients, which depressed revenues despite market share
increases in many business segments. This was more than compensated
for, however, by cost savings. The substantially higher provision for loan
losses, which required ¤ 2.1billion last year, led to the slightly lower overall
result.
We used the financial year ended to strengthen and transform the bank,
thereby laying important foundations for our ongoing business success.
We agreed four strategic initiatives in the spring of last year. We set
out to turn the bank into a focused and cost-efficient organization with
substantially lower risk-weighted positions. In this process, however, we
maintained our entire product range and distribution platform. We also
upheld our global presence in full.
In the meantime we have consistently worked through the package of
measures we announced and have already exceeded our targets at an early
stage. We have reduced costs strongly, focused on our core businesses
and divested industrial shareholdings. We have improved the quality of
our balance sheet and strengthened our core capital. All this is paying
off in the current difficult market conditions. The result is a leaner
Deutsche Bank which, in terms of economic efficiency and adaptability,
bears little resemblance to the Deutsche Bank of one year ago.
3The Group
Leading to resultsSpokesman’s letter

We achieved this by re-engineering many processes, divesting non-core
activities, outsourcing service functions, and with other measures to
improve efficiency in the Corporate Divisions. This led to substantial job
cuts and a permanent reduction of our fixed cost base. We also took
additional measures that will lead to further cost savings in future.
We completed our divestment program for non-core activities at the
beginning of 2003. For example, we sold Deutscher Herold and other
insurance activities in the course of the Scudder acquisition. We also
shed our asset finance activities in North America, our global custody
business, passive asset management and, at the beginning of this year,
a large part of our private equity portfolio. Eurohypo was transferred to a
new joint enterprise with the mortgage bank subsidiaries of Dresdner
Bank and Commerzbank.
During the reporting year, we accelerated the sale of industrial sharehold-
ings, including Munich Re, Deutsche Börse, Buderus and Continental.
The resulting capital gains, coupled with the strong reduction of risk-
weighted positions, increased our core capital ratio to 9.6%. That puts
us among the best in our industry. This sound capital situation met with
a very positive response from rating agencies and investors.
We returned a part of the gains to our shareholders in the form of a share
buyback program launched in summer 2002. By the end of the year, we
had already bought more than 5% of our own shares.
The optimization of the Private Clients and Asset Management Group
Division (PCAM) made considerable progress in 2002. PCAM became
much more profitable despite weak equities markets. With the acquisi-
tions of Scudder and RREEF, we advanced to join the leading group of
global asset managers and took a significant step forward in the U.S.
market to become the world’s leading real estate asset manager.
4
The new Private & Business Clients Corporate Division concentrates on
asset-building private clients and business customers, with the focus on
our core markets of Germany, Italy and Spain. The Corporate Division
combines the former personal banking business, our services for business
clients and parts of our former private banking business. The integration
process, to be implemented this year, will lead to further improvements
in market leverage and cost-efficiency.
We have great expectations for our new Private Wealth Management,
which addresses high net worth private individuals worldwide. It is closely
aligned with specific target groups and combines all of the bank’s
strengths for our customers. We reinforced our position in Switzerland,
where Deutsche Bank had already been one of the biggest foreign private
banks for a long time, by acquiring the bank Rüd, Blass & Cie, Zurich.
For our Corporate and Investment Bank Group Division (CIB), 2002 was
not an easy year owing to weak stock markets worldwide, strongly
declining new issue and M&A business as well as generally deteriorating
investor confidence. Nevertheless, we gained market share and further
strengthened our leading position in many business areas. A good num-
ber of our business divisions won important awards. Our derivatives busi-
ness is a typical example: several financial magazines nominated us
“Derivatives House of the Year”.
The fact that we are already ahead of plan with our strategic initiatives is
due to the strong discipline and determination of our staff in the imple-
mentation of the measures involved. I would like to extend my cordial
thanks to all employees for their hard work and dedication during this
demanding phase.
5The Group
Our considerable progress, however, is still not reflected in our share
price. The main reason is that the Deutsche Bank share has remained
linked to the depressed tendency of the German equities market. In the
past financial year, the DAX lost about 44% of its value. As a result, it
turned in a weaker performance than comparable international stock
market indices which, in some cases, suffered much smaller declines.
The main focus of our financial communication this year is therefore on
the advantages of our business model. Deutsche Bank has firm roots in
the – for us – profitable German home market. Nevertheless, thanks to
our good global alignment, roughly two thirds of our revenues are already
generated outside Germany.
With its leaner organization and greater operating efficiency, Deutsche
Bank is well-positioned to react flexibly to future demands and risks.
We are determined to exploit all market opportunities and to further
increase the Group’s earning power. For this purpose, we shall concen-
trate in 2003 on recognizing the needs of our demanding clients at an
early stage and expanding our business relations with client groups that
have strong potential.
Nevertheless, it is particularly difficult to give an outlook for the current
financial year. Capital markets and businesses will remain preoccupied
by geopolitical risks. Economic fundamentals will not receive greater
attention again until there is a resolution in sight.
For the lending environment, caution is still the order of the day. As things
stand at present, however, we do not expect a continuation of the
corporate scandals which considerably burdened our lending costs last
year. Furthermore, we have begun to hedge parts of our loan portfolio on
the market using credit derivatives.
6

It is proposed to the General Meeting on June 10, 2003 that an unchanged
dividend of ¤ 1.30 per share be paid for the financial year 2002. This is an
expression of our confidence in the prospects for the current financial
year. Over and above the dividend payment, we had already returned
over ¤ 2 billion to our shareholders by the end of 2002 under our share
buyback program.
The 2003 financial year has got off to a good start for Deutsche Bank.
This makes me and my colleagues on the Group Executive Committee
confident for the development of business in the coming months.
Yours sincerely,
Josef Ackermann
Spokesman of the Board of Managing Directors and
Chairman of the Group Executive Committee
Frankfurt am Main, March 2003
7The Group

Group Executive Committee
Josef Ackermann*, born 1948, Board member since 1996. Spokesmanof the Board of Managing Directors, Chairman of the Group ExecutiveCommittee and responsible for Corporate Development, Corporate Com-munications as well as Economics and Treasury.
Clemens Börsig*, born 1948, Board member since 2001. Chief Financialand Risk Officer, responsible for Controlling, Tax and Investor Relations aswell as for Risk Management and Corporate Security.
Michael Cohrs, born 1956, Head of Global Corporate Finance.
Jürgen Fitschen, born 1948, Head of Global Transaction Banking, GlobalBanking Division and Global Relationship Management Germany.
Tessen von Heydebreck*, born 1945, Board member since 1994. ChiefAdministrative Officer, responsible for Corporate Cultural Affairs, HumanResources, Legal, Compliance and Audit.
Tom Hughes, born 1957, Head of Asset Management.
8

Anshu Jain, born 1963, Head of Global Markets.
Hermann-Josef Lamberti*, born 1956, Board member since 1999.Chief Operating Officer, responsible for Cost and Infrastructure Manage-ment, Information Technology, Operations, Building and Facilities Manage-ment as well as Purchasing.
Rainer Neske, born 1964, Head of Private & Business Clients.
Kevin Parker, born 1959, Head of Global Equities.
Pierre de Weck, born 1950, Head of Private Wealth Management.
Ted Virtue, born 1960, Head of Corporate Investments(until February 20, 2003).
Herbert Walter, born 1953, Head of Private & Business Clients(until March 19, 2003).
* Member of the Board of Managing Directors of Deutsche Bank AG.
9The Group
In alphabetical order from top left to bottom right
Corporate profile New structures and initiatives for a leaner Group and focus on core businesses
New strategic initiatives
Group Executive Committee formed
Deutsche Bank implemented a new management structure in January2002. Three months later, we announced four strategic initiatives. Theyare:
– focus on current earnings,– focus on core businesses,– improvement of capital and balance sheet management,– optimization of Private Clients and Asset Management Group Division.
These initiatives are intended to reduce costs, increase efficiency andraise profitability.
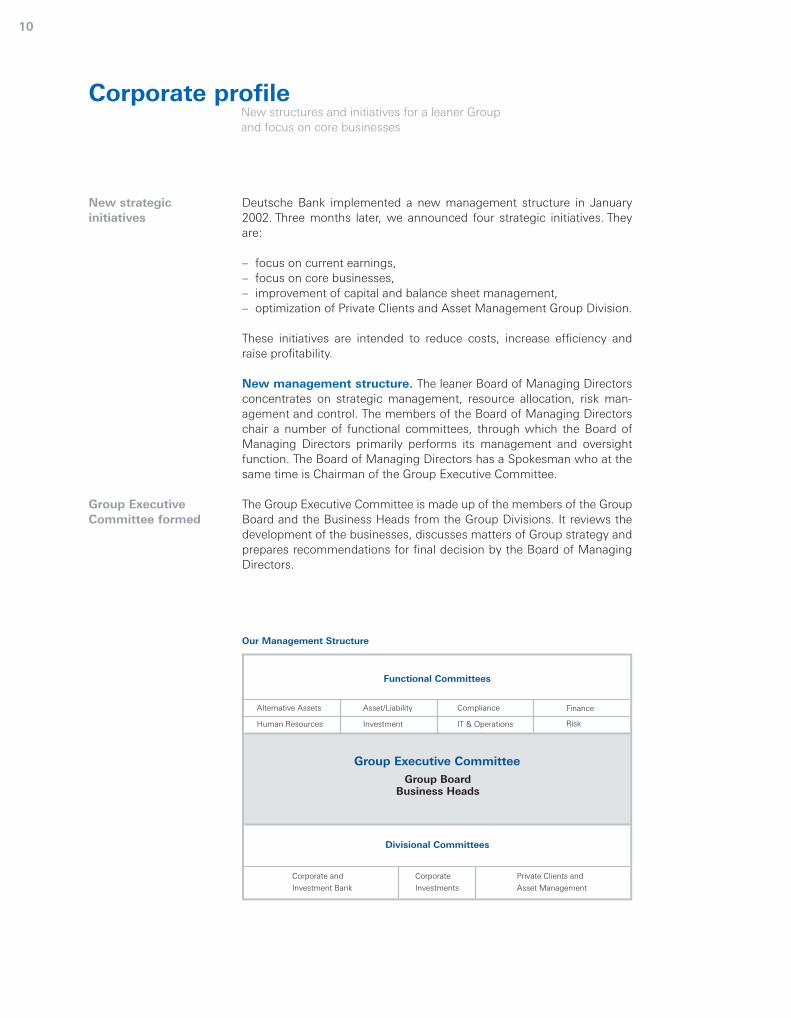
New management structure. The leaner Board of Managing Directorsconcentrates on strategic management, resource allocation, risk man-agement and control. The members of the Board of Managing Directorschair a number of functional committees, through which the Board ofManaging Directors primarily performs its management and oversightfunction. The Board of Managing Directors has a Spokesman who at thesame time is Chairman of the Group Executive Committee.
The Group Executive Committee is made up of the members of the GroupBoard and the Business Heads from the Group Divisions. It reviews thedevelopment of the businesses, discusses matters of Group strategy andprepares recommendations for final decision by the Board of ManagingDirectors.
10
Our Management Structure
Finance
Investment
Alternative Assets Asset/Liability
Human Resources
Compliance
IT & Operations Risk
Corporate and
Investment Bank
Corporate
Investments
Private Clients and
Asset Management
Functional Committees
Divisional Committees
Group Executive Committee
Group BoardBusiness Heads

Three Group Divisions
Services from onesource
Structural realignment
Better market penetration
Three divisional operating committees, each chaired by a member of the Group Executive Committee, have functional responsibility for theoperational management of the Group Divisions.
Group Divisions. Deutsche Bank comprises three Group Divisions:Corporate and Investment Bank (CIB), Private Clients and Asset Manage-ment (PCAM) and Corporate Investments (CI). The Corporate Center supports the Board of Managing Directors withplanning, steering, control, risk management and regulatory compliance.
Corporate and Investment Bank. CIB unites the CorporateBanking & Securities and Global Transaction Banking Corporate Divi-sions. It addresses private and public sector institutional customers aswell as small and medium-sized firms and global corporates. Relationshipmanagers working through a centralized organization ensure that cus-tomers’ demand for financial services is satisfied from one source.
Corporate Banking & Securities consists primarily of the Global Markets,Global Equities and Global Corporate Finance Business Divisions. Theyoffer capital market products worldwide ranging from the straightforwardissuing of a first-class government bond to the individually-structuredproblem solution for complex financial requirements.
Private Clients and Asset Management. In 2002, PCAM consisted ofPersonal Banking, Private Banking and Asset Management. The optimiza-tion of these businesses is a key priority for the Group. To give themgreater focus in the market, we began to restructure PCAM in October2002. Besides the new Private & Business Clients segment, the GroupDivision will also include a second segment comprising Private WealthManagement, Asset Management and Private Clients Services, which waspreviously part of CIB.
Private & Business Clients is focused on asset-building private clients andsmall businesses in its three core markets of Germany, Italy and Spain.Our former personal banking business is now combined in this newCorporate Division with small business banking, hitherto a CIB activity,and parts of the previous private banking unit. This common platformand single franchise under the Deutsche Bank brand will bring bettermarket penetration and cost savings.
Private Wealth Management addresses high net worth individuals world-wide. We offer tailored solutions for these demanding clients’ wealthmanagement needs in their home countries and offshore.
11The Group

Asset Management covers our powerful retail franchises in Europe (DWSInvestments) and in the United States (Scudder Investments) as well asglobal institutional asset management business. With assets under man-agement totaling roughly ¤ 1,000 billion at the end of 2002, PCAM is oneof the world’s leading providers in this market. In real estate investmentbusiness, we are number one globally.
Corporate Investments. The Corporate Investments Group Divisioncomprises private equity, real estate and our traditional industrial share-holdings. After a critical review of the business portfolio and the strategicoptions, we decided to divest a substantial part of our private equitybusiness at the beginning of 2003.
Strategic initiatives. The new management structure with its clearlydefined functional responsibilities was a major precondition for the res-olute and rapid implementation of our strategic initiatives.
Focus on current earnings. Of the planned staff reduction of roughly14,500 by the middle of 2003, we had reached almost 80% by the end ofthe year under review. The pro forma operating cost base was reduced bysome ¤ 3.8 billion in total in 2002 due to increased efficiency, lower discretionary spending and taking into account the consolidation effectsfrom the purchase and sale of business activities.
Focus on core businesses. In 2002 and the first quarter of 2003, wedivested a number of units. Deutscher Herold, our insurance subsidiary,went to Zurich Financial Services in April 2002. We sold DeutscheFinancial Services, which operates in commercial and consumer financebusiness in the U.S.A., as well as parts of the Group’s branch bankingbusiness in France and index-linked (passive) asset management busi-ness. We also disposed of the greater part of our securities custodybusiness. We separated in full from several subsidiaries in the IT sector orreduced our stake to a minority. We outsourced parts of our IT infrastruc-ture on the European continent and parts of our building and facilitiesmanagement activities.
We merged our mortgage bank Eurohypo AG with the mortgage bankingbusiness of Commerzbank and Dresdner Bank to form one of Europe’sleading providers of finance for real estate and for the public sector. Atthe end of 2002, Deutsche Bank held a share of almost 35%.
Improvement of capital and balance sheet management. Tostrengthen our regulatory capital position and improve the Group’s returnon equity, we managed our risk-weighted asset position down by ¤68 bil-lion during 2002. Our BIS core capital ratio rose to 9.6% by December 31.
12
A leading asset manager
Lower costs
Risk-weighted assetsreduced
Non-core activitiesdivested

Furthermore, we repurchased more than 38 million Deutsche Bank sharesin 2002 within the framework of a share buyback program resolved by theGeneral Meeting.
Optimization of PCAM Group Division. With the acquisition of theScudder asset management business and the real estate investment firmRREEF, PCAM fundamentally improved its market and revenue position.The business portfolio was aligned even more closely with the variousclient segments and preferences as a result of the restructuring. Weexpanded our global asset management platform in the U.S.A., Europeand Asia Pacific. The acquisition of Scudder also enabled us to improveour position in the U.S. high net worth market.
The cooperation agreement entered into with Deutsche Vermögens-beratung AG (DVAG) in spring 2002 broadens our client reach in mutualfund business as well as in bank and building finance products.
A smaller, but for PCAM strategically important, acquisition was agreedat the beginning of February 2003. We shall acquire the Swiss privatebank Rüd, Blass & Cie AG Bankgeschäft from Zurich Financial Services.This business specializes in equity portfolio management for wealthy private clients. Rüd, Blass & Cie represents a highly complementary add-on to our existing platform in Private Wealth Management.
Acquisitions in assetmanagement
Private banking business expanded
13The Group
Directory of Deutsche Bank Offices on the Internet: www.deutsche-bank.com/offices
Close to our customers

Transparency. Common elements in all the varied corporate governance
arrangements in Europe are accountability and transparency. But the
integrity to apply sound principles effectively is crucial: Deutsche Bank
serves as a European example.
Paul Arlman, Member of the Board, ECGI-European Corporate Governance
Institute; Secretary General, FESE-Federation of European Securities
Exchanges, Brussels

In March 2001, Deutsche Bank was already the first DAX 30 company topublish its own Corporate Governance Principles. These guidelines arecustom-tailored to Deutsche Bank and regulate our relations with ourshareholders, the tasks and duties of the Board of Managing Directorsand the Supervisory Board, the structure and disclosure of the perform-ance-based compensation of these two bodies and the demands onreporting and transparency. With these Principles, we publicly state howwe want to ensure the responsible and value-driven management andcontrol of Deutsche Bank. The Corporate Governance Principles are inten-ded to promote and strengthen the trust of our present and future share-holders, customers, staff and the public nationally and internationally.
Voluntary commitment beyond duty. In 2002, the German CorporateGovernance Code was approved by the Government Commission set upexpressly for this purpose. Most of the recommendations and sugges-tions were already contained in our Corporate Governance Principles, soonly a few additions had to be made. The Board of Managing Directorsand Supervisory Board approved the revised Corporate GovernancePrinciples on October 30, 2002. As a voluntary commitment, they gobeyond the requirements of law and, in many respects, beyond those ofthe German Corporate Governance Code. Besides disclosing the individ-ual compensation of the members of its Board of Managing Directors,Deutsche Bank also publishes without delay the transactions by mem-bers of the Board of Managing Directors and Supervisory Board inDeutsche Bank AG shares or derivatives based on them. This also coverstransactions that fall below the statutory bagatelle limit.
Statement of compliance. On October 30, 2002, the Board of Manag-ing Directors and the Supervisory Board stated in accordance with §161German Stock Corporation Act that Deutsche Bank AG complies with therecommendations of the “Government Commission German CorporateGovernance Code” with the following exceptions:
– For the members of the Board of Managing Directors and SupervisoryBoard, there is a directors and officers’ liability insurance policy witha small deductible (Code No. 3.8). This is actually a group insurancepolicy for a large number of staff members in Germany and abroad.Internationally, a higher deductible is not usual; a differentiationbetween board members and staff thus does not appear to be appro-priate.
– Separate compensation is not presently paid for chairing SupervisoryBoard committees. The Board of Managing Directors and the Supervi-sory Board will propose to the next General Meeting that a regulationon compensation for chairing Supervisory Board committees (CodeNo. 5.4.5 (1) sentence 3) be added to §14 (1) of the Articles of Associ-ation of Deutsche Bank AG.
Promoting trust
Timely transparency
15The Group
Corporate governance – a part of our identityPrinciples for the responsible management and control of Deutsche Bank

A leading positionin Europe
Sarbanes-Oxley Actpassed
Clear responsibilities and controls. Deutsche Bank introduced Group-wide monitoring of compliance with our Corporate Governance Prin-ciples. Responsibilities and obligations relating to compliance with theindividual legal and voluntary corporate governance requirements wereclearly allocated. This supports the Corporate Governance Officer on theBoard of Managing Directors, Clemens Börsig, in the performance of histasks. The Corporate Governance Officer presented his report on compli-ance with the Corporate Governance Principles to the Board of ManagingDirectors and the Supervisory Board. The Board of Managing Directorsand the Supervisory Board are convinced that the Corporate GovernancePrinciples were again fully observed in 2002.
The Compliance staff unit ensures that the standards of conduct requiredunder capital market law are observed, in particular to avoid conflicts ofinterest in securities business. Through his monitoring measures andcontrols, the Compliance Officer was satisfied that the respective lawsand bank-internal regulations were observed. He submitted a report tothe Board of Managing Directors on the observance of compliance regulations. This report was also sent to the Supervisory Board.
The high standard of our Corporate Governance Principles was againconfirmed with an outstanding third place by the consulting companyDéminor in a survey of EURO STOXX 50 companies. We are confidentthat with our system of corporate governance we shall continue in futureto take a leading position compared with our national and internationalpeers.
U.S. capital market law. Deutsche Bank’s share is listed on the NewYork Stock Exchange. For this reason, the bank is also subject to thisexchange’s listing rules and to U.S. capital market law. The passage ofthe Sarbanes-Oxley Act in July 2002 and the implementation rules of theSecurities and Exchange Commission (SEC) are intended to strengthencorporate governance at companies, improve investor protection andrevive lost confidence in the capital markets. Deutsche Bank alreadyfulfills many of these new requirements, so there are only a few SECregulations remaining to be implemented. Typical issues here are:
– The required special internal control and reporting processes, whichare designed to ensure that important information about DeutscheBank Group is submitted on time and in full, are to be documented andcontinuously analyzed. Furthermore, a certification process extendinginto the individual areas will be implemented to ensure the materialcorrectness and completeness of financial results.
Corporate GovernanceReport presented
16
Legal contradictions
Corporate governanceas a process
17The Group
– The responsibilities of the “One Voice Committee” established last yearare to be expanded to include detailed regulations on disclosure pro-cedures (Disclosure Committee).
Several of the Sarbanes-Oxley Act rules, however, do not conform withGerman law. In this context, it remains to be seen to what extent the SECwill consider, for example, the special features of German corporate andco-determination law in their implementation rules and allow exceptionsin individual cases.
Documentation. This Annual Report including the related publicationsdocuments our compliance with the Corporate Governance Principles. Inthe Operating and Financial Review and Prospects, we provide informa-tion on the expected development of business. The Risk Report containsinformation on our risk management system. The List of Shareholdingsgives details of Deutsche Bank’s important shareholdings. Statements onour shareholder structure are made in the section on Shareholders.
We view corporate governance as a continuous process. For this reason,we will regularly check and, if necessary, amend our Principles in light ofnew experience, statutory regulations and ongoing developments innational and international standards.
The complete Corporate Governance Report for 2002 including the currentlyvalid Corporate Governance Principles can be ordered from DeutscheBank (see page 261) and is available at www.deutsche-bank.com/ir.

Future-oriented. When it comes to important international issues such
as the environment, global corporations are playing an increasingly
significant role. That is why it is important to have forward-looking, future-
oriented companies like Deutsche Bank play a leading part in making
the world’s economic development more sustainable.
Prof. Dr. Klaus Töpfer, Executive Director of the United Nations
Environment Program, UNEP, Nairobi

Shareholders, customers, staff and society are Deutsche Bank’s fourstakeholder groups. We strive to create successful partnerships withthem in a spirit of trust.
The basis for this is our corporate culture which draws creativity andstrength from the natural diversity of our people. The differences arewhat take us forward. Performance, innovation, teamwork, trust and cus-tomer focus are shared values which are firmly anchored in our corporateidentity and give us stability and direction. They are a decisive factor inour success, allowing us to grasp market opportunities and deliver long-lasting value to all our stakeholders.
Shareholders. The successful development of our business to the bene-fit of all stakeholders depends on our shareholders’ future readiness toinvest in our corporation. In this respect we compete intensely with theexpected returns on investment and risk profiles of all other capitalinvestment alternatives. Deutsche Bank faces this challenge by contin-uously re-aligning its corporate strategy with the demands of the mar-kets. We report quickly and openly to our shareholders on all importantdevelopments: transparency is one of our foremost concerns.
Customers. Success in the market place depends on the satisfaction ofour customers. This means offering attractive products and tailored solu-tions on competitive terms and conditions. Our customers and theirneeds are therefore at the core of our business philosophy and actions.
Staff. Our staff are responsible for making our services and productsattractive. First-class training, strong motivation and broad experience arethe essential attributes we are continuously endeavoring to refine. To thisend, we are investing in a modern human resources management systemthat respects and supports each co-worker as a partner with personalresponsibility. The process of structural change demands a high level offlexibility from our staff, which we regard as a challenge to all of us.
Society. We acknowledge our responsibility as part of the community.Our broad commitment to social, cultural and scientific causes is specifi-cally directed towards improving young people’s prospects. With oursupport for education and training, we want to help keep our society fit for the future. For us, sustaining the balance between economy, ecology and social considerations has central importance.
19The Group
Creating value for our partners Deutsche Bank acts in the interests of its shareholders, customers, staff and society
Diversity is part ofcorporate culture
Shareholders Customers
Staff Society

20
ShareholdersAn attractive return for our shareholders presupposes successful client relationships
Structural Data 2002 2001 2000
Shareholders by group Institutional (including banks) 82% 81% 81%
in % of share capital Private 18% 19% 19%
Regional breakdown Germany 54% 47% 48%
in % of share capital European Union (excluding Germany) 27% 33% 33%
Switzerland 10% 9% 9%
U.S.A. 8% 8% 9%
Other 1% 3% 1%
Key Figures 2002 2001 2000
Change in total return of Deutsche Bank share (43.7%) (9.5%) 7.3%
Share in equities trading (including Xetra) in Germany 7.2% 7.6% 6.0%
Shareholder Satisfaction Index1 60 62 62
Special Projects
Expanded Internet services For the 2002 General Meeting, our shareholders were, for the first time, ableto issue not only instructions, but also powers of attorney, and order admission cards via the Internet.
Share buyback program Systematic implementation of the program using open market andderivative deals. By returning capital to our shareholders, the return on equity and earnings per share can be improved.
1 The Index is based on the expected share price development and the assessment of general information about Deutsche Bank. It is calculated in a poll at the Deutsche Bank General Meeting.

21The Group
CustomersClient orientation and product innovation are key to our company’s competitive success
21The Group
Structural Data 2002 2001 2000
Number of customers
Corporate and Investment Bank1 84,545 108,320 129,200
Private Clients and Asset Management Personal Banking 12,500,000 12,000,000 11,200,000
Private Banking 403,000 430,0002 493,000
Asset Management3
– Institutional 5,022 2,422 1,924
– Retail 8,114,000 4,840,000 4,700,000
Key Figures 2002 2001 2000
Corporate and Investment Bank Euromoney Poll of Polls – ranking 3 1 1
Euromoney Capital Raising Poll – ranking 3 1 1
Euromoney Awards for Excellence, number of awards won 23 13 31
International Financial Review (IFR) Awards (majors) 10 (2) 7 (0) 7 (1)
Private Clients and Asset Management Personal Banking (Germany)
– Client Satisfaction Index 66 68 67
– Client Loyalty Index 65 70 69
Asset Management
– Position in DM/Standard & Poor’s4 1 1 1
A further award for Asset Management:Pensions & Investments 2002: Rank 4 for “Managers Ranked by Total Worldwide Institutional Assets Under Management”.
Special Projects
Private & Business Clients Combining of products for private and business clients under the brand name Deutsche Bank starts in October 2002.
InfoTr@ck Introduction of an online premier trade inquiry browser for clients and their business partners to track trade-related transactions along the entire supply chain.
New directions on the equity market Launch of an innovative Sharia-compliant equity product.
1 In 2002 and 2001, limited comparability with respective previous year figure due to divestments of business activities and changed calculation base.2 Restated for consistency, and excludes clients of Deutsche Bank Alex. Brown.3 Owing to major organizational changes (including the recategorization of client groups), the figures for 2000 and 2001 have been restated for reasons of comparability;
new acquisitions in 2002 were Scudder and RREEF.4 In the category “Big Groups”.

22
StaffMotivated, knowledgeable and client-focused employees are our biggest success factor
Structural Data 2002 2001 2000
Staff (full-time equivalent)1 77,442 86,524 89,784
Divisions Private Clients and Asset Management 46.4% 42.9% 42.6%
Corporate and Investment Bank 44.8% 44.5% 42.5%
Corporate Investments 0.9% 3.4% 4.0%
DB Services 7.1% 8.4% 10.0%
Corporate Center 0.8% 0.8% 0.9%
Regions Germany 43.7% 47.6% 48.5%
Europe (excluding Germany) 27.6% 26.5% 25.6%
North America 19.8% 17.5% 17.2%
South America 0.8% 0.8% 0.6%
Asia/Pacific/Africa 8.1% 7.6% 8.0%
Qualifications2 University degree 34.7% 34.5% 37.2%
Highest school certificates 37.8% 32.4% 32.3%
Other school certificates 27.5% 33.1% 30.5%
Age3 up to 24 years 8.7% 10.4% 11.2%
25–34 years 36.8% 37.4% 38.3%
35–44 years 32.4% 30.4% 29.4%
45–54 years 18.0% 17.4% 16.7%
over 54 years 4.1% 4.4% 4.4%
Key Figures 2002 2001 2000
Employee Commitment Index 67 70 72
Absentee rate 2.9% 2.6% 2.3%
Employees leaving the bank for a new job3 3.6% 8.0% 7.8%
Advanced training (expenses in ¤ million) 126 150 122
Training (expenses in ¤ million) 53 64 63
Participants in the staff share program4 30% – 65%
Special Projects
Global, Group-wide employee survey Objective: precise and realistic depiction of quality factors which could influence employees’ attitudes and behavior patterns; basis for organiza-tional development in a complex environment.
“HR Online” – Group-wide Intranet portal Gives staff direct access to personal data and, to a certain extent,providing access to Human Resources (HR) allows them to update information (objective: better data quality, moreapplications for employees and efficient processes); allows managers, inter alia, to initiate Intranet-based management staff authorization processes (objective: supporting management tasks).
Gives access to information on global training (objective: planning ofindividual advanced training).
1 Staff (full-time equivalent) = total headcount adjusted proportionately for part-time staff, excluding apprentices and interns.2 Point of reference: number of staff (headcount).3 2002 not comparable with pre-year figures due to changed calculation base.4 Suspended in 2001 due to stock market situation.

23The Group
SocietyDeutsche Bank’s worldwide commitment to the community is part of its corporate identity
Structural Data 2002 2001 2000
Number of countries in which Deutsche Bank operates (including offshore sites) 76 75 73
Key Figures 2002 2001 2000
Spending by foundations and other charitable institutions related to
Deutsche Bank Group, as well as project-related spending (in ¤ million)
Social affairs Deutsche Bank Foundation Alfred Herrhausen Helping People to Help Themselves 7.5 4.0 5.0
Deutsche Bank Americas Foundation 15.7 16.0 14.4
Deutsche Bank Citizenship UK 4.1 6.1 4.2
Deutsche Bank Africa Foundation 0.2 – –
Other project-related spending1 0.4 0.4 0.5
Culture Cultural Foundation of Deutsche Bank 3.6 2.7 3.7
Other project-related spending1 0.7 0.8 0.9
Society and the Deutsche Bank Donation Fund in the sciences Donors’ Association for German Science 5.6 5.4 5.7
Deutsche Bank Institute for Family-Owned Businessesat the University of Witten/Herdecke 1.1 1.1 1.1
Alfred Herrhausen Society for International Dialogue 1.3 1.1 0.7
Environment ISO 14001, UNEP-Financial Initiative, World Business Council for Sustainable Development, econsense, Global Reporting Initiative 1.1 2.32 3.32
Special Projects
Flood aid Donation of ¤ 5 million to give quick and direct help to the victims of the flood catastrophe in centralEurope during August 2002.
UN Global Compact/ Support for the nine Global Compact principles in the fields of “Human Rights, Labor, Environment”Microcredit using our Microcredit fund as a best practice project and its integration into the
Global Compact Learning Forum.
Berliner Philharmoniker Since the 2002/2003 season, Deutsche Bank has been partner to the Berliner Philharmonikerunder the slogan “a vision for music”.
National Anti-Doping As a founding member of the German NADA Deutsche Bank seeks to support and enhance fairness Agency (NADA), and transparency in sports and in this way supplements its cooperation with the German SportsGermany Promotion Foundation.
1 Only incurred in the Corporate Center.2 Including the competition “Worldwide Young Researchers for the Environment”.

Strategic Vision. Deutsche Bank has a strong capital position, quality franchises and a
reputation for strategic vision. As an investor we welcome the steps Deutsche Bank is making
to improve its cost structure, risk management and its ability to re-allocate capital in order
to increase returns. Progress on these fronts should be rewarded under any market backdrop.
Julie Thomas, Investment Analyst, Morley Fund Management, London

Worst year for the DAX. In 2002, share prices decreased significantlyon the world’s most important stock exchanges. After the two precedingyears each closed lower than the year before, some share prices col-lapsed to an extent not seen since the 1929 crash. Prices fell particularlydramatically in Germany. Over the year, the German DAX 30 share indexlost 44%. Since the end of 1999, the DAX has therefore shed nearly 60%.
The representative European share indices lost considerably less groundin 2002, for example in London (FTSE 100: minus 25%), in Paris (CAC 40:minus 34%) and Switzerland (SMI: minus 28%). Losses in the U.S.A.were also lower: the Dow Jones shed 17% and the broader marketS&P 500 24%. It would seem that the German stock market is sufferingincreasingly from the weaknesses of Germany as a business location. Thedoubts – gaining strength abroad – about Germany’s willingness and ability to reform obsolete structures apparently resulted all too often inforeign investors shunning German stocks. In this context, the interna-tional position of German companies frequently receives insufficientattention.
DAX plunges
Location’s weaknesses
25Shareholders
Deutsche Bank shares follow the downward trendof the German stock market
In the long term an investment with an above-average return
Useful information on the Deutsche Bank share
2002
Change in total return (43.7%)
Share in equities trading (including Xetra) in Germany 7.2%
Average daily trading volume 11.69 million shares
As of December 31, 2002
Issued shares 621,854,246
Outstanding shares 585,446,954
Share capital ¤ 1,591,946,869.76
Market capitalization ¤ 27.3 billion
Share price1 ¤ 43.90
Weighting in the DAX 8.8%
Weighting in the Dow Jones STOXX 50 1.3%
Securities identification codes
Deutsche Börse New York Stock Exchange
Type of issue Registered share Type of issue Global Registered Share
Symbol DBK Currency U.S.$
WKN 514 000 Symbol DB
ISIN DE0005140008 CINS D18190898
Reuters DBKGn.DE Bloomberg DBK GR
1 Xetra closing price

Good start to the year
Many burdening factors
26
Confidence in equity investment decreases. The year 2002 initiallygot off to a promising start on the stock market. In the first few months,the opportunities for economic recovery in Europe seemed to be good,based on an upswing in the U.S. economy. The Deutsche Bank shareprofited from this. In January 2002, it reached the year’s high of ¤ 82.65.In the months that followed, the mood deteriorated and investorsbecame more reticent, especially international investors. Share prices,however, remained relatively stable despite strong fluctuations character-ized by a high state of nervousness.
With investors’ confidence in the integrity of the stock markets and theirparticipants already shaken, the climate deteriorated generally in the thirdquarter. Record numbers of corporate failures, poor profitability andstructural problems emerging at numerous banks and insurance com-panies, as well as insecurity over German domestic and geopoliticalissues were important burdening factors. Finally, market rumors on creditquality and the threat of a liquidity crisis in the banking sector resultedin the share price falling to its low for the year of ¤ 35.60 on October 9.
100
300
500
700
900
1,100
1,300
80 86 88 90 92 94 96 98 00 02
Long-term value
Total Return Index, beginning of 1980 = 100, quarterly figuresSource: Datastream
82 84
1,500
Deutsche BankDAXCDAX Banks

27Shareholders
It was not until the last few weeks of 2002 that the Deutsche Bank sharesucceeded in escaping to a certain extent from the downward trend. Asof year’s end, it was quoted at ¤ 43.90, approximately 23% above its lowin the autumn.Deutsche Bank’s market capitalization at the end of the year was¤ 27.3 billion (2001: ¤ 48.8 billion). The Deutsche Bank share had aweighting of 8.8% in the DAX German share index at the end of 2002(2001: 6.8%). Trading in Deutsche Bank shares in Germany reached a total volume of roughly ¤ 183 billion in 2002, ranking them secondamong DAX stocks.Since October 3, 2001, Deutsche Bank’s shares have also been listed onthe New York Stock Exchange. The volume of trading in our shares duringthe first full calendar year increased steadily from a low daily average ofabout 35,000 shares in the first six months to more than double that fig-ure (72,000) in the second half-year period. We are confident that thisupward trend will continue.
Long-term return higher than the DAX. Despite the strong pricedecline in 2002, our share has been a worthwhile investment in a long-term comparison. If investors had bought Deutsche Bank shares for theequivalent of ¤ 10,000 at the beginning of 1980, they would have had ashareholding worth ¤ 65,191 at the end of 2002 if they had participated incapital increases without the payment of additional funds and used thedividends to buy new shares. This corresponds to an annual return of8.5% on average for the comparison period. This is better than an invest-ment in the German market which, in terms of the DAX, yielded 8%.
Leaner equity base abroad. Considering the difficult environment, weare pleased to report only a slight fall in the number of our shareholders.As of December 31, 2002, 512,519 (2001: 523,059) shareholders werelisted in our register. Of the total 621,854,246 shares issued, 82% were heldby institutional investors (including banks) and 18% by private persons.
The apparently decreasing interest on the part of international investors isalso reflected in our regional shareholder structure. After the percentageof shares held by foreign shareholders had risen continuously since 1998– up to 53% at the end of 2001 – it dipped again during the year to 46%.Investors domiciled in the U.K. reduced their Deutsche Bank sharehold-ings most strongly.
We are not aware of any major shareholders with a shareholding of morethan 5% to be reported under §21 German Securities Trading Act.According to its own statements, LaCaixa, the Spanish savings bank, hasa shareholding of 3.6% in Deutsche Bank.
550
450
350
250
0298 99 00 01
499
539
494513
523
Number of shareholders slightly lower
in thousands at year’s end
High trading volumein Deutsche Bankshares
Worthwhile investment

Participation increased
Strong demand forinformation
28
Stronger participation in General Meeting. Around 6,500 people (2001:5,300) came to our General Meeting on May 22, 2002 in the Festhalle inFrankfurt. A total of 35.8% of the voting capital was represented in thevotes on resolutions. We thus succeeded again in increasing shareholderparticipation and improving markedly on the low point in 2000 (31.9%).We continued to expand our Internet applications relating to the GeneralMeeting. For the first time, our shareholders were not only able to issueinstructions using the Internet, but also to appoint proxies and orderadmission cards. The increasing popularity of this medium makes usconfident that this will continue to benefit the exercise of voting rightsat our future General Meetings.
The 2002 General Meeting featured changes in the top management andcontrol bodies of Deutsche Bank. With effect from the end of the GeneralMeeting, Hilmar Kopper resigned as Chairman of the Supervisory Boardand Rolf-E. Breuer, until then Spokesman of the Board of ManagingDirectors, was elected as his successor. Josef Ackermann, member ofthe Board of Managing Directors of Deutsche Bank AG since 1996,became the new Spokesman of the Board of Managing Directors.
All resolutions at our General Meeting were again approved with largemajorities. Shareholders renewed the authorization for a share buybackprogram. It was approved by the Board of Managing Directors in Juneand launched in July. In accordance with the German Stock CorporationAct, we are thus authorized to buy back up to 62 million shares (i.e. 10%of all issued shares) before this authorization expires in September 2003.We publish information regularly on the status of our share buyback pro-gram. By the end of 2002, we had purchased 38.1million of our shares, or6.1% of our issued shares, at an average price of ¤ 53.97. In returningcapital to our shareholders, we are able to increase our return on equityand earnings per share.
Challenge to Investor Relations. The adverse stock market climateand the negative impact of corporate scandals on confidence in theintegrity of securities markets were major challenges to our financialcommunication in 2002. Only a timely, open and consistent flow of infor-mation to the financial markets enabled us to build up and maintaindurable investor relations. It was helpful in this respect that we were sup-ported by the initiative launched at Deutsche Bank in early 2001 for betterfinancial transparency.
The task of conveying our corporate strategy to the public in a difficultenvironment was the main influence on our investor relations activities in2002. To meet the strong demand for information on the part of bankanalysts and investors, we launched a series of roadshows at all impor-
GermanyForeign countries
50
30
40
0299 00 01
51
4849
52
47
5354
46
Decreasing foreign share
Share capital in % at year’s end
55
35
45

Dividend maintained
tant international financial centers. The new Spokesman of the Board ofManaging Directors, Josef Ackermann, presented his strategic initiativesand answered questions from expert audiences.
With more than 35 written investor relations announcements, whichwere also published simultaneously on the Internet, we kept institutionaland private investors informed about important events at Deutsche Bank.In total we held 310 small group meetings (2001: 210) with internationalinvestors, increasingly via video or telephone conferences. At our analystmeetings, we regularly provided information on the development of busi-ness and our strategic measures. These events are also broadcast liveover the Internet to allow direct, unrestricted access for all interested par-ties. The dialogue with our private investors is also important to us. Themany calls and the broad range of questions we receive on the share-holder hotline reflect the strong interest in Deutsche Bank’s develop-ment. On all important dates in Deutsche Bank’s financial calendar, weoffer the opportunity to contact us via Internet to discuss current ques-tions on the development of business.
Dividend proposal for 2002. It will be proposed to the General Meetingin June 2003 that an unchanged dividend of ¤ 1.30 per share be paid forthe 2002 financial year.
29Shareholders
Insurance companies,mutual fund companies18 %
Wage and salaryearners, pensioners9 %
Other privatepersons9 %
Other institutionalinvestors and companies64 %
Distribution of share capital
621.9 million shares at year’s end 2002

Partnership. We have a strong relationship with Deutsche
Bank that allows us to build on our mutual networks and
business strategies to achieve extraordinary results.
Zhu Xinqiang, General Manager, Bank of China, Beijing

Corporate and Investment Bank Innovation and client focus prove their worth in very difficult markets
For the Corporate and Investment Bank Group Division (CIB) – see page 11 – 2002 was a difficult year. Strong stock market volatility, signifi-cant declines in flotations and mergers and acquisitions, rising corporatedefaults, and falling investor confidence were typical of the markets.Despite these tough conditions, CIB grew market share in many fields ofbusiness. Moreover, the Group Division responded successfully to mar-ket volatility and enhanced its position.Our commitment in both the debt and equity markets was recognized ina number of ways. Our derivatives business in particular received signifi-cant accolades. The specialist magazine International Financial Reviewnamed Deutsche Bank as Derivatives House of the Year and Interest RateDerivatives House of the Year. The magazine Risk also named the bankDerivatives House of the Year, with prizes for interest rate derivatives,credit derivatives, energy/commodity derivatives and equity derivativesresearch.
Corporate Banking & Securities
The Corporate Banking & Securities Corporate Division consists primarilyof the sales and trading activities of the Global Markets and Global EquitiesBusiness Divisions as well as the Global Corporate Finance Business Division.
Global Markets comprises all trading, sales and research in foreignexchange, government, agency, and investment grade debt, emergingmarkets, exchange-traded, OTC and credit derivatives, commodities,structured transactions, money markets, repo and securitization.
31Customers
Equity Interestrate
Com-modity
Foreignexchange
CIB: strong growth in
derivatives business
Volume growth 2001/2002vs. 2000 in %
Deutsche Bank: client volumesSource for total market: Bank for International Settlements,British Bankers Association
Deutsche BankTotal market
0
25
50
100106
70
56
46
17
4033
16
75
Corporate and Investment Bank1
in ¤ m. 2002 2001
Net revenues 14,319 17,474
Provision for credit losses (1,740) (581)
Operating cost base (11,285) (13,729)
Income before nonoperating costs 1,294 3,164
Average active equity 16,250 18,697
Risk-weighted positions (BIS) 156,096 187,945
Assets 643,668 677,623
1 For notes and other detailed information, see page 90 and page 176.
Income before nonoperating costs 2002
In a difficult environment, CIB revenues fell by 18 % to ¤ 14.3 billion. Equities trading was
strongly impacted by the tight market conditions. In trading with fixed-income securities
and related products, revenues fell by only 7 %. The measures taken in CIB to raise effi-
ciency and reduce costs led to an 18 % decrease in the operating cost base to ¤ 11.3 bil-
lion. Income before nonoperating costs in 2002 was ¤ 1.3 billion after ¤ 3.2 billion in the
previous year. This included growth of ¤ 1.2 billion in provision for credit losses to
¤ 1.7 billion, reflecting the deterioration in the business environment.

The market environment presented many challenges in 2002, notably theabsence of expected interest rate cuts in important currencies. Neverthe-less, Global Markets consistently increased its business in fixed-incomesecurities, especially with large corporates and financial institutions, andexpanded its operations in the U.S.A. One of the major contributors to Global Markets’ growth in 2002 was itsderivatives business. The credit derivatives business secured around 500new clients and new transaction volumes in interest rate derivatives andcredit derivatives increased by 31% and 73% respectively.Risk management became even more important in 2002, both to us andto our clients. Deutsche Bank’s expertise was noted by numerous indus-try surveys and awards. The magazine Euromoney named us the World’sBest Risk Management House for the second successive year and BestRisk Management House in Western Europe.Global Markets’ U.S. business made rapid strides in 2002. Although over-all bond issuance fell by approximately 20% in the U.S.A., DeutscheBank tripled its underwriting business with North American corporates.For the first time, the bank topped league tables for All International Bondissuance and dominated the euro markets for the fourth consecutiveyear. Among many bond issues led by Deutsche Bank were a number ofU.S. dollar offerings for a big U.S.-based financial institution and numer-ous landmark deals for European sovereigns.Deutsche Bank also attained market leadership in asset-backed securitiesin the U.S.A. and Europe, a feat acknowledged by International FinancialReview, which named the bank North American and European Securitiza-tion House of the Year. Notable transactions in this area included a keyrole for Deutsche Bank in a U.S.$ 5 billion securitization of auto loans inthe U.S.A., the largest deal of its kind.Further evidence of the bank’s growing presence in the U.S.A. came inthe Treasuries market, where Deutsche Bank was voted Top Dealer in apoll conducted by Institutional Investor.
The Global Equities Business Division comprises cash equities,research, sales and trading, equity derivatives, structuring and tradingand equity prime services.In 2002, despite increasingly volatile markets, Deutsche Bank consoli-dated its position amongst the top three houses in convertibles, equityderivatives, program trading and in equity prime services. In equityresearch, we were considered to be one of the most independent teamsin the market by Global Investor magazine.Deutsche Bank continued to be the leading equities house in Europe anddominated the two major European markets, the U.K. and Germany. Inthe U.K., the bank established a market share in excess of 10% in sec-ondary trading and the European research product was ranked numberthree in the 2002 Institutional Investor All-European research survey.
32
2
0
4
6
8
Global Markets: uptrend in
international bonds continues
Market share in %
All international bondsSource: Thomson Financial
98 99 00 01 02
8.5
6.47.1
7.9
9.0
Global Markets: trading in credit
derivatives grows
Net new volume in credit default swapsIndex in 2000 = 100
00 0201
50
0
100
150
200
100
155
268
250

Largely due to product innovation, we made a breakthrough in the Ger-man warrants market. Here, Deutsche Bank overtook the traditional mar-ket leader for the first time. Global Equities continued to build its presence in the U.S.A. Our analystswere highly ranked in the Institutional Investor All-American survey. Investment in Asia over the past 12 months started to reap rewards andDeutsche Bank was among the top five counterparties for clients seekingAsian equity product. In Japan, equity research was ranked number twoin the Nikkei survey and the Asian research product rose four places inthe Institutional Investor All-Asia research survey 2002. Innovation wasalso key in 2002, and Global Equities brought several new products to themarket – notably through its Strategic Equity Transactions Group.Deutsche Bank led landmark equity swaps, derivatives transactions andblock trades for a major European bank. We also arranged an acceleratedbookbuild for one of Europe’s leading corporates.Further innovation was demonstrated by the Xavex online trading sys-tem, which saw nearly 400% growth in volumes in the reporting year.The Xavex Dynamic Bond Portfolio Fund, launched in 2002, highlightedthe cross-business cooperation between Global Equities and Global Markets. This was also evident in the launch of the Islamic Equity buildercertificates, an innovative Sharia-compliant product. The DWS FundsFlex Protect fund was the first product to emerge from a joint venturebetween DWS and Global Equity Derivatives.
The Global Corporate Finance Business Division comprises mergersand acquisitions (M&A) and advisory, equity capital markets, credit tradingand debt products as well as global relationship management.Corporate Finance benefited from a further strengthening of key industrygroups such as financial institutions, consumer and real estate, as well asenhanced coverage in the U.K. and France. In 2002, a year when completed transactions in global mergers andacquisitions declined by 39%, Deutsche Bank increased its market sharefrom 6% to 17%.Deutsche Bank consolidated this growth by securing first place in Germany and a top three ranking in the U.K. in announced M&A trans-actions. Major deals included a number of advisory roles for a leadingU.K.-based oil company.In the U.S.A., Deutsche Bank advised one of its clients on the biggesttelecommunications transaction of 2002 and the largest private shoppingcenter transaction in the U.S. real estate sector. The bank also advised onthe largest U.S. buyout since 1989 in the forest products sector. In the Asia Pacific region, Deutsche Bank was involved in several of themajor transactions of 2002. These included advising on the formation of ajoint venture between four of the world’s largest companies to constructand operate an important pipeline project in China, the largest demergerin Australian corporate history and a landmark M&A deal in New Zealand.
M&A marketshare tripled
Closer cooperation
33Customers
Deutsche Bank14 %
Global Equities: leader in
European equity trading
Market share 2002 in %
Source: Autex data

Deutsche Bank was the number one mergers and acquisitions advisor inAustralia and New Zealand in 2002.Deutsche Bank demonstrated its leadership in debt financing for clientsin 2002, and brought to the market a number of challenging and complextransactions, despite reducing risk-weighted assets and limiting balancesheet usage. International Financial Review named Deutsche Bank LoanHouse of the Year. The successful financing for a leading tobaccocompany was named European Loan of the Year. Deutsche Bank wasalso named European Loan Trading House of the Year. In the Americas, Deutsche Bank advanced into the top two in the highyield market, doubling its market share. International Financial Reviewnamed Deutsche Bank U.S. High Yield Bond House of the Year.There was also success in non-dollar high yield, where Deutsche Bankbecame market leader with over 40% market share. In Japan, DeutscheBank established a strong franchise with market leading transactions,including major roles in the two largest management buyouts.In equity and equity-related issuance in Europe, the Middle East andAfrica, Deutsche Bank increased its market share to 13.8% and movedinto first place. The bank played a major part in the first U.K. IPO sinceJuly 2001 and led innovative equity-linked transactions for a Portuguesecorporate and a Swiss chemicals company. We more than doubled our market share with U.S. equity issuers,increasing our volumes by 66% while the total market volume declined23%. Deutsche Bank was bookrunner on the largest gaming industry IPOin history, and for the second year running, the bank won the ConvertibleDeal of the Year award from Corporate Finance magazine.
Global Transaction Banking
The Global Transaction Banking Corporate Division consists of CorporateTrust & Agency Services, Global Trade Finance and Global Cash Manage-ment.As part of our focus on core businesses, we agreed to divest parts of ourcustody activities. The sale was closed at the end of January 2003.
Corporate Trust & Agency Services (CTAS) continued to strengthenits global franchise in 2002, notably in the U.S.A., Japan and Italy.Deutsche Bank established itself as the top issuing and paying agent foreuro medium-term note and euro commercial paper programs. In themortgage-backed securities market in the U.S.A. and in the Europeanand U.S. asset-backed securities markets, we are one of the top threetrustees.
34
U.S.A. Global
0
10
20
30
40
Completed M&A dealsSource: Thomson Financial
Global Corporate Finance:
worldwide market share gains
in advisory
Market shares in %
2.4
17.8
5.5
16.5
Germany
22.8
39.7
Europe
11.0
19.8
20012002
Market gainsin U.S. equity

In 2002, Corporate Trust & Agency Services won a number of importantindustry accolades, including Best Trustee for Europe and Best Trusteefor Asia Pacific from International Securitisation Report.
The Global Trade Finance Business Division, which combines all ofDeutsche Bank’s trade and export finance businesses, consolidated itsleading position in Europe and Asia in 2002 and continued to expand itsactivities in the Americas.Global Trade Finance executed a number of notable trade-related transac-tions across a wide range of countries in 2002. These included landmarkdeals in Kazakhstan, Hungary and Russia. We extended our client prod-uct portfolio and adopted online technology to enable clients to accessreal-time information related to their trade transactions.This diversity was recognized by Euromoney’s Trade Finance magazine,which named Deutsche Bank Best Short Term Trade Finance Bank, BestTrade Documentation Bank and awarded the bank several Deal of theYear prizes.
Global Cash Management won further benchmark mandates withcorporates and financial institutions in 2002. Importantly, Global CashManagement increased its presence among U.S. corporates. We main-tained our position as dominant provider of euro clearing services and top-five U.S. dollar clearer for financial institutions.Ongoing investment in technology development was channelled into system enhancements to increase processing efficiency as well as toextend the bank’s volume transactions processing capabilities. Addition-ally, new Internet-based services were launched. Industry acknowledgements continued with Deutsche Bank being namedBest at Cash Management by The Banker magazine, and in Europe, Bestat Cash Management by Euromoney and Best Cash Manager by TreasuryManagement International.
Product portfolioextended
Leader in cashmanagementtechnology
35Customers
Trustee mandates for U.S. mortgage-backed securitiesSource: Thomson Financial
4
0
8
12
16
5.16.4
Global Transaction Banking:
strongly expanding trustee business in
U.S. mortgage-backed securities
Market share in new business in %
15.7
020100

Reliability. I preferred Deutsche Bank for its franchise and
since then I’ve been proven right in my choice. Deutsche Bank
offers me the maximum of expertise and service, product
quality and advice, which is just what I expect from my bank.
Marina Zummo, Businesswoman, Verona

Private Clients and Asset ManagementProgress with optimization and realignment for future expansion
In 2002, the Private Clients and Asset Management Group Division(PCAM) – see page 11 – made excellent progress towards its strategicgoal of optimizing the PCAM franchise. PCAM significantly improved itsoverall financial performance, with a substantial increase in profits anda larger contribution to Group profitability. We also streamlined our costbase with a focused cost containment program. With our acquisition ofScudder and RREEF in the U.S.A., we complemented our strong existingpresence in Europe, and established the Group Division as a leadingasset manager in the world’s major markets.In October 2002, we began to realign the organizational structure in partsof PCAM in order to further improve the basis for profitable growth.
Personal Banking
On profitable growth path. In the Personal Banking Corporate Division,we added further attractive services to our client offering. Thanks to dis-ciplined performance management and focused sales activities, PersonalBanking delivered a much stronger performance in 2002. Our strength inloans, deposits and other products more than compensated for thedecline in securities turnover. Strict cost discipline enabled us to signifi-cantly reduce operating expenses in our branch network and online busi-ness.
Aligned for growth
37Customers
11.5
11
12
12.5
Personal Banking:
growth in client numbers continues
in millions at year’s end
0100
11.2
12.0
Private Clients and Asset Management1
in ¤ m. 2002 2001
Net revenues 8,972 10,393
Provision for credit losses (226) (206)
Policyholder benefits and claims (685) (2,946)
Operating cost base (6,422) (6,954)
Income before nonoperating costs 1,639 287
Average active equity 4,493 4,324
Risk-weighted positions (BIS) 57,359 56,231
Assets 101,296 123,784
1 For notes and other detailed information, see page 96 and page 176.
Income before nonoperating costs 2002
PCAM’s results were strongly influenced by the divestment of the insurance business
and the Scudder and RREEF acquisitions. The fall in revenues by ¤ 1.4 billion to ¤ 9.0 bil-
lion was attributable to lower insurance premiums, accompanied by reduced policy-
holder benefits and claims. The strong rise in income before nonoperating costs by
¤ 1.4 billion to ¤ 1.6 billion in 2002 included a gain of ¤ 502 million from divestment of
the insurance business and related activities. The remaining improvement stemmed
largely from a substantial reduction in the operating cost base in the Personal Banking
Corporate Division.
Distribution strengthened
Integrated platform
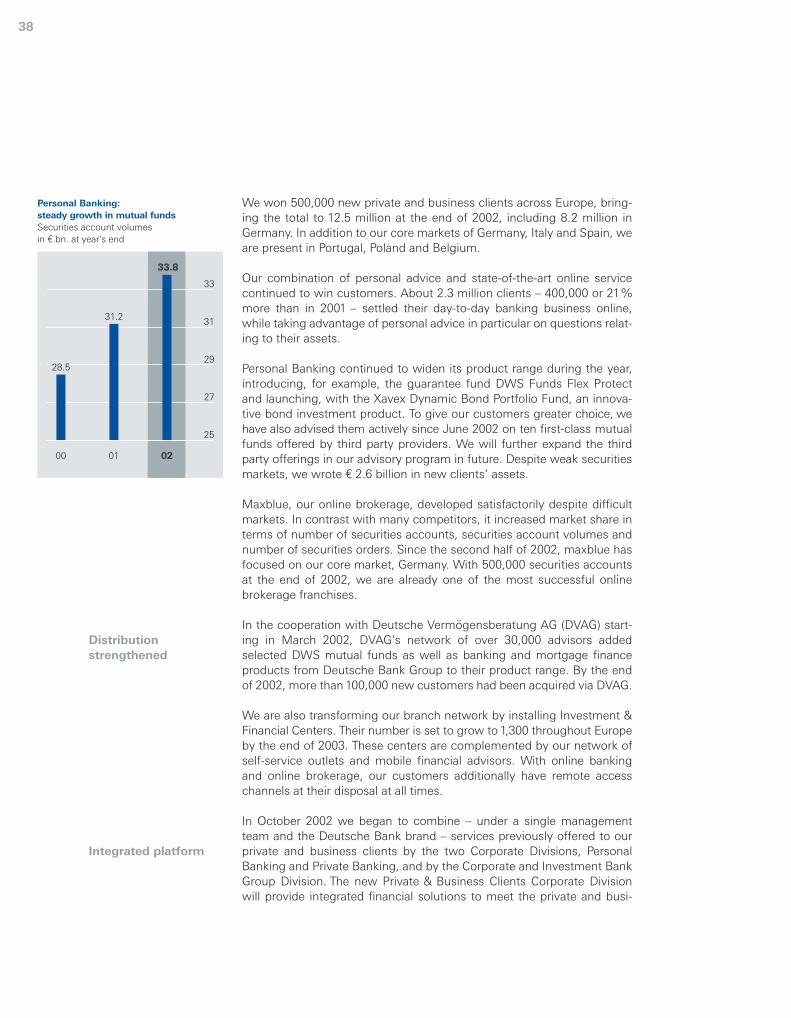
We won 500,000 new private and business clients across Europe, bring-ing the total to 12.5 million at the end of 2002, including 8.2 million inGermany. In addition to our core markets of Germany, Italy and Spain, weare present in Portugal, Poland and Belgium.
Our combination of personal advice and state-of-the-art online servicecontinued to win customers. About 2.3 million clients – 400,000 or 21%more than in 2001 – settled their day-to-day banking business online,while taking advantage of personal advice in particular on questions relat-ing to their assets.
Personal Banking continued to widen its product range during the year,introducing, for example, the guarantee fund DWS Funds Flex Protectand launching, with the Xavex Dynamic Bond Portfolio Fund, an innova-tive bond investment product. To give our customers greater choice, wehave also advised them actively since June 2002 on ten first-class mutualfunds offered by third party providers. We will further expand the thirdparty offerings in our advisory program in future. Despite weak securitiesmarkets, we wrote ¤ 2.6 billion in new clients’ assets.
Maxblue, our online brokerage, developed satisfactorily despite difficultmarkets. In contrast with many competitors, it increased market share interms of number of securities accounts, securities account volumes andnumber of securities orders. Since the second half of 2002, maxblue hasfocused on our core market, Germany. With 500,000 securities accountsat the end of 2002, we are already one of the most successful onlinebrokerage franchises.
In the cooperation with Deutsche Vermögensberatung AG (DVAG) start-ing in March 2002, DVAG’s network of over 30,000 advisors addedselected DWS mutual funds as well as banking and mortgage financeproducts from Deutsche Bank Group to their product range. By the endof 2002, more than 100,000 new customers had been acquired via DVAG.
We are also transforming our branch network by installing Investment &Financial Centers. Their number is set to grow to 1,300 throughout Europeby the end of 2003. These centers are complemented by our network ofself-service outlets and mobile financial advisors. With online bankingand online brokerage, our customers additionally have remote accesschannels at their disposal at all times.
In October 2002 we began to combine – under a single managementteam and the Deutsche Bank brand – services previously offered to ourprivate and business clients by the two Corporate Divisions, PersonalBanking and Private Banking, and by the Corporate and Investment BankGroup Division. The new Private & Business Clients Corporate Divisionwill provide integrated financial solutions to meet the private and busi-
38
27
25
29
31
33
Personal Banking:
steady growth in mutual funds
Securities account volumesin ¤ bn. at year’s end
00 01 02
28.5
31.2
33.8

ness needs of eight attractive customer segments in Europe. Importanthere is that our advisory service is tailored individually to the customer’svarious life stages.
We are convinced that, by combining and concentrating our core com-petencies for these customer groups in the new Private & BusinessClients Corporate Division, we shall become more competitive, layingthe foundations for even more successful and more profitable businessrelationships.
Private Banking
With new alignment. In 2002, our worldwide private banking businessgained strong momentum, in particular from the integration of Scudder’sprivate banking activities in the U.S.A. Despite adverse market condi-tions, we improved our tailored range of integrated solutions for wealthmanagement clients. Private Banking expanded its services designed tohelp customers maintain or increase their assets. We widened our rangeof investment types and our advisory offering for market risk manage-ment. Private Banking is also working even more closely with the Corpo-rate and Investment Bank and with Asset Management in the interest ofits customers.
At the end of 2002, 5,373 Private Banking staff at the world’s principalfinancial centers served roughly 403,000 clients worldwide. Invested assetscame to ¤ 148 billion, of which Germany accounted for ¤ 72 billion.
Following the acquisition of Scudder, our customers can now access abroader spectrum of superior global services at ten American locations.Important economies of scale were achieved at the same time as a resultof the broader base of clients and assets. We shall continue to expandglobally our “Wealth with Responsibility” program with which PrivateBanking helps wealthy families deal effectively with the many non-finan-cial aspects of their wealth.
In Germany, Private Banking rolled out a new, integrated financial plan-ning tool for customers. It allows them to take an integrated, long-termapproach to strategic asset allocation. This product proved very effectivefor safeguarding our clients’ assets in times of volatile financial markets.Our pricing model, which was introduced in 2001 and is based on advi-sory service uptake rather than securities transactions, helped stabilizerevenues in Private Banking.
Scudder addsmomentum
39Customers
0
5
10
15
20
25
DWS: market leader at high level
in Germany
Market share in % at year’s end
24.2
00 01 029998
21.923.2
25.0
23.1
Source: BVI

Swiss private bankacquired
For the further growth of our global private banking business, we arecommitted to training and retaining top-quality professionals as part ofour goal of becoming employer of choice in the industry. Importantinvestments were made in staff development and training in 2002. In thepast three years, for example, 285 relationship managers completed the“Deutsche Bank Private Banking Qualified Financial Consultant” programat the Academy of the Ruhr University in Bochum. The expansion of ourplatform in the U.S.A. in 2002 made us more attractive as an employerand boosted our global talent pool.
In October 2002 we began to tailor our organizational model more specifi-cally around the various segments of our client base. The new PrivateWealth Management will provide exclusive global coverage for high networth and ultra high net worth individuals and families with their particu-larly sophisticated requirements.
In February 2003, we reached agreement on the acquisition of the highlyreputed Swiss private bank Rüd, Blass & Cie AG Bankgeschäft. Thisaddition is an ideal complement to our existing infrastructure and givesus further access to the attractive ultra high net worth client segment inSwitzerland.
Asset Management
Broader base. Outstanding events in 2002 in the Asset ManagementCorporate Division were the successfully completed acquisitions ofScudder and the real estate asset manager RREEF. We initiated thedivestment of our passive asset management business as part of ourfocus on high-value, higher-margin businesses: active institutional, retail,and alternative investments.
We launched DWS Investments as a truly pan-European brand in themutual fund business, covering all our key markets in Europe. Our sub-sidiary DWS has become Europe’s largest mutual fund company,expanding its domestic market share leadership to 25% in 2002. DWSreceived top accolades for its fund performance in Austria, France,Belgium, the U.K. and Switzerland. In Germany, the rating agency Stand-ard&Poor’s named it the Best Mutual Fund Company for the eighth yearin succession.
In collateralized bond obligations (CBO) business, which DWS onlyentered in 2000, we became one of the leading European managers in2002.
40
Europe40 %
Asset Management:
globalization of platform
Total of ¤ 726 bn. assetsunder management* at year’s end 2002
Americas53 %
Asia Pacific7 %
* Including alternative investments

In our institutional business, Deutsche Asset Management is one of theleading managers of European pension funds. Furthermore, DeutscheAsset Management was named German Asset Management Firm of theYear by the magazine Financial News.
In the Americas, our U.S. retail business operates under the ScudderInvestments brand with some 95 funds spanning the breadth ofDeutsche Asset Management’s investment range. These funds are avail-able through brokers, financial planners, banks and other intermediaries.Scudder also distributes funds directly through the AARP (AmericanAssociation of Retired Persons) Investment Program. To strengthen thisposition, we have begun to selectively expand our business relationshipswith bulge bracket distributors and are increasing our own wholesalingcapacity by 50 %.
Our institutional asset management business completed new transac-tions on a record scale in 2002, both in the core product range as well asin innovative value-added strategies such as quantitative products andalternative investments.
Asia Pacific has strong growth potential for global asset managementbusiness. In Asia, China and South Korea are proving to be particularlystrong new business opportunities. In Japan, our strength in Japaneseequities, combined with our innovative retail distribution strategies,continues to provide opportunities for growth. The good prospects inAustralia are based on our leadership position in alternative investmentsand on strong independent consultant support.
As fund manager for institutional and private clients, Deutsche AssetManagement, with businesses in Japan, Singapore, Hong Kong, Aus-tralia, South Korea, India and Taiwan, is a market leader in Asia Pacific.
41Customers
Asset Management:
balanced product mix
Total of ¤ 726 bn. assetsunder management at year’s end 2002
Retail funds34 %
InstitutionalActive45 %
Passive14 %
Alternative investmentsincluding real estate7 %
Strong growthpotential in Asia

Customer Focus. The Blackstone Group enjoys a strong business relation-
ship with Deutsche Bank. We and our portfolio companies benefit from
Deutsche Bank’s private equity investment capital, as well as the full range
of the bank’s global commercial and investment banking services.
Mark J. Johnson, Associate, Stephen A. Schwarzman, President and CEO,
Michael S. Chae, Principal, The Blackstone Group, New York

Corporate InvestmentsPrivate equity business streamlined and industrial shareholdings sold
The Corporate Investments Group Division, created in February 2001, isprimarily responsible for Deutsche Bank’s traditional industrial sharehold-ings (DB Investor) and its investments in private equity (DB Capital Part-ners). The invested assets combined in Corporate Investments at the endof 2002 amounted to ¤ 26.4 billion. Of this total, ¤ 6.7 billion related toPrivate Equity, ¤ 9.2 billion to DB Investor and ¤ 10.5 billion to OtherCorporate Investments.
Industrial shareholdings. DB Investor has been the management com-pany for all publicly listed industrial shareholdings of Deutsche BankGroup since 1998. In spring 2002, Deutsche Bank AG decided to separatefrom non-core businesses and to accelerate the divestment of its indus-trial shareholdings. Consequently, DB Investor concentrated during 2002on the partial divestment of its portfolio of publicly listed shares. Despitedifficult capital markets and decreasing share prices, successful resultswere achieved. During the first quarter of 2002 the stake in Baden-Württembergische Bank AG was fully disposed of, while the participationin Nürnberger-Beteiligungs-AG was reduced to just below 3 % frompreviously 26.4 %. Furthermore, shares and fixed-income securities heldin special funds with an aggregated value of roughly ¤ 4 billion as well assmaller parts of the stakes in Allianz AG and Münchener Rückver-sicherungs-Gesellschaft AG were sold in the capital market. At the end ofthe second quarter the remaining participation of 4.2% in MünchenerRückversicherungs-Gesellschaft AG was entirely placed with the market.In the first half of 2002 we sold a total of 7.1% of the shares of MünchenerRückversicherungs-Gesellschaft AG.
43Customers
Corporate Investments1
in ¤ m. 2002 2001
Net revenues 3,086 2,054
Provision for credit losses (144) (202)
Operating cost base (1,222) (1,363)
Income before nonoperating costs 1,720 489
Average active equity 6,751 7,757
Risk-weighted positions (BIS) 19,219 56,202
Assets 26,546 121,006
1 For notes and other detailed information, see page 103 and page 176.
Industrial share-holdings divested
Income before nonoperating costs 2002
In the 2002 financial year, income before nonoperating costs in Corporate Investments
Group Division amounted to ¤1.7 billion. This corresponded to an increase of ¤1.2 billion or
252% compared with the previous year. The main reason for this was higher revenue from
the sale of industrial shareholdings. This included, as the largest transaction, the complete
divestment of our shareholding in Münchener Rückversicherungs-Gesellschaft AG.

Private equityportfolio reviewed
In the second half of the year the holdings in Deutsche Börse AG, Conti-nental AG and Buderus AG were completely sold, while the stake inSüdzucker AG was reduced from 10.9% to 4.8%. DB Investor also dis-posed of some smaller stakes and holdings. In total, Deutsche BankGroup received proceeds from disposals of stakes in other publicly listedcorporations (not including the securities held via special funds) totalingapproximately ¤ 5.1 billion, achieving net gains of roughly ¤ 3.5 billion.
During the fourth quarter of 2002 all material industrial shareholdingswere concentrated in DB Value GmbH to further streamline the Groupstructure. Remaining holdings under the DB Investor roof will be mergedwithin Deutsche Bank Group or liquidated.
The market value of the remaining shareholdings in other publicly listedcorporations totaled roughly ¤ 5.6 billion on December 31, 2002, whichcompares to ¤ 15.4 billion at the end of 2001. The substantial marketvalue reduction can be attributed to the above-mentioned disposals anddecreased share prices.
Private equity. DB Capital Partners has functional responsibility inDeutsche Bank Group for private equity investing. This includes directprivate equity investments and fund investing. DB Capital Partners oper-ates out of offices at various locations in the U.S.A., Europe, and Aus-tralia. Both Deutsche Bank assets and clients’ assets are invested.
The direct investing group provides private equity financing, includingbuyouts, venture capital, growth financing and mezzanine financing forportfolio companies. Consistent with the Group’s strategy for industrialshareholdings in 2002, DB Capital Partners focused on managing existingportfolio companies with the aim of reducing risk and maximizing value.The entire invested assets were critically reviewed and all options analyzed.
In February 2003, we sold 80% of our late-stage private equity portfoliowith a value of ¤ 1.5 billion. Deutsche Bank retains a share of 20% inthe portfolio, comprising private equity investments in the U.S.A. (e.g.Prestige Brands, Jostens) and in Europe (including Center Parcs, UnitedBiscuits).
In fund investing business, DB Capital Partners manages a portfolio ofthird-party private equity funds of funds. This business is conducted outof New York and London. It provides the bank’s clients with access todiversified portfolios of private equity funds through structured invest-ment vehicles. Investments are made in Europe and the U.S.A. in a broadrange of private equity funds, including leveraged buyout and venturecapital funds.
44
Accelerated sales of industrial
shareholdings
in ¤ bn.
5.1
02010098 99
1.2
2.1
1.6
2.7
5
4
3
2
1
0

During 2002, we launched several attractive third-party products. Theyincluded a principal-protected fund of funds, a secondary fund of fundsand other structured private equity products. With these products, too,we provide our customers with the benefits of our investing and structur-ing expertise in this market segment.
45Customers
Direct private equity investments
by region
Total of ¤ 3.5 bn. at year’s end 2002
Germany33 %
Europe(excluding Germany)27 %
U.S.A.33 %
Rest of world 7 %

Since February 2001, DB Services has been the central provider of cross-divisional services at Deutsche Bank. At the end of 2002, it had 5,501employees (full-time equivalent).
DB Services’ customers are primarily our own Corporate Divisions. Services provided by units featuring an excellent price/quality ratio areincreasingly being offered to external markets. The business approach ofDB Services is guided by the free market philosophy. This ensures thatour Corporate Divisions receive high-quality services at competitiveterms and conditions.
Broad service range. DB Services is divided into four organizationalunits: Information Technology, Transaction Banking, Corporate Servicesand Corporate Center Services. It offers an exceptionally broad rangeof services, comprising facilities management, securities and paymentservices, the conception and implementation of complex ITprojects aswell as software development and maintenance.
Concentration on core activities. In 2002, DB Services focused evenmore strongly on the strategy of raising efficiency and reducing costs.As part of our global cost containment measures, we streamlined ourservices portfolio. Services which had no clear competitive advantage inthe market in the foreseeable future were separated from the Group. Weexpect concentration on our core activities to bring us greater flexibility,lower costs and better development opportunities for the staff con-cerned.
In July we transferred our shares in emaro, a joint venture for operationof an electronic marketplace, to our partner SAP. In November, we soldour subsidiary easycash, which offers card payment services, to GZSGesellschaft für Zahlungssysteme. With effect from the turn of the year2002/2003, we reduced our stake in Sinius, the IT service provider, to lessthan 20% by selling 50.16% to Siemens Business Services, the previousminority shareholder.
With effect from the beginning of 2003, DB Services was dissolved as anindependent unit. Its functions and staff were allocated to the Corporateand Investment Bank and Private Clients and Asset Management GroupDivisions and to the Corporate Center.
46
DB ServicesClient-focused services for Deutsche Bank and the market
2
0
4
6
8
9.0
7.2
5.5
DB Services: decreasing number of staff
in thousands at year’s end*
020100
* Full-time equivalent
Guided by market principle

Corporate Center A Group management instrument of the Board of Managing Directors
The Corporate Center supports the Board of Managing Directors in theuniform management of the Group. Important supra-divisional tasksrelate to information technology as well as to organizational and struc-tural issues. The management of Group-wide control and risk-relevantfunctions has special importance. All the respective processes are glob-ally integrated into the Corporate Divisions and closely aligned to busi-ness. This principle of operating in close contact with the market, butwith independent reporting lines, is a central element of our corporatephilosophy. The members of the Board of Managing Directors responsi-ble for the control and risk-related staff units in the Corporate Center arethe Chief Financial and Risk Officer, Chief Administrative Officer andChief Operating Officer.
Controlling, Tax and Risk Management. For the Controlling staff unit,the changeover to U.S. GAAP accounting and the stringent requirementsof the SEC, the U.S. securities and stock exchange regulator, have sub-stantially increased the reporting workload. In addition, there are alsotighter corporate governance regulations in Germany and abroad, theimplementation of which ties up considerable resources in some cases.The Tax unit advises the Corporate Divisions on tax issues relating tostructures, products and transactions. It monitors our tax positionsworldwide and ensures that our tax obligations are fulfilled.Risk Management monitors and manages the credit, market and oper-ational risks in Deutsche Bank. This task has fundamental importanceespecially in an adverse economic environment.
Audit, Legal and Compliance. Internal Audit regularly inspectsDeutsche Bank’s internal control and risk management systems andassesses its operating and business processes. For this purpose it appliesuniform standards that also satisfy regulatory requirements.The Legal unit supports the management of the bank’s legal and reputa-tion risks and coordinates cooperation with regulatory bodies, especiallythe Federal Financial Supervisory Authority. In 2002, Legal was heavilyinvolved with new corporate governance recommendations.With the help of its control system, the neutral Compliance functionmakes sure that capital market law and the standards of conduct towhich we have committed ourselves are observed.
Treasury. The Treasury staff unit is responsible for the Group-widemanagement of capital, balance sheet and liquidity and coordinates theirallocation to the Corporate Divisions. It also ensures that our regionalunits fulfil their regulatory capital requirements.
47Customers
98 99 00 01 02
5.0
6.0
7.0
8.0
9.0
High core capital ratio
BIS core capital ratio* in % at year’s end
7.8
6.3
8.1
9.6
5.9
* 98-99: IAS figures00-02: U.S. GAAP figures
Supports the Group Board

Creativity. The creativity and diversity of colleagues worldwide are a unique compet-
itive advantage. Achieving top performance in times of constant change depends on
each one of us showing adaptability, team spirit and tenacity.
Kathrin Leeb, Deutsche Bank AG, Global Corporate Finance, Frankfurt am Main
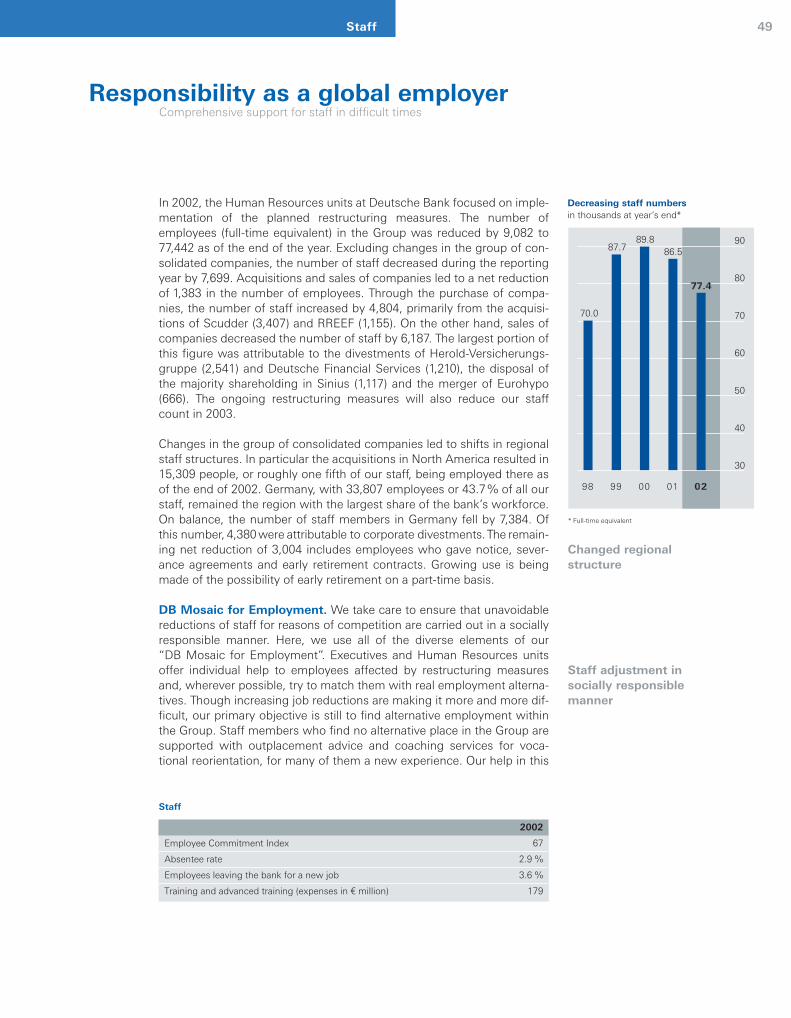
Responsibility as a global employerComprehensive support for staff in difficult times
Decreasing staff numbers
in thousands at year’s end*
0298 99 00 01
30
80
70
60
50
40
90
77.4
87.7
70.0
89.886.5
* Full-time equivalent
In 2002, the Human Resources units at Deutsche Bank focused on imple-mentation of the planned restructuring measures. The number ofemployees (full-time equivalent) in the Group was reduced by 9,082 to77,442 as of the end of the year. Excluding changes in the group of con-solidated companies, the number of staff decreased during the reportingyear by 7,699. Acquisitions and sales of companies led to a net reductionof 1,383 in the number of employees. Through the purchase of compa-nies, the number of staff increased by 4,804, primarily from the acquisi-tions of Scudder (3,407) and RREEF (1,155). On the other hand, sales ofcompanies decreased the number of staff by 6,187. The largest portion ofthis figure was attributable to the divestments of Herold-Versicherungs-gruppe (2,541) and Deutsche Financial Services (1,210), the disposal ofthe majority shareholding in Sinius (1,117) and the merger of Eurohypo(666). The ongoing restructuring measures will also reduce our staffcount in 2003.
Changes in the group of consolidated companies led to shifts in regionalstaff structures. In particular the acquisitions in North America resulted in15,309 people, or roughly one fifth of our staff, being employed there asof the end of 2002. Germany, with 33,807 employees or 43.7% of all ourstaff, remained the region with the largest share of the bank’s workforce.On balance, the number of staff members in Germany fell by 7,384. Ofthis number, 4,380were attributable to corporate divestments.The remain-ing net reduction of 3,004 includes employees who gave notice, sever-ance agreements and early retirement contracts. Growing use is beingmade of the possibility of early retirement on a part-time basis.
DB Mosaic for Employment. We take care to ensure that unavoidablereductions of staff for reasons of competition are carried out in a sociallyresponsible manner. Here, we use all of the diverse elements of our“DB Mosaic for Employment”. Executives and Human Resources unitsoffer individual help to employees affected by restructuring measuresand, wherever possible, try to match them with real employment alterna-tives. Though increasing job reductions are making it more and more dif-ficult, our primary objective is still to find alternative employment withinthe Group. Staff members who find no alternative place in the Group aresupported with outplacement advice and coaching services for voca-tional reorientation, for many of them a new experience. Our help in this
49Staff
Changed regionalstructure
Staff adjustment in socially responsible manner
Staff
2002
Employee Commitment Index 67
Absentee rate 2.9 %
Employees leaving the bank for a new job 3.6 %
Training and advanced training (expenses in ¤ million) 179

50
respect goes way beyond our contractual obligations and severance pay-ments.
To poll staff is to involve them. Structural adjustment measures, espe-cially those affecting staff, clearly influence the image that employeeshave of their employer, which largely determines their loyalty to andmotivation for the company. In 2002, we wanted a precise and realisticpicture of the mood of our staff. We therefore conducted a professional,Group-wide survey of our staff, inquiring into all the factors that couldinfluence their mood and conduct. Approximately 35,000 staff membersworldwide – or 42.6% of our total staff – voluntarily took part in thissurvey. Primarily, it revealed a gratifyingly high level of motivation andwillingness to embrace change on the part of our staff members. Theycontinue to regard Deutsche Bank as highly professional and believe inits success. On the other hand, staff members called for greater clarity in the defi-nition of each individual’s expected contribution towards achieving theGroup’s targets, greater support for personal and career developmentand closer cooperation among the Corporate Divisions. We take thesewishes very seriously and are already working on rapid and sustainableimprovements.
Diversity management as an economic factor in our success. Pro-moting diversity is part of our corporate identity, which is based on abroad definition of diversity. Our philosophy reflects our respect for eachother, openness and individual responsibility for ongoing career andpersonal development. We defined this basic view in Deutsche Bank’sown globally applied Code of Conduct. We expect every member of staffto comply with it.We want to provide for an open environment, where cultural conflicts areavoided and employees are promoted according to their performance.Our success is based on our ability to create the necessary professionalconditions for our talented staff members. To make it possible for everystaff member to develop his or her full potential, we support the need fora work-life balance. Our efforts aimed at equal opportunity in the workplace, which wererewarded for the second time with the “Total-E Quality” accolade – anaward highly esteemed in the professional world – are paying off. Theproportion of female executives, for example, has risen in the last two yearsfrom 9.4% to 14%. Our commitment to a prejudice-free work environ-ment was awarded the Max Spohr Prize by the Völklinger Kreis e.V.
Performance-based compensation promotes dedication and pro-ductivity. Deutsche Bank Group’s present staff remuneration is based ona modern compensation system. The base salary is linked to responsibili-ties and a peer comparison. In addition to base salary, there are variableearnings components linked to the results of Deutsche Bank Group and
Regional deployment of our staff
Total of 77,442* at year’s end 2002
Germany44 %
Europe(excludingGermany)27 %
NorthAmerica20 %
South America1 %
Asia/Pacific/Africa8 %
* Full-time equivalent
Highly motivatedemployees

the individual’s performance. The introduction of the “Tariff Bonus” pro-gram in Germany made it possible for the first time in 2002 to structure avariable income component for employees paid according to the tariffwage agreement and to link this component to their individual perform-ance. This portion will significantly increase as a result of the tariff wageagreement for the private-sector banking industry concluded at the endof 2002.
We considerably expanded various share-based compensation compo-nents. Staff members with high variable compensation receive a portionof their pay, not as cash, but in the form of Deutsche Bank shares.Depending on the amount of total compensation, the portion in sharescan increase to approximately 50% of the variable component. In thisway, personal performance and the development of our share price arelinked in the interests of shareholders.
Talent for the bank of tomorrow. In 2002, the bank hired 800 univer-sity graduates – from all over the world and for all Corporate Divisionsand important locations. Our user-friendly Internet website makes it pos-sible to apply online, which has simplified and accelerated the hiringprocess. In Germany, our apprentices are an important source of tomor-row’s management. To fulfil the more complex requirements of anincreasingly specialized business world, we train apprentices in six differ-ent occupations. Last year, vocational training contracts were concludedwith 938 young people. At the end of the year, Deutsche Bank Groupemployed a total of 2,407 apprentices.
Pension commitments outsourced. In December, the Board of Man-aging Directors of Deutsche Bank gave its approval to outsource thepension provisions for staff members and pensioners in Germany totaling¤ 3.9 billion and to back them with securities investments. The assetsretained to finance the pension provisions will be transferred irrevocablyto a legal, independent trustee and consequently deducted fromDeutsche Bank’s operating assets. By separating these assets and invest-ing them in a widely-diversified portfolio of securities, especially bonds,we are securing the company pension claims even more strongly thanbefore. Nevertheless, our pensioners will continue to receive their pensionpayments directly from Deutsche Bank. All Group companies remain fullyliable for their pension commitments. In outsourcing its pension obliga-tions, Deutsche Bank is adjusting to international standards. At the sametime, we are reducing our balance sheet and improving its internationalcomparability.
Length of service of our staff
Total of 83,970* at year’s end 2002
Less than 5 years43 %
5 to 14 years32 %
More than 14 years25 %
* Headcount
51Staff
Performance-based variable compensation

Energy. Trust and energy are essential if new projects are to live.
In the Deutsche Bank we have found these qualities in abundance,
and we are proud to be their partners in our journey into the 21st
century. They have enabled us both to dream and to move forward,
and we are profoundly grateful.
Sir Simon Rattle, Music Director of the Berliner Philharmoniker
and Artistic Director of the Berlin Philharmonie, Berlin

Commitment to societyOur corporate citizenship activities focus on tolerance, cultural diversity and responsibility towards society
At the dawn of the 21st century, human society faces challenges that willimpact strongly on the future. As a corporation with global operations,Deutsche Bank is involved in the search for new approaches to a sustain-able consensus. We exercise our commitment to society worldwide through foundationsand a broad range of initiatives and projects in the social, cultural, scien-tific and environmental areas. Our activities are centrally managed by theCorporate Cultural Affairs staff unit in the Corporate Center.
Tolerance and diversity. In 2002, numerous events and projects dealtwith the year’s topic “With an Open Mind – Tolerance and Diversity”. TheAlfred Herrhausen Society for International Dialogue addressed this issuein Germany and abroad in a series of discussions and publications. TheTenth Annual Colloquium in Berlin was the highlight, where 250 well-known experts from 29 countries discussed challenges facing toleranceand diversity as well as potential solutions in a global context.
Commitment to society. The Deutsche Bank Alfred Herrhausen Foun-dation Helping People to Help Themselves provided its funds and expertknowledge to the flood victims in August 2002 in Germany, Austria andthe Czech Republic: approximately 500 individual acts of assistance andover 50 charitable donations were made to hospitals, schools and kinder-gartens up to the beginning of 2003. Deutsche Bank donated a total ofmore than ¤ 5 million, some of which also went to scientific and culturalcauses in the regions affected. On top of this, individual donations fromcustomers and employees amounted to ¤ 1.5 million.The project “Youth–School–Industry” was expanded for the first time toinclude Poland, the Czech Republic and Hungary. 1,865 students at 100schools worked on 450 business-related projects integrated into their les-sons, which were then published by media partners. We initiated a newproject, “School is Cool – Making Learning More Fun” to counteract thegrowing tendency towards truancy.
53Society
National and international forums
Help given in many ways
Society1
in ¤ m. 2002
Social affairs 27.9
Culture 4.3
Society and the sciences 8.0
Environment 1.1
1 Spending by foundations and other charitable institutions related to Deutsche Bank Group, as well as project-relatedspending.

54
In Great Britain, our commitment to society also puts strong emphasison educational issues. As part of the “Enriching Curriculum Learning”project, more than 5,000 students in London were able to gather inspira-tional learning experiences by attending cultural events and workshopshosted by artists. In numerous school projects, Deutsche Bank staffmembers taught students the basics of business management and howto use electronic media. Deutsche Bank received the City of London’sDragon Award for its innovative projects in London’s disadvantagedneighborhoods. On the American continent, the Community Development Group pro-vides support to disadvantaged communities in metropolitan areas inthe form of grants, bonds and programs. The “Housing First!” projectfocused on the lack of affordable housing in New York City. The initiativeplayed a part in the City of New York’s allocation of more thanU.S.$ 3.5 billion to low-income housing projects. In Latin America, a largenumber of our employees again participated in “Initiative plus”, ourGroup-wide volunteer program, and helped make a difference in localpoverty-stricken neighborhoods in 2002. Deutsche Bank provided finan-cial support for their projects. The Deutsche Bank Africa Foundation began its activities in the reportingyear with an endowment of U.S.$ 15 million and was actively engaged ineducational, developmental and job creation projects. The most impor-tant ones in 2002 were the “Lim’unvune Entrepreneurial Assistance Pro-gramme”; the “CIDA City Campus”, a four-year scholarship program forpupils from underprivileged regions; and the “Noah project”, which caresfor AIDS orphans in family-like groups.
Art and culture. For the first time, works of art from our extensive artcollection were on display on all continents. Exhibits in Singapore, Auck-land, Mexico City and Cape Town offered different perspectives in con-temporary art. In St. Petersburg, the Hermitage presented contemporaryart from a German company’s collection for the first time with our exhibi-tion entitled “Man in the Middle”. Our “Moment”– art in public spaces –series of exhibitions continued with Karin Sanders’ “wordsearch”. With600,000 visitors, Deutsche Guggenheim Berlin was the most successfulprivate exhibition room in the German capital.Since its establishment in 1995, the Deutsche Bank Cultural Foundationhas provided support to nearly 600 projects and launched a growingnumber of its own events. Highlights in 2002 included our support for the“Picasso et les Femmes” exhibition in Chemnitz as well as the expansionof our cooperation with the Berliner Philharmoniker. As exclusive spon-sor, Deutsche Bank annually hosts the opening concert of the season aswell as concert tours in Germany and abroad. In addition, the CulturalFoundation also provides financial support to promising young musiciansstudying with the Berliner Philharmoniker’s Orchestra Academy. OurOpera Today Academy accepts 15 scholars each year and prepares themfor artistic leadership functions at opera houses.
Africa7 %
* Excluding visitors to Deutsche Guggenheim Berlin
Australia8 %
Visitors to Deutsche Bank’s
art exhibitions by continent
Total of 126,707 visitors in 2002*
America21%
Europe50 %
Asia14 %
Participation in projects
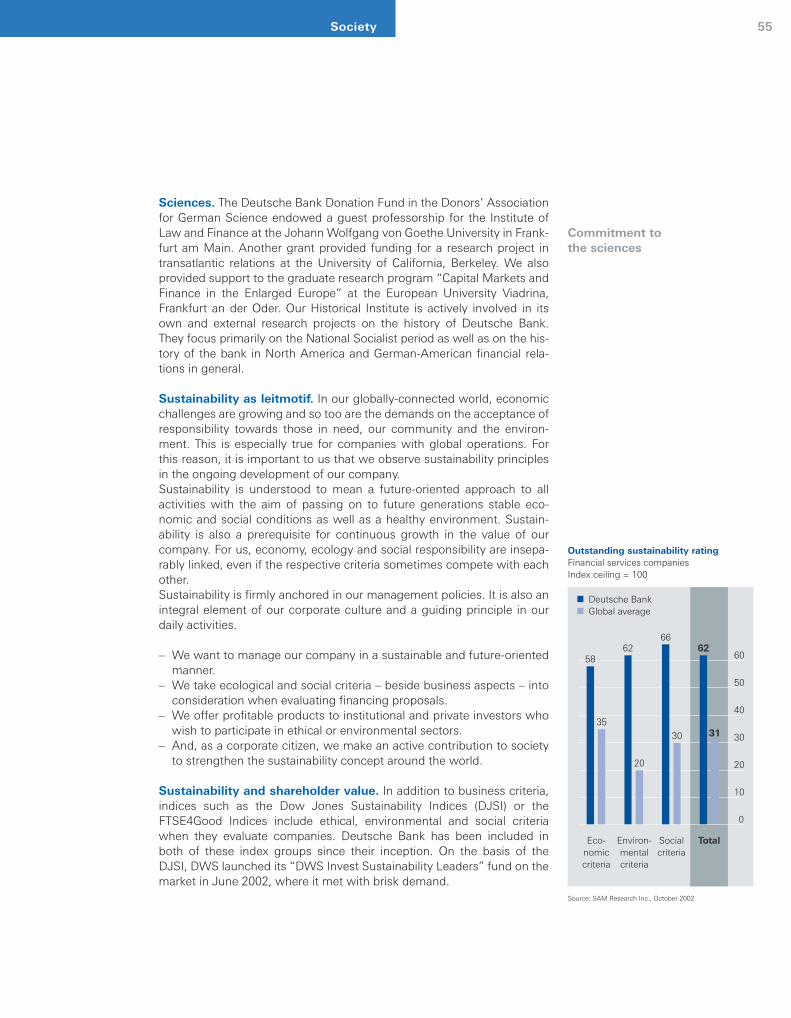
55Society
Sciences. The Deutsche Bank Donation Fund in the Donors’ Associationfor German Science endowed a guest professorship for the Institute ofLaw and Finance at the Johann Wolfgang von Goethe University in Frank-furt am Main. Another grant provided funding for a research project intransatlantic relations at the University of California, Berkeley. We alsoprovided support to the graduate research program “Capital Markets andFinance in the Enlarged Europe” at the European University Viadrina,Frankfurt an der Oder. Our Historical Institute is actively involved in itsown and external research projects on the history of Deutsche Bank.They focus primarily on the National Socialist period as well as on the his-tory of the bank in North America and German-American financial rela-tions in general.
Sustainability as leitmotif. In our globally-connected world, economicchallenges are growing and so too are the demands on the acceptance ofresponsibility towards those in need, our community and the environ-ment. This is especially true for companies with global operations. Forthis reason, it is important to us that we observe sustainability principlesin the ongoing development of our company. Sustainability is understood to mean a future-oriented approach to allactivities with the aim of passing on to future generations stable eco-nomic and social conditions as well as a healthy environment. Sustain-ability is also a prerequisite for continuous growth in the value of ourcompany. For us, economy, ecology and social responsibility are insepa-rably linked, even if the respective criteria sometimes compete with eachother. Sustainability is firmly anchored in our management policies. It is also anintegral element of our corporate culture and a guiding principle in ourdaily activities.
– We want to manage our company in a sustainable and future-orientedmanner.
– We take ecological and social criteria – beside business aspects – intoconsideration when evaluating financing proposals.
– We offer profitable products to institutional and private investors whowish to participate in ethical or environmental sectors.
– And, as a corporate citizen, we make an active contribution to societyto strengthen the sustainability concept around the world.
Sustainability and shareholder value. In addition to business criteria,indices such as the Dow Jones Sustainability Indices (DJSI) or theFTSE4Good Indices include ethical, environmental and social criteriawhen they evaluate companies. Deutsche Bank has been included inboth of these index groups since their inception. On the basis of theDJSI, DWS launched its “DWS Invest Sustainability Leaders” fund on themarket in June 2002, where it met with brisk demand.
Eco-nomiccriteria
Environ-mentalcriteria
Socialcriteria
Total
Source: SAM Research Inc., October 2002
Outstanding sustainability rating
Financial services companiesIndex ceiling = 100
Deutsche BankGlobal average
0
10
20
30
40
50
605862
6662
3130
20
35
Commitment to the sciences

56
Environmental management system. As the first major bank to do soin Germany, Deutsche Bank implemented an environmental manage-ment system based on ISO 14001 standards in 1999. As part of the exter-nal ISO certification, working procedures and system requirements areinspected annually. Certification was confirmed again in Germany in 2002and covered both operating environmental protection and our businessactivities. The latter are subject to the respective globally valid regulationsrelating to environmental protection, for example in connection withcompany and risk valuation.
Global commitment. Deutsche Bank is an active part of a network aim-ing to implement the sustainability concept wherever possible. We coop-erate with national and international partners, including non-governmen-tal organizations, government authorities and foundations. In this con-text, we view ourselves as a corporate citizen with global responsibility.We have been actively involved for many years with supra-nationalorganizations and national programs such as the United Nations Environ-ment Programme (UNEP) and Global Compact, as well as econsense –a Forum for Sustainable Development.The United Nations Global Compact initiative is dedicated to achievingglobal acceptance of standards of conduct. The standards are articulatedin nine principles focusing on human rights, labor and the environment.Deutsche Bank was one of the first companies to support this global ini-tiative, with more than 800 companies now participating. We feel wehave a duty, not only to observe these principles, but also to encourageother companies to join us in the Global Compact.We regard the Deutsche Bank Microcredit Development Fund as a goodexample of the implementation of Global Compact principles. Micro orvery small loans have proven to be most effective instruments enablingfamilies to support themselves, for example by establishing small busi-nesses, and to escape the poverty cycle. In 2002, Deutsche Bankexpanded both the financial and geographical scope of the MicrocreditDevelopment Fund. In the reporting year, the Fund’s resources made itpossible to provide loans totaling U.S.$ 45 million to approximately90,000 micro-businesses. Since the end of 2001, private investors in Ger-many and the U.K. have been able to participate in the Fund.econsense – a Forum for Sustainable Development is an initiative spon-sored by leading internationally-active German companies and organiza-tions. Its aim is to participate in a dialogue with political circles in order tocreate conditions that encourage innovation and competitiveness.
North Americaincluding the Caribbean16 %
Microcredit by region
Total of U.S.$ 45 m. at year’s end 2002
SouthAmerica11 %
Eastern Europe13 %
Asia37 %
Africa23 %
Environmentalmanagement confirmed

57
58 Management Discussion111 Introductory Note112 Board of Managing Directors in the Reporting Year113 Independent Auditors’ Report114 Income Statement115 Statement of Comprehensive Income116 Balance Sheet117 Statement of Changes in Shareholders’ Equity118 Cash Flow Statement
Notes119 [1] Significant Accounting Policies131 [2] Impact of Changes in Accounting Principles132 [3] Acquisitions and Dispositions133 [4] Trading Assets and Trading Liabilities134 [5] Securities Available for Sale 136 [6] Other Investments 140 [7] Loans141 [8] Allowances for Credit Losses142 [9] Asset Securitizations145 [10] Assets Pledged and Received as Collateral 145 [11] Premises and Equipment, Net146 [12] Goodwill and Other Intangible Assets, Net149 [13] Assets Held for Sale150 [14] Other Short-term Borrowings150 [15] Long-term Debt151 [16] Trust Preferred Securities153 [17] Obligation to Purchase Common Shares154 [18] Common Shares and Share-Based Compensation Plans162 [19] Asset Restrictions and Dividends163 [20] Regulatory Capital165 [21] Interest Revenues and Interest Expense166 [22] Trading Revenues, Net166 [23] Insurance Business167 [24] Pension and Other Employee Benefit Plans170 [25] Restructuring Activities172 [26] Income Taxes175 [27] Earnings Per Common Share176 [28] Business Segments and Related Information185 [29] International Operations 187 [30] Derivative Financial Instruments and Financial Instruments
with Off-Balance Sheet Risk191 [31] Concentrations of Credit Risk192 [32] Fair Value of Financial Instruments194 [33] Litigation195 [34] Terrorist Attacks in the United States
196 Risk Report
Due to rounding, numbers presented throughout this document may not add up precisely to the totals we provide and percentages may not precisely reflect the absolute figures.

You should read the following discussion and analysis in conjunction with theconsolidated financial statements and the related notes to them. Our consoli-dated financial statements for the years ended December 31, 2002, 2001 and2000 have been audited by KPMG Deutsche Treuhand-Gesellschaft Aktien-gesellschaft Wirtschaftsprüfungsgesellschaft.
Critical Accounting Policies
We have prepared the consolidated financial statements in this document inaccordance with U.S. GAAP. In preparing our consolidated financial statements,we make estimates and assumptions that affect the reported amount of assetsand liabilities and disclosure of contingent assets and liabilities at the date of ourconsolidated financial statements. These estimates and assumptions also affectthe reported amounts of revenues and expenses during the reporting period.Actual results may differ from those estimates. We have identified the following accounting policies as critical to the under-standing of our results of operations, since the application of these policiesrequires significant management estimation and underlying assumptions. Sinceestimating future events and their effects cannot be perceived with certainty,these estimates and assumptions could result in materially different amountsreported if conditions or underlying circumstances were to change. A criticalaccounting estimate requires management to make assumptions about mattersthat are highly uncertain at the time the accounting estimate is made. It isdependent on events remote in time that may or may not occur or it is not capa-ble of being readily calculated from generally accepted methodologies orderived with some degree of precision from available data. A critical accountingestimate also involves estimates where management could have reasonablyused another estimate in the current accounting period. An estimate could alsobe deemed critical if changes in the accounting estimate are reasonably likely tooccur from period to period and have a material impact on financial condition,changes in financial condition or results of operations. For a detailed discussionof these and other accounting policies, see Note [1] to the consolidated financialstatements.
We maintain an allowance for loan losses for exposures in our portfolio that rep-resents our estimate of probable losses in our loan portfolio. Determining theallowance for loan losses requires significant management judgments andassumptions. The components of the allowance for loan losses include a specificloss component and an inherent loss component consisting of the country riskallowance, the smaller-balance standardized homogeneous loan loss allowanceand the other inherent loss allowance. We believe that the accounting estimaterelated to the allowance for loan losses is a critical accounting estimate becausethe underlying assumptions used for both the specific and inherent loss compo-nents of the allowance can change from period to period. Such changes maymaterially affect the consolidated statement of income. The estimate for theallowance for loan losses is a critical accounting estimate for our CorporateBanking & Securities and Personal Banking Corporate Divisions.
58
Management DiscussionOperating and Financial Review and Prospects
Allowance for Loan Losses

Management Discussion
The specific loss component is the allowance for losses on loans for which man-agement believes we will be unable to collect all of the principal and interest dueunder the loan agreement. This component results in the largest portion of ourallowance and requires consideration of various underlying factors. Theseassumptions include, but are not limited to, the financial strength of our cus-tomers, the expected future cash flows, fair value of underlying collateral or themarket price of the loan. Some of the underlying factors used in determining theinherent loss component include, but are not limited to, historical loss experi-ence and political, economic and other relevant factors. Significant changes inany of these factors could materially affect the consolidated statement ofincome. For example, if our current assumptions about expected future cashflows used in determining the specific loss component differ from actual results,we may need to make additional provisions for loan losses. In addition, the fore-casted financial strength of any given customer may change due to various cir-cumstances, such as future changes in the global economy or new informationbecoming available as to financial strength that may not have existed at the dateof our estimates. This new information may require us to adjust our current esti-mates and make additional provisions for loan losses.Our provision for loan losses totaled ¤ 2.1billion, ¤ 1.0 billion and ¤ 478 million forthe year ended December 31, 2002, 2001 and 2000, respectively.For further discussion on our allowance for loan losses, see our risk report andNotes [1], [7] and [8] to the consolidated financial statements.
Certain assets, including goodwill and other intangible assets, equity methodand direct investments (including venture capital companies and nonmarketableequity securities), securities available for sale, and premises and equipment, aresubject to an impairment review. We record impairment charges when webelieve an asset has experienced an other than temporary decline in value, or itscost may not be recoverable. Future impairment charges may be required if trig-gering events occur, such as adverse market conditions, suggesting deteriora-tion in an asset’s recoverability or fair value. Assessment of timing of when suchdeclines become other than temporary and/or the amount of such impairment isa matter of significant judgement.Goodwill and other intangible assets with indefinite useful lives are tested forimpairment on an annual basis, or more frequently if events or changes in cir-cumstances indicate that the goodwill or other intangible assets may beimpaired, such as an adverse change in business climate. Impairment isrecorded if the fair value of goodwill is less than its carrying amount, or if the fairvalue of an intangible asset with an indefinite useful life is less than its carryingamount. The fair value determination used in the impairment assessmentrequires estimates based on quoted market prices, prices of comparable busi-nesses, present value or other valuation techniques, or a combination thereof,necessitating management to make subjective judgements and assumptions.Because these estimates and assumptions could result in significant differencesto the amounts reported if underlying circumstances were to change, we con-sider this estimate to be critical. As of December 31, 2002, goodwill had a carry-ing amount of ¤ 8.4 billion. Evaluation of impairment is a significant estimate formultiple divisions. During 2002, an impairment charge for goodwill wasrecorded after an assessment for impairment was made due to a change in theestimated fair value as a result of holding a significant portion of our PrivateEquity business unit for sale in our Corporate Investments Group Division. Forfurther discussion on goodwill and other intangible assets, see Note [12] to theconsolidated financial statements.
59
Impairment of Assetsother than Loans

60
Other intangible assets with finite useful lives and property, plant and equipmentare evaluated for impairment when indicators of impairment exist. If the sum ofthe undiscounted future cash flows expected to result from an asset is less thanthe reported value, an impairment must be recognized to the extent the fairvalue of the asset is less than its carrying amount. If the asset is held for sale, theimpairment charge is recorded based on the lower of the asset’s carrying valueor fair value less cost to sell. If an asset is to be disposed of by a means otherthan sale, when the asset ceases to be used a loss is recorded for any excess ofcarrying value over salvage value. For additional information on property, plantand equipment, see Note [11] to the consolidated financial statements and forfurther discussion on intangible assets, see Note [12] to the consolidated financialstatements.Equity method investments, direct investments and securities available for saleare evaluated for impairment on a quarterly basis, or more frequently if events orchanges in circumstances indicate that these investments are impaired. Forexample, indications that these investments are impaired could include specificconditions in an industry or geographical area or specific information regardingthe financial condition of the issuer, such as a downgrade in credit rating.Because this specific information may become available after we make our eval-uation, we may be required to recognize an other-than-temporary impairment inthe future. Because the estimate for other-than-temporary impairment couldchange from period to period based upon future events that may or may notoccur, we consider this to be a critical accounting estimate. If the decline in fairvalue below cost of the investment is determined to be other than temporary, animpairment loss is recognized to the extent the carrying value of the investmentexceeds fair value. Determining whether a decline in value is other than tempo-rary requires judgment. We recognized an other-than-temporary impairment forequity method investments, direct investments and securities available for salein 2002 and 2001. Securities available for sale are carried at fair value with netunrealized gains and losses included in other comprehensive income. Any unre-alized losses included in other comprehensive income are not recorded in earn-ings until the losses are realized or determined to be an other-than-temporaryimpairment. For additional information on securities available for sale, see Note [5]to the consolidated financial statements and for equity method investments anddirect investments, see Note [6] to the consolidated financial statements.
We recognize deferred tax assets and liabilities for the future tax consequencesattributable to differences between the financial statement carrying amounts ofexisting assets and liabilities and their respective tax bases, net operating losscarryforwards and tax credits. We recognize deferred tax assets subject to man-agement’s judgment based on available evidence that realization is more likelythan not and they are reduced, if necessary, by a valuation allowance to theamount that based on available evidence management believes will more likelythan not be realized. We believe that the accounting estimate related to the val-uation allowance is a critical accounting estimate because the underlyingassumptions can change from period to period. If we were not able to realize allor part of our net deferred tax assets in the future, an adjustment to our deferredtax assets would be charged to income tax expense in the period such determi-nation was made.
Deferred Tax AssetValuation Allowances

Management Discussion 61
Fair Value Estimates
We have considered future taxable income, the mix of earnings in the locationswhere we operate, and tax planning strategies in determining the need for a val-uation allowance. We could be required to increase the valuation allowance if wewere unable to generate sufficient taxable income. Our income tax provisionincluded charges related to changes in valuation allowances of approximately¤ 254 million and ¤ 286 million for the year ended December 31, 2002 and 2001,respectively. As a result of a reduction of our valuation allowance, we had anincome tax benefit of ¤ 108 million for the year ended December 31, 2000. Thesechanges were a result of reviews of the factors discussed above.
Quoted market prices in active markets are the most reliable measure of fairvalue. However, quoted market prices for certain instruments, investments andactivities, such as non-exchange traded contracts and venture capital compa-nies, may not be available.When quoted market prices are not available, derivatives and securities valuesare determined based upon discounted cash flow analysis, comparison to simi-lar observable market transactions, or the use of financial models. Discountedcash flow analysis is dependent upon estimated future cash flows and the dis-count rate used. Valuation using pricing models is dependent upon time value,yield curve, volatility factors, prepayment speeds, default rates, loss severity,current market prices and transaction prices for underlying financial instru-ments. Pricing adjustments to model or portfolio valuations consider liquidity,credit exposure, concentration risks, hedging strategies, quality of model inputs,and other factors.Where valuation of financial instruments is subjective due to the lack of observ-able market prices or inputs, management must apply judgment to make esti-mates and certain assumptions. For example, if prices or inputs to financialmodels are used for similar financial instruments, judgment is applied to makeappropriate adjustments for differences in credit risk, liquidity or other factors.Because the fair value determined may differ from actual net realizable value,this estimate is considered a critical accounting estimate. These estimates arecritical accounting estimates for our Corporate Banking & Securities CorporateDivision, which trade certain over-the-counter derivatives, some of which mayhave long terms or complex structures that are valued using financial models.Fair value estimates are also critical for our Corporate Investments Group Division, which may hold investments that are not actively traded.
Effects of German Tax Reform Legislation and Accounting for IncomeTaxes
You should note in reviewing our results of operations that the financial account-ing treatment under U.S. GAAP for income tax rate changes results in a negativeimpact on our results of operations in 2002 and 2001 and a large positive impactin 2000. These impacts totaled an expense of ¤ 2.8 billion in 2002, ¤ 995 millionin 2001 and a benefit of ¤ 9.3 billion in 2000. We therefore recommend that youalso consider our net income for 2002, 2001 and 2000 excluding the effect of theimpact of changes in income tax rates when you compare 2002, 2001 and 2000to one another and to earlier and future periods.

62
Two important tax law changes occurred in 1999 and 2000 that affected and willcontinue to affect our net income. In 1999, the German government reduced thecorporate income tax rate on retained profits from 45% to 40%. In October2000, the German government enacted comprehensive tax reform legislation.The comprehensive tax reform legislation in 2000 contained two major changesrelevant to our corporate taxation:– The corporate income tax rate declined, beginning on January 1, 2001, to 25%
for all corporate profits. Until the end of 2000, the rates were 40% for retainedprofits and 30 % for distributed profits.
– The tax rate applicable to capital gains on the sale of equity securities eligibleunder the legislation was, beginning on January 1, 2002, reduced to zero. Untilthat date, the tax rate that applied to capital gains on these sales was thesame as the tax rate applicable to ordinary income. For 2000, this tax ratechange resulted in a tax benefit of ¤ 9.0 billion.
The following is a description of the accounting treatment for these income taxrate changes and its effects on our results of operations.U.S. GAAP requires us to record all unrealized gains on available for sale securi-ties, net of the related deferred tax provisions, in other comprehensive income.The deferred tax provisions are based on the excess of the fair value of thesesecurities over our tax basis in them. At the end of each reporting period, werecord deferred tax provisions and related deferred taxes payable based on thechange in the unrealized gain for that period using the effective income tax ratewe expect will apply in the period we expect to realize the gain. Since both theunrealized gains and the related deferred tax provision are recorded in othercomprehensive income, neither the unrealized gains nor the deferred tax provi-sion affects net income in that period.U.S. GAAP also requires that, in a period that includes the date on which newtax rates are enacted, companies must adjust all of the deferred tax assets andliabilities they have recorded. These adjustments to deferred tax assets and lia-bilities reflect the new effective tax rates that will apply in the periods in whichthe temporary differences that led to the creation of the deferred items areexpected to be reversed. The changes in tax law we describe above required usto make these types of adjustments in 1999 and 2000. Because our available forsale securities include an extensive portfolio of eligible equity securities that hadappreciated substantially in value, we had a significant amount of relateddeferred tax liabilities. These deferred tax liabilities were substantially reduced asa result of this new legislation. The elimination of the German tax on the capitalgains on sales of eligible equity securities is responsible for the majority of theincome tax benefit we recognized in 2000.Most of the eligible equity securities are among our industrial holdings. Weacquired many of these industrial holdings, most of which we classify as avail-able for sale securities under U.S. GAAP, many years ago, and most of themhave appreciated in value considerably over that time. Since we intend to sellthese industrial holdings in the most tax-efficient and commercially prudentmanner possible, the estimated effective tax rate we applied to these unrealizedgains when the new tax rate changes were enacted was essentially zero. As aresult, most of the reductions in deferred tax liabilities associated with unrealizedgains on our eligible equity securities related to our industrial holdings.

Management Discussion 63
Although we recorded the deferred tax provisions directly to other comprehen-sive income for unrealized gains on available for sale securities, U.S. GAAP nev-ertheless required that this adjustment to the related deferred tax liabilities for achange in expected effective income tax rates be recorded as an adjustment ofincome tax expense in the period the tax rate change is enacted. The adjustment to deferred tax liabilities related to eligible equity securities,however, did not result in an adjustment to the deferred tax provisions that hadaccumulated in other comprehensive income. These accumulated provisionsremain in other comprehensive income until the related securities are sold, andthey are then recognized as tax expense in the period of the sale. As such, cer-tain possible effects of our accounting for income tax rate changes related to oureligible equity securities on our results of operations are as follows: – When we sell each eligible equity security, we recognize tax expense in the
period of its sale equal to that investment security’s share of the deferred taxprovisions that had accumulated in other comprehensive income on the taxrate change dates. The amount we had accumulated in other comprehensiveincome related to our eligible equity securities was approximately ¤ 3.0 billionon December 31, 2002 and ¤ 5.9 billion on December 31, 2001.
– This means that, regardless of the size of the realized gains, if any, on subse-quent sales of these eligible equity securities, there will be significant incometax expense in the periods of the sales. This expense will offset part or all ofthat gain or add to any loss when calculating net income.
– Although we have recognized in 2000 a significant deferred tax benefit as aresult of the tax rate changes related to eligible equity securities and willrecord significant deferred tax expense in the years these securities are sold,any realized gains on these securities starting in 2002 will not result in anytaxes actually payable in cash in the periods of the sales or any other time,unless the rates are changed again before we sell the securities. In otherwords, all of the deferred tax benefit and expense amounts are noncashitems. In addition, when we reverse the related deferred tax provisionsthrough the income tax expense line item, there will be no effect on our totalshareholders’ equity. This is because the deferred tax provisions, which weaccumulate in other comprehensive income, and retained earnings, where thenoncash income tax expense will have its effect, are both components ofshareholders’ equity.

64
The following table presents the level of unrealized gains and related effects inavailable for sale equity securities of DB Industrial Holdings, which held the mostpart of our portfolio of industrial holdings which reflect both the significantreductions in market prices since the effective date of the tax rate change anddispositions of industrial holdings. Since the deferred tax amount relating to thesecurities not sold has been frozen based on the level of market prices in 1999and 2000, the deferred tax amount relating to the tax rate changes in Germanycurrently exceeds the amount of related unrealized gains of the available for saleequity securities of DB Industrial Holdings.
As a consequence, the accounting for income tax rate changes related to eligi-ble equity securities may result in significant impacts on our results of opera-tions in periods in which we sell these securities. This effect is illustrated in 2002and 2001 when we sold portions of our eligible equity securities. The gainsresulting from most of these sales were not subject to tax. We reversed thedeferred taxes which had accumulated in other comprehensive income, throughDecember 31, 2000, in respect of these securities. We recognized these rever-sals as tax expense of ¤ 2.8 billion in 2002 and ¤ 995 million in 2001 even thoughthere is no tax actually payable on the gains.Neither the release of the deferred tax liability with an impact on the incomestatement nor the reversal of the offset amount in other comprehensive incomewith an impact on the income statement has an economic effect. They do notaffect the bank’s tax position vis-à-vis the tax authorities. The initial release didnot lead to a tax refund from the tax authorities and likewise, the sale and thereversal of the offset amount will not create a tax liability to the tax authorities.Neither the initial release of the deferred tax liability nor the unrealized gains andlosses from securities available for sale are included in regulatory core capitalnor in the calculation of our adjusted return on equity. The entire procedure is aU.S. GAAP specific accounting requirement. We believe that the economiceffects of the tax rate changes are not appropriately reflected in the individualperiods up to and including the period of the sale.
Significant Acquisitions and Divestitures
In December 2001, we signed agreements with Zurich Financial Services (Zurich)to acquire the greater part of Zurich’s asset management businesses (Scudder,excluding its U.K. operations) and to sell to Zurich the greater part of our insur-ance business, most of which we held through Versicherungsholding derDeutschen Bank AG (Deutscher Herold). We completed these transactions, thateffect basically our Corporate Divisions Asset Management and Personal Bank-ing, in the second quarter of 2002.
in ¤ bn. Dec 31, 2002 Dec 31, 2001 Dec 31, 2000 Dec 31, 1999
Market value 5.3 14.1 17.5 21.8
Cost 5.0 5.7 5.6 5.8
Unrealized gains in Other Comprehensive Income 0.3 8.4 11.9 16.0
Less: deferred tax relating to 1999 and 2000 tax rate changes in Germany 2.9 5.5 6.5 8.6
Other Comprehensive Income, net (2.6) 2.9 5.4 7.4

Management Discussion 65
In the second quarter of 2002, we acquired U.S.-based real estate investmentmanager RREEF. RREEF is operated as a business unit within DB Real Estate,the real estate investment management group of our Asset Management Corporate Division.In the second quarter of 2002, we sold our Banque Worms’ branches locatedoutside of Paris. In the first quarter of 2003 we sold our remaining two BanqueWorms’ branches in Paris.Following the agreement reached in 2001, in the third quarter of 2002 wemerged our mortgage bank subsidiary, EUROHYPO AG EuropäischeHypothekenbank der Deutschen Bank, with Deutsche Hypothekenbank Frank-furt-Hamburg AG and Rheinhyp Rheinische Hypothekenbank AG, which werethe respective mortgage bank subsidiaries of Dresdner Bank and Commerzbank,to form the new EUROHYPO AG. For certain purposes, other than financialreporting under U.S. GAAP, the merger had retroactive effect from January 1,2002, even though the merger of the three entities was completed and enteredinto the commercial register on August 13, 2002. After the merger, our share inthe combined entity was 34.6%, with Commerzbank taking a 34.4% share andDresdner Bank taking a 28.7% share (free-float 2.3%). In connection with themerger, in December 2002, part of our London-based real estate investmentbanking business was contributed to EUROHYPO AG. On December 31, 2002our share of the combined entity was 34.6%. Furthermore, in January 2003, partof our German commercial real estate financing activities and Dresdner Bank’sU.S.-based real estate investment banking team were transferred to the combined entity. The three transfers resulted in an increase in our share ofEUROHYPO AG to 37.6%. In regard to these transactions, we have transferred inthe first quarter 2002 the activities of our mortgage bank subsidiary from ourCorporate Division Corporate Banking & Securities to our Group Division Corpo-rate Investments.In the third quarter of 2002, we entered into an agreement with Northern TrustCorporation to sell most of our Passive Asset Management business. The closingof the sale was completed in the first quarter of 2003.In the fourth quarter of 2002, we signed definitive agreements for the sale ofsubstantial parts of our Global Securities Services business, that was combinedin our Corporate Division Global Transaction Banking, to State Street Corpora-tion. The transaction closed in the first quarter of 2003.In the fourth quarter of 2002, we sold our commercial finance business ofDeutsche Financial Services, that was part of our Group Division CorporateInvestments, to GE Commercial Finance and our consumer finance business ofDeutsche Financial Services to E*TRADE Bank.In the fourth quarter of 2002, we signed an agreement with IBM Business Ser-vices (IBM BS) pursuant to which we will outsource our German Private Clientsand Asset Management (PCAM) Information Technology/Infrastructure (IT/I)data centers, continental European server sites and DWS Europe computer cen-ters to IBM BS. The contract is for a ten-year period. Under the agreement, IBMBS will provide us with a wide range of technology services. Pursuant to theagreement, effective February 1, 2003, we transferred our PCAM IT/I business,including the respective human resources and controlling groups as well asrelated infrastructure functions, to IBM BS. Upon this transfer, approximately900 staff left the company and joined their new employer IBM BS.

66
In February 2003, we signed an agreement with Zurich Financial Services toacquire Rüd, Blass & Cie AG Bankgeschäft, a private Swiss bank. The trans-action, that will strengthen our expertise in the Private Wealth Management, issubject to regulatory approval.In November 2002, we entered into exclusive negotiations with the manage-ment team of DB Capital Partners regarding the sale of our late-stage privateequity portfolio. The sale was completed in February 2003. We will retain a 20%interest in the portfolio.In February 2003, we announced the simultaneous sale of two prime City ofLondon real estate investments. We have entered into agreements with TheBritish Land Company PLC for the sale of the long leasehold (999 years) of1Appold Street and with KanAm grundinvest Fonds for our 55% interest in Win-chester House. We will remain in occupancy of these properties for a minimumof 15 years.
Operating Results
You should read the following discussion and analysis in conjunction with theconsolidated financial statements.
The following table presents our condensed consolidated statement of incomefor 2002, 2001 and 2000:
Overview
in ¤ m. 2002 2001 2000
Net interest revenues 7,186 8,620 7,028
Provision for loan losses 2,091 1,024 478
Net interest revenues after provision for loan losses 5,095 7,596 6,550
Commissions and fee revenues 10,834 10,727 11,693
Trading revenues, net 4,024 6,031 7,625
Other noninterest revenues 4,503 4,163 8,133
Total noninterest revenues 19,361 20,921 27,451
Total net revenues 24,456 28,517 34,001
Compensation and benefits 11,358 13,360 13,526
Goodwill amortization/impairment 62 871 771
Restructuring activities 583 294 125
Other noninterest expenses 8,904 12,189 12,710
Total noninterest expenses 20,907 26,714 27,132
Income before income tax expense (benefit) and cumulativeeffect of accounting changes 3,549 1,803 6,869
Income tax expense 372 434 2,643
Income tax expense (benefit) from the change in effectivetax rate and the reversing effect1 2,817 995 (9,287)
Income before cumulative effect of accounting
changes, net of tax 360 374 13,513
Cumulative effect of accounting changes, net of tax2 37 (207) –
Net income1, 2 397 167 13,513
1 Income tax expense of ¤ 2.8 billion in 2002, income tax expense of ¤ 995 million in 2001 and ¤ 9.3 billion of income tax benefit in 2000resulted from changes in effective tax rates pursuant to German tax law and the reversing effect. We describe these changes and theireffects above in “Effects of German Tax Reform Legislation and Accounting for Income Taxes”. The next table presents these figuresexcluding these effects.
2 In 2002 and 2001, these figures reflect the cumulative effect of changes in accounting principle. We describe these changes and theireffects on our Consolidated Statement of Income below in “Cumulative Effect of Accounting Changes”.

The following table shows our net income excluding cumulative effects ofaccounting changes and the effects of the tax rate changes we describe above:
In 2002 our net income was ¤ 397 million, which includes tax expense of ¤ 2.8billion due to the reversal of tax benefits recorded in prior years for the effect ofchanges in German tax law. The cumulative effect of accounting changesincreased net income by ¤ 37 million. Net income was ¤ 167 million in 2001,including tax expense of ¤ 995 million representing the reversal of tax benefitsrecorded in prior years for the effect of German tax law changes. Net income in2001 was further reduced by the ¤ 207 million cumulative effect of accountingchanges. Excluding the effect of tax law changes in both years, net income in 2002 and 2001 would have been ¤ 3.2 billion and ¤ 1.2 billion, respectively.Further, excluding the cumulative effect of accounting changes in both years,net income would have been ¤ 3.2 billion in 2002 and ¤ 1.4 billion in 2001.Net income in 2000 was ¤ 13.5 billion and included a benefit from those Germantax law changes of ¤ 9.3 billion. Excluding this effect the net income in 2000would have been ¤ 4.2 billion. There was no cumulative effect of accountingchanges in 2000.Basic earnings per share were ¤ 0.64 in 2002, as compared to ¤ 0.27 in 2001 and¤ 22.00 in 2000.
Our net interest revenues in any period depend primarily on the following:– the amounts and kinds of assets and liabilities we have, and the kinds of
revenues they generate and expenses they incur; – general levels of and movements in interest rates; and – to a lesser extent, movements in exchange rates.
2002 2001 2000
Per Share Per Share Per Sharein ¤ m. (except per share amounts) (basic) (basic) (basic)
Net income 397 ¤ 0.64 167 ¤ 0.27 13,513 ¤ 22.00
Cumulative effect of accounting changes, net of tax (37) ¤ (0.06) 207 ¤ 0.33 – –
Income tax expense (benefit) from the change in effective tax rate and the reversing effect 2,817 ¤ 4.58 995 ¤ 1.61 (9,287) ¤ (15.12)
Net income before accounting changes and the
effect of tax rate changes 3,177 ¤ 5.16 1,369 ¤ 2.21 4,226 ¤ 6.88
Net Interest Revenues
Management Discussion 67

68
The following table sets forth data relating to our net interest revenues:
Net interest revenues were ¤ 7.2 billion in 2002, a decrease of ¤ 1.4 billion, or17%, as compared to 2001. Our net interest revenues were ¤ 8.6 billion in 2001,an increase of ¤ 1.6 billion, or 23%, as compared to 2000. Our net interest spreadincreased by 29 basis points whereas our net interest margin decreased by6 basis points in 2002, after both increased in 2001. The decrease in net interest revenues in 2002 occurred because, while both ourinterest revenues and our interest expense decreased, the decrease in interestexpense was smaller. The overall decline in net interest revenues is due to anumber of factors. Dividends received, primarily on our securities available forsale portfolio, decreased by ¤ 644 million. The principal reasons for the declineare the sale of most of our insurance business in the second quarter of 2002, themerger of our mortgage bank subsidiary EUROHYPO with the mortgage banksubsidiaries of Dresdner Bank AG and Commerzbank AG in the third quarter of2002 and the sale of our European asset finance and leasing business in the sec-ond quarter 2001. In 2001, by contrast, a year in which interest revenues andinterest expense as well decreased compared to 2000, the decrease in our inter-est revenues was exceeded by the decrease in interest expense.We believe that the change in our mix of businesses is the single most importantfactor driving the general development of net interest revenues, net interest mar-gin and net interest spread during recent years. In 2002, for example, we soldmost of our insurance business and merged our mortgage bank subsidiary. Wehave experienced a continuing shift in the mix of our business towards invest-ment banking activities, including trading, and asset management. These busi-nesses not only generate noninterest revenues, such as trading revenues andcommissions and fee revenues, but they also generate related net interest rev-enues. Trading assets, for example, produce both interest income and tradingrevenues, and our costs of trading liabilities and other funding of the tradingassets include both interest and noninterest expenses. As we have changed ourasset and liability structure to emphasize our trading businesses, we havebecome less focused on earnings from net interest revenues or net trading rev-enues in isolation. We instead manage our business by reference to the totalrevenues our trading portfolio generates, including interest and noninterest rev-enues, and our total costs of carrying them, including interest and noninterestexpenses. The proportion of interest and noninterest revenues and expenses ourtrading portfolio generates in any period is a function of market conditions, theopportunities available to our trading units and the strategies they adopt andinstruments they use in response. To give you what we believe is a more
in ¤ m. (except percentages) 2002 2001 2000
Net interest revenues 7,186 8,620 7,028
Average interest-earning assets1 781,134 877,727 898,514
Average interest-bearing liabilities1 729,643 783,710 815,867
Gross interest yield2 4.58% 6.11% 6.14%
Gross interest rate paid3 3.92% 5.74% 5.90%
Net interest spread4 0.66% 0.37% 0.24%
Net interest margin5 0.92% 0.98% 0.78%
1 Average balances for each year are calculated based upon month-end balances.2 Gross interest yield is the average interest rate earned on our average interest-earning assets.3 Gross interest rate paid is the average interest rate we paid on our average interest-bearing liabilities.4 Net interest spread is the difference between the average interest rate earned on average interest-earning assets and the average interest
rate paid on average interest-bearing liabilities.5 Net interest margin is net interest revenues expressed as a percentage of average interest-earning assets.

Management Discussion 69
comprehensive indication of the performance of our trading businesses, wepresent our trading related interest revenues and expenses together with ourother trading revenues and expenses below under “Trading revenues, net”.The development of our net interest revenues is also influenced to a significantextent by the accounting treatment of some of our derivatives transactions. Weenter into nontrading derivative transactions as economic hedges of the interestrate risks of our nontrading assets and liabilities. Some of these derivatives qual-ify as hedges for accounting purposes while others do not. When derivativetransactions qualify as hedges for accounting purposes, the interest arising fromthe derivatives appear in interest revenues and expense, where they compen-sate the interest flows from the assets and liabilities they are intended to hedge.When derivatives do not qualify for hedge accounting treatment, the interestflows that arose from the derivatives during any period all appear in trading rev-enues for that period. Nontrading derivative transactions that did not qualify forhedge accounting treatment produced net interest cash flows, which weincluded in trading revenues, of ¤ 360 million in 2002, ¤ 259 million in 2001 and¤ 105 million in 2000. The following table shows our net interest revenues including the interest onnontrading derivatives not qualifying for hedge accounting treatment:
Had these transactions all qualified as hedges, our net interest revenues wouldhave decreased ¤ 1.3 billion between 2001 and 2002, rather than decreasing ¤ 1.4billion, as we report; and our net interest revenues would have increased ¤ 1.7 bil-lion between 2000 and 2001, rather than increasing ¤ 1.6 billion as we report.Before 2001, many of our derivative transactions did not qualify as hedges foraccounting purposes because we did not, at the time we entered into them, doc-ument them contemporaneously in the manner U.S. GAAP require for them toqualify. While we adopted SFAS 133 beginning in 2001 such that some of thesederivative transactions qualify as hedges for accounting purposes, we continue toenter into derivative transactions that, while intended as economic hedges, donot qualify for hedge accounting treatment. The accounting may result in differ-ences in gain and loss recognition on the nonqualifying derivatives and the under-lying hegded items. However, over the lifetime of the transactions, the gains andlosses on the nonqualifying derivatives and underlying transactions offset.As a result of the continued change of our mix of businesses our trading portfo-lio became the largest single category of our interest-earning assets, accountingfor 33% of our total average interest-earning assets in 2002. Our loan portfolio,however, which accounted for 29% of our total average interest-earning assetsin the same period, is still the largest single contributor to our interest revenueswith ¤ 11.7 billion, or 33%, of total interest revenues. Our loans earned an aver-age yield in 2002 of 115 basis points below that of 2001 as interest rates declinedconsiderably in our major markets, particularly in the U.S. In 2001, when interestrates had already declined substantially, the average yield earned on our loanportfolio was 21 basis points lower than in 2000.The changing mix of our business, together with the effects of our accountingfor derivatives transactions, account for most of the movements in our net inter-
in ¤ m. 2002 2001 2000
Net interest revenues 7,186 8,620 7,028
Interest from nonqualifying derivatives(included in trading revenues) 360 259 105
Net interest revenues including interest from
nonqualifying derivatives 7,546 8,879 7,133

70
est revenues. However, interest rates and exchange rates were also contributors.As noted above, interest rates decreased in our major markets in 2002 and 2001,particularly in the United States and to a lesser extent in Germany and the othereuro zone countries as well as the United Kingdom. In 2000, by contrast, interestrates in our major markets increased, particularly in the United States, Germanyand in the other euro zone countries. The euro declined against the U.S. dollarand other major currencies in the first years after its introduction and thenremained in a fairly narrow band during 2001. During 2002, however, the eurogained strength and increased to beyond parity levels against the U.S. dollar. Wecannot quantify the impacts of each of these factors, but we believe that theyhad considerably less impact on net interest revenues than did our changing mixof businesses.
Interest Revenues. The table below sets forth a breakdown of our interest revenues for 2002, 2001 and 2000:
in ¤ m. 2002 2001 2000
Interest on interest-earning deposits in other banks
In German offices 335 788 472In non-German offices 1,134 2,124 1,831
Total 1,469 2,912 2,303
Interest on central bank funds sold and securities
purchased under resale agreements
In German offices 587 628 746In non-German offices 5,992 7,598 7,261
Total 6,579 8,226 8,007
Interest on securities borrowed
In German offices 5 179 20In non-German offices 2,804 5,148 6,624
Total 2,809 5,327 6,644
Interest and dividend income on securities available
for sale and other investments
In German offices 1,066 2,728 2,175In non-German offices 576 983 1,181
Total 1,642 3,711 3,356
Interest on loans
In German offices 7,152 9,781 10,742In non-German offices 4,589 7,838 9,395
Total 11,741 17,619 20,137
Interest on trading assets
In German offices 1,744 3,035 3,008In non-German offices 9,634 12,536 11,431
Total 11,378 15,571 14,439
Other interest revenues 163 273 245
Total interest revenues 35,781 53,639 55,131

Management Discussion 71
Our total interest revenues decreased ¤ 17.9 billion, or 33%, between 2002 and2001. Our reduced interest revenues were in part due to a reduction of our inter-est-earning assets but primarily due to lower interest rates. The following are theprimary categories of interest-earning assets that caused the decline: – Interest on loans decreased ¤ 5.9 billion, or 33%, in 2002, as compared to
2001, resulting in almost equal parts from a 18% decrease in our average bal-ance of loans and reduced yields. This decrease in loans was mainly due tothe merger of our mortgage bank subsidiary in the third quarter of 2002,which reduced our average loan portfolio by ¤ 24 billion. The average yield onour loans decreased further to 5.14% in 2002 from 6.29% in 2001.
– Interest on trading assets decreased by ¤ 4.2 billion, or 27%, in 2002 as com-pared to 2001. While the average volume of interest-earning assets we held inour trading portfolio outside Germany increased slightly, the total averageyield decreased substantially to 4.47 %, down by 195 basis points comparedto 2001.
– Interest on securities borrowed decreased ¤ 2.5 billion, or 47%, between2002 and 2001. The decrease was primarily the result of a 193 basis pointsdecrease in yields outside Germany representing generally reduced interestrates, along with a 25% reduction in total average volume.
– Interest and dividend income on securities available for sale and other invest-ments decreased by ¤ 2.1 billion, or 56%, in 2002 as compared to 2001,mostly due to lower average volumes in Germany. This decline was largely theresult of the disposal of most of our insurance business and the merger of ourmortgage bank subsidiary, both of which had significant investments in thesesecurities. In addition, we had further sales of our industrial holdings. Lowerdividend income, primarily on our reduced industrial holdings, was the mainreason for a 93 basis points decline of our average yield to 2.98%.
Our total interest revenues decreased ¤ 1.5 billion, or 3%, between 2000 and2001. The following are the primary categories of interest-earning assets thataffected total interest revenues:– Interest on loans decreased ¤ 2.5 billion or 13% in 2001, as compared to 2000.
This resulted primarily from a 10% decrease in our average balance of loans.Almost 90% of the decline in the average balance of loans occurred outsideGermany. Our average yield on our loans decreased only slightly from 6.50%in 2000 to 6.29% in 2001. Much of the decrease in our loan portfolio related toshorter-term credit we extended ancillary to other businesses outside Ger-many. In our domestic market, average loan volume remained basicallyunchanged and the interest yield on these loans declined to 6.00% in 2001, ascompared to 6.45% in 2000, in line with the overall decrease in market rates.
– Interest on securities borrowed decreased ¤ 1.3 billion in 2001 as compared to2000. The decrease was the result of an 17% decrease in the average balanceof these assets, particularly as a result of the general conditions in the equitiesmarkets, which led to less business activities. We continued to conduct thisbusiness predominantly outside Germany.
– Interest on trading assets increased ¤ 1.1 billion, or 8%, between 2001 and2000, due to the higher average volume of interest-earning assets we held inour trading portfolio outside Germany.
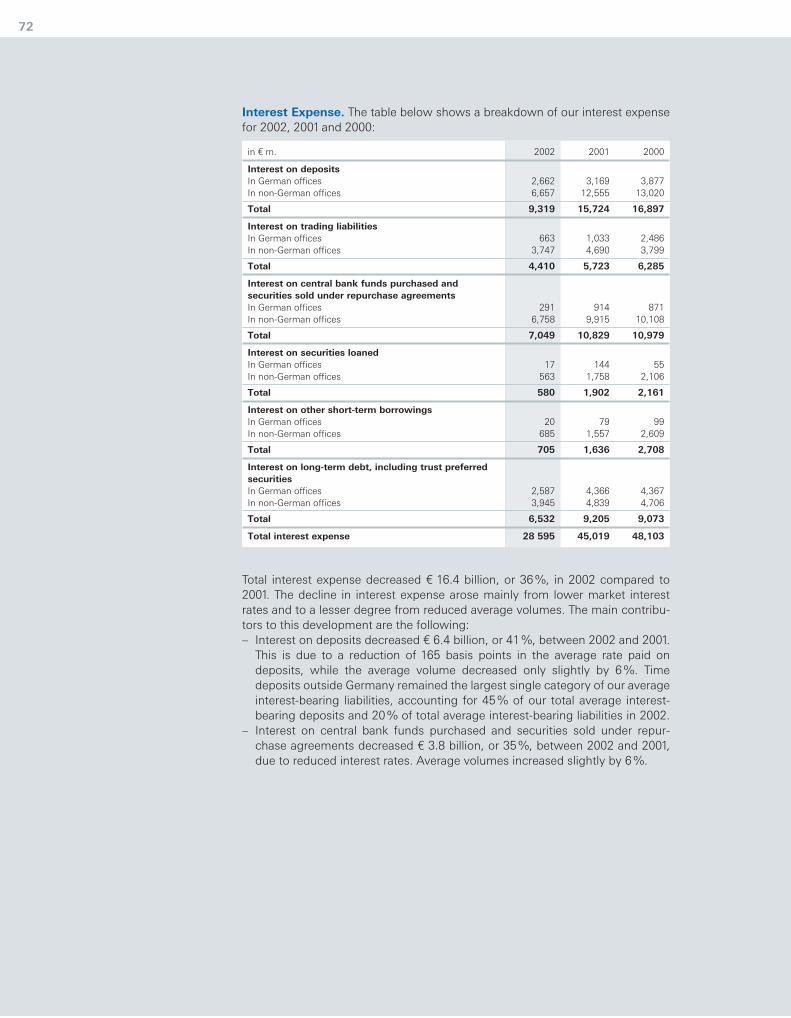
72
Interest Expense. The table below shows a breakdown of our interest expensefor 2002, 2001 and 2000:
Total interest expense decreased ¤ 16.4 billion, or 36%, in 2002 compared to2001. The decline in interest expense arose mainly from lower market interestrates and to a lesser degree from reduced average volumes. The main contribu-tors to this development are the following:– Interest on deposits decreased ¤ 6.4 billion, or 41%, between 2002 and 2001.
This is due to a reduction of 165 basis points in the average rate paid ondeposits, while the average volume decreased only slightly by 6%. Timedeposits outside Germany remained the largest single category of our averageinterest-bearing liabilities, accounting for 45% of our total average interest-bearing deposits and 20% of total average interest-bearing liabilities in 2002.
– Interest on central bank funds purchased and securities sold under repur-chase agreements decreased ¤ 3.8 billion, or 35%, between 2002 and 2001,due to reduced interest rates. Average volumes increased slightly by 6%.
in ¤ m. 2002 2001 2000
Interest on deposits
In German offices 2,662 3,169 3,877In non-German offices 6,657 12,555 13,020
Total 9,319 15,724 16,897
Interest on trading liabilities
In German offices 663 1,033 2,486In non-German offices 3,747 4,690 3,799
Total 4,410 5,723 6,285
Interest on central bank funds purchased and
securities sold under repurchase agreements
In German offices 291 914 871In non-German offices 6,758 9,915 10,108
Total 7,049 10,829 10,979
Interest on securities loaned
In German offices 17 144 55In non-German offices 563 1,758 2,106
Total 580 1,902 2,161
Interest on other short-term borrowings
In German offices 20 79 99In non-German offices 685 1,557 2,609
Total 705 1,636 2,708
Interest on long-term debt, including trust preferred
securities
In German offices 2,587 4,366 4,367In non-German offices 3,945 4,839 4,706
Total 6,532 9,205 9,073
Total interest expense 28 595 45,019 48,103
Management Discussion 73
– Interest on long-term debt, including trust preferred securities decreased¤ 2.7 billion, or 29 %, from 2001 to 2002. The average volume of long-termdebt decreased by 12%, largely due to the merger of our mortgage bank sub-sidiary which reduced our average long-term debt by ¤ 28 billion, while thetotal average rate paid decreased by 112 basis points to 4.54% in 2002.
– Interest on securities loaned decreased by ¤ 1.3 billion, or 70%, from 2001 to2002, due to significantly lower average volumes and interest rates. The aver-age rate paid declined by 273 basis points to 5.09%.
– Interest on trading liabilities decreased ¤ 1.3 billion, or 23%, between 2002and 2001, mainly due to reduced costs to carry our short positions in securi-ties. The majority of this business was carried out in trading portfolios we heldoutside Germany, therefore, 79% of total average trading liabilities and 85%of related interest expense was incurred outside Germany.
Our total interest expense decreased ¤ 3.1 billion, or 6%, between 2000 and2001. The major contributors to the variance were the following: – Interest on other short-term borrowings decreased ¤ 1.1 billion, or 40%, from
2000 to 2001. The decrease occurred in our non-German offices, with 69% ofthis decrease attributable to the lower average rate of 4.51%, as compared to6.98% in 2000, and 31 % from reduced borrowing activities.
– Interest on deposits decreased ¤ 1.2 billion, or 7%, in 2001 compared to 2000.This decrease arose from a reduction of 94 basis points in the average ratepaid on time deposits, while there was a relatively stable average volumecompared to 2000. Time deposits outside Germany were the largest singlecategory of our average interest-bearing liabilities, representing 53% of totalaverage interest bearing deposits and 24% of average total interest-bearingliabilities in 2001.
– Interest on trading liabilities decreased ¤ 562 million, or 9%, in 2001 as com-pared to 2000, largely due to decreased short positions in securities. On aver-age during 2001, we held 81% of these liabilities in our trading businessesoutside Germany and 82% of the related interest expense was incurred out-side Germany.
– Interest on long-term debt, including trust preferred securities increased ¤ 132million, or 1%, in 2001 compared to 2000 due to an increased volume of long-term debt issued to replace shorter-term funding, while the average rate paiddecreased from 6.04 % in 2000 to 5.66% in 2001.

74
Our provision for loan losses consists of changes to the allowances we carry forcredit losses on loans. The allowance consists of a specific loss component,which relates to specific loans, and an inherent loss component. The inherentloss component consists of a country risk allowance, an allowance for smaller-balance homogeneous loans and an other inherent loss component to coverlosses in our loan portfolio which we have not otherwise identified. Our provision for loan losses in 2002 was ¤ 2.1 billion, an increase of 104% fromthe prior year. This amount is composed of both net new specific and inherentloan loss provisions. The provision for the year was primarily due to provisionsraised to address the downturn in the telecommunications industry and specificloan loss provisions reflecting the deterioration in various industry sectors repre-sented in our German portfolio and the Americas. The inherent loss provision was ¤ 195 million in 2002, an increase of ¤ 55 million,as compared to 2001. This increase was partly offset by a ¤ 54 million reductionof country risk provisions. In 2002 we refined the measure for calculating ourother inherent loss allowance to make our overall provision more sensitive to theprevailing credit environment and less based on historical experience.The provision for loan losses was ¤ 1.0 billion in 2001, an increase of ¤ 546 mil-lion, or 114%, over the ¤ 478 million recorded in 2000. The 2001 provision wascomposed of net new specific loan loss provisions and other inherent loss provi-sions, offset in part by net reductions of country risk provisions. Our total netnew specific loan loss provision amounted to ¤ 951million in 2001and ¤ 805 mil-lion in 2000. Most of this increase was due to less favorable economic condi-tions in the last quarter of 2001. In that final quarter we increased our specificloan loss provisions in connection with a single U.S. borrower in the utility sec-tor and various Argentine exposures and on our leveraged and structuredfinance activities.
Our noninterest revenues were ¤ 19.4 billion in 2002, a decrease of ¤ 1.6 billion,or 7%, as compared to ¤ 20.9 billion reported in 2001.The primary driver behind the decline in noninterest revenues was the continuedweakness of the financial markets in 2002. This was the principal factor in a ¤ 2.0billion, or 33% decline in trading revenues, net. Equities trading, with a net trading gain of ¤ 62 million, was ¤ 1.5 billion below last year.
in ¤ m. 2002 2001 2000
Commissions and fee revenues 10,834 10,727 11,693
Trading revenues, net 4,024 6,031 7,625
Insurance premiums 744 2,717 2,837
Net gains on securities available for sale 3,523 1,516 3,670
Other noninterest revenues 236 (70) 1,626
Total 19,361 20,921 27,451
Noninterest Revenues
Provision for LoanLosses

Management Discussion 75
Another driver behind the decline in our noninterest revenues in 2002 was thedecrease in our insurance premiums resulting from the sale of most of our insur-ance business, including our subsidiaries in Germany, Spain, Italy, and Portugal,to Zurich Financial Services. However, this decline was largely offset by a relateddecline in policyholder benefits and claims which is included in noninterestexpenses. Net gains on securities available for sale increased by ¤ 2.0 billion due to netgains on sales from our industrial holdings portfolio. Our noninterest revenues were ¤ 20.9 billion in 2001, a decrease of ¤ 6.5 billion,or 24%, as compared to the ¤ 27.5 billion reported in 2000. The primary driver behind the decline in noninterest revenues was the weaknessof the financial markets in 2001 which deteriorated further after the terrorist actsof September 11. Specifically, deteriorating securities prices led to a reduction inour results, we made lower revenues in businesses where our commissions orfees are based on the value of the client assets managed or on our performancein managing them, and we had reduced customer transaction volumes in manyof our businesses.
Commissions and Fee Revenues. The following table shows the principal components of our commissions and fee revenues in 2002, 2001 and 2000:
Commissions and fees from fiduciary activities were ¤ 3.9 billion in 2002, anincrease of ¤ 389 million, or 11%, as compared to 2001 which was primarily dueto an increase in commissions for assets under management, primarily becauseof the acquisition of Scudder business in the second quarter of 2002.Commissions and fees from fiduciary activities amounted to ¤ 3.5 billion in 2001,a decrease of ¤ 371 million, or 9%, as compared to 2000, which was primarilydue to lower management and performance fees in asset management, offset inpart by increased commissions for administration. Underwriting and advisory fees amounted to ¤ 1.7 billion in 2002, unchangedcompared with 2001.
in ¤ m. 2002 2001 2000
Commissions and fees from fiduciary activities
Commissions for administration 632 643 466
Commissions for assets under management 3,214 2,798 3,222
Commissions for other securities business 80 96 220
Total 3,926 3,537 3,908
Commissions, broker’s fees, markups on securities
underwriting and other securities activities
Underwriting and advisory fees 1,743 1,744 2,157
Brokerage fees 2,576 2,813 3,013
Total 4,319 4,557 5,170
Fees for other customer services 2,589 2,633 2,615
Total commissions and fees 10,834 10,727 11,693

76
Underwriting and advisory fees decreased by ¤ 413 million, or 19%, to ¤ 1.7 bil-lion in 2001 from the ¤ 2.2 billion we earned in 2000. The slowdown in capitalmarkets activity that began in the first half of 2000 continued through 2001, andcaused lower activities in our issuing and advisory business. Brokerage fees amounted to ¤ 2.6 billion in 2002, a decrease of ¤ 237 million, or8%, as compared to 2001. This decrease is a result of lower transaction volumesdue to the continued weak financial market conditions.Brokerage fees were ¤ 2.8 billion in 2001, a decrease of ¤ 200 million, or 7% ascompared to 2000, as weak financial market conditions caused significant customer restraint and brokerage transaction volume declined.
Trading Revenues, Net. We account for our trading activities on a fair valuebasis. Trading revenues as reported in our Consolidated Statement of Incomeinclude both realized and unrealized gains and losses on the positions we hold inour trading portfolio and net interest revenues on derivatives we hold for tradingpurposes. For the components of our trading portfolio, see Note [22] to the consolidated financial statements.Our trading revenues were ¤ 4.0 billion in 2002, a decrease of ¤ 2.0 billion, or33%, as compared to 2001. The substantially lower trading revenues weremainly due to the continued difficult market environment, the effect of a singleblock trade and lower hedge gains on our industrial holdings.Trading revenues were ¤ 6.0 billion in 2001, a decrease of ¤ 1.6 billion, or 21%,between 2001 and 2000. The decrease in trading revenues was partially due toequity market conditions, which started to deteriorate late in 2000 and thereforeled to lower transaction volume in equities trading. This was partly compensatedby the impact of derivatives we entered into for nontrading purposes, but whichdid not qualify for hedge accounting treatment.Our trading businesses generates revenues and expense streams that are partlyoutside trading revenues, net because:– Interest income on trading assets is included in interest revenues;– Interest expense on trading liabilities is included in interest expense; and– The cost or benefit of funding our net trading positions appears in either inter-
est revenues or interest expense in our consolidated statement of income.
Therefore, we believe that you should consider more than our net trading rev-enues according to U.S. GAAP to assess the performance of our trading opera-tions. As we note above under “Net Interest Revenues”, market conditions,changing opportunities and our trading units’ responses to them lead tochanges in the composition of our trading inventories, which in turn causechanges from period to period in the mix of revenues and expense our tradingactivities generate. In 2002, for example, we continued to focus on fixed incomerelated trading positions and reduced equity trading inventories, despite difficultconditions in all market segments, therefore incurring a mix of revenues andexpense containing a higher proportion of interest. Accordingly, we manage ourtrading business on a measure we call “trading performance”. This measure isnot provided for in U.S. GAAP, and, because we may calculate it in a differentmanner than other companies who may report similarly named measures, wediscourage you from comparing it to any measures other companies reportwithout analyzing how they calculate these measures.

Management Discussion 77
The following tables and narrative indicate how we arrive at trading perform-ance.First, we calculate a measure we call “net trading related interest”. Net tradingrelated interest includes the following elements:– Interest revenues from our trading assets;– Interest expense from our trading liabilities;– Interest expense and interest revenues representing the funding cost or
benefit associated with our trading positions; and– Adjustment for net interest revenues from nontrading derivatives that do not
qualify for hedge accounting treatment.
We calculate the funding cost or benefit continuously based on identifiabletransactions which directly fund the positions, to the extent there are identifiabletransactions, and on the basis of the average cost or benefit across our averagebalances of trading assets and liabilities, and their corresponding market fundingrates.We adjust trading revenues for net interest revenues from nontrading derivativesthat do not qualify for hedge accounting treatment. Had these transactions qual-ified as hedges for accounting purposes, the net interest cash flows associatedwith them would have been reported as net interest revenues.The following table shows the components of net trading related interest. Asinterest revenues on our trading assets, interest expenses on our trading liabili-ties and the funding cost/benefit are included in net interest revenues, the tableindicates the total of these items as “trading related interest” before adjustmentfor the net interest revenues from nontrading derivatives that do not qualify forhedge accounting treatment (nonqualifying derivatives).
in ¤ m. 2002 2001 2000
Interest revenues on trading assets 11,378 15,571 14,439
Interest expense on trading liabilities 4,410 5,723 6,285
Funding cost 4,788 8,204 8,188
Trading related interest
(included in net interest) 2,180 1,644 (34)
Interest from nonqualifying derivatives(included in trading revenues) (360) (259) (105)
Net trading related interest 1,820 1,385 (139)

The following table combines trading revenues according to U.S. GAAP with thenet trading related interest to arrive at our measure of trading performance:
In 2002, our trading performance decreased by ¤ 1.6 billion, or 21 %, as com-pared to 2001. The prevailing difficult market environment during 2002 led to theoverall weaker performance. However, all trading areas generated significantpositive results. Equity trading performance was ¤ 549 million, a decline of 74%,between 2002 and 2001. Results in 2002 included the negative effect of a singleblock trade. Interest and credit trading performance decreased ¤ 373 million, or11%, in the same period. Performance in our foreign exchange, metals and com-modity trading declined only slightly to ¤ 1.2 billion in 2002, reflecting our strongmarket position in foreign exchange trading. Other trading performanceincreased by ¤ 480 million due to increased revenues in Emerging Markets busi-ness and higher revenues relating to derivatives on our own shares. In addition,other trading performance included ¤ 488 million gains from derivative transac-tions entered into for nontrading purposes, but not qualifying for hedge account-ing. This represented a decrease of ¤ 198 million over the ¤ 686 million recognizedin 2001. The gains recorded in 2002 included ¤ 144 million hedge gains on ourindustrial holdings. The majority of the remaining amount was due to gains sub-sequent to the early curtailment of nonqualifying hedge structures and gains onnonqualifying hedges of instruments also recorded at fair value.Our trading performance decreased by ¤ 70 million, or 1%, in 2001 as comparedto 2000. Our performance in equity trading in particular suffered from theadverse market conditions and decreased by ¤ 677 million, or 25%. On the otherhand, however, a number of trading businesses achieved revenue growthdespite the difficult environment in 2001, compensating for the decline in equi-ties. Interest and credit related trading performance increased by ¤ 575 million,or 21%, because of record revenues in trading in debt securities and over-the-counter interest and credit derivatives. Foreign exchange, metals and commodi-ties trading increased by 27% over 2000, mainly because we were able to bene-fit from our leading market position in foreign exchange trading. Other tradingperformance included ¤ 686 million gains on nonqualifying derivatives in 2001,which is an increase of ¤ 226 million as compared to 2000. The fact that signi-ficant revenues were recorded in 2001 is largely due to forward contracts oncertain of our industrial holdings, which failed to qualify for hedge accountingtreatment.
78
2002 2001 2000
Net Trading Net Trading Net TradingTrading trading per- Trading trading per- Trading trading per-
revenues related form- revenues related form- revenues related form-in ¤ m. reported interest1 ance reported interest1 ance reported interest1 ance
Interest and credit trading 1,286 1,614 2,900 2,203 1,070 3,273 1,740 958 2,698
Equity trading 62 487 549 1,610 471 2,081 3,367 (609) 2,758
Foreign exchange, metal,commodity trading 1,226 6 1,232 1,385 (6) 1,379 1,102 (12) 1,090
Other trading2 1,450 (287) 1,163 833 (150) 683 1,416 (476) 940
Total 4,024 1,820 5,844 6,031 1,385 7,416 7,625 (139) 7,486
1 Includes interest income from trading assets and interest expense from trading liabilities, as well as allocations of interest expense and income representing the funding cost or benefitassociated with trading positions. These amounts are included in net interest revenues in the Consolidated Statement of Income. Also adjusts net interest revenues on derivatives enteredinto for nontrading purposes, but failing to qualify for hedge accounting treatment.
2 Includes gains and losses from derivatives not qualifying for hedge accounting treatment.
Management Discussion 79
Insurance Premiums. Insurance premiums were ¤ 744 million in 2002, adecrease of ¤ 2.0 billion, or 73%, as compared to 2001. The decline in our insur-ance premiums was attributable to the sale in the second quarter of 2002 ofmost of our insurance business, including our subsidiaries in Germany, Spain,Italy, and Portugal, to Zurich Financial Services. This decline was basically offsetby a corresponding decline in policyholder benefits and claims expenses,reported under noninterest expenses. After the sale, we continue to be theexclusive distributor of insurance products from our former subsidiaries to ourclients in Germany, Italy and Spain. Insurance premiums were ¤ 2.7 billion in2001, a decrease of ¤ 120 million or 4% compared to 2000. For further informa-tion on insurance assets and liabilities see Note [23] to the consolidated financialstatements.
Net Gains on Securities Available for Sale. Gains on securities available forsale totaled ¤ 3.5 billion in 2002, an increase of ¤ 2.0 billion, or 132%, comparedto 2001. Fiscal 2002 included net gains of ¤ 2.6 billion on the sale of our remain-ing holdings in Munich Re and, to a lesser extent, more of our holdings in AllianzAG. These gains were offset by write-downs of ¤ 308 million on available for salesecurities due to other-than-temporary impairments. Gains on securities available for sale were ¤ 1.5 billion in 2001, a decrease of¤ 2.2 billion, or 59 %, compared to 2000. In 2001, we disposed of approximately25% of our holding in Munich Re which accounted for ¤ 1.4 billion of our netgains on sales. Additionally, we recorded ¤ 428 million in write-downs of ourportfolio in 2001.The gains from securities available for sale in 2000 included a ¤ 337 million gainwe recognized when we transferred some mutual funds from securities availablefor sale to our trading portfolio. We transferred these mutual funds when wedetermined that our management of the market risk in these securities would beenhanced by moving responsibility for them to the risk managers of our tradingportfolio.Our strategy with respect to our industrial holdings has been to significantlyreduce the size of, and maximize value from, our industrial holdings.
Other Noninterest Revenues. Other noninterest revenues were ¤ 236 millionin 2002 as compared to ¤ (70) million in 2001. In 2002, we recorded a net gain of¤ 438 million from the deemed sale of a partial interest of EUROHYPO in themerger of mortgage banks, together with the related contribution of part of ourLondon based real estate investment banking business, and a net gain of ¤ 502million on the disposal of most of our insurance subsidiaries. These net gainswere offset by a ¤ 236 million loss from the sale of a subsidiary in 2002 andwrite-downs on the value of a subsidiary held for sale and on other investments,including certain private equity investments. Further offsetting these gains werenet losses from our equity method investments which included ¤ 706 millionrepresenting our share in net loss of Gerling-Konzern Versicherungs-Beteili-gungs-AG. In 2003, a number of events have occurred with respect to Gerling-Konzern Versicherungs-Beteiligungs-AG, which may negatively impact its valueand the value of our investment. For more information, see Note [6] to the consolidated financial statements.

80
Other noninterest revenues were negatively affected in 2001 by the poor capitalmarket conditions, which deteriorated further after the terrorist acts of Septem-ber 11. In 2001, we recorded ¤ 1.4 billion of net write-downs and valuation adjust-ments on our investments as compared to approximately ¤ 200 million in suchcharges in 2000.
Compensation and Benefits. Compensation and benefits were ¤ 11.4 billion in2002, a decrease of 15% from 2001. This was our largest category of noninterestexpense. The decrease in 2002 was impacted by various factors, including head-count reductions from restructuring activities and the sale or merger of some ofour businesses somewhat offset by increased headcount from the integration ofthe Scudder business. Given the continued lower earnings in 2002, performancedriven and target bonus payments declined in 2002 as compared to 2001. Alsoincluded in 2002 are ¤ 60 million for the buyout of our Coinvestment Plans.Compensation and benefits were ¤ 13.4 billion in 2001, a decrease of 1% from2000. The impact of inflationary salary increases and continued selective expan-sion in some of our businesses as well as an increase in severance paymentsand additional expense of ¤ 140 million related to the buyout of the Global EquityPlan was offset by a decrease in bonus and other special payments as well asreductions of workforce in other areas. Although a comparison of year end totalfull-time staff shows a decline from 2000 to 2001, the average number of full-time staff increased slightly compared to 2000, primarily as a result of the acqui-sition of National Discount Brokers Group Inc. in November 2000. Approxi-mately 40% of our compensation and benefits in 2001 were due to special pay-ments, including performance driven and target based bonus payments, largelybased on pre-tax profitability. Given the poorer results in 2001, performancedriven and target based bonus payments declined in 2001 compared to 2000.Although bonus payments are based on targets or performance, the effects ofretention contracts slightly offset the decline in target and performance relatedbonuses.
in ¤ m. 2002 2001 2000
Compensation and benefits 11,358 13,360 13,526
Other noninterest expenses 8,145 9,187 8,707
Policyholder benefits and claims 759 3,002 4,003
Goodwill amortization/impairment 62 871 771
Restructuring activities 583 294 125
Total 20,907 26,714 27,132
Noninterest Expenses

Management Discussion 81
Share-based compensation. Compensation and benefits included ¤ 460 millionand ¤ 1.2 billion for our share-based compensation plans for the years endedDecember 31, 2002 and 2001, respectively. Included were net losses from non-trading equity derivatives to offset fluctuations in employee share-based com-pensation expense totaling ¤ 226 million in 2002, as compared to ¤ 27 million in2001.
Pension Benefits. The amounts in compensation and benefits included pensioncosts of ¤ 565 million and ¤ 474 million for the years ended December 31, 2002and 2001, respectively. Our pension costs are developed from actuarial valua-tions. Inherent in these valuations are key assumptions, including discount ratesfor determining expense and benefit obligations and expected long-term rates ofreturn on plan assets. The key assumptions used in developing our 2002 netpension cost were a weighted-average discount rate of 5.7%, a weighted-aver-age expected return on plan assets of 6.7 % and a weighted-average rate ofincrease in future compensation levels of 3.0%. The discount rate and expectedlong-term rate of return on assets was reduced due to current market condi-tions.Our most significant pension plans are provided for employees located in Ger-many, the U.S. and the U.K. These locations represented approximately 97% ofour consolidated benefit obligation as of December 31, 2002. During 2002, wecontributed ¤ 3.9 billion to a segregated pension trust to fund our German pen-sion plans. This did not have an impact on the pension cost for 2002 as the fund-ing was made towards the end of the year. We also made additional contribu-tions to increase the plan assets of our qualified U.S. and U.K. pension plansamounting to approximately ¤ 115 million and ¤ 300 million, respectively. Pension costs can change due to variations in the key assumptions underlyingthe actuarial calculations. Holding all other assumptions constant for our signifi-cant pension plans, a one percent increase or decrease in the discount rate usedin determining the expense would have decreased or increased pension expenseby ¤ (54) million and ¤ 67 million, respectively for the year ended December 31,2002. Likewise, a one percent increase or decrease in the expected long-termrate of return on plan assets would have decreased or increased pensionexpense by ¤ (19) million and ¤ 23 million, respectively. However, this impactdoes not reflect the German pension plans because the expected return on planassets was not included in determining pension expense in 2002 as the planswere not funded until December 2002. If more than one of these assumptionswere changed, the impact would not necessarily be the same as if only oneassumption were changed in isolation.Contributions for plan assets required for 2003 related to our pension benefitplans will be determined by the 2003 actuarial valuations once completed. Mar-ket conditions and interest rates significantly impact future assets and liabilitiesof our pension plans. Contributions might be required in the future upon meas-urement of plan obligations.For further information on our pension plans, see Note [24] to the consolidatedfinancial statements.

82
Other Noninterest Expenses. The following table shows the principal compo-nents of our other noninterest expenses in 2002, 2001and 2000. In the table cer-tain 2001 and 2000 line items have been reclassified to conform with the 2002presentation:
Net occupancy expense of premises was ¤ 1.3 billion in 2002, a decrease of¤ 43 million, or 3 %, from 2001. The decrease reflected the downsizing of ourbranch network from restructuring activities and sale or merger of businesses,principally insurance and mortgage banking, that was offset partly by higherexpenses subsequent to the acquisition of Scudder business.Net occupancy expense of premises was ¤ 1.3 billion in 2001, an increase of¤ 244 million, or 22%, from 2000. This increase reflected new leases, buy-outsof redundant leases no longer required and refurbishments of properties.
Furniture and equipment expenses were ¤ 230 million in 2002, a decrease of¤ 127 million, or 36%, as compared to 2001, primarily due to lower depreciationand maintenance costs. Furniture and equipment expenses were ¤ 357 million in2001, a decrease of ¤ 211 million, or 37%, as compared to 2000, primarily due tolower depreciation and maintenance costs. In both years, the downsizing of ourbranch network from restructuring activities, which was down 25% since year-end 2000, was a factor in the decline. In addition, in 2002 the impact of the saleof much of our insurance business and the merger of our mortgage banking subsidiary outweighed the addition of the Scudder business.
IT costs were ¤ 2.2 billion in 2002, a decrease of ¤ 155 million, or 7%, as com-pared to 2001. This decrease was to a large extent due to reductions in the costof software applications development as well as lower rental and maintenancecosts for IT hardware. IT costs were ¤ 2.3 billion in 2001, an increase of ¤ 128 million, or 6 %, as compared to 2000.
Agency and other professional service fees were ¤ 761 million in 2002, adecrease of ¤ 319 million, or 30%, from 2001. Agency and other professionalservice fees were ¤ 1.1 billion in 2001, a decrease of ¤ 71 million, or 6%, from2000.The decrease in both years was primarily attributable to the reduction in our useof external consultants.
in ¤ m. 2002 2001 2000
Net occupancy expense of premises 1,291 1,334 1,090
Furniture and equipment 230 357 568
IT costs 2,188 2,343 2,215
Agency and other professional service fees 761 1,080 1,151
Communication and data services 792 891 762
Other expenses 2,883 3,182 2,921
Total 8,145 9,187 8,707

Management Discussion 83
Communication and data services decreased by ¤ 99 million, or 11% to¤ 792 million in 2002 as compared to 2001, mainly due to reduced market activ-ities and headcount reduction.Communication and data services were ¤ 891 million in 2001, an increase of¤ 129 million, or 17%, from 2000. This was mainly due to higher leased equip-ment payments, maintenance costs for software and data communicationsequipment, higher telephone and line charges and increased usage of marketdata services.
Other expenses were ¤ 2.9 billion in 2002, a decrease of ¤ 299 million, or 9%,as compared to 2001. This category comprises a variety of individual cost ele-ments, most of them down as compared to 2001. Among these, marketing,travel and entertainment expenses decreased significantly. Other expenses in2002 also included certain legal-related provisions. We recorded ¤ 48 million inconnection with a proposed settlement of investigations related to research ana-lyst independence and ¤ 58 million to settle litigation dating from 1999 relatingto allegations regarding statements about our negotiations to acquire BankersTrust. Other expenses also included ¤ 64 million to cover potential liabilities inconnection with certain European customer transactions related to the years1992 through 1996.Other expenses in 2000 included a provision of ¤ 50 million related to a founda-tion called “Foundation for Remembrance, Responsibility and the Future“. Wehad already provided for nearly all of the remainder of our ¤ 153 million contri-bution to this foundation in 1998. This foundation, which German companies,including ourselves, and the German government agreed to establish, is provid-ing financial payments to victims of forced labor and other injustices under theNational Socialist regime. The DM 10 billion foundation is funded in equalamounts by German companies and the German government.
Policyholder Benefits and Claims. Policyholder benefits and claims includedclaims payments, allocations to our loss reserves from property/casualty andassumed reinsurance business, payments to policyholders and additions toreserves and liabilities in favor of policyholders. Policyholder benefits and claimswere ¤ 759 million in 2002, a decrease of ¤ 2.2 billion compared to 2001. Thisreduction was due to the aforementioned sale of most of our insurance businessto Zurich Financial Services and was largely offset by a decline in insurance premium revenues.Policyholder benefits and claims were ¤ 3.0 billion in 2001, a 25% reductioncompared to 2000. This reduction reflected lower allocation for the benefit ofpolicyholders from the annual surplus of our insurance affiliates in line withdecreased net gains on securities available for sale and reduced insurance revenues.
Goodwill Amortization/Impairment. As of January 1, 2002, in accordancewith SFAS 142, “Goodwill and Other Intangible Assets”, goodwill is no longeramortized. However, goodwill evaluations are required annually and whenevents or circumstances indicate impairment is likely and, accordingly, werecorded ¤ 62 million in impairment of goodwill related to our Private Equityreporting unit during 2002. A significant portion of the reporting unit was classi-fied as held for sale during 2002 resulting in an impairment of the goodwill thatwill remain in the unit after sale.

84
Goodwill amortization was ¤ 871 million in 2001, an increase of ¤ 100 million, or13 %, as compared to 2000. In 2001, the amortization of the Bankers Trust good-will was ¤ 514 million, compared to ¤ 501million in 2000. The amortization of theMorgan Grenfell goodwill was ¤ 62 million in 2001, compared to ¤ 63 million in2000. For National Discount Brokers Group, Inc. we amortized ¤ 43 million ofgoodwill in 2001 compared to ¤ 4.8 million in 2000.
Restructuring Activities. We recorded ¤ 583 million of expenses in restructur-ing activities in 2002, ¤ 294 million in 2001 and ¤ 125 million in 2000. Theexpenses related to the following restructuring plans:
We recorded a pre-tax charge of ¤ 340 million in the first quarter of 2002 relatedto restructuring activities affecting all of our group divisions: the Corporate andInvestment Bank Group Division (CIB), Private Clients and Asset ManagementGroup Division (PCAM), and Corporate Investments Group Division (CI). Of thetotal ¤ 340 million, ¤ 246 million related to the restructuring measures in PCAM,¤ 93 million in CIB and ¤ 1million in CI. The restructuring covers a broad range ofmeasures primarily to streamline our branch network in Germany, as well as ourinfrastructure. A total of approximately 2,100 staff are impacted by these restruc-turing plans, which are expected to be completed by the end of the first quarterof 2003.In the second quarter of 2002, the Group Board approved an additional restruc-turing plan of ¤ 265 million related to CIB, which is expected to be completed bythe end of the first half of 2003. This restructuring resulted from detailed busi-ness reviews and reflects our outlook for the markets in which we operate. Itrelates to banking coverage, execution and relationship management processes,custody, trade finance and other transaction banking activities; and the relatedtechnology, settlement, real estate and other support functions. This plan affectsapproximately 2,000 staff, across all levels of the Group.We recorded a pre-tax charge of ¤ 294 million in the fourth quarter of 2001related to a restructuring plan affecting both of our main group divisions: CIBand PCAM. Of the total ¤ 294 million, ¤ 213 million related to the restructuringmeasures in CIB and ¤ 81 million related to PCAM, of which ¤ 14 million relatedto Private Clients Services business (PCS) later transferred to CIB. We plannedfor a reduction of approximately 2,400 staff, across all levels of the Group. Therestructuring in CIB covered steps to be taken as a result of changing marketconditions in the year 2001 and to give further effect to the CIB organizationaland business model that was created during 2001. It primarily impacted CIB’scustomer coverage and relationship management processes, certain aspects ofthe cash management, custody and trade finance businesses of Global Transac-tion Banking and the related elements of the settlement, infrastructure and realestate support functions. The plan also included the further streamlining of thesenior management structure in PCAM as a consequence of the re-organization
in ¤ m. 2002 2001 2000
Group Restructuring 2002 340 – –
CIB Restructuring 265 – –
Group Restructuring 2001 (22) 294 –
Deutsche Bank Trust Corp. – – (20)
Personal Banking – – 136
Other – – 9
Total 583 294 125

Management Discussion 85
of this group division’s business model and operations, including real estate sup-port. As of December 31, 2001, approximately 200 positions were eliminated.During the year ended December 31, 2002, approximately 1,800 additionalemployees were terminated in connection with the plan. Due primarily to higherthan expected staff attrition, actions related to the remaining positions includedin the restructuring plan were not taken and, therefore, reserves of ¤ 20 millionwere released in 2002. The remaining infrastructure related reserve of ¤ 2 millionwas also released during 2002.There is a further staff reduction of 1,950 which is the result of the re-segmenta-tion of our Private Banking and Personal Banking Corporate Divisions of PCAMinto the Private Wealth Management Business Division and the Private & Busi-ness Clients Corporate Division and will include staff reductions in our credit pro-cessing centers as well. The costs of implementing these measures in 2003 and2004 will be expensed as incurred. In addition, we will continue to have furtherrelated cuts in our branch network. We also recorded restructuring activities in 2000 totaling ¤ 136 million in con-nection with a plan for Deutsche Bank Privat- und Geschäftskunden AG (for-merly Deutsche Bank 24) to consolidate its branch offices and its related back-office functions. Of this amount, approximately ¤ 100 million was for severanceand other termination-related costs attributable to approximately 1,000 posi-tions, and ¤ 36 million was for other costs primarily related to lease terminations.All actions contemplated in the plan were completed during 2001. During 2000,we completed all of the significant initiatives contemplated in the DeutscheBank Trust Corporation restructuring plans and released the remaining restruc-turing liability. For further information on our restructuring activities, see Note [25] to the consolidated financial statements.
Income tax expense in 2002 was ¤ 3.2 billion, as compared to income taxexpense of ¤ 1.4 billion in 2001 and income tax benefit of ¤ 6.6 billion in 2000.The above differences are primarily attributable to the accounting for effects ofGerman income tax rate changes that were enacted in 1999 and 2000. The taxbenefit attributable to these changes was ¤ 9.3 billion in 2000. In 2001 and 2002there was tax expense of ¤ 995 million and ¤ 2.8 billion, respectively, as a resultof the reversal of the deferred taxes accumulated in other comprehensiveincome at December 31, 2000, due to actual sales of equity securities. Weexpect further reversal of tax expense in future years as additional equity securi-ties are disposed of. Excluding the effects of changes in German tax rates oureffective tax rates were 10% in 2002, 24 % in 2001 and 38% in 2000. The majorreason for the decrease in the effective tax rate since 2000 has been the impactof tax-exempt capital gains.
Income Tax Expense(Benefit)

86
In July 2001, the FASB issued SFAS No. 141, “Business Combinations” (“SFAS141”) and SFAS No. 142, “Goodwill and Other Intangible Assets” (“SFAS 142”).SFAS 141requires that all business combinations initiated after June 30, 2001, beaccounted for by the purchase method and eliminates the use of the pooling-of-interests method. Other provisions of SFAS 141 and SFAS 142 require that, as ofJanuary 1, 2002, goodwill no longer be amortized, reclassifications betweengoodwill and other intangible assets be made based upon certain criteria, and,once allocated to reporting units (the business segment level, or one levelbelow), that tests for impairment of goodwill be performed at least annually.Upon adoption of the requirements of SFAS 142 as of January 1, 2002, the Grouprecognized a ¤ 37 million tax-free gain as a cumulative effect of change inaccounting principle from the write-off of negative goodwill.Effective January 1, 2001, we adopted SFAS No. 133, “Accounting for DerivativeInstruments and Hedging Activities”. SFAS 133, as amended, establishesaccounting and reporting standards for derivative instruments, including certainderivative instruments embedded in other contracts, and for hedging activities.It requires companies to recognize all derivatives on the balance sheet as assetsor liabilities measured at fair value. The change in a derivative’s fair value is gen-erally recognized in current period earnings or equity. Upon adoption of SFAS133, we recorded a net transition expense of ¤ 207 million, after tax, as a cumu-lative effect of a change in accounting principle in the Consolidated Statement ofIncome. This amount was primarily due to the adjustment required to bringcertain embedded derivatives to fair value and to adjust the carrying amount ofthe related host contracts (items in which the derivatives are embedded) atJanuary 1, 2001, pursuant to the SFAS 133 transition provisions for embeddedderivatives that must be accounted for separately.
Cumulative Effect ofAccounting Changes

Management Discussion 87
Results of Operations by Segment
For detailed information on our management reporting systems in general andthe reconciliation of total results of operations and total assets of our businesssegments under our management reporting systems to the consolidated finan-cial statements prepared in accordance with U.S. GAAP, see Note [28] to theconsolidated financial statements.
The following tables show information regarding our business segments for the years ended December 31, 2002, 2001 and 2000. The criterion for segmenta-tion into divisions is our organizational structure as it existed at December 31,2002. We prepared these figures in accordance with our management reportingsystems.
2002 Corporate and Investment Bank Private Clients and Asset Management Corporate Total
Corporate Global Total Asset Private Personal Total Invest- Manage-
Banking & Trans- Manage- Banking Banking ments ment
Securities action ment Reporting
in ¤ m. Banking
Net revenues1 11,615 2,704 14,319 2,513 1,468 4,991 8,972 3,086 26,377
Provision for loan losses 1,697 12 1,709 (3) 15 215 227 155 2,091
Provision for off-balance sheet positions 83 (52) 31 – – (1) (1) (11) 19
Policyholder benefits and claims – – – 35 – 650 685 – 685
Operating cost base2 9,049 2,236 11,285 2,022 1,324 3,076 6,422 1,222 18,929
Income before
nonoperating costs 786 508 1,294 459 129 1,051 1,639 1,720 4,653
Goodwill impairment – – – – – – – 62 62
Severance payments 238 17 255 72 19 45 136 19 410
Restructuring activities 316 26 342 (1) 24 217 240 1 583
Minority interest 8 – 8 25 (1) 8 32 2 42
Total nonoperating costs 562 43 605 96 42 270 408 84 1,097
Income before income
taxes3 224 465 689 363 87 781 1,231 1,636 3,556
Average active equity4 14,454 1,796 16,250 2,665 386 1,442 4,493 6,751 27,494
Assets5 631,052 25,758 643,668 22,448 11,626 69,507 101,296 26,546 748,335
Risk-weighted positions(BIS risk positions) 142,483 13,613 156,096 6,027 7,271 44,061 57,359 19,219 232,674
1 Net interest revenues and noninterest revenues.2 Noninterest expenses excluding nonoperating costs (goodwill impairment, severance payments, restructuring activities, minority interest), provision for off-balance sheet positions and
policyholder benefits and claims.3 Before cumulative effect of accounting changes.4 We allocate our book equity to our divisions for management reporting purposes in proportion to the economic capital we calculate for them.5 At the group division level CIB, PCAM, CI and Total Management Reporting, we include intersegment items between the group divisions/corporate divisions.
Segmental Results ofOperations

88
2001 Corporate and Investment Bank Private Clients and Asset Management Corporate Total
Corporate Global Total Asset Private Personal Total Invest- Manage-
Banking & Trans- Manage- Banking Banking ments ment
Securities action ment Reporting
in ¤ m. Banking
Net revenues1 14,421 3,053 17,474 1,853 1,697 6,843 10,393 2,054 29,921
Provision for loan losses 629 (19) 610 12 11 183 206 199 1,015
Provision for off-balance sheet positions 5 (34) (29) – – – – 3 (26)
Policyholder benefits and claims – – – 48 – 2,898 2,946 – 2,946
Operating cost base2 11,279 2,450 13,729 1,619 1,482 3,853 6,954 1,363 22,046
Income (loss) before
nonoperating costs 2,508 656 3,164 174 204 (91) 287 489 3,940
Goodwill amortization 470 65 535 125 27 35 187 135 857
Severance payments 256 41 297 21 19 44 84 13 394
Restructuring activities 190 37 227 35 21 11 67 – 294
Minority interest 13 2 15 36 2 16 54 17 86
Total nonoperating costs 929 145 1,074 217 69 106 392 165 1,631
Income (loss) before
income taxes3 1,579 511 2,090 (43) 135 (197) (105) 324 2,309
Average active equity4 15,965 2,732 18,697 2,206 417 1,701 4,324 7,757 30,778
Assets5 663,760 24,708 677,623 20,600 12,469 91,572 123,784 121,006 896,476
Risk-weighted positions(BIS risk positions) 168,705 19,240 187,945 5,890 8,476 41,865 56,231 56,202 300,378
1 Net interest revenues and noninterest revenues.2 Noninterest expenses excluding nonoperating costs (goodwill amortization, severance payments, restructuring activities, minority interest), provision for off-balance sheet positions and
policyholder benefits and claims.3 Before cumulative effect of accounting changes.4 We allocate our book equity to our divisions for management reporting purposes in proportion to the economic capital we calculate for them.5 At the group division level CIB, PCAM, CI and Total Management Reporting, we include intersegment items between the group divisions/corporate divisions.
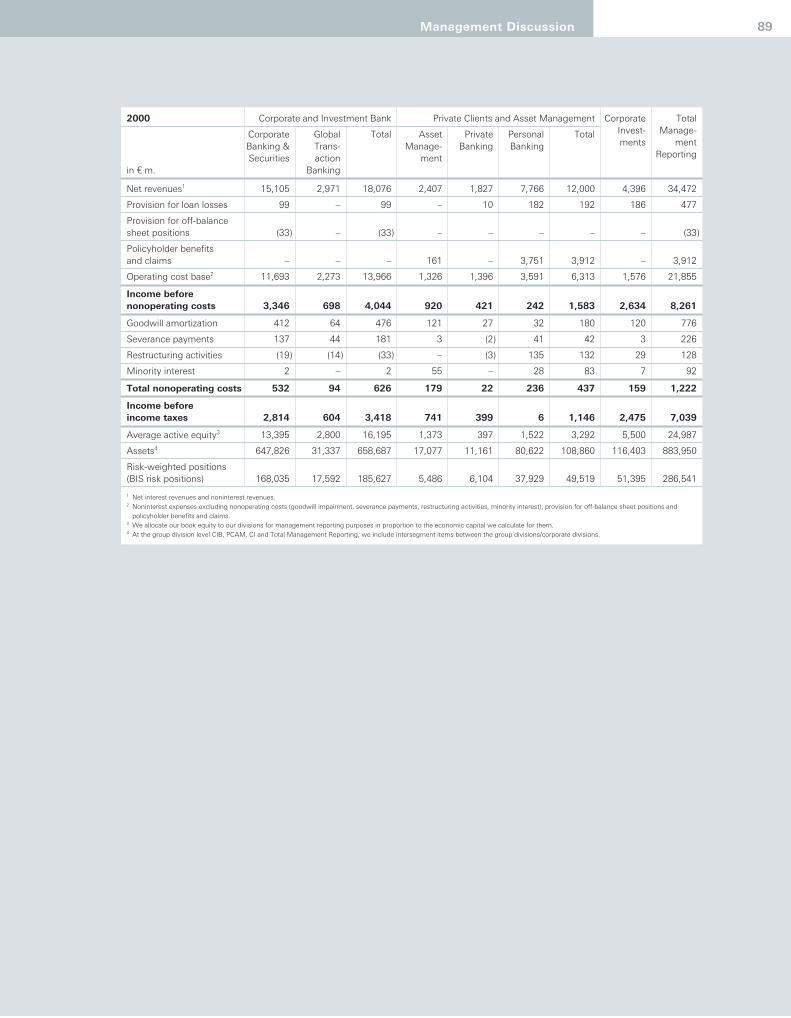
Management Discussion 89
2000 Corporate and Investment Bank Private Clients and Asset Management Corporate Total
Corporate Global Total Asset Private Personal Total Invest- Manage-
Banking & Trans- Manage- Banking Banking ments ment
Securities action ment Reporting
in ¤ m. Banking
Net revenues1 15,105 2,971 18,076 2,407 1,827 7,766 12,000 4,396 34,472
Provision for loan losses 99 – 99 – 10 182 192 186 477
Provision for off-balance sheet positions (33) – (33) – – – – – (33)
Policyholder benefits and claims – – – 161 – 3,751 3,912 – 3,912
Operating cost base2 11,693 2,273 13,966 1,326 1,396 3,591 6,313 1,576 21,855
Income before
nonoperating costs 3,346 698 4,044 920 421 242 1,583 2,634 8,261
Goodwill amortization 412 64 476 121 27 32 180 120 776
Severance payments 137 44 181 3 (2) 41 42 3 226
Restructuring activities (19) (14) (33) – (3) 135 132 29 128
Minority interest 2 – 2 55 – 28 83 7 92
Total nonoperating costs 532 94 626 179 22 236 437 159 1,222
Income before
income taxes 2,814 604 3,418 741 399 6 1,146 2,475 7,039
Average active equity3 13,395 2,800 16,195 1,373 397 1,522 3,292 5,500 24,987
Assets4 647,826 31,337 658,687 17,077 11,161 80,622 108,860 116,403 883,950
Risk-weighted positions(BIS risk positions) 168,035 17,592 185,627 5,486 6,104 37,929 49,519 51,395 286,541
1 Net interest revenues and noninterest revenues.2 Noninterest expenses excluding nonoperating costs (goodwill impairment, severance payments, restructuring activities, minority interest), provision for off-balance sheet positions and
policyholder benefits and claims.3 We allocate our book equity to our divisions for management reporting purposes in proportion to the economic capital we calculate for them.4 At the group division level CIB, PCAM, CI and Total Management Reporting, we include intersegment items between the group divisions/corporate divisions.

90
Group Divisions
The following table sets forth the results of our Corporate and Investment BankGroup Division for the years ended December 31, 2002, 2001and 2000, in accor-dance with our management reporting systems:
In the following paragraphs, we discuss the contribution of the individual corpo-rate divisions to the overall results of the Corporate and Investment Bank GroupDivision.
Corporate and Investment BankGroup Division
in ¤ m. 2002 2001 2000
Sales & Trading (equity) 2,791 4,111 5,152
Sales & Trading (debt and other products) 5,423 5,814 4,449
Origination (equity) 354 492 937
Origination (debt) 388 441 286
Advisory 516 568 879
Loan products 2,393 2,975 3,623
Transaction services 2,704 3,053 2,971
Other (250) 20 (221)
Total net revenues 14,319 17,474 18,076
Provision for loan losses 1,709 610 99
Provision for off-balance sheet positions 31 (29) (33)
Total provision for credit losses 1,740 581 66
Operating cost base1 11,285 13,729 13,966
Income before nonoperating costs 1,294 3,164 4,044
Average active equity 16,250 18,697 16,195
Adjusted return on average active equity in %2 8% 17% 25%
Cost/income ratio in %3 79% 79% 77%
1 Noninterest expenses excluding nonoperating costs (goodwill amortization/impairment, severance payments, restructuring activities,minority interest), provision for off-balance sheet positions and policyholder benefits and claims.
2 Income before nonoperating costs divided by average active equity.3 Operating cost base and policyholder benefits and claims divided by net revenues.

The following table sets forth the results of our Corporate Banking & SecuritiesCorporate Division for the years ended December 31, 2002, 2001 and 2000, inaccordance with our management reporting systems:
Income Before Nonoperating Costs. Income before nonoperating costsdeclined ¤ 1.7 billion, or 69 %, to ¤ 786 million for the year ended December 31,2002. The decline was attributable to a higher provision for credit losses and adecrease in net revenues of 19%, partly offset by reductions in our operatingcost base of 20 %.Income before nonoperating costs was ¤ 2.5 billion in 2001, a decrease of 25%,or ¤ 838 million, as compared to 2000. Increases in the provision for loan lossesand reductions in net revenues accounted for most of this decline.
Net Revenues. Net revenues were ¤ 11.6 billion in 2002 compared to ¤ 14.4 bil-lion in 2001. During 2002, prevailing market conditions negatively affected rev-enues from equities and equity-related products as well as revenues from loanproducts. Revenues from equities and equity-related products were also impactedby the adverse effect of a single block trade in the first quarter 2002. Total sales and trading revenues were ¤ 8.2 billion in 2002 compared to ¤ 9.9 bil-lion in 2001, a decline of ¤ 1.7 billion, or 17%. Revenues from debt and otherproducts remained strong in a weaker environment. The market for equities andequity-related products continued to suffer from lower volumes and the effectsof widening credit spreads in the derivatives markets. Revenues from equityproducts declined to ¤ 2.8 billion in 2002 from ¤ 4.1 billion in 2001.
in ¤ m. 2002 2001 2000
Sales & Trading (equity) 2,791 4,111 5,152
Sales & Trading (debt and other products) 5,423 5,814 4,449
Origination (equity) 354 492 937
Origination (debt) 388 441 286
Advisory 516 568 879
Loan products 2,393 2,975 3,623
Other (250) 20 (221)
Total net revenues 11,615 14,421 15,105
Provision for loan losses 1,697 629 99
Provision for off-balance sheet positions 83 5 (33)
Total provision for credit losses 1,780 634 66
Operating cost base1 9,049 11,279 11,693
Income before nonoperating costs 786 2,508 3,346
Average active equity 14,454 15,965 13,395
Adjusted return on average active equity in %2 5% 16% 25%
Cost/income ratio in %3 78% 78% 77%
1 Noninterest expenses excluding nonoperating costs (goodwill amortization/impairment, severance payments, restructuring activities,minority interest), provision for off-balance sheet positions and policyholder benefits and claims.
2 Income before nonoperating costs divided by average active equity.3 Operating cost base and policyholder benefits and claims divided by net revenues.
Corporate Banking &Securities CorporateDivision
Management Discussion 91

92
Total origination revenues decreased from ¤ 933 million in 2001 to ¤ 742 millionin 2002. Equity origination revenues declined by ¤ 138 million, or 28%, in 2002,driven by the origination-related portion of the adverse effect of a single blocktrade as mentioned above. In addition, lower debt underwriting activity con-tributed to reduced origination revenues for debt and related products.For the year ended December 31, 2002, advisory revenues declined by 9% to¤ 516 million as compared to the prior year.Revenues from loan products fell for the year ended December 31, 2002, to¤ 2.4 billion from ¤ 3.0 billion in 2001. The decline from 2001 was due to lowerinterest rates and loan book reductions reflecting our activities to reduce creditexposure. The disposal of our European financial services business in May 2001also contributed to the decline.Other net revenues included goodwill funding costs of ¤ 218 million in 2002 and¤ 234 million in 2001. In total, other net revenues changed to an expense of¤ 250 million in 2002 from revenues of ¤ 20 million in 2001. Other net revenuesin 2001 included a gain from the sale of our European financial services businessof ¤ 180 million.Net revenues decreased 5%, from ¤ 15.1 billion in 2000 to ¤ 14.4 billion in 2001.The marked deterioration in economic conditions in the second half of 2000 con-tinued throughout 2001. Generally weak markets and the reduction in transac-tion volumes adversely affected our equities related sales and trading, origina-tion and advisory businesses, but our fixed income business improved.Total sales and trading revenues reached ¤ 9.9 billion in 2001 from ¤ 9.6 billion in2000. However, there were two offsetting trends. Net revenues from sales andtrading (equity) fell 20% to ¤ 4.1billion in 2001 from ¤ 5.2 billion in 2000. Net rev-enues from sales and trading (debt and other products) increased over the sameperiod by 31 % to ¤ 5.8 billion from ¤ 4.4 billion. This reflected, in part, the favor-able conditions in the fixed income markets, together with our clients’ emphasison lower-risk products after September 11, 2001. Total origination revenues decreased from ¤ 1.2 billion in 2000 to ¤ 933 million in2001. Origination (equity) net revenues declined largely due to significant reduc-tions in transaction volume during 2001 falling from ¤ 937 million in 2000 to¤ 492 million in 2001. Origination (debt) net revenues, on the other hand,increased 54 % from ¤ 286 million in 2000 to ¤ 441 million in 2001, because ofimproved fixed income markets.Advisory revenues declined from ¤ 879 million in 2000 to ¤ 568 million in 2001,reflecting reduced transaction activity. Net revenues from loan products fell by 18% to ¤ 3.0 billion from ¤ 3.6 billion.This reduction was attributable to a number of factors: lower average balancesof loans due to increased securitizations, declining interest rates in the majormarkets where we do business and the sale of our European financial servicesbusiness in May 2001. Other net revenues included goodwill funding costs of ¤ 234 million in 2001 and¤ 272 million in 2000. In total, other net revenues changed from an expenseof ¤ 221 million in 2000 to revenues of ¤ 20 million in 2001. Other net revenues in2001 included a gain from the sale of our European financial services business inEurope.

Management Discussion 93
Provision for Credit Losses. The provision for credit losses was ¤ 1.8 billion in2002 compared to ¤ 634 million in 2001 and ¤ 66 million in 2000. The 2002 pro-vision included a charge of ¤ 200 million reflecting a refinement in the measure-ment of our other inherent loss allowance.The provision for loan losses for the year ended December 31, 2002, reflectedprovisions raised to address the downturn in the telecommunications industryand specific loan loss provision reflecting the deterioration in various industrysectors represented within our German portfolio and the Americas.The increase in 2001 arose primarily from new specific provision for loan lossesin our leveraged business, telecommunications and loan exposure managementportfolio across most regions. Another contributing factor was provision for loanlosses concerning Argentina.
Operating Cost Base. The operating cost base in 2002 was ¤ 9.0 billion, sub-stantially lower than the 2001 costs of ¤ 11.3 billion. The measures taken toimprove operating efficiency and to control discretionary spending have yieldedbenefits. The decrease of compensation and benefits by more than 25% wasdue to headcount reductions and also reflected lower performance-related com-pensation expenses. Non-compensation expenses decreased by 13% reflectinglower IT costs and other savings across all major spending categories.The operating cost base in 2001 was ¤ 11.3 billion, substantially unchanged from2000. Compensation and benefits were ¤ 5.4 billion, slightly lower than ¤ 5.6 bil-lion in 2000. Reduced performance-related compensation expense were partlyoffset by increased salaries we incurred as part of our expansion of selectedbusinesses. Non-compensation expense increased due to additional expendi-ture on IT and settlement systems throughout the businesses.
Cost/Income Ratio. The cost/income ratio of 78% in 2002 is the same as theratio in 2001. The benefits of our cost containment program and the emphasis oncontrol of discretionary spending in 2002 offset reductions in net revenues asindividually discussed above.The cost/income ratio of 78% in 2001 increased by 1 percentage point from 77%in 2000. This was principally a result of reduced revenues in 2001 against 2000.

94
The following table sets forth the results of our Global Transaction Banking Corporate Division for the years ended December 31, 2002, 2001 and 2000, inaccordance with our management reporting systems:
Income Before Nonoperating Costs. Income before nonoperating costsdeclined ¤ 148 million, or 23%, to ¤ 508 million for the year ended December 31,2002. Lower revenues were partly offset by a reduced operating cost base,which reflected measures taken to improve operating efficiency and to controldiscretionary spending.Income before nonoperating costs was ¤ 656 million in 2001, a decrease of 6%,or ¤ 42 million, from 2000. Increases in the operating cost base were the maincause of this reduction.In the first quarter of 2003, we sold a substantial part of our Global SecuritiesServices business to State Street Corp. During 2002 those businesses sold con-tributed net revenues of approximately ¤ 700 million with a negligible impact onincome before nonoperating costs.
Net Revenues. Net revenues declined to ¤ 2.7 billion in 2002 from ¤ 3.1 billionin 2001 primarily due to reduced interest rate margins and lower transaction vol-umes.Net revenues increased by almost 3% in 2001 to ¤ 3.1 billion from ¤ 3.0 billion in2000. Increases in revenues from cash management were due in part to theacquisition of Banque Worms in 2001. Increased revenues from securities lend-ing resulted from the declining interest rate environment in 2001 and a higherlevel of dividend transactions. These increases were partially offset by reductionsin net revenues from our custody activities due to lower market valuations andlower transaction volumes.
Provision for Credit Losses. The provision for credit losses in 2002 was a netrelease of ¤ 40 million compared to a net release of ¤ 53 million in 2001 and anegligible result in 2000.The provision for credit losses in 2002 reflected an increase in exposures result-ing from the drawdown of certain guarantees more than offset by reductions inthe level of cross border exposures and provision transfers to Corporate Banking& Securities. In 2001, the net release resulted principally from the reductions incross border exposures.
in ¤ m. 2002 2001 2000
Net revenues 2,704 3,053 2,971
Provision for loan losses 12 (19) –
Provision for off-balance sheet positions (52) (34) –
Total provision for credit losses (40) (53) –
Operating cost base1 2,236 2,450 2,273
Income before nonoperating costs 508 656 698
Average active equity 1,796 2,732 2,800
Adjusted return on average active equity in %2 28% 24% 25%
Cost/income ratio in %3 83% 80% 76%
1 Noninterest expenses excluding nonoperating costs (goodwill amortization/impairment, severance payments, restructuring activities,minority interest), provision for off-balance sheet positions and policyholder benefits and claims.
2 Income before nonoperating costs divided by average active equity.3 Operating cost base and policyholder benefits and claims divided by net revenues.
Global TransactionBanking CorporateDivision

Management Discussion 95
Operating Cost Base. The cost saving initiatives implemented within this cor-porate division have contributed to the reduced operating cost base, which wasdown to ¤ 2.2 billion in 2002 from ¤ 2.5 billion in 2001. Savings were recorded inmost expense categories. Additionally, some of our costs are transaction volumebased and have been affected by the reduced customer volumes that have beenexperienced.The transactional nature of this corporate division leads to processing and settle-ment costs that are high as a percentage of revenue. As transaction volumes fellin 2001, these costs offset an increased portion of our net revenues. However,our investment in information technology and operations increased the operat-ing cost base by 8%, from ¤ 2.3 billion in 2000 to ¤ 2.5 billion in 2001.
Cost/Income Ratio. The cost/income ratio of 83% in 2002 was higher by 3 per-centage points than in 2001. The benefits of our cost containment program havebeen more than offset by the reductions in revenues as individually discussedabove.The cost/income ratio of 80% in 2001 increased by 4 percentage points from76% in 2000. This was principally as a result of cost increases that were not fullymatched by the lower level of increases in revenues.

96
The following table sets forth the results of our Private Clients and Asset Man-agement Group Division for the years ended December 31, 2002, 2001and 2000,in accordance with our management reporting systems:
In the following paragraphs, we discuss the contribution of the individual corpo-rate divisions to the overall results of Private Clients and Asset ManagementGroup Division.
in ¤ m. (except invested assets) 2002 2001 2000
Portfolio/fund management 2,723 2,170 2,679
Advisory 1,235 1,374 1,612
Loan/deposit products 2,531 2,462 2,262
Transaction fees 589 642 620
Insurance business 963 3,487 4,484
Other 931 258 343
Total net revenues 8,972 10,393 12,000
Provision for loan losses 227 206 192
Provision for off-balance sheet positions (1) – –
Total provision for credit losses 226 206 192
Policyholder benefits and claims 685 2,946 3,912
Operating cost base1 6,422 6,954 6,313
Income before nonoperating costs 1,639 287 1,583
Average active equity 4,493 4,324 3,292
Adjusted return on average active equity in %2 36% 7% 48%
Cost/income ratio in %3 79% 95% 85%
Invested assets (in ¤ bn.) 963 911 929
Additional Information:Results of sold insurance and related
activities included above
Insurance business 780 3,308 4,268
Other 502 – –
Total net revenues 1,282 3,308 4,268
Provision for credit losses – 2 3
Policyholder benefits and claims 650 2,896 3,749
Operating cost base1 103 376 432
Income before nonoperating costs 529 34 84
Invested assets (in ¤ bn.) – 19 17
1 Noninterest expenses excluding nonoperating costs (goodwill amortization/impairment, severance payments, restructuring activities,minority interest), provision for off-balance sheet positions and policyholder benefits and claims.
2 Income before nonoperating costs divided by average active equity.3 Operating cost base and policyholder benefits and claims divided by net revenues.
Private Clients andAsset ManagementGroup Division

The following table sets forth the results of our Asset Management CorporateDivision for the years ended December 31, 2002, 2001 and 2000, in accordancewith our management reporting systems:
Income Before Nonoperating Costs. Income before nonoperating costs ofour Asset Management Corporate Division was ¤ 459 million in 2002, anincrease of ¤ 285 million, or 164%, as compared to 2001. This improvement wasprimarily attributable to reductions in our operating cost base and more favor-able transactions from our real estate business.Income before nonoperating costs was ¤ 174 million in 2001, a decrease of¤ 746 million, or 81 %, as compared to 2000. Decreased revenues of ¤ 554 mil-lion due to unfavorable market conditions and increased operating costs of¤ 293 million accounted for the decrease in income before nonoperating costs.In the first quarter of 2003, we sold most of our Passive Asset Managementbusiness to Northern Trust Corporation. The revenues associated with the soldbusiness accounted for less than 2% of Asset Management’s total revenues.The related assets and liabilities were not material to the Group’s total assets andliabilities.
Net Revenues. Net revenues rose ¤ 660 million, or 36%, to ¤ 2.5 billion in 2002.The acquisition of Scudder and RREEF in the second quarter of 2002 contributed¤ 579 million, or 88%, to the growth in net revenues. The remaining increase of¤ 81 million, or 12%, was due to more favorable year-over-year contributionsfrom our real estate and hedge funds businesses of ¤ 185 million and a gain of¤ 8 million on the sale of insurance-related activities. These increases were par-tially offset by lower fee income of approximately ¤ 110 million from the tradi-tional fund management business further reflecting the ongoing weak marketenvironment experienced in 2002.
in ¤ m. (except invested assets) 2002 2001 2000
Portfolio/fund management 2,192 1,565 2,040
Insurance business 44 57 162
Other 277 231 205
Total net revenues 2,513 1,853 2,407
Provision for loan losses (3) 12 –
Provision for off-balance sheet positions – – –
Total provision for credit losses (3) 12 –
Policyholder benefits and claims 35 48 161
Operating cost base1 2,022 1,619 1,326
Income before nonoperating costs 459 174 920
Average active equity 2,665 2,206 1,373
Adjusted return on average active equity in %2 17% 8% 67%
Cost/income ratio in %3 82% 90% 62%
Invested assets (in ¤ bn.) 726 631 641
1 Noninterest expenses excluding nonoperating costs (goodwill amortization/impairment, severance payments, restructuring activities,minority interest), provision for off-balance sheet positions and policyholder benefits and claims.
2 Income before nonoperating costs divided by average active equity.3 Operating cost base and policyholder benefits and claims divided by net revenues.
Asset ManagementCorporate Division
Management Discussion 97
98
Net revenues were ¤ 1.9 billion in 2001, a decrease of ¤ 554 million, or 23%, ascompared to 2000. This decrease arose principally from weaker market condi-tions in 2001, which led to reduced funds performance fees and funds manage-ment fees.
Operating Cost Base. The operating cost base increased ¤ 403 million, or25%, to ¤ 2.0 billion in 2002. The main reason for the increase was the acquisi-tion of Scudder and RREEF in the second quarter of 2002, which contributed¤ 573 million to our operating cost base. This increase was partially offset as theoperating cost base in 2001 included write-downs on our real estate portfolio ofapproximately ¤ 150 million. The operating cost base was ¤ 1.6 billion in 2001, an increase of ¤ 293 million, or22 %, as compared to 2000. The increase was primarily due to compensationand benefits, which experienced organic growth in compensation levels as wellas the full year effect of hiring in the second half of 2000. Also contributing to theincrease were write-downs on our real estate portfolio in 2001 of approximately¤ 150 million and reorganization expenses incurred for our activities in France.
Cost/Income Ratio. From 2001 to 2002 the cost/income ratio decreased by 8 percentage points to 82% in 2002 with the impact of increased revenues discussed above outweighing the increased expense impact.The increase in the cost/income ratio from 62% in 2000 to 90% in 2001 wasmainly attributable to the strong net revenues and the lower operating cost basein 2000 as described above.
Invested Assets. Invested assets increased by ¤ 95 billion, or 15%, to ¤ 726 billion in 2002 compared to 2001. The primary driver of the increase wasthe acquired invested assets of Scudder and RREEF of ¤ 292 billion. Because ofthe weak market environment in 2002, the positive impact of these acquisitionswas largely offset by a net new money loss of ¤ 25 billion, negative performancemovements of ¤ 86 billion and negative foreign currency impact of ¤ 84 billion. Invested assets were essentially unchanged in 2001 compared to 2000.

Management Discussion
The following table sets forth the results of our Private Banking Corporate Divi-sion for the years ended December 31, 2002, 2001 and 2000, in accordance withour management reporting systems:
Income Before Nonoperating Costs. Income before nonoperating costs ofour Private Banking Corporate Division was ¤ 129 million for the year endedDecember 31, 2002 compared to ¤ 204 million for the year ended December 31,2001. This decrease was mainly caused by lower revenues from our advisoryproducts which were partially offset by reductions of our operating cost base.Income before nonoperating costs was ¤ 204 million for the year ended Decem-ber 31, 2001as compared to ¤ 421million for the year ended December 31, 2000.The decline was primarily attributable to lower revenues from our advisory prod-ucts and increases in our operating cost base.
Net Revenues. Net revenues totaled ¤ 1.5 billion in 2002, a decline of ¤ 229 mil-lion, or 13%, compared to 2001. The challenging conditions in the internationalmarkets led to a further drop in the value of invested assets and to reduced activ-ities of our clients. The decline in net revenues from advisory products was par-tially offset by net revenues of ¤ 46 million generated by the Scudder PrivateInvestment Counsel, which was acquired in the second quarter of 2002. Thisacquisition enhances our investment management capabilities and expands ourdistribution platform in the U.S.Net revenues amounted to ¤ 1.7 billion in 2001, a decline of ¤ 130 million, or 7%,compared to 2000. Weaker revenues from our advisory business, whichdeclined by ¤ 129 million, or 13 %, compared to 2000 was the primary reason forthis decline. The weak market environment in 2001 led to a substantial restraintamong our customers and a decline in securities-related commissions. Broker-age activity dropped significantly and our ability to market new products waslimited.
99
in ¤ m. (except invested assets) 2002 2001 2000
Portfolio/fund management 472 526 544
Advisory 696 858 987
Loan/deposit products 244 282 262
Transaction fees 14 15 (1)
Insurance business 14 13 10
Other 28 3 25
Total net revenues 1,468 1,697 1,827
Provision for loan losses 15 11 10
Provision for off-balance sheet positions – – –
Total provision for credit losses 15 11 10
Policyholder benefits and claims – – –
Operating cost base1 1,324 1,482 1,396
Income before nonoperating costs 129 204 421
Average active equity 386 417 397
Adjusted return on average active equity in %2 34% 49% 106%
Cost/income ratio in %3 90% 87% 76%
Invested assets (in ¤ bn.) 148 167 178
1 Noninterest expenses excluding nonoperating costs (goodwill amortization/impairment, severance payments, restructuring activities,minority interest), provision for off-balance sheet positions and policyholder benefits and claims.
2 Income before nonoperating costs divided by average active equity.3 Operating cost base and policyholder benefits and claims divided by net revenues.
Private Banking Corporate Division

100
Additionally, net revenues benefited in 2000 from booming stock markets in thefirst quarter when our customers’ demand for new products (including initialpublic offerings) was significantly higher than throughout the year 2001.
Provision for Credit Losses. The provision for credit losses for the year endedDecember 31, 2002 totaled ¤ 15 million compared to ¤ 11 million for the yearended December 31, 2001. The increase primarily reflected losses for counter-parties in Europe resulting from shortfalls in collateral levels as stock marketsdeclined. The provision for credit losses totaled ¤ 11 million for the year ended Decem-ber 31, 2001 was essentially unchanged compared to 2000.
Operating Cost Base. The operating cost base declined by ¤ 158 million, or11%, to ¤ 1.3 billion in 2002. The primary reasons for this decline were our ongo-ing cost containment efforts and our restructuring measures for the PrivateBanking business in Germany. In addition, costs declined due to lower costs forIT-projects as well as lower transaction-related costs due to reduced client activ-ity. These decreases in our operating cost base were partially offset by the inclu-sion of the Scudder Private Banking business in the second quarter of 2002which contributed ¤ 48 million to the operating cost base in 2002.The operating cost base was ¤ 1.5 billion in 2001, an increase of ¤ 86 million, or6%, compared to 2000. The largest single items causing this increase were soft-ware and premises write-downs.
Cost/Income Ratio. The cost/income ratio for 2002 was 90% compared to87% in 2001. The increase was attributable to the decrease in revenues asdescribed above.The cost/income ratio was 87% in 2001 compared to 76% in 2000, with theincrease caused by the reduction in net revenues and the increase in our operat-ing cost base as described above.
Invested Assets. Invested assets declined by ¤ 19 billion, or 11%, to ¤ 148 bil-lion at December 31, 2002. The additional invested assets of ¤ 10 billion due tothe integration of the Scudder Private Banking business were more than offsetby market-driven valuation reductions in the other portfolios. The strengtheningof the euro against the U.S. dollar also caused a further market-driven reduction.Compared to December 31, 2000, invested assets declined by ¤ 11billion, or 6%,to ¤ 167 billion at December 31, 2001. Decreases in invested assets in our U.S.business and declines due to the overall stock market conditions more than offset net new money.

Management Discussion
The following table sets forth the results of our Personal Banking Corporate Divi-sion for the years ended December 31, 2002, 2001 and 2000, in accordance withour management reporting systems:
Income Before Nonoperating Costs. Income before nonoperating costs ofour Personal Banking Corporate Division was ¤ 1.1 billion for the year endedDecember 31, 2002. The results in 2002 included a net gain of ¤ 494 million fromthe disposal of most of our insurance and related activities to Zurich FinancialServices. The remaining increase of income before nonoperating costs wasattributable to a significant reduction of our operating cost base and to increasedrevenues from loan/deposit and advisory products.
101
in ¤ m. (except invested assets) 2002 2001 2000
Portfolio/fund management 59 78 96
Advisory 539 516 625
Loan/deposit products 2,287 2,181 2,000
Transaction fees 575 627 621
Insurance business 905 3,417 4,312
Other 626 24 112
Total net revenues 4,991 6,843 7,766
Provision for loan losses 215 183 182
Provision for off-balance sheet positions (1) – –
Total provision for credit losses 214 183 182
Policyholder benefits and claims 650 2,898 3,751
Operating cost base1 3,076 3,853 3,591
Income (loss) before nonoperating costs 1,051 (91) 242
Average active equity 1,442 1,701 1,522
Adjusted return on average active equity in %2 73% (5%) 16%
Cost/income ratio in %3 75% 99% 95%
Invested assets (in ¤ bn.) 89 113 110
Additional Information: Results of sold insurance and related
activities included above
Insurance business 780 3,308 4,268
Other 494 – –
Total net revenues 1,274 3,308 4,268
Provision for credit losses – 2 3
Policyholder benefits and claims 650 2,896 3,749
Operating cost base1 103 376 432
Income before nonoperating costs 521 34 84
Invested assets (in ¤ bn.) – 19 17
1 Noninterest expenses excluding nonoperating costs (goodwill amortization/impairment, severance payments, restructuring activities,minority interest), provision for off-balance sheet positions and policyholder benefits and claims.
2 Income before nonoperating costs divided by average active equity.3 Operating cost base and policyholder benefits and claims divided by net revenues.
Personal Banking Corporate Division

Loss before nonoperating costs was ¤ 91 million for the year ended Decem-ber 31, 2001, compared to income before nonoperating costs of ¤ 242 million forthe year ended December 31, 2000. The decrease in net revenues was primarilydue to lower gains from securities available for sale and write-downs of securi-ties available for sale for other-than-temporary impairment, predominantlyrelated to our insurance business. This decline was substantially offset byreduced policyholder benefits and claims, reflecting lower allocations for thebenefit of policyholders from the annual surplus of our insurance subsidiaries.The operating cost base increased, mainly due to specific items such as theintroduction of the euro and e-commerce initiatives. Excluding these items, theoperating cost base was essentially unchanged.Comparison figures for historical periods are materially affected by the sale ofthe insurance and related activities. The following discussion of Personal Bank-ing’s results of operations excludes the results of these activities in all periods.
Net Revenues. Net revenues increased by ¤ 182 million, or 5%, compared to2001. The growth in net revenues from our loan/deposit products was attributa-ble to higher volumes. Revenues from advisory products increased despite theweak market environment, due to the launch of new products (e.g. XAVEX) anda higher demand for funds products after the reform of the German pension sys-tem. This reform also had a positive effect on the referral of insurance productsfrom our former subsidiaries.Net revenues were ¤ 3.5 billion in 2001, essentially unchanged compared to2000. Net revenues from our advisory business and our portfolio/fund manage-ment business were negatively impacted by the continued weakness in theinternational capital markets that led to a substantial restraint among our cus-tomers regarding securities transactions. This decrease was offset by higher netrevenues from loan and deposits products due to increased volumes.
Provision for Credit Losses. Provision for credit losses increased to ¤ 214 mil-lion in 2002 reflecting the challenging credit environment.In 2001, our provision for credit losses was ¤ 181 million, a slight increase of¤ 2 million compared to 2000.
Operating Cost Base. The operating cost base was ¤ 3.0 billion in 2002, adecrease of ¤ 504 million, or 14%, as compared to 2001. The significant reduc-tion in 2002 resulted from our activities to improve efficiency and to control dis-cretionary spending. Compensation and benefits expenses were reduced bymore than 10% reflecting headcount reductions in connection with our restruc-turing activities. Non-compensation expenses decreased by more than 15%mainly due to reduced spending for marketing, information technology andbusiness consulting as well as due to lower occupancy expenses reflecting therestructuring of our branch network in 2002. The operating cost base was ¤ 3.5 billion in 2001, an increase of ¤ 318 million, or10%, as compared to 2000. The increase was mainly attributable to expenses forspecific projects such as the introduction of the euro and e-commerce initia-tives. Excluding these items, the operating cost base was essentially unchangedreflecting cost containment activities we implemented.
102

Management Discussion
Cost/Income Ratio. The cost/income ratio was 80% in the year 2002. This is asignificant improvement of 18 percentage points compared to 2001, reflectingour reduced operating cost base and increased net revenues as describedabove.The cost/income ratio was 98 % in 2001 compared with 90% in 2000, anincrease primarily due to the increases in the 2001 operating cost base asdescribed above.
Invested Assets. Invested assets in 2002 were ¤ 89 billion, a decrease of ¤ 5 bil-lion compared to 2001. This decrease was attributable to a decline in market val-ues of equities and mutual funds (¤ 7 billion), partly offset by net new money(¤ 2 billion).Invested assets in 2001 were ¤ 94 billion compared to ¤ 93 billion in 2000.Reductions in market values of ¤ 8 billion were due to the weak performance onthe equity markets. They were more than offset by net new money, mainly frommutual funds and equities.
The following table sets forth the results of our Corporate Investments GroupDivision for the years ended December 31, 2002, 2001 and 2000, in accordancewith our management reporting systems:
Income Before Nonoperating Costs. Income before nonoperating costs ofour Corporate Investments Group Division was ¤ 1.7 billion for the year endedDecember 31, 2002, an increase of ¤ 1.2 billion, or 252%, as compared to theyear ended December 31, 2001. The increase was primarily attributable to highergains from the sale of industrial holdings.Income before nonoperating costs was ¤ 489 million for the year ended Decem-ber 31, 2001, a decrease of ¤ 2.1 billion, or 81%, as compared to the year endedDecember 31, 2000. Write-downs and valuation adjustments of some of ouralternative assets together with lower gains from the sales of industrial holdingsaccounted for most of the decrease.In November 2002, we entered into exclusive negotiations with the manage-ment team of DB Capital Partners regarding the sale of our late-stage privateequity portfolio. The transaction, which comprises the sale of 80% of our Late-stage Private Equity Portfolio, was completed in February 2003.
103
in ¤ m. 2002 2001 2000
Net revenues 3,086 2,054 4,396
Provision for loan losses 155 199 186
Provision for off-balance sheet positions (11) 3 –
Total provision for credit losses 144 202 186
Operating cost base1 1,222 1,363 1,576
Income before nonoperating costs 1,720 489 2,634
Average active equity 6,751 7,757 5,500
Adjusted return on average active equity in %2 25% 6% 48%
Cost/income ratio in %3 40% 66% 36%
1 Noninterest expenses excluding nonoperating costs (goodwill amortization/impairment, severance payments, restructuring activities,minority interest), provision for off-balance sheet positions and policyholder benefits and claims.
2 Income before nonoperating costs divided by average active equity.3 Operating cost base and policyholder benefits and claims divided by net revenues.
Corporate InvestmentsGroup Division

Net Revenues. Net revenues were ¤ 3.1 billion in 2002, an increase of ¤ 1.0 bil-lion, or 50 %, as compared to 2001. Net revenues in 2002 included ¤ 3.5 billion net gains from our industrial holdingsportfolio which primarily related to the sale of our remaining stake in Munich Re(net gain of ¤ 2.6 billion) and the sale of some of our interest in Allianz AG (netgain of approximately ¤ 400 million). Further transactions in 2002 included thesales of our stakes in Deutsche Börse AG, RWE AG, Buderus AG and Continen-tal AG as well as the reduction of our stake in Südzucker AG. In 2001, the largesttransaction relating to our industrial holdings portfolio was the sale of some ofour interest in Munich Re resulting in a gain of ¤ 1.4 billion. Net revenues in 2001also reflected a gain of approximately ¤ 800 million for nontrading derivatives inconnection with our industrial holdings portfolio compared to a gain of approxi-mately ¤ 150 million in 2002.In 2002, net revenues included a net gain of ¤ 438 million from the deemed saleof a partial interest of our mortgage banking subsidiary EUROHYPO, togetherwith the related contribution of part of our London-based real estate investmentbanking business. Also included were anticipated losses of ¤ 217 million relatedto our Private Equity business held for sale and a net loss of ¤ 236 million relatedto the sale of the major part of our North American financial services business.Charges in 2001 of ¤ 80 million were also related to our North American financialservices business. Net revenues in 2002 also reflected net write-downs of ¤ 435 million on ouralternative investments portfolio and net losses of ¤ 728 million on certain equity method investments including ¤ 706 million from our equity methodinvestment in Gerling-Konzern Versicherungs-Beteiligungs-AG. Similar chargesin 2001 amounted to ¤ 1.1 billion, net of a gain on the disposal of a building of¤ 233 million.The remaining variance in net revenues in 2002 compared to 2001 was attributa-ble to reduced revenues after the disposal of the above mentioned businessescombined with lower dividend income from our industrial holdings portfolio. At year-end 2002, the alternative assets portfolio of the Corporate InvestmentsGroup Division had a carrying value of ¤ 6.8 billion, of which 51% were privateequity direct investments, 25% were real estate investments and 24% were pri-vate equity indirect and other investments. We continue to monitor the portfolioon a quarterly basis for any potential impairment. If the public equity and high-yield financing markets continue to deteriorate, we may determine that furtherwrite-downs and valuation adjustments are necessary. Net revenues were ¤ 2.1 billion in 2001, a decrease of ¤ 2.3 billion, or 53%, ascompared to 2000. The largest transaction relating to our industrial holdings portfolio in 2001 wasthe reduction of our stake in Munich Re which resulted in a gain of ¤ 1.4 billion.The largest transaction in 2000 was a sale of some of our interest in Allianz AGwith a gain of ¤ 2.3 billion. Net revenues in 2001 also included a gain of approxi-mately ¤ 800 million for nontrading derivatives related to our industrial holdingsportfolio.Net revenues from our alternative investments portfolio were materiallyimpacted by adverse market conditions in 2001, which resulted in write-downsand valuation adjustments, net of gains from disposals of ¤ 1.1 billion in 2001(including a gain of ¤ 233 million on the sale of a building) as compared toapproximately ¤ 200 million for such net charges in 2000. Most of the write-downs were related to investments in the technology and telecommunicationsectors.
104

Management Discussion
At year-end 2001, the alternative assets portfolio in Corporate Investments had acarrying value of ¤ 8.2 billion, of which 59% were private equity direct invest-ments, 17% were real estate investments and 24% were private equity indirectand other investments.
Provision for Credit Losses. The provision for credit losses was ¤ 144 millionin 2002 compared to ¤ 202 million in 2001. The ¤ 58 million reduction was primarily attributable to the deconsolidation of EUROHYPO in the third quarter of 2002.The provision for credit losses was ¤ 202 million in 2001, an increase of ¤ 16 mil-lion, or 9%, as compared to 2000. This increase was primarily related to a higherprovision concerning our mortgage banking business, partly compensated by aprovision decline related to our industrial holdings portfolio.
Operating Cost Base. The operating cost base decreased in 2002 to ¤ 1.2 bil-lion from ¤ 1.4 billion in 2001. The reduction primarily resulted from the abovedescribed deconsolidation of our mortgage banking and North American finan-cial services businesses in 2002 and the disposal of NDB brokerage business inthe third quarter of 2001. In 2002, the operating cost base also included ¤ 60 mil-lion related to the buyout of our Coinvestment plans. The operating cost base declined in 2001 to ¤ 1.4 billion from ¤ 1.6 billion in 2000,which was a result of a decrease in expenses for strategic initiatives.
Cost/Income Ratio. The cost/income ratio was 40% in 2002 compared with66% in 2001. This improvement is primarily the result of increased revenues dueto sales of certain industrial holdings as described above.The cost/income ratio was 66 % in 2001 compared with 36% in 2000. Thisdecline is due to the decrease in revenues from the sale of industrial holdings,and an increase in private equity write-downs in 2001.
105
Recent Accounting Developments
Effective January 1, 2002, we adopted SFAS No. 141, “Business Combinations”(“SFAS 141”) and SFAS No. 142, “Goodwill and Other Intangible Assets” (“SFAS142”). SFAS 141 requires that all business combinations initiated after June 30,2001, be accounted for by the purchase method and eliminates the use of thepooling-of-interests method. Other provisions of SFAS 141 and SFAS 142 requirethat, as of January 1, 2002, goodwill no longer be amortized, reclassificationsbetween goodwill and other intangible assets be made based upon certain crite-ria, and, once allocated to reporting units (the business segment level, or onelevel below), that tests for impairment of goodwill be performed at least annu-ally. Upon adoption of the requirements of SFAS 142, as of January 1, 2002, wediscontinued the amortization of goodwill with a net carrying amount of ¤ 8.7billion. We also recognized a ¤ 37 million tax-free gain as a cumulative effect ofchange in accounting principle from the write-off of negative goodwill and therewere no reclassifications between goodwill and other intangible assets. We recognized a ¤ 62 million loss from impairment of goodwill during the fourthquarter of 2002 resulting from the decision to sell a portion of our private equitybusiness. This sale closed in the first quarter of 2003. SFAS 142 does not requireretroactive restatement for all periods presented, however, pro forma informa-tion for 2001 and 2000 is provided (see Note [12]) and assumes that SFAS 142was in effect as of January 1, 2000.
Effective January 1, 2002, we adopted SFAS No. 144, “Accounting for the Impair-ment or Disposal of Long-Lived Assets” (“SFAS 144”). SFAS 144 supersedesFASB Statement No. 121, “Accounting for the Impairment of Long-Lived Assetsand for Long-Lived Assets to Be Disposed Of”, and the accounting and reportingprovisions of APB Opinion No. 30, “Reporting the Results of Operations—Reporting the Effects of Disposal of a Segment of a Business, and Extraordinary,Unusual and Infrequently Occurring Events and Transactions”, for the disposal ofa segment of a business. This Statement also amends ARB No. 51, “Consoli-dated Financial Statements”, to eliminate the exception to consolidation for asubsidiary for which control is likely to be temporary. Upon adoption all long-lived assets to be disposed of and discontinued operations shall be measured atthe lower of carrying amount or fair value less cost to sell. This Statement alsobroadens the existing definition of discontinued operations to include a compo-nent of an entity (rather than a segment of a business). The adoption of SFAS 144did not have a material impact on our consolidated financial statements. SeeNote [13] for information regarding assets held for sale at December 31, 2002.
Effective November 21, 2002, we adopted provisions in EITF Issue No. 02-3,“Issues Involved in Accounting for Derivative Contracts Held for Trading Pur-poses and Contracts Involved in Energy Trading and Risk Management Activi-ties” (“EITF 02-3”) that require that up front dealer profit (or loss) should not berecognized on derivative contracts unless supported by observable market data,observable prices of other current market transactions or other observable datasupporting the valuation technique. The adoption did not have a material impacton our consolidated financial statements for 2002. We do not expect EITF 02-3to affect the ultimate recognition of dealer profit (or loss), however, it may affectthe timing of that recognition.
106
SFAS 141 and 142
SFAS 144
EITF 02-3

Management Discussion
The other provisions of EITF 02-3, related to energy and derivative contracts heldfor trading purposes, which have effective dates in 2002 and 2003, do not or arenot expected to have a material impact on our consolidated financial statements.
In June 2002, the FASB issued SFAS No. 146, “Accounting for Costs Associatedwith Exit or Disposal Activities” (“SFAS 146”). SFAS 146 requires companies torecognize costs associated with exit or disposal activities when they are incurredrather than at the date of a commitment to an exit or disposal plan. SFAS 146replaces the existing guidance provided by EITF Issue No. 94-3, “Liability Recog-nition for Certain Employee Termination Benefits and Other Costs to Exit anActivity (including Certain Costs Incurred in a Restructuring)”. SFAS 146 is to beapplied prospectively to exit or disposal activities initiated after December 31,2002.
In November 2002, the FASB issued Interpretation No. 45, “Guarantor’s Account-ing and Disclosure Requirements for Guarantees, Including Indirect Guaranteesof Indebtedness of Others” (“FIN 45”), which addresses the disclosure to bemade by a guarantor in its interim and annual financial statements about itsguarantee obligations. These disclosure requirements are included in Note [30]to the consolidated financial statements. FIN 45 also requires the recognition ofa liability for the fair value at inception of guarantees entered into or modifiedafter December 31, 2002. The adoption of FIN 45 will not have a material impacton our consolidated financial statements.
In March 2003, we decided to adopt the fair value recognition provisions ofSFAS No. 123, “Accounting for Stock-Based Compensation” (“SFAS 123”)prospectively for all employee awards granted, modified or settled afterJanuary 1, 2003. This prospective adoption is one of the methods provided forunder SFAS No. 148, “Accounting for Stock-Based Compensation – Transitionand Disclosure”. Generally, the fair value based method under SFAS 123 resultsin higher compensation expense for stock options depending on the significantterms, such as the number of shares and exercise price, of the options beinggranted.The majority of our stock option awards are granted on a date shortly after theend of the performance year with an effective date as of the end of the perform-ance year. We are currently evaluating the potential impact, if any, of prospec-tively adopting the fair value provisions of SFAS 123 on future option awards andother share-based compensation plans.
107
SFAS 146
FIN 45
SFAS 148

108
In January 2003, the FASB issued Interpretation No. 46, “Consolidation of Vari-able Interest Entities” (“FIN 46”). FIN 46 requires a company to consolidate enti-ties that do not have sufficient independent equity if the company will absorb amajority of the entity’s expected losses, or receive the majority of the entity’sexpected residual gains, or both. Securitization vehicles that are qualifying spe-cial purpose entities under SFAS 140 are excluded from the new rule and remainunconsolidated. For us, the Interpretation is effective immediately for entitiesestablished after January 31, 2003, and is effective July 1, 2003, for entities cre-ated before February 1, 2003. We are evaluating the effect, if any, that the adop-tion of FIN 46 will have on our consolidated financial statements. FIN 46 requirestransitional disclosures where it is reasonably possible that we will have to con-solidate or disclose information about certain entities when this Interpretationbecomes effective. These transitional disclosures are included in Note [9] to theconsolidated financial statements.
FIN 46

Management Discussion
Outlook
We still act in a challenging environment. The recovery promised by confidenceindicators in spring 2002 did not materialize. On the contrary, growth slowedduring the year and the Euroland economy entered 2003 on a very sluggishnote. External demand, the major engine of growth in 2002, will be dampenedby the appreciating euro as global growth will remain soft. One positive factorfor domestic demand should be the decline in Euroland inflation, which willimprove consumers’ real purchasing power. Still, GDP growth in 2003 will beonly marginally higher than in 2002 and fall some 1.5 percentage points short ofthe economy’s potential growth rate. Both the situation in the Middle East and,partly related to that, the further development of the USD/EUR exchange ratepose significant downside risks to this already not very optimistic scenario. Ger-many will continue to be a growth laggard in Euroland with current-year GDPbarely rising.Market sentiment has clearly deteriorated on both sides of the Atlantic. Defaultsare rising in number while recovery rates have fallen. Investors’ confidence inthe integrity of the stock markets and their participants is still at a very low level.Nevertheless, prospects for the bank are favorable. We will continue to benefitfrom the cost reduction progress we achieved in 2002 and the measures wetook to strengthen our balance sheet. And even if the German economy wors-ens, the steps we have already taken to limit our credit exposure should preventany upsurge in loss provisioning. All the measures taken in 2002 position us verywell for a market rebound.Having made such great progress on transforming the bank, we now intend toconcentrate on growing our businesses and making better use of cross-divi-sional synergies within the bank. In essence, we are aiming at continued prod-uct innovation within our client-tailored approach, increased share of wallet ofexisting customers, further penetration of customer target segments as well asorganic growth complemented with disciplined add-on acquisitions. In CIB, we want to accelerate our efforts to concentrate, more selectively, onthose companies and institutions whom we can serve best and most profitably.We want to continue to increase the cost-effectiveness of our salesforce, focus-ing ever more intensively on problem solving for our clients, improving our shareof wallet, and returns from key relationships. Only recently, we decided to sepa-rate a part of our corporate and institutional client coverage from our GlobalCorporate Finance (GCF) Business Division. This will constitute a new businessdivision called Global Banking Division (GBD).In PCAM, we intend to grow particularly in Private & Business Clients, AssetManagement and Private Wealth Management. We believe that this is a keycomponent of managing performance (both improving profitability and diver-sifying our earnings base) as well as a critical step in positioning ourselvesstrategically for the future. Through the acquisition of Scudder, we have attained‘bulge bracket’ status in the asset management arena as measured by investedassets. The re-segmentation of our Private Banking and Personal Banking Divi-sions into the new corporate division Private & Business Clients and the newbusiness division Private Wealth Management, enhances our strategic focusand ability to target products and services to client needs. The Scudder acquisi-tion also enhanced our Private Wealth Management franchise in the U.S., andstrengthened the platform from which we can deliver investment managementservices to high net worth individuals. It is our stated strategy of growing thisbusiness both organically and through selective, add-on acquisitions.
109

After having sold our late-stage private equity portfolio through a managementbuy-out in February 2003, Corporate Investments will comprise our remainingprivate equity and venture capital assets, our industrial holdings, third-party pri-vate equity funds and principal-owned real estate assets. In the context of ourstrategy of value preservation, enhancement and realization we want to carefullymanage this portfolio.Risk management will be a key success factor in 2003. We are confident in ourability to carefully and attentively manage and address our credit risk exposures.This commitment is evidenced by a change in the measurement in our otherinherent loss allowance making the provision more sensitive to the prevailingcredit environment and less based on historical experience. In addition, we planto introduce a new pricing model to better shield ourselves from loan losses,making us the first German financial institution to make such a move. Respond-ing to upcoming changes in the regulatory environment, we implemented a revised Operational Risk Management Policy, effective January 1, 2003, setting the route for a strong, fully functional and proactive management ofOperational Risk.Continued cost discipline will remain a top priority and we expect to see the fullbenefits of the successful cost reductions in the financial year 2003. Neverthe-less, we are committed to maintain our rigorous attitude to reducing our costbase, constantly improving the efficiency of our businesses and infrastructureplatforms.We want to continue to redeploy our capital and balance sheet towards cus-tomers, markets and businesses which generate the greatest return to share-holders. On the other hand, we are ready to withdraw capital from activitieswhose returns, and risks, do not offer sufficient reward. During the current chal-lenging market conditions, we believe it is prudent to maintain our Tier 1 ratio(BIS) above the 8–9% target band. We will closely monitor capitals levels in2003 and adjust them as conditions warrant.Overall, we still face significant challenges as we look forward to 2003 as ouroperating environment will continue to be very hard. Nevertheless, we believethat our strengthening competitive position will provide us with opportunitieseven in volatile markets.
110
Consolidated Financial Statements 111
Introductory Note
The accompanying consolidated financial statements were prepared in accordancewith United States Generally Accepted Accounting Principles (U.S. GAAP).
In order to comply with Section 292a of the HGB (German Commercial Code),the consolidated financial statements were supplemented with a consolidatedbusiness review report, a list of mandates, a list of shareholdings, and additionalexplanations. Therefore, the consolidated financial statements, which have to befiled with the Commercial Register and published in the Federal Gazette, complywith the Accounting and Banking Directives of the European Community (Direc-tive 83/349/EWG, Directive 84/253/EWG, Directive 86/635/EWG). For the inter-pretation of these directives we relied on the statement by the German Account-ing Standards Committee.
The consolidated financial statements and the consolidated business reviewreport as of December 31, 2002 prepared in accordance with Section 292a of theHGB (German Commercial Code) is filed with the Commercial Register in Frank-furt am Main under the number HRB 30000. It will be, as well as the list ofmandates and the list of shareholdings, provided to shareholders on request.

112
Board of Managing Directors in the Reporting Year
Josef AckermannSpokesman from May 22, 2002
Rolf-E. BreuerSpokesman and Member of theBoard of Managing Directors untilMay 22, 2002
Clemens Börsig
Thomas R. Fischeruntil January 30, 2002
Jürgen Fitschenuntil January 30, 2002
Tessen von Heydebreck
Hermann-Josef Lamberti
Michael Philippuntil January 30, 2002

Consolidated Financial Statements
Independent Auditors’ Report
The Supervisory Board of Deutsche Bank Aktiengesellschaft
We have audited the accompanying consolidated balance sheets of DeutscheBank Aktiengesellschaft and subsidiaries (the “Company”) as of December 31,2002 and 2001, and the related consolidated statements of income, comprehen-sive income, changes in shareholders’ equity, and cash flows for each of theyears in the three-year period ended December 31, 2002. These consolidatedfinancial statements are the responsibility of the Company’s management. Ourresponsibility is to express an opinion on these consolidated financial state-ments based on our audits.
We conducted our audits in accordance with auditing standards generallyaccepted in the United States of America. Those standards require that we planand perform the audit to obtain reasonable assurance about whether the finan-cial statements are free of material misstatement. An audit includes examining,on a test basis, evidence supporting the amounts and disclosures in the financialstatements. An audit also includes assessing the accounting principles used andsignificant estimates made by management, as well as evaluating the overallfinancial statement presentation. We believe that our audits provide a reason-able basis for our opinion.
In our opinion, the consolidated financial statements referred to above presentfairly, in all material respects, the financial position of Deutsche Bank Aktien-gesellschaft and subsidiaries as of December 31, 2002 and 2001, and the resultsof their operations and their cash flows for each of the years in the three-yearperiod ended December 31, 2002, in conformity with accounting principles generally accepted in the United States of America.
As discussed in Note 2 to the consolidated financial statements, effective Janu-ary 1, 2002, the Company adopted Statement of Financial Accounting StandardsNo. 142 “Goodwill and Other Intangible Assets”.
Frankfurt am Main, March 11, 2003KPMG Deutsche Treuhand-GesellschaftAktiengesellschaft Wirtschaftsprüfungsgesellschaft
Nonnenmacher KeeseWirtschaftsprüfer Wirtschaftsprüfer
113

Income StatementDeutsche Bank Group
Income Statement
Earnings Per Share Figures
The accompanying notes are an integral part of the Consolidated Financial Statements.
114
in ¤ m. [Notes] 2002 2001 2000
Interest revenues [1], [21], [30] 35,781 53,639 55,131Interest expense [1], [21], [30] 28,595 45,019 48,103Net interest revenues 7,186 8,620 7,028
Provision for loan losses [1], [7], [8] 2,091 1,024 478
Net interest revenues after provision for loan losses 5,095 7,596 6,550
Commissions and fees from fiduciary activities 3,926 3,537 3,908Commissions, broker’s fees, markups on securities underwriting and other securities activities 4,319 4,557 5,170Fees for other customer services 2,589 2,633 2,615Insurance premiums [1] 744 2,717 2,837Trading revenues, net [1], [22], [30] 4,024 6,031 7,625Net gains on securities available for sale [1], [5] 3,523 1,516 3,670Net income (loss) from equity method investments [1], [6] (887) (365) 300Other revenues [1] 1,123 295 1,326
Total noninterest revenues 19,361 20,921 27,451
Compensation and benefits [1], [18], [24], [30] 11,358 13,360 13,526Net occupancy expense of premises [1] 1,291 1,334 1,090Furniture and equipment [1] 230 357 568IT costs [1] 2,188 2,343 2,215Agency and other professional service fees 761 1,080 1,151Communication and data services 792 891 762Policyholder benefits and claims [1] 759 3,002 4,003Other expenses [1] 2,883 3,182 2,921Goodwill amortization/impairment [1], [3], [12] 62 871 771Restructuring activities [25] 583 294 125
Total noninterest expenses 20,907 26,714 27,132
Income before income tax expense (benefit) and cumulative effect of
accounting changes 3,549 1,803 6,869
Income tax expense [1], [26] 372 434 2,643Income tax expense (benefit) from the change in effective tax rate and the reversing effect [26] 2,817 995 (9,287)
Income before cumulative effect of accounting changes, net of tax 360 374 13,513
Cumulative effect of accounting changes, net of tax [2] 37 (207) –
Net income 397 167 13,513
in ¤ [18], [27] 2002 2001 2000
Earnings per common share
BasicIncome before cumulative effect of accounting changes, net of tax 0.58 0.60 22.00Cumulative effect of accounting changes, net of tax 0.06 (0.33) –Net income 0.64 0.27 22.00
DilutedIncome before cumulative effect of accounting changes, net of tax 0.57 0.60 21.72Cumulative effect of accounting changes, net of tax 0.06 (0.33) –Net income 0.63 0.27 21.72
Cash dividends declared per common share 1.30 1.30 1.15

Consolidated Financial Statements
Statement of Comprehensive IncomeDeutsche Bank Group
Statement of Comprehensive Income
The accompanying notes are an integral part of the Consolidated Financial Statements.
115
in ¤ m. 2002 2001 2000
Net income 397 167 13,513
Deferred tax on unrealized net gains on securities available for sale relating to 1999 and 2000 tax rate changes in Germany1 2,817 995 –Unrealized gains (losses) on securities available for sale
Unrealized net losses arising during the year, net of tax and other2 (5,596) (2,496) (1,185)Net reclassification adjustment for realized net gains, net of applicable tax and other3 (3,527) (1,423) (1,516)
Unrealized net gains (losses) on derivatives hedging variability of cash flows, net of tax4 2 (1) –Minimum pension liability, net of tax5 (8) – –Unrealized foreign currency translation gains (losses) arising during the year, net of tax6 (1,602) 85 432
Total other comprehensive income (loss) (7,914) (2,840) (2,269)
Comprehensive income (loss) (7,517) (2,673) 11,244
1 Amounts relate to the reversal effect of a tax benefit realized in 1999 and 2000 due to tax rate changes in 1999 and 2000.2 Amounts are net of an income tax benefit of ¤ 69 million, ¤ 105 million and ¤ 820 million for the years ended December 31, 2002, 2001 and 2000, respectively, and adjustments to insurance
policyholder liabilities and deferred acquisition costs of ¤ (230) million, ¤ (610) million and ¤ 5 million for the years ended December 31, 2002, 2001 and 2000, respectively.3 Amounts are net of applicable income tax expense of ¤ 15 million, ¤ 144 million and ¤ 1,702 million for the years ended December 31, 2002, 2001 and 2000, respectively, and adjustments
to insurance policyholder liabilities and deferred acquisition costs of ¤ 110 million, ¤ (44) million and ¤ 429 million for the years ended December 31, 2002, 2001 and 2000, respectively.4 The amount is net of an income tax expense for the year ended December 31, 2002 and an income tax benefit for the year ended December 31, 2001.5 Amount is net of an income tax benefit of ¤ 3 million for the year ended December 31, 2002.6 Amounts are net of an income tax (benefit) expense of ¤ 26 million, ¤ (41) million and ¤ (35) million for the years ended December 31, 2002, 2001 and 2000, respectively.

116
Balance SheetDeutsche Bank Group
Assets
Liabilities and Shareholders’ Equity
The accompanying notes are an integral part of the Consolidated Financial Statements.
in ¤ m. [Notes] Dec 31, 2002 Dec 31, 2001
Noninterest-bearing deposits [32]Domestic offices 21,960 22,244Foreign offices 8,598 7,487
Interest-bearing deposits [32]Domestic offices 95,033 96,659Foreign offices 202,034 247,699
Total deposits 327,625 374,089Trading liabilities [1], [4], [32] 131,212 121,329Central bank funds purchased and securities sold under repurchase agreements [1], [32] 90,709 81,375Securities loaned [1], [32] 8,790 7,620Other short-term borrowings [14], [32] 11,573 20,472Acceptances outstanding 99 553Insurance policy claims and reserves [23] 8,557 35,241Accrued interest payable 4,668 7,423Other liabilities [24], [25] 37,695 58,943Long-term debt [15], [32] 104,055 166,908Trust preferred securities [16], [32] 3,103 4,076Obligation to purchase common shares [17] 278 –Total liabilities 728,364 878,029
Common shares, no par value, nominal value of ¤ 2.561 1,592 1,591Additional paid-in capital 11,199 11,253Retained earnings 22,087 22,619Common shares in treasury, at cost2 (1,960) (479)Equity classified as obligation to purchase common shares (278) –Share awards 955 899Accumulated other comprehensive income [1]
Deferred tax on unrealized net gains on securities available for sale relating to 1999 and2000 tax rate changes in Germany (3,043) (5,860)Unrealized net gains on securities available for sale, net of applicable tax and other 156 9,279Unrealized net gains (losses) on derivatives hedging variability of cash flows, net of tax 1 (1)Minimum pension liability, net of tax (8) –Foreign currency translation, net of tax (710) 892
Total accumulated other comprehensive income (3,604) 4,310Total shareholders’ equity [18], [20] 29,991 40,193
Total liabilities and shareholders’ equity 758,355 918,222
Commitments and contingent liabilities (Notes [11], [30] and [33]).1 Issued: 2002: 621,854,246 shares; 2001: 621,568,446 shares.2 Common shares in treasury, at cost: 2002: 36,407,292 shares; 2001: 7,092,821 shares.
in ¤ m. [Notes] Dec 31, 2002 Dec 31, 2001
Cash and due from banks [1], [19], [32] 8,979 10,388Interest-earning deposits with banks [10], [32] 25,691 37,986Central bank funds sold and securities purchased under resale agreements [1], [32] 117,689 103,685Securities borrowed [1], [32] 37,569 40,318Trading assets [1], [4], [10], [32] 297,062 293,653
of which ¤ 70 billion and ¤ 16 billion were pledged to creditors and canbe sold or repledged at December 31, 2002 and 2001, respectively
Securities available for sale [1], [5], [10], [32] 21,619 71,666of which ¤ 736 million and ¤ 524 million were pledged to creditors and can be sold or repledged at December 31, 2002 and 2001, respectively
Other investments [6], [32] 10,768 11,997Loans, net [1], [7], [8], [9], [10], [31], [32] 167,303 259,838Premises and equipment, net [1], [10], [11] 8,883 9,806Goodwill [1], [2], [12] 8,372 8,741Other intangible assets, net [1], [2], [12] 1,411 206Other assets related to insurance business [23] 7,797 13,875Due from customers on acceptances 99 553Accrued interest receivable 4,208 5,907Other assets 40,905 49,603Total assets 758,355 918,222

Consolidated Financial Statements 117
Statement of Changes in Shareholders’ EquityDeutsche Bank Group
Statement of Changes in Shareholders’ Equity
The accompanying notes are an integral part of the Consolidated Financial Statements.
in ¤ m. 2002 2001 2000
Common shares
Balance, beginning of year 1,591 1,578 1,573Common shares distributed under employee benefit plans 1 13 5Balance, end of year 1,592 1,591 1,578Additional paid-in capital
Balance, beginning of year 11,253 10,876 10,556Common shares distributed under employee benefit plans 21 462 188Net gains (losses) on treasury shares sold (129) (85) 132Other 54 – –Balance, end of year 11,199 11,253 10,876Retained earnings
Balance, beginning of year 22,619 23,331 10,581Net income 397 167 13,513Cash dividends declared and paid (800) (801) (706)Other (129) (78) (57)Balance, end of year 22,087 22,619 23,331Common shares in treasury, at cost
Balance, beginning of year (479) (119) (61)Purchases of shares (30,755) (37,032) (35,731)Sale of shares 28,441 36,090 35,366Treasury shares distributed under employee benefit plans 833 582 307Balance, end of year (1,960) (479) (119)Equity classified as obligation to purchase common shares
Balance, beginning of year – – –Additions (330) – –Deductions 52 – –Balance, end of year (278) – –Share awards – common shares issuable
Balance, beginning of year 1,666 1,883 821Deferred share awards granted, net 1,098 487 1,356Deferred shares distributed (809) (704) (294)Balance, end of year 1,955 1,666 1,883Share awards – deferred compensation
Balance, beginning of year (767) (1,016) (538)Deferred share awards granted, net (1,098) (487) (1,356)Amortization of deferred compensation, net 865 736 878Balance, end of year (1,000) (767) (1,016)Accumulated other comprehensive income
Balance, beginning of year 4,310 7,150 9,419Change in deferred tax on unrealized net gains on securities available for sale relating to 1999 and 2000 tax rate changes in Germany 2,817 995 –Change in unrealized net gains on securities available for sale, net of applicable tax and other (9,123) (3,919) (2,701)Change in unrealized net gains/losses on derivatives hedging variability of cash flows, net of tax 2 (1) –Change in minimum pension liability, net of tax (8) – –Foreign currency translation, net of tax (1,602) 85 432Balance, end of year (3,604) 4,310 7,150
Total shareholders’ equity, end of year 29,991 40,193 43,683

Cash Flow StatementDeutsche Bank Group
Cash Flow Statement
The accompanying notes are an integral part of the Consolidated Financial Statements.
118
in ¤ m. 2002 2001 2000
Net income 397 167 13,513
Adjustments to reconcile net income to net cash used in operating activitiesProvision for loan losses 2,091 1,024 478Restructuring activities 583 294 125Gain on sale of securities available for sale, other investments, loans and other (4,928) (2,806) (4,161)Deferred income taxes, net 2,480 (159) (8,332)Impairment, depreciation and other amortization and accretion 2,845 4,886 3,320Cumulative effect of accounting changes, net of tax (37) 207 –Share of net loss (income) from equity method investments 753 278 (338)
Income adjusted for noncash charges, credits and other items 4,184 3,891 4,605
Net change inTrading assets (4,071) (1,263) (35,599)Other assets 8,627 (9,670) 11,258Trading liabilities 11,412 (3,022) (16,411)Other liabilities (20,639) (4,559) (264)Other, net (296) 1,412 3,075
Net cash used in operating activities (783) (13,211) (33,336)
Net change inInterest-earning deposits with banks 7,800 9,232 (11,238)Central bank funds sold and securities purchased under resale agreements (14,004) (47,959) 36,185Securities borrowed 2,749 33,138 (7,272)Loans 9,634 5,802 (28,064)
Proceeds fromSale of securities available for sale 25,835 41,128 43,058Maturities of securities available for sale 7,731 2,746 17,369Sale of other investments 5,089 7,096 4,405Sale of loans 9,508 16,185 16,496Sale of premises and equipment 717 1,015 344
Purchase ofSecurities available for sale (22,464) (34,289) (55,463)Other investments (4,474) (7,976) (7,702)Loans (2,364) (8,903) (7,586)Premises and equipment (1,696) (3,689) (2,164)
Net cash received (paid) for business combinations/divestitures (1,110) 924 (1,096)Other, net 687 958 252Net cash provided by (used in) investing activities 23,638 15,408 (2,476)
Net change inDeposits (41,278) 22,548 13,623Securities loaned and central bank funds purchased and securities sold underrepurchase agreements 7,603 (16,096) (12,629)Other short-term borrowings 274 (15,151) 9,571
Issuances of long-term debt and trust preferred securities 40,245 32,958 61,233Repayments and extinguishments of long-term debt and trust preferred securities (27,201) (22,884) (40,371)Issuances of common shares 73 320 193Purchases of treasury shares (30,755) (37,032) (35,731)Sale of treasury shares 28,665 36,024 35,514Cash dividends paid (800) (801) (706)Other, net (455) (522) (644)Net cash (used in) provided by financing activities (23,629) (636) 30,033
Net effect of exchange rate changes on cash and due from banks (635) 325 2,710Net increase (decrease) in cash and due from banks (1,409) 1,886 (3,069)Cash and due from banks, beginning of the year 10,388 8,502 11,571Cash and due from banks, end of the year 8,979 10,388 8,502Interest paid 31,349 48,099 46,250Income taxes paid, net 408 1,251 1,819Noncash investing activities
Transfer from available for sale securities to trading assets – 22,101 507Transfer from trading assets to available for sale securities – 14,938 –

[1] Significant Accounting Policies
Deutsche Bank Aktiengesellschaft (“Deutsche Bank” or the “Parent”) is a stockcorporation organized under the laws of the Federal Republic of Germany.Deutsche Bank together with all majority-owned subsidiaries (the “Group”) is aglobal provider of a full range of corporate and investment banking, privateclients and asset management products and services. For a discussion of theGroup’s business segment information, see Note [28]. The accompanying consolidated financial statements are stated in euros andhave been prepared in accordance with accounting principles generallyaccepted in the United States of America (“U.S. GAAP”). Certain prior periodamounts have been reclassified to conform to the current presentation. The preparation of financial statements in conformity with U.S. GAAP requiresmanagement to make estimates and assumptions that affect the reportedamounts of assets and liabilities and disclosure of contingent assets and liabili-ties at the balance sheet date, and the reported amounts of revenue andexpenses during the reporting period. Actual results could differ from manage-ment’s estimates. The following is a description of the significant accounting policies of the Group.
The consolidated financial statements include Deutsche Bank together with allmajority-owned subsidiaries. All material intercompany transactions and accountshave been eliminated. Investments in enterprises are accounted for using the equity method when theGroup is not the majority owner but has the ability to significantly influence oper-ating and financial policies of the investee. Generally, this is when the Group hasan investment between 20% and 50% of the voting stock of a corporation or3% or more of a limited partnership. Other factors that are considered in deter-mining whether the Group has significant influence include representation onthe board of directors (supervisory board in the case of German stock corpora-tions) and material intercompany transactions. These investments are reportedin other investments and the pro-rata share of their income or loss, on aU.S. GAAP basis, as well as disposition gains and losses, are included in netincome from equity method investments. Equity method losses in excess of theGroup’s carrying amount of the investment in the enterprise are charged againstother assets held by the Group related to the investee. Prior to January 1, 2002,the difference between the Group’s cost and its proportional underlying equity innet assets of the investee at the date of investment (“equity method goodwill”)was amortized on a straight-line basis against net income from equity methodinvestments over a period not exceeding fifteen years. Effective January 1, 2002,the Group adopted SFAS No. 142, “Goodwill and Other Intangible Assets”(“SFAS 142”). In accordance with SFAS 142, equity method goodwill is no longeramortized.
Consolidated Financial Statements
NotesDeutsche Bank Group
Principles of Consolidation andOther Investments
119

Foreign CurrencyTranslation
Reverse Repurchaseand RepurchaseAgreements
120
Special Purpose Entities (“SPEs”) are legal entities created for a particular pur-pose and are used in structuring a wide range of capital markets products.Unless the SPE meets the criteria for a Qualifying Special Purpose Entity (“QSPE”)as defined in SFAS No. 140, “Accounting for Transfers and Servicing of FinancialAssets and Extinguishments of Liabilities” (“SFAS 140”) (see Asset Securitiza-tions below), the Group consolidates SPEs when it is deemed to control and/orretain the majority of the risks and rewards of the SPE. The underlying holdings of designated investment companies that are consoli-dated are included in other investments, as they are primarily nonmarketableequity securities, and are carried at fair value. Changes in fair value of the under-lying holdings are included in other revenues. Direct investments over which the Group does not have significant influence,including investments in venture capital companies and nonmarketable equitysecurities, are included in other investments and carried at historical cost, net ofdeclines in fair value below cost that are deemed to be other than temporary.Gains and losses upon sale or impairment are included in other revenues.
Assets and liabilities denominated in currencies other than an entity’s functionalcurrency are translated into its functional currency using the period endexchange rates, and the resulting transaction gains and losses are reported innoninterest revenues or noninterest expenses.In consolidation, the financial statements of entities with functional currenciesother than the euro are translated into the euro and the resulting translationgains and losses, net of any hedge and tax effects, are reported in accumulatedother comprehensive income within shareholders’ equity. Revenues andexpenses are translated at the weighted average rate during the year whereasassets and liabilities are translated at the period end rate.
Securities purchased under resale agreements (“reverse repurchase agree-ments”) and securities sold under agreements to repurchase (“repurchaseagreements”) are generally treated as collateralized financings and are carried atthe amount of cash disbursed and received, respectively. Generally, the partydisbursing the cash takes possession of the securities serving as collateral forthe financing. Securities purchased under resale agreements consist primarily ofOECD country sovereign bonds or sovereign guaranteed bonds. Securities ownedand pledged as collateral under repurchase agreements in which the counter-party has the right by contract or custom to sell or repledge the collateral are disclosed on the Consolidated Balance Sheet in accordance with SFAS 140. The Group monitors the fair value of the securities received or delivered. Forsecurities purchased under resale agreements, the Group requests additionalsecurities or the return of a portion of the cash disbursed when appropriate inresponse to a decline in the market value of the securities received. Similarly, thereturn of excess securities or additional cash is requested when appropriate inresponse to an increase in the market value of securities sold under repurchaseagreements. The Group offsets reverse repurchase and repurchase agreementswith the same counterparty which meet the applicable netting criteria in FASBInterpretation No. 41, “Offsetting of Amounts Related to Certain Repurchase andReverse Repurchase Agreements” (“FIN 41”). Interest earned on reverse repur-chase agreements and interest incurred on repurchase agreements are reportedas interest revenues and interest expense, respectively.

Securities borrowed and securities loaned are recorded at the amount of cashadvanced or received. Securities borrowed transactions generally require theGroup to deposit cash with the securities lender. In a securities loaned transac-tion, the Group generally receives either cash collateral, in an amount equal to orin excess of the market value of securities loaned, or securities. If the securitiesreceived may be sold or repledged, they are accounted for as trading assets anda corresponding liability to return the security is recorded. The Group monitorsthe fair value of securities borrowed and securities loaned and additional collat-eral is obtained, if necessary. Fees received or paid are reported in interest revenues and interest expense, respectively. Securities owned and pledged as collateral under securities lending agreements in which the counterparty has the right by contract or custom to sell or repledge the collateral are disclosed onthe Consolidated Balance Sheet in accordance with SFAS 140.
Loans held for sale are accounted for at the lower of cost or market and arereported as trading assets.The Group designates debt and marketable equity securities as either held fortrading purposes or available for sale at the date of acquisition. Trading assets, except for loans held for sale, and trading liabilities are carried attheir fair values and related realized and unrealized gains and losses are includedin trading revenues.Securities available for sale are carried at fair value with the changes in fair valuereported in accumulated other comprehensive income within shareholders’equity unless the security is subject to a fair value hedge, in which case changesin fair value resulting from the risk being hedged are recorded in other revenues.The amounts reported in other comprehensive income are net of deferredincome taxes and adjustments to insurance policyholder liabilities and deferredacquisition costs.Declines in fair value of securities available for sale below their amortized costthat are deemed to be other than temporary and realized gains and losses arereported in the Consolidated Statement of Income in net gains on securitiesavailable for sale. The amortization of premiums and accretion of discounts arerecorded in interest revenues. Generally, the weighted-average cost method isused to determine the cost of securities sold. Fair value is generally based on quoted market prices, price quotes from brokersor dealers or discounted expected cash flows.
Loans Held for Sale,Trading Assets and Liabilities, and Securities Available for Sale
Consolidated Financial Statements
Securities Borrowedand Securities Loaned
121

Derivatives All freestanding contracts considered to be derivatives for purposes of SFASNo. 133, “Accounting for Derivative Instruments and Hedging Activities”(“SFAS 133”) are carried at fair value in the balance sheet regardless of whetherthey are held for trading or nontrading purposes. Derivative features embeddedin other contracts that meet certain criteria are also measured at fair value. Fairvalues for derivatives are based on quoted market prices or pricing modelswhich take into account current market and contractual prices of the underlyinginstruments as well as time value and yield curve or volatility factors underlyingthe positions. Fair values also take into account expected market risks, modelingrisks, administrative costs and credit considerations. Assets and liabilities arisingfrom contracts covered by qualifying master netting agreements are reported ona net basis, in accordance with FASB Interpretation No. 39, “Offsetting ofAmounts Related to Certain Contracts” (“FIN 39”). The Group enters into various contracts for trading purposes, including swaps,futures contracts, forward commitments, options and other similar types of contracts and commitments based on interest and foreign exchange rates, andequity and commodity prices. Such positions are carried at their fair values aseither trading assets or trading liabilities, and related gains and losses areincluded in trading revenues. Derivative features embedded in other nontrading contracts are measured separately at fair value when they are not clearly and closely related to the hostcontract and meet the definition of a derivative. Unless designated as a hedge,changes in the fair value of such an embedded derivative are reported in tradingrevenues. The carrying amount is reported on the Consolidated Balance Sheetwith the host contract. Certain derivatives entered into for nontrading purposes, not qualifying forhedge accounting, that are otherwise effective in offsetting the effect of trans-actions on noninterest revenues and expenses are recorded in other assets orother liabilities with changes in fair value recorded in the same noninterest revenues and expense captions affected by the transaction being offset. Thechanges in fair value of all other derivatives not qualifying for hedge accountingare recorded in trading revenues. Beginning January1, 2001, the Group has applied hedge accounting in accordancewith SFAS 133. There are three possible types of hedges under this standard,each of which is accounted for differently: (1) fair value hedges, (2) cash flowhedges, and (3) hedges of net investments in foreign operations. For fair value hedges, changes in the fair value of the hedged asset or liabilitydue to the risk being hedged are recognized in earnings along with changes inthe entire fair value of the derivative. When hedging interest rate risk, for boththe derivative and the hedged item any interest accrued or paid is reported ininterest income or expense and the unrealized gains and losses from the fairvalue adjustments are reported in other revenues. When hedging the foreignexchange risk in an available-for-sale security, the fair value adjustments relatedto the foreign exchange exposures are also recorded in other revenues. Hedgeineffectiveness is reported in other revenues and is measured as the net effect ofthe fair value adjustments made to the derivative and the hedged item arisingfrom changes in the market rate or price related to the risk being hedged. If a fair value hedge is canceled because the derivative is terminated or de-des-ignated, any remaining interest rate related fair value adjustment made to thecarrying amount of a hedged debt instrument is amortized to interest over theremaining life of the original hedge. For other types of fair value adjustments oranytime the hedged asset or liability is sold or terminated, any basis adjustmentsare included in the calculation of the gain or loss on sale or termination.
122

For cash flow hedges, there is no special accounting for the hedged item andthe derivative is carried at fair value with changes in value reported initially inother comprehensive income to the extent the hedge is effective. These amountsinitially recorded in other comprehensive income are subsequently reclassifiedinto earnings in the same periods during which the forecasted transactionaffects earnings. Thus, for hedges of interest rate risk the amounts are amortizedinto interest revenues or expense along with the interest accruals on the hedgedtransaction. When hedging the foreign exchange risk in an available-for-salesecurity, the amounts resulting from foreign exchange risk are included in thecalculation of the gain or loss on sale once the hedged security is sold. Hedgeineffectiveness for cash flow hedges is recorded in other revenues and is gener-ally measured as the difference between the changes in fair value of the actualhedging derivative and a hypothetically perfect hedge. When cash flow hedges of interest rate risk are canceled, amounts remaining inaccumulated other comprehensive income are amortized to interest revenues orexpense over the original life of the hedge. For cancellations of other types ofcash flow hedges, the related amounts accumulated in other comprehensiveincome are reclassified into earnings either in the same income statement caption and period as the forecasted transaction, or in other revenues when it isno longer probable that the forecasted transaction will occur. For hedges of net investments in foreign operations, the portion of the change infair value of the derivative due to changes in the spot foreign exchange rate isrecorded as a foreign currency translation adjustment in other comprehensiveincome to the extent the hedge is effective, the remainder is recorded as otherrevenues. Any derivative de-designated as a hedge is transferred to trading assets and lia-bilities and marked to market with changes in fair value recognized in tradingrevenues. For any hedging derivative that is terminated, the difference betweenthe derivative’s carrying amount and the cash paid or received is recognized asother revenues. Prior to 2001, most of the derivatives entered into for nontrading purposes,although considered effective as economic hedges, did not qualify for hedgeaccounting mainly due to contemporaneous documentation requirements thatcould not be fulfilled when initially adopting U.S. GAAP after the fact. Conse-quently, these derivatives have been accounted for as trading derivatives, that is,they are marked to market and the changes in fair value are reported in tradingrevenues. In addition, for periods prior to January 1, 2001, hedge accounting was differentfor the limited cases where it was applied for certain interest rate and foreigncurrency hedges. Interest rate swaps were accounted for as off-balance sheettransactions with interest payable or receivable recorded on an accrual basis. For cross currency interest rate swaps, interest was accrued and the foreign currency notional amount of the swaps was translated at spot rates with theresulting gain or loss reported in earnings. No special accounting was applied tothe hedged items.
Consolidated Financial Statements 123

Loans
Leasing Transactions
Allowances for Credit Losses
Loans generally are carried at their outstanding unpaid principal balances net ofcharge-offs, unamortized premiums or discounts, and deferred fees and costson originated loans. Interest revenues are accrued on the unpaid principal balance net of charge-offs. Net deferred fees and premiums or discounts arerecorded as an adjustment of the yield (interest revenues) over the lives of therelated loans. Loans are placed on nonaccrual status if either the loan has been in default as topayment of principal or interest for 90 days or more and the loan is neither wellsecured nor in the process of collection; or the loan is not yet 90 days past due,but in the judgment of management the accrual of interest should be ceasedbefore 90 days because it is probable that all contractual payments of interestand principal will not be collected. When a loan is placed on nonaccrual status,any accrued but unpaid interest previously recorded is reversed against currentperiod interest revenues. Cash receipts of interest on nonaccrual loans arerecorded as either interest revenues or a reduction of principal according tomanagement’s judgment as to the collectability of principal.
Lease financing transactions, which include direct financing and leveragedleases, in which a Group entity is the lessor are classified as loans. Unearnedincome is amortized to interest revenues over the lease term using the interestmethod. Capital leases in which a Group entity is the lessee are capitalized asassets and reported in premises and equipment.
The allowances for credit losses represent management’s estimate of probablelosses that have occurred in the loan portfolio and other lending-related commit-ments as of the date of the consolidated financial statements. The allowance forloan losses is reported as a reduction of loans and the allowance for credit losseson lending-related commitments is reported in other liabilities. To allow management to determine the appropriate level of the allowance forloan losses, all significant counterparty relationships are reviewed periodically,as are loans under special supervision, such as impaired loans. Smaller-balancestandardized homogeneous loans are collectively evaluated for impairment. Thisreview encompasses current information and events related to the counterparty,as well as industry, geographic, economic, political, and other environmentalfactors. This process results in an allowance for loan losses which consists of aspecific loss component and an inherent loss component. The specific loss component is the allowance for impaired loans as calculatedunder SFAS No. 114, “Accounting by Creditors for Impairment of a Loan” asamended by SFAS No. 118, “Accounting by Creditors for Impairment of a Loan –Income Recognition and Disclosures” (collectively “SFAS 114”). Impaired loansrepresent loans for which, based on current information and events, manage-ment believes it is probable that the Group will not be able to collect all principaland interest amounts due in accordance with the contractual terms of the loanagreement. The specific loss component of the allowance is measured by theexcess of the recorded investment in the loan, including accrued interest, overeither the present value of expected future cash flows, the fair value of theunderlying collateral or the market price of the loan. Impaired loans are generallyplaced on nonaccrual status. The inherent loss component is for all other loans not individually evaluated butthat, on a portfolio basis, are believed to have some inherent loss, in accordancewith SFAS No. 5, “Accounting for Contingencies” (“SFAS 5”). The inherent losscomponent consists of an allowance for country risk, an allowance for smaller-balance standardized homogeneous exposures and an other inherent loss
124

component. The country risk component is for loan exposures in countrieswhere there are serious doubts about the ability of counterparties to complywith the repayment terms due to the economic or political situation prevailing inthe respective country of domicile, that is, for transfer and currency convertibilityrisks. The allowance for smaller-balance standardized homogeneous exposuresis established for loans to individuals and small business customers of the private and retail business. These loans are evaluated for inherent loss on a col-lective basis, based on analyses of historical loss experience from each producttype according to criteria such as past due status and collateral recovery values.The other inherent loss component represents an estimate of inherent lossesresulting from the imprecisions and uncertainties in determining credit losses.Loans subject to this component of the allowance exclude those that have beendetermined to be impaired under SFAS 114. This component is determined bycalculating the ratio of an entity’s historical average loan losses (net of recover-ies) to the historical average of its loan exposures, applying the resulting ratio tothe corresponding period end loans and adjusting the results for relevant envi-ronmental factors. During 2002, the measurement of the other inherent losscomponent was refined to incorporate an expected loss measure, which consid-ers among other factors, collateral, maturities, and long-term statistical averagesof default and loss history. This refinement was made in order to make the provision more sensitive to the prevailing credit environment and less based onhistorical loss experience.Amounts determined to be uncollectable are charged to the allowance. Sub-sequent recoveries, if any, are credited to the allowance. The provision for loanlosses, which is charged to income, is the amount necessary to adjust theallowance to the level determined through the process described above. The allowance for credit losses on lending-related commitments is determinedusing the same measurement techniques as the allowance for loan losses.
Consolidated Financial Statements 125

Asset Securitizations
Premises and Equipment
When the Group transfers financial assets to securitization trusts in securitiza-tions of mortgage or other loan portfolios, it may retain one or more sub-ordinated tranches, cash reserve accounts, or in some cases, servicing rights orinterest-only strips, all of which are retained interests in the securitized assets.The amount of the gain or loss on transfers accounted for as sales depends inpart on the previous carrying amounts of the financial assets involved in thetransfer, allocated between the assets sold and the retained interests based ontheir relative fair values at the date of transfer. Retained interests other than serv-icing rights are classified as trading assets, securities available for sale or otherassets depending on the nature of the retained interest and management intent.Servicing rights are classified in intangible assets, carried at the lower of the allocated basis or current fair value and amortized in proportion to and over the period of net servicing revenue. To obtain fair values, quoted market prices are used if available. However, forsecurities representing retained interests from securitizations of financial assets,quotes are often not available, so the Group generally estimates fair value basedon the present value of future expected cash flows using management’s bestestimates of the key assumptions (loan losses, prepayment speeds, forwardyield curves, and discount rates) commensurate with the risks involved. Interestrevenues on retained interests is recognized using the effective yield method.Securitization trusts that meet the criteria for QSPEs, as defined in SFAS 140, arenot consolidated.
Premises and equipment are stated at cost less accumulated depreciation.Depreciation is generally computed using the straight-line method over the esti-mated useful lives of the assets. The range of estimated useful lives is 25 to 50years for premises and 3 to 10 years for furniture and equipment. Leaseholdimprovements are depreciated on a straight-line basis over the shorter of theterm of the lease or the estimated useful life of the improvement, which is gen-erally 3 to 15 years. Depreciation of premises is included in net occupancyexpense of premises, while depreciation of equipment is included in furnitureand equipment expense or IT costs. Maintenance and repairs are charged toexpense and improvements are capitalized. Gains and losses on dispositions arereflected in other revenues. Leased properties meeting certain criteria are capitalized as assets in premisesand equipment and depreciated over the terms of the leases. Eligible costs related to software developed or obtained for internal use are cap-italized and depreciated using the straight-line method over a period of 3 to 5years. Eligible costs include external direct costs for materials and services, aswell as payroll and payroll related costs for employees directly associated withan internal-use software project. Overhead, as well as costs incurred duringplanning or after the software is ready for use, is expensed as incurred.
126

Prior to January 1, 2002, goodwill and other intangible assets, which includesservicing rights related to asset securitizations, were amortized over their esti-mated useful lives. Goodwill, which represents the excess of cost over the fairvalue of net assets acquired at the date of acquisition, was amortized on astraight-line basis over a period not exceeding fifteen years. In accordance withSFAS 142, as of January 1, 2002, goodwill is no longer amortized and is tested forimpairment annually, or more frequently if events or changes in circumstancesindicate that the goodwill may be impaired, such as an adverse change in busi-ness climate. Other intangible assets in existence at January 1, 2002, have afinite useful life and continue to be amortized over a period of 3 to 15 years. Inaddition, other intangible assets acquired subsequent to January 1, 2002, thatwere determined to have an indefinite useful life, primarily investment manage-ment agreements related to retail mutual funds, are not amortized and are testedfor impairment at least annually.
Securities available for sale, equity method and direct investments (includinginvestments in venture capital companies and nonmarketable equity securities)are subject to impairment reviews. An impairment charge is recorded if a declinein fair value below the asset’s amortized cost or carrying value, depending onthe nature of the asset, is deemed to be other than temporary. Other intangible assets with finite useful lives and premises and equipment arealso subject to impairment reviews if a change in circumstances indicates thatthe carrying amount of an asset may not be recoverable. If estimated undis-counted cash flows relating to an asset held and used are less than its carryingamount, an impairment charge is recorded to the extent the fair value of theasset is less than its carrying amount. For an asset to be disposed of by sale, aloss is recorded based on the lower of the asset’s carrying value or fair value lesscost to sell. An asset to be disposed of other than by sale is considered held andused and accounted for as such until it is disposed of. Prior to January 1, 2002, goodwill was subject to an impairment review if achange in circumstances indicated that its carrying amount may not be recover-able. As of January 1, 2002, goodwill and other intangible assets which are notamortized are tested for impairment at least annually according to SFAS 142.
Consolidated Financial Statements
Goodwill and OtherIntangible Assets
Impairment
127

Income Taxes
Share-Based Compensation
The Group recognizes the current and deferred tax consequences of all trans-actions that have been recognized in the consolidated financial statements, usingthe provisions of the appropriate jurisdictions’ tax laws. Deferred tax assets andliabilities are recognized for the future tax consequences attributable to differ-ences between the financial statement carrying amounts of existing assets andliabilities and their respective tax bases, net operating loss carryforwards and taxcredits. The amount of deferred tax assets is reduced by a valuation allowance, if necessary, to the amount that, based on available evidence, managementbelieves will more likely than not be realized. Deferred tax liabilities and assets are adjusted for the effect of changes in taxlaws and rates in the period that includes the enactment date.
The Group has elected to account for its share awards under the intrinsic value-based method of accounting prescribed by Accounting Principles Board OpinionNo. 25, “Accounting for Stock Issued to Employees” (“APB 25”) as permitted by SFAS No. 123, “Accounting for Stock-Based Compensation” (“SFAS 123”).Under the intrinsic value-based method, compensation expense is the excess, ifany, of the quoted market price of the shares at grant date or other measure-ment date over the amount an employee must pay, if any, to acquire the shares.Compensation expense is recorded over the period in which employees performservices to which the awards relate. Compensation expense is reversed in theperiod an award is forfeited. The Group records its obligations under outstanding deferred share awards inshareholders’ equity as share awards – common shares issuable. The relateddeferred compensation is also included in shareholders’ equity. These classifica-tions are based upon the Group’s intent to settle these awards with its commonshares. Compensation expense for share-based awards payable in cash isremeasured based on the underlying share price changes and the related obliga-tions are included in other liabilities until paid.
128

The following table illustrates the effect on net income and earnings per share if the Group had applied the fair value recognition provisions of SFAS 123 toshare-based awards.
Comprehensive income is defined as the change in equity of an entity excludingtransactions with shareholders such as the issuance of common or preferredshares, payment of dividends and purchase of treasury shares. Comprehensiveincome has two major components: net income, as reported in the ConsolidatedStatement of Income, and other comprehensive income as reported in the Con-solidated Statement of Comprehensive Income. Other comprehensive incomeincludes such items as unrealized gains and losses from translating net invest-ments in foreign operations net of related hedge effects, unrealized gains andlosses from changes in fair value of securities available for sale, net of deferredincome taxes and the related adjustments to insurance policyholder liabilitiesand deferred acquisition costs, minimum pension liability and the effective portions of realized and unrealized gains and losses from derivatives used ascash flow hedges, less amounts reclassified to earnings in combination with thehedged items. Comprehensive income does not include changes in the fairvalue of nonmarketable equity securities, traditional credit products and otherassets generally carried at cost.
For purposes of the Consolidated Statement of Cash Flows, the Group’s cashand cash equivalents are cash and due from banks.
Insurance Premiums. Insurance premiums from long duration life and healthcontracts are earned when due. Premiums from short duration contracts, prima-rily property and casualty, are earned over the period of the contract in propor-tion to the amount of insurance protection provided. The Group does not havesignificant reinsurance activities.
Consolidated Financial Statements
Cash Flow Statement
Insurance Activities
129
ComprehensiveIncome
in ¤ m. Dec 31, 2002 Dec 31, 2001 Dec 31, 2000
Net income, as reported 397 167 13,513
Add: Share-based compensation expense includedin reported net income, net of related tax effects 228 671 884
Deduct: Share-based compensation expense determined under fair value method for all awards, net of related tax effects (478) (875) (822)
Pro forma net income (loss) 147 (37) 13,575
Earnings (loss) per share
Basic – as reported ¤ 0.64 ¤ (0.27 ¤ 22.00
Basic – pro forma ¤ 0.24 ¤ (0.06) ¤ 22.10
Diluted – as reported ¤ 0.63 ¤ (0.27 ¤ 21.72
Diluted – pro forma ¤ 0.23 ¤ (0.06) ¤ 21.82

Deferred Acquisition Costs. Acquisition costs that vary with and are primarilyrelated to the acquisition of new and renewal insurance contracts, principallycommissions, certain underwriting and agency expenses and the costs of issu-ing policies, are deferred to the extent that they are recoverable from future earn-ings. Deferred acquisition costs for nonlife business are amortized over the pre-mium-paying period of the related policies. Deferred acquisition costs of lifebusiness are generally amortized over the life of the insurance contract or at aconstant rate based upon the present value of estimated gross profits or esti-mated gross margins expected to be realized. Deferred acquisition costs arereported in other assets related to insurance business.
Unit-Linked Business. Liabilities under unit-linked business where the invest-ment risk is borne by the contract holders represent funds for contracts in whichinvestment income and investment gains and losses accrue directly to the con-tract holders, as well as reserves for mortality risks and expenses related tothose contracts. The assets related to these accounts are legally segregated andare not subject to claims that arise out of any other business of the Group. Theassets are carried at fair value. Deposits received under unit-linked businesshave been reduced for amounts assessed for management services and risk pre-miums. Deposits, net investment income and realized investment gains andlosses for these accounts are excluded from revenues and related liabilityincreases are excluded from expenses.
Other Liabilities Included in Insurance Policy Claims and Reserves. Inaddition to the reserve for unit-linked business, the liability for insurance policyclaims and reserves includes benefit reserves, a provision for premium refundsand property and casualty loss reserves.Benefit reserves for life business, annuities and health policies have been com-puted based upon mortality, morbidity, persistency and interest rate assump-tions applicable to these coverages, including provisions for adverse deviation.Participating life contracts include provisions for terminal dividends. Theseassumptions consider Group experience and industry standards and may berevised if it is determined that future experience will differ substantially fromthose previously assumed. The provision for premium refunds includes amounts allocated to policyholderaccounts under relevant local statutory or contractual requirements as well asamounts that result from differences between these financial statements andstatutory financial statements and that will reverse and enter into future deferredprofit sharing calculations. Unrealized gains and losses in connection with thevaluation of investments are also recognized in the provision for premiumrefunds to the extent that the policyholder will participate in such gains and losses on the basis of statutory or contractual regulations when they arerealized. Property and casualty loss reserves include estimates for both reported andunreported claims incurred and related claims adjustment expenses. Lossreserves for property and casualty insurance represent the estimated ultimateunpaid cost of all incurred claims and are adjusted regularly based on experience.Unearned premiums for property and casualty insurance included in other insur-ance provisions represent the unexpired portion of policy premiums.
130

In determining insurance reserves, the Group performs a continuing review of itsoverall position, its reserving techniques and its reinsurance. Since the reservesare based on estimates, the ultimate liability may be more or less than carriedreserves. The effects of changes in such estimated reserves are included in earn-ings in the period in which the estimates are changed.
[2] Impact of Changes in Accounting Principles
Effective January 1, 2002, the Group adopted SFAS No.141, “Business Combina-tions” (“SFAS 141”) and SFAS No. 142. SFAS 141 requires that all business com-binations initiated after June 30, 2001, be accounted for by the purchase methodand eliminates the use of the pooling-of-interests method. Other provisions ofSFAS 141 and SFAS 142 require that, as of January 1, 2002, goodwill no longer be amortized, reclassifications between goodwill and other intangible assets bemade based upon certain criteria, and, once allocated to reporting units (thebusiness segment level, or one level below), that tests for impairment of good-will be performed at least annually. Upon adoption of the requirements ofSFAS 142 as of January 1, 2002, the Group discontinued the amortization ofgoodwill with a net carrying amount of ¤ 8.7 billion. Upon adoption, the Grouprecognized a ¤ 37 million tax-free gain as a cumulative effect of a change inaccounting principle from the write-off of negative goodwill and there were noreclassifications between goodwill and other intangible assets. SFAS 142 doesnot require retroactive restatement for all periods presented, however, pro formainformation for 2001 and 2000 is provided (see Note [12]) and assumes thatSFAS 142 was in effect as of January 1, 2000.
Effective January 1, 2001, the Group adopted SFAS 133. SFAS 133, as amended,establishes accounting and reporting standards for derivative instruments,including certain derivative instruments embedded in other contracts, and forhedging activities. It requires companies to recognize all derivatives on the bal-ance sheet as assets or liabilities measured at fair value. The change in a deriva-tive’s fair value is generally recognized in current period earnings or equity. Uponadoption of SFAS 133, the Group recorded a net transition expense of ¤ 207 mil-lion, net of an income tax benefit of ¤ 118 million, as a cumulative effect of achange in accounting principle. This amount was primarily due to the adjust-ment required to bring certain embedded derivatives to fair value and to adjustthe carrying amount of the related host contracts (items in which the derivativesare embedded) at January 1, 2001, pursuant to the SFAS 133 transition provi-sions for embedded derivatives that must be accounted for separately. As per-mitted by SFAS 133, upon adoption the Group transferred debt securities with afair value of ¤ 22,101 million from securities available for sale to trading assetsand recognized the related unrealized gains of ¤ 150 million in earnings for theyear ended December 31, 2001.
Consolidated Financial Statements
SFAS 141 and 142
SFAS 133
131

Effective April 1, 2001, the Group adopted EITF Issue No. 99-20, “Recognition ofInterest Income and Impairment on Purchased and Retained Beneficial Interestsin Securitized Financial Assets” (“EITF 99-20”). EITF 99-20 provides guidanceregarding income recognition and determination of impairment on certain asset-backed securities held as investments, with particular impact on those invest-ments held outside of trading accounts. The adoption of EITF 99-20 did not havea material impact on the Group’s consolidated financial statements.
[3] Acquisitions and Dispositions
The Group acquired National Discount Brokers Group, Inc. (“NDB”) in two stepswith control being achieved in November 2000. The total purchase price wasapproximately U.S.$ 1.0 billion. The acquisition was accounted for as a purchase,which resulted in the recording of goodwill of U.S.$ 616 million. In the periodfrom the acquisition to December 31, 2001, goodwill was amortized on astraight-line basis based upon an estimated useful life of 15 years. In September2001, Deutsche Bank sold NDB’s on-line brokerage business to AmeritradeHolding Corp., which reduced goodwill related to the NDB acquisition byU.S.$ 146 million. As a result of this transaction, the Group owned approximately13 percent of Ameritrade Holding Corp. This share was reduced to approxi-mately 9 percent as of December 31, 2002.During 2001, the Group committed to a plan to dispose of the commercialfinance operation in North America and, therefore, the business was valued atthe lower of carrying value or fair value less cost to sell, resulting in a ¤ 80 millioncharge. During 2002, the commercial and consumer finance businesses ofDeutsche Financial Services were sold resulting in an additional net loss of¤ 236 million. The remaining assets of these businesses are currently in theprocess of being liquidated.In the second quarter of 2002, the Group purchased Zurich Scudder Invest-ments, Inc., the Scudder asset management business. This transaction wastreated as an exchange of the Group’s German insurance holding company Ver-sicherungsholding der Deutschen Bank Aktiengesellschaft (Deutscher Herold)and a net cash payment of approximately ¤ 1.7 billion for Scudder. The purchaseresulted in goodwill of approximately ¤ 1.0 billion and indefinite useful life intan-gible assets of ¤ 1.1billion. In addition, Deutsche Bank sold insurance subsidiariesdomiciled in Spain, Italy, and Portugal. These transactions resulted in gains of¤ 494 million in Personal Banking and ¤ 8 million in Asset Management.In April 2002 the Group acquired RoPro U.S. Holding, Inc., which is the holdingcompany for the U.S. based real estate investment manager RREEF. The pur-chase price for this acquisition amounted to approximately U.S.$ 501 million.Goodwill amounted to U.S.$ 306 million.Following the agreement reached in 2001, in the third quarter of 2002 the Group merged its mortgage bank subsidiary, EUROHYPO AG EuropäischeHypothekenbank der Deutschen Bank, with the mortgage bank subsidiaries ofDresdner Bank and Commerzbank, to form the new EUROHYPO AG. This trans-action resulted in a deconsolidation from the Group’s consolidated financial state-ments and the recognition of a net gain of ¤ 418 million. After the merger, theGroup’s share in the combined entity was 34.6%. Since the merger in August2002, the Group has accounted for this investment under the equity method.The acquisitions and disposals which occurred in 2002 led to a net reduction of total assets of approximately ¤ 93 billion, as compared to December 31, 2001.
132
EITF 99-20

[4] Trading Assets and Trading Liabilities
The components of these accounts are as follows:
in ¤ m. Dec 31, 2002 Dec 31, 2001
Bonds and other fixed-income securities 175,042 150,698
Equity shares and other variable-yield securities 47,354 77,683
Positive market values from derivative financial instruments1 65,729 60,622
Other trading assets2 8,937 4,650
Total trading assets 297,062 293,653
Bonds and other fixed-income securities 51,124 48,784
Equity shares and other variable-yield securities 17,987 18,346
Negative market values from derivative financial instruments1 62,101 54,199
Total trading liabilities 131,212 121,329
1 Derivatives under master netting agreements are shown net.2 Includes loans held for sale.
Consolidated Financial Statements 133

[5] Securities Available for Sale
The fair value, amortized cost and gross unrealized holding gains and losses forthe Group’s securities available for sale follow:
134
Dec 31, 2002
Fair Gross Unrealized AmortizedValue Holding Cost
in ¤ m. Gains Losses
Debt securities
German government 396 20 – 376
U.S. Treasury and U.S. government agencies 168 – – 168
U.S. local (municipal) governments 2 – – 2
Other foreign governments 2,893 39 (18) 2,872
Corporates 6,400 231 (47) 6,216
Other asset-backed securities 2,977 – – 2,977
Mortgage-backed securities, principally obligations of U.S. federal agencies 164 1 – 163
Other debt securities 652 1 (3) 654
Equity securities
Equity shares 6,441 757 (596) 6,280
Investment certificates and mutual funds 1,499 10 (55) 1,544
Other 27 16 – 11
Total securities available for sale 21,619 1,075 (719) 21,263
Dec 31, 2001
Fair Gross Unrealized AmortizedValue Holding Cost
in ¤ m. Gains Losses
Debt securities
German government 4,339 66 (9) 4,282
U.S. Treasury and U.S. government agencies 192 – – 192
U.S. local (municipal) governments 50 – – 50
Other foreign governments 14,676 229 (210) 14,657
Corporates 22,116 643 (193) 21,666
Other asset-backed securities 3,189 12 (2) 3,179
Mortgage-backed securities, principally obligations of U.S. federal agencies 1,083 21 (1) 1,063
Other debt securities 1,857 55 (1) 1,803
Equity securities
Equity shares 22,600 10,022 (750) 13,328
Investment certificates and mutual funds 1,507 48 (13) 1,472
Other 57 36 – 21
Total securities available for sale 71,666 11,132 (1,179) 61,713

At December 31, 2002, securities issued by DaimlerChrysler AG with a fair valueof ¤ 3.4 billion were the only securities of an individual issuer that exceeded 10% of the Group’s total shareholders’ equity.The components of net gains on securities available for sale as reported in theConsolidated Statement of Income follow:
On January 1, 2001, the Group transferred debt securities with a fair value of¤ 14.9 billion from trading assets to securities available for sale. There was noimpact on earnings from this transfer which primarily involved securities issued byGerman and other foreign governments. Prior to 2001, these securities were riskmanaged together with derivatives which were classified as trading mainly due tocontemporaneous hedge documentation requirements that could not be fulfilledwhen initially adopting U.S. GAAP after the fact. Beginning 2001, these securitiesare hedged in accordance with the Group’s management practices with deriva-tives that qualify for hedge accounting and were reclassified accordingly. In 2000, the Group transferred certain portfolios, consisting of mutual funds withan aggregate cost of ¤ 170 million, from securities available for sale to tradingassets. These available for sale securities were not subject to active risk man-agement or included in market risk reporting. Management concluded that themarket risk management on these securities would be enhanced by movingresponsibility for them to the risk managers of the Group’s trading portfolio. The
Dec 31, 2000
Fair Gross Unrealized AmortizedValue Holding Cost
in ¤ m. Gains Losses
Debt securities
German government 634 11 (5) 628
U.S. Treasury and U.S. government agencies 172 – (1) 173
U.S. local (municipal) governments 17 – – 17
Other foreign governments 16,902 277 (227) 16,852
Corporates 37,200 1,360 (797) 36,637
Other asset-backed securities 4,252 35 (53) 4,270
Mortgage-backed securities, principally obligations of U.S. federal agencies 3,803 21 (51) 3,833
Other debt securities 200 17 – 183
Equity securities
Equity shares 27,136 14,493 (607) 13,250
Investment certificates and mutual funds 1,769 128 (15) 1,656
Other 165 45 (6) 126
Total securities available for sale 92,250 16,387 (1,762) 77,625
in ¤ m. 2002 2001 2000
Debt securities – gross realized gains 149 405 268
Debt securities – gross realized losses1 (235) (256) (363)
Equity securities – gross realized gains 4,094 2,376 4,288
Equity securities – gross realized losses2 (485) (1,009) (523)
Net gains on securities available for sale 3,523 1,516 3,670
1 Includes ¤ 156 million and ¤ 27 million of write-downs for other-than-temporary impairment for the years ended December 31, 2002 and 2001, respectively.
2 Includes ¤ 152 million and ¤ 401 million of write-downs for other-than-temporary impairment for the years ended December 31, 2002 and 2001, respectively.
Consolidated Financial Statements 135

resulting gross gain on the transfer of ¤ 337 million was recognized in net gainson securities available for sale for the year ended December 31, 2000. The following table shows the fair value, remaining maturities, approximateweighted-average yields (based on amortized cost) and total amortized cost bymaturity distribution of the debt security components of the Group’s securitiesavailable for sale at December 31, 2002:
[6] Other Investments
The following table summarizes the composition of other investments:
Investments over which the Group has significant influence, generally evidencedby a 20 to 50 % ownership of the voting stock of a corporation or 3% or more ofa limited partnership, are accounted for under the equity method of accounting.These investments totaled ¤ 6.0 billion and ¤ 5.3 billion at December 31, 2002and 2001, respectively. The aggregate market value of the investments in activelytraded listed companies amounted to ¤ 269 million at December 31, 2002. Theseinvestments had an aggregated carrying value of ¤ 210 million. The Group’s pro-rata share of the investees’ income or loss determined on a U.S. GAAP basiswas a loss of ¤ 753 million and a loss of ¤ 278 million for the years endedDecember 31, 2002 and 2001, respectively. In addition, amortization of goodwillof ¤ 31 million for the year ended December 31, 2001, and write-offs for other-than-temporary impairments of ¤ 305 million and ¤ 113 million for the yearsended December 31, 2002 and 2001, respectively, were included in net income(loss) from equity method investments.
136
Equity Method Investments
Up to one More than one More than five More than Totalyear year and up to years and up to ten years
five years ten years
in ¤ m. Amount Yield Amount Yield Amount Yield Amount Yield Amount Yield
German government 3 6.61% 91 3.65% 252 4.09% 50 4.46% 396 4.06%
U.S. Treasury and U.S. government agencies 142 2.67% 3 4.92% – 23 7.88% 168 3.43%
U.S. local (municipal) governments 2 5.00% – – – 2 5.00%
Other foreign governments 1,929 3.23% 599 5.31% 216 4.55% 149 4.58% 2,893 3.83%
Corporates 2,020 4.52% 2,497 4.50% 1,032 5.52% 851 7.69% 6,400 5.11%
Other asset-backed securities – 5 6.14% – 2,972 5.75% 2,977 5.75%
Mortgage-backed securities, principally obligations of U.S. federal agencies 164 4.97% – – – 164 4.97%
Other debt securities 525 2.08% 119 3.25% 8 1.96% – 652 2.29%
Total fair value 4,785 3,314 1,508 4,045 13,652
Total amortized cost 4,657 3,276 1,444 4,051 13,428
in ¤ m. Dec 31, 2002 Dec 31, 2001
Equity method investments 6,039 5,344
Investments held by designated investment companies 230 274
Other equity interests 4,499 6,379
Total 10,768 11,997

Related party loans to equity method investees amounted to ¤ 3,485 million and¤ 1,348 million at December 31, 2002 and 2001, respectively. At December 31,2002 loans totaling ¤ 117 million to two equity method investees were on nonac-crual status. At December 31, 2001, loans totaling ¤ 181 million to three equitymethod investees were on nonaccrual status.At December 31, 2002, the following investees represented 75% of the carryingvalue of equity method investments:
The following two equity method investments are considered to be significanton an individual basis.
Gerling-Konzern Versicherungs-Beteiligungs-AG. For the years endedDecember 31, 2002, 2001 and 2000, the Group recognized ¤ (706) million,¤ (125) million and ¤ 57 million respectively, as the Group’s share of the netincome (loss) from the Gerling-Konzern Versicherungs-Beteiligungs-AG. As theyear 2002 financial statements are not yet available, the loss in 2002 includes theGroup’s share of the anticipated IAS loss, adjusted for estimated U.S. GAAP-spe-cific adjustments and loss contingencies.
Investment Ownership
AKA Ausfuhrkredit-Gesellschaft mit beschränkter Haftung, Frankfurt am Main 26.89%
AMP Private Capital Portfolio No. 1 L.P., London 16.67%
Arrow Property Investments Limited, London 46.18%
AW-Beteiligungs GmbH, Ochsenfurt 37.88%
Cassa di Risparmio di Asti S.p.A., Asti 20.00%
DB 100 Unit Trust, Georgetown 27.71%
DBG Osteuropa-Holding GmbH, Frankfurt am Main 50.00%
DBG Vermögensverwaltungsgesellschaft mbH, Frankfurt am Main 45.00%
Deutsche European Partners IV, London 24.92%
Deutsche EuroShop AG, Eschborn/Ts. 44.91%
Deutsche Interhotel Holding GmbH & Co. KG, Berlin 45.64%
EUROHYPO AG, Frankfurt am Main 34.64%
Fondo Piramide Globale, Milan 34.03%
Gerling NCM Credit and Finance AG, Köln1 9.55%
Gerling-Konzern Versicherungs-Beteiligungs-AG, Köln 34.56%
IMLY B.V., Rotterdam 40.00%
K&N Kenanga Holdings Bhd, Kuala Lumpur 16.59%
Mannesmann GmbH & Co. Beteiligungs-KG, Eschborn/Ts. 10.00%
MEFIS Beteiligungsgesellschaft mbH, Eschborn/Ts. 43.00%
Orbis S.A., Warsaw 10.37%
Santorini Investments Limited Partnership, Edinburgh2 51.04%
The Kinetics Group, Inc., Santa Clara 33.60%
United Biscuits (Equity) Ltd., Georgetown 20.40%
1 28.87% direct and indirect holdings.2 The Group does not have control over this investee.
Consolidated Financial Statements 137

The following table provides a summary of Gerling-Konzern Versicherungs-Beteiligungs-AG’s consolidated statement of income according to IAS:
The following table provides a summary of Gerling-Konzern Versicherungs-Beteiligungs-AG’s consolidated balance sheet according to IAS:
In 2003, the following events have occurred with respect to Gerling-Konzern Versicherungs-Beteiligungs-AG: – the sale of its reinsurance unit (Gerling-Konzern Globale Rückversicherungs-AG)
to Globale Management GmbH (former name: Lago Achte GmbH) was notapproved by the German Federal Financial Supervisory Authority (“BaFin”).
– its chief executive officer resigned.– its life insurance unit (Gerling-Konzern Lebensversicherungs-AG) and property
and casualty unit (Gerling-Konzern Allgemeine Versicherungs-AG) were down-graded by Standard & Poor’s from “A–” to “BB+”.
The Group is assessing the impact of these events on the value of Gerling-Konzern Versicherungs-Beteiligungs-AG and on the Group’s investment.
EUROHYPO AG. The following table provides a summary of EUROHYPO AG’sconsolidated statement of income according to German GAAP for the ninemonths ended September 30, 2002 and for the twelve months ended Decem-ber 31, 2001. These are the only available financials due to the fact that themerger took place in August 2002 but was effective January 1, 2002 for GermanGAAP purposes. Under German GAAP, the merger was accounted for similar toa pooling of interests.
138
in ¤ m. Dec 31, 2001
Investments 31,153
Other assets 13,226
Intangible assets 442
Total assets 44,821
Underwriting provisions 37,203
Other liabilities 5,816
Subordinated capital 369
Equity 1,433
Total liabilities and shareholders’ equity 44,821
in ¤ m. 2001 2000
Net earned premiums 8,349 7,630
Other income 2,358 2,815
Benefit and claim payments (9,159) (7,943)
Underwriting expenses (2,030) (1,921)
Other expenses (403) (386)
Net income (loss) before tax (885) 195
Income tax expense (benefit) (327) 27
Minority interests (5) 1
Net income (loss) (563) 169

The year 2001 figures below represent twelve months of pro forma informationas if the merger occurred on January 1, 2001:
The following table provides a summary of EUROHYPO AG’s consolidated balance sheet according to German GAAP (2001 pro forma figures):
The underlying investment holdings of the Group’s designated investment com-panies are carried at fair value, and totaled ¤ 230 million and ¤ 274 million atDecember 31, 2002 and 2001, respectively. The Group’s designated investmentcompanies, all of which are 100 % owned, consist of Small Business InvestmentCompanies (“SBICs”), and one designated investment company subsidiary inGermany.
Other equity interests totaling ¤ 4.5 billion and ¤ 6.4 billion at December 31, 2002and 2001, respectively, include investments in which the Group does not havesignificant influence, including certain venture capital companies and nonmar-ketable equity securities. These investments are generally accounted for at historical cost, net of write-offs for other-than-temporary impairments. The write-offs for other-than-temporary impairments of these investments amounted to¤ 423 million and ¤ 968 million for the years ended December 31, 2002 and 2001,respectively.
Investments Held by Designated Investment Companies
Other Equity Interests
Nine months ended Twelve months endedin ¤ m. Sep 30, 2002 Dec 31, 2001
Net interest and commission income 857 1,167
Administrative expenses (326) (457)
Net other operating income (expense) (92) (65)
Extraordinary items (150) (139)
Net income before tax 289 506
Income tax expense (benefit) 17 (11)
Net income 272 517
in ¤ m. Sep 30, 2002 Dec 31, 2001
Claims on banks 25,760 31,553
Claims on customers 168,447 173,362
Bonds and other fixed-income securities 38,484 42,328
Other assets 2,910 3,621
Total assets 235,601 250,864
Liabilities to banks 30,820 31,525
Liabilities to customers 42,139 43,575
Liabilities in certificate form 151,923 166,755
Provisions and other liabilities 6,332 5,121
Capital and reserves 4,387 3,888
Total liabilities and shareholders’ equity 235,601 250,864
Consolidated Financial Statements 139

[7] Loans
The following table summarizes the composition of loans:
The “other” category included no single industry group with aggregate borrow-ings from the Group in excess of 10 percent of the total loan portfolio at Decem-ber 31, 2002.Certain related third parties have obtained loans from the Group on various occa-sions. All such loans have been made in the ordinary course of business and onsubstantially the same terms, including interest rates and collateral, as thoseprevailing at the time for comparable transactions with unrelated persons. There were ¤ 897 million and ¤ 1.6 billion of related party loans (excluding loansto equity method investees) outstanding at December 31, 2002 and 2001,respectively.
140
in ¤ m. Dec 31, 2002 Dec 31, 2001
German
Banks and insurance 1,600 7,444
Manufacturing 9,388 12,612
Households (excluding mortgages) 13,768 13,509
Households – mortgages 25,226 35,283
Public sector 1,750 20,752
Wholesale and retail trade 4,549 6,559
Commercial real estate activities 15,841 28,311
Lease financing 416 436
Other 15,898 22,878
Total German 88,436 147,784
Non-German1
Banks and insurance 9,120 12,465
Manufacturing 13,157 19,490
Households (excluding mortgages) 6,937 7,873
Households – mortgages 7,276 6,503
Public sector 2,834 2,906
Wholesale and retail trade 9,918 9,200
Commercial real estate activities 2,519 7,306
Lease financing 3,905 3,263
Other 27,768 49,297
Total Non-German 83,434 118,303
Gross loans 171,870 266,087
Less: Unearned income 250 664
Less: Allowance for loan losses 4,317 5,585
Total loans, net 167,303 259,838
1 For 2001 certain exposures were reclassified from banks and insurance to other (¤ 6.5 billion) and from commercial real estate activitiesto households (¤ 2.8 billion).

This table sets forth information about the Group’s impaired loans:
[8] Allowances for Credit Losses
The allowances for credit losses consist of an allowance for loan losses and anallowance for credit losses on lending-related commitments. The following table shows the activity in the Group’s allowance for loan losses:
The following table shows the activity in the Group’s allowance for credit losseson lending-related commitments:
Impaired Loans
in ¤ m. Dec 31, 2002 Dec 31, 2001 Dec 31, 2000
Total impaired loans1 8,922 10,797 10,296
Allowance for impaired loans under SFAS 1142 3,144 3,720 4,577
Average balance of impaired loans during the year 9,710 10,363 7,399
Interest income recognized on impaired loansduring the year 166 248 376
1 Included in these amounts are ¤ 6.0 billion, ¤ 8.2 billion and ¤ 8.5 billion as of December 31, 2002, 2001 and 2000, respectively, thatrequire an allowance. The remaining impaired loans do not require a specific allowance because either the present value of expectedfuture cash flows, the fair value of the underlying collateral or the market price of the loan exceed the recorded investment.
2 The allowance for impaired loans under SFAS 114 is included in the Group’s allowance for loan losses.
in ¤ m. 2002 2001 2000
Balance, beginning of year 5,585 6,745 7,281
Provision for loan losses 2,091 1,024 478
Net charge-offs
Charge-offs (2,728) (2,055) (1,296)
Recoveries 112 67 75
Total net charge-offs (2,616) (1,988) (1,221)
Allowance related to acquisitions/divestitures (421) (156) 44
Foreign currency translation (322) (40) 163
Balance, end of year 4,317 5,585 6,745
in ¤ m. 2002 2001 2000
Balance, beginning of year 496 453 569
Provision for credit losses 17 (30) (33)
Net charge-offs – (22) (34)
Allowance related to acquisitions/divestitures (11) (2) 5
Foreign currency translation (17) 97 (54)
Balance, end of year 485 496 453
Consolidated Financial Statements 141
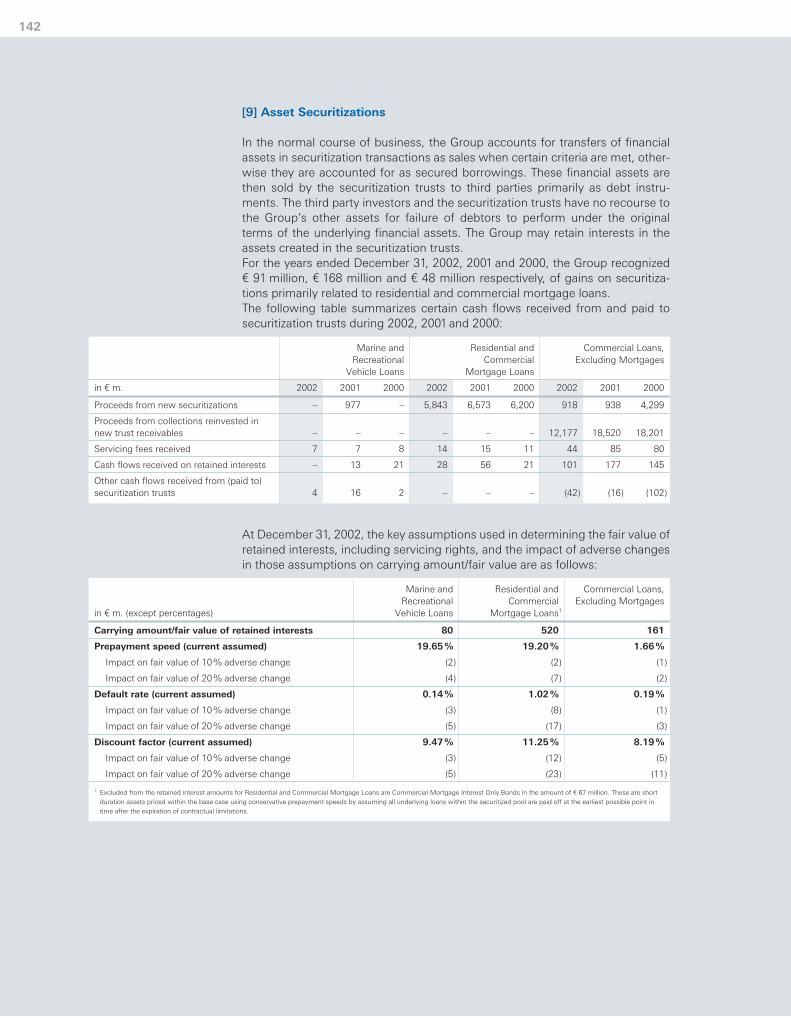
[9] Asset Securitizations
In the normal course of business, the Group accounts for transfers of financialassets in securitization transactions as sales when certain criteria are met, other-wise they are accounted for as secured borrowings. These financial assets arethen sold by the securitization trusts to third parties primarily as debt instru-ments. The third party investors and the securitization trusts have no recourse tothe Group’s other assets for failure of debtors to perform under the originalterms of the underlying financial assets. The Group may retain interests in theassets created in the securitization trusts. For the years ended December 31, 2002, 2001 and 2000, the Group recognized¤ 91 million, ¤ 168 million and ¤ 48 million respectively, of gains on securitiza-tions primarily related to residential and commercial mortgage loans. The following table summarizes certain cash flows received from and paid tosecuritization trusts during 2002, 2001 and 2000:
At December 31, 2002, the key assumptions used in determining the fair value ofretained interests, including servicing rights, and the impact of adverse changesin those assumptions on carrying amount/fair value are as follows:
142
Marine and Residential and Commercial Loans,Recreational Commercial Excluding Mortgages
Vehicle Loans Mortgage Loans
in ¤ m. 2002 2001 2000 2002 2001 2000 2002 2001 2000
Proceeds from new securitizations – 977 – 5,843 6,573 6,200 918 938 4,299
Proceeds from collections reinvested in new trust receivables – – – – – – 12,177 18,520 18,201
Servicing fees received 7 7 8 14 15 11 44 85 80
Cash flows received on retained interests – 13 21 28 56 21 101 177 145
Other cash flows received from (paid to) securitization trusts 4 16 2 – – – (42) (16) (102)
Marine and Residential and Commercial Loans,Recreational Commercial Excluding Mortgages
in ¤ m. (except percentages) Vehicle Loans Mortgage Loans1
Carrying amount/fair value of retained interests 80 520 161
Prepayment speed (current assumed) 19.65% 19.20% 1.66%
Impact on fair value of 10% adverse change (2) (2) (1)
Impact on fair value of 20% adverse change (4) (7) (2)
Default rate (current assumed) 0.14% 1.02% 0.19%
Impact on fair value of 10% adverse change (3) (8) (1)
Impact on fair value of 20% adverse change (5) (17) (3)
Discount factor (current assumed) 9.47% 11.25% 8.19%
Impact on fair value of 10% adverse change (3) (12) (5)
Impact on fair value of 20% adverse change (5) (23) (11)
1 Excluded from the retained interest amounts for Residential and Commercial Mortgage Loans are Commercial Mortgage Interest Only Bonds in the amount of ¤ 67 million. These are shortduration assets priced within the base case using conservative prepayment speeds by assuming all underlying loans within the securitized pool are paid off at the earliest possible point intime after the expiration of contractual limitations.

These sensitivities are hypothetical and should be viewed with caution. As thefigures indicate, changes in fair value based on a 10 percent variation in assump-tions generally should not be extrapolated because the relationship of thechange in assumption to the change in fair value may not be linear. Also, in thistable, the effect of a variation in a particular assumption on the fair value of theretained interest is calculated without changing any other assumptions; in real-ity, changes in one factor may result in changes in another (for example,increases in market interest rates may result in lower prepayments andincreased credit losses), which might counteract the sensitivities. The key assumptions used in measuring the initial retained interests resultingfrom securitizations completed in 2002 were not significantly different from thecurrent assumptions in the above table. The key assumptions used in measuring the initial retained interest resultingfrom securitizations completed in 2001 were not significantly different from thekey assumptions used in determining the fair value of retained interests, includ-ing servicing rights, at December 31, 2001. The assumptions used at Decem-ber 31, 2001 were as follows:
The following table presents information about securitized loans, including delin-quencies (loans which are 90 days or more past due) and credit losses, net ofrecoveries, for the years ended December 31, 2002 and 2001:
The table excludes securitized loans that the Group continues to service but otherwise has no continuing involvement.In January 2003, the FASB issued Interpretation No. 46, “Consolidation of Vari-able Interest Entities” (FIN 46). FIN 46 requires transitional disclosures where itis reasonably possible that the Group will have to consolidate or disclose infor-mation about certain entities when this Interpretation becomes fully effective onJuly 1, 2003. The following transitional disclosures are based on the Group’s preliminary assessment of the entities it is involved with as those entities are currently structured. The actual impact upon adoption may differ significantly.
Consolidated Financial Statements 143
Marine and Residential and Commercial Loans,Recreational Commercial Excluding
Vehicle Loans Mortgage Loans Mortgages
Prepayment speed 19.56% 12.00% 26.28%
Default rate 0.28% 2.71% 0.34%
Discount factor 9.76% 14.59% 10.85%
Marine and Residential and Commercial Loans,Recreational Commercial Excluding
Vehicle Loans Mortgage Loans Mortgages
in ¤ m. 2002 2001 2002 2001 2002 2001
Total principal amount of loans 1,178 2,033 12,409 14,929 1,266 7,483
Principal amount of loans 90 daysor more past due 3 3 223 81 35 39
Net credit losses 16 14 24 19 3 25

When this Interpretation becomes fully effective on July 1, 2003, it is reasonablypossible that the Group will be required to consolidate or provide disclosures forcertain types of entities as follows:
For commercial paper programs, the Group acts as an administrative agent tofacilitate the sale of loans, other receivables, or securities from various third par-ties to a commercial paper entity. The commercial paper entity then issues col-lateralized commercial paper to the market. The liabilities of the commercialpaper entity are nonrecourse to the Group, so the Group’s maximum exposureof loss results primarily from any guarantees or liquidity facilities provided to thevehicle. For certain fixed-term mutual funds that the Group manages, the Groupguarantees the value of mutual fund units that investors purchase. The Group’smaximum exposure of loss related to these mutual funds results primarily fromthese guarantees. For the commercial real estate leasing vehicles and closed-end funds, third party investors essentially provide senior financing for the purchase of commercial real estate which is leased to other third parties. TheGroup’s maximum exposure of loss results primarily from any subordinatedfinancing or guarantees that are provided to these vehicles. For asset securitiza-tion and other vehicles, the Group may purchase or retain a subordinated inter-est in the assets being securitized. The liabilities of these vehicles are mainlynonrecourse to the Group, so the Group’s maximum exposure of loss results pri-marily from the risk associated with the Group’s purchased and retained interestin the vehicles.
144
Dec 31, 2002
Total MaximumAssets Exposure
in ¤ m. to Loss
Commercial paper programs 19,229 23,765
Fixed-term mutual funds 13,719 13,719
Commercial real estate leasing vehicles and closed-end funds 8,181 5,246
Asset securitization and other 3,792 898

Consolidated Financial Statements
[10] Assets Pledged and Received as Collateral
The carrying value of the Group’s assets pledged (primarily for borrowings,deposits, and securities loaned) as collateral where the secured party does nothave the right by contract or custom to sell or repledge the Group’s assets are asfollows:
At December 31, 2002 and 2001, the Group has received collateral with a fairvalue of ¤ 253 billion and ¤ 218 billion, respectively, arising from securities pur-chased under reverse repurchase agreements, securities borrowed, derivativestransactions, customer margin loans and other transactions, which the Group asthe secured party has the right to sell or repledge. ¤ 154 billion and ¤ 202 billionfor the years ended December 31, 2002 and 2001, respectively, relates to collat-eral that the Group has received and sold or repledged primarily to cover shortsales, securities loaned and securities sold under repurchase agreements. Theseamounts exclude the impact of netting in accordance with FIN 41.
[11] Premises and Equipment, Net
An analysis of premises and equipment, including assets under capital leases,follows:
145
in ¤ m. Dec 31, 2002 Dec 31, 2001
Interest-earning deposits with banks – 2,027
Trading assets 26,266 42,244
Securities available for sale 445 1,675
Loans 12,275 12,557
Premises and equipment 586 347
Total 39,572 58,850
in ¤ m. Dec 31, 2002 Dec 31, 2001
Land 1,483 1,655
Buildings 5,842 6,293
Leasehold improvements 1,510 1,513
Furniture and equipment 3,270 3,772
Purchased software 502 737
Self-developed software 796 998
Construction-in-progress 346 237
Total 13,749 15,205
Less: Accumulated depreciation 4,866 5,399
Premises and equipment, net1 8,883 9,806
1 Amounts at December 31, 2002 and 2001 include ¤ 2.4 billion and ¤ 2.5 billion, respectively, of net book value of premises and equipment held for investment purposes.
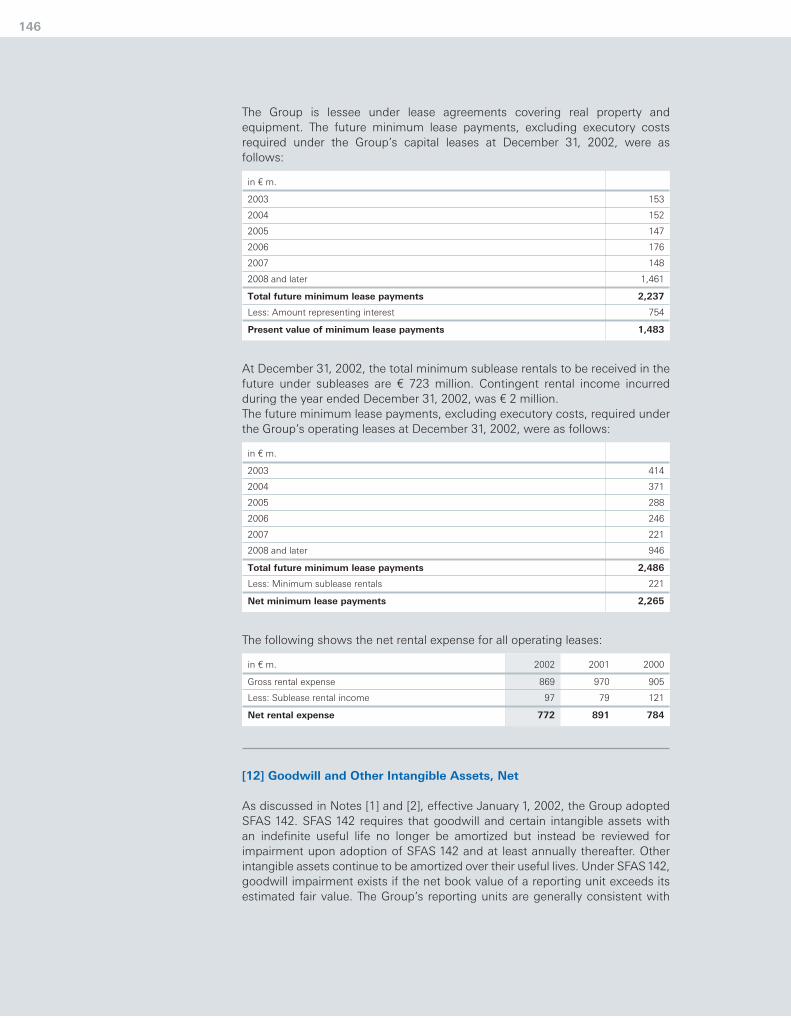
The Group is lessee under lease agreements covering real property and equipment. The future minimum lease payments, excluding executory costsrequired under the Group’s capital leases at December 31, 2002, were as follows:
At December 31, 2002, the total minimum sublease rentals to be received in thefuture under subleases are ¤ 723 million. Contingent rental income incurred during the year ended December 31, 2002, was ¤ 2 million.The future minimum lease payments, excluding executory costs, required underthe Group’s operating leases at December 31, 2002, were as follows:
The following shows the net rental expense for all operating leases:
[12] Goodwill and Other Intangible Assets, Net
As discussed in Notes [1] and [2], effective January 1, 2002, the Group adoptedSFAS 142. SFAS 142 requires that goodwill and certain intangible assets with an indefinite useful life no longer be amortized but instead be reviewed forimpairment upon adoption of SFAS 142 and at least annually thereafter. Otherintangible assets continue to be amortized over their useful lives. Under SFAS 142,goodwill impairment exists if the net book value of a reporting unit exceeds itsestimated fair value. The Group’s reporting units are generally consistent with
146
in ¤ m.
2003 153
2004 152
2005 147
2006 176
2007 148
2008 and later 1,461
Total future minimum lease payments 2,237
Less: Amount representing interest 754
Present value of minimum lease payments 1,483
in ¤ m.
2003 414
2004 371
2005 288
2006 246
2007 221
2008 and later 946
Total future minimum lease payments 2,486
Less: Minimum sublease rentals 221
Net minimum lease payments 2,265
in ¤ m. 2002 2001 2000
Gross rental expense 869 970 905
Less: Sublease rental income 97 79 121
Net rental expense 772 891 784

Other Intangible Assets
Consolidated Financial Statements
the Group’s business segment level, or one level below. There was no impair-ment charge resulting from the adoption of SFAS 142. The Group performs itsannual impairment review during the fourth quarter of each year, beginning inthe fourth quarter of 2002.A goodwill impairment loss of ¤ 62 million was recognized in the Private Equityreporting unit during 2002. A significant portion of the reporting unit was classi-fied as held for sale during the fourth quarter of 2002 resulting in an impairmentof the goodwill related to the remaining unit.
An analysis of acquired other intangible assets follows:
For the year ended December 31, 2002 the aggregate amortization expense forother intangible assets was ¤ 26 million.The estimated aggregate amortization expense for each of the succeeding fivefiscal years are as follows:– in 2003: ¤ 31 million– in 2004: ¤ 24 million– in 2005: ¤ 20 million– in 2006: ¤ 19 million– in 2007: ¤ 18 million
147
Gross Carrying Amount Accumulated Amortization Net Carrying Amount
in ¤ m. Dec 31, 2002 Dec 31, 2001 Dec 31, 2002 Dec 31, 2001 Dec 31, 2002 Dec 31, 2001
Amortized intangible assets
Customer contracts 98 27 20 16 78 11
Investment management agreements 70 38 9 4 61 34
Other customer-related 57 – 14 – 43 –
Other 31 28 13 12 18 16
Total 256 93 56 32 200 61
Unamortized intangible assets
Retail investment managementagreements and other 1,111 –
Loan servicing rights1 100 145
Total other intangible assets 1,411 206
1 Loan servicing rights are carried at the lower of the allocated basis or current fair value and amortized in proportion to and over the estimated period of net servicing revenue.
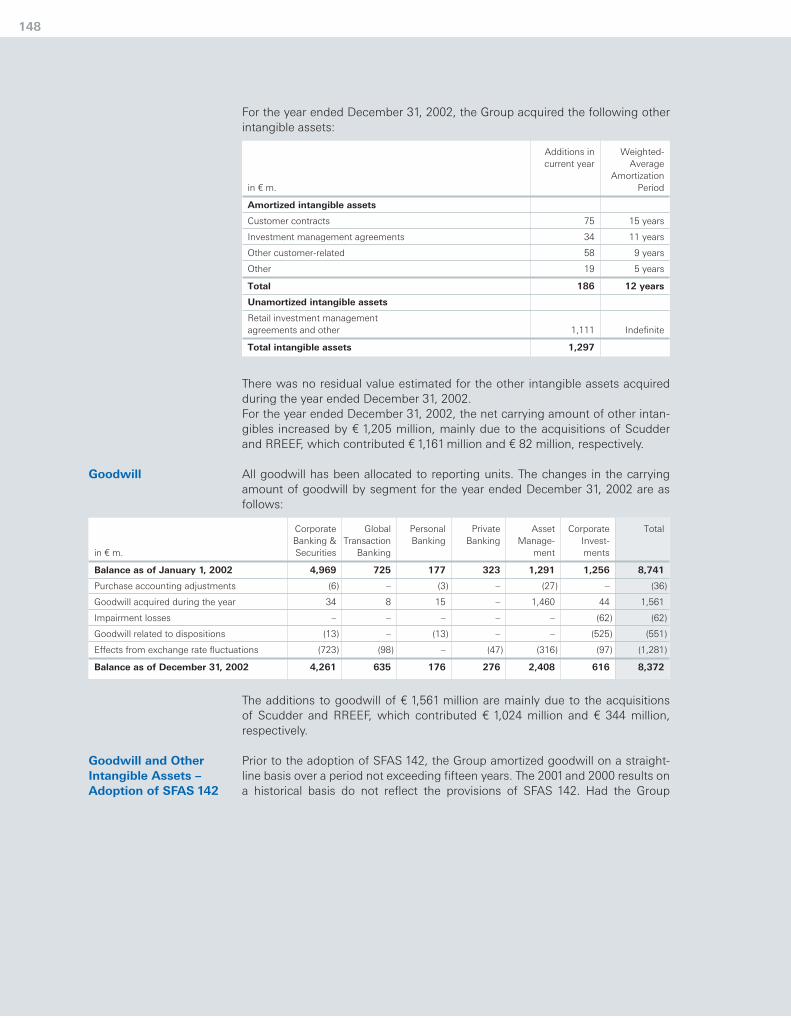
Goodwill and OtherIntangible Assets –Adoption of SFAS 142
For the year ended December 31, 2002, the Group acquired the following otherintangible assets:
There was no residual value estimated for the other intangible assets acquiredduring the year ended December 31, 2002.For the year ended December 31, 2002, the net carrying amount of other intan-gibles increased by ¤ 1,205 million, mainly due to the acquisitions of Scudderand RREEF, which contributed ¤ 1,161 million and ¤ 82 million, respectively.
All goodwill has been allocated to reporting units. The changes in the carryingamount of goodwill by segment for the year ended December 31, 2002 are as follows:
The additions to goodwill of ¤ 1,561 million are mainly due to the acquisitions of Scudder and RREEF, which contributed ¤ 1,024 million and ¤ 344 million,respectively.
Prior to the adoption of SFAS 142, the Group amortized goodwill on a straight-line basis over a period not exceeding fifteen years. The 2001and 2000 results ona historical basis do not reflect the provisions of SFAS 142. Had the Group
148
Goodwill
Additions in Weighted-current year Average
Amortizationin ¤ m. Period
Amortized intangible assets
Customer contracts 75 15 years
Investment management agreements 34 11 years
Other customer-related 58 9 years
Other 19 5 years
Total 186 12 years
Unamortized intangible assets
Retail investment managementagreements and other 1,111 Indefinite
Total intangible assets 1,297
Corporate Global Personal Private Asset Corporate TotalBanking & Transaction Banking Banking Manage- Invest-
in ¤ m. Securities Banking ment ments
Balance as of January 1, 2002 4,969 725 177 323 1,291 1,256 8,741
Purchase accounting adjustments (6) – (3) – (27) – (36)
Goodwill acquired during the year 34 8 15 – 1,460 44 1,561
Impairment losses – – – – – (62) (62)
Goodwill related to dispositions (13) – (13) – – (525) (551)
Effects from exchange rate fluctuations (723) (98) – (47) (316) (97) (1,281)
Balance as of December 31, 2002 4,261 635 176 276 2,408 616 8,372

Consolidated Financial Statements
adopted SFAS 142 in prior years, the historical net income and basic and dilutednet income per common share would have been as follows:
[13] Assets Held for Sale
During 2002, the Group decided to sell certain businesses in the Global Trans-action Banking, Asset Management and Corporate Investment segments. The netassets for these businesses, most of which are reported as other investments,were written down to the lower of their carrying value or fair value less cost to sell resulting in a loss of ¤ 217 million for the year ended December 31, 2002.
149
in ¤ m. 2002 2001 2000
Net income
Reported net income 397 167 13,513
Add back: goodwill amortization net of negative goodwill – 784 769
Add back: equity method goodwill amortization – 18 15
Add back: other intangible assets amortization – 7 –
Adjusted net income 397 976 14,297
in ¤ 2002 2001 2000
Earnings per share (basic)
Income before cumulative effect of accounting changes, net of tax 0.58 0.60 22.00
Cumulative effect of accounting changes, net of tax 0.06 (0.33) –
Reported net income 0.64 0.27 22.00
Add back: goodwill amortization net of negative goodwill – 1.26 1.25
Add back: equity method goodwill amortization – 0.03 0.02
Add back: other intangible assets amortization – 0.01 –
Adjusted net income 0.64 1.57 23.27
in ¤ 2002 2001 2000
Earnings per share (diluted)
Income before cumulative effect of accounting changes, net of tax 0.57 0.60 21.72
Cumulative effect of accounting changes, net of tax 0.06 (0.33) –
Reported net income 0.63 0.27 21.72
Add back: goodwill amortization net of negative goodwill – 1.26 1.24
Add back: equity method goodwill amortization – 0.03 0.02
Add back: other intangible assets amortization – 0.01 –
Adjusted net income 0.63 1.57 22.98

[14] Other Short-term Borrowings
Short-term borrowings are borrowed funds generally with an original maturity ofone year or less. Commercial paper generally mature within 90 days. Compo-nents of other short-term borrowings include:
[15] Long-term Debt
The Group issues fixed and floating rate long-term debt denominated in variouscurrencies, approximately half of which is denominated in euros. Fixed rate debt outstanding at December 31, 2002 matures at various datesthrough 2050 and carries contractual interest rates ranging from 0.04% to16.00%. The weighted-average interest rates on fixed rate debt at December 31,2002 and 2001were 4.68% and 5.12%, respectively. Floating rate debt outstand-ing, with contractually determined interest rates ranging from 0.02% to 13.00%at December 31, 2002, matures at various dates through 2050. The weighted-average contractual interest rates on floating rate debt at December 31, 2002and 2001 were 3.01% and 3.84%, respectively. The following table is a summary of the Group’s long-term debt:
150
in ¤ m. Dec 31, 2002 Dec 31, 2001
Commercial paper 4,320 14,251
Other 7,253 6,221
Total 11,573 20,472
By remaining maturities Due in Due in Due in Due in Due in Due after Total Totalin ¤ m. 2003 2004 2005 2006 2007 2007 Dec 31, 2002 Dec 31, 2001
Senior debt
Mortgage bonds1
Fixed rate – – – – – – – 48,501
Floating rate – – – – – – – 8,215
Other bonds and notes
Fixed rate 5,940 7,085 4,669 5,688 2,706 26,525 52,613 59,773
Floating rate 6,374 7,548 5,715 7,422 2,741 12,246 42,046 39,167
Subordinated debt
Bonds and notes2
Fixed rate 2,198 62 210 1,248 532 2,940 7,190 8,885
Floating rate 258 268 88 20 368 1,204 2,206 2,367
Total 14,770 14,963 10,682 14,378 6,347 42,915 104,055 166,908
1 Includes bonds known as “Pfandbriefe”, which are issued by German mortgage banks. Decrease to zero in 2002 due to deconsolidation of mortgage bank subsidiaries.2 Includes DM 1.2 billion and DM 1.4 billion in nominal amounts of bearer participatory certificates which matured on December 31, 2002 and mature on December 31, 2003, respectively.
These certificates carry an annual dividend rate of 9 % and 8.75 %, respectively, and will be redeemed, subject to the stipulations on loss participation on June 30, 2003 and June 30, 2004,respectively. These dividends have priority over the rights of shareholders to share in the Group profits. During 2001, DM 75 million was extinguished from the second tranche.

Consolidated Financial Statements
Based solely on the contractual terms of the debt issues, the following table rep-resents the range of interest rates payable on this debt for the periods specified:
The weighted-average effective interest rates for total long-term debt were3.95% and 4.73 % at December 31, 2002 and December 31, 2001, respectively. The interest rates for the floating rate debt issues are generally based on LIBOR,although in certain instances they are subject to minimum interest rates as spec-ified in the agreements governing the respective issues. The Group enters into various transactions related to the debt it issues. This debtmay be traded for market-making purposes or held for a period of time. Pur-chases of the debt are accounted for as extinguishments; however, the resultingnet gains (losses) during 2002 and 2001 were insignificant.
[16] Trust Preferred Securities
The Group formed fourteen statutory business trusts, of which the Group ownsall of the common securities and which it consolidates into the Group’s financialstatements. These trusts have no independent assets or operations, and exist forthe sole purpose of issuing cumulative and noncumulative trust preferred secu-rities and investing the proceeds thereof in an equivalent amount of junior sub-ordinated debentures or noncumulative preferred securities, respectively, withinthe Group. The Group’s trust preferred securities at December 31, 2002 and 2001 totaled¤ 3.1 billion and ¤ 4.1 billion, respectively, comprised of ¤ 1.0 billion and ¤ 1.5 bil-lion cumulative trust preferred securities (net of deferred issuance costs andunamortized discount), respectively, and ¤ 2.1 billion and ¤ 2.6 billion noncumu-lative trust preferred securities, respectively.
151
Dec 31, 20021 Dec 31, 20011
Senior debt
Mortgage bonds2
Fixed rate N/A 0.01% – 8.45%
Floating rate3 N/A 3.03% – 5.89%
Other bonds and notes
Fixed rate 0.04% – 16.00% 0.02% – 16.00%
Floating rate 0.02% – 13.00% 0.08% – 11.64%
Subordinated debt
Bonds and notes
Fixed rate 1.71% – 10.50% 0.88% – 18.00%
Floating rate 0.27% – 8.00% 0.70% – 8.00%
N/A – Not applicable1 The Group issues senior and subordinated long-term debt denominated in various currencies. Interest rates on Japanese Yen
denominated debt represent the lower end of the range while interest rates on South African Rand denominated debt represent the higher end of the range.
2 Decrease to zero in 2002 due to deconsolidation of mortgage bank subsidiaries.3 Excludes approximately ¤ 1.4 billion in 2001 which relates to unusually-priced structured transactions with floating interest rates ranging
from 1.79 % to 11.23 %.

The junior subordinated debentures, which are the sole assets of the trusts, areunsecured obligations of the Group, and are subordinate and junior in right of payment to all present and future senior and subordinated indebtedness and certain other financial obligations of the Group. The principal amount of subordinated debentures held by each trust equals the aggregate liquidationamount of its trust securities and its common securities. The subordinateddebentures bear interest at the same rate, and will mature on the same date, asthe corresponding trust securities. The debentures are redeemable prior to thestated maturity at the option of the Group during the redemption periodsdescribed below. The cumulative trust preferred securities are eligible for inclusion in the Group’ssupplementary capital. A summary of the cumulative trust preferred securities issued and outstandingfollows:
The noncumulative preferred securities, which are the sole assets of the trusts,evidence preferred ownership interest in limited liability companies which arewholly-owned subsidiaries of the Group. The limited liability companies investthe proceeds from the noncumulative preferred securities in subordinated notesissued by the Group. Interest on the subordinated notes will be paid to the lim-ited liability companies on the dates described in the table below. Amounts avail-able to the trusts for distribution to the holders/creditors of the noncumulativetrust preferred securities (or loans, as the case may be) will be limited to distri-butions received by the trusts from the limited liability companies with respect tothe noncumulative preferred securities. The terms of the noncumulative trustpreferred securities are substantially identical to the terms of the noncumulativepreferred securities and do not have any scheduled maturity date. Capital pay-ments on the trust preferred securities are discretionary and noncumulative andare expected to be paid out of capital payments received by the trusts. Uponredemption of the noncumulative preferred securities, the trust must redeem a corresponding number of the trust preferred securities. The noncumulative
152
Noncumulative Trust Preferred Securities
Cumulative Trust Preferred Securities
Aggregate Aggregate Per Annum Interest Stated Earlier RedemptionLiquidation Liquidation Interest Payment Maturity of Maturity Period ofAmount of Amount of Rate of Dates Debentures Date1 Debentures
Trust Trust Debentures and Trust on or afterPreferred Preferred and Trust Preferred
Securities at Securities at Preferred SecuritiesDec 31, 2002 Dec 31, 2001 Securities
BT InstitutionalCapital Trust A ¤ 264 m. ¤ 312 m. 8.09% 6/1, 12/1 12/1/26 – 12/1/06
BT InstitutionalCapital Trust B ¤ 152 m. ¤ 180 m. 7.75% 6/1, 12/1 12/1/26 – 12/1/06
BT Capital Trust B ¤ 197 m. ¤ 233 m. 7.90% 1/15, 7/15 1/15/27 1/15/17 1/15/07
BT Preferred 3/31, 6/30Capital Trust I2 – ¤ 283 m. 8.13% 9/30, 12/31 2/1/37 2/1/02 2/1/02
BT PreferredCapital Trust II3 ¤ 189 m. ¤ 230 m. 7.88% 2/25, 8/25 2/25/27 2/25/12 2/25/07
BTC Capital 3 monthTrust I LIBOR 3/30, 6/30
¤ 200 m. ¤ 236 m. plus 0.75% 9/30, 12/30 12/30/26 – 12/30/06
Total4 ¤ 1,002 m. ¤ 1,474 m.
1 The maturity dates may be shortened under certain circumstances.2 Outstanding shares were redeemed at par on February 28, 2002.3 During 2002, the Group repurchased approximately ¤ 6 million BT Preferred Capital Trust II securities.4 Excludes deferred issuance costs and unamortized discount of ¤ 7 million and ¤13 million at December 31, 2002 and 2001, respectively.

Consolidated Financial Statements
preferred securities are redeemable at the option of the Group after expiry ofindividual remaining periods between 2 and 27 years. The noncumulative trust preferred securities are eligible for inclusion in theGroup’s core capital. A summary of the noncumulative trust preferred securities issued and outstand-ings follows:
The noncumulative preferred securities, subordinated notes and related incomeeffects are eliminated in the consolidated financial statements.
[17] Obligation to Purchase Common Shares
The Group has entered into forward purchases and sold put options of DeutscheBank shares as part of a share buy-back program. As of December 31, 2002, theput options were exercised and the shares have been acquired. In total, 900,000shares were acquired via exercised put options and 4,251,000 shares are under-lying the forward purchases. The cash redemption amounts of the forwards arereported as obligation to purchase common shares and result in a reduction ofshareholders’ equity with an equal amount reported under liabilities.
153
Aggregate Liquidation Aggregate Liquidation Per Annum Interest Interest Payment DatesAmount of Trust Amount of Trust Rate of Notes
Preferred Securities Preferred Securitiesat Dec 31, 2002 at Dec 31, 2001
Deutsche Bank CapitalFunding Trust I1 ¤ 451 m. ¤ 760 m. 7.87% 6/30, 12/30
Deutsche Bank CapitalFunding Trust II ¤ 211 m. ¤ 249 m. 7.75% 3/30, 6/30, 9/30, 12/30
Deutsche Bank Capital Funding Trust III ¤ 500 m. ¤ 500 m. 6.60% 3/30, 6/30, 9/30, 12/30
Deutsche Bank CapitalTrust I ¤ 305 m. ¤ 361 m. 3 month LIBOR + 1.70% 3/30, 6/30, 9/30, 12/30
Deutsche Bank CapitalTrust II ¤ 155 m. ¤ 172 m. 5.20% 6/30, 12/30
Deutsche Bank CapitalTrust III ¤ 114 m. ¤ 134 m. 3 month LIBOR + 1.90% 3/30, 6/30, 9/30, 12/30
Deutsche Bank CapitalTrust IV ¤ 156 m. ¤ 184 m. 3 month LIBOR + 1.80% 3/30, 6/30, 9/30, 12/30
Deutsche Bank CapitalTrust V ¤ 216 m. ¤ 255 m. 3 month LIBOR + 1.80% 3/30, 6/30, 9/30, 12/30
Total ¤ 2,108 m. ¤ 2,615 m.
1 Includes basis adjustments on qualified hedges of ¤ 44.0 million and ¤ 22.1million as of December 31, 2002 and 2001, respectively. Aggregate liquidation amount as of December 31, 2002 isnet of amount repurchased in the open market.

[18] Common Shares and Share-Based Compensation Plans
Deutsche Bank’s share capital consists of common shares issued in registeredform without par value. Under German law, no par value shares are deemed tohave a “nominal” value equal to the total amount of share capital divided by thenumber of shares. The shares have a nominal value of ¤ 2.56. Common share activity was as follows:
Shares purchased for treasury consist of shares held for a period of time by theGroup as well as any shares purchased with the intention of being resold in theshort term. All such transactions were recorded in shareholders’ equity and norevenue was recorded in connection with these activities.
Deutsche Bank’s share capital may be increased by issuing new shares for cashand in some circumstances for noncash consideration. At December 31, 2002,Deutsche Bank had authorized but unissued capital of ¤ 685,822,970 which maybe issued at various dates through April 30, 2007 as follows:
Deutsche Bank also has conditional capital of ¤ 231,614,835. Conditional capitalincludes various instruments that may potentially be converted into commonshares. At December 31, 2002, ¤ 80,000,000 of conditional capital is available forparticipatory certificates with warrants and/or convertible participatory certifi-cates, bonds with warrants, and convertible bonds which may be issued in oneor more issuances on or before April 30, 2004. In addition, ¤ 64,000,000 isrelated to option rights issued until May 20, 2005 under the DB Global Partner-ship Plan, ¤ 51,200,000 is related to option rights issued until May 10, 2003under the DB Global Partnership Plan and ¤ 35,719,539 is related to the optionrights issued under the DB Global Share Plan and the db Share Plan. ¤ 695,296are available for the Global Equity Plan. These plans are described below.
154
Authorized and Conditional Capital
Number of shares 2002 2001 2000
Common shares outstanding,
beginning of year 614,475,625 614,600,765 613,058,750
Shares issued under employee benefit plans 285,800 5,054,400 2,171,526
Shares purchased for treasury (440,351,020) (447,045,982) (436,326,857)
Shares sold or distributed from treasury 444,869,642 441,866,442 435,697,346
Shares purchased under share buy-back program (33,833,093) – –
Common shares outstanding, end of year 585,446,954 614,475,625 614,600,765
Authorized Capital Authorized Capital Expiration Dateexcluding Shareholders’
Pre-Emptive Rights
¤ 127,822,9701 – April 30, 2003
¤ 300,000,000 – April 30, 2004
– ¤ 30,000,000 May 31, 2005
¤ 128,000,0001 – April 30, 2006
¤ 100,000,000 – April 30, 2007
1 Capital increase may be effected for noncash contributions with the intent of acquiring a company or holdings in companies.

Share-Based Compensation
Share-Based Compensation PlansCurrently Used ForGranting New Awards
Consolidated Financial Statements
The Group applies the provisions of APB 25 for its share-based compensationplans. Compensation expense for share-based awards is included in compensa-tion and benefits on the Consolidated Statement of Income. See Note [1] for a discussion on the Group’s accounting for share-based compensation. In accordance with the requirements of SFAS 123 “Accounting for Stock-BasedCompensation”, the pro forma disclosures relating to net income and earningsper share are provided on pages 161 and 162.The Group’s significant share-based compensation plans are described in moredetail below.
DB Global PartnershipDeferred Share Awards. DB Equity Units (“DB Equity Units”) are deferred shareawards, each of which entitles the holder to one of the shares approximatelyfour years from the date of the grant, subject to certain exceptions. DB EquityUnits granted in relation to annual bonuses are forfeited if a participant termi-nates employment under certain circumstances within the first two years follow-ing the grant. Compensation expense for the DB Equity Units is recognized in the performanceyear as they relate to annual bonuses earned as part of compensation. Compen-sation expense is based on the quoted market price of a common share on thegrant date of the award. Deutsche Bank grants an exceptional award to a selected group of employees asa retention incentive that is forfeited if the participant terminates employment forany reason prior to the end of an approximate four-year vesting period. Com-pensation expense for the exceptional award is recognized over the vestingperiod.
Options. Performance options (“Performance Options”) are rights to purchasethe shares. The reference price is set at the higher of the fair market value of theshares on the date of grant or an average of the fair market value of the sharesfor the ten trading days on the Frankfurt Stock Exchange up to and including thedate of the grant. Performance Options are granted with an exercise price equalto 120% of the reference price. Performance Options are subject to a minimum vesting period of two years. Ingeneral, one-third of the options will become exercisable at each of the second,third and fourth anniversaries of the grant date. However, if the shares trade atmore than 130% of the reference price for 35 consecutive trading days, the Per-formance Options will become exercisable on the later of the end of the 35-daytrading period or the second anniversary of the award date. Under certain cir-cumstances, if a participant terminates employment prior to the vesting date,Performance Option awards will be forfeited. All options not previously exercisedor forfeited expire on the sixth anniversary of the grant date. No compensation expense was recognized for the years ended December 31,2002 and 2001 because the exercise price of the Performance Options exceededthe market price of the underlying shares on the date of grant.
Appreciation Rights. Partnership Appreciation Rights (“PARs”) are rights toreceive a cash award in an amount equal to 20% of the reference pricedescribed above. The vesting of PARs will occur at the same time and to thesame extent as the vesting of Performance Options. PARs are automaticallyexercised at the same time and in the same proportion as the exercise of the Per-formance Options.
155
No compensation expense was recognized for the years ended December 31,2002 and 2001 as the PARs represent a right to a cash award that is only exer-cisable in conjunction with the exercise of Performance Options. This effectivelyreduces the exercise price of any Performance Option exercised to the referenceprice described above.
DB Global Share PlanCommon Shares Purchased at a Discount. In 2002, eligible employees couldpurchase up to 20 shares of the common shares. Eligible retirees could purchaseup to 10 shares of the common shares. Only German employees and retireeswere eligible to purchase these shares at a discount in 2002. In 2001, eligibleemployees could purchase up to 60 shares at a discount. Retirees in certain geographic regions were eligible to participate in the plan and were eligible topurchase up to 25 shares of the common shares at a discount. The discount waslinked to the Group’s previous year’s earnings. The participant is fully vested andreceives all dividend rights for the shares purchased. At the date of purchase,the Group recognizes as compensation expense the difference between thequoted market price of a common share at the grant date and the price paid bythe participant.
Options. In 2002, employee participants received five options to purchase oneshare for each share purchased. In 2001, employee participants received anoption to purchase one share for each share purchased. Options issued in con-nection with the purchase of shares vest two years after the date of grant andexpire after six years. Following the vesting period, options may be exercised ata strike price equal to 120% of the reference price. The reference price is set at the higher of the fair market value of the shares on the date of grant or anaverage of the fair market value of the shares for the ten trading days on theFrankfurt Stock Exchange up to and including the date of grant.Generally, a participant must have been working for the Group for at least oneyear and have an active employment contract in order to participate. Rights areforfeited upon termination of employment. Participants who retire or becomepermanently disabled prior to fulfillment of the vesting period may still exercisetheir rights during the exercise period. There is no compensation expense recorded for the option grants under theDB Global Share Plan because the exercise price exceeds the market price of theunderlying shares on the date of grant.
DB Share SchemeUnder the DB Share Scheme, the Group may grant various employees deferredshare awards which provide the right to receive common shares of the Group ata specified future date. The expense related to a portion of the shares awardedunder the plan is recognized in the performance year if it relates to annualbonuses earned as part of compensation, while the remainder of the sharesawarded for retention purposes are expensed over the vesting period, which isgenerally three years. Compensation expense is based on the quoted marketprice of a common share at the grant date of the awards.
156

Share-Based Compensation PlansNo Longer Used forGranting New Awards
Consolidated Financial Statements
Restricted Equity UnitsUnder the Restricted Equity Units Plan, the Group may grant various employeesdeferred share awards for retention purposes which provide the right to receivecommon shares of the Group at a specified future date. The expense related torestricted equity units awarded is recognized over the vesting period, whichis generally four to five years. Compensation expense is based on the quotedmarket price of a common share at the grant date of the awards.
Global Equity PlanDuring 1998, 1999, and 2000, certain key employees of the Group participated inthe Global Equity Plan (“GEP”) and were eligible to purchase convertible bondsin DM 1,000 denominations at par. On October 16, 2001, the Board of ManagingDirectors gave approval to buy out the remaining participants in the GlobalEquity Plan at a fixed discount per underlying share. For purposes of the buy-out, the Group set the reference price at ¤ 73.72 and employees could acceptthe offer during a specified period in 2001. As of December 31, 2001, 2,775 par-ticipants holding DM 55,429,000 (¤ 28,340,398) bonds convertible into11,085,800 shares accepted the offer and received cash payments totaling¤ 490,347,106. Compensation expense relating to participants who accepted thebuy-out offer was fully accrued in 2001. As of December 31, 2002, convertible bonds outstanding for the remaining par-ticipants may be converted into approximately 271,600 common shares after theannual shareholders’ meeting in June 2003 if specific performance criteria are met.Bonds not converted will be redeemed at maturity at their nominal value. Compensation expense is recorded using variable plan accounting over the vest-ing period for remaining participants in the GEP based upon an estimated dis-count for the applicable three-year performance period and the current price ofthe common shares. Compensation expense relating to terminated participantswho retain their award is fully accrued in the year of termination and remeasuredat the end of each reporting period until the conversion date. Compensationexpense accrued for participants whose rights are forfeited is reversed upontermination.
Stock Appreciation Rights PlansThe Group has stock appreciation rights plans (“SARs”) which provide eligibleemployees of the Group the right to receive cash equal to the appreciation of theGroup’s shares over an established strike price. The stock appreciation rightsgranted can be exercised approximately three years from the date of grant.Stock appreciation rights expire approximately six years from the date of grant.Compensation expense on SARs, calculated as the excess of the current marketprice of the Group’s common shares over the strike price, is recorded using vari-able plan accounting. The expense related to a portion of the awards is recog-nized in the performance year if it relates to annual bonuses earned as part ofcompensation, while remaining awards are expensed over the vesting periods.
157

db Share PlanCommon Shares Purchased at a Discount. Prior to the adoption of theDB Global Share Plan, certain employees were eligible to purchase up to 60shares of the Group’s common shares at a discount under the db Share Plan. Atthe date of purchase, the Group recognized as compensation expense the differ-ence between the quoted market price of a common share at the grant date andthe price paid by the participant. The terms and conditions of the prior db SharePlan are substantially similar to those of the DB Global Share Plan except for thedetermination of the option strike price as discussed below.
Options. In addition, employee participants received options to purchase up to60 shares, depending on the number of shares purchased. Options issued inconnection with the purchase of shares vest over a period of approximatelythree years beginning on the date of grant. Following the vesting period, optionsmay be exercised if specific performance criteria are met. If the performance cri-teria are met, the options are exercisable during a fifteen-day exercise periodbeginning on the sixth trading day following the respective annual shareholders’meeting. The exercise price is based on the average quoted price of a commonshare on the Frankfurt Stock Exchange (XETRA) on the five trading days beforethe exercise period starts. A discount is applied to the exercise price at anamount that depends on the Group’s performance criteria. The maximum dis-count the participant is eligible to receive is 66.67%. Compensation expense for the db Share Plan is recorded using variable planaccounting over the vesting period based upon an estimated exercise price forthe applicable three-year period and the current market price of the commonshares. Compensation expense relating to terminated participants who retaintheir award is fully accrued in the year of termination and remeasured at the endof each reporting period until the exercise date. Compensation expense accruedfor participants whose rights are forfeited is reversed upon termination.
OtherThe Group has other local share-based compensation plans, none of which, indi-vidually or in the aggregate are material to the consolidated financial statements.
The Group recognized compensation expense related to its significant share-based compensation plans, described above, as follows:
158
CompensationExpense
in ¤ m. 2002 2001 2000
DB Global Partnership1 4 19 –
DB Global Share Plan 3 4 –
DB Share Scheme/Restricted Equity Units 469 726 890
Global Equity Plan (6) 302 236
Stock Appreciation Rights Plans2 35 93 54
db Share Plan (45) 53 126
Total 460 1,197 1,306
1 Compensation expense for the years ended December 31, 2002 and 2001 included ¤ 3.9 million and ¤ 19 million, respectively, related to DB Equity Units granted in February 2003 and February 2002, respectively.
2 For the years ended December 31, 2002 and 2001, net losses of ¤ 226 million and ¤ 27 million, respectively, from nontrading equityderivatives, used to offset fluctuations in employee share-based compensation expense, were included.
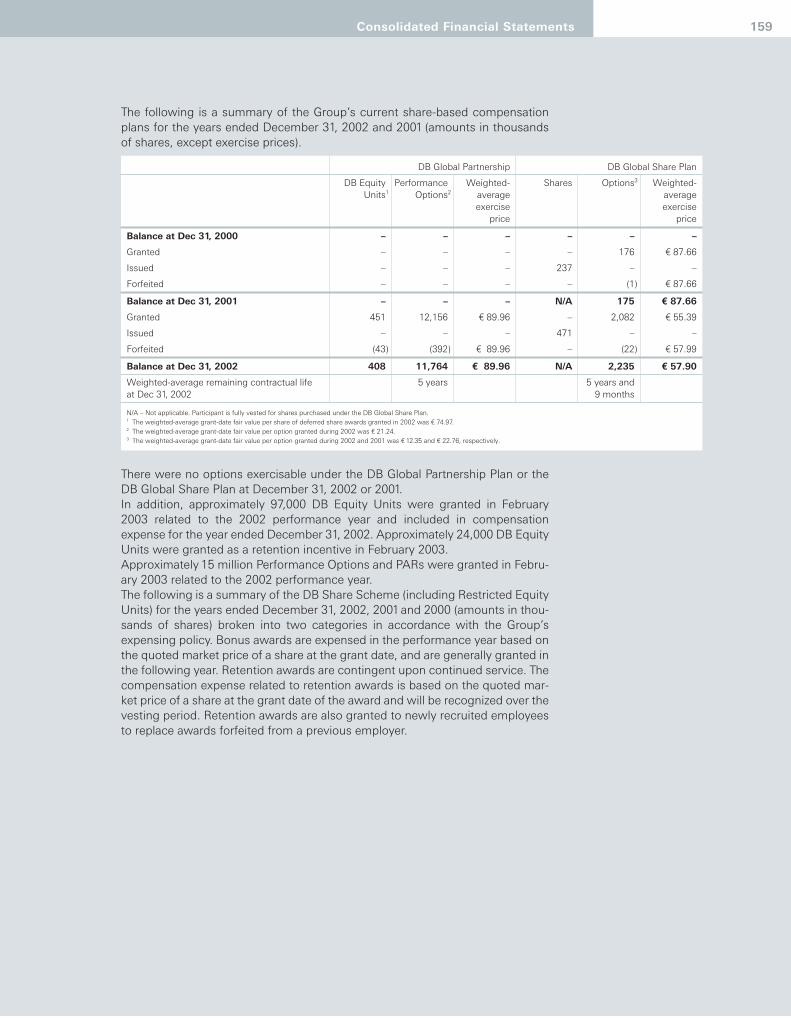
Consolidated Financial Statements
The following is a summary of the Group’s current share-based compensationplans for the years ended December 31, 2002 and 2001 (amounts in thousandsof shares, except exercise prices).
There were no options exercisable under the DB Global Partnership Plan or theDB Global Share Plan at December 31, 2002 or 2001.In addition, approximately 97,000 DB Equity Units were granted in February2003 related to the 2002 performance year and included in compensationexpense for the year ended December 31, 2002. Approximately 24,000 DB EquityUnits were granted as a retention incentive in February 2003.Approximately 15 million Performance Options and PARs were granted in Febru-ary 2003 related to the 2002 performance year.The following is a summary of the DB Share Scheme (including Restricted EquityUnits) for the years ended December 31, 2002, 2001 and 2000 (amounts in thou-sands of shares) broken into two categories in accordance with the Group’sexpensing policy. Bonus awards are expensed in the performance year based onthe quoted market price of a share at the grant date, and are generally granted inthe following year. Retention awards are contingent upon continued service. Thecompensation expense related to retention awards is based on the quoted mar-ket price of a share at the grant date of the award and will be recognized over thevesting period. Retention awards are also granted to newly recruited employeesto replace awards forfeited from a previous employer.
159
DB Global Partnership DB Global Share Plan
DB Equity Performance Weighted- Shares Options3 Weighted-Units1 Options2 average average
exercise exerciseprice price
Balance at Dec 31, 2000 – – – – – –
Granted – – – – 176 ¤ 87.66
Issued – – – 237 – –
Forfeited – – – – (1) ¤ 87.66
Balance at Dec 31, 2001 – – – N/A 175 ¤ 87.66
Granted 451 12,156 ¤ 89.96 – 2,082 ¤ 55.39
Issued – – – 471 – –
Forfeited (43) (392) ¤ 89.96 – (22) ¤ 57.99
Balance at Dec 31, 2002 408 11,764 ¤ 89.96 N/A 2,235 ¤ 57.90
Weighted-average remaining contractual life 5 years 5 years andat Dec 31, 2002 9 months
N/A – Not applicable. Participant is fully vested for shares purchased under the DB Global Share Plan.1 The weighted-average grant-date fair value per share of deferred share awards granted in 2002 was ¤ 74.97.2 The weighted-average grant-date fair value per option granted during 2002 was ¤ 21.24.3 The weighted-average grant-date fair value per option granted during 2002 and 2001 was ¤ 12.35 and ¤ 22.76, respectively.

In addition to the amounts shown in the table above, the Group granted the following equity awards in February 2003:(a) Approximately 1 million DB Share Scheme awards with a fair value of ¤ 39.61in relation to the 2002 performance year as bonus awards, which were expensedentirely in 2002.(b) Approximately 24 million restricted equity units as retention awards. Eachequity unit provides the right to receive a common share of the Group’s stocksubject to certain vesting criteria through August 2007, and will be expensedover the vesting period. These awards are granted in anticipation of ongoingcontribution to the Group and, in most cases, award recipients forfeit their rightsto receive shares if they leave the Group before the end of the vesting period.The quoted market price of a share at the grant date of the 2003 awards was¤ 39.61.
160
Bonus Retention TotalAwards1 Awards2
in thousands of shares
Balance at Dec 31, 1999 1,327 3,540 4,867
Granted 4,898 5,264 10,162
Issued (2,526) (1,717) (4,243)
Forfeited (274) (200) (474)
Balance at Dec 31, 2000 3,425 6,887 10,312
Granted 6,607 9,495 16,102
Issued (4,012) (2,902) (6,914)
Forfeited (297) (176) (473)
Balance at Dec 31, 2001 5,723 13,304 19,027
Granted 6,386 12,148 18,534
Issued (5,603) (4,243) (9,846)
Forfeited (417) (1,610) (2,027)
Balance at Dec 31, 2002 6,089 19,599 25,688
1 The weighted-average grant-date fair values per share of deferred share awards granted during 2002, 2001 and 2000 were ¤ 74.96,¤ 97.96 and ¤ 82.29, respectively.
2 The weighted-average grant-date fair values per share of deferred share awards granted during 2002, 2001 and 2000 were ¤ 72.56,¤ 66.66 and ¤ 88.88, respectively. For the outstanding balance at year-end 2002 the weighted-average grant-date fair value per share was ¤ 70.28 and approximateley ¤ 400 million were expensed by year-end 2002.

SFAS 123 Pro-forma-Information
Consolidated Financial Statements
The following is a summary of the Group’s share-based compensation plans (forwhich there will be no future awards) for the years ended December 31, 2002,2001 and 2000.
There were no options exercisable under the db Share Plan at December 31,2002, 2001 or 2000.
See Note [1] for the pro forma information regarding net income and earningsper share as required by SFAS 123. The pro forma information was determinedfor the years ended December 31, 2002, 2001 and 2000, as if the Group hadaccounted for its employee share options under the fair value method ofSFAS 123. The expense for the deferred share awards is the same under APB 25and SFAS 123. For purposes of pro forma disclosure, the estimated fair value of the options isrecognized in the performance year if it relates to annual bonuses earned as partof compensation, while the remainder is amortized to expense over the option’svesting period.
161
Global Stock db Share PlanEquity Appreciation
Plan Rights Plans
in thousands of Convertible SARs2 Shares Options3
equivalent shares Bonds1
Balance at Dec 31, 1999 10,977 – – 1,633
Purchased 6,968 – 2,172 –
Granted – 6,674 – 1,889
Forfeited (549) (166) – (34)
Balance at Dec 31, 2000 17,396 6,508 N/A 3,488
Granted – original – 16,510 – –
Exchanged – (16,223) – –
Granted – new – 10,328 – –
Convertible bonds converted (5,054) – – –
Convertible bonds redeemed (11,086) – – –
Forfeited (649) (195) – (12)
Balance at Dec 31, 2001 607 16,928 N/A 3,476
Granted – 3 – –
Issued – (30) – (1,453)
Convertible bonds converted (286) – – –
Forfeited (49) (555) – (170)
Balance at Dec 31, 2002 272 16,346 – 1,853
Weighted-average remainingcontractual life at Dec 31, 2002 5 months 5 months
N/A – Not applicable. Participant is fully vested for shares purchased under the db Share Plan.1 Convertible bonds are included in long-term debt on the Consolidated Balance Sheet. Amounts presented in table above are presented
in thousands of equivalent shares.2 SARs are granted at various strike prices. In October 2001, 16,223,276 SARs with a strike price of ¤ 98 vesting in 2004 and expiring
in 2007 were replaced by 10,328,417 rights at a strike price of ¤ 67.3 The options outstanding as of December 31, 2002 will expire in one tranche after the shareholder meeting in 2003.
The weighted-average grant-date fair value per option granted during 2000 was ¤ 63.47.
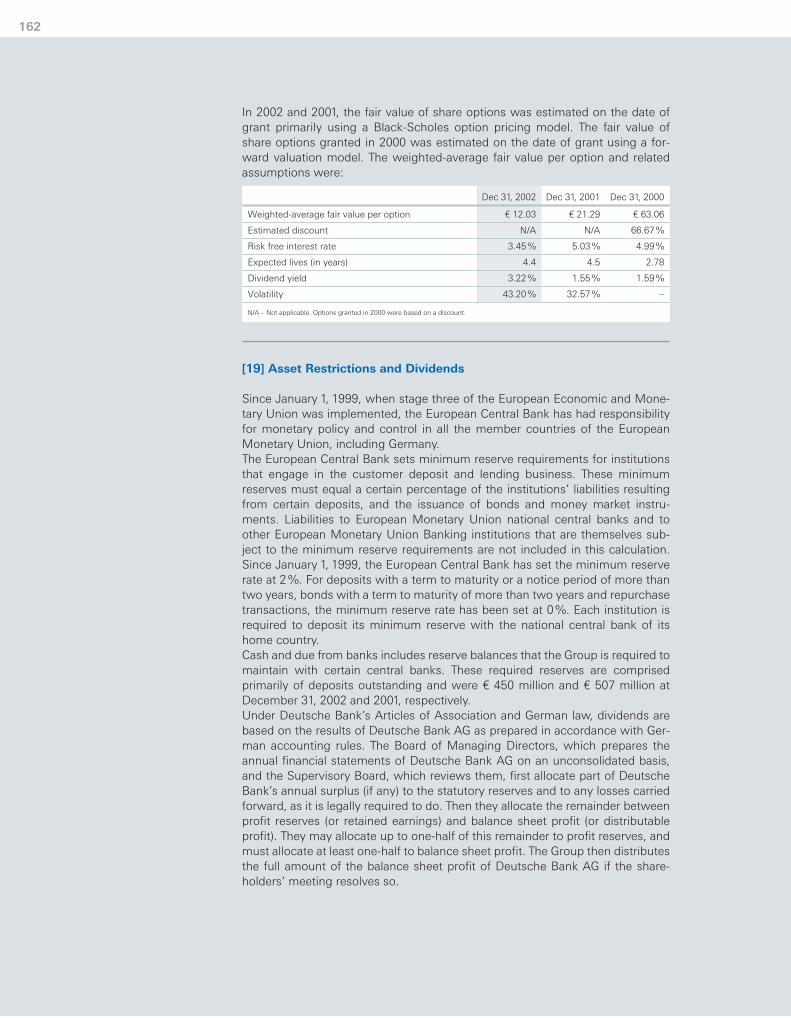
In 2002 and 2001, the fair value of share options was estimated on the date ofgrant primarily using a Black-Scholes option pricing model. The fair value ofshare options granted in 2000 was estimated on the date of grant using a for-ward valuation model. The weighted-average fair value per option and relatedassumptions were:
[19] Asset Restrictions and Dividends
Since January 1, 1999, when stage three of the European Economic and Mone-tary Union was implemented, the European Central Bank has had responsibilityfor monetary policy and control in all the member countries of the EuropeanMonetary Union, including Germany. The European Central Bank sets minimum reserve requirements for institutionsthat engage in the customer deposit and lending business. These minimumreserves must equal a certain percentage of the institutions’ liabilities resultingfrom certain deposits, and the issuance of bonds and money market instru-ments. Liabilities to European Monetary Union national central banks and toother European Monetary Union Banking institutions that are themselves sub-ject to the minimum reserve requirements are not included in this calculation.Since January 1, 1999, the European Central Bank has set the minimum reserverate at 2%. For deposits with a term to maturity or a notice period of more thantwo years, bonds with a term to maturity of more than two years and repurchasetransactions, the minimum reserve rate has been set at 0%. Each institution isrequired to deposit its minimum reserve with the national central bank of itshome country. Cash and due from banks includes reserve balances that the Group is required tomaintain with certain central banks. These required reserves are comprised primarily of deposits outstanding and were ¤ 450 million and ¤ 507 million atDecember 31, 2002 and 2001, respectively.Under Deutsche Bank’s Articles of Association and German law, dividends arebased on the results of Deutsche Bank AG as prepared in accordance with Ger-man accounting rules. The Board of Managing Directors, which prepares theannual financial statements of Deutsche Bank AG on an unconsolidated basis,and the Supervisory Board, which reviews them, first allocate part of DeutscheBank’s annual surplus (if any) to the statutory reserves and to any losses carriedforward, as it is legally required to do. Then they allocate the remainder betweenprofit reserves (or retained earnings) and balance sheet profit (or distributableprofit). They may allocate up to one-half of this remainder to profit reserves, andmust allocate at least one-half to balance sheet profit. The Group then distributesthe full amount of the balance sheet profit of Deutsche Bank AG if the share-holders’ meeting resolves so.
162
Dec 31, 2002 Dec 31, 2001 Dec 31, 2000
Weighted-average fair value per option ¤ 12.03 ¤ 21.29 ¤ 63.06
Estimated discount N/A N/A 66.67%
Risk free interest rate 3.45% 5.03% 4.99%
Expected lives (in years) 4.4 4.5 2.78
Dividend yield 3.22% 1.55% 1.59%
Volatility 43.20% 32.57% –
N/A – Not applicable. Options granted in 2000 were based on a discount.

Consolidated Financial Statements
Certain other subsidiaries are subject to various regulatory and other restrictionsthat may limit cash dividends and certain advances to Deutsche Bank.
[20] Regulatory Capital
The regulatory capital adequacy guidelines applicable to the Group are set forthby the Basel Committee on Banking Supervision, the secretariat of which is pro-vided by the Bank for International Settlements (“BIS”) and by European Councildirectives, as implemented by the German Federal Financial Supervisory Authority(Bundesanstalt für Finanzdienstleistungsaufsicht, “BaFin”), which has assumedthis responsibility from the former German Banking Supervisory Authority. Effec-tive December 31, 2001 the BaFin permitted the Group to calculate its BIS capitaladequacy ratios using U.S. GAAP amounts. Prior to December 31, 2001 theGroup used International Accounting Standards (“IAS”) for disclosure to theGroup’s regulators. The BIS capital ratio is the principal measure of capital adequacy for internationalbanks. This ratio compares a bank’s regulatory capital with its counterparty risksand market risks (which the Group refers to collectively as the “risk position”).Counterparty risk is measured by asset and off-balance sheet exposures accord-ing to broad categories of relative credit risk. The Group’s market risk compo-nent is a multiple of its value-at-risk figure, which may be calculated for regula-tory purposes based on the Group’s internal models. These models wereapproved by the BaFin for use in determining the Group’s market risk equivalentcomponent of its risk position. A bank’s regulatory capital is divided into threetiers (core or Tier I capital, supplementary or Tier II capital, and Tier III capital).Core or Tier I capital consists primarily of share capital, additional paid-in capitaland retained earnings less certain intangibles (principally goodwill) and theimpact from the tax law changes (as described below). Supplementary or Tier IIcapital consists primarily of participatory capital, long-term subordinated debt,unrealized gains on listed securities and other inherent loss allowance. Tier IIIcapital consists mainly of certain short-term subordinated liabilities. The mini-mum BIS total capital ratio (Tier I + Tier II + Tier III) is 8% of the risk position, andthe minimum BIS core (Tier I) capital ratio is 4% of the risk position. Under BISguidelines, the amount of subordinated debt that may be included as Tier II cap-ital is limited to 50% of Tier I capital. Total Tier II capital is limited to 100% ofTier I capital. The effect of the German Tax Reform Legislation on available for sale securitiesis treated differently for the regulatory capital calculation and financial account-ing. For financial accounting purposes, deferred tax provisions for unrealizedgains on available for sale securities are recorded directly to other comprehen-sive income whereas the adjustment to the related deferred tax liabilities for achange in expected effective income tax rates is recorded as an adjustment ofincome tax expense in current period earnings. The positive impact from theabove on retained earnings of the Group from the two important German tax lawchanges in 1999 and 2000 amounts to approximately ¤ 3.0 billion as of Decem-ber 31, 2002. For the purpose of calculating the regulatory capital, gross unreal-ized gains on available for sale securities are excluded from Tier I capital. Theadjustment relates to accumulated other comprehensive income (¤ (2.9) billion)and the release of deferred tax provisions (¤ 3.0 billion) included in retained earnings. Failure to meet minimum capital requirements can initiate certain mandates, andpossibly additional discretionary actions by the BaFin and other regulators that,
163
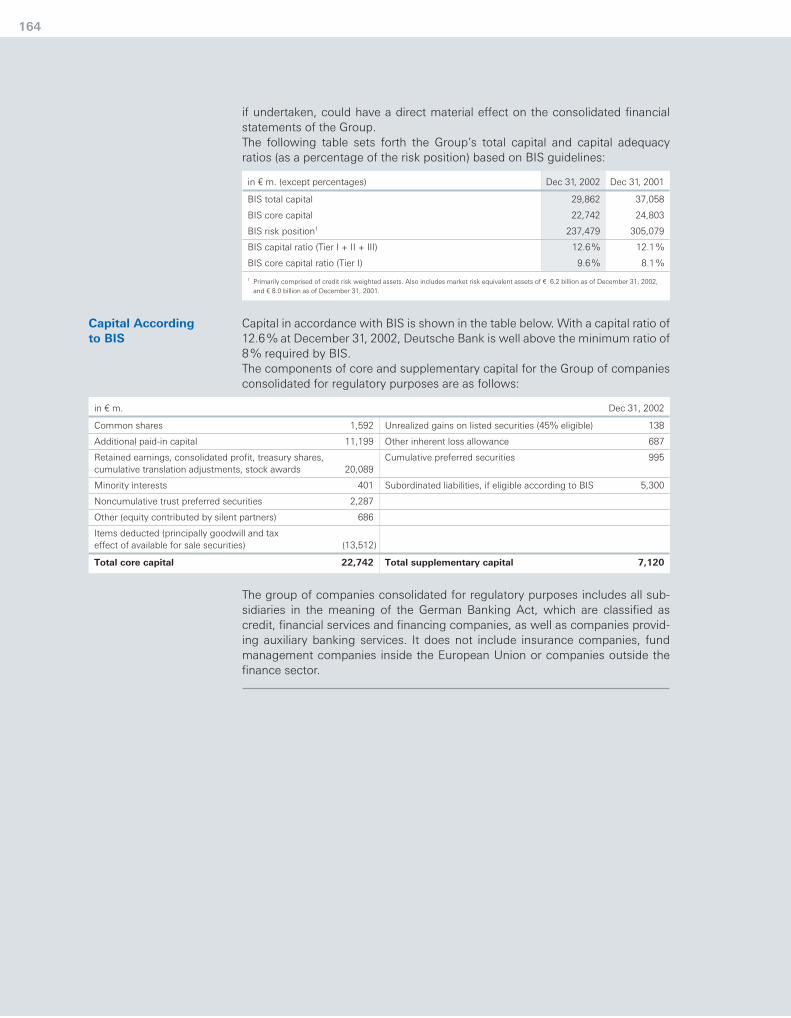
if undertaken, could have a direct material effect on the consolidated financialstatements of the Group. The following table sets forth the Group’s total capital and capital adequacyratios (as a percentage of the risk position) based on BIS guidelines:
Capital in accordance with BIS is shown in the table below. With a capital ratio of12.6% at December 31, 2002, Deutsche Bank is well above the minimum ratio of8% required by BIS. The components of core and supplementary capital for the Group of companiesconsolidated for regulatory purposes are as follows:
The group of companies consolidated for regulatory purposes includes all sub-sidiaries in the meaning of the German Banking Act, which are classified ascredit, financial services and financing companies, as well as companies provid-ing auxiliary banking services. It does not include insurance companies, fundmanagement companies inside the European Union or companies outside thefinance sector.
164
Capital According to BIS
in ¤ m. (except percentages) Dec 31, 2002 Dec 31, 2001
BIS total capital 29,862 37,058
BIS core capital 22,742 24,803
BIS risk position1 237,479 305,079
BIS capital ratio (Tier I + II + III) 12.6% 12.1%
BIS core capital ratio (Tier I) 9.6% 8.1%
1 Primarily comprised of credit risk weighted assets. Also includes market risk equivalent assets of ¤ 6.2 billion as of December 31, 2002, and ¤ 8.0 billion as of December 31, 2001.
in ¤ m. Dec 31, 2002
Common shares 1,592 Unrealized gains on listed securities (45% eligible) 138
Additional paid-in capital 11,199 Other inherent loss allowance 687
Retained earnings, consolidated profit, treasury shares, Cumulative preferred securities 995cumulative translation adjustments, stock awards 20,089
Minority interests 401 Subordinated liabilities, if eligible according to BIS 5,300
Noncumulative trust preferred securities 2,287
Other (equity contributed by silent partners) 686
Items deducted (principally goodwill and taxeffect of available for sale securities) (13,512)
Total core capital 22,742 Total supplementary capital 7,120

Consolidated Financial Statements
[21] Interest Revenues and Interest Expense
The following are the components of interest revenues and interest expense:
165
in ¤ m. 2002 2001 2000
Interest revenues
Interest-earning deposits with banks 1,469 2,912 2,303
Central bank funds sold and securities purchased under resale agreements 6,579 8,226 8,007
Securities borrowed 2,809 5,327 6,644
Interest income on securities available for sale and other investments 1,257 2,682 2,594
Dividend income on securities available for sale and other investments 385 1,029 762
Loans 11,741 17,619 20,137
Trading assets 11,378 15,571 14,439
Other 163 273 245
Total interest revenues 35,781 53,639 55,131
Interest expense
Interest-bearing deposits
Domestic 2,662 3,169 3,877
Foreign 6,657 12,555 13,020
Trading liabilities 4,410 5,723 6,285
Central bank funds purchased and securities sold under repurchase agreements 7,049 10,829 10,979
Securities loaned 580 1,902 2,161
Other short-term borrowings 705 1,636 2,708
Long-term debt 6,362 8,918 8,767
Trust preferred securities 170 287 306
Total interest expense 28,595 45,019 48,103
Net interest revenues 7,186 8,620 7,028

[22] Trading Revenues, Net
The following are the components of trading revenues:
[23] Insurance Business
The following are the components of other assets related to insurance business:
All other assets of the Group’s insurance business, primarily securities availablefor sale, are included in the respective line item on the Consolidated BalanceSheet. The following are the components of insurance policy claims and reserves:
The Group sold most of its insurance business in 2002 to Zurich Financial Services.
166
in ¤ m. 2002 2001 2000
Interest and credit trading 1,286 2,203 1,740
Equity trading 62 1,610 3,367
Foreign exchange, metal, commodity trading 1,226 1,385 1,102
Other trading1 1,450 833 1,416
Total 4,024 6,031 7,625
1 Includes gains and losses from derivatives not qualifying for hedge accounting treatment.
in ¤ m. Dec 31, 2002 Dec 31, 2001
Investment under unit-linked business 7,514 11,467
Deferred acquisition costs 17 1,729
Other 266 679
Total other assets related to insurance business 7,797 13,875
in ¤ m. Dec 31, 2002 Dec 31, 2001
Benefit reserves 418 18,922
Reserve for unit-linked business 7,514 11,932
Provision for premium refund – 1,303
Other insurance provisions and liabilities 625 3,084
Total insurance policy claims and reserves 8,557 35,241

[24] Pension and Other Employee Benefit Plans
Employee retirement arrangements, covering the majority of the Group’s sub-sidiaries and employees, are provided in the principal countries in which theGroup operates. The value of a participant’s accrued benefit is based primarilyon each employee’s salary and length of service. The Group provides retirement arrangements primarily for employees working inthe United States, Germany, Spain, Italy, Belgium, France, the Netherlands andthe United Kingdom. The majority of beneficiaries of the retirement arrange-ments are principally located in Germany. All plans are valued using the pro-jected unit credit method. In December 2002 the Group funded the majority ofits pension plans in Germany. The Group contributed ¤ 3.9 billion to a segregatedpension trust relating to an accumulated benefit obligation totaling ¤ 3.5 billion.In addition, the Group contributed to its qualified U.S. and U.K. pension plansapproximately ¤ 115 million and ¤ 300 million, respectively. Plans in Germany,the United States, the United Kingdom, Belgium, France, the Netherlands andAsia are generally funded, while the Spanish and Italian plans are unfunded. The Group also sponsors a number of defined contribution plans coveringemployees of certain subsidiaries. The assets of all the Group’s defined contribu-tion plans are held in independently administered funds. Contributions are gen-erally determined as a percentage of salary. In addition, the Group’s affiliates offer unfunded contributory defined benefitpostretirement health care plans to a number of retired employees who are prin-cipally located in the United States. These plans pay stated percentages of nec-essary medical and dental expenses of retirees after a stated deductible hasbeen met. The Group funds these plans on a cash basis as benefits are due. The following tables provide a reconciliation of the changes in the Group’s plans’benefit obligations and fair value of assets over the two-year period endedDecember 31, 2002 and a statement of the funded status as of December 31 foreach year:
Consolidated Financial Statements 167

The aggregate projected benefit obligation, accumulated benefit obligation, andfair value of plan assets for those pension plans with accumulated benefit obli-gations in excess of plan assets were ¤ 1,454 million, ¤ 1,367 million and ¤ 1,084million, respectively, as of December 31, 2002 and ¤ 4,654 million, ¤ 4,185 mil-lion and ¤ 297 million, respectively, as of December 31, 2001.A minimum pension liability of ¤ 8 million, net of tax, is recorded in other com-prehensive income for the excess of accumulated benefit obligation over the fairvalue of plan assets.
168
Pension Benefits PostretirementBenefits
in ¤ m. 2002 2001 2002 2001
Change in benefit obligation
Benefit obligation at beginning of year 6,772 6,416 151 121
Service cost 323 309 4 4
Interest cost 384 367 8 10
Plan amendments 11 – 20 –
Acquisitions/divestitures (55) (25) 5 –
Actuarial loss (gain) (194) (83) 5 25
Benefits paid (282) (266) (12) (10)
Curtailment/settlement 4 – – (5)
Foreign currency exchange rate changes (310) 54 (21) 6
Benefit obligation at end of year 6,653 6,772 160 151
Change in plan assets
Fair value of plan assets at beginning of year 2,369 2,634 – 1
Actual return on plan assets (289) (350) – –
Employer contributions1 4,493 97 12 10
Benefits paid (103) (100) (13) (10)
Curtailment/settlement 67 – 1 (1)
Foreign currency exchange rate changes (241) 88 – –
Fair value of plan assets at end of year 6,296 2,369 – –
Funded status (357) (4,403) (160) (151)
Unrecognized net actuarial loss (gain) 893 690 (13) (21)
Unrecognized prior service cost (benefit) (1) 26 15 (8)
Unrecognized transition assets 1 (5) – –
Accrued benefit cost at end of year2 536 (3,692) (158) (180)
1 Amount of 2002 includes ¤ 3.9 billion, ¤ 115 million and ¤ 300 million contributed to the Group’s German, U.S. and U.K. pension plans,respectively.
2 Prepaid pension costs totaled ¤ 951million and ¤ 665 million at December 31, 2002 and 2001, respectively. No prepaid postretirementcosts were recognized at these dates.

Consolidated Financial Statements
Benefits expense for the years ended December 31, 2002, 2001 and 2000,included the following components:
The following actuarial assumptions were calculated on a weighted-averagebasis and reflect the local economic conditions for each country’s respectivedefined benefit and postretirement benefit plans:
In determining postretirement benefits expense, an annual rate of increase of8.9% in the per capita cost of covered health care benefits was assumed for2003. The rate was assumed to decrease gradually to 5.0% by 2007 and remainat that level thereafter.Assumed health care cost trend rates have a significant effect on the amountsreported for the retiree health care plans. A one-percentage-point change in
169
Pension Benefits Postretirement Benefits
in ¤ m. 2002 2001 2000 2002 2001 2000
Service cost 323 309 314 4 4 2
Interest cost 384 367 339 8 10 7
Expected return on plan assets (175) (197) (200) – – –
Actuarial loss (gain) recognized 39 1 15 – (1) –
Settlement/curtailment 4 4 24 – – –
Amortization of unrecognized transition asset (10) (10) (13) – – –
Total defined benefit plans 565 474 479 12 13 9
Defined contribution plans 228 175 196 – – –
Other plans – – 9 – – –
Net periodic benefit expense 793 649 684 12 13 9
Pension Benefits Postretirement Benefits1
2002 2001 2000 2002 2001 2000
Discount rate in determining expense 5.7% 6.4% 5.7% 6.7% 7.2% 7.7%
Discount rate in determining benefit obligations at year-end 5.8% 6.1% 6.2% 6.7% 7.2% 7.6%
Rate of increase in future compensation levelsfor determining expense 3.0% 3.4% 3.0% 4.5% 5.0% 5.0%
Rate of increase in future compensation levelsfor determining benefit obligations at year-end 2.0% 2.5% 3.5% 4.0% 5.0% 5.0%
Expected long-term rate of return on assets 6.7% 8.1% 8.2% N/A 9.0% 9.0 %
N/A – Not applicable1 The weighted-average actuarial assumptions for the postretirement plans primarily reflect the assumptions used in the United States as this is where the Group’s significant postretirement
plans are located.
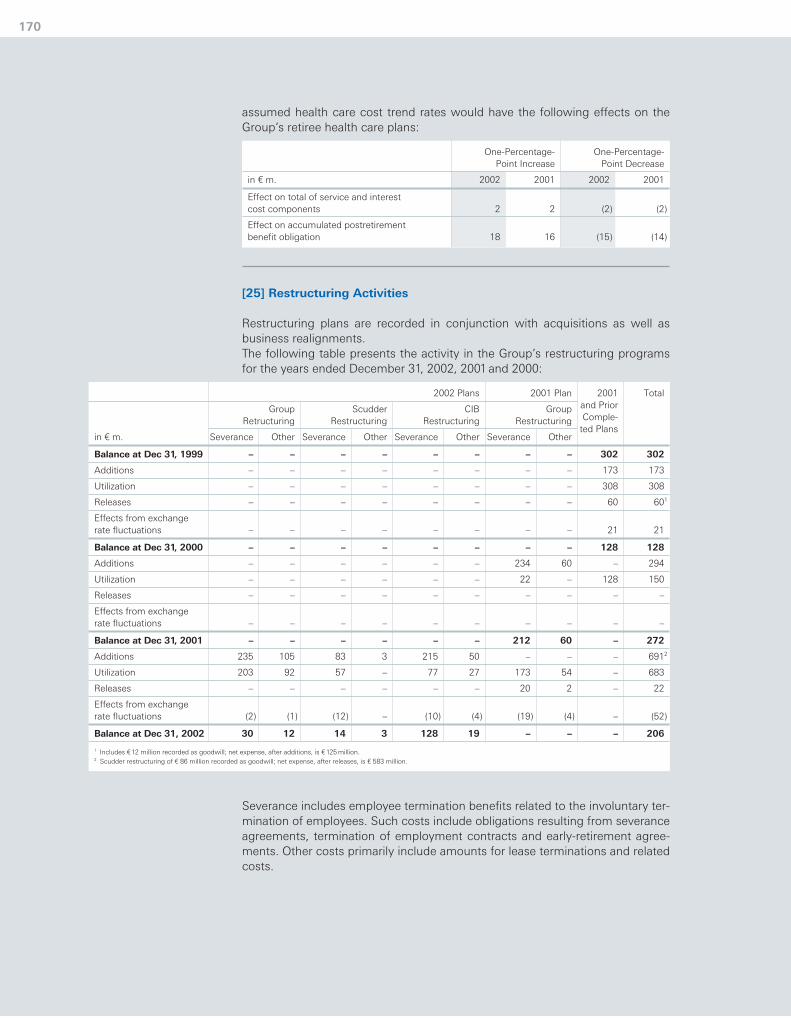
assumed health care cost trend rates would have the following effects on theGroup’s retiree health care plans:
[25] Restructuring Activities
Restructuring plans are recorded in conjunction with acquisitions as well asbusiness realignments. The following table presents the activity in the Group’s restructuring programsfor the years ended December 31, 2002, 2001 and 2000:
Severance includes employee termination benefits related to the involuntary ter-mination of employees. Such costs include obligations resulting from severanceagreements, termination of employment contracts and early-retirement agree-ments. Other costs primarily include amounts for lease terminations and relatedcosts.
170
2002 Plans 2001 Plan 2001 Total
Group Scudder CIB Group and Prior
Retructuring Restructuring Restructuring Restructuring Comple-
in ¤ m. Severance Other Severance Other Severance Other Severance Otherted Plans
Balance at Dec 31, 1999 – – – – – – – – 302 302
Additions – – – – – – – – 173 173
Utilization – – – – – – – – 308 308
Releases – – – – – – – – 60 601
Effects from exchangerate fluctuations – – – – – – – – 21 21
Balance at Dec 31, 2000 – – – – – – – – 128 128
Additions – – – – – – 234 60 – 294
Utilization – – – – – – 22 – 128 150
Releases – – – – – – – – – –
Effects from exchangerate fluctuations – – – – – – – – – –
Balance at Dec 31, 2001 – – – – – – 212 60 – 272
Additions 235 105 83 3 215 50 – – – 6912
Utilization 203 92 57 – 77 27 173 54 – 683
Releases – – – – – – 20 2 – 22
Effects from exchangerate fluctuations (2) (1) (12) – (10) (4) (19) (4) – (52)
Balance at Dec 31, 2002 30 12 14 3 128 19 – – – 206
1 Includes ¤ 12 million recorded as goodwill; net expense, after additions, is ¤ 125 million.2 Scudder restructuring of ¤ 86 million recorded as goodwill; net expense, after releases, is ¤ 583 million.
One-Percentage- One-Percentage-Point Increase Point Decrease
in ¤ m. 2002 2001 2002 2001
Effect on total of service and interestcost components 2 2 (2) (2)
Effect on accumulated postretirementbenefit obligation 18 16 (15) (14)

2002 Plans
Consolidated Financial Statements
At December 31, 2002, ¤ 172 million of the remaining restructuring liabilitiesrelated to severance and other termination-related costs for further staff reduc-tions of approximately 1,500 positions. These severance actions, as well as theactions related to other exit activities, are expected to be completed by the endof the first half of 2003. During the year ended December 31, 2002, approximately 5,400 employeeswere terminated, resulting in a payment of ¤ 510 million against restructuring liabilities. The following is a description of the Group’s restructuring plans for the yearsended December 31, 2002 and 2001.
Group Restructuring. The Group recorded a pre-tax charge of ¤ 340 million inthe first quarter of 2002 related to restructuring activities affecting all ofDeutsche Bank’s group divisions: Corporate and Investment Bank (CIB), PrivateClients and Asset Management (PCAM) and Corporate Investments (CI). Of thetotal ¤ 340 million, ¤ 246 million are related to restructuring measures in PCAM,¤ 93 million in CIB and ¤ 1 million in CI. A total of approximately 2,100 staff areimpacted by these restructuring plans. The restructuring covers a broad range ofmeasures primarily to streamline the Group’s branch network in Germany, aswell as its infrastructure.As of December 31, 2002, approximately 2,000 positions were eliminated and¤ 295 million of the reserve was utilized. As of December 31, 2002, ¤ 30 millionof the remaining reserve balance related to severance and other termination-related costs for further staff reductions of approximately 100 positions and¤ 12 million related to lease terminations and other related costs. All actions contemplated in the plan are expected to be completed by the end of the firstquarter of 2003.
CIB Restructuring. In the second quarter of 2002, the Group recorded arestructuring liability of ¤ 265 million related to the CIB Group Division. The planaffected approximately 2,000 staff, across all levels of the Group. The restructuring resulted from detailed business reviews and reflected theGroup’s outlook for the markets in which it operates. It related to banking cover-age, execution and relationship management processes; custody; trade financeand other transaction banking activities; and the related technology, settlement,real estate and other support functions.During the year ended December 31, 2002, approximately 800 positions wereeliminated and ¤ 104 million of the reserve was utilized. As of December 31,2002, ¤ 128 million of the remaining reserve balance related to severance andother termination-related costs for further staff reductions of approximately1,200 positions and ¤ 19 million related to lease terminations and other relatedcosts. All actions contemplated in the plan are expected to be completed by theend of the first half of 2003.
Scudder Restructuring. During 2002, the Group recorded a restructuring lia-bility of ¤ 86 million related to restructuring activities in connection with theacquisition of Zurich Scudder Investments, Inc. Of this amount, approximately¤ 83 million of severance and other termination-related costs and ¤ 3 million forother costs, primarily related to lease terminations, were recognized as a liabilityassumed as of the acquisition date and charged directly to goodwill. A total ofapproximately 1,000 Scudder staff is impacted by this restructuring plan.
171
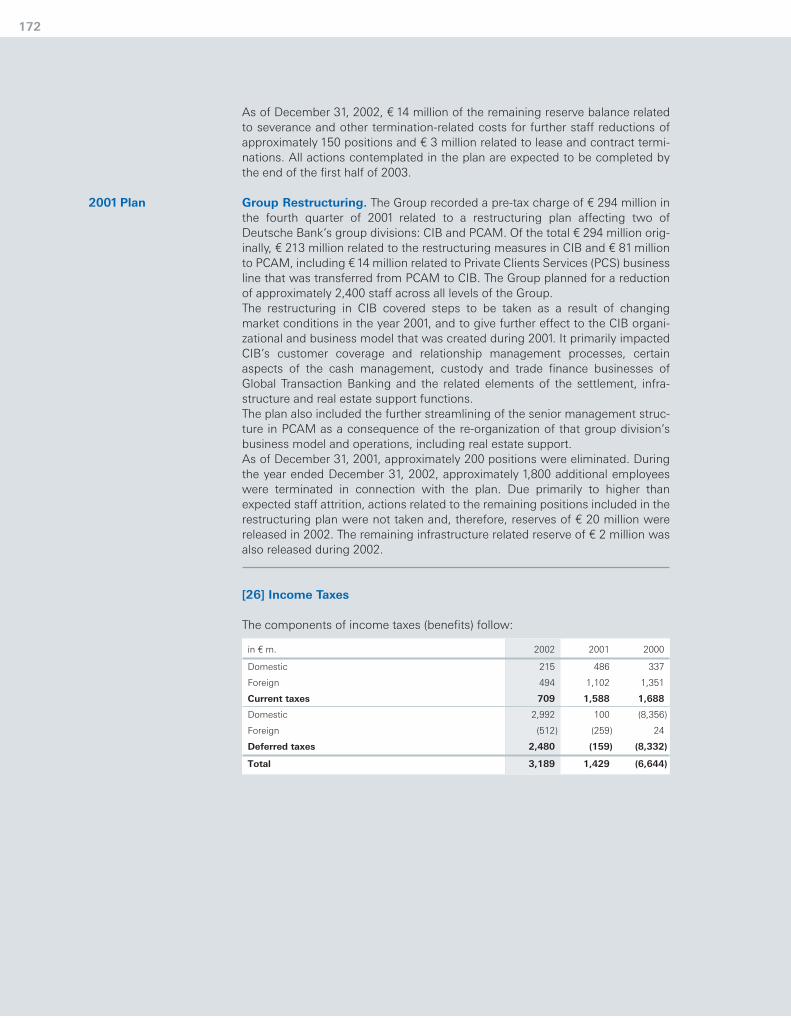
As of December 31, 2002, ¤ 14 million of the remaining reserve balance relatedto severance and other termination-related costs for further staff reductions ofapproximately 150 positions and ¤ 3 million related to lease and contract termi-nations. All actions contemplated in the plan are expected to be completed bythe end of the first half of 2003.
Group Restructuring. The Group recorded a pre-tax charge of ¤ 294 million inthe fourth quarter of 2001 related to a restructuring plan affecting two ofDeutsche Bank’s group divisions: CIB and PCAM. Of the total ¤ 294 million orig-inally, ¤ 213 million related to the restructuring measures in CIB and ¤ 81 millionto PCAM, including ¤ 14 million related to Private Clients Services (PCS) businessline that was transferred from PCAM to CIB. The Group planned for a reductionof approximately 2,400 staff across all levels of the Group. The restructuring in CIB covered steps to be taken as a result of changing market conditions in the year 2001, and to give further effect to the CIB organi-zational and business model that was created during 2001. It primarily impactedCIB’s customer coverage and relationship management processes, certainaspects of the cash management, custody and trade finance businesses ofGlobal Transaction Banking and the related elements of the settlement, infra-structure and real estate support functions. The plan also included the further streamlining of the senior management struc-ture in PCAM as a consequence of the re-organization of that group division’sbusiness model and operations, including real estate support. As of December 31, 2001, approximately 200 positions were eliminated. Duringthe year ended December 31, 2002, approximately 1,800 additional employeeswere terminated in connection with the plan. Due primarily to higher thanexpected staff attrition, actions related to the remaining positions included in therestructuring plan were not taken and, therefore, reserves of ¤ 20 million werereleased in 2002. The remaining infrastructure related reserve of ¤ 2 million wasalso released during 2002.
[26] Income Taxes
The components of income taxes (benefits) follow:
172
2001 Plan
in ¤ m. 2002 2001 2000
Domestic 215 486 337
Foreign 494 1,102 1,351
Current taxes 709 1,588 1,688
Domestic 2,992 100 (8,356)
Foreign (512) (259) 24
Deferred taxes 2,480 (159) (8,332)
Total 3,189 1,429 (6,644)

Consolidated Financial Statements
The following is an analysis of the difference between the amount that wouldresult from applying the German statutory income tax rate to income before taxand the Group’s actual income tax expense (benefit):
During 2000, a new tax law was enacted in Germany which reduced the corpo-rate tax rates and exempted from tax certain gains from the sale of equity secu-rities. The corporate tax rate was reduced from 40% on retained earnings and30% on distributed earnings to a single 25% rate effective January 1, 2001. Thedomestic tax rate including corporate tax, solidarity surcharge, and trade taxused for calculating deferred tax assets and liabilities as of December 31, 2000was 39.3% which at that time was the expected statutory rate for 2001. The taxlaw change also exempted certain gains on the sale of equity securities effectiveJanuary 1, 2002. The effect of the above changes was a net income tax benefit of¤ 9.3 billion for the year ended December 31, 2000. Approximately ¤ 6.2 billionof the tax benefit from the change in tax rates in 2000 is related to the reductionof deferred tax liabilities previously recorded on unrealized gains on equity secu-rities – even though these deferred taxes were originally established through acharge to other comprehensive income, not through a charge to earnings. For the years ended December 31, 2002 and 2001, due to actual sales of equitysecurities on which there was accumulated deferred tax provision in other com-prehensive income, it was necessary to reverse those provisions as income taxexpense. This treatment led to income tax expense of ¤ 2,817 million and ¤ 995million, respectively. This adjustment does not result in actual tax payments andhas no net effect on shareholders’ equity. The remaining accumulated deferred tax amounts recorded within other com-prehensive income will be reversed as income tax expense in the periods thatthe related securities are sold. At December 31, 2002 and 2001, the amount ofthese deferred taxes accumulated within other comprehensive income that willreverse in a future period as tax expense when the securities are sold is approxi-mately ¤ 3.0 billion and ¤ 5.9 billion, respectively. The corporate income tax rate in Germany has been temporarily increased by1.5% to 26.5% for the year 2003 only as enacted in September 2002. This willincrease the statutory income tax rate to 40.5% for temporary differences thatwill reverse in 2003. The resulting tax benefit did not have a material impact onincome taxes.
173
in ¤ m. 2002 2001 2000
Expected tax expense at German statutory
income tax rate of 39.2% (52.4% for 2000) 1,391 707 3,599
Effect of changes in German tax law and the reversing effect 2,817 995 (9,287)
Domestic tax rate differential on dividend distribution (65) – (172)
Tax-exempt gains on securities and other income (1,824) (1,077) (101)
Foreign tax-rate differential 87 (146) (903)
Change in valuation allowance 254 286 (108)
Nondeductible expenses 223 354 98
Goodwill amortization/impairment 24 363 404
Tax credit related to domestic dividend received (7) (109) (144)
Tax rate differential on (income) losson equity method investments 348 143 (157)
Other (59) (87) 127
Actual income tax expense (benefit) 3,189 1,429 (6,644)

The tax effects of each type of temporary difference and carryforward that giverise to significant portions of deferred income tax assets and liabilities are the following:
Included in other assets and other liabilities at December 31, 2002 and 2001 aredeferred tax assets of ¤ 3.9 billion and ¤ 3.8 billion and deferred tax liabilities of¤ 1.1 billion and ¤ 1.4 billion, respectively. Certain foreign branches and companies in the Group have deferred tax assetsrelated to net operating loss carryforwards and tax credits available to reducefuture tax expense. The net operating loss carryforwards at December 31, 2002were ¤ 6.3 billion of which ¤ 5.9 billion has no expiration date and ¤ 429 millionexpire at various dates extending to 2021. Tax credits were ¤ 326 million of which¤ 221 million will expire in 2004 and ¤ 33 million will expire in 2005 and ¤ 72 mil-lion have other expiration dates. The Group has established a valuation allowancewhere realization of those losses and credits is not likely. The Group did not provide income taxes or foreign withholding taxes on ¤ 5.2billion of cumulative earnings of foreign subsidiaries as of December 31, 2002because these earnings are intended to be indefinitely reinvested in those oper-ations. It is not practicable to estimate the amount of unrecognized deferred taxliabilities for these undistributed foreign earnings.
174
in ¤ m. Dec 31, 2002 Dec 31, 2001
Deferred income tax assets
Trading activities 12,298 17,424
Net operating loss carryforwards and tax credits 2,632 2,222
Property and equipment, net 673 756
Other assets 2,253 2,913
Allowance for loan losses 152 315
Other provisions 593 883
Total 18,601 24,513
Valuation allowance (949) (965)
Deferred tax assets after valuation allowance 17,652 23,548
Deferred income tax liabilities
Trading activities 13,197 19,468
Property and equipment, net 689 434
Securities valuation 82 236
Other liabilities 858 974
Total 14,826 21,112
Net deferred income tax assets 2,826 2,436

[27] Earnings Per Common Share
Basic earnings per common share amounts were computed by dividing netincome by the average number of common shares outstanding during the year.The average number of common shares outstanding is the sum of the averagenumber of common shares outstanding and undistributed vested sharesawarded under deferred share plans. Diluted earnings per share amounts were calculated by adding back to netincome the interest expense on the convertible bonds and dividing this amountby the average number of common shares and dilutive potential common sharesoutstanding during the year. Diluted earnings per share assumes the conversion into common shares of out-standing share options, unvested deferred share awards and convertible bonds,as computed under the treasury stock method, if dilutive. Under the treasuryshare method, the number of incremental shares is determined by assuming theissuance of the outstanding share options, deferred share awards, and sharesfrom convertible bonds, reduced by the number of shares assumed to be repur-chased from the issuance proceeds, using the Group’s average market shareprice for the year.
Consolidated Financial Statements 175

The following tables set forth the computation of basic and diluted earnings pershare:
[28] Business Segments and Related Information
From the beginning of 2002, the Group revised its management reporting systems to reflect changes in the methodologies employed for managing theGroup’s divisions and to reflect changes in management responsibility for certainbusinesses.The methodologies for managing the Group’s divisions were amended to bringthem more closely in line with U.S. GAAP. The changes were primarily related tothe accounting for share-based compensation, the accounting for equitymethod investments, the elimination of income earned on the Group’s bondsand the presentation of minority interest as a noninterest expense item. In addi-tion, the reporting format of the Group’s management reporting systems wererevised to reflect how management evaluated its businesses in 2002. Prior periods have been restated to conform to the current year’s presentation.
176
in ¤ m. 2002 2001 2000
Income before cumulative effect of accounting changes, net of tax 360 374 13,513
Cumulative effect of accounting changes, net of tax 37 (207) –
Numerator for basic earnings per share – net income 397 167 13,513
Effect of dilutive securities:
Convertible bonds – – 1
Numerator for diluted earnings per share – net income applicable
to common shareholders after assumed conversions 397 167 13,514
in ¤ 2002 2001 2000
Basic earnings per share
Income before cumulative effect of accounting changes, net of tax 0.58 0.60 22.00
Cumulative effect of accounting changes, net of tax 0.06 (0.33) –
Net income 0.64 0.27 22.00
Diluted earnings per share
Income before cumulative effect of accounting changes, net of tax 0.57 0.60 21.72
Cumulative effect of accounting changes, net of tax 0.06 (0.33) –
Net income 0.63 0.27 21.72
Number of shares 2002 2001 2000
Denominator for basic earnings per share – weighted-average shares outstanding 615,867,917 619,809,559 614,303,797
Effect of dilutive securities:
Options 4,350,557 800,535 842,839
Convertible bonds 107,527 174,003 4,296,519
Deferred shares 6,145,041 2,003,504 2,748,708
Dilutive potential common shares 10,603,125 2,978,042 7,888,066
Denominator for diluted earnings per share – adjusted
weighted-average shares after assumed conversions 626,471,042 622,787,601 622,191,863

Organizational Structure
Changes in Manage-ment Responsibility
Consolidated Financial Statements
The Corporate and Investment Bank Group Division serves all of the Group’s corporate and institutional clients, ranging from small and medium-sized enter-prises to multinational corporations. The Group serves its clients through thecorporate divisions, Corporate Banking & Securities and Global TransactionBanking.The Private Clients and Asset Management Group Division integrates, on aglobal basis, all of the Group’s activities for retail and affluent clients, as well asits active and passive asset management activities for retail and institutionalclients. Within this group division, the Group manages these activities in threeglobal corporate divisions: Asset Management, Private Banking, and PersonalBanking. Within the Corporate Investments Group Division, the Group combines its principal investment activities. This unit manages the Group’s principal privateequity and venture capital investments and its real estate holding companies, aswell as its industrial investments. The principal investments held by DB Investorare included in this group division. In addition, Corporate Investments coversstrategic investments as well as activities that do not belong to the Group’s corebusiness.The Group also has a service function called DB Services, that provides corpo-rate services, information technology, consulting and transaction services to theentire organization. The Group’s Corporate Center includes those functions thatsupport cross-divisional management.
During 2002, management responsibility changed for the following significantbusinesses: – The Private Clients Services business was transferred from the Private
Banking Corporate Division to the Corporate Banking & Securities Corporate Division.
– The Morgan Grenfell private equity business previously assigned to the AssetManagement Corporate Division was transferred to the Corporate Invest-ments Group Division.
– The real estate business managed by the subsidiary DB Real Estate Manage-ment GmbH (formerly Deutsche Grundbesitz Management GmbH) and thereal estate investment funds business in Italy (brand name “Fondimmobiliari”)were transferred from Corporate Investments Group Division to the AssetManagement Corporate Division where they are managed under “DB RealEstate”.
– All European e-brokerage activities under the brand name “maxblue” are con-solidated under the Personal Banking Corporate Division. The Group thereforetransferred all European “maxblue” activities previously reported under theCorporate Investments Group Division to the Personal Banking CorporateDivision. The same transfer was made for all e-commerce activities in connec-tion with the brand name “moneyshop/moneyshelf”.
177

The effects of significant acquisitions and divestitures on segmental results ofoperations are described below: – The disposal of most of the Group’s insurance subsidiaries affected both
net revenues and noninterest expenses of the Personal Banking CorporateDivision.
– A majority of the Scudder business is included in the Asset Management Cor-porate Division with a smaller part included in the Private Banking CorporateDivision. The RREEF business is included entirely in the Asset ManagementCorporate Division.
– The merger of the Group’s mortgage bank subsidiary “EUROHYPO AGEuropäische Hypothekenbank der Deutschen Bank” with the mortgage banksubsidiaries of Dresdner Bank AG and Commerzbank AG to the newly created“EUROHYPO AG” in the third quarter of 2002 led to the deconsolidation of theGroup’s former subsidiary. In anticipation of the merger, the business of theGroup’s mortgage bank was transferred from the Corporate Banking & Secu-rities Corporate Division to the Corporate Investments Group Division as ofthe first quarter of 2002. After the merger, the Group’s share in the combinedentity was 34.6%, with Commerzbank taking a 34.4% share and DresdnerBank taking a 28.7% share (free-float 2.3%). In connection with the merger,in December 2002, part of the Group’s London-based real estate investmentbanking business was contributed to EUROHYPO AG. On December 31,2002, the Group’s share of the combined entity was 34.6%.
– The Group sold its commercial finance business in North America to GE Com-mercial Finance in October 2002 and the Group sold its consumer financebusiness in North America to E*TRADE Bank in December 2002.
178
Impact of Acquisitionsand Divestitures During 2002

Consolidated Financial Statements
Business segment results are determined based on the Group’s internal management reporting process, which reflects the way management views itsbusinesses, and are not necessarily prepared in accordance with the Group’sU.S. GAAP consolidated financial statements. This internal management report-ing process may be different than the processes used by other financial institu-tions and therefore, should be considered in making any comparisons withthose institutions. Since the Group’s business activities are diverse in nature andits operations are integrated, certain estimates and judgments have been madeto apportion revenue and expense items among the business segments.The management reporting system follows the “matched transfer pricing con-cept” in which the Group’s external net interest revenues are allocated to thebusiness segments based on the assumption that all positions are funded orinvested via the money and capital markets. Therefore, to create comparabilitywith competitors which have legally independent units with their own equityfunding, we allocate among our business segments the notional interest crediton our consolidated capital resulting from our method for allocating fundingcosts. This credit is allocated in proportion to each business segment’s allocatedequity, and is included in the segment’s net interest revenues.The general principle of the Group’s book equity allocation framework is to allo-cate the total of the Group’s average active equity to the segments in proportionto their share of economic risk positions using a multiplier for which the Grouputilizes the term “Capital Allocation Factor (CAF)”. Starting 2002, the Group’saverage active equity increased while the aggregated economic risk positions ofthe segments went down. As it is the Group’s objective to maintain the risk sen-sitivity within the equity allocation framework, the Group decided to maintain aconstant CAF multiplier for all of 2002 based on the relation between theGroup’s average active equity and the aggregated economic risk positions of thesegments as of January 2002. Consequently, the reduction in the aggregatedeconomic risk positions of the Group’s segments during 2002 led to less allo-cated average active equity and the incentive for the Group’s segments to fur-ther reduce risk positions was strengthened. The resulting unallocated amountof average active equity amounted to ¤ 3.8 billion in 2002.Revenues from intersegment transactions are allocated to the business seg-ments on a mutually agreed basis. In addition, cost centers are internal serviceproviders operating on a nonprofit basis and allocate their costs to the servicerecipient. The allocation criteria are generally contractually agreed and are eitherdetermined based upon “price per unit” (for areas with countable services) or“fixed price” or “agreed percentages” (for all areas without countable services).
179
General Informationon the Group’s Management’sReporting Systems

The following tables present the results of the business segments for the yearsended December 31, 2002, 2001 and 2000:
180
Segmental Results ofOperations
2002 Corporate and Investment Bank Private Clients and Asset Management Corporate Total
Corporate Global Total Asset Private Personal Total Invest- Manage-
Banking & Trans- Manage- Banking Banking ments ment
Securities action ment Reporting
in ¤ m. Banking
Net revenues1 11,615 2,704 14,319 2,513 1,468 4,991 8,972 3,086 26,377
Provision for loan losses 1,697 12 1,709 (3) 15 215 227 155 2,091
Provision for off-balance sheet positions 83 (52) 31 – – (1) (1) (11) 19
Policyholder benefits and claims – – – 35 – 650 685 – 685
Operating cost base2, 4 9,049 2,236 11,285 2,022 1,324 3,076 6,422 1,222 18,929
Income before
nonoperating costs 786 508 1,294 459 129 1,051 1,639 1,720 4,653
Goodwill impairment – – – – – – – 62 62
Severance payments 238 17 255 72 19 45 136 19 410
Restructuring activities 316 26 342 (1) 24 217 240 1 583
Minority interest 8 – 8 25 (1) 8 32 2 42
Total nonoperating costs 562 43 605 96 42 270 408 84 1,097
Income before income
taxes5 224 465 689 363 87 781 1,231 1,636 3,556
Average active equity6 14,454 1,796 16,250 2,665 386 1,442 4,493 6,751 27,494
Assets3,7 631,052 25,758 643,668 22,448 11,626 69,507 101,296 26,546 748,335
Expenditures for additions to long-lived assets 262 73 335 44 18 37 99 335 769
Risk-weighted positions(BIS risk positions) 142,483 13,613 156,096 6,027 7,271 44,061 57,359 19,219 232,674
1 Includes:Net interest revenues 3,712 934 4,646 (137) 243 2,447 2,553 85 7,284Net revenues from external customers 11,555 2,828 14,383 2,710 1,320 4,865 8,895 3,002 26,280Net intersegment revenues 60 (124) (64) (197) 148 126 77 84 97Net income (loss) from equity method investments (32) 1 (31) 141 – 20 161 (1,034) (904)
2 Includes:Depreciation, depletion and amortization 358 103 461 72 45 176 293 132 886
3 Includes:Equity method investments 571 38 609 1,145 12 16 1,173 3,944 5,726
4 Noninterest expenses excluding nonoperating costs (goodwill impairment, severance payments, restructuring activities, minority interest), provision for off-balance sheet positions and policyholder benefits and claims.
5 Before cumulative effect of accounting changes.6 Book equity is allocated to the divisions for Management Reporting purposes in proportion to the economic capital calculated for them.7 At the group division level CIB, PCAM, CI and Total Management Reporting, intersegment items between the group divisions/corporate divisions are included.

Consolidated Financial Statements 181
2001 Corporate and Investment Bank Private Clients and Asset Management Corporate Total
Corporate Global Total Asset Private Personal Total Invest- Manage-
Banking & Trans- Manage- Banking Banking ments ment
Securities action ment Reporting
in ¤ m. Banking
Net revenues1 14,421 3,053 17,474 1,853 1,697 6,843 10,393 2,054 29,921
Provision for loan losses 629 (19) 610 12 11 183 206 199 1,015
Provision for off-balance sheet positions 5 (34) (29) – – – – 3 (26)
Policyholder benefits and claims – – – 48 – 2,898 2,946 – 2,946
Operating cost base2, 4 11,279 2,450 13,729 1,619 1,482 3,853 6,954 1,363 22,046
Income (loss) before
nonoperating costs 2,508 656 3,164 174 204 (91) 287 489 3,940
Goodwill amortization 470 65 535 125 27 35 187 135 857
Severance payments 256 41 297 21 19 44 84 13 394
Restructuring activities 190 37 227 35 21 11 67 – 294
Minority interest 13 2 15 36 2 16 54 17 86
Total nonoperating costs 929 145 1,074 217 69 106 392 165 1,631
Income (loss) before
income taxes5 1,579 511 2,090 (43) 135 (197) (105) 324 2,309
Average active equity6 15,965 2,732 18,697 2,206 417 1,701 4,324 7,757 30,778
Assets3,7 663,760 24,708 677,623 20,600 12,469 91,572 123,784 121,006 896,476
Expenditures for additions to long-lived assets 560 99 659 31 62 67 160 141 960
Risk-weighted positions(BIS risk positions) 168,705 19,240 187,945 5,890 8,476 41,865 56,231 56,202 300,378
1 Includes:Net interest revenues 3,876 1,073 4,949 (75) 265 3,173 3,363 144 8,456Net revenues from external customers 14,423 3,115 17,538 2,130 1,553 6,646 10,329 1,931 29,798Net intersegment revenues (2) (62) (64) (277) 144 197 64 123 123Net income (loss) from equity method investments (27) – (27) (11) – 3 (8) (341) (376)
2 Includes:Depreciation, depletion and amortization 362 100 463 41 67 255 364 84 911
3 Includes:Equity method investments 1,094 – 1,094 1,021 – 126 1,147 2,885 5,126
4 Noninterest expenses excluding nonoperating costs (goodwill amortization, severance payments, restructuring activities, minority interest), provision for off-balance sheet positions and policyholder benefits and claims.
5 Before cumulative effect of accounting changes.6 Book equity is allocated to the divisions for Management Reporting purposes in proportion to the economic capital calculated for them.7 At the group division level CIB, PCAM, CI and Total Management Reporting, intersegment items between the group divisions/corporate divisions are included.
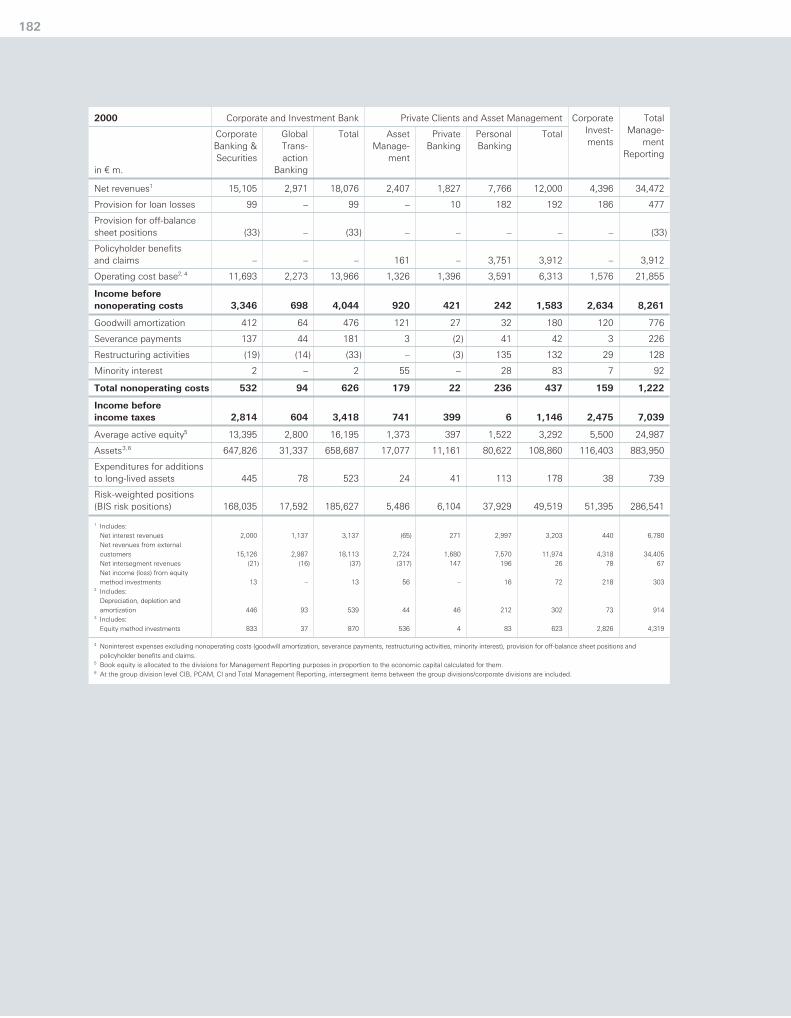
182
2000 Corporate and Investment Bank Private Clients and Asset Management Corporate Total
Corporate Global Total Asset Private Personal Total Invest- Manage-
Banking & Trans- Manage- Banking Banking ments ment
Securities action ment Reporting
in ¤ m. Banking
Net revenues1 15,105 2,971 18,076 2,407 1,827 7,766 12,000 4,396 34,472
Provision for loan losses 99 – 99 – 10 182 192 186 477
Provision for off-balance sheet positions (33) – (33) – – – – – (33)
Policyholder benefits and claims – – – 161 – 3,751 3,912 – 3,912
Operating cost base2, 4 11,693 2,273 13,966 1,326 1,396 3,591 6,313 1,576 21,855
Income before
nonoperating costs 3,346 698 4,044 920 421 242 1,583 2,634 8,261
Goodwill amortization 412 64 476 121 27 32 180 120 776
Severance payments 137 44 181 3 (2) 41 42 3 226
Restructuring activities (19) (14) (33) – (3) 135 132 29 128
Minority interest 2 – 2 55 – 28 83 7 92
Total nonoperating costs 532 94 626 179 22 236 437 159 1,222
Income before
income taxes 2,814 604 3,418 741 399 6 1,146 2,475 7,039
Average active equity5 13,395 2,800 16,195 1,373 397 1,522 3,292 5,500 24,987
Assets3,6 647,826 31,337 658,687 17,077 11,161 80,622 108,860 116,403 883,950
Expenditures for additions to long-lived assets 445 78 523 24 41 113 178 38 739
Risk-weighted positions(BIS risk positions) 168,035 17,592 185,627 5,486 6,104 37,929 49,519 51,395 286,541
1 Includes:Net interest revenues 2,000 1,137 3,137 (65) 271 2,997 3,203 440 6,780Net revenues from external customers 15,126 2,987 18,113 2,724 1,680 7,570 11,974 4,318 34,405Net intersegment revenues (21) (16) (37) (317) 147 196 26 78 67Net income (loss) from equity method investments 13 – 13 56 – 16 72 218 303
2 Includes:Depreciation, depletion and amortization 446 93 539 44 46 212 302 73 914
3 Includes:Equity method investments 833 37 870 536 4 83 623 2,826 4,319
4 Noninterest expenses excluding nonoperating costs (goodwill amortization, severance payments, restructuring activities, minority interest), provision for off-balance sheet positions and policyholder benefits and claims.
5 Book equity is allocated to the divisions for Management Reporting purposes in proportion to the economic capital calculated for them.6 At the group division level CIB, PCAM, CI and Total Management Reporting, intersegment items between the group divisions/corporate divisions are included.

Consolidated Financial Statements
The following tables present the revenue components of the Corporate andInvestment Bank Group Division and the Private Clients and Asset Manage-ment Group Division for the years ended December 31, 2002, 2001 and 2000respectively:
183
in ¤ m. 2002 2001 2000
Sales & Trading (debt and other products) 5,423 5,814 4,449
Sales & Trading (equity) 2,791 4,111 5,152
Total Sales & Trading 8,214 9,925 9,601
Transaction services 2,704 3,053 2,971
Loan products 2,393 2,975 3,623
Origination (debt) 388 441 286
Origination (equity) 354 492 937
Total Origination 742 933 1,223
Advisory 516 568 879
Other (250) 20 (221)
Total 14,319 17,474 18,076
in ¤ m. 2002 2001 2000
Portfolio/funds management 2,723 2,170 2,679
Loan/deposit products 2,531 2,462 2,262
Advisory 1,235 1,374 1,612
Insurance business 963 3,487 4,484
Transaction fees 589 642 620
Other 931 258 343
Total 8,972 10,393 12,000
Corporate and Investment Bank
Private Clients andAsset Management

The following tables provide a reconciliation of the total results of operations andtotal assets of the Group’s business segments under management reporting sys-tems to the consolidated financial statements prepared in accordance withU.S. GAAP for the years ended December 31, 2002, 2001 and 2000:
There are two primary categories of adjustments which the Group records toreconcile the total results according to management reporting to the consoli-dated financial statements. These adjustments include differences in accountingmethods used for management reporting versus U.S. GAAP and adjustmentsrelating to activities outside the management responsibility of the business segments.
Net revenues. For the years ended December 31, 2002, 2001 and 2000, adjust-ments included approximately ¤ 0.1 billion, ¤ (0.2) billion and ¤ 0.3 billion,respectively, related to positions which are marked to market for managementreporting purposes and accounted for on an accrual basis under U.S. GAAP. Theyear 2002 also included approximately ¤ 0.2 billion for the elimination of tradinglosses on the Group’s securities and approximately ¤ (0.1) billion mainly due tolosses from internally hedging share-based compensation plans. The year 2001also included approximately ¤ (0.3) billion due to losses from internally hedgingshare-based compensation plans and approximately ¤ 0.1 billion for other corpo-rate items outside the responsibility of the business segments. The year 2000also included approximately ¤ (0.2) billion for the elimination of gains on theGroup’s securities.
184
Reconciliation of Segmental Results ofOperations to Consoli-dated Results of Operations Accordingto U.S. GAAP
2002 2001 2000
Total Adjust- Total Total Adjust- Total Total Adjust- TotalManage- ments Consoli- Manage- ments Consoli- Manage- ments Consoli-
ment dated ment dated ment datedin ¤ m. Reporting Reporting Reporting
Net revenues1 26,377 170 26,547 29,921 (380) 29,541 34,472 7 34,479
Provision for loan losses 2,091 – 2,091 1,015 9 1,024 477 1 478
Provision for off-balancesheet positions 19 (2) 17 (26) (4) (30) (33) – (33)
Policyholder benefits andclaims 685 74 759 2,946 56 3,002 3,912 91 4,003
Operating cost base2 18,929 41 18,970 22,046 (19) 22,027 21,855 (35) 21,820
Income before
nonoperating costs 4,653 57 4,710 3,940 (422) 3,518 8,261 (50) 8,211
Nonoperating costs 1,097 64 1,161 1,631 84 1,715 1,222 120 1,342
Income before income taxes3 3,556 (7) 3,549 2,309 (506) 1,803 7,039 (170) 6,869
Total assets 748,335 10,020 758,355 896,476 21,746 918,222 883,950 45,044 928,994
1 Net interest revenues and noninterest revenues. 2 Noninterest expenses excluding nonoperating costs (goodwill amortization/impairment, severance payments, restructuring activities, minority interest),
provision for off-balance sheet positions and policyholder benefits and claims.3 Before cumulative effect of accounting changes.

Net Revenues (Including Provisionfor Loan Losses) byGeographical Location
Consolidated Financial Statements
Provision for loan losses and provision for off-balance sheet positions.The adjustments reflected provisions for loan losses and provisions for off-bal-ance sheet positions, none of which was individually material, that are not underthe management responsibility of the business segments.
Operating cost base, policyholder benefits and claims and nonoperatingcosts. In 2002, adjustments were primarily attributable to expenses related tolegal items not under the management responsibility of the business segments.In 2001, approximately ¤ 0.1 billion was related to buyout costs for the GlobalEquity Plan that was offset by a positive adjustment of approximately ¤ 0.1billionrelated to internally hedging share-based compensation plans. The remainingadjustment of approximately ¤ 0.1 billion primarily related to other corporateitems not under the management responsibility of the business segments.Adjustments for the year ended December 31, 2000 were primarily attributableto expenses related to corporate items not under the management responsibilityof the business segments.
Total Assets. The adjustments consisted of assets not allocated to the businesssegments (including deferred tax assets and premises and equipment) and tointersegment items between the group divisions.
The following table presents net revenues (including provision for loan losses) bygeographical location:
[29] International Operations
The following table presents asset and income statement information by majorgeographic area. The information presented has been classified based primarilyon the location of the Group’s office in which the assets and transactions arerecorded. However, due to the highly integrated nature of the Group’s opera-tions, estimates and assumptions have been made to allocate items betweenregions.
185
in ¤ m. 2002 2001 2000
Germany 10,676 12,788 14,295
Europe (excluding Germany) 6,228 7,429 9,739
North America (primarily U.S.) 5,218 6,106 7,585
South America 175 211 181
Asia-Pacific1 2,159 1,983 2,201
Consolidated net revenues2 24,456 28,517 34,001
1 Includes revenues from Africa, which were not material in 2002, 2001 and 2000.2 Consolidated net revenues include net interest revenues after provision for loan losses and noninterest revenues. Revenues are attributed
to countries based on the location in which the Group’s booking are located.

186
2002 Total Total Total Income Netassets revenues1 expenses1 (loss) income
before (loss)in ¤ m. taxes2
Europe (excluding Germany) 285,181 18,846 18,724 122 192
North America (primarily U.S.) 205,375 13,352 13,953 (601) (383)
South America 1,051 963 877 86 52
Asia-Pacific3 49,976 3,955 3,356 599 400
Total international 541,583 37,116 36,910 206 261
Domestic operations (Germany) 216,772 18,026 14,683 3,343 136
Total 758,355 55,142 51,593 3,549 397
International as a percentage oftotal above 71% 67% 72% 6% 66%
1 Total revenues include interest revenues and noninterest revenues. Total expenses include interest expense, noninterest expenses andprovision for loan losses.
2 Before cumulative effect of accounting changes. 3 Includes balance sheet and income statement data from Africa, which were not material in 2002.
2001 Total Total Total Income Netassets revenues1 expenses1 (loss) income
before (loss)in ¤ m. taxes2
Europe (excluding Germany) 311,711 23,919 22,918 1,001 522
North America (primarily U.S.) 237,456 21,794 22,349 (555) (811)
South America 2,433 816 708 108 41
Asia-Pacific3 58,487 4,875 4,723 152 7
Total international 610,087 51,404 50,698 706 (241)
Domestic operations (Germany) 308,135 23,156 22,059 1,097 408
Total 918,222 74,560 72,757 1,803 167
International as a percentage oftotal above 66% 69% 70% 39% N/M
1 Total revenues include interest revenues and noninterest revenues. Total expenses include interest expense, noninterest expense and provision for loan losses.
2 Before cumulative effect of accounting changes. 3 Includes balance sheet and income statement data from Africa, which were not material in 2001. N/M – Not meaningful
2000 Total Total Total Income Netassets revenues1 expenses1 before income
in ¤ m. taxes
Europe (excluding Germany) 319,664 25,723 23,099 2,624 1,854
North America (primarily U.S.) 256,260 25,402 23,912 1,490 1,030
South America 1,475 759 701 58 52
Asia-Pacific2 69,865 5,470 5,128 342 203
Total international 647,264 57,354 52,840 4,514 3,139
Domestic operations (Germany) 281,730 25,228 22,873 2,355 10,374
Total 928,994 82,582 75,713 6,869 13,513
International as a percentage oftotal above 70% 69% 70% 66% 23%
1 Total revenues include interest revenues and noninterest revenues. Total expenses include interest expense, noninterest expenses and provision for loan losses.
2 Includes balance sheet and income statement data from Africa, which were not material in 2000.

Derivatives Held orIssued for TradingPurposes
Derivatives Held orIssued for NontradingPurposes
Consolidated Financial Statements
[30] Derivative Financial Instruments and Financial Instruments withOff-Balance Sheet Risk
In the normal course of business, the Group enters into a variety of derivativetransactions for both trading and nontrading purposes. The Group’s objectives inusing derivative instruments are to meet customers’ needs, to manage theGroup’s exposure to risks and to generate revenues through trading activities.Derivative contracts used by the Group in both trading and nontrading activitiesinclude swaps, futures, forwards, options and other similar types of contractsbased on interest rates, foreign exchange rates and the prices of equities andcommodities (or related indices).
The Group trades derivative instruments on behalf of customers and for its ownpositions. The Group transacts derivative contracts to address customerdemands both as a market maker in the wholesale markets and in structuringtailored derivatives for customers. The Group also takes proprietary positions forits own accounts. Trading derivative products include swaps, options, forwardsand futures and a variety of structured derivatives which are based on interestrates, equities, credit, foreign exchange and commodities.
Derivatives held or issued for nontrading purposes primarily consist of interestrate swaps used to manage interest rate risk. Through the use of these deriva-tives, the Group is able to modify the volatility and interest rate characteristics ofits nontrading interest-earning assets and interest-bearing liabilities. The Groupis subject to risk from interest rate fluctuations to the extent that there is a gapbetween the amount of interest-earning assets and the amount of interest-bear-ing liabilities that mature or reprice in specified periods. The Group actively man-ages this interest rate risk through, among other things, the use of derivativecontracts. Utilization of derivative financial instruments is modified from time totime within prescribed limits in response to changing market conditions, as wellas changes in the characteristics and mix of the related assets and liabilities. The Group also uses cross-currency interest rate swaps to hedge both foreigncurrency and interest rate risks from securities available for sale. For these hedges, the Group applies either fair value or cash flow hedgeaccounting when cost beneficial. When hedging only interest rate risk, fair valuehedge accounting is applied for hedges of assets or liabilities with fixed interestrates, and cash flow hedge accounting is applied for hedges of floating interestrates. When hedging both foreign currency and interest rate risks, cash flowhedge accounting is applied when all functional-currency-equivalent cash flowshave been fixed, otherwise fair value hedge accounting is applied. For the years ended December 31, 2002 and 2001, net hedge ineffectivenessfrom fair value hedges, which is based on changes in fair value resulting fromchanges in the market price or rate related to the risk being hedged, andamounts excluded from the assessment of hedge effectiveness resulted in a lossof ¤ 81 million and a gain of ¤ 34 million, respectively. As of December 31, 2002,the longest term cash flow hedge outstanding matures in 2029. Derivatives entered into for nontrading purposes that do not qualify for hedgeaccounting are also classified as trading assets and liabilities. These includeinterest rate swaps, foreign exchange forwards and cross currency interest rateswaps used to economically hedge interest and foreign exchange risk, but forwhich it is not cost beneficial to apply hedge accounting. Also included arenegotiated transactions related to the Group’s industrial holdings classified as
187
available for sale, which the Group has entered into for strategic and economicpurposes despite the fact that hedge accounting is precluded. Net losses of ¤ 226 million and ¤ 27 million from nontrading equity derivativesused to offset fluctuations in employee share-based compensation expensewere included in compensation and benefits for the years ended December 31,2002 and 2001, respectively. Prior to January 1, 2001, most of the derivatives entered into for nontrading pur-poses, although considered effective as economic hedges, did not qualify forhedge accounting mainly due to contemporaneous documentation require-ments that could not be fulfilled when initially adopting U.S. GAAP after the fact.Consequently, these derivatives have been accounted for as trading derivatives,that is, they are marked to market and the changes in fair value are reported intrading revenues.
The Group enters into contracts indexed to Deutsche Bank common shares aspart of a share buy-back program, to acquire shares to satisfy employee stockcompensation awards, and for trading purposes.Related to the share buy-back program, at December 31, 2002, the Group hadoutstanding agreements to purchase, on a forward basis, approximately 4 mil-lion Deutsche Bank shares at a weighted-average strike price of ¤ 65.45 pershare. The agreements mature between three months and one year and must bephysically settled. The cash redemption amounts of these forwards, whichtotaled ¤ 278 million, are reported as obligation to purchase common shares andresulted in a reduction of shareholders’ equity with an equal amount reportedunder liabilities.Related to employee share compensation awards, at December 31, 2002, theGroup had outstanding agreements to purchase, on a forward basis, approxi-mately 26 million Deutsche Bank shares at a weighted-average strike price of¤ 72.35 per share. The agreements expire or are exercisable at the vesting datesof the related share awards and mature in less than five years. These agreementsmay, at the Group’s discretion, be settled physically, on a net basis in DeutscheBank shares, or using a combination of both methods. Consequently these contracts are accounted for as permanent equity.Based on the closing price of Deutsche Bank common shares of ¤ 43.90 pershare at December 31, 2002, the Group would have delivered approximately43 million Deutsche Bank shares if the Group had chosen to net share settlethese contracts at December 31, 2002. If the share price had been ¤ 1 lower, theGroup would have delivered an additional 1 million shares if the Group had cho-sen to net share settle these contracts.At December 31, 2002, the Group had outstanding call options to purchaseapproximately 17 million shares at a weighted-average strike price of ¤ 69.00 pershare related to employee share compensation awards. The options must benet-cash settled. The contracts mature in less than five years.
188
Derivative FinancialInstruments Indexedto Our Own Stock

Consolidated Financial Statements
Related to trading activities, the following derivative contracts that are indexedto Deutsche Bank’s own stock are outstanding at December 31, 2002:
The above contracts related to trading activities are accounted for as tradingassets and liabilities and are thus carried at fair value with changes in fair valuerecording in earnings.
189
Type of Settlement Maturity Number of Weighted- Effect of Fair ValueContract Alternative issuers shares average decrease of
to which strike price of share Contractcontracts are price by ¤ 1
indexed (in ¤) (¤ in thousands) (¤ in thousands)
Purchased Net-cash Up to 3 months 359,400 69.90 30 704Options >3 months – 1 year 1,149,900 78.67 (9) 1,916
>1 year – 5 years 1,203,100 83.60 (456) 10,157
Sold Options Net-cash Up to 3 months 35,800 40.56 (7) 82>3 months – 1 year 433,700 42.09 (69) 2,140>1 year – 5 years 384,000 64.31 288 1,563
Forward Deutsche Bank >3 months – 1 year 13,500,000 75.22 (13,500) 443,748Purchases choice >1 year – 5 years 10,000,000 69.00 (10,000) 266,198
Net-cash/physical1,2
Net-cash Up to 3 months 13,546 42.90 (14) 94>3 months – 1 year 467,735 43.90 (468) 2,254>5 years 3,450 50.10 (3) 21
Forward Counterparty >3 month – 1 year 3,199,067 96.86 3,199 179,151Sales choice >1 year – 5 years 22,781,614 69.00 22,782 669,419
Net-cash/physical1
Net-cash Up to 3 months 8,236,744 44.73 8,237 57,869>3 months – 1 year 1,151,086 44.02 1,151 26>1 year – 5 years 22,600 47.96 23 94
1 Fair values do not differ significantly relating to settlement alternatives.2 The forward purchases are subject to collateral requirements.

The Group utilizes various lending-related commitments in order to meet thefinancing needs of its customers. The contractual amount of these commit-ments is the maximum amount at risk for the Group if the customer fails to meetits obligations. Off-balance sheet credit risk amounts are determined withoutconsideration of the value of any related collateral and reflect the total potentialloss on undrawn commitments. The table below summarizes our lending-relatedcommitments:
In addition, as of December 31, 2002, commitments to enter into reverse repurchase and repurchase agreements totaled ¤ 1.4 billion and ¤ 311 million,respectively. Commitments to enter into reverse repurchase and repurchaseagreements amounted to ¤ 3.9 billion and ¤ 7.1billion, respectively, as of Decem-ber 31, 2001. As of December 31, 2002 and 2001 the Group had commitments to contributecapital to equity method and other investments totaling ¤ 829 million and ¤ 583million, respectively.The Group also enters regularly into various guarantee and indemnificationagreements in the normal course of business. Probable losses under financialguarantees are provided for as part of the allowance for credit losses on lending-related commitments as shown in Note [8]. The principal guarantees and indem-nifications that the Group enters into are the following:Financial guarantees, standby letters of credit and performance guarantees, witha carrying amount of ¤ 610 million and with maximum potential payments of¤ 32.6 billion as of December 31, 2002, generally require the Group to pay in theevent of default of debt obligations or when the guaranteed party fails to meetits obligations. Most of these guarantees mature within one year and the maxi-mum term is 48 years. These guarantees are collateralized with cash, securitiesand other collateral of ¤ 5.4 billion as of December 31, 2002.Market value guarantees with a carrying amount of ¤ 9 million as of Decem-ber 31, 2002, consist of agreements to pay customers if the price of fixed-termmutual fund units purchased fall below a certain amount. The maximum amountof potential payments as of December 31, 2002 was ¤ 13.5 billion and representsthe total volume guaranteed of the respective funds. These guarantees haverevolving terms and generally are not collateralized. Upon exercise, written put options effectively require the Group to pay for adecline in market value related to the counterparty’s underlying asset or liability.The carrying amount and maximum potential payments of written puts as ofDecember 31, 2002 was ¤ 10.4 billion and ¤ 64.5 billion, respectively. Nearly all ofthe puts mature within 10 years with a significant portion maturing within fouryears and the maximum term being 35 years. Additionally, credit derivativesrequiring payment by the Group in the event of default of debt obligations havea carrying and maximum potential payment amount of ¤ 706 million and ¤ 18.0
190
Financial Instrumentswith Off-BalanceSheet Credit Risk
in ¤ m. Dec 31, 2002 Dec 31, 2001
Commitments to extend credit
Fixed rates1 21,724 26,390
Variable rates2 81,802 97,570
Commitments to purchase loans 814 1,265
Commitments to sell loans 1,011 2,999
1 Includes commitments to extend commercial letters of credit and guarantees of ¤ 2.2 billion and ¤ 3.2 billion at December 31, 2002 and 2001, respectively.
2 Includes commitments to extend commercial letters of credit and guarantees of ¤ 1.3 billion and ¤ 38 million at December 31, 2002 and 2001, respectively.

Consolidated Financial Statements
billion, respectively, with terms up to 9 years and primarily less than 5 years.These contracts are typically uncollateralized.Securities lending indemnifications require the Group to indemnify customersfor the replacement costs or market value of securities loaned to third parties inthe event the third parties fail to return the securities. These indemnificationshad a maximum potential payment amount of ¤ 46.1 billion and ¤ 42.2 billion, atDecember 31, 2002 and 2001, respectively, with contract terms up to 6 months.The Group primarily receives cash as collateral in excess of the contractamounts. This collateral totaled ¤ 46.6 billion and ¤ 44.0 billion at December 31,2002 and 2001, respectively.
[31] Concentrations of Credit Risk
The Group distinguishes its credit exposures among the following categories:loans, tradable assets, over-the-counter (“OTC”) derivatives and contingent liabilities. Loans exclude interest-earning deposits with banks, other claims (mostly unset-tled balances from securities transactions) and accrued interest. Tradable assets, as defined for this purpose, include bonds, other fixed-incomeproducts and traded loans. Over-the-counter derivatives are the Group’s credit exposures arising from over-the-counter, or OTC, derivative transactions. Credit exposure in OTC derivativesis measured by the cost to replace the contract if the counterparty defaults on itsobligation. The costs of replacement amount to only a small portion of thenotional amount of a derivative transaction. The Group calculates its credit expo-sure under OTC derivatives transactions at any time as the replacement costs ofthe transactions based on marking them to market at that time. Contingent liabilities include liabilities from guarantees (excluding market valueguarantees) and indemnity agreements. They exclude letters of credit, other obli-gations such as irrevocable loan commitments and placement and underwritingcommitments. The Group also excludes other quantifiable indemnities and commitments, which predominantly relate to securities lending on behalf of customers. The following tables represent an overview of the Group’s total credit exposure(other than credit exposure arising from repurchase and reverse repurchaseagreements, securities lending and borrowing, interest-earning deposits withbanks and irrevocable loan commitments) according to the industrial sectorsand the geographical regions of the Group’s counterparties. Credit exposure forthese purposes consists of all transactions where losses might occur due to thefact that counterparties will not fulfill their contractual payment obligations. Thegross amount of the exposure has been calculated without taking any collateralinto account.
191

In the following table, exposures have been allocated to regions based on thedomicile of the Group’s counterparties, irrespective of any affiliations the coun-terparties may have with corporate groups domiciled elsewhere.
[32] Fair Value of Financial Instruments
SFAS 107, “Disclosures about Fair Value of Financial Instruments”, requires thedisclosure of fair value information about financial instruments, whether or notrecognized in the balance sheet, for which it is practicable to estimate that value.Quoted market prices, when available, are used as the measure of fair value. Incases where quoted market prices are not available, fair values are based onpresent value estimates or other valuation techniques. These derived fair valuesare significantly affected by assumptions used, principally the timing of futurecash flows and the discount rate. Because assumptions are inherently subjectivein nature, the estimated fair values cannot be substantiated by comparison toindependent market quotes and, in many cases, the estimated fair values wouldnot necessarily be realized in an immediate sale or settlement of the instrument.The disclosure requirements of SFAS 107 exclude certain financial instrumentsand all nonfinancial instruments (e.g., franchise value of businesses). Accord-
192
Credit Risk Profile by Loans Tradable Assets OTC Derivatives Contingent Liabilities TotalIndustry Sector
Dec 31, Dec 31, Dec 31, Dec 31, Dec 31, Dec 31, Dec 31, Dec 31, Dec 31, Dec 31,in ¤ m. 2002 20012 2002 2001 2002 2001 2002 2001 2002 2001
Banks and insurance 10,720 19,909 47,686 62,512 44,970 44,377 5,892 8,091 109,268 134,889
Manufacturing 22,545 32,102 17,142 13,917 2,389 4,903 9,598 12,705 51,674 63,627
Households 53,207 63,168 – – 281 318 392 477 53,880 63,963
Public sector 4,584 23,658 95,356 91,578 1,792 1,576 232 240 101,964 117,052
Wholesale and retail trade 14,467 15,759 2,583 2,503 688 671 1,989 2,906 19,727 21,839
Commercial real estate activities 18,360 35,617 2,657 3,138 688 230 978 983 22,683 39,968
Other 47,7371 75,2101 31,157 28,524 9,487 4,888 10,623 11,254 99,004 119,876
Total 171,620 265,423 196,581 202,172 60,295 56,963 29,704 36,656 458,200 561,214
1 Includes lease financing and a deduction for unearned income.2 For 2001 certain loan exposures were reclassified from banks and insurance to other (¤ 6.5 billion) and from commercial real estate activities to households (¤ 2.8 billion).
Credit Risk Profile by Loans Tradable Assets OTC Derivatives Contingent Liabilities TotalRegion
Dec 31, Dec 31, Dec 31, Dec 31, Dec 31, Dec 31, Dec 31, Dec 31, Dec 31, Dec 31,in ¤ m. 2002 2001 2002 2001 2002 2001 2002 2001 2002 2001
Eastern Europe 1,679 2,334 4,186 1,659 678 762 483 573 7,026 5,328
Western Europe 133,732 205,981 76,971 93,233 35,094 30,956 21,089 26,065 266,886 356,235
Africa 618 324 951 993 451 669 23 266 2,043 2,252
Asia-Pacific 8,517 13,035 30,493 29,315 4,515 6,143 2,403 3,077 45,928 51,570
North America 24,643 39,817 78,464 70,967 17,698 17,236 5,450 6,150 126,255 134,170
Central and South America 2,373 3,884 2,984 4,177 597 1,080 249 516 6,203 9,657
Other1 58 48 2,532 1,828 1,262 117 7 9 3,859 2,002
Total 171,620 265,423 196,581 202,172 60,295 56,963 29,704 36,656 458,200 561,214
1 Includes supra-national organizations and other exposures that have not been allocated to a single region.

Consolidated Financial Statements
ingly, the aggregate fair value amounts presented do not represent manage-ment’s estimation of the underlying value of the Group. The following are the estimated fair values of the Group’s financial instrumentsrecognized on the Consolidated Balance Sheet, followed by a general descrip-tion of the methods and assumptions used to estimate such fair values.
For short-term financial instruments, defined as those with remaining maturitiesof 90 days or less, the carrying amounts were considered to be a reasonableestimate of fair value. The following instruments were predominantly short-term:
For those components of the above listed financial instruments with remainingmaturities greater than 90 days, fair value was determined by discounting con-tractual cash flows using rates which could be earned for assets with similarremaining maturities and, in the case of liabilities, rates at which the liabilitieswith similar remaining maturities could be issued as of the balance sheet date.
Methods andAssumptions
193
Assets Liabilities
Cash and due from banks Interest-bearing deposits
Central bank funds sold and securities Central bank funds purchased and securities soldpurchased under resale agreements and under repurchase agreements and securitiessecurities borrowed loaned
Interest-earning deposits with banks Other short-term borrowings
Other financial assets Other financial liabilities
Carrying Amount Fair Value
in ¤ m. Dec 31, 2002 Dec 31, 2001 Dec 31, 2002 Dec 31, 2001
Financial assets
Cash and due from banks 8,979 10,388 8,979 10,388
Interest-earning deposits with banks 25,691 37,986 25,715 38,086
Central bank funds sold and securitiespurchased under resale agreements and securities borrowed 155,258 144,003 155,302 144,007
Trading assets1 297,062 293,653 297,077 293,653
Securities available for sale 21,619 71,666 21,619 71,666
Other investments 4,504 6,221 4,504 6,225
Loans (excluding leases), net 163,002 256,194 165,486 259,235
Other financial assets 46,818 62,275 46,813 62,275
Financial liabilities
Noninterest-bearing deposits 30,558 29,731 30,558 29,731
Interest-bearing deposits 297,067 344,358 296,936 344,357
Trading liabilities 131,212 121,329 131,212 121,329
Central bank funds purchased and securities sold under repurchase agreements and securities loaned 99,499 88,995 99,515 88,988
Other short-term borrowings 11,573 20,472 11,581 20,423
Other financial liabilities 46,718 68,950 46,693 68,950
Long-term debt2 107,158 170,984 108,414 172,138
Other positions
Contingent liabilities 33,976 39,171 33,976 39,171
Commitments to extend credit3 103,526 123,960 103,429 123,925
1 Includes loans held for sale.2 Includes trust preferred securities.3 Includes commitments to extend guarantees and letters of credit.

Trading assets (including derivatives and excluding loans held for sale), tradingliabilities and securities available for sale are carried at their fair values.Loans held for sale are accounted for at the lower of cost or market. For short-term loans and variable rate loans which reprice within 90 days, thecarrying value was considered to be a reasonable estimate of fair value. Forthose loans for which quoted market prices were available, fair value was basedon such prices. For other types of loans, fair value was estimated by discountingfuture cash flows using the current rates at which similar loans would be madeto borrowers with similar credit ratings and for the same remaining maturities. Inaddition, the specific loss component of the allowance for loan losses, includingrecoverable amounts of collateral, was considered in the fair value determinationof loans. The fair value estimate of commitments to extend credit, standby andother letters of credit and guarantees included the unrealized gains and losseson those off-balance sheet positions and was generally determined in the samemanner as loans. Other investments consist primarily of investments in equityinstruments (excluding, in accordance with SFAS 107, investments accountedfor under the equity method). Other financial assets consisted primarily of accounts receivable, accrued interestreceivable, cash and cash margins with brokers and due from customers onacceptances. Noninterest-bearing deposits do not have defined maturities. Fair value repre-sents the amount payable on demand as of the balance sheet date. Other financial liabilities consisted primarily of accounts payable, accrued inter-est payable, accrued expenses and acceptances outstanding. The fair value of long-term debt and trust preferred securities was estimated byusing market quotes, as well as discounting the remaining contractual cashflows using a rate at which the Group could issue debt with a similar remainingmaturity as of the balance sheet date.
[33] Litigation
Due to the nature of its business, the Group is involved in litigation and arbitra-tion proceedings in Germany and in a number of jurisdictions outside Germany,including the United States, arising in the ordinary course of business. While it isnot feasible to predict or determine the ultimate outcome of all pending orthreatened legal and regulatory proceedings, the Group does not believe that theoutcome of these proceedings will have a material adverse effect on the Group’sfinancial condition or results of operations. On December 20, 2002, the U.S. Securities and Exchange Commission, theNational Association of Securities Dealers, the New York Stock Exchange, theNew York Attorney General, and the North American Securities AdministratorsAssociation (on behalf of state securities regulators) announced an agreement inprinciple with ten investment banks to resolve investigations relating to researchanalyst independence. Deutsche Bank Securities Inc. (“DBSI”), the U.S. SEC-registered broker-dealer subsidiary of Deutsche Bank, was one of the ten invest-ment banks. Pursuant to the agreement in principle, and subject to finalizationand approval of the settlement by DBSI, the Securities and Exchange Commis-sion and state regulatory authorities, DBSI agrees, among other things (i) to pay¤ 48 million, of which ¤ 24 million is a civil penalty and ¤ 24 million is for restitu-tion for investors, (ii) to adopt internal structural and operational reforms that willfurther augment the steps it has already taken to ensure research analyst inde-pendence and promote investor confidence, (iii) to contribute ¤ 24 million
194

Consolidated Financial Statements
spread over five years to provide third-party research to clients, (iv) to contribute¤ 5 million towards investor education, and (v) to adopt restrictions on the allo-cation of shares in initial public offerings to corporate executives and directors.
[34] Terrorist Attacks in the United States
As a result of the terrorist attacks in the United States on September 11, 2001, theGroup’s office buildings located at 130 Liberty Street and 4 Albany Street in NewYork were damaged. The Group’s employees located at these office buildings, inaddition to employees located in leased properties at 4 World Trade Center and14–16 Wall Street were relocated to contingency premises. The Group is evaluating the future plans for the buildings located at 130 LibertyStreet and 4 Albany Street, both of which were severely damaged due to thedestruction of the World Trade Center. The leased property and all lease-hold improvements at 4 World Trade Center were destroyed. Employees have re-occupied the premises at 14–16 Wall Street.Costs incurred by the Group as a result of the terrorist attacks include, but arenot limited to, write-offs of fixed assets, expenses incurred to replace fixedassets that were damaged and relocation expenses. The Group also continues toevaluate the costs that it may incur in the future to resolve the damage to itsbuildings adjacent to the World Trade Center site. The Group has and will con-tinue to make claims for its costs related to the terrorist attacks, including thoserelated to business interruption, through its insurance policies. These policieshave coverage limits of U.S.$ 1.7 billion in total damages and a U.S.$ 750 millionsub-limit for business interruption, service interruption and extra expenses. As ofDecember 31, 2002, the Group has received advance payments on its insurancerecoveries of approximately U.S.$ 232 million, which were applied against previously established receivables, and a commitment for additional advancepayments of U.S.$ 50 million. The Group believes that it will recover substantially all of its costs under its insur-ance policies, but there can be no assurance that all of the costs incurred, lossesfrom business interruption, losses from service interruption or extra expenseswill be paid by the insurance carriers, as they may dispute portions of theGroup’s claims. For the years ended December 31, 2002 and 2001, no losseshave been recorded by the Group.
195

Risk Report
The wide variety of our businesses requires us to identify, measure, aggregateand manage our risks effectively, and to allocate our capital among our busi-nesses appropriately. We manage risk through a framework of risk principles,organizational structures and risk measurement and monitoring processes thatare closely aligned with the activities of our Group Divisions.
Risk Management Principles
The following key principles underpin our approach to risk management:– Our Board of Managing Directors provides overall risk management supervi-
sion for our consolidated Group as a whole. Our Supervisory Board regularlymonitors our risk profile.
– Our Group Risk Committee has responsibility for management and control ofour risks.
– We manage credit, market, liquidity, operational and business risks in a coor-dinated manner at all relevant levels within our organization.
– The structure of our global risk management department is closely alignedwith the structure of our Group Divisions.
– The risk management function is independent of our Group Divisions.
Risk Management Organization
Our Group Chief Risk Officer, who is a member of our Board of Managing Direc-tors, is responsible for all risk management activities within our consolidatedGroup. The Group Chief Risk Officer chairs our Group Risk Committee. Each ofour Group Divisions has a divisional Chief Risk Officer, who sits on the GroupRisk Committee and reports directly to the Group Chief Risk Officer. The GroupRisk Committee has the mandate to:– Define our risk appetite in a manner that is consistent with our overall business
strategies;– Approve risk policies, procedures and methodologies that are consistent with
our risk appetite;– Manage the portfolio of risks throughout our organization; – Develop and implement a Group-wide applicable methodology for the meas-
urement of Risk Adjusted Return on Economic Capital; and – Approve the organizational structure of our risk management department and
appoint its key management personnel.
196

Risk Report
The Group Risk Committee has delegated some of its tasks to sub-committees,the most relevant being the Group Credit Policy Committee. Among others itreviews credit policies, industry reports and country risk limit applicationsthroughout the Group.For each of our Group Divisions, we then have a divisional risk unit which reportsto the divisional Chief Risk Officer. Each divisional risk unit has the mandate to: – Ensure that the business conducted within its division is consistent with the
risk appetite the Group Risk Committee has set;– Formulate and implement risk policies, procedures and methodologies that
are appropriate to the businesses within its division; – Approve credit risk and market risk limits; – Conduct periodic portfolio reviews to ensure that the portfolio of risks is
within acceptable parameters; and – Develop and implement risk management infrastructures and systems that
are appropriate for its division.
Our controlling, audit and legal departments support our risk management func-tion. They operate independently both of the Group Divisions and of the riskmanagement department. The role of the controlling department is to quantifythe risk we assume and ensure the quality and integrity of our risk-related data.Our audit department reviews the compliance of our internal control procedureswith internal and regulatory standards. Our legal department provides legaladvice and support on topics including collateral arrangements and netting.
Categories of Risk
The most important risks we assume are specific banking risks and risks arisingfrom the general business environment.
Our risk management processes distinguish among four kinds of specific bank-ing risks: credit risk, market risk, liquidity risk and operational risk.
Credit risk arises from all transactions that give rise to actual, contingent orpotential claims against any counterparty, obligor or borrower (which we refer tocollectively as “counterparties”). This is the largest single risk we face. We distinguish among three kinds of credit risk:– Default risk is the risk that counterparties fail to meet contractual payment
obligations.– Country risk is the risk that we may suffer a loss, in any given country, due
to the following reasons: political and social upheaval, nationalization and expropriation of assets, government repudiation of external indebtedness,exchange controls and currency depreciation or devaluation.
– Settlement risk is the risk that the settlement or clearance of transactions willfail. It arises whenever the exchange of cash, securities and/or other assets isnot simultaneous.
Specific BankingRisks
197

Insurance SpecificRisks
Market risk arises from the uncertainty concerning changes in market pricesand rates (including interest rates, equity prices, foreign exchange rates andcommodity prices), the correlations among them and their levels of volatility.
Liquidity risk is the risk to our earnings and capital arising from our potentialinability to meet obligations when they are due without incurring unacceptablelosses.
Operational risk is the potential for incurring losses in relation to employees,project management, contractual specifications and documentation, technol-ogy, infrastructure failure and disasters, external influences and customer rela-tionships. This definition includes, among others, legal and regulatory risk,which is based on recent regulatory discussion concerning operational risk.
General business risk describes the risk we assume due to potential changes ingeneral business conditions, such as our market environment, client behaviorand technological progress. This can affect our earnings if we fail to quicklyadjust to these changing conditions.
Following the sale of Deutscher Herold insurance companies to Zurich FinancialServices Group, we are not engaged in any activities which result in insurance-specific risks that are material to the Group.
198
General Business Risk

Risk Report
Risk Management Tools
We use a comprehensive range of quantitative tools and metrics for monitoringand managing risks. Some of these tools are common to a number of risk cate-gories, while others are tailored to the particular features of specific risk cate-gories. These quantitative tools and metrics generate the following types ofinformation: – Information that quantifies the susceptibility of the market value of single
positions or portfolios to changes in market parameters (commonly referredto as sensitivity analysis);
– Information that measures aggregate risk using statistical techniques, takinginto account the interdependencies and correlations between individual risks;and
– Information that quantifies exposures to losses that could arise from extrememovements in market prices or rates, using scenario analysis to simulate cri-sis situations.
– We also calculate risk data for regulatory purposes.
As a matter of policy, we continuously assess the appropriateness and the relia-bility of our quantitative tools and metrics in the light of our changing risk envi-ronment. The following are the most important quantitative tools and metrics wecurrently use to measure, manage and report our risk:
We use expected loss as a measure of the default and cross border transfer riskparts of our credit risk. Expected loss is a measurement of the default loss wecan expect within a one-year period on our credit exposure, based on our histor-ical loss experience. When calculating expected loss, we take collateral, maturi-ties and statistical averaging procedures into account to reflect the risk charac-teristics of our different types of exposures and facilities. All parameter assump-tions are based on long-term statistical averages of our internal default and losshistory as well as external benchmarks.We use expected loss as a tool of our risk management process and as part ofour management reporting systems. We also use the applicable results of theexpected loss calculations when establishing the other inherent loss allowanceincluded in our financial statements. Applicable results in this context are thosewhich are used to estimate losses inherent in loans and contingent liabilities thatare not already considered in the specific loss component of our allowance orour allowance for smaller-balance standardized homogeneous loans.
We rely on our book capital to absorb any losses that result from the risks weassume in our businesses. Book capital is defined as the amount of equity capi-tal that appears in our balance sheet. We use economic capital as our primarytool to allocate our book capital among our businesses. We also use it to assesstheir profitability and their relative abilities to employ capital efficiently. Eco-nomic capital is a measure designed to state with a high degree of certainty theamount of equity capital we need at any given date to absorb unexpected lossesarising from our exposures on that date. We use it to show an aggregated viewof our risk position from individual business lines up to our consolidated Grouplevel.
199
Expected Loss
Economic Capital

We calculate economic capital for the default risk, cross border transfer risk andsettlement risk elements of credit risk, for market risk, for operational risk and forgeneral business risk. We calculate the economic capital requirement for ourcredit exposures as the amount we would need to protect ourselves against verysevere losses caused by defaults.“Very severe”means a 0.02% probability that ouraggregated losses within one year will exceed our economic capital for that year.
We use the value-at-risk approach to derive quantitative measures for our trad-ing book market risks under normal market conditions. Our value-at-risk (or VaR)figures play a role in both internal and external (regulatory) reporting. For a givenportfolio, value-at-risk measures the potential future loss (in terms of marketvalue) which, under normal market conditions, will not be exceeded with adefined confidence level in a defined period. The value-at-risk for a total portfoliorepresents a measure of our aggregated market risk (aggregated using pre-determined correlations) in that portfolio.
We supplement our analysis of market risk with stress testing. We performstress tests because value-at-risk calculations are based on relatively recent his-torical data and only purport to estimate risk up to a defined confidence level.Therefore, they only reflect possible losses under relatively normal market condi-tions. Stress tests help us determine the effects of potentially extreme marketdevelopments on the market values of our assets. We use stress testing to deter-mine the amount of economic capital we need to allocate to cover our marketrisk exposure under extreme market conditions.
German banking regulations assess our capacity to assume risk in several ways:
Risk Position. Risk-weighted assets relating, in particular, to default risks, andthe equivalent for our market risk position (interest rate, exchange rate, shareprice and commodity price risks). Our regulators permit us to use our internalvalue-at-risk approach to calculate the market risk position as a component ofrisk positions.
Capital. The Total capital which can be used to back the risk position and is recognized for bank regulatory purposes consists of core capital (Tier I), supplementary (Tier II) and Tier III capital.
200
Value-at-Risk
Stress Testing
Regulatory RiskReporting
Risk Report
Credit Risk
Credit risk makes up the largest part of our risk exposures. We manage our creditrisk following these principles: – Every extension of credit to any counterparty requires approval at the appro-
priate seniority level. – All of our Group Divisions must apply consistent standards in arriving at their
credit decisions. – The approval of credit limits for counterparties and the management of our
individual credit exposures must fit within our portfolio guidelines and ourcredit strategies, and each decision is also based on a risk-versus-returnanalysis.
– Every material change to a credit facility (such as of its tenor, collateral struc-ture or major covenants) requires approval at the appropriate level.
– We assign credit approval authorities to individuals according to their qualifi-cations, experience and training, and we review these periodically.
– We measure and consolidate all our credit exposures to each obligor on aglobal, consolidated basis that applies across our consolidated Group. Wedefine an “obligor” as a group of individual borrowers or counterparties thatare linked to one another by any of a number of criteria we have established,including capital ownership, voting rights, demonstrable control, other indica-tion of group affiliation; or are jointly and severally liable for all or significantportions of the credit we have extended.
A primary element of the credit approval process is a detailed risk assessment ofevery credit exposure associated with an obligor. Our risk assessment proce-dures consider both the creditworthiness of the counterparty (which results in acounterparty rating) and the risks related to the specific type of credit facility orexposure. This risk assessment not only affects the outcome of the credit deci-sion, but also influences the level of decision-making authority we require toextend the credit, the terms and conditions of the transaction and the monitor-ing procedures we apply to the ongoing exposure. We have our own in-house assessment methodologies, scorecards and ratingscale for evaluating our client groupings. Before 2002, our in-house classifica-tions required a mapping to convert from several 10-grade rating scales into oneconsistent metric. In 2002, we moved the counterparty ratings for our corporatecredit exposure from several 10-grade rating scales to a single, more granular,26-grade rating scale, eliminating the need for mapping when aggregating ourexposures across regions and product categories for reporting purposes. Thisenables us to harmonize our internal rating scale with common market practiceand improve comparability between different sub-portfolios of our institution.When we assign our internal risk ratings, we compare them with external riskratings assigned to our counterparties by the major international rating agencies,where possible. We calibrated the new 26-grade rating scale on a probability of default measurewhich is based on a statistical analysis of historical defaults in our portfolio. Weexpress these measures as a percentage probability that a counterparty willdefault on our exposure to it. We then assign these probability of default calcu-lations into categories that we regard, for our purposes, as fundamentally equiv-alent to those of the major international rating agencies.
201
Credit Risk Ratings

Credit limits set forth maximum credit exposures we are willing to assume overspecified periods. They relate to products, conditions of the exposure and otherfactors. Our credit policies also establish special procedures (including lowerapproval thresholds and more senior approval personnel) for exceptional caseswhen we may assume exposures beyond established limits. These exceptions provide a degree of flexibility for unusual business opportuni-ties, new market trends and other similar factors.
In making credit decisions, we measure and consolidate globally all exposuresand facilities to the same obligor that carry credit risk. This includes loans, repur-chase agreements, reverse repurchase agreements, letters of credit, guaranteesand derivative transactions. Unless prohibited by regulations we exclude expo-sures that, in our opinion, do not expose us to any significant default risk. Inaddition, we typically exclude exposures relating to other categories of risk, suchas market risk. These risks are subject to scrutiny under their own individualpolicies. For approval purposes, we do not distinguish between committed anduncommitted or advised and unadvised facilities. We treat any prolongation ofan existing credit exposure as a new credit decision requiring the appropriateprocedures and approvals. A credit analysis forms the basis of every credit decision we make. This analysispresents and assesses the material information for a decision regarding a creditexposure and generates a report. We generally update our credit reports annu-ally and require credit reports for all initial credit approvals and for subsequentinternal reviews. These reports must contain the following: an overview of ourrelevant limits and exposures, a summary of our internal rating history of thecounterparty, an overview of the particular facilities, key financial data, a shortdescription of the reason for the report’s submission and a summary credit riskassessment.
We monitor all of our credit exposures on a continuing basis using the risk man-agement tools described above. We also have procedures in place to identify atan early stage credit exposures for which there may be an increased risk of loss.Accountability for recognition of problem credits rests with the relationshipmanager in conjunction with the appropriate credit officer. We believe that cus-tomers where problems could arise must be identified well in advance to effec-tively manage the credit exposure. The objective of an early warning system is toaddress potential problems while adequate alternatives for action are still avail-able. This early detection is a tenet of our credit culture and is intended to ensurethat greater attention is paid to such an exposure.
202
Credit Limits
Exposure Measure-ment for ApprovalPurposes
Monitoring DefaultRisk

Risk Report
In instances where we have identified customers where problems might arise,the respective exposure is placed on a watchlist. Additionally, we refer therelated exposures to a special loan management team. Within our consumercredit exposure, as described below, the delinquency status is tracked which isthe main basis for the transfer to a special loan management team. The functionof this group is to effectively manage problem exposures by taking prompt cor-rective action to ensure asset values are preserved and losses are minimized.The special loan management team performs this function either through con-sultation with the credit unit or direct management of an exposure.
We define our total credit risk exposures as all transactions where losses mightoccur due to the fact that counterparties may not fulfill their contractual paymentobligations. We calculate the gross amount of the exposure without taking intoaccount any collateral, other credit enhancement or credit protection transac-tions. When we describe our credit risk exposure, we distinguish between thefollowing categories: loans, tradable assets, over-the-counter derivatives andcontingent liabilities. Listed below are some further details concerning our creditrisk exposure categories:– “Loans“ exclude interest-earning deposits with banks, other claims (mostly
unsettled balances from securities transactions) and accrued interest.– “Tradable assets“, as defined for this purpose, include bonds, other fixed-
income products and traded loans. – “OTC derivatives“ are our credit exposures arising from over-the-counter, or
OTC, derivative transactions. Credit exposure in OTC derivatives is measuredby the cost to replace the contract if the counterparty defaults on its obliga-tions. The costs of replacement amount to only a small portion of the notionalamount of a derivative transaction. We calculate our credit exposure underOTC derivatives transactions at any time as the replacement costs of thetransactions based on marking them to market at that time.
– “Contingent liabilities“ include liabilities from guarantees (excluding marketvalue guarantees) and indemnity agreements. They exclude letters of credit,other obligations such as irrevocable loan commitments and placement andunderwriting commitments. These exclusions were ¤ 107.8 billion on Decem-ber 31, 2002 and ¤ 126.1billion on December 31, 2001. We also excluded otherquantifiable indemnities and commitments of ¤ 49.9 billion, which predomi-nantly relate to securities lending on behalf of customers. In 2002, more than77% of our irrevocable commitments were to counterparties rated at theequivalent of investment grade debt ratings from the major international rating agencies.
Our total credit exposure can be classified under two broad headings: corporatecredit exposure and consumer credit exposure. – Our consumer credit exposure consists of our smaller-balance standardized
homogeneous loans which include personal loans, residential and nonresi-dential mortgage loans, overdrafts and loans to self-employed and small busi-ness customers of our private and retail business.
– Our corporate credit exposure consists of all remaining exposures not definedas consumer credit exposure. Corporate credit exposure is the largest creditexposure and is discussed below in more detail.
203
Credit Risk Exposure

The following table breaks down our corporate credit exposure (other than creditexposure arising from repurchase and reverse repurchase agreements, securi-ties lending and borrowing, interest-earning deposits with banks and irrevocableloan commitments) according to the creditworthiness categories of our counter-parties:
The above table illustrates not only a general reduction in our corporate expo-sures (including the effects of the deconsolidation of our EUROHYPO mortgagebusiness, which caused loan volume decreases in all rating bands, including the sub-investment grade categories) but also reflects a change in the distribution ofcreditworthiness in our corporate loan portfolio, which can be attributed to twomain factors:First, the change in our corporate credit exposure in 2002 compared to 2001 is aconsequence of a general deterioration of creditworthiness in our loan portfolioas is evidenced by the increasing proportion of lower rated loans. During thecourse of 2002, the observable general trend has been downgrades rather thanupgrades in both our international and domestic lending portfolios. Most specif-ically, the general trend has been a downwards migration of loans rated BBB andbelow. This downgrading is partially a reflection of the difficulties that persist inthe global economic climate faced by us and our counterparties and is also evi-dence of a general downturn that is being experienced within the banking indus-try. Despite this general downgrading, the overall quality of the loan portfolioremains sound.Second, as described above in “Credit Risk Ratings”, we have recently harmo-nized our internal rating system for our counterparties by recalibrating it to oneglobal scale. This new calibration, which is part of our initiative to comply withupcoming Basel II requirements as well as improving our internal economic cap-ital allocation, has a stronger focus on global comparability and benchmarkingagainst external ratings. In order to make the 2002 and 2001 figures comparable,we have restated the 2001 figures, on an estimated basis, reflecting the new cal-ibration of our internal risk rating system by applying more refined mappingswhen aggregating individual exposures previously rated on different 10-gradescales. For EUROHYPO, which was deconsolidated in 2002, the rating restate-ment for 2001 resulted in a net reduction in exposures rated BBB and better andnet increases in the categories below. For our 2001 loan exposures excludingEUROHYPO the restatement of 2001 figures resulted in net increases at both theupper and the lower end of our creditworthiness categories.
204
Corporate CreditExposure
Loans Tradable OTC Derivatives Contingent TotalAssets Liabilities
Dec 31, Dec 31, Dec 31, Dec 31, Dec 31, Dec 31, Dec 31, Dec 31, Dec 31, Dec 31,in ¤ m. 2002 2001 2002 2001 2002 2001 2002 2001 2002 2001
AAA-AA 11,043 32,022 120,732 115,196 22,977 27,878 2,423 7,131 157,175 182,227
A 16,610 21,242 24,949 42,841 20,281 13,447 5,557 5,291 67,397 82,821
BBB 30,549 61,956 27,115 23,735 10,745 12,166 9,370 10,519 77,779 108,376
BB 37,269 71,804 17,426 9,598 5,528 2,962 8,195 9,658 68,418 94,022
B 11,590 18,424 3,701 8,261 640 370 3,063 2,753 18,994 29,808
CCC and below 9,611 6,573 2,658 2,541 124 140 1,096 1,304 13,489 10,558
Total 116,672 212,021 196,581 202,172 60,295 56,963 29,704 36,656 403,252 507,812

Risk Report
The restatement of our 2001 creditworthiness categories did not alter theamount of problem loans or otherwise classified exposures. In particular, thelevel of specific loan loss allowances reported in our 2001 financials is notaffected as it was established based on an individual review of each credit. Like-wise, our inherent loss allowance is not impacted.
Our consumer credit exposure consists of our smaller-balance standardizedhomogeneous loans primarily in Germany, Italy and Spain which include personal loans, residential and nonresidential mortgage loans, overdrafts andloans to self-employed and small business customers of our private and retailbusiness. This portfolio collectively represents a large number of individualsmaller-balance loans to consumers and small businesses. We allocate this port-folio into various sub-portfolios according to our major product categories andgeographical dispersion. The table below presents consumer loan delinquencies in terms of loans that are90 days or more past due and net credit costs, which are the net provisionscharged during the period, after recoveries. Loans deemed to be 90 days ormore past due and net credit costs are both expressed as a percentage of total exposure:
The volume of our consumer credit exposure rose by ¤ 1.5 billion, or 2.9%, from2001 to 2002, driven mainly by our German and Italian business. Total net creditcosts remained materially unchanged as increases in German consumer financ-ing were offset by improvements in German mortgage lending and other Euro-pean business. Loans delinquent by 90 days or more decreased from 2.48% to2.43%, reflecting decreases in Germany partly offset by increases in Italy.
205
Consumer CreditExposure
Total Exposure 90 Days or More Past Due Net Credit Costsin ¤ m. in % of Total Exposure in % of Total Exposure
Dec 31, Dec 31, Dec 31, Dec 31, Dec 31, Dec 31,2002 2001 2002 2001 2002 2001
Consumer Credit Exposure Germany
Consumer and Small Business Financing 11,326 11,463 1.91 1.95 0.75 0.66
Mortgage Lending 33,610 32,952 2.10 2.27 0.09 0.11
Consumer Credit Exposure Other Europe 10,012 8,987 4.14 3.88 0.59 0.73
Total Consumer Credit Exposure 54,948 53,402 2.43 2.48 0.32 0.33

Our total credit exposures were ¤ 600.7 billion on December 31, 2002 and¤ 737.6 billion on December 31, 2001. These figures include the exposures shownin the table below, as well as credit exposures arising from repurchase andreverse repurchase agreements, securities lending and borrowing, interest-earn-ing deposits with banks and irrevocable loan commitments. The following table breaks down our total credit exposure (other than creditexposure arising from repurchase and reverse repurchase agreements, securi-ties lending and borrowing, interest-earning deposits with banks and irrevocableloan commitments) according to the industrial sectors of our counterparties:
The exposure to Households, as shown in the table above, primarily reflects ourconsumer credit exposure. For 2001, certain loan exposures were reclassifiedfrom Banks and insurance to Other (¤ 6.5 billion) and from Commercial realestate activities to Households (¤ 2.8 billion).The reclassification of our 2001 credit risk profile by industry sector did not alterthe amount of problem loans or otherwise classified exposures. In particular, thelevel of specific loan loss allowances reported in our 2001 financials is notaffected as it was established based on an individual review of each credit.
206
Total Credit Exposure
Loans Tradable OTC Derivatives Contingent TotalAssets Liabilities
Dec 31, Dec 31, Dec 31, Dec 31, Dec 31, Dec 31, Dec 31, Dec 31, Dec 31, Dec 31,in ¤ m. 2002 2001 2002 2001 2002 2001 2002 2001 2002 2001
Banks and insurance 10,720 19,909 47,686 62,512 44,970 44,377 5,892 8,091 109,268 134,889
Manufacturing 22,545 32,102 17,142 13,917 2,389 4,903 9,598 12,705 51,674 63,627
Households 53,207 63,168 – – 281 318 392 477 53,880 63,963
Public sector 4,584 23,658 95,356 91,578 1,792 1,576 232 240 101,964 117,052
Wholesale andretail trade 14,467 15,759 2,583 2,503 688 671 1,989 2,906 19,727 21,839
Commercial realestate activities 18,360 35,617 2,657 3,138 688 230 978 983 22,683 39,968
Other 47,7371 75,2101 31,157 28,524 9,487 4,888 10,623 11,254 99,004 119,876
Total 171,620 265,423 196,581 202,172 60,295 56,963 29,704 36,656 458,200 561,214
1 Includes lease financing and a deduction for unearned income.

Risk Report
The following table breaks down our total credit exposure (other than creditexposure arising from repurchase and reverse repurchase agreements, securi-ties lending and borrowing, interest-earning deposits with banks and irrevocableloan commitments) by geographical region. For this table, we have allocatedexposures to regions based on the domicile of our counterparties, irrespective ofany affiliations the counterparties may have with corporate groups domiciledelsewhere:
207
Loans Tradable OTC Derivatives Contingent TotalAssets Liabilities
Dec 31, Dec 31, Dec 31, Dec 31, Dec 31, Dec 31, Dec 31, Dec 31, Dec 31, Dec 31,in ¤ m. 2002 2001 2002 2001 2002 2001 2002 2001 2002 2001
Eastern Europe 1,679 2,334 4,186 1,659 678 762 483 573 7,026 5,328
Western Europe 133,732 205,981 76,971 93,233 35,094 30,956 21,089 26,065 266,886 356,235
Africa 618 324 951 993 451 669 23 266 2,043 2,252
Asia-Pacific 8,517 13,035 30,493 29,315 4,515 6,143 2,403 3,077 45,928 51,570
North America 24,643 39,817 78,464 70,967 17,698 17,236 5,450 6,150 126,255 134,170
Central andSouth America 2,373 3,884 2,984 4,177 597 1,080 249 516 6,203 9,657
Other1 58 48 2,532 1,828 1,262 117 7 9 3,859 2,002
Total 171,620 265,423 196,581 202,172 60,295 56,963 29,704 36,656 458,200 561,214
1 Includes supranational organizations and other exposures that we have not allocated to a single region.
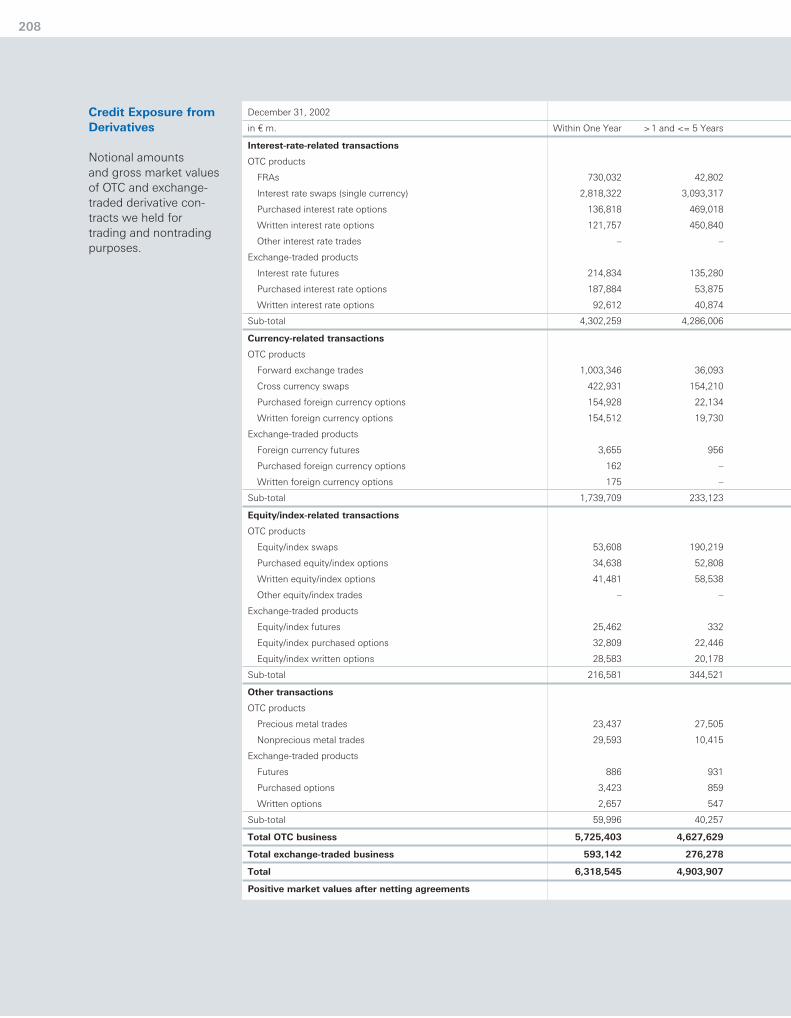
208
December 31, 2002
in ¤ m. Within One Year >1 and <= 5 Years
Interest-rate-related transactions
OTC products
FRAs 730,032 42,802
Interest rate swaps (single currency) 2,818,322 3,093,317
Purchased interest rate options 136,818 469,018
Written interest rate options 121,757 450,840
Other interest rate trades – –
Exchange-traded products
Interest rate futures 214,834 135,280
Purchased interest rate options 187,884 53,875
Written interest rate options 92,612 40,874
Sub-total 4,302,259 4,286,006
Currency-related transactions
OTC products
Forward exchange trades 1,003,346 36,093
Cross currency swaps 422,931 154,210
Purchased foreign currency options 154,928 22,134
Written foreign currency options 154,512 19,730
Exchange-traded products
Foreign currency futures 3,655 956
Purchased foreign currency options 162 –
Written foreign currency options 175 –
Sub-total 1,739,709 233,123
Equity/index-related transactions
OTC products
Equity/index swaps 53,608 190,219
Purchased equity/index options 34,638 52,808
Written equity/index options 41,481 58,538
Other equity/index trades – –
Exchange-traded products
Equity/index futures 25,462 332
Equity/index purchased options 32,809 22,446
Equity/index written options 28,583 20,178
Sub-total 216,581 344,521
Other transactions
OTC products
Precious metal trades 23,437 27,505
Nonprecious metal trades 29,593 10,415
Exchange-traded products
Futures 886 931
Purchased options 3,423 859
Written options 2,657 547
Sub-total 59,996 40,257
Total OTC business 5,725,403 4,627,629
Total exchange-traded business 593,142 276,278
Total 6,318,545 4,903,907
Positive market values after netting agreements
Credit Exposure fromDerivatives
Notional amounts and gross market valuesof OTC and exchange-traded derivative con-tracts we held for trading and nontradingpurposes.

Risk Report 209
Notional Amount Maturity Distribution Positive Market Value Negative Market Value Net Market Value
After Five Years Total
830 773,664 417 (552) (135)
2,517,510 8,429,149 213,557 (207,536) 6,021
344,924 950,760 27,188 – 27,188
366,192 938,789 – (26,866) (26,866)
– – – – –
1,593 351,707 – (247) (247)
– 241,759 182 – 182
– 133,486 – (67) (67)
3,231,049 11,819,314 241,344 (235,268) 6,076
1,176 1,040,615 19,535 (19,889) (354)
106,788 683,929 18,064 (21,711) (3,647)
1,156 178,218 5,124 – 5,124
664 174,906 – (4,798) (4,798)
– 4,611 – – –
– 162 14 – 14
– 175 – (24) (24)
109,784 2,082,616 42,737 (46,422) (3,685)
51,143 294,970 9,037 (9,971) (934)
13,017 100,463 13,352 – 13,352
10,215 110,234 – (12,857) (12,857)
– – – – –
– 25,794 218 (69) 149
– 55,255 5,112 – 5,112
342 49,103 – (4,471) (4,471)
74,717 635,819 27,719 (27,368) 351
6,532 57,474 2,602 (1,782) 820
260 40,268 5,401 (4,844) 557
108 1,925 – – –
24 4,306 167 – 167
– 3,204 – (122) (122)
6,924 107,177 8,170 (6,748) 1,422
3,420,407 13,773,439 314,277 (310,806) 3,471
2,067 871,487 5,693 (5,000) 693
3,422,474 14,644,926 319,970 (315,806) 4,164
65,985

To reduce our derivatives-related credit risk, we regularly seek the execution ofmaster agreements (such as the International Swap Dealers Association (ISDA)contract for swaps) with our clients. A master agreement allows the offsetting ofthe obligations arising under all of the derivatives contracts the agreement cov-ers, resulting in one single net claim against the counterparty (called “close-outnetting”). In addition, we also enter into “payment netting” agreements underwhich we net non-simultaneous settlement of cash flows, reducing our principalrisk. We frequently enter into these agreements in our foreign exchange busi-ness.For internal credit exposure measurement purposes, we only apply netting whenwe believe it is legally enforceable for the relevant jurisdiction and counterparty.Similarly, we enter into collateral support agreements only when we believe thatthe risk situation justifies doing so. These collateral arrangements generally pro-vide risk mitigation through periodic (usually daily) margining of the coveredportfolio or transactions and termination of the master agreement if the counter-party fails to honor a collateral call. As with netting, when we believe the collat-eral is enforceable we reflect this in our exposure measurement. As the replacement values of our portfolios fluctuate with movements in marketrates and with changes in the transactions in the portfolios, we also estimate thepotential future replacement costs of the portfolios over their lifetimes or, in caseof collateralized portfolios, over appropriate unwind periods. We measure ourpotential future exposure against separate limits, which can be a multiple of thecredit limit. We supplement our potential future exposure analysis with stresstests to estimate the immediate impact of market events on our exposures (suchas event risk in our emerging markets portfolio). Trading activities in credit derivatives led to positive market values of ¤ 2.2 billionafter netting as of December 31, 2002. Credit derivatives are included in the tableabove; they are predominantly assigned to equity/index-related transactions.Outside the trading activities, derivative transactions are also used to managecredit risks in the banking book. Included in the table above are non-exchange traded commodity contracts thatare accounted for at fair value. The majority of these contracts mature in lessthan five years and are valued based on actively quoted prices.
Treatment of Default Situations Under Derivatives. Unlike in the case ofour standard loan assets, we generally have more options to manage the creditrisk in our OTC derivatives when movement in the current replacement costs ofthe transactions and the behavior of our counterparty indicate that there is therisk that upcoming payment obligations under the transactions might not behonored. In these situations, we frequently are able to obtain additional collateralor terminate the transactions or the related master agreement.When our decision to terminate transactions or the related master agreementresults in a residual net obligation of the counterparty, we restructure the obliga-tion into a nonderivative claim and manage it through our regular workoutprocess. As a consequence, we do not show any nonperforming derivatives.
210

Risk Report
Country Risk
We manage country risk through a number of risk measures and limits, the mostimportant being:
Total Country Credit Exposure. We set limits on our aggregate credit expo-sure to counterparties which we view as being at risk if economic or politicalevents occur, and which could lead to widespread credit defaults in a particularcountry (a “country risk event”). We include all credit extended to counterparties domiciled in that country(including unguaranteed subsidiaries of foreign entities). We also include creditextended to offshore subsidiaries of those local clients.
Cross Border Transfer Risk. Arises where we extend credit from one of ouroffices in one country to a counterparty in a different country. We define thetransfer risk component of such credit risk as arising where an otherwise solventand willing debtor is unable to meet its obligations due to the imposition of gov-ernmental or regulatory controls restricting its ability either to obtain foreignexchange or to transfer assets to nonresidents (a “transfer risk event”). – For internal risk management purposes, cross border transfer risk includes
credit we have extended to our own international branches and subsidiaries,although for this disclosure we have not included these transactions.
– In 2002 we modified the basis for establishing limits to monitor cross bordertransfer risk. We now capture this based on full notional value (previously seton a “money-at-risk” basis). We believe this provides a more accurate meas-ure of exposure to a given country.
Highly-Stressed Event Risk Scenarios (“ERS”). We use stress testing tomeasure potential market risk on our trading positions and view these as marketrisks.
Our country risk ratings represent a key tool in our management of country risk.Our ratings include:– Country Credit Risk Rating. An estimate of the probability of occurrence of a
country risk event. – Cross Border Transfer Risk Rating. An estimate of the probability of a trans-
fer risk event (usually as part of a country risk event).– Event Risk Rating. For further details see “Market Risk” below.
Our ratings are established by an independent country risk research functionwithin our Credit Risk Management division. All country credit risk and cross border transfer risk ratings are reviewed, andrevised or reaffirmed, at least annually by the Group Credit Policy Committee.Our country risk research group also reviews, at least quarterly, our ratings forthe major emerging market countries in which we conduct business. Ratings forcountries which we view as particularly volatile, as well as all ERS ratings, aresubject to continuous review.We also regularly compare our internal risk ratings with the ratings of the majorinternational rating agencies.
211
Country Risk Ratings

We manage our exposure to country risk through a framework of limits. We setcountry limits for all Emerging Markets countries as defined below. They includelimits on total country credit exposure, cross border transfer risk, and ERS risk.Limits are reviewed at least annually, in conjunction with the review of countryrisk ratings. Country limits are set by either our Board of Managing Directors orby our Group Credit Policy Committee, pursuant to delegated authority.
We charge our Group Divisions with the responsibility of managing their countryrisk within the approved limits. The regional units within Credit Risk Manage-ment monitor our country risk based on information provided by our controllingfunction. Our Group Credit Policy Committee also reviews data on cross bordertransfer risk. Since 1998 the Bank has actively been reducing its exposure to Emerging Mar-kets countries. For this purpose, we define Emerging Markets as including allcountries in Latin America (including the Caribbean), Asia (excluding Japan),Eastern Europe, the Middle East and Africa. In connection with this strategy, ourCredit Risk Management department focuses particularly on our total countrycredit exposure to Emerging Markets countries and regularly provides reports toour Group Credit Policy Committee.
The following charts show the development of total Emerging Markets countrycredit exposure, and utilized Emerging Markets cross border transfer risk expo-sure by region:
On December 31, 2002, of our ¤ 8.1 billion total cross border transfer risk expo-sure to Emerging Markets, only ¤ 6.4 billion represents utilized exposures, downfrom ¤ 7.6 billion on December 31, 2001 and ¤ 8.9 billion on December 31, 2000.
212
20002002 2001
0
1
2
3
Asia(excluding Japan)
LatinAmerica
EasternEurope
MiddleEast
Africa
Total Emerging Markets
Country Credit Exposure
in ¤ bn.TotalTotal excluding OTC derivatives
Emerging Markets Cross Border Transfer Risk Exposure by Region
in ¤ bn.200220012000
0
5
10
15
20
Country Risk Limits
Monitoring CountryRisk
Country Risk Exposure

Risk Report
Measuring our Default and Cross Border Transfer Risk Exposures
We measure our exposure to default and cross border transfer risk using anexpected loss criterion, and we maintain economic capital with respect to theexposures. We base our expected loss and economic capital calculations on thatpart of our total credit exposure that we feel is exposed to default and cross bor-der transfer risk. We exclude exposures that we treat as subject to risks otherthan default and cross border transfer risk (e.g., exposure for which we assigneconomic capital under market risk policies). The following table shows ourdefault and cross border transfer risk exposure, and expected loss and economiccapital, by Group Division, as we calculate it for expected loss and economiccapital purposes:
Credit Loss Experience and Allowance for Loan Losses
We establish an allowance for loan losses that represents our estimate of proba-ble losses in our loan portfolio. The responsibility for determining our allowancefor loan losses rests with credit risk management. The components of thisallowance are:
Specific Loss Component: Allowances we maintain to cover the default risk ofspecific exposures.
Inherent Loss Component: – Country Risk Allowance: Allowances we maintain to cover credit losses
inherent in our pool of cross border loans to borrowers located in certaincountries solely as a result of transfer and currency convertibility risks.
– Smaller-Balance Standardized Homogeneous Loan Loss Allowance:Allowances we maintain at a portfolio level to cover credit losses inherent inthese types of loans.
– Other Inherent Loss Allowance: Allowances we maintain as an estimate ofcredit losses which we have not otherwise identified.
213
December 31, 2002 Corporate and Private Clients Other1 TotalInvestment Bank and Asset Group
in ¤ m. Management
Loans 101,672 66,120 3,828 171,620
OTC derivatives 60,277 18 – 60,295
Contingent liabilities 27,590 1,492 622 29,704
Irrevocable loan commitments (including letters of credit) 103,146 4,186 465 107,797
Repurchase and reverse repurchase agreements and securities lending and borrowing 9,031 1 – 9,032
Interest-earning deposits with banks 19,356 223 6,112 25,691
Total credit exposure 321,072 72,040 11,027 404,139
Expected loss 1,063 241 12 1,316
Economic capital for default and cross border transfer risk 7,564 1,008 69 8,641
1 Primarily relates to the Corporate Investments Group Division.

The specific loss component relates to all loans deemed to be impaired, follow-ing an assessment of the counterparty’s ability to repay. A loan is considered tobe impaired when we determine that it is probable that we will be unable to col-lect all interest and principal due in accordance with the terms of the loan agree-ment. We determine the amount, if any, of the specific provision we shouldmake, taking into account the present value of expected future cash flows, thefair value of the underlying collateral or the market price of the loan.We regularly re-evaluate all credit exposures which have already been specifi-cally provided for, as well as all credit exposures that appear on our watchlist.
The inherent loss component relates to all other loans we do not individually pro-vide for, but which we believe to have some inherent loss on a portfolio basis.
Country Risk Allowance. We establish a country risk allowance for loan expo-sures in countries where we have serious doubts about the ability of our coun-terparties to comply with the repayment terms due to the economic or politicalsituation prevailing in the respective countries of domicile, that is, for transferand currency convertibility risks. We determine the percentage rates for ourcountry risk allowance on the basis of a comprehensive matrix that encom-passes both historical loss experience and market data, such as economic, polit-ical and other relevant factors affecting a country’s financial condition. In makingour decision, we focus primarily on the cross border transfer risk ratings that weassign to a country and the amount and type of collateral.
Smaller-Balance Standardized Homogeneous Loan Loss Allowance. Oursmaller-balance standardized homogeneous portfolio includes smaller-balancepersonal loans, residential and nonresidential mortgage loans, overdrafts andloans to self-employed and small business customers of our private and retailbusiness. These loans are evaluated for inherent loss on a collective basis, basedon analyses of historical loss experience from each product type according tocriteria such as past due status and collateral recovery values. The resultingallowance encompasses the loss inherent both in current and performing loans,as well as in delinquent and nonperforming loans within the homogeneous loanportfolio.
Other Inherent Loss Allowance. This component of the allowance representsan estimate of our inherent losses resulting from the imprecisions and uncer-tainties in determining credit losses. This estimate of inherent losses excludesthose exposures we have already considered in the specific loss component asdescribed above or considered when establishing our allowance for smaller-bal-ance standardized homogeneous loans. We have historically used a ratio of anentity’s historical average losses (net of recoveries) to the historical average of itsloan exposures, the result of which we applied to our corresponding period endloan exposures and adjusted the result for relevant environmental factors. As aconsequence of our improved risk management processes and capabilities, in2002 we refined the measure for calculating our other inherent loss allowance.This refinement was made in order to make the provision more sensitive to theprevailing credit environment and less based on historical loss experience. Thenew measurement incorporates the expected loss results which we generate aspart of our economic capital calculations outlined above. Therefore, the newmeasurement considers, among other factors, our internal rating informationwhich results in a better reflection of the current economic situation and conse-
214
Specific Loss Component
Inherent Loss Component

Risk Report
quently provides better guidance for losses inherent in the portfolio that havenot yet been individually identified.
We take charge-offs based on credit risk management’s assessment when wedetermine that the loans are uncollectable. We generally charge off a loan whenall economically sensible means of recovery have been exhausted. Our determi-nation considers information such as the occurrence of significant changes inthe borrower’s financial position such that the borrower can no longer pay theobligation, or that the proceeds from collateral will not be sufficient to pay theloan.Prior to 2001, our entities regulated outside the United States, which accountedfor approximately 87% of our net charge-offs in 2000, consistently charged offloans when all legal means of recovery had been exhausted. This practiceresulted in charge-offs occurring at a later date than for our entities regulated inthe United States. We began to develop a methodology in 2001 to bring our worldwide charge-offpractices more into line with industry practices in the United States and hadanticipated that the timing of our charge-offs would accelerate. In 2001, entitiesregulated outside the United States began to implement this change, whichresulted in a higher level of charge-offs relative to that which would haveoccurred under the prior practice.
Our problem loans are comprised of nonaccrual loans, loans 90 days or morepast due and still accruing and troubled debt restructurings.The following table presents the components of our 2002 and 2001 problemloans:
215
Charge-off Policy
Problem Loans
Dec 31, 2002 Dec 31, 2001
Impaired Nonperforming Total Impaired Nonperforming TotalLoans1 Homogeneous Loans1 Homogeneous
in ¤ bn. Loans Loans
Nonaccrual loans 8.5 1.6 10.1 10.0 1.5 11.5
Loans 90 days or more pastdue and still accruing 0.2 0.3 0.5 0.5 0.4 0.9
Troubled debt restructurings 0.2 – 0.2 0.3 – 0.3
Total problem loans 8.9 1.9 10.8 10.8 1.9 12.7
1 Loans for which we determine that it is probable that we will be unable to collect all principal and interest due according to the contractual terms of the loan agreements.

The decrease in our total problem loans in 2002 is due to ¤ 2.7 billion of grosscharge-offs, a ¤ 1.4 billion reduction due to the deconsolidation of various enti-ties and a ¤ 0.8 billion reduction as a result of exchange rate movements offsetby ¤ 3.0 billion of net new problem loans. Included in the ¤ 1.9 billion nonper-forming homogeneous loans, as of December 31, 2002, are ¤ 1.3 billion of loansthat are 90 days or more past due as well as ¤ 541 million of loans that are lessthan 90 days past due.The following table illustrates our total problem loans based on the domicile ofour counterparty (within or outside Germany) for the last five years. We have noother material interest-bearing assets that are nonperforming:
Nonaccrual Loans. We place a loan on nonaccrual status if either – the loan has been in default as to payment of principal or interest for 90 days
or more and the loan is neither well secured nor in the process of collection, or
– the loan is not yet 90 days past due, but in the judgment of management theaccrual of interest should be ceased before 90 days because it is probable thatwe will be unable to collect all principal and interest due according to the con-tractual terms of the loan agreement.
When a loan is placed on nonaccrual status, any accrued but unpaid interestpreviously recorded is reversed against current period interest revenue. Cashreceipts of interest on nonaccrual loans are recorded as either interest revenueor a reduction of principal according to management’s judgment as to collec-tability of principal.As of December 31, 2002 our nonaccrual loans totaled ¤ 10.1 billion, a netdecrease of ¤ 1.4 billion, or 12%, from 2001. The net decrease in nonaccrualloans is mainly due to charge-offs, deconsolidations and exposure reductions,partially offset by loans classified as nonaccrual for the first time.
216
Dec 31, Dec 31, Dec 31, Dec 31, Dec 31,in ¤ m. 2002 2001 2000 1999 1998
Nonaccrual loans
German 4,587 6,538 3,730 3,899 4,550
Non-German 5,511 4,990 2,824 2,104 1,024
Total nonaccrual loans 10,098 11,5281 6,554 6,003 5,574
Loans 90 days or more past dueand still accruing
German 439 658 1,028 985 1,028
Non-German 70 189 470 1,275 1,043
Total loans 90 days or more
past due and still accruing 509 847 1,498 2,260 2,071
Troubled debt restructurings
German 38 57 14 242 55
Non-German 154 222 141 154 144
Total troubled
debt restructurings 192 279 155 396 199
1 Total nonaccrual loans for 2001 includes approximately ¤ 3.4 billion of impaired loans that were classified as potential problem loans in 2000.

Risk Report
As of December 31, 2001 our nonaccrual loans totaled ¤ 11.5 billion, a netincrease of ¤ 4.9 billion, or 74 %, from 2000. We estimate that the impact of thepreviously disclosed change in our nonaccrual practice was approximately ¤ 3.4billion. ¤ 2.0 billion was due to additional nonaccruals in our U.S. entities, a fur-ther ¤ 745 million was due to our medium-sized corporate portfolio and realestate businesses in Germany, and ¤ 290 million was due to a deterioration inour smaller-balance homogeneous portfolio in Italy. These increases were par-tially offset by movements in other portfolios and net charge-offs.
Loans Ninety Days or More Past Due and Still Accruing. These are loans inwhich contractual interest or principal payments are 90 days or more past duebut on which we continue to recognize interest revenue. These loans are wellsecured and in the process of collection. In 2002, our 90 days or more past due and still accruing interest loans decreasedby ¤ 338 million, or 40% to ¤ 509 million. This decrease is mainly due to decon-solidations (¤ 217 million), the placing of loans on nonaccrual status and charge-offs.In 2001, our 90 days or more past due and still accruing interest loans decreasedby ¤ 651 million, or 44%, to ¤ 847 million, primarily reflecting the movement ofsome of our real estate portfolios in Germany (¤ 410 million) and the smaller-balance homogeneous portfolio in Italy (¤ 255 million) to nonaccrual status.
Troubled Debt Restructurings. Troubled debt restructurings are loans whichwe have restructured due to deterioration in the borrower’s financial position.We may restructure these loans in one or more of the following ways:– reducing the stated interest rate for the remaining portion of the original life of
the debt; – extending the maturity date (or dates) at an interest rate lower than the current
market rate for new debt with a similar risk profile; – reducing the face amount or maturity amount of the debt; and – reducing the accrued interest on the debt.
If a borrower performs satisfactorily for one year under a restructured loaninvolving a modification of terms, we no longer consider that borrower’s loan tobe a troubled debt restructuring, unless at the time of restructuring the newinterest rate was lower than the market rate for similar credit risks. These loansare not included in the reported troubled debt restructurings amounts. Our troubled debt restructurings totaled ¤ 192 million as of December 31, 2002,a decrease of 31% from 2001. The decrease in our troubled debt restructuringsis mainly due to exposure reductions and loans now classified as nonaccrual.Our troubled debt restructurings totaled ¤ 279 million as of December 31, 2001,an 80% increase from 2000. This increase is primarily attributable to restruc-tured credits in Western Europe and Asia.
217

The following table shows the approximate effect on interest revenue of nonac-crual loans and troubled debt restructurings. It shows the gross interest incomethat would have been recorded in 2002 if those loans had been current in accor-dance with their original terms and had been outstanding throughout 2002 orsince their origination, if we only held them for part of 2002. It also shows theamount of interest income on those loans that was included in net income for2002:
218
in ¤ m. 2002
German loans
Gross amount of interest that would have been recorded at original rate 212
Less interest, net of reversals, recognized in interest revenue 114
Reduction of interest revenue 98
Non-German loans
Gross amount of interest that would have been recorded at original rate 302
Less interest, net of reversals, recognized in interest revenue 82
Reduction of interest revenue 220
Total reduction of interest revenue 318

Risk Report
The following table sets forth the components of our allowance for loan lossesby industry of the borrower, and the percentage of our total loan portfolioaccounted for by those industry classifications, on the dates specified. Thebreakdown between German and non-German borrowers is based on the loca-tion of the borrowers:
Movements in the Allowance for Loan Losses. We record increases to ourallowance for loan losses as an expense on our Consolidated Statement ofIncome. If we determine that we no longer need provisions we have taken pre-viously, we decrease our allowance and record the amount as a reduction of the provision on our Consolidated Statement of Income. Charge-offs reduce our allowance while recoveries increase the allowance without affecting theConsolidated Statement of Income.
219
Allowance for LoanLosses
in ¤ m. (except percentages) Dec 31, 2002 Dec 31, 2001 Dec 31, 2000 Dec 31, 1999 Dec 31, 1998
German
Specific loan loss allowance
Banks and insurance 37 1% 7 3% 67 4% 6 2% 10 3%
Manufacturing 317 5% 427 5% 668 5% 707 5% 781 6%
Households(excluding mortgages) 121 8% 102 5% 110 5% 64 5% 83 6%
Households—mortgages 5 15% 73 13% 58 12% 171 13% 162 13%
Public sector – 1% – 8% – 8% – 8% – 9%
Wholesale and retail trade 130 3% 187 2% 359 3% 407 4% 438 6%
Commercial real estate activities 287 9% 643 11% 773 9% 689 9% 568 10%
Other 479 9% 606 9% 840 11% 990 13% 788 16 %
Specific German total 1,376 2,045 2,875 3,034 2,830
Inherent loss allowance 495 1,098 1,395 1,435 1,768
German total 1,871 51% 3,143 56% 4,270 57% 4,469 59% 4,598 69%
Non-German
Specific loan loss allowance 1,768 1 675 1,702 1,575 882
Inherent loss allowance 678 767 773 1,237 1,036
Non-German total 2,446 49% 2,442 44% 2,475 43% 2,812 41% 1,918 31%
Total allowance for loan losses 4,317 100% 5,585 100% 6,745 100% 7,281 100% 6,516 100%
Total specific allowance 3,144 3,720 4,577 4,609 3,712
Total inherent loss allowance 1,173 1,865 2,168 2,672 2,804
Total allowance for loan losses 4,317 5,585 6,745 7,281 6,516

The following table sets forth a breakdown of the movements in our allowancefor loan losses for the periods specified:
220
in ¤ m. (except percentages) 2002 2001 2000 1999 1998
Allowance at beginning of year 5,585 6,745 7,281 6,516 6,388
Charge-offs
German
Banks and insurance 8 7 13 5 4
Manufacturing 196 280 123 127 107
Households(excluding mortgages) 400 214 37 41 15
Households – mortgages 45 27 39 48 32
Public sector – – – – –
Wholesale and retail trade 140 192 60 81 58
Commercial real estate activities 127 209 148 158 154
Lease financing – 1 3 2 1
Other 567 426 220 147 128
Total German 1,483 1,356 643 609 499
Non-German
Excluding lease financing 1,244 697 652 215 243
Lease financing only 1 2 1 15 1
Total Non-German 1,245 699 653 230 244
Total charge-offs 2,728 2,055 1,296 839 743
Recoveries
German
Banks and insurance – – – 1 2
Manufacturing 4 4 10 8 1
Households(excluding mortgages) 24 15 3 2 2
Households – mortgages 2 2 – – –
Public sector – – – – –
Wholesale and retail trade 3 1 – – –
Commercial real estate activities 3 – 3 5 2
Lease financing – – – – –
Other 42 11 35 5 19
Total German 78 33 51 21 26
Non-German
Excluding lease financing 34 34 24 23 10
Lease financing only – – – 6 –
Total Non-German 34 34 24 29 10
Total recoveries 112 67 75 50 36
Net charge-offs 2,616 1,988 1,221 789 707
Provision for loan losses 2,091 1,024 478 725 908
Other changes (currency translation and allowance related to acquisitions/divestitures) (743) (196) 207 829 (73)
Allowance at end of year 4,317 5,585 6,745 7,281 6,516
Percentage of total net charge-offs to average loans for the year 1.15 % 0.71 % 0.39 % 0.31 % 0.35 %

Risk Report
The following table presents an analysis of the changes in the international component of the allowance for loan losses. As of December 31, 2002, 57% ofour total allowance was attributable to international clients:
Our allowance for loan losses as of December 31, 2002 was ¤ 4.3 billion, 23%lower than the ¤ 5.6 billion at the end of 2001. This decrease in our allowancebalance was principally due to increases in our charge-offs, partially offset byincreases in our provisions due to adverse economic conditions that continuedto persist in 2002. The overall reduction in our allowance for loan losses can alsobe attributed to net deconsolidations of ¤ 421 million and exchange rate move-ments.Our gross charge-offs grew to ¤ 2.7 billion in 2002, an increase of ¤ 673 million,or 33%, over 2001 charge-offs. Of the charge-offs for 2002, ¤ 1.9 billion wererelated to our corporate credit exposure, mainly driven by our German and NorthAmerican portfolios, and ¤ 777 million were related to our consumer credit expo-sure.Our provision for loan losses in 2002 was ¤ 2.1 billion, an increase of 104% fromthe prior year. This amount is composed of both net new specific and inherentloan loss provisions. The provision for the year is primarily due to provisionsraised to address the downturn in the telecommunications industry and specificloan loss provisions reflecting the deterioration in various industry sectors repre-sented within our German portfolio and the Americas.Our specific loan loss allowance was ¤ 3.1 billion as of December 31, 2002, adecrease of ¤ 576 million, or a 15% reduction from 2001. The change in ourallowance includes a net specific loan loss provision of ¤ 2.0 billion, 74% ofwhich was for non-German clients. The provision was 111% higher than the pre-vious year. The increased provision, however, was nearly offset by net charge-offs of ¤ 1.8 billion. As the specific loan loss allowance is the largest componentof our total allowance for loan losses, the net reduction in our specific loan lossallowance for 2002 is also due to the reasons outlined above for the overallreduction in our total allowance for loan losses.
221
in ¤ m. 2002 2001 2000 1999 1998
Allowance at beginning of year 2,441 2,475 2,812 1,918 1,735
Charge-offs 1,245 699 653 230 244
Recoveries 34 34 24 29 10
Net charge-offs 1,211 665 629 201 234
Provision for loan losses 1,500 710 219 296 443
Other changes (currency trans-lation and allowance related toacquisitions/divestitures) (284) (79) 73 799 (26)
Allowance at end of year 2,446 2,441 2,475 2,812 1,918

Our inherent loan loss allowance totaled ¤ 1.2 billion as of December 31, 2002, a decrease of ¤ 692 million, or 37%, from the level at the end of 2001. A majordriver of the net reduction was ¤ 716 million net charge-offs in our homoge-neous loan portfolio, partially offset by a net provision for smaller-balance stan-dardized homogeneous exposures of ¤ 179 million. The volume of charge-offs inthe homogeneous portfolio in 2002 was affected by the establishment of days-past-due thresholds at which certain homogeneous loan types are completelycharged-off.Our allowance for loan losses as of December 31, 2001 was ¤ 5.6 billion, 17%lower than the ¤ 6.7 billion at the end of 2000. This decrease in our allowancebalance was principally due to increases in our charge-offs, offset by increasesin provisions due to weakened economic conditions in 2001.Our charge-offs grew to ¤ 2.1billion in 2001, an increase of ¤ 759 million, or 59%,over 2000 charge-offs. This was principally due to a change in practice in ourentities regulated outside the United States. Out of the total charge-offs for 2001¤ 1.4 billion or two-thirds were in our German portfolio, of which ¤ 957 millionapplied to clients in the medium-sized corporate portfolio and ¤ 407 millionrelated to smaller-balance standardized homogeneous exposures. Approxi-mately 25% of the charge-offs in the German-Other category, which totaled ¤ 426 million, related to a single medium-sized German corporate client in theconstruction industry. The remaining ¤ 700 million were charge-offs in our non-German portfolio, of which ¤ 402 million, or 58%, related to charge-offs in NorthAmerica, principally in our leveraged business.Our total provision for loan losses in 2001 was ¤ 1.0 billion, an increase of 114%from the prior year. This amount is comprised of both new specific and inherentloan loss provisions, reflecting the downturn in the global economy.Our specific loan loss allowance was ¤ 3.7 billion as of December 31, 2001, a19% decrease from 2000. The change in the allowance includes a specific loanloss provision of ¤ 951 million, 70% of which was for non-German clients. Theprovision was 18% higher than the prior year and included increased provisionsrelated to a single American borrower in the utilities industry, various Argentineexposures and our leveraged business. The increased provision was offset inpart by ¤ 1.6 billion in net charge-offs.Our inherent loss allowance totaled ¤ 1.9 billion as of December 31, 2001, adecrease of ¤ 303 million, or 14%, from the level at the end of 2000. A majordriver of the net reduction was ¤ 383 million of charge-offs in our Private andPersonal Banking business in Germany, partially offset by a provision for smaller-balance standardized homogeneous exposures of ¤ 127 million. Furthermore,our country risk allowance shows a net decrease of 16%, reflecting the selldown of assets which previously attracted country risk allowance in Turkey andthroughout Asia excluding Japan, and an increase in collateral held against crossborder assets.Our allowance for loans losses as of December 31, 2000 was ¤ 6.7 billion, 7%lower than the ¤ 7.3 billion at the end of 1999. This decrease in our allowancebalance was principally due to increases in our charge-offs, lower specific provi-sions and a net release of our inherent loss provisions.
222

Risk Report
Our charge-offs increased to ¤ 1.3 billion in 2000, a ¤ 457 million, or 54%,increase over 1999 charge-offs. Of this increase, ¤ 423 million was exclusivelyattributable to our non-German customers. Approximately 70%, or ¤ 296 million,of this increase was due to charge-offs related to Russia and Iraq. We also had ¤ 34 million of charge-offs for our German clients in the medium-sized corporateportfolio. Approximately 60% of the charge-offs captured in the German-Othercategory related to a single medium-sized German corporate customer in theconstruction industry.Our total provision for loan losses in 2000 was ¤ 478 million, a decline of 34%from the prior year. This balance was composed of net new specific loan lossprovisions and a release of our inherent loss provision. Our total net new specificloan loss provision amounted to ¤ 805 million, which was almost equally splitbetween German and non-German clients. Our specific loan loss provisionsdeclined between 1999 and 2000, reflecting the improvement of the quality ofour loan portfolio. Specific provisions were approximately 13% less in 2000 thanthe prior year due in large part to provisions we took in 1999 with respect to asignificant exposure to a single German borrower in the real estate industry.Our inherent loss allowance totaled ¤ 2.2 billion as of December 31, 2000, a 19%drop from the level at the end of 1999. This decline reflected the effect of the ¤ 296 million of charge-offs described above and country provision releasestotaling ¤ 154 million. Of the ¤ 154 million country provision releases, ¤ 88 million was due to reduced exposure (mainly in Brazil and Turkey), ¤ 34 millionwas due to a net reduction in provisioning rates applied to individual countries,and the remaining amount related to other changes, primarily foreign exchange.In addition to a small increase in our allowances on the homogeneous loan port-folio, we released a net ¤ 98 million from our other inherent loss allowance in2000 due to two legal entities: EUROHYPO and Bankers Trust. Each of theseentities had a decrease in its loss factors in 2000 because of a decline in its his-torical average charge-offs and an increase in its average loan exposures.Our allowance for loan losses at December 31, 1999 was ¤ 7.3 billion, a 12%increase from 1998. This increase in our allowance for loan losses was principallydue to substantial increases in our specific provisions, and the Bankers Trustacquisition (¤ 477 million), partially offset by releases of country risk provisions,a substantial decrease in the inherent loss provision and a slight increase incharge-offs (¤ 96 million).Our total charge-offs increased 13% during 1999 to ¤ 839 million. This increasewas primarily attributable to the German domestic portfolio. Approximately 30%of the German-Other charge-off was related to the construction industry.During 1999, our provision for loan losses totaled ¤ 725 million, a 20% or ¤ 183 million decrease from the preceding year. This decrease was mainlyattributable to higher specific loan loss provisions, offset in part by releases ofcountry risk provision. Our German specific provision increased to ¤ 568 million, a 65% increase from the preceding year. This increase was mainlyattributable to higher provisions for the German borrower we refer to above.
223

Our non-German specific provision totaled ¤ 358 million in 1999, a 30% increasefrom the preceding year. This increase was due to the fact that we were able tospecifically identify those exposures, recorded in various Emerging Marketcountries, which required a specific provision. At the same time, we releasedcountry risk provisions, particularly in Indonesia and Turkey.Our allowance for loan losses at December 31, 1998 was ¤ 6.5 billion, a 2%increase from 1997. This increase was primarily due to the effects of the Asianand Russian financial crisis. The following table presents an analysis of the changes in our allowance forcredit losses on lending-related commitments:
Settlement Risk
Our extensive trading activities may give rise to risk at the time of settlement ofthose trades. Settlement risk is the risk of loss due to the failure of a counter-party to honor its obligations to deliver cash, securities or other assets as con-tractually agreed.For many types of transactions, we mitigate settlement risk by closing the trans-action through a clearing agent which effectively acts as a stakeholder for bothparties, only settling the trade once both parties have fulfilled their sides of thebargain.Where no such settlement system exists, as is commonly the case with foreignexchange trades, the simultaneous commencement of the payment and thedelivery parts of the transaction is common practice between trading partners(free settlement). In these cases, we may seek to mitigate our settlement riskthrough the execution of bilateral payment netting agreements. We are also anactive participant in industry initiatives to reduce settlement risks. Acceptance ofsettlement risk on free settlement trades requires approval from our credit riskpersonnel, either in the form of pre-approved settlement risk limits, or throughtransaction-specific approvals. We do not aggregate settlement risk limits withother credit exposures for credit approval purposes, but we take the aggregateexposure into account when we consider whether a given settlement risk wouldbe acceptable.
224
in ¤ m. 2002 2001 2000
Allowance at beginning of year 496 453 569
Provision for credit losses 17 (30) (33)
Net charge-offs – (22) (34)
Other changes (currency translation and allowance related to acquisitions/divestitures) (28) 95 (49)
Allowance at end of year 485 496 453

Risk Report
Market Risk
Substantially all of our businesses are subject to the risk that market prices andrates will move and result in profits or losses for us. We distinguish among fourtypes of market risk:– Interest rate risk (including specific risk as well as general risk, as described
below);– Equity price risk (including specific risk as well as general risk, as described
below);– Foreign exchange risk;– Commodity price risk.
We assume market risk in both our trading and our nontrading activities. Weassume risk by making markets and taking positions in debt, equity, foreignexchange, other securities and commodities as well as in interest rate, equity,foreign exchange, and commodity derivatives.We use a combination of risk sensitivities, value-at-risk, stress testing and eco-nomic capital metrics to manage market risks and establish limits. Economiccapital is the metric we use to describe all our market risks, both in trading andnontrading portfolios. Value-at-risk is also a common metric used in the man-agement of our trading risks.Our Board of Managing Directors and Group Risk Committee, supported byGroup Market Risk Management, which is part of our internally independent riskmanagement function, set a Group-wide value-at-risk limit for the market risks inthe trading book. Group Market Risk Management sub-allocates this overall limitto our Group Divisions and below that to specific business lines and trading port-folio groups and geographical regions.Our market risk disclosures for the trading businesses are based on Germanbanking regulations, which permit banks to calculate market risk capital usingtheir own internal models. In October 1998, the German Banking SupervisoryAuthority (now the German Federal Financial Supervisory Authority) approvedour internal market risk models for calculating market risk capital for our generalmarket risk and issuer-specific risk. It confirmed its approval in 2000, after a fur-ther review and subsequent to our acquisition of Bankers Trust and in 2002, thisapproval was renewed. We use our internal value-at-risk model, which wedescribe below, to calculate the market risk component of our regulatory capital.
Our value-at-risk disclosure is intended to ensure the consistency of market riskreporting for internal risk management, for regulatory purposes and for externaldisclosure. The overall value-at-risk limit for our Corporate and Investment BankGroup Division was ¤ 73 million throughout the year 2002 (with a 99% confi-dence level, as we describe below, and a one-day holding period), except for thetime period from January 8 to February 25, 2002 when we temporarily increasedthe limit to ¤ 100 million. The value-at-risk limit for our consolidated Group trad-ing positions was ¤ 77 million throughout the year 2002, except for the timeperiod from January 8 to February 25, 2002 when we temporarily increased thelimit to ¤ 100 million.
225
Market Risk Manage-ment Framework

There are two significant areas where our determination of which assets aretrading assets and which are nontrading assets differ under German bankingregulations and U.S. GAAP.First, material differences in the classification of assets as trading assets occur insome of our business units, which are considered to be trading units for regula-tory and internal risk management reporting. In these units we have assetswhich are included in the value-at-risk of the trading units even though they arenot trading assets under U.S. GAAP. These assets typically consist of moneymarket loans and of tradable loans and are primarily assigned to our Global Mar-kets Finance and Global Corporate Finance business lines. At year-end 2002, anamount of ¤ 3.9 billion of loans was classified as trading assets for regulatoryreporting. This amount was similar at year-end 2001.Second, we have differences due to the application of hedge accounting. AtDecember 31, 2002 the fair value of these transactions amounted to ¤ 1.9 billionin assets and ¤ 1.2 billion in liabilities. These differences were not material atyear-end 2001.In addition, we exclude from our value-at-risk figures the foreign exchange riskarising from currency positions that German regulation permits us to excludefrom currency risk reporting. These are currency positions which are fullydeducted from, or covered by, equity capital recognized for regulatory reporting,plus partial hedges on such equity capital, as well as shares in affiliated compa-nies that we record in foreign currency and value at historical cost – all of whichwe refer to as structural currency positions. This approach is in accordance withGerman banking regulations and has the consent of the German Federal Finan-cial Supervisory Authority. These holdings had a total book value of ¤ 11.7 billionon December 31, 2002. Of this amount, 66% was denominated in U.S. dollars,17% in pounds sterling, and 7% in Japanese yen. The remainder was distributedamong various other currencies.Also, we do not consolidate for German regulatory reporting purposes compa-nies that are not credit institutions, financial services institutions, financial enter-prises or bank service enterprises. However, we do consolidate a number ofthese companies under U.S. GAAP. These companies include primarily ourinsurance companies and certain investment companies. These companiesmanage their market risks themselves (pursuant to the regulations applicable tothese companies’ risk management activities) and we do not include them inthis market risk management disclosure. At December 31, 2002, these compa-nies held ¤ 12.1 billion of nontrading assets, while they did not hold any tradingassets.
We use the value-at-risk approach to derive quantitative measures for our tradingbook market risks under normal market conditions.For a given portfolio, value-at-risk measures the potential future loss (in terms ofmarket value) that, under normal market conditions, will not be exceeded in adefined period and with a defined confidence level. The value-at-risk measureenables us to apply a constant and uniform measure across all of our tradingbusinesses and products. This facilitates comparisons of our market risk esti-mates both over time and against our actual daily trading results.
226
Differences in Market Risk Reportingbetween GermanBanking Regulationsand U.S. GAAP
Value-at-Risk (VaR)Analysis

Risk Report
Since January 1, 1999, we have calculated value-at-risk for both internal andexternal reporting using a 99% confidence level, in accordance with BIS rules.For internal reporting purposes, we use a holding period of one day. For regula-tory reporting purposes, the holding period is ten days, i.e. if the portfolio is heldwithout change for ten days, there is a 1% chance that the portfolio’s marketvalue would decline by an amount greater than the value-at-risk figure.We believe that our value-at-risk model takes into account all material risk fac-tors assuming normal market conditions. Examples of these factors are interestrates, equity prices, foreign exchange rates and commodity prices, as well astheir implied volatilities. The model incorporates both linear and nonlinear effectsof the risk factors on the portfolio value. In our model, the nonlinear effects cap-ture risks specific to derivatives. The statistical parameters required for the value-at-risk calculation are based on a 261 trading day history (corresponding to onecalendar year of trading days) with equal weighting being given to each obser-vation.Before and during 2001 we used an assumption of zero correlation among thevarious risk classes which means we assumed that losses in the various riskclasses occur independently of one another. In 2002 we moved to an aggrega-tion approach based on full correlation among the various risk classes.The value-at-risk for interest rate and equity price risks consists of two compo-nents each. The general risk describes value changes due to general marketmovements, while the specific risk has issuer-related causes. When aggregatinggeneral and specific risks, we assume that there is zero correlation betweenthem.We calculate value-at-risk using Monte Carlo simulations. A Monte Carlo simula-tion is a model that calculates profit or loss for a transaction for a large number(such as 10,000) of different market scenarios, which are generated by assuminga joint (log-) normal distribution of market prices based on the observed statisti-cal behavior of the simulated risk factors in the last 261 trading days. However,we still use a variance-covariance approach to calculate specific interest rate riskfor some portfolios, such as in our integrated credit trading and securitizationbusinesses.
We use back-testing on our trading units to verify the predictive power of thevalue-at-risk calculations. In back-testing, we compare the hypothetical dailyprofits and losses under the buy-and-hold assumption (in accordance with German regulatory requirements) with the estimates we had forecast using thevalue-at-risk model.A back-testing committee meets on a quarterly basis to discuss back-testingresults of the Group as a whole and individual businesses. The committee consists of risk managers, risk controllers and business area controllers. Theyanalyze performance fluctuations and assess the predictive power of our value-at-risk models, which in turn allows us to improve the risk estimation process.
227
Back-Testing
While value-at-risk, calculated on a daily basis, supplies forecasts for potentiallarge losses under normal market conditions, we perform stress tests in whichwe value our trading portfolios under extreme market scenarios not covered bythe confidence interval of our value-at-risk models.The quantification of market risk under extreme stress scenarios forms the basisof our assessment of the economic capital that we estimate is needed to coverthe market risk in all of our positions. Underlying risk factors (market parame-ters) applicable to the different products are stressed, meaning that we assumea sudden change, according to pre-defined scenarios. We take the resulting pre-dicted losses from applying the worst of these scenarios to the various portfoliosas the economic capital for those businesses. We derive the stress scenariosfrom historic worst case scenarios adjusted for structural changes in currentmarkets.For example, we calculate country-specific event risk scenarios for all emergingmarkets and assess these event risk results daily. A committee reviews the country risk ratings and scenario loss limits bi-weekly. In addition to the country-specific event risk scenarios for Emerging Markets, we also run regular (weekly)market stress scenarios on the positions of every major trading portfolio.Our stress test scenarios include:– price and volatility risks for interest rate, equity price, foreign exchange and
commodity prices for industrialized countries. This covers both trading andnontrading securities and investments, as well as trading book derivativesportfolios and includes many basis risks;
– Emerging Markets’ risks, including equity price declines, strong interest ratemovements and currency devaluations;
– credit spread risks for bonds and traded loans of both industrialized andEmerging Markets countries;
– underwriting risks in debt and equity capital markets.
We aggregate the economic capital numbers by aggregating losses from thosestress scenarios using correlations that reflect stressed market conditions (ratherthan the normal market correlations used in the value-at-risk model). These cal-culations are performed weekly.On December 31, 2002 our economic capital calculation for market risk arisingfrom the trading units totaled ¤ 0.9 billion.
Although we believe that our proprietary market risk models are of a high stan-dard, we are committed to their ongoing development and allocate substantialresources to reviewing and improving them.Our stress testing results and economic capital estimations are limited by theobvious fact that our stress tests are necessarily limited in number and not alldownside scenarios can be predicted and simulated. Whilst the risk managershave used their best judgement to define worst case losses, with the knowledgeof past extreme market moves, it is possible for our market risk positions to losemore value than even our economic capital utilization estimates.
228
Stress Testing andEconomic Capital
Limitations of Our Proprietary Risk Models

Risk Report
Our value-at-risk analyses should also be viewed in the context of the limitationsof the methodology we use and are therefore not maximum amounts that wecan lose on our market risk positions. The limitations of the value-at-riskmethodology include the following:– the use of historical data as a proxy for estimating future events may not cap-
ture all potential events, particularly those which are extreme in nature; – the assumption that changes in risk factors follow a normal or logarithmic nor-
mal distribution. This may not be the case in reality and may lead to an under-estimation of the probability of extreme market movements;
– the use of a holding period of one day (or ten days for regulatory value-at-riskcalculations) assumes that all positions can be liquidated or hedged in thatperiod of time. This assumption does not fully capture the market risk arisingduring periods of illiquidity, when liquidation or hedging in that period of timemay not be possible. This is particularly the case for the use of a one-day hold-ing period;
– the use of a 99% confidence level does not take account of, nor makes anystatement about, any losses that might occur beyond this level of confidence;
– we calculate value-at-risk at the close of business on each trading day. We donot subject intra-day exposures to intra-day value-at-risk calculations;
– value-at-risk does not capture all of the complex effects of the risk factors onthe value of positions and portfolios and could, therefore, underestimatepotential losses. For example, the way sensitivities are represented in thevalue-at-risk model may only be exact for small changes in market parameters.
We believe that the aggregate value-at-risk estimates for our consolidated Groupas a whole stand up well against our back-testing procedures (as measured bythe number of hypothetical buy-and-hold portfolio losses against the predictedvalue-at-risk). However, we acknowledge the limitations in the value-at-riskmethodology by supplementing the value-at-risk limits with other position andsensitivity limit structures, as well as with stress testing, both on individual port-folios and on a consolidated basis.
The following table shows the value-at-risk of our trading units in 2002 and 2001.The minimum and maximum value-at-risk amounts show the bands withinwhich the values fluctuated during the periods specified. We calculate the value-at-risk with a holding period of one day and a confidence level of 99%. “Diversi-fication effect” refers to the effect that the total value-at-risk on a given day islower than the sum of the values-at-risk relating to the individual risk factors.Simply adding the value-at-risk figures of the individual risk classes to arrive atan aggregate value-at-risk would imply the assumption that the losses in all riskcategories occur simultaneously.
229
Value-at-Risk of theTrading Units of OurCorporate and Invest-ment Bank GroupDivision

The following table shows the value-at-risk of our trading units:
The following graphs show the daily aggregate value-at-risk of our trading unitsin 2002 and 2001, including diversification effects:
230
* Value-at-risk for 2002 based on full correlation,while value-at-risk for 2001 based on zero correlation among the risk classes.
25
45
65
1/02 2/02 3/02 4/02 5/02 6/02 7/02 8/02 9/02 10/02 11/02 12/02
85
Daily Value-at-Risk of Trading Units in 2002*in ¤ m.
25
35
45
55
1/01 2/01 3/01 4/01 5/01 6/01 7/01 8/01 9/01 10/01 11/01 12/01
Daily Value-at-Risk of Trading Units in 2001*in ¤ m.
* Value-at-risk for 2002 based on full correlation,while value-at-risk for 2001 based on zero correlation among the risk classes.
Total1 Diversification Interest Rate Equity Price Foreign Exchange Commodity PriceEffect Risk Risk Risk Risk
in ¤ m. 2002 2001 2002 2001 2002 2001 2002 2001 2002 2001 2002 2001
Average 42.38 41.02 30.90 23.19 35.63 34.91 24.28 19.90 8.02 6.19 5.35 3.22
Maximum 88.86 55.38 47.54 30.60 58.48 51.69 89.26 35.04 29.25 16.61 8.66 7.60
Minimum 29.36 27.89 21.17 16.68 24.67 22.35 13.43 11.67 2.64 2.87 2.28 1.78
Year-end 32.94 40.53 22.50 21.11 29.12 34.88 13.75 20.09 6.84 3.15 5.73 3.52
1 Total for 2002 based on full correlation, total for 2001 based on zero correlation among the risk classes.

Risk Report
Our trading value-at-risk largely fluctuated between ¤ 30 million and ¤ 45 millionin 2002, with two exceptions. The start of year peak was driven by a large equityposition that resulted from an underwriting transaction that took time to selldown, for which a temporary limit increase to ¤ 100 million was granted. TheAugust spike above ¤ 45 million was primarily driven by above-average interestrate risk positions that were taken in anticipation of interest rate cuts.The following histograms show the distribution of actual daily income of ourtrading units in 2002 and 2001. The histograms indicate, for each year, the num-ber of trading days on which we reached each level of trading income shown onthe horizontal axis in millions of euro. The trading units achieved a positiveincome for over 99 % of the trading days in 2001 and for over 96% of the tradingdays in 2002. On no trading day in either year did they incur an actual loss thatexceeded the value-at-risk estimate for that day:
231
* 99th percentile of daily income distribution.** Average value-at-risk (confidence level 99 %).
<–15 –15 –10 –5 0 5 10 15 20 25 30 35 40 45 50 55 60 65 70 75 80 85 90 95 >100
0
10
20
30
Days
Daily Income of Trading Units in 2002
in ¤ m.Daily average: 32.1
46.9*
42.4**
Daily Income of Trading Units in 2001
in ¤ m.
* 99th percentile of daily income distribution.** Average value-at-risk (confidence level 99 %).
Daily average: 41.8 Days
10–10 –5 0 5 15 20 25 30 35 40 45 50 >10055 60 65 70 75 80 85 90 95
20
30
10
35.4*
41.0**
0

The comparison of the distribution of our trading units’ actual daily income withthe average value-at-risk enables us to ascertain how reasonable our value-at-risk estimate is. The histogram for 2002 shows that the actual distribution of ourtrading units’ income produces a 99th percentile of ¤ 46.9 million below theaverage daily income level of ¤ 32.1 million. This compares with the averagevalue-at-risk estimate of ¤ 42.4 million and is larger due to the fact that therewere ten loss-making trading days in 2002 (of which only four were greater than¤ 10 million and none were greater than the value-at-risk estimate), as opposedto only two loss-making days in 2001.The value-at-risk and actual income of the trading units throughout the year areshown in the following graph:
In addition, there were two hypothetical buy-and-hold losses that exceeded ourvalue-at-risk estimate for the trading units as a whole in 2001 and one hypothet-ical loss exceeding the value-at-risk in 2002. This is in line with the expected twoto three outliers a year that a 99% confidence level value-at-risk model ought topredict.
These risks constitute the largest portion of the market risks of our consolidatedGroup. We do not use value-at-risk as the primary metric for our nontrading port-folios because of the nature of these positions as well as the lack of transparencyof some of the pricing. Instead we assess the risk of these portfolios, the biggestof which is equity price risk, through the use of stress testing procedures thatare particular to each risk class and which take into account the liquidity of eachasset class. This assessment forms the basis of economic capital estimatesneeded to support the portfolios using a methodology which is consistent withthat used for the trading risk positions. These economic capital estimates enableus to apply a constant and uniform measure across all of our nontrading portfo-lios and thereby actively monitor and manage the risks. The interest rate and for-eign exchange risks arising from our nontrading portfolios have been transferredto our Global Markets Finance business line within our Corporate and Invest-ment Bank Group Division and are managed on the basis of value-at-risk.There are nontrading market risks held and managed in our Corporate andInvestment Bank Group Division, our Private Clients and Asset ManagementGroup Division and our Corporate Investments Group Division.
232
– 100
– 50
0
50
100
Income of Trading Units and Value-at-Risk in 2002
in ¤ m.
1/02 2/02 3/02 4/02 5/02 6/02 7/02 8/02 9/02 10/02 11/02 12/02
Income of Trading Units
Value-at-Risk
Market Risk in OurNontrading Portfolios

Risk Report
On December 31, 2002, our economic capital total measurement for all corpo-rate investments and alternative assets was ¤ 8.3 billion, which included ¤ 3.2billion for private equity, ¤ 2.0 billion for industrial holdings and ¤ 1.1 billion forreal estate investments. This economic capital assessment does not presumeany diversification benefits between the risks of the different assets. In our Corporate and Investment Bank Group Division, the majority of nontrad-ing market risk arises from holdings in listed equity investments, including a ¤ 496 million holding in Axel Springer Verlag AG. Our Private Clients and AssetManagement Group Division primarily incurs nontrading market risk through itsproprietary investments in mutual funds, hedge funds and real estate which sup-port the client asset management businesses. Our Corporate Investments GroupDivision’s nontrading market risks remain by far the biggest in the Group and aremainly incurred through private equity and various legacy funds and equityinvestments.The total market value of our consolidated Group’s nontrading equity invest-ments under U.S. GAAP consisted of ¤ 8.0 billion of equity securities availablefor sale (including the industrial holdings, the largest of which are shown in thetable below) at December 31, 2002 and of ¤ 24.2 billion at year-end 2001. In addi-tion, other investments held at equity totaled ¤ 6.0 billion at December 31, 2002and ¤ 5.3 billion at year-end 2001 and the book value of our other investmentsnot held at equity totaled ¤ 4.7 billion at December 31, 2002 compared to ¤ 6.7billion at year-end 2001. For further information on our other investments, in par-ticular our investments held at equity, see Note [6] to the consolidated financialstatements.The asset and liability positions of some subsidiaries, including Deutsche BankPrivat- und Geschäftskunden, Deutsche Bank Lübeck, Deutsche Bank Interna-tional Limited and Deutsche Bank Saar give rise to some nontrading book mar-ket risks but are a small portion of the total, especially since the deconsolidationof our mortgage bank subsidiary, EUROHYPO, from our financial statements inAugust (the vast majority of the general interest rate risk of the nontrading loanbooks is passed onto the Corporate and Investment Bank Group Division andmanaged within the trading book).
Alternative Assets Investment Activities. All of our three Group Divisionsengage in alternative assets investment activities. The Corporate Investmentsand the Private Clients and Asset Management Group Divisions conduct invest-ment activities in alternative assets as principals, fiduciaries and on behalf ofthird parties as fund managers. We define alternative assets as direct invest-ments in private equity, venture capital, mezzanine debt, real estate principalinvestments, investments in leveraged buy-out funds, venture capital funds andhedge funds. We manage our investments in hedge funds as principal in the Pri-vate Clients and Asset Management Group Division and on a smaller scale, inthe Corporate and Investment Bank Group Division.
233

Group Corporate Investment/Alternative Assets Committee. To ensure acoordinated investment strategy, a consistent risk management process andappropriate portfolio diversification, our Group Corporate Investment/AlternativeAssets Committee (which a member of our Board of Managing Directors chairs),supervises all of our alternative assets investment activities. The Global Head ofGroup Market Risk Management is also the Chief Risk Officer for CorporateInvestments and Alternative Assets and is a member of the Group CorporateInvestment/Alternative Assets Committee.The Group Corporate Investment/Alternative Assets Committee defines invest-ment strategies, determines risk adjusted return requirements, sets limits forinvestment asset classes, allocates economic capital among the various alterna-tive assets units and approves policies, procedures and methodologies for managing alternative assets risk. The Group Corporate Investment/AlternativeAssets Committee receives monthly portfolio reports showing performance,estimated market values, economic capital usage derived from stress tests andrisk profiles of the investments. The committee also oversees the portfolio ofindustrial holdings and other strategic investments in entities held in our Corpo-rate Investments Group Division. The Group Corporate Investment/AlternativeAssets Committee has established dedicated investment commitment commit-tees for each alternative asset category.We carry private equity, venture capital and real estate investments on our balance sheet at their costs of acquisition (less write-downs, if applicable) or fairvalue. In certain circumstances, depending on our ownership percentage ormanagement rights, we apply the equity method to our investments. In somesituations, we consolidate investments made by the private equity business. Weaccount for our investments in leveraged buy-out funds using the equity methodand carry hedge fund investments at current market value.As of December 31, 2002 the book value of our alternative assets investmentportfolio amounted to ¤ 9.7 billion. It consisted of ¤ 5.3 billion of private equityinvestments, ¤ 4.0 billion of real estate investments and ¤ 0.4 billion of hedgefund investments.The portfolio is dominated by the private equity and real estate investmentswhich totaled ¤ 9.3 billion as of December 31, 2002 (at the end of 2001 the bookvalue of our private equity and real estate investments was ¤ 11.0 billion). Theywere primarily invested in Western Europe (60%) and North America (35%). Interms of industrial sectors we believe the majority of the private equity portfoliois well diversified. Of the above ¤ 5.3 billion, a ¤ 2.1 billion portion was held infunds managed by external managers.On December 31, 2002, our (undiversified) economic capital measurement foralternative assets under the aegis of the Group Corporate Investment/AlternativeAssets Committee (excluding industrial holdings) totaled ¤ 4.5 billion. Our eco-nomic capital measurement for alternative assets at the end of 2001 totaled ¤ 5.3billion (total recalculated for 2001 based on definition of alternative assetsabove).
Management of Our Mutual Funds. Our mutual fund investments (held in the Private Clients and Asset Management Group Division) amounted to ¤ 1.1 billion at December 31, 2002 and support our broad asset managementfund offerings to clients, sometimes being used to seed new funds. They wereinvested predominantly in securities and shares of Western European (mainlyGerman) issuers and across a broad mix of industries (including governments).Our economic capital estimate for the risk arising from these holdings was ¤ 133million. At year-end 2001 our mutual fund investments amounted to ¤ 5.5 billion.
234

Risk Report
The amount of our mutual fund investments has declined mainly because wehave sold our investments in special funds in early 2002.
Management of Our Industrial Holdings. DB Investor is responsible foradministering and restructuring our industrial holdings portfolio. However,Deutsche Bank AG holds some industrial holdings directly. DB Investor currentlyplans to continue selling most of its publicly listed holdings over the next fewyears, subject to the legal environment and market conditions.We deem equity investments in nonbanking enterprises to be significant if theirmarket value exceeds ¤ 150 million. The total percentages and market values ofthe significant nonbank holdings directly and/or indirectly attributable to us wereas follows on December 31, 2002 and on December 31, 2001:
235
Dec 31, 2002 Country of Share of Capital Market ValueDomicile (in %) (in ¤ m.)
DaimlerChrysler AG Germany 11.8 3,403
Allianz AG Germany 3.2 753
Linde AG Germany 10.0 401
HeidelbergCement AG(previously Heidelberger Zement AG) Germany 8.5 189
Total 4,746
Dec 31, 2001 Country of Share of Capital Market ValueDomicile (in %) (in ¤ m.)
DaimlerChrysler AG Germany 12.1 5,861
MünchenerRückversicherungs-Gesellschaft AG Germany 7.2 3,889
Allianz AG Germany 4.0 2,806
Linde AG Germany 10.1 552
RWE AG Germany 1.5 360
Südzucker AG Germany 11.3 313
Heidelberger Zement AG Germany 8.9 287
Buderus AG Germany 10.5 204
Mg technologies ag Germany 9.1 166
Continental AG Germany 8.2 162
Fiat S.p.A. Italy 1.6 155
Bayer AG Germany 0.6 154
Total 14,909

Liquidity Risk
Liquidity risk management has been instrumental in maintaining a healthy fundingprofile during this period of general economic weakness.
We have mapped all of our funding relevant assets and liabilities in time bucketscorresponding to their maturities to create what we call the “Funding Matrix”.Given that trading assets are typically more liquid than their contractual maturi-ties suggest, we have divided them into liquids (assigned to the time bucket oneyear and under) and illiquids (assigned to time buckets up to five years based onmodeling of their liquidity characteristics). We have modeled assets and liabili-ties from the retail bank that show a behavior of being renewed or prolongedregardless of capital market conditions (mortgage loans and retail deposits) andassigned them to time buckets accordingly. Wholesale banking products arebucketed based on their contractual maturities. We use the expected holdingperiod to assign corporate investments to the Funding Matrix. The Funding Matrix shows the excess or shortfall of assets over liabilities in eachtime bucket and thus allows us to identify and manage open liquidity exposures.We have also developed a cumulative mismatch vector, which enables us topredict whether any excess or shortfall will grow, decline or switch over time.The Funding Matrix forms the basis for our annual securities issuance planwhich upon approval of our Group Asset and Liability Committee establishesissuing targets for securities by tenor, volume and instrument. Funding Matrixand issuance plan form the basis to determine the liquidity spread which is onecomponent of the internal transfer price. On the basis of this model we have not identified any material funding mis-matches. In fact, considering capital, we are structurally long funded.
We have established a system to track net cash outflows over an eight-weekhorizon. This system allows management to assess our short-term liquidity position in any location, region and globally on a by-currency and by-productbasis. The system captures all of our cash flows, thereby including liquidity risksresulting from off-balance sheet transactions as well as from transactions on our balance sheet. We model transactions which have no specific contractualmaturities using statistical analysis to capture the actual behavior of these trans-actions. Our Board of Managing Directors, upon the recommendations of ourGroup Asset and Liability Committee, has set global and regional limits for theliquidity exposures which we monitor on a daily basis.
Unsecured wholesale funding is a finite resource. Over the course of 2002, wehave reduced our short-term unsecured wholesale funding (CP and CD, Bankand Central Bank deposits) by approximately ¤ 24 billion (see table below). Our Group Asset and Liability Committee has set limits to restrict utilization of unsecured wholesale funding.
236
Funding Matrix
Short-term Liquidity
Unsecured Funding

Risk Report
Diversification of our funding profile in terms of investor types, regions, productsand instruments is an important part of our liquidity policy. Our core fundingresources, such as retail and fiduciary deposits and long-term capital marketsfunding, form the cornerstone of our liability profile. Customer deposits, fundsfrom institutional investors and interbank funding are additional sources of fund-ing. We use interbank deposits primarily to fund liquid assets.
The above chart shows the composition of our unsecured liabilities as of December 31, 2002 both in euro billion and as a percentage of our total un-secured liabilities. Our total unsecured liabilities amounted to approximately ¤ 332 billion on that date. The liability diversification report is a managementinformation tool we use to actively manage our liability composition. It containsall relevant unsecured liabilities and can selectively be reconciled against bal-ance sheet items.We track the volume and location within our consolidated inventory of unen-cumbered, liquid assets which we can use immediately to raise funds either inthe repurchase agreement markets or by selling the assets. The securities inven-tory consists of a wide variety of liquid securities, which we can convert intocash even in times of market stress.The liquidity of these assets is an important element in protecting us againstshort-term liquidity squeezes. By holding these liquid assets, we also protectourselves against unexpected liquidity squeezes resulting from customers draw-ing large amounts under committed credit facilities. In addition, we maintained,on average, a ¤ 25 billion portfolio of highly liquid securities in major currenciesaround the world to supply collateral for cash needs associated with clearingactivities in euro, U.S. dollar and other major currencies.
237
* Small/Mid Cap: refers to deposits by small and medium sized European corporates.** CP-CD: Commercial Paper/Certificates of Deposit.
0
40
80
120
RetailDeposits
FiduciaryDeposits
CapitalMarkets
Small/Mid Cap*
CP-CD**
External Unsecured Liabilities by Product
in ¤ bn.
December 31, 2002: total ¤ 332 billionDecember 31, 2001: total ¤ 366 billion
BankDeposits
CentralBank
Deposits
OtherNon-BankDeposits
99
20
70
11
29 30
12
6155
12
3647
14
74
20
108
30%30%
21% 20%
6% 5%3% 4%
9%
13%
9%10%
4% 3%
18%15%
Funding Diversificationand Asset Liquidity
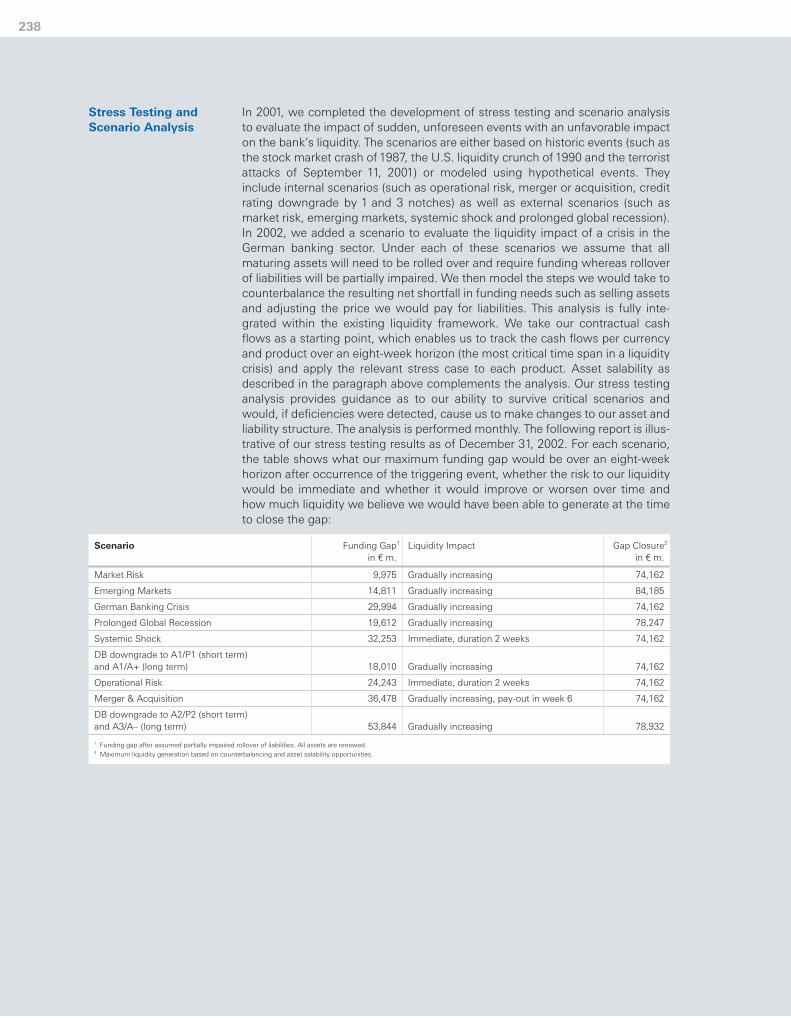
In 2001, we completed the development of stress testing and scenario analysisto evaluate the impact of sudden, unforeseen events with an unfavorable impacton the bank’s liquidity. The scenarios are either based on historic events (such asthe stock market crash of 1987, the U.S. liquidity crunch of 1990 and the terroristattacks of September 11, 2001) or modeled using hypothetical events. Theyinclude internal scenarios (such as operational risk, merger or acquisition, creditrating downgrade by 1 and 3 notches) as well as external scenarios (such as market risk, emerging markets, systemic shock and prolonged global recession).In 2002, we added a scenario to evaluate the liquidity impact of a crisis in theGerman banking sector. Under each of these scenarios we assume that allmaturing assets will need to be rolled over and require funding whereas rolloverof liabilities will be partially impaired. We then model the steps we would take tocounterbalance the resulting net shortfall in funding needs such as selling assetsand adjusting the price we would pay for liabilities. This analysis is fully inte-grated within the existing liquidity framework. We take our contractual cashflows as a starting point, which enables us to track the cash flows per currencyand product over an eight-week horizon (the most critical time span in a liquiditycrisis) and apply the relevant stress case to each product. Asset salability asdescribed in the paragraph above complements the analysis. Our stress testinganalysis provides guidance as to our ability to survive critical scenarios andwould, if deficiencies were detected, cause us to make changes to our asset andliability structure. The analysis is performed monthly. The following report is illus-trative of our stress testing results as of December 31, 2002. For each scenario,the table shows what our maximum funding gap would be over an eight-weekhorizon after occurrence of the triggering event, whether the risk to our liquiditywould be immediate and whether it would improve or worsen over time andhow much liquidity we believe we would have been able to generate at the timeto close the gap:
238
Stress Testing andScenario Analysis
Scenario Funding Gap1 Liquidity Impact Gap Closure2
in ¤ m. in ¤ m.
Market Risk 9,975 Gradually increasing 74,162
Emerging Markets 14,811 Gradually increasing 84,185
German Banking Crisis 29,994 Gradually increasing 74,162
Prolonged Global Recession 19,612 Gradually increasing 78,247
Systemic Shock 32,253 Immediate, duration 2 weeks 74,162
DB downgrade to A1/P1 (short term)and A1/A+ (long term) 18,010 Gradually increasing 74,162
Operational Risk 24,243 Immediate, duration 2 weeks 74,162
Merger & Acquisition 36,478 Gradually increasing, pay-out in week 6 74,162
DB downgrade to A2/P2 (short term)and A3/A– (long term) 53,844 Gradually increasing 78,932
1 Funding gap after assumed partially impaired rollover of liabilities. All assets are renewed.2 Maximum liquidity generation based on counterbalancing and asset salability opportunities.

Risk Report
With the increasing importance of liquidity management in the financial industry,we consider it important to contribute to financial stability by regularly address-ing central banks, supervisors and market participants on liquidity risk-relatedtopics. We participate in a number of working groups regarding liquidity and willstrive to assist in creating an industry standard that is appropriate to evaluateand manage liquidity risk.In addition to our internal liquidity management systems, the liquidity exposureof German banks is regulated by the German Banking Act and regulations issuedby the German Federal Financial Supervisory Authority.
We carry out certain business activities via arrangements with unconsolidatedentities. We may provide financial support or otherwise be exposed to risks ofloss as a result of these arrangements, typically through guarantees that we pro-vide or subordinated retained interests that we hold. The purposes, risks, andeffects of these arrangements are described below. Our use of derivativesindexed to our own stock which are accounted for off-balance sheet is dis-cussed below as well.We provide financial support related to off-balance sheet activities chiefly in connection with asset securitizations, commercial paper programs, commercialreal estate leasing vehicles and closed-end funds and certain fixed-term mutualfunds that we manage. The risks from these arrangements are included in ouroverall assessments of credit, liquidity and market risks.We may provide financial support in connection with asset securitizations byretaining a subordinated interest in the assets being securitized. In an assetsecuritization, we sell financial assets to a securitization trust which funds itspurchase by issuing debt (asset-backed securities) to investors. We have no control over the securitization trust after the sale, and our creditors and we haveno claim on the assets that we have sold. Similarly, the investors and the se-curitization trust have no recourse to our other assets if the loans go into default.For these reasons, we are not permitted to consolidate these trusts. Asset-backed securities are attractive to investors in what is a deep and liquid marketthat lowers borrowing costs and increases credit availability to businesses and toconsumers.The securitization trusts we use in these transactions pose limited liquidity riskssince the payments to investors are directly tied to the payments received fromthe trust’s assets and are unaffected by changes in our own credit rating orfinancial situation. A sudden drop in investor demand for asset-backed securitiescould cause us to restrict our lending thereafter for the types of loans we typi-cally securitize, but we are not dependent on securitizations as a source of fund-ing and such a market shift would not pose any significant additional liquidityrisk not already considered in our risk analyses. To the extent we hold senior orsubordinated debt issued by a securitization trust we have credit risk which isconsidered as part of our credit risk assessments or market valuations. Note [9]to the consolidated financial statements provides additional information regard-ing the extent of our retained interests in securitizations and the volume of ourasset securitization activities.Commercial paper programs represent a way for third parties to securitize theirfinancial assets. In commercial paper programs, we do not securitize any of ourown financial assets, but act as administrative agent. As administrative agent,we facilitate the sale of loans, other receivables, or securities from various thirdparties to an unconsolidated special purpose entity. We may also facilitate thetransfer of the loans and securities that represent collateral provided by the thirdparties in return for loans granted by the unconsolidated entity. The entity then
239
Off-balance SheetArrangements with UnconsolidatedEntities

issues collateralized commercial paper to the market. In these situations, thecommercial paper issuer is restricted from purchasing assets from or makingloans to us. Rating agencies typically rate such commercial paper in the highestshort-term category because of the collateral and credit support normally pro-vided by a financial institution.Unlike securitization trusts, commercial paper programs do pose liquidity risksince the commercial paper issued is short-term whereas the issuer’s assets arelonger term. We take on this risk whenever we provide a liquidity support facilityto the issuer. We may also guarantee the assets of the issuer as part of the facil-ity, giving us secondary credit risk with the first loss taken by the third partieswho sold their assets to the entity. We sponsor commercial real estate leasing vehicles and closed-end fundswhere third party investors essentially provide senior financing for the purchaseof commercial real estate which is leased to other third parties. We typicallyeither provide subordinated financing or we guarantee the investment made bythe third parties, which exposes us to real estate market risk, and we receivefees for our administrative services.For certain fixed-term mutual funds that we manage, we guarantee the value ofmutual fund units that investors purchase. The investment policies of thesefunds are designed to minimize the risk of market value loss which, in turn, mit-igates risk of these guarantees. We may be required to consolidate certain of the entities described above uponthe adoption of Interpretation No. 46, “Consolidation of Variable Interest Enti-ties”, on July 1, 2003. The impact of the Interpretation and the extent of thefinancial support we provide for the arrangements described above is disclosedin Note [9] to the consolidated financial statements. Also, the guaranteesdescribed above are included in the overall disclosures of guarantees inNote [30] to the consolidated financial statements. We enter into contracts to purchase Deutsche Bank common shares on a forward basis at a fixed price for purposes of satisfying employee stock com-pensation awards as they vest. These contracts are entered into with market participants, not special purpose entities. Current accounting rules require thatthese contracts be recorded off-balance sheet. Please see Note [30] of the con-solidated financial statements for further information regarding these contracts.
240

Risk Report
The following table shows the maturity breakdown of the indicated contractualfinancial obligations outstanding as of December 31, 2002:
The significant obligations in the above table of contractual financial obligationsare included in our overall assessment of liquidity risk.
Operational Risk
The banking industry, in close dialog with the Basel Committee on BankingSupervision achieved important milestones in 2002 in developing the new Reg-ulatory Operational Risk Framework, although the discussions with the regulatorsconcerning the capital and framework guidelines have not yet ended. On thebasis of the regulatory discussion we define operational risk as the potential forincurring losses in relation to employees, project management, contractualspecifications and documentation, technology, infrastructure failure and disas-ters, external influences and customer relationships. This definition includes,among others, legal and regulatory risk.The development of guidelines, standards, tools and methodologies to measureand protect against operational risk will be a major challenge to the banking sec-tor in the coming years. This is especially true in view of the new capital ade-quacy regulations currently under discussion, which will come into force at theend of 2006 and which will impose a capital charge for operational risks. More-over the regulators specify in their paper “Sound Practices for the Managementand Supervision of Operational Risk” qualitative demands regarding a bank’sorganization and risk management as well as quantitative directives for risk iden-tification and risk measurement. We are already working towards fulfilling thefuture requirements.
We are implementing a framework for managing our operational risk on a globalbasis. A Group Operational Risk Management Policy defines roles and respon-sibilities for managing and reporting operational risk. Divisional standards sup-plement this Group policy. Responsibility for operational risk managementessentially lies with our Business Divisions. We are implementing four differentsystems for the management of operational risks:– We perform operational risk “self-assessments” using our db-RiskMap tool.
This results in a specific operational risk profile (high risk potential) for busi-ness lines, service functions and the Corporate Center. In 2002 db-SAT com-plements the self-assessment approach. Focus is on business efficiency andimprovement of controls.
– We collect losses arising from operational risk events in our db-IncidentReporting System database.
– We capture and monitor qualitative and quantitative risk indicators in our tooldb-Score for transaction processing risk and information security risk.
241
Contractual FinancialObligations
Managing Our Operational Risk
Due in Due after Total
in ¤ m. 2003 2004 2005 2006 2007 2007
Long-term debt1 14,770 14,963 10,682 14,378 6,347 42,915 104,055
Capital lease obligations 153 152 147 176 148 1,461 2,237
Operating lease obligations 414 371 288 246 221 946 2,486
Total 15,337 15,486 11,117 14,800 6,716 45,322 108,778
1 Excludes ¤ 3.1 billion of trust preferred securities.

– We will automatically capture action points resulting from risk assessments ordb-Score in db-Track. Within db-Track we will monitor the progress of theoperational risk action points on an on-going basis.
These systems help to give an overview of our current operational risk profilesand to define risk management measures and priorities. We monitor the statusof framework implementation in a scorecard, which forms the basis for quarterlyreview by the Group Operational Risk Committee. As an incentive to implementthis framework, we grant certain deductions of the economic capital for opera-tional risk to the Business Divisions. The calculation of economic capital foroperational risk is based on a statistical model using external loss data with certain top down adjustments.Our Group Chief Risk Officer has appointed a Chief Risk Officer Operational Riskwith Group-wide responsibility. He is represented on the Group Risk Committeeand is Chairman of the Group Operational Risk Committee. The latter committee,whose members include the divisional Operational Risk Officers and representa-tives of Service Functions and Corporate Center such as Audit, Controlling,Human Resources, Legal, Tax and Compliance, develops and implements ourinternal guidelines for managing operational risk. The Chief Risk Officer Opera-tional Risk is head of our Operational Risk Management, with responsibility toroll-out the Operational Risk framework, i.e. policy, tools, reporting. The Opera-tional Risk Management functions of the Corporate Divisions are part of ourindependent Operational Risk Management function and report to the Chief RiskOfficer Operational Risk.We seek to minimize operational risk associated with our communication, infor-mation and settlement systems through the development of back-up systemsand emergency plans. We engage in regular employee training, operatinginstructions and inspections to help limit operational defects or mistakes. Whereappropriate, we purchase insurance against operational risks.
242

Risk Report
Regulatory Risk Reporting
The following table shows the development of our risk position, capital and cap-ital adequacy ratios for the companies we consolidate for the purposes of ourregulatory risk reporting. We calculate these figures in compliance with BISguidelines and the related guidance of the German Federal Financial SupervisoryAuthority:
Our capital adequacy measures consist of the following:
Risk Position. Risk-weighted assets relating, in particular, to default risks, andthe equivalent for our market risk position (interest rate, exchange rate, shareprice and commodity price risks). Our regulators permit us to use our internalvalue-at-risk approach to calculate the market risk position as a component ofrisk position.
Capital. The Total capital which can be used to back the risk position and is recognized for bank regulatory purposes consists of:– Core capital (Tier I): primarily share capital, reserves and hybrid capital com-
ponents, such as noncumulative trust preferred securities and equity con-tributed by silent partners.
– Supplementary capital (Tier II): primarily long-term subordinated liabilities,unrealized gains on listed securities and other inherent loss allowance.
– Tier III capital: mainly short-term subordinated liabilities and excess Tier II capital.
The capital ratio compares a bank’s risk position to its regulatory capital. Theminimum BIS total capital ratio (Tier I + Tier II + Tier III) is 8% of the risk position.The minimum BIS core capital ratio (Tier I) is 4% of the risk-weighted positionsand 2.29% of the market risk equivalent. The minimum core capital ratio for thetotal risk position therefore depends on the weighted average of risk-weightedpositions and market risk equivalent. Under BIS guidelines, the amount of sub-ordinated debt that may be included as Tier II capital is limited to 50% of Tier Icapital. Total Tier II capital is limited to 100% of Tier I capital.In 2002 our risk position decreased by ¤ 67.6 billion to ¤ 237.5 billion on Decem-ber 31, 2002. The decrease was driven by several factors, mainly the deconsoli-dation of EUROHYPO and DFS, a weaker U.S. dollar and the reduction of ourloan business.
243
Dec 31, Dec 31,in ¤ m. (except percentages) 2002 2001
Risk-weighted positions 231,262 297,063
Market risk equivalent1 6,217 8,016
Risk position 237,479 305,079
Core capital (Tier I) 22,742 24,803
Supplementary capital (Tier II) 7,120 12,255
Available Tier III capital – –
Total capital 29,862 37,058
Core capital ratio (Tier I) 9.6% 8.1%
Capital ratio (Tier I + II + III) 12.6% 12.1%
1 A multiple of our value-at-risk, calculated with a probability level of 99% and a ten-day holding period.

BIS rules and the German Banking Act require us to cover our market risk as ofDecember 31, 2002 with slightly over ¤ 497 million of regulatory capital (Tier I +II + III). We met this requirement entirely with Tier I and Tier II capital. Our U.S. GAAP based Total capital was ¤ 29.9 billion on December 31, 2002 andour core capital (Tier I) was ¤ 22.7 billion, compared to ¤ 37.1 billion and ¤ 24.8billion on December 31, 2001. Our supplementary capital (Tier II) of ¤ 7.1billion onDecember 31, 2002 amounted to 31% of our core capital. Our capital ratio was 12.6% on December 31, 2002, significantly higher than the8% minimum required by the BIS guidelines. Our core capital ratio was 9.6% inrelation to the total risk position (including market risk equivalent).
Overall Risk Position
To calculate our overall (nonregulatory) risk position, we aggregate the economiccapital figures for all types of risk. This corresponds to a conservative assump-tion that very severe losses occur simultaneously in all types of risk, i.e. the dif-ferent risk types are 100% correlated. For credit risk economic capital, cross-divisional diversification effects of the credit portfolio are separately calculatedfor the Corporate and Investment Bank Group Division, the Private Clients andAsset Management Group Division and the Corporate Investments Group Divi-sion, resulting in ¤ 7.9 billion, ¤ 1.0 billion and ¤ 0.1 billion respectively. Thesenumbers are then aggregated for all Group Divisions which again is a conserva-tive assumption, i.e. diversification benefits between Group Divisions respec-tively are not taken into account.On December 31, 2002, our economic capital totaled ¤ 20.6 billion, compared to¤ 20.9 billion as of December 31, 2001, while our BIS Tier I capital is ¤ 22.7 bil-lion. This does not include liquidity risk, the risk of our insurance companies orthe risk of the industrial holdings of DB Investor. The following table highlightsthat the year-end 2002 allocation of the total economic capital among the risktypes remained largely unchanged compared to year-end 2001:
244
Economic Capital Dec 31, Dec 31,in ¤ m. 2002 2001
Credit risk 8,942 9,064
Market risk 7,191 7,257
Operational risk 2,449 2,538
Business risk 1,978 2,026
Total 20,560 20,885

Further Information
Statement by the Board of Managing Directors
The Board of Managing Directors of Deutsche Bank AG is responsible forthe Consolidated Financial Statements. They have been prepared inaccordance with accounting principles generally accepted in the UnitedStates of America and thus fulfil the conditions of §292a German Com-mercial Code for exemption from preparation of consolidated financialstatements in accordance with German commercial law. In addition, thedisclosure requirements of the European Union are satisfied.
The responsibility for correct accounting requires an efficient internalmanagement and control system and a functioning audit apparatus.Deutsche Bank’s internal control system is based on written communica-tion of policies and procedures governing structural and proceduralorganization, enlarged risk controlling for default and market risks as wellas the segregation of duties. It covers all business transactions, assetsand records. Deutsche Bank’s audit is carried out in accordance with theextensive audit plans covering all divisions of the Group and also includ-ing compliance with the organizational terms of reference.
KPMG Deutsche Treuhand-Gesellschaft Aktiengesellschaft Wirtschafts-prüfungsgesellschaft audited the Consolidated Financial Statements inaccordance with German auditing regulations, and in supplementarycompliance with auditing standards generally accepted in the UnitedStates of America and issued an unqualified opinion. KPMG DeutscheTreuhand-Gesellschaft and the Audit Department of Deutsche Bank hadfree access to all documents needed in the course of their audits for anevaluation of the Consolidated Financial Statements and for an assess-ment of the appropriateness of the internal control system.
Frankfurt am Main, March 4, 2003Deutsche Bank AG
245
Confirmations and Management Bodies
Josef Ackermann Clemens Börsig
Tessen von Heydebreck Hermann-Josef Lamberti

Report of the Supervisory Board
At five regular meetings last year, the Supervisory Board advised theBoard of Managing Directors and monitored its management of busi-ness. The Board of Managing Directors informed the Supervisory Boardregularly, without delay and comprehensively, and presented all mattersto the Supervisory Board that required its decision.
The Supervisory Board regularly held discussions with the Board ofManaging Directors on business policies and other fundamental issuesrelating to corporate planning, management and strategy, the bank’sfinancial development and earnings situation, and the bank’s riskmanagement as well as transactions that were of significant importanceto the bank. Furthermore, current topics and decisions were also dealtwith in regular discussions between the Spokesman of the Board of Man-aging Directors and the Chairman of the Supervisory Board. Particularimportance attached to the Supervisory Board’s deliberations on thebank’s four key strategic initiatives (focus on current earnings, focus oncore businesses, improvement of capital and balance sheet management,optimization of PCAM Group Division), on the difficult national and inter-national economic and political environment, and on the enhancement ofthe bank’s Corporate Governance Principles to comply with the newGerman Corporate Governance Code and the U.S. Sarbanes-Oxley Act.This enhancement served to define more precisely the cooperationbetween the Board of Managing Directors and the Supervisory Boardand also resulted in new versions of the Terms of Reference for theChairman’s Committee and the Audit Committee. Additional informationon corporate governance is given in the Corporate Governance Report2002.
Meetings of the Supervisory Board. At its meeting on January 30,2002, the Supervisory Board discussed the development of business in2001, the key figures of the Annual Financial Statements for 2001, andthe plan for the years 2002 to 2004. Discussions were also held with theBoard of Managing Directors on the realignment of the managementstructure and the formation of the Group Executive Committee as well asthe Operating Committees and Functional Committees.
At the meeting on March 22, 2002, the Annual Financial Statements for2001 were approved and thus established. Furthermore, the resolutionproposals for the agenda of the General Meeting 2002 were approvedand the Supervisory Board was informed about risk management in theGroup.
At the Supervisory Board meeting directly following the General Meetingon May 22, 2002, Dr. Breuer was elected Chairman of the SupervisoryBoard, of the Chairman’s Committee, and of the Credit and MarketRisk Committee and Dr. Baumann was elected Chairman of the AuditCommittee.
246
Dr. Rolf-E. Breuer
Chairman of the SupervisoryBoard

Further Information 247
Confirmations and Management Bodies
On July 31, 2002, the Supervisory Board was informed of the develop-ment of business in the first half of 2002. It gave its approval to the sale ofcertain industrial shareholdings of the bank. The Board of ManagingDirectors furthermore informed the Supervisory Board about the strategicrealignment of the bank and about the outsourcing of significant parts ofthe IT infrastructure and IT services.
At the Supervisory Board’s last meeting of the year on October 30, 2002,the development of business in the first nine months was discussed. Thebank’s Corporate Governance Principles, adjusted to the German Cor-porate Governance Code, were approved along with the revised Termsof Reference for the Supervisory Board, for the Chairman’s Committeeand for the Audit Committee. Together with the Board of ManagingDirectors, the Supervisory Board resolved the wording and the issuing ofthe statement of compliance in accordance with §161 of the GermanStock Corporation Act. In addition, the bank’s human resources reporton staff development and succession planning was discussed and theresolution was taken on the increase of the bank’s share capital requiredin connection with the issue of staff shares and option rights.
All of the members of the Supervisory Board participated in more thanhalf of the Supervisory Board meetings taking place during the period oftheir membership in the year 2002.
The Committees of the Supervisory Board. The Chairman’s Committeemet five times during the reporting period. At its meetings, the Committeehandled not only issues relating to the Board of Managing Directors,but also those concerning the bank’s Corporate Governance Principles,succession planning and the process of selecting new Supervisory Boardmembers.
At its six meetings, the Credit and Market Risk Committee discussedcommitments subject to mandatory approval under German law and theArticles of Association and all major loans and loans entailing increasedrisks. Where necessary, the Committee gave its approval. Apart fromcredit, liquidity, country and market risks, the Committee also reviewedoperational risks. Furthermore, global industry portfolios were presentedand discussed at length.
The Audit Committee met three times during the period under review.Representatives of the bank’s auditor also attended its meetings. Subjectscovered were the audit and approval of the Annual Financial Statementsand Consolidated Financial Statements, the review of the quarterly finan-cial statements, relations with the auditor, the proposal for the election ofthe auditor, the auditor’s remuneration and the audit mandate, includingthe specification of certain focal points for the audit as well as thecontrol of the auditor’s independence. Furthermore, the Committee

248
extensively discussed the handling of the effects of the Sarbanes-OxleyAct on the Audit Committee’s working procedures and its relations withthe auditor. The Audit Committee had reports submitted to it regularly onthe work of Internal Audit and was able to convince itself that the auditorhad no conflicts of interest.
The Mediation Committee, established pursuant to the regulations of theCo-Determination Act, did not have to be convened in 2002.
Annual Financial Statements. Representatives of the bank’s auditorattended the Financial Statements Meetings of the Supervisory Board andof the Credit and Market Risk Committee and commented on questionsraised.
KPMG Deutsche Treuhand-Gesellschaft Aktiengesellschaft Wirtschafts-prüfungsgesellschaft, Frankfurt am Main, the auditor of the AnnualFinancial Statements elected at last year’s General Meeting, has auditedthe accounting, the Annual Financial Statements for 2002 and theManagement Report as well as the Consolidated Financial Statementswith Notes, and issued an unqualified opinion. The relevant reportsof the auditor were given to the Supervisory Board for inspection. TheSupervisory Board agreed with the results of this audit.
Today, the Supervisory Board established the Annual Financial State-ments prepared by the Board of Managing Directors and agreed to theConsolidated Financial Statements. The Supervisory Board agrees withthe proposal for the appropriation of profits.
Personnel issues. Mr. Kopper resigned from the Supervisory Board witheffect from the end of the General Meeting on May 22, 2002. The Super-visory Board thanks him for his efficient and successful leadership ofthe body during his five years as Chairman of the Supervisory Board ofDeutsche Bank AG. As his successor with effect from May 22, 2002, theGeneral Meeting elected Dr. Breuer, who left the Board of ManagingDirectors on the same day and was elected Chairman of the SupervisoryBoard at its meeting directly following the General Meeting.
With the election of Dr. Baumann as Chairman of the Audit Committee onMay 22, 2002, the Supervisory Board complied with the suggestion in theGerman Corporate Governance Code that the office of Chairman of theAudit Committee should not be filled by a former member of the Board ofManaging Directors.
With effect from January 30, 2002, Dr. Fischer, who had been a fullmember of the Board of Managing Directors since January 1, 1999,resigned from the bank at his own request. Also on January 30, 2002,Mr. Philipp left the Board of Managing Directors and on March 27, 2002,
Further Information 249
Confirmations and Management Bodies
at his own request, the bank. Mr. Fitschen requested that he be relievedof his duties as member of the Board of Managing Directors of the bankwith effect from January 30, 2002, in order to devote himself, as memberof the Group Executive Committee, to the divisions Global TransactionBanking, Global Banking Division and Global Relationship ManagementGermany, for which he is responsible. The Supervisory Board thanksall these gentlemen for their successful activity and for their valuablecontributions to the further development of the bank.
The Supervisory Board thanks the Board of Managing Directors and thebank’s employees for their great personal dedication.
Frankfurt am Main, March 21, 2003The Supervisory Board
Dr. Rolf-E. BreuerChairman

250
Supervisory Board
Hilmar Kopperuntil May 22, 2002– Chairman,Frankfurt am Main
Dr. Rolf-E. Breuerfrom May 22, 2002– Chairman,Frankfurt am Main
Heidrun Förster*– Deputy Chairperson,Deutsche Bank Privat- undGeschäftskunden AG, Berlin
Dr. rer. oec. Karl-Hermann BaumannChairman of the SupervisoryBoard of Siemens Aktien-gesellschaft, Munich
Dr. Ulrich CartellieriFrankfurt am Main
Klaus Funk*Deutsche Bank Privat- undGeschäftskunden AG, Frankfurt am Main
Gerald Herrmann*Federal Executive Secretary ofUnified Services Union, Berlin
Sabine Horn*Deutsche Bank AG, Frankfurt am Main
Sir Peter Job London
Prof. Dr. Henning Kagermann Co-Chairman and CEOof SAP AG, Walldorf/Baden
Ulrich Kaufmann*Deutsche Bank AG, Düsseldorf
Peter Kazmierczak*Deutsche Bank AG, Essen
Adolf KrachtChairman of the SupervisoryBoard of Wilhelm von Finck AG, Grasbrunn
Professor Dr.-Ing. E. h. Berthold LeibingerChairman of the Board of Management TRUMPF GmbH + Co. KG, Ditzingen
Margret Mönig-Raane*Vice President of Unified Services Union, Berlin
Dr. Michael Otto Chairman of the Board of Man-agement of Otto (GmbH & Co KG), Hamburg
Klaus Schwedler*Deutsche Bank AG, Eschborn
Tilman TodenhöferDeputy Chairman of the Board of Management of Robert Bosch GmbH, Stuttgart
Michael Freiherr Truchseß von Wetzhausen*Deutsche Bank AG, Frankfurt am Main
Lothar Wacker*Deutsche Bank AG, Cologne
Dipl.-lng. Albrecht WoesteChairman of the SupervisoryBoard and the Shareholders’Committee of Henkel KGaA, Düsseldorf
Chairman’s CommitteeHilmar Kopper until May 22, 2002– ChairmanDr. Rolf-E. Breuer from May 22, 2002– ChairmanDr. Ulrich CartellieriHeidrun Förster*Lothar Wacker*
Mediation CommitteeHilmar Kopper until May 22, 2002– ChairmanDr. Rolf-E. Breuer from May 22, 2002– ChairmanDr. Ulrich CartellieriHeidrun Förster*Ulrich Kaufmann*
Audit CommitteeHilmar Kopper until May 22, 2002– ChairmanDr. rer. oec. Karl-Hermann Baumann– Chairman from May 22, 2002Dr. Rolf-E. Breuer from May 22, 2002Dr. Ulrich CartellieriHeidrun Förster*Sabine Horn* from January 30, 2002Michael Freiherr Truchseß von Wetzhausen*
Credit and Market RiskCommitteeHilmar Kopper until May 22, 2002– ChairmanDr. Rolf-E. Breuer from May 22, 2002– ChairmanDr. rer. oec. Karl-Hermann BaumannDr. Ulrich CartellieriSir Peter Job from January 30, 2002– Substitute MemberAdolf Kracht– Substitute Member
* elected by the staff

Further Information 251
Confirmations and Management Bodies
Advisory Board
Dr. Mark Wössneruntil March 26, 2002– Chairman,Munich
Ulrich Hartmannuntil March 26, 2002– Deputy Chairman,from March 26, 2002– Chairman,Chairman of the Board of Managing Directors of E.ON AG, Düsseldorf
Werner Wenningfrom March 26, 2002– Deputy Chairman,Chairman of the Board of Managing Directors of Bayer AG, Leverkusen
Carl L. von Boehm-BezingFrankfurt am Main
Sir John Craven until March 12, 2002,London
Dr. jur. Walter DeussKarstadtQuelle AG, Essen
Michael Dobsonuntil May 5, 2002,Frankfurt am Main
Dr. Karl-Gerhard EickMember of the Board of Management ofDeutsche Telekom AG, Bonn
Dr. Michael EndresFrankfurt am Main
Dr. Karl-Ludwig KleyMember of the Executive Board of Deutsche Lufthansa AG,Cologne
Max Dietrich KleyMember of the Board of Executive Directors of BASF Aktiengesellschaft, Ludwigshafen
Dr. Jürgen KrumnowFrankfurt am Main
Georg KruppFrankfurt am Main
Francis Meruntil December 31, 2002,Ministre de l’Économie, des Finances et de l’Industrie, Paris
August OetkerGeneral Partner of Dr. August Oetker KG, Bielefeld
Eckhard PfeifferHouston
Dr. techn. h.c. Dipl.-lng. ETH Ferdinand Piëchuntil April 16, 2002,Chairman of the Supervisory Board of Volkswagen AG, Wolfsburg
Dr. Bernd Pischetsriederfrom April 16, 2002,Chairman of the Board of Management of Volkswagen AG,Wolfsburg
Dr. Wolfgang Reitzlefrom November 1, 2002,President and CEO of Linde AG, Wiesbaden
Dr. rer. pol. Michael RogowskiPresident, Federation of GermanIndustries,Chairman of the Supervisory Board of J.M.Voith AG, Heidenheim
Dr. rer. pol. Dipl.-Kfm. Gerhard RüschenBad Soden am Taunus
Dr. Ronaldo H. Schmitz Frankfurt am Main
Jürgen E. SchremppChairman of the Board of Management of DaimlerChrysler AG, Stuttgart
Dipl.-lng. Hans Peter Stihl General Partner ofSTIHL Holding AG & Co.KG, Waiblingen
Dr. Frank Trömeluntil March 26, 2002,Deputy Chairman of the Supervisory Board of DELTON AG,Bad Homburg vor der Höhe
Marcus WallenbergExecutive Vice President INVESTOR AB, Stockholm
Dr. Ulrich WeissFrankfurt am Main
Dr. Jürgen Zechuntil May 22, 2002,Cologne

252
Board of Managing Directors
Josef AckermannSpokesman from May 22, 2002
Rolf-E. BreuerSpokesman and Member of the Board of Managing Directors until May 22, 2002
Clemens Börsig
Thomas R. Fischeruntil January 30, 2002
Jürgen Fitschenuntil January 30, 2002
Tessen von Heydebreck
Hermann-Josef Lamberti
Michael Philippuntil January 30, 2002

Further Information 253
Supplementary Information
Group Five-Year RecordFigures according to U.S. GAAP
Balance Sheet in ¤ m. 2002 2001 2000 1999 19981
Total Assets 758,355 918,222 928,994 875,789 652,269
Loans, net 167,303 259,838 274,660 254,173 218,160
Liabilities 728,364 878,029 885,311 843,438 625,054
Total shareholders’ equity 29,991 40,193 43,683 32,351 27,215
Tier I risk-based capital (BIS)2 22,742 24,803 23,504 17,338 15,979
Total risk-based capital (BIS)2 29,862 37,058 39,343 35,172 29,343
Income Statement in ¤ m. 2002 2001 2000 1999 19981
Net interest revenues 7,186 8,620 7,028 7,994 6,235
Provision for loan losses 2,091 1,024 478 725 908
Commissions and fee income 10,834 10,727 11,693 7,967 5,514
Trading revenues, net 4,024 6,031 7,625 2,127 262
Other noninterest revenues 4,503 4,163 8,133 6,944 5,192
Total net revenues 24,456 28,517 34,001 24,307 16,295
Compensation and benefits 11,358 13,360 13,526 9,655 6,557
Goodwill amortization/impairment 62 871 771 486 189
Restructuring activities 583 294 125 459 289
Other noninterest expenses 8,904 12,189 12,710 11,356 8,735
Total noninterest expenses 20,907 26,714 27,132 21,956 15,770
Income before income tax expense (benefit)
and cumulative effect of accounting changes 3,549 1,803 6,869 2,351 525
Income tax expense 372 434 2,643 1,689 240
Income tax expense (benefit) from the change in effective tax rate and the reversing effect 2,817 995 (9,287) (951) –
Cumulative effect of accounting changes, net of tax 37 (207) – – –
Net income 397 167 13,513 1,613 285
Key Figures 2002 2001 2000 1999 1998
Basic earnings per share ¤ 0.64 ¤ 0.27 ¤ 22.00 ¤ 2.76 ¤ 0.54
Diluted earnings per share ¤ 0.63 ¤ 0.27 ¤ 21.72 ¤ 2.74 ¤ 0.54
Dividends paid per share in period ¤ 1.30 ¤ 1.30 ¤ 1.15 ¤ 1.12 ¤ 0.92
Return on average total shareholders’ equity (RoE)3 1.1 % 2.3 % 41.4 % – –
Adjusted return on average active shareholders’ equity4 10.2 % 7.1 % 20.1 % – –
Cost/income ratio5 78.8 % 87.6 % 76.5 % – –
Price/earnings ratio 69.68 294.07 4.12 30.56 90.31
BIS core capital ratio (Tier I)2 9.6 % 8.1% 7.8% 5.9% 6.3 %
BIS capital ratio (Tier I+ II+ III)2 12.6 % 12.1% 13.1% 12.0% 11.5 %
Employees (full-time equivalents) 77,442 86,524 89,784 87,702 70,064
1 Amounts in this column are unaudited. We have restated in euro the amounts we originally reported in Deutsche Mark, using the fixed conversion rate of DM 1.95583 per euro.2 For 2002, 2001 and 2000 on the basis of U.S. GAAP, for 1999 and 1998 on the basis of IAS.3 Net income in 2001 is adjusted for amortization of goodwill and other intangible assets.4 We calculate this adjusted measure of our return on average total shareholders’ equity to make it easier to compare us to our competitors. We refer to this adjusted measure as our “average
active equity”. However, this is not a measure of performance under U.S. GAAP and you should not compare our ratio to other companies’ ratios without considering the differences in calcu-lation of the ratios. The principal items for which we adjust our ratio are the aggregate unrealized gains and losses in our portfolio of shareholdings in publicly-listed industrial companies and the related tax effect. We include realized gains and losses and the related tax effect in “average active equity” from the time the shareholdings are sold and the related gains are employed by our businesses. In addition we adjust our average total shareholders’ equity for the effect of our paying a dividend once a year following its approval by the general shareholders’ meeting.Net income used for this calculation is adjusted for the income tax expense from the change in effective tax rate and the reversing effect, for the effect of accounting changes, and in 2001, adjusted for the amortization of goodwill and other intangible assets.
5 Total noninterest expenses (excluding amortization of goodwill and other intangible assets in 2001 and 2000) as a percentage of net interest revenues before provision for loan losses plus noninterest revenues (excluding amortization of negative goodwill in 2001).

Declaration of Backing1
254
For the following companies, Deutsche Bank AG ensures, except in thecase of political risk, that they are able to meet their contractual liabilities:
1 Companies with which a profit and loss transfer agreement exists are marked in the List of Shareholdings.
DB Investments (GB) Limited, London
Deutsche Asset Management Europe GmbH, Frankfurt am Main(formerly: Deutsche Fonds Holding GmbH)
Deutsche Asset Management International GmbH, Frankfurt am Main(formerly: Deutsche Asset Management GmbH)
Deutsche Asset ManagementInvestmentgesellschaft mbHvormals DEGEF Deutsche Gesellschaftfür Fondsverwaltung mbH,Frankfurt am Main
Deutsche Australia Limited, Melbourne
Deutsche Bank Americas Holding Corp.,New York/USA (formerly: Deutsche Bank North America Holding Corp.)
Deutsche Bank Lübeck Aktiengesellschaftvormals Handelsbank, Lübeck
Deutsche Bank Luxembourg S.A.,Luxembourg
Deutsche Bank (Malaysia) Berhad,Kuala Lumpur
Deutsche Bank Polska S.A., Warsaw
Deutsche Bank (Portugal), S.A., Lisbon(formerly: Deutsche Bank de Investimento, S.A.)
Deutsche Bank Rt., Budapest
Deutsche Bank S.A., Buenos Aires
Deutsche Bank S.A. – Banco Alemão,São Paulo
Deutsche Bank S.A./N.V., Brussels
Deutsche Bank Saar Aktiengesellschaft,Saarbrücken
Deutsche Bank, Sociedad AnónimaEspañola, Barcelona
Deutsche Bank Società per Azioni, Milan
Deutsche Bank (Suisse) S.A., Geneva
Deutsche Bank Trust Aktiengesellschaft Private Banking,Frankfurt am Main
Deutsche Futures Singapore Pte Ltd., Singapore (formerly: Deutsche Morgan Grenfell Futures Pte Ltd.)
Deutsche Morgan Grenfell Group plc, London
Deutsche Securities Limited, Hong Kong(formerly: Deutsche Morgan Grenfell Capital MarketsLimited)
Deutsche Securities Asia Limited,Hong Kong
DWS Investment GmbH, Frankfurt am Main (formerly: DWS Deutsche Gesellschaft für Wertpapiersparen mbH)
DWS Investment S.A., Luxembourg(formerly: DB Investment Management S.A.)
OOO Deutsche Bank, Moscow
Schiffshypothekenbank zu LübeckAktiengesellschaft, Hamburg

Further Information
Glossary
Adjusted return on average
active shareholders’equity
An adjusted measure to make it easier to compare us to our competitors. Theprincipal item for which we adjust ourReturn on equity is the aggregate un-realized gains and losses (including taxeffect) in our portfolio of shareholdings inpublicly-listed industrial companies. Weinclude realized gains and losses (net oftax effect) in active equity from the timethose shareholdings are sold and therelated gains are employed by our busi-nesses. � Return on average total share-holders’ equity (RoE).
Agency debt
Debt issued by U.S. government-backedmortgage corporations such as FreddieMac and Fannie Mae.
Alternative assets/investments
Direct investments in � Private equity,venture capital, mezzanine capital, realestate capital investments and invest-ments in leveraged buyout funds, venturecapital funds and � Hedge funds.
Asset-backed securities
Particular type of securitized paymentreceivables in the form of tradablesecurities. These securities are createdby the repackaging of certain financialassets (� Securitization).
Back-testing
Back-testing is used to verify the predic-tive power of the � Value-at-risk model.Hypothetical daily profits and losses arecompared with the estimates we hadforecast using the � Value-at-risk model.
Banking book
All risk positions that are not allocated tothe � Trading book.
BIS
Bank for International Settlementsdomiciled in Basel.
BIS capital ratio
Key figure for international banks expres-sing in % the ratio between their capitaland their risk-weighted position for regu-latory purposes. The minimum total capi-tal ratio to be complied with is 8% andthe minimum core capital ratio 4%.
Bookbuilding
An issuing process where the individualinvestor’s demand is matched with anissuer’s specific financing interests withregard to issue price.
Broker/brokerage
Brokers accept orders to buy and sellsecurities from banks and privateinvestors and execute them on behalf ofthe customer. For this activity, the brokerusually receives a commission.
Buyout
Purchase (in full or in part) of a companyor specific corporate activities.
Capital according to BIS
Capital recognized for regulatorypurposes according to the Basel CapitalAdequacy Accord of 1988 (last amendedin January 1996) for international banks. Total capital consists of:– core capital or Tier I capital: primarily
share capital, reserves and hybridcapital components,
– supplementary capital or Tier II capital:primarily participatory capital, long-term subordinated debt, unrealizedgains on listed securities and otherinherent loss allowances,
– Tier III capital: mainly short-term subor-dinated debt and excess Tier II capital.
Supplementary capital is limited to 100%of core capital and the amount of long-term subordinated debt that can berecognized as supplementary capital islimited to 50% of core capital.
Cash flow statement
Calculation and presentation of thecash flow generated or consumed bya company during a financial year asa result of its business, investing andfinancing activities, and reconciliation ofholdings of cash and cash equivalents(cash reserve) at the beginning and endof a financial year.
Cash management
Refers to the management of liquidassets in dollars, euro and othercurrencies for companies and financialinstitutions to optimize financialtransactions.
Clearing
The process of transmitting, reconcilingand, in some cases, confirming paymentorders.
Collateralized bond obligations (CBO)
Structured securities whose cash flowsare covered by the interest and capitalredemption payments from a bond� Portfolio. Structuring makes it possibleto redistribute the portfolio risks andrevenues. The � Rating of the securitiesdepends on the quality of the � Portfo-lio, its diversification and the respectiveseniority of the securities.
Commitment
A firm’s employees have commitmentwhen they identify with their company,its goals and values, are willing to workhard for it and prefer to stay in itsemployment.
Comprehensive income
Change of equity excluding transactionswith shareholders (e.g. dividends,issuance of shares). It consists primarilyof net income and � Other comprehen-sive income.
Confidence level
The level of probability that the lossstated by the � Value-at-risk will arise inthe respective interval.
Corporate finance
General term for capital market-related,innovative financing services to satisfyspecial consulting requirements in busi-ness with corporate customers.
Corporate trust and agency services
Services to safeguard the smoothadministration of equity and fixed-incomefinancings, sometimes known as post-IPOservices.
Cost/income ratio
In general: a ratio expressing a company’scost effectiveness which sets operatingexpenses in relation to operating income. Here: sum of noninterest expenses asa percentage of the aggregate sumof net interest revenues and noninterestrevenues.
255
Supplementary Information

Country risk
The risk that we may suffer a loss, in anygiven country, due to political and socialunrest, nationalization and expropriationof assets, government repudiation ofexternal indebtedness, exchange controlsand currency depreciation or devaluation.
Credit default swap
A credit default swap is a financial con-tract in which a third-party default risk istransferred by a lender to a counterpartywho agrees to insure the lender againstthe risk in return for a regular payment(in essence, an insurance premium).
Credit derivatives
Financial instruments with which� Credit risk connected with loans,bonds or other risk-weighted assets ormarket risk positions is transferred toparties providing collateral. This does notalter or re-establish the underlying creditrelationship of the original risk-takers(parties selling the credit risks).
Credit risk
Risk that customers may not be ableto meet their contractual payment obliga-tions. Credit risk includes default risk,country risk and settlement risk.
Custody
Custody and administration of securitiesas well as additional securities services.
Debt products
Tradable instruments representing aliability or claim with respect to assetsof one or more private or public sectorentities. The phrase also denotes abroader range of instruments includingforeign exchange and commodity con-tracts, the dynamics of which behave ina similar way to debt instruments as such.
Derivatives
Products whose value derives largelyfrom the price, price fluctuations andprice expectations of an underlyinginstrument (e.g. share, bond, foreignexchange or index). Derivatives include� Swaps, � Options and � Futures.
Earnings per share
Key figure determined according to� U.S. GAAP and expressing a com-pany’s net income in relation to theaverage number of common shares.Apart from basic earnings per share,diluted earnings per share must also bereported if the conversion and exerciseof outstanding stock options, shareawards and convertible bonds couldincrease the number of shares.
E-business/e-commerce
The total volume of all electronic dataexchange in connection with commercialactivities: information flows and trans-actions with products or services.E-commerce covers relations betweencompanies, between companies andpublic authorities and between compa-nies and private individuals. E-commerceuses various forms of data transmission(telephone, television, data networks� Internet).
Economic capital
A figure which states with a high degreeof certainty the amount of equity capitalwe need at any given time to absorbunexpected losses arising from currentexposures. It must be clearly distin-guished from reported capital andreserves.
Emerging markets
Expanding markets in developingnations, primarily financial markets.
Equity capital markets
Primarily, activities connected with acompany’s IPO or the placement of newshares. It also covers the privatization ofstate-owned companies.
Equity method
Valuation method for investments incompanies over which significantinfluence can be exercised regardingoperating and financial policies. The pro-rata share of the company's net income(loss) increases (decreases) the carryingvalue of the investment affecting netincome. Distributions decrease the carry-ing value of the investment withoutaffecting net income.
Euro commercial paper program
Instrument allowing the flexible issuanceof unsecured, short-term debt by anissuer. A program may comprise severalbond issues over a period of time.
Euro medium-term notes (MTNs)
Flexible bond programs used to issueunsecured debt instruments at differenttimes. Volumes, currencies and maturi-ties (one to ten years) can be adjustedaccording to financing needs. Euro-MTNs are issued on the Euromarketmainly in U.S. dollars; bank syndicatesguarantee the complete placement ofeach issue.
Event risk scenarios
Scenarios representing important events, e.g. large movements in interestor exchange rates.
Expected loss
Measurement of the default loss to beexpected in our loan portfolio within oneyear on the basis of historical loss data.
Exposure
The amount which the bank may lose incase of losses incurred due to risks taken,e.g. in case of a borrower’s or counter-party’s default.
Fair value
Amount at which assets or liabilitieswould be exchanged betweenknowledgeable, willing and independentcounterparties. Fair value is oftenidentical to market price.
Fund services
A number of services performed on be-half of third party fund managers, rangingfrom valuations, share registration, custo-dian bank services to accounting and riskmanagement.
256

Further Information
Futures
Forward contracts standardized withrespect to quantity, quality and deliverydate, in which an instrument traded onthe money, capital, precious metal or for-eign exchange markets is to be deliveredor taken receipt of at an agreed price ata certain future time. Cash settlement isoften stipulated for such contracts (e.g. futures based on equity indices) tomeet the obligation (instead of deliveryor receipt of securities).
General business risk
Risk arising from changes in generalbusiness conditions, such as marketenvironment, client behavior and techno-logical progress. These factors can affectour earnings if we are unable to adjustquickly to changes in them.
Global Trade Finance
Unites the bank’s entire Trade Financeand Trade and Risk Services activities.The Business Division covers our exportfinance and risk hedging business withfinancial institutions and corporateclients including multinationals, large andexpanding corporates, and public sectorcompanies.
Goodwill
The amount which the buyer of a com-pany pays, taking account of future earn-ings, over and above the � Fair value ofthe company’s individually identifiableassets and liabilities.
Hedge accounting
Balance sheet reporting of hedging rela-tionships (formation of valuation units)which are subject to certain conditions.
Hedge fund
A fund whose investors are generallyinstitutions and wealthy individuals.Hedge funds can employ strategieswhich mutual funds are not permitted touse. Examples include short selling,leveraging and � Derivatives. Since thereis a legal restriction to a maximum of100 investors in the U.S.A., the minimuminvestment is typically U.S.$ 1million.Hedge fund returns are often uncorre-lated with traditional investment returns.
IAS
(International Accounting Standards)
Accounting standards developed byinternational associations of accountants,preparers of financial statements andfinancial experts; these standards ensurecomparability of accounting and disclo-sure not just within the European Unionbut worldwide. The main objective ofsuch reporting is to present informationneeded for decision-making by a broadgroup of parties interested in financialstatements, especially investors.
Internet
The world’s biggest computer networkthat consists of numerous interlinkednetworks and individual resources. TheInternet’s main services include elec-tronic post (e-mail), the world wide web(www), search engines, file transfer (FTP)and discussion forums (Usenet/news-groups).
Intranet
An in-house electronic network that usesInternet technologies and is located inthe � Internet. It offers features such asinformation services, job offers and e-mail facilities for staff. Usually a firewallis installed between the � Internet andthe Intranet to protect the internal net-work from damage and unauthorizedaccess from the � Internet, but allowsfull access to the latter.
Investment & Financial Centers
Investment & Financial Centers are ourmodern branches where we offer privateand business clients our full range ofproducts and advisory services from onesource and under one roof.
Investment banking
Generic term for capital market-orientedbusiness. This includes primarily theissuing and trading of securities and their� Derivatives, interest and currencymanagement, � Corporate finance,M&A advisory, structured finance and� Private equity.
Investor relations
Investor relations describes the system-atic and continuous two-way communi-cation between companies and both cur-rent and potential providers of capital.Information is supplied on major corpo-rate events, financial results, businessstrategy and the capital market’s expec-tations of management. One objective ofinvestor relations activities is to ensurethat a company’s equity is appropriatelyvalued by the market.
Late stage private equity
Investments in unlisted companies whichbelong to the category of “more mature”corporate investment opportunities interms of age and positive cash flow.
Leveraged buyout
Debt-financed purchase of all or partof a company or specific activitiesof a company. Debt and redemptionpayments are financed from the acquiredcompany’s future revenues.
Liquidity risk
Risk to our earnings and capital arisingfrom the bank’s potential inability tomeet matured obligations withoutincurring unacceptably high losses.
Management buyout
Purchase of a company’s entireoutstanding shares by its management,thereby ending the company’s listing.
Mark-to-market valuation
Valuation at current market prices.Applies, for instance, to trading activities(� Trading revenues).
Market risk
Arises from the uncertainty concerningchanges in market prices and rates(including interest rates, share prices,foreign exchange rates and commodityprices), the correlations among them andtheir levels of volatility.
257
Supplementary Information
Mezzanine
Mezzanine investments consist primarilyof investments in debt securities with anequity component. The debt securitiestypically rank below the issuer’s bankdebt but senior to other debt securities,preferred stock and common equity. The equity component usually consistsof warrants.
Monte Carlo simulation
A Monte Carlo simulation is a model thatcalculates the gain or loss from a trans-action by analyzing a large number ofdifferent market scenarios (e.g.10,000).
Netting agreements
Agreements between two parties thatunder certain circumstances – e.g. insol-vency – mutual claims from outstandingbusiness can be offset against eachother. The inclusion of a legally bindingnetting agreement reduces the defaultrisk from a gross to a net amount.
Online banking
The transaction of banking business viaelectronic networks (� Internet).
Operational risk
Potential for incurring losses in relation to employees, project management,contractual specifications and their docu-mentation, technology, infrastructure fail-ure and disasters, external influences andcustomer relationships. This definitionincludes legal and regulatory risk.
Option
Right to purchase (call option) or sell (putoption) a specific asset (e.g. security orforeign exchange) from or to a counter-party (option seller) at a predeterminedprice on or before a specific future date.
OTC derivatives
Nonstandardized financial instruments(� Derivatives) not traded on a stockexchange, but directly between marketparticipants (over the counter).
Other comprehensive income
Primarily includes unrealized gains andlosses on foreign currency translationand on � Securities available for sale.These unrealized gains and losses are not included in net income but reportedin accumulated other comprehensiveincome in shareholders’ equity.
Passive asset management
This business includes funds that track avariety of financial indices worldwide.The objective of passive asset manage-ment is to create a portfolio that repli-cates the risk and total return character-istics of the relevant index while keepingthe transaction costs associated with thetrading of securities as low as possible.
Personal banking
In general: business with private individ-uals, self-employed people and smallbusinesses.Here: branch business including comple-mentary distribution channels such asself-service, � Online banking and cards. It does not include � Private banking.
Portfolio
In general: part or all of one or all cate-gories of asset (e.g. securities, loans,equity investments or real estate). Port-folios are formed primarily to diversify risk.Here: combination of similar transactions,especially in securities and/or � Deriva-tives, under price risk considerations.
Portfolio management
Management and administration of a� Portfolio of securities for a client. This can involve the continual review ofthe portfolio and, if agreed with theclient, purchases and sales.
Principal-protected fund of funds
A pooled investment vehicle that investsin private equity funds and uncondition-ally guarantees repayment of principal.
Private banking
Business with investment-oriented andhigh net worth clients.
Private equity
Equity investment in non-listed compa-nies. Examples are venture capital andbuyout funds.
Probability of default
States the expected average probabilityof counterparty default, based on a statis-tical analysis of historical defaults in our� Portfolio.
Projected unit credit method
An accrued benefit valuation method,according to SFAS 87, used to determinethe actuarial present value of an enter-prise’s defined benefit obligations andthe related current service cost. Thismethod takes into account the expectedrates of salary increases, for instance, asthe basis for future benefit increases. Therate used to discount post-employmentbenefit obligations is determined by ref-erence to market yields at the balancesheet date on high quality corporatebonds.
Quantitative investments
� Portfolios of equities, bonds as well as� Hedge funds. � Portfolios are man-aged in a systematic and regulatedframework applying fundamental invest-ment principles. The choice of invest-ment is determined by the processing oflarge data volumes for which quantitativemethods and techniques are applied.
Rating
External: standardized evaluation ofissuers’ credit standing and debt instru-ments, carried out by specializedagencies.Internal: detailed risk assessment ofevery � Exposure associated with anobligor.
Registered shares
Shares registered in a person’s name.As required under joint stock companylaw, that person is registered in the shareregister with several personal detailsand the number of shares owned. Onlythose persons entered in the share regis-ter are deemed to be shareholders of thecompany and are entitled, for instance,to exercise rights at the General Meeting.
258
Further Information
Relationship management
In general: together with product special-ists, qualified relationship managers lookafter selected corporate customers in adefined market segment. Here: a coverage approach in nationaland international business with corporatecustomers.
Repo (repurchase agreement)
An agreement to repurchase securitiessold (genuine repurchase agreementwhere the asset remains the seller’sproperty). From the buyer’s viewpoint,the transaction is a reverse repo.
Return on average total share-
holders’ equity (RoE)
In general: ratio showing the incomesituation of a company, setting profit (net income) in relation to capitalemployed. Here: net income as a percentage ofaverage capital employed over the year� Adjusted return on average activeshareholders’ equity.
Risk position according to BIS
The risk position according to � BIS ismade up of risk-weighted assets, com-prising above all the counterparty risks inthe � Banking book and the � Tradingbook, and the market risk equivalent forinterest, foreign exchange, equity andcommodity price risks.While the risk-weighted assets arecalculated on the basis of regulatorystandard methods, the market riskequivalent corresponds to 12.5 times our� Value-at-risk figure (99% � Confi-dence level and 10 days holding period),which is calculated on the basis of ourregulatorily recognized internal modelsand scaled up with a bank-specificmultiplier (at least 3).
Secondary fund of funds
A structured investment vehicle con-sisting of private equity funds availableon the secondary market.
Securities available for sale
Securities which are not held for tradingpurposes and (in case of debt securities)are not held to maturity. They arereported in the balance sheet at their� Fair value. Changes in � Fair valueare generally reported in � Other com-prehensive income in shareholders’equity. Declines in � Fair value belowtheir amortized cost that are deemed to be other than temporary and realizedgains and losses are reported in the con-solidated statement of income.
Securitization
In general: rights evidenced by securities(e.g. shares or bonds). Here: replacing loans or financing variouskinds of claims by issuing securities(such as bonds or commercial paper).
Segment information
Disclosure of a company’s assets andincome, broken down by activity (divi-sion) and geographical area (region).
Shareholder value
Management concept that focusesstrategic and operational decision-making on the steady growth of a com-pany’s value. The guiding principle is thatonly returns above the cost of capital addvalue for shareholders.
Sharia
The Qur’an is the principal source of theSharia, i.e. Islamic law. It regulatesall aspects of Muslim life. Muslims mayinvest in financial products that do notinfringe against the laws established inthe Sharia.
Strategic Equity Transactions Group
A group operated jointly by Equities andCorporate Finance. The group executesfor corporate clients transactions thathave an equity component and arestructured or strategic in nature.
Sustainability
Denotes the interplay of economy,ecology and social responsibility with theobjective of sustainably advancing thebasis for human life while preparing it forthe future.
Swaps
In general: exchange of one paymentflow for another. Interest rate swap: exchange of interestpayment flows in the same currency withdifferent terms and conditions (e.g. fixedor floating). Currency swap: exchange of interestpayment flows and principal amounts indifferent currencies.
Trading book
A bank-regulatory term for positions infinancial instruments, shares and trad-able claims held by a bank which areintended for resale in the short term tobenefit from price and interest rate fluc-tuations. This also includes business thatis closely associated with trading bookpositions (e.g. for hedging purposes).Risk positions not belonging to thetrading book are shown in the � Bankingbook.
Trading revenues
Balance of realized and unrealizedgains and losses on the positions heldin the trading portfolio and net interestrevenues on � Derivatives held fortrading purposes. Trading generallyreflects frequent buying and selling, i.e.the positions are taken with the objec-tive of generating profits on short-termdifferences in price.
Transaction services
Comprise custody, global funds services,securities lending, corporate trust andagency services, clearing, balance sheetand cash management services, tradeand payment services, structured exportfinance and international trade finance.They also include trustee services, retire-ment funds administration and portfoliomeasurement.
259
Supplementary Information

Trust preferred securities
Hybrid capital instruments characterizedby profit-related interest payments.Under banking regulations they are partof core capital if interest payments arenot accumulated in case of losses (noncumulative trust preferred securities) and if the instruments do not have astated maturity date or if they are notredeemable at the option of the holder.Otherwise they are included in supple-mentary capital (e.g. cumulative trustpreferred securities).
U.S. GAAP (United States Generally
Accepted Accounting Principles)
U.S. accounting principles drawn up bythe Financial Accounting StandardsBoard (FASB) and the American Instituteof Certified Public Accountants (AICPA).In addition, the interpretations and expla-nations furnished by the Securities andExchange Commission (SEC) are parti-cularly relevant for companies listed onthe stock exchange. As in the case of� IAS the main objective is to providedecision useful information, especially forinvestors.
Value-at-risk
Value-at-risk measures, for a given� Portfolio, the potential future loss (interms of market value) that, undernormal market conditions, will not beexceeded in a given period and with agiven � Confidence level.
Xavex Dynamic Bond Portfolio Fund™
Innovative bond investment productthrough which customers participatein an actively managed � Portfolio of more than 450 government bonds,Pfandbriefe, corporate bonds andemerging market debt instruments.
260

Impressum/Publications
Deutsche Bank Aktiengesellschaft
Taunusanlage 12
D-60262 Frankfurt am Main
Telephone: +49 69 910-00
Investor Relations:
+49 69 9 10-38080
Annual Report on the Internet:
www.deutsche-bank.com/02
Photos
Giovanni Castell, Hamburg
page 8
Robert Fischer, Munich
page 30
Andreas Pohlmann, Munich
page 246
Matthias Ziegler, Munich
pages 8, 9, 14, 18, 24, 36, 42, 48
and 52
Forward-looking statements
contain risks
This report contains forward-looking
statements. Forward-looking statements
are statements that are not historical
facts; they include statements about our
beliefs and expectations. Any statement
in this report that states our intentions,
beliefs, expectations or predictions (and
the assumptions underlying them) is a
forward-looking statement. These state-
ments are based on plans, estimates and
projections as they are currently available
to the management of Deutsche Bank.
Forward-looking statements therefore
speak only as of the date they are made,
and we undertake no obligation to
update publicly any of them in light of
new information or future events.
By their very nature, forward-looking
statements involve risks and uncertain-
ties. A number of important factors could
therefore cause actual results to differ
materially from those contained in any
forward-looking statement. Such factors
include the conditions in the financial
markets in Germany, in Europe, in the
United States and elsewhere from which
we derive a substantial portion of our
trading revenues, potential defaults of
borrowers or trading counterparties,
the implementation of our restructuring
including the envisaged reduction in
headcount, the reliability of our risk
management policies, procedures and
methods, and other risks referenced in
our filings with the U.S. Securities and
Exchange Commission. Such factors are
described in detail in our SEC Form 20-F
of March 27, 2003 on pages 9 through12
under the heading “Risk Factors”. Copies
of this document are available upon
request or can be downloaded from
www.deutsche-bank.com/ir.
We shall be happy to send you the
following publications relating to the
financial statements:
Results 2002 – Annual Report of
Deutsche Bank Group (U.S. GAAP)
(German, English and French;
Spanish – as Short Summary)
Form 20-F (English)
Annual Financial Statements
and Management Report of
Deutsche Bank AG for 2002
(German, English, French)
List of mandates 2002
(German/English)
List of shareholdings 2002
(German/English)
List of Advisory Council members 2002
(German)
Corporate Governance – Report 2002
and Principles
(German, English)
Corporate Cultural Affairs –
Report 2002
(German, English; from June 2003)
How to order:
– by e-mail to [email protected]
– on the Internet at
www.deutsche-bank.com/02
– by fax to +49 69 95009529
– by phone to +49 69 95009530
– by post from:
Deutsche Bank AG
Leser-Service-PKS
D-60262 Frankfurt am Main
Germany
261

Financial Calendar for 2003/2004
April 30, 2003 Interim Report as at March 31, 2003
June 10, 2003 General Meeting in the
Festhalle Frankfurt am Main (Exhibition Center)
June 11, 2003 Dividend payment
July 31, 2003 Interim Report as at June 30, 2003
October 30, 2003 Interim Report as at September 30, 2003
February 5, 2004 Publication of figures for the 2003 financial year
April 30, 2004 Interim Report as at March 31, 2004
June 2, 2004 General Meeting in the
Festhalle Frankfurt am Main (Exhibition Center)
June 3, 2004 Dividend payment
July 30, 2004 Interim Report as at June 30, 2004
October 29, 2004 Interim Report as at September 30, 2004
003 83304 02 · 3/03