annual results june 2002 15 august 2002. results summary $ million 20012002 % change revenue...
TRANSCRIPT

Annual ResultsAnnual Results
June 2002June 2002
15 August 200215 August 2002
Annual ResultsAnnual Results
June 2002June 2002
15 August 200215 August 2002

Results SummaryResults Summary
$ million$ million 20012001 20022002 % Change% Change
RevenueRevenue 300.4300.4 344.6344.6 15%15%
Operating ExpensesOperating Expenses 224.7224.7 236.4236.4 5%5%
EBITDAEBITDA 75.775.7 108.2108.2 43%43%
Depn & AmortDepn & Amort 95.495.4 113.0113.0 18%18%
EBITEBIT (19.7)(19.7) (4.8)(4.8) (76%)(76%)
InterestInterest 21.321.3 26.726.7 25%25%
OtherOther 1.31.3 (1.3)(1.3) (200%)(200%)
Net Loss after Net Loss after TaxTax (42.3)(42.3) (30.2)(30.2) (29%)(29%)

Subscriber GrowthSubscriber Growth
‘‘000000 20012001 20022002 % Change% Change
UHF ResidentialUHF Residential 159.8159.8 136.3136.3 (15%)(15%)
DBS ResidentialDBS Residential 264.2264.2 284.3284.3 8%8%
DBS WholesaleDBS Wholesale -- 75.475.4 --
CommercialCommercial 6.46.4 7.37.3 14%14%
Total SubscribersTotal Subscribers 430.4430.4 503.2503.2 17%17%

FullFull Year Subscribers Year Subscribers
0
100,000
200,000
300,000
400,000
500,000
1991
1992
1993
1994
1995
1996
1997
1998
1999
2000
2001
2002
UHF Satellite Wholesale
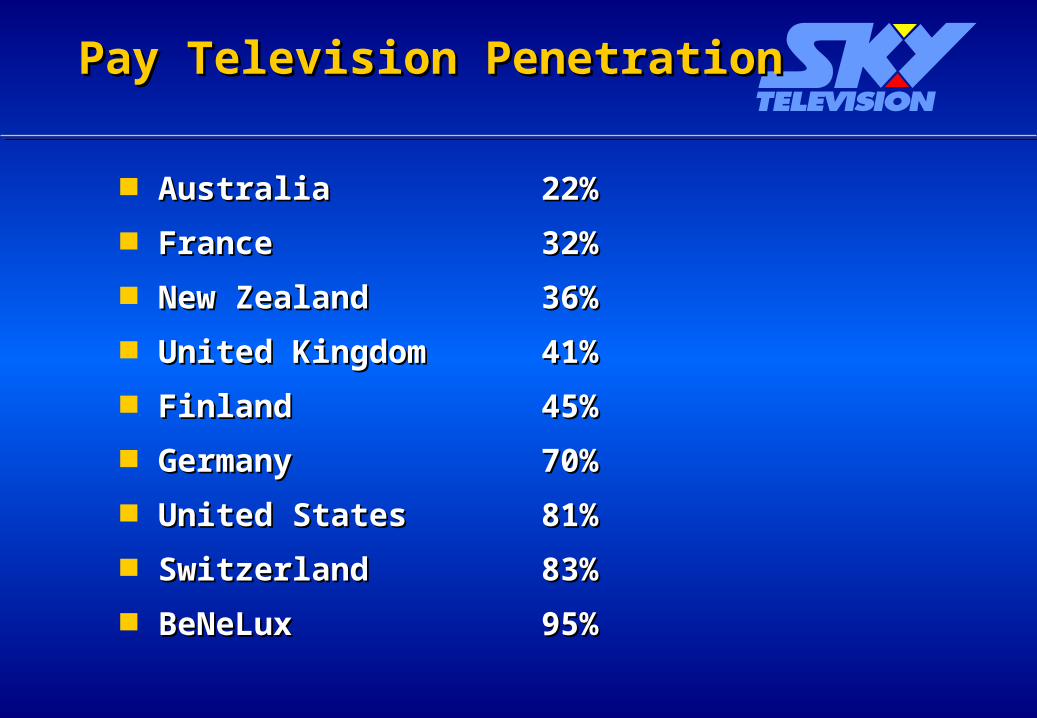
Pay Television PenetrationPay Television Penetration
AustraliaAustralia 22%22%
FranceFrance 32%32%
New ZealandNew Zealand 36%36%
United KingdomUnited Kingdom 41%41%
FinlandFinland 45%45%
GermanyGermany 70%70%
United StatesUnited States 81%81%
SwitzerlandSwitzerland 83%83%
BeNeLuxBeNeLux 95%95%

Moving Annual Moving Annual Net ChurnNet Churn
10%12%14%16%18%20%22%24%26%28%30%32%
Dec-00
Feb-01
Apr-01
Jun-01
Aug-01
Oct-01
Dec-01
Feb-02
Apr-02
Jun-02
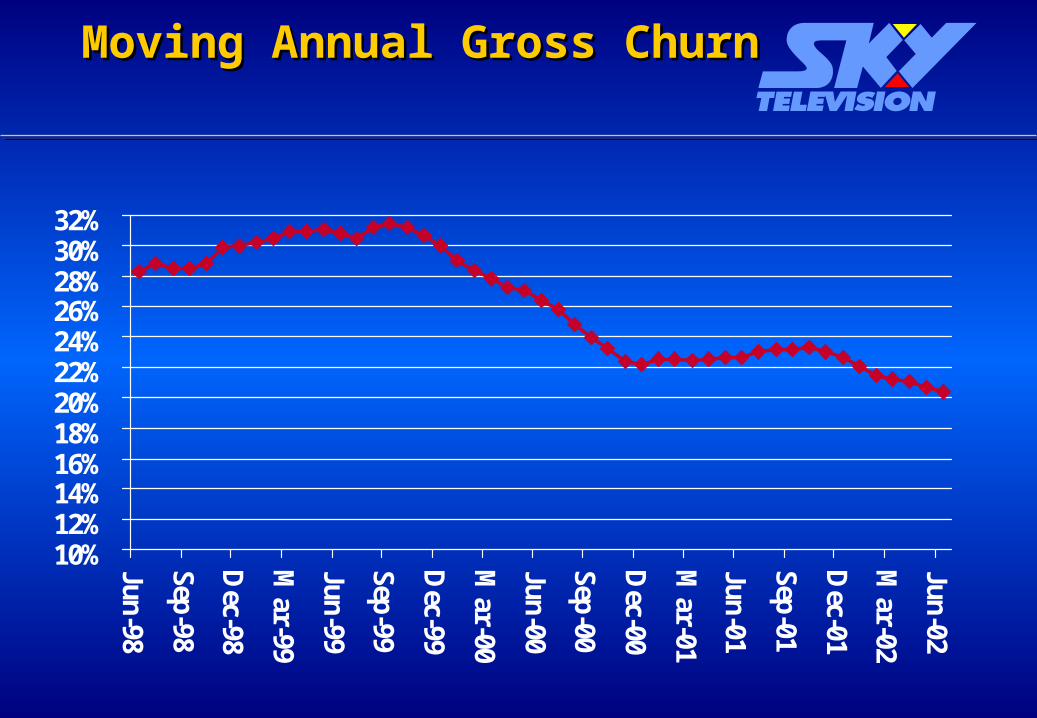
Moving Annual Moving Annual Gross ChurnGross Churn
10%12%14%16%18%20%22%24%26%28%30%32%
Jun-98
Sep-98
Dec-98
Mar-99
Jun-99
Sep-99
Dec-99
Mar-00
Jun-00
Sep-00
Dec-00
Mar-01
Jun-01
Sep-01
Dec-01
Mar-02
Jun-02

Total RevenueTotal Revenue
$164$188 $236
$263$300
$345
$0
$50
$100
$150
$200
$250
$300
$350
NZ
$ in
mil
lion
s
1997 1998 1999 2000 2001 2002Year End 30 June
CAGR 16%
CAGR 16%

Average Revenue per Unit (ARPU)Average Revenue per Unit (ARPU)
$48.47
$50.51
$47.00
$47.50
$48.00
$48.50
$49.00
$49.50
$50.00
$50.50
$51.00
NZ$
Total
2001 2002

Average Revenue per Unit (ARPU)Average Revenue per Unit (ARPU)
$54.35$55.46
$41.42$40.94
$18.43
$5.00
$15.00
$25.00
$35.00
$45.00
$55.00
NZ$
Satellite UHF Cable
2001 2002

Advertising RevenueAdvertising Revenue
$5.8
$8.6 $10.7$11.6 $12.6
$16.5
$0
$2
$4
$6
$8
$10
$12
$14
$16
$18
NZ
$ in
mil
lion
s
1997 1998 1999 2000 2001 2002Year End 30 June
CAGR 22%
CAGR 22%

Programming CostsProgramming Costsas a percentage of revenueas a percentage of revenue
42%
46%
43%
49%50%
48%
36%
38%
40%
42%
44%
46%
48%
50%
52%
% o
f Pro
gram
min
g
1997 1998 1999 2000 2001 2002
Year End 30 June

EBITDAEBITDA
$50.4 $48.3
$73.7$74.1
$75.7
$108.2
$0.0
$20.0
$40.0
$60.0
$80.0
$100.0
$120.0
NZ
$ in
mill
ions
1997 1998 1999 2000 2001 2002
Year End 30 June
CAGR 16%
CAGR 16%

Capital Expenditure Capital Expenditure (excluding Transponders)(excluding Transponders)
$37.4
$13.7
$36.5
$16.9
$10.4$97.9
$13.5
$3.3
$93.6
$6.8$2.9
$130.7
$11.4$11.2
$85.7
$2.0
$20.2
$0
$20
$40
$60
$80
$100
$120
$140
$160
$NZ
(m
illi
ons)
1997 1998 1999 2000 2001 2002Year End 30 June
Decoders and Installation Digital Expansion Other

Net Profit/(Loss)Net Profit/(Loss)
-$9.3
$6.1$3.2
-$27.1
-$42.3
-$30.2
-$45.0
-$40.0
-$35.0
-$30.0
-$25.0
-$20.0
-$15.0
-$10.0
-$5.0
$0.0
$5.0
$10.0
NZ
$ in
mill
ions
1997 1998 1999 2000 2001 2002
Year End 30 June

Second Half ComparisonSecond Half Comparison
$ million$ million 22ndnd Half Half 0101
22ndnd Half Half 0202
% Change% Change
RevenueRevenue 155.9155.9 177.8177.8 14%14%
Operating ExpensesOperating Expenses 116.6116.6 121.7121.7 4%4%
EBITDAEBITDA 39.339.3 56.156.1 43%43%
Depn & AmortDepn & Amort 50.450.4 58.758.7 17%17%
EBITEBIT (11.1)(11.1) (2.6)(2.6) (77%)(77%)
InterestInterest 11.111.1 14.214.2 28%28%
OtherOther 0.60.6 0.20.2 (67%)(67%)
Net Loss after Net Loss after TaxTax (22.8)(22.8) (17.0)(17.0) (25%)(25%)

2002 Operating Cash Flow2002 Operating Cash Flow
$ million$ million 20012001 20022002 % Change% Change
Net Loss after TaxNet Loss after Tax (42.3)(42.3) (30.2)(30.2) (29%)(29%)ADDADD
Depn & AmortDepn & Amort 95.495.4 113.0113.0 18%18%
Loss on Football KingzLoss on Football Kingz 0.00.0 2.02.0 0%0%
Working Cap Dec/(Inc)Working Cap Dec/(Inc) (12.4)(12.4) (10.7)(10.7) (14%)(14%)
OtherOther 3.23.2 2.92.9 (34%)(34%)
Net Operating Cash Net Operating Cash FlowFlow 43.943.9 77.077.0 75%75%

Free Cash FlowFree Cash Flow
$ million$ million 20012001 20022002 % Change% Change
Net Operating Cash Net Operating Cash FlowFlow 43.943.9 77.077.0 75%75%
Net Investing Cash Net Investing Cash FlowsFlows (140.7)(140.7) (114.2)(114.2) (19%)(19%)
Free Cash FlowFree Cash Flow (96.8)(96.8) (37.2)(37.2) (62%)(62%)

Impact of Football KingzImpact of Football Kingz
$ million$ million
As As ReportedReported
Adjusted Adjusted for Kingzfor Kingz
Net Loss after TaxNet Loss after Tax (30.2)(30.2) (25.7)(25.7)
Net Operating Cash FlowNet Operating Cash Flow 77.077.0 78.878.8
$m$m
Kingz After Tax LossKingz After Tax Loss 1.81.8
Loss on DisposalLoss on Disposal 2.02.0
Goodwill AmortisedGoodwill Amortised 0.70.7
TotalTotal 4.54.5

FundingFunding
$111m of Capital Notes raised October 2001 @ $111m of Capital Notes raised October 2001 @ 9.3%. Election date October 20069.3%. Election date October 2006
Bank Facility $225m, drawn to $157m. Margin is Bank Facility $225m, drawn to $157m. Margin is 50bp50bp
Bank Facility repayable MarchBank Facility repayable March 20042004

TaxTax
Tax losses carried forward of $110mTax losses carried forward of $110m
Tax Asset not recognisedTax Asset not recognised
Approximately $58m of losses to be offset by INLApproximately $58m of losses to be offset by INL
INL to repay cash to SKY when tax is due INL to repay cash to SKY when tax is due
ie $58mie $58m x 33% = $19.1mx 33% = $19.1m

Foreign Currency HedgingForeign Currency Hedging
84% hedged for 2002/03 $US commitments 84% hedged for 2002/03 $US commitments @ .4343@ .4343
20% hedged for 2003/04 $US commitments@ .434220% hedged for 2003/04 $US commitments@ .4342
88% hedged for 2002/03 $Aud commitments 88% hedged for 2002/03 $Aud commitments @[email protected]
17% hedged for 2003/04 $Aud commitments 17% hedged for 2003/04 $Aud commitments @[email protected]

Expense AnalysisExpense Analysis
$ million$ million 20012001 20022002 % Change% Change
ProgrammingProgramming 151.5151.5 166.6166.6 10%10%
Subscriber ManagementSubscriber Management 9.39.3 12.712.7 37%37%
TransmissionTransmission 17.517.5 6.96.9 (61%)(61%)
Selling, General & Selling, General & AdministrationAdministration 43.643.6 43.443.4 (0.5%)(0.5%)
Depreciation & AmortisationDepreciation & Amortisation 94.694.6 112.3112.3 19%19%
Football KingzFootball Kingz 4.84.8 6.06.0 25%25%
Total Operating ExpensesTotal Operating Expenses 321.3321.3 347.9347.9 8%8%

Capital Expenditure AnalysisCapital Expenditure Analysis
$ million$ million 20012001 20022002 % Change% Change
Transponder LeaseTransponder Lease -- 17.517.5 100%100%
Subscriber EquipmentSubscriber Equipment 130.7130.7 85.785.7 (34%)(34%)
Digital ExpansionDigital Expansion 11.411.4 2.02.0 (82%)(82%)
Interactive ApplicationsInteractive Applications 2.02.0 3.03.0 50%50%
Right of renewalRight of renewal 4.54.5 10.710.7 138%138%
OtherOther 5.35.3 4.54.5 (15%)(15%)
Total Capital ExpenditureTotal Capital Expenditure 153.3153.3 123.4123.4 (20%)(20%)
Subscriber Acquisition Cost Subscriber Acquisition Cost (DBS)(DBS) $815$815 $680$680 (17%)(17%)

Industry Strategic ConsolidationIndustry Strategic Consolidation
TVNZ on SKY Digital PlatformTVNZ on SKY Digital Platform
TelstraClear wholesale distribution agreementTelstraClear wholesale distribution agreement SKY re-sold on TCL networkSKY re-sold on TCL network SKY exclusive procurer of TCL programmingSKY exclusive procurer of TCL programming 7 year term7 year term
Telecom Telecom Expires March 2003Expires March 2003

2002 Key Messages2002 Key Messages
Net loss reduced by 29% to $30mNet loss reduced by 29% to $30m
Operating cash flow up 75% to $77mOperating cash flow up 75% to $77m
Negative free cash flow reduced by $60m to $37mNegative free cash flow reduced by $60m to $37m
Subscriber numbers up 17% to 503k.Subscriber numbers up 17% to 503k.
ARPU up 4% to $50.51, DBS ARPU up 2% to $55.46ARPU up 4% to $50.51, DBS ARPU up 2% to $55.46
Churn down 16% to 11.7% (Net) Churn down 16% to 11.7% (Net)
Subscriber acquisition costs reduced by 17% to Subscriber acquisition costs reduced by 17% to $680$680


