results 2 - mcda assessment tools for sustainability ... · results 2 - mcda assessment tools for...
TRANSCRIPT

Results 2 - MCDA
Assessment tools for sustainability monitoring
of bioeconomy networks
Jakob Hildebrandt, M.Sc. in International Material Flow Management

Contents
BACKGROUND
GOALS
METHODS
RESULTS
CONCLUSIONS07.06.2017 2
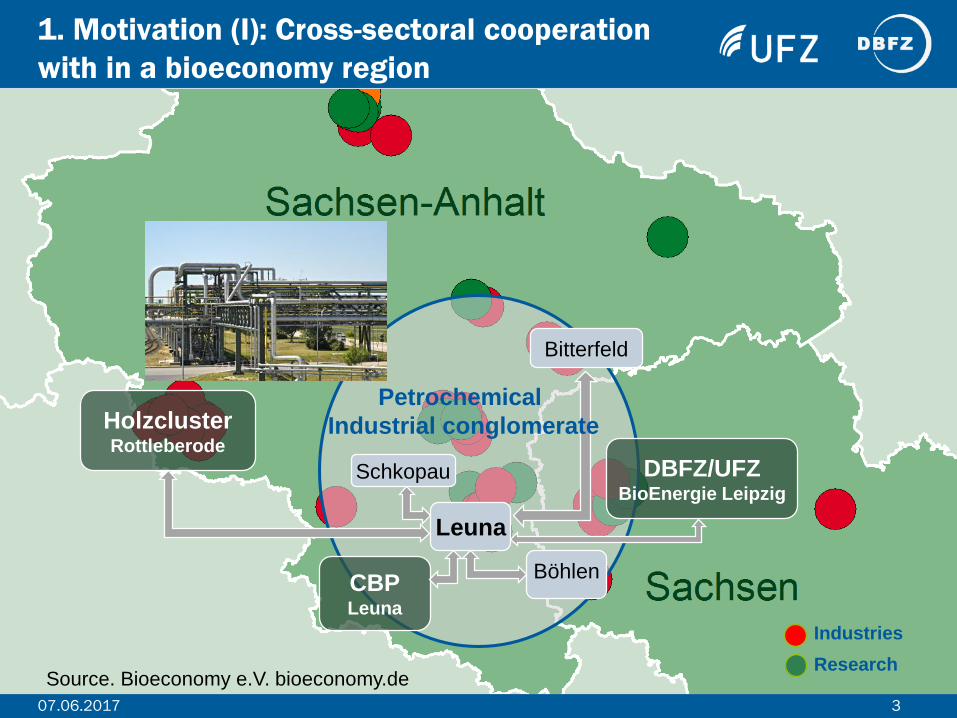
1. Motivation (I): Cross-sectoral cooperation
with in a bioeconomy region
Industries
Research
Leuna
Böhlen
Schkopau
Bitterfeld
CBPLeuna
HolzclusterRottleberode
DBFZ/UFZBioEnergie Leipzig
Petrochemical
Industrial conglomerate
Source. Bioeconomy e.V. bioeconomy.de
07.06.2017 3

TG 5:
Management
of the
BioEconomy
TG 2: Production of base
chemicals from non-food
biomass
TG 3: Polymers,
materials und products
from biomass
TG 1: Production and material utilization of non-food biomass (wood
production, logistics and manufacturing; innovative timber
construction)
TG 4: Energetic utilization and optimization in the context of the
overall cascading value chain
Flows:
EthyleneHydrogenAromats....
Residue streams
Para
met
ers,
met
ho
ds,
op
tim
izat
ion
Residue streams
Energy Energy
Material flows: Wood, Residues
Flows: e.g. Biophenol derivates
wood fibre
Energetic optimization of processes
TG 6:
Education
for the
BioEconomy
Source: Cluster BioEconomy
1. Motivation (II): Integration of energy and
material flows along value chains
07.06.2017 4

Product group 1: Engineered wood products
Product group 2 : Wood-based platform chemicals and polymers
Products:
Laminated veneer lumber
Glulam timber
Cross-laminated timber
Wood fibre boards
Products:
Lignin-based Foams
Lignin-based Resins
Cellulose-based Olephines
Other bio-based polymers (e.g. PLA)
Products:
Composite materials (structural elements)
Wood-Plastic-Composites (non-structural elements
Product group 3 : Wood-based composites
1. Motivation (III): Levering sustainability potentials
of bio-based products before entering the market
07.06.2017 5
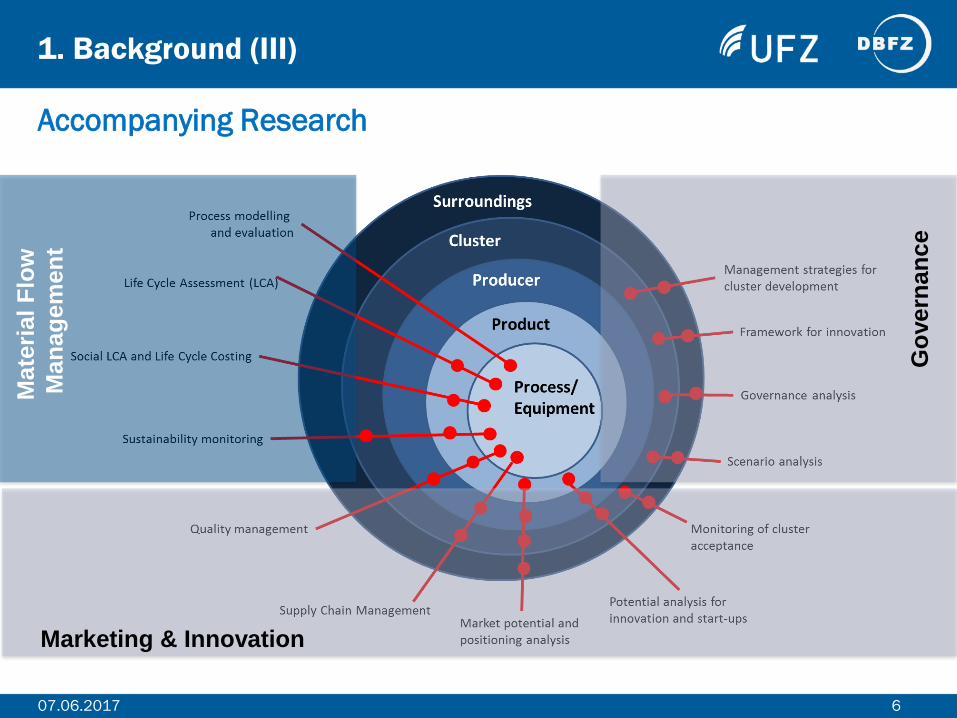
Accompanying Research
Ma
teri
al
Flo
w
Man
ag
em
en
t1. Background (III)
Go
vern
an
ce
Marketing & Innovation
07.06.2017 6

Operationalization:
• Collecting Life Cycle inventory data for socio-economic and
environmental assessment of selected production chains
• Early identification of chances & risks (Hotspots) for
development towards sustainable production and
consumption
Goal:
• Development of a monitoring system for portfolio management
with selected key performance indicators
• Establishment of a sustainability index for value-added
networks within a bioeconomy region
• Identification of trade-offs between
decision alternatives
Sustainability monitoring
∑ Sustainability-Index
2. Goal and Scope (I):
07.06.2017 7

SUMINISTRO – Sustainability monitoring Index for
assessing regional bio-based industry networks
Bezama, A.; Siebert, A.; Hildebrandt, J.; Thrän, D. (2016). Integration of LCA, LCC and social LCA for assessing a bioeconomy Region: In book: Life Cycle Approaches
to Sustainable Regional Development, Chapter: 37, Publisher: Taylor & Francis Ltd, Editors: Stefania Massari, Guido Sonnemann, Fritz Balkau, pp.7 (258 -264)
07.06.2017 8
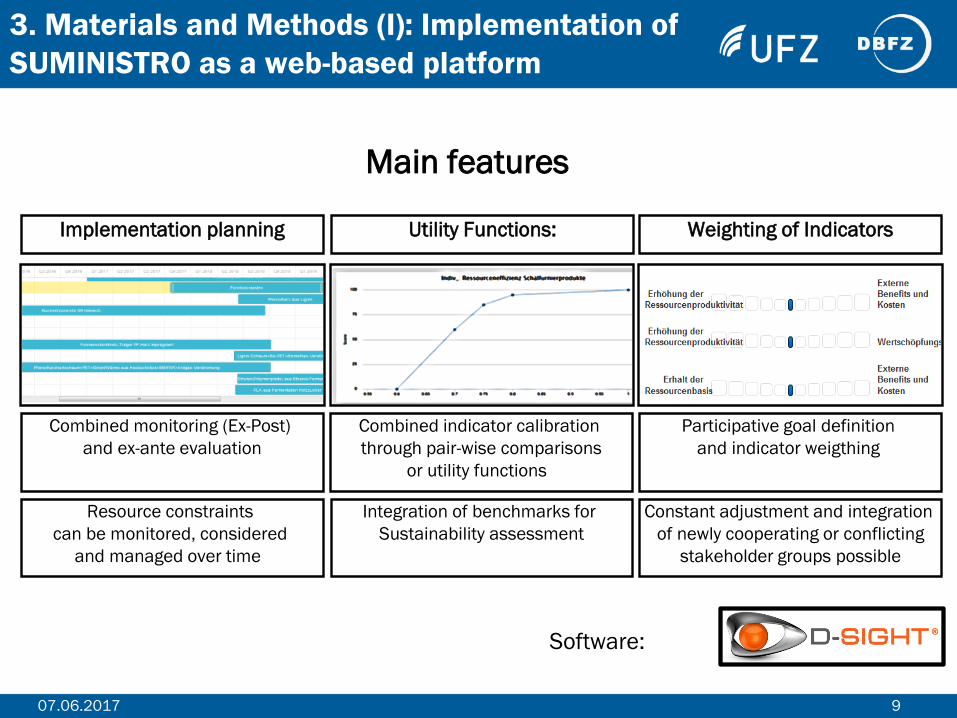
3. Materials and Methods (I): Implementation of
SUMINISTRO as a web-based platform
Software:
Page
9
Main features
Implementation planning Utility Functions:
Combined monitoring (Ex-Post)
and ex-ante evaluation
Integration of benchmarks for
Sustainability assessment
Combined indicator calibration
through pair-wise comparisons
or utility functions
Resource constraints
can be monitored, considered
and managed over time
Constant adjustment and integration
of newly cooperating or conflicting
stakeholder groups possible
Weighting of Indicators
Participative goal definition
and indicator weigthing
07.06.2017 9

3. Materials and Methods (II): Case study system
of the Spitzencluster Region (TRL 3 – 9 )
Upscaling of R&D-processes and established production systems
07.06.2017 10

3. Materials and Methods (III): Representative product
basket case (TRL 7 - 9)
630.000 t
abs.dry/a
97.000 t/a
181.500 t/a
62.000 t/a
40.000 t/a
80.000 t/a
22.500 t/a
4000 t/a
7.500 t/a
Input:
Output:
07.06.2017 11

Economic
benchmarks
Socio-econ. data
Spec. process inventoriesEnv. product benchmarks
Env. benchmarks of production
sites
Techn. process benchmarks
Techn.-econ.
data
Forestry
potentials &
sustainability
3. Materials and Methods (IV): Data sources
along value chains and aggregation levels
07.06.2017 12
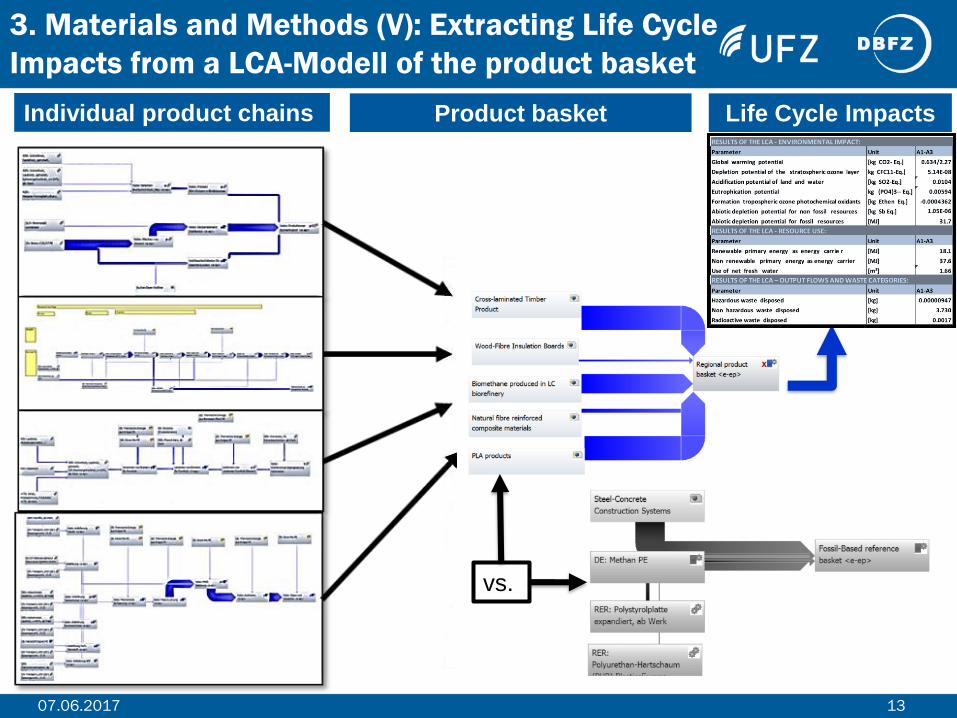
3. Materials and Methods (V): Extracting Life Cycle
Impacts from a LCA-Modell of the product basket
Life Cycle ImpactsIndividual product chains Product basket
07.06.2017 13
vs.
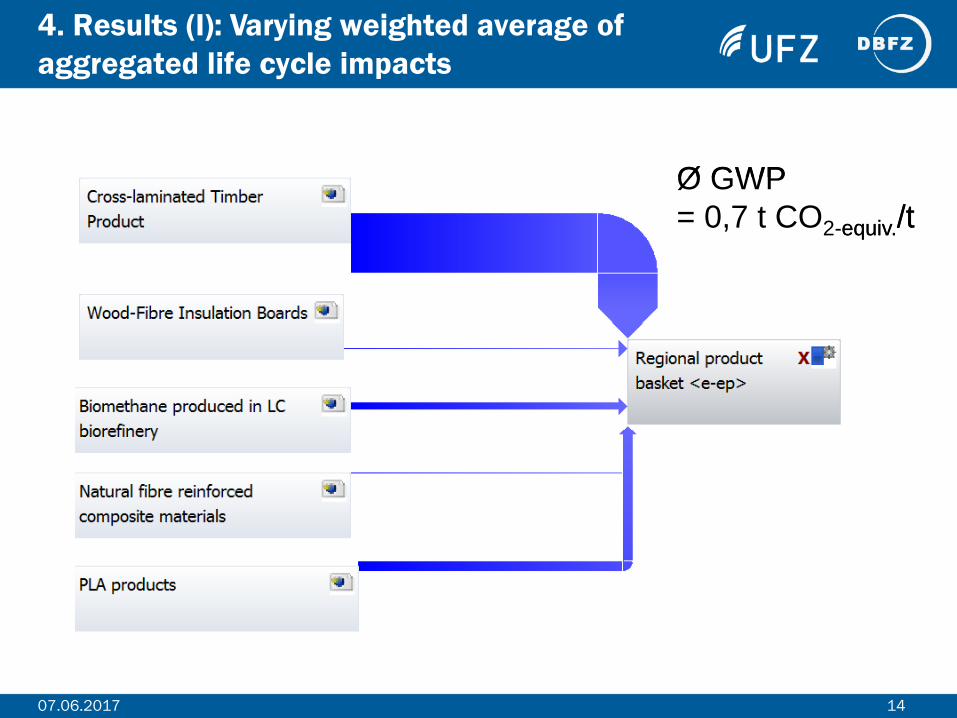
Ø GWP
= 1,2 t CO2-equiv./t
1407.06.2017
Ø GWP
= 0,7 t CO2-equiv./t
4. Results (I): Varying weighted average of
aggregated life cycle impacts

1507.06.2017
4. Results (II): Comparative LCA of the
regional product basket
-1,5 -1 -0,5 0 0,5 1 1,5
ADP elements
ODP, catalytic
EP
TETP
POCP
AP
FAETP
HTTP
GWP 100 a
ADP fossil
MAETP
Relative advantage of the regional bio-based basket in comparison of CML 2013 Impacts
ADP elements: Abiotic depletion of elements [kg Sb-equiv.]
EP: Eutrophication potential [kg Phosphat-equiv.]
TETP: Terrestrial ecotoxicity potential [kg DCB-equiv.]
POCP: Photochemical ozone creation potential [kg Ethen-equiv.]
AP: Acidification potential [kg SO2-equiv.]
HTTP: Human toxicity potential [kg DCB-equiv.]
GWP 100 a: Global warming potential [kg CO2-equiv.]
ADP fossil: Abiotic depletion of fossils [MJ]
MAETP: Marine aquatic ecotoxicity [kg DCB-equiv.]
FAETP: Freshwater aquatic ecotoxicity potential [kg DCB-equiv.]

1607.06.2017
4.Results (III): Comparing cumulated resource
use over time, decoupling and limits to growth
Use of Natural Gas
Substituting Natural Gas
with biogenic heat
Saw logs and veneer logs
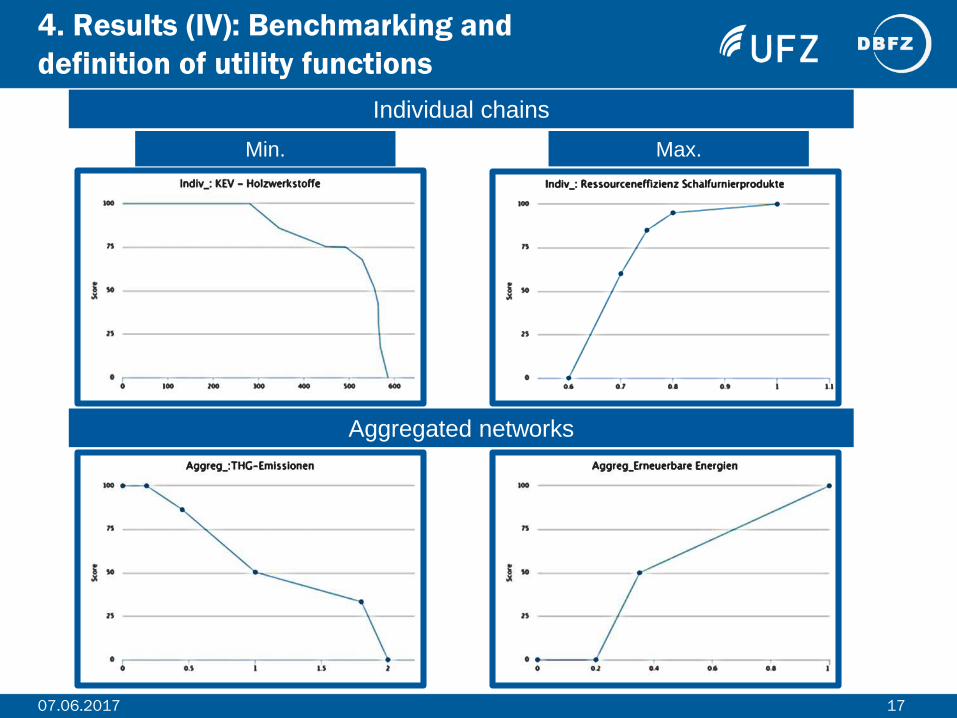
4. Results (IV): Benchmarking and
definition of utility functions
Individual chains
Min. Max.
Aggregated networks
07.06.2017 17

4. Results (V): Keeping indicators and
product baskets on track of the radar
680 kg CO2-equiv./t
68 % of Biomass-Input
less 5 %of Input
> 40 % Energetic
recovery
> 55 % self-sufficeint
heat supply
high demand resins
and natural gas
unclear
benefit of
Hydrolysis
Lignin
07.06.2017 18

5. Conclusions (I): Capabilities of the
monitoring tool
Single production systems
can be evaluated as well as
aggregated multi-product
systems.
Aggregation of
sustainability
metrics for
biorefinery concepts
and sLCA was
realized and
embedded into
assessment
scenarios.
Resource flows
can be traced
and allocated
to projects
over time.
Specifying an
“ideal “ path
towards more
sustainable
regional resource
conversion and
tracking progress
in achieving it.
07.06.2017 19
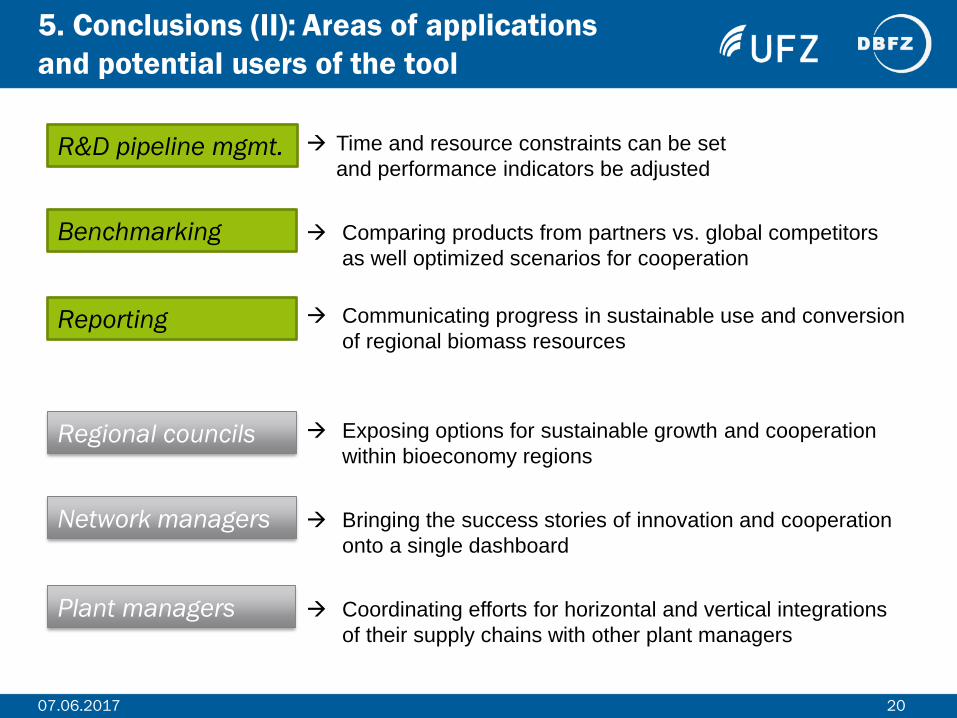
5. Conclusions (II): Areas of applications
and potential users of the tool
R&D pipeline mgmt.
Benchmarking
Reporting
Regional councils
Network managers
Plant managers
Time and resource constraints can be set
and performance indicators be adjusted
x Comparing products from partners vs. global competitors
as well optimized scenarios for cooperation
Communicating progress in sustainable use and conversion
of regional biomass resources
X Exposing options for sustainable growth and cooperation
within bioeconomy regionsX
Bringing the success stories of innovation and cooperation
onto a single dashboard
X
Coordinating efforts for horizontal and vertical integrations
of their supply chains with other plant managers
07.06.2017 20

Jakob Hildebrandt
Working Group „Bioeconomy and Biomass Resources“
Department of Bioenergy