resulting from wood storage and wood treatment facilities for electrici
TRANSCRIPT

DETERMINATION OF POLYCYCLIC AROMATIC HYDROCARBONS (PAHs) RESULTING FROM WOOD STORAGE AND WOOD TREATMENT FACILITIES FOR
ELECTRICITY TRANSMISSION IN SWAZILAND
by
CONSTANCE STHEMBILE VAN ZUYDAM
submitted in fulfilment of the requirements for the degree of
MASTER OF SCIENCE
in the subject
ENVIRONMENTAL SCIENCE
at the
UNIVERSITY OF SOUTH AFRICA
SUPERVISOR: MR K F MEARNS JOINT SUPERVISOR: DR J M THWALA
JUNE 2007

DECLARATION
I, Constance van Zuydam, hereby declare that Determination of Polycyclic Aromatic
Hydrocarbons (PAHs) resulting from wood storage and wood treatment facilities for
electricity transmission in Swaziland is my own work and that all the sources that I
have used or quoted have been indicated and acknowledged by means of complete
references. The thesis has not been submitted or will not be submitted to a university
or any institution for the award of a degree.
Signed (Author) Date _
Signed (Supervisor) Date

ii
ABSTRACT
A study was conducted in two sites: one at an electricity storage facility belonging to
the Swaziland Electricity Board (SEB) and the other at a facility that belongs to its
treated pole supplier, the Thonkwane wood creosote treatment plant. The drainage
system of these sites leads to surface waters in rivers. This is a cause of concern
since creosote contains polycyclic aromatic hydrocarbons (PAHs), which are listed
as priority pollutants by the US Environmental Protection Agency. They have toxic,
mutagenic and carcinogenic effects and as a result they pose a threat to human life
and the environment. No previous studies have been done on PAHs in Swaziland.
The main objective of this study was to determine the impact of the SEB storage
facility and the creosote treatment plant by investigating the extent of PAHs in
surrounding environments (soil, sediments and surface waters).
Preliminary studies were undertaken on the storage facility and the creosote
treatment plant. No PAHs were detected from the pole storage facility; therefore the
creosote wood treatment facility was selected as the ideal site at which to conduct
the research. Soil samples were collected from depths 15 cm and 60 cm at points
around the creosote plant, including effluent discharge points. The samples were
extracted by solid-phase micro extraction (SPME) and analysed by GC/MS. The
GC/MS, incorporating a solid phase micro extraction step, provided detection limits
ranging from 0.12 µg/g to 20.08 µg/g. The pollution patterns in the study site were
assessed using cluster analysis and principal component analysis.
Most of the 16 US EPA-listed priority pollutants were detected from the creosote
wood treatment facility. PAHs such as anthracene, fluorene, naphthalene and
fluoranthene were dominant in all the sampling sites. The compounds occurred in
very high concentrations (0.64, 0.46, 0.27 and 0.26 mg/kg respectively). These
compounds are found in pure creosote as determined in the sample taken from the
Thonkwane creosote tank site. The highest concentration of PAHs was observed in
the soil samples taken next to the road site.

iii
The concentrations of the identified PAHs were above the acceptable minimal level
allowed in soil by the US EPA and Swaziland Environment Authority (SEA). The
levels of the PAHs are also above the recommended US EPA limit in soil, which is
0.1 mg/kg. The results indicated that significant soil pollution was taking place in
some of the sampling sites.
The top layer (0 – 15 cm) contained many PAHs at high levels whilst the 60 cm layer
had a lower number of PAHs which were also in low concentrations. This provided
an indication that there is no downward movement of PAHs from the surface layer to
underground layers. The potential exists for contamination of surface waters when
there is runoff from the project area. This is a cause of concern, since both the
creosote treatment plant and areas outside the facility are contaminated. Therefore,
the site has to be cleaned up, preferably by using a phytoremediation technique.

iv
ACKNOWLEDGEMENTS
I would like to thank God for making this dream come true.
Many people have contributed to the successful completion of this work. Special
thanks to my Supervisor Mr. K F Mearns and Joint supervisor Dr. J M Thwala for
their guidance, support, motivation, stimulating feedback and critical questions.
Special thanks to Mr. Robert Mnisi (Uniswa) for his assistance throughout the work.
Several other people have also contributed in the outcome of this work. These
include Mrs Belinda Hickman from Protechnik Laboratories, Mr Leonard Dlamini of
the Forensic Department in the Swaziland Royal Police.
Finally, I would like to thank my husband Ian and son Kian for all their support and
the fact that they were always there. Many thanks to Kian for his understanding, and
the joy and laughter he brings to my life.
May the Almighty bless you all.

v
ABBREVIATIONS AND ACRONYMS
CSIR Council for Scientific and Industrial Research
EPA Environmental Protection Agency
GC Gas Chromatography
HPLC High Performance Liquid Chromatography
IARC International Agency for Research on Cancer
ISO International Standard Organisation
MFO Mixed function oxidises
PCA Principal Component Analysis
PAH Polyaromatic hydrocarbons or (polycyclic aromatic hydrocarbons)
PCB Polychlorinated biphenyl
PIDS Photo-Ionisation Detectors
SAPP Southern African Power Pool
SEA Swaziland Environment Authority
SEB Swaziland Electricity Board
SFE Supercritical Fluid Extraction
SPME Solid phase Micro Extraction
STEM Short-Term Energy Market
WHO World Health Organisation

vi
TABLE OF CONTENTS
Declaration ..................................................................................................................i Abstract ...................................................................................................................... ii Acknowledgements.................................................................................................... iv Abbreviations and Acronyms ......................................................................................v Table of contents .......................................................................................................vi List of figures ............................................................................................................. ix List of tables ...............................................................................................................x List of plates ...............................................................................................................x
Chapter 1 Background ........................................................................... 1 1.1 Introduction.................................................................................................. 1
1.2 Problem statement ...................................................................................... 4
1.3 Justification for the study............................................................................. 5
1.4 Study area ................................................................................................... 9
1.4.1 Study area 1, Matsapha Central Stores (wood storage facility).......... 10
1.4.2 Study area 2, Thonkwane (wood treatment facility). .......................... 12
1.5 Hypotheses ............................................................................................... 15
1.5.1 Hypothesis 1 ...................................................................................... 15
1.5.2 Hypothesis 2 ...................................................................................... 15
1.6 Aims and objectives .................................................................................. 16
1.6.1 Aims of the study................................................................................ 16
1.6.2 Objectives of the study ....................................................................... 16
1.7 Chapter outline .......................................................................................... 16
Chapter 2 Literature Review................................................................ 18 2.1 Introduction................................................................................................ 18
2.2 Theoretical studies .................................................................................... 18
2.2.1 Identity and properties of creosote ..................................................... 18
2.2.2 Properties of creosote ........................................................................ 20
2.2.3 Uses of creosote ................................................................................ 22
2.2.4 Creosote treatment process of wood.................................................. 22
2.3 Polycyclic Aromatic Hydrocarbons (PAHs)................................................ 23

vii
2.3.1 Sources and pathways of PAHs......................................................... 23
2.3.2 Formation of PAHs............................................................................. 25
2.3.3 Properties and environmental fate of PAHs ....................................... 27
2.3.4 PAHs from a creosote treatment facility ............................................. 29
2.3.5 PAHs in soil ........................................................................................ 29
2.3.6 Chemical characteristics of monitored PAHs ..................................... 30
2.3.7 Toxicological effects ........................................................................... 31
2.3.8 Human exposure and risks of PAHs................................................... 32
2.4 International standards.............................................................................. 33
2.5 Soil remediation techniques ...................................................................... 33
2.5.1 Engineering approaches .................................................................... 35
2.5.2 Process-based techniques ................................................................. 35
2.5.3 Chemical processes ........................................................................... 38
2.6 Methods survey ......................................................................................... 40
2.6.1 Sample pretreatment.......................................................................... 40
2.6.2 Extraction ........................................................................................... 40
2.6.3 Clean-up............................................................................................. 45
2.6.4 Instrumental analysis.......................................................................... 46
Chapter 3 Methodology ....................................................................... 48 3.1 Introduction................................................................................................ 48
3.2 Preliminary Survey .................................................................................... 48
3.3 Sampling ................................................................................................... 49
3.3.1 Matsapha site..................................................................................... 49
3.3.2 Thonkwane creosote wood treatment plant........................................ 50
3.4 Laboratory ................................................................................................. 52
3.4.1 Sample extraction using SPME.......................................................... 52
3.5 Analyses.................................................................................................... 53
Chapter 4 Results and Discussion ...................................................... 55 4.1 Introduction................................................................................................ 55
4.2 Calibration and chromatograms ................................................................ 55

viii
4.2.1 Method detection limit ........................................................................ 58
4.2.2 Instrument performance ..................................................................... 59
4.3 Sample concentrations.............................................................................. 60
4.3.1 Preliminary survey results. ................................................................. 60
4.3.2 Futher investigation of PAHs at the Thonkwane creosote wood
treatment facility ............................................................................................... 62
4.3.3 Depth.................................................................................................. 69
4.4 Chemometric data analyses ...................................................................... 71
Chapter 5 Conclusion .......................................................................... 81 5.1 Introduction................................................................................................ 81
5.2 Total PAHs and pollutant profile ................................................................ 81
5.3 Regulations ............................................................................................... 83
5.4 Depth/leachability of PAHs ........................................................................ 83
5.5 Recommendations and mitigation ............................................................. 85
5.5.1 Mitigation measures for health and safety in the study areas............. 85
5.5.2 The best environmental practices ...................................................... 86
5.5.3 Mitigation for contaminated soil .......................................................... 87
5.6 Conclusion and recommendations ........................................................... 88
References .............................................................................................................. 90 Appendices............................................................................................................ 104

ix
LIST OF FIGURES
Figure 1.1 Location of power stations and transmission and distribution lines in
Swaziland__________________________________________________________3
Figure 1.2 Study Areas: Matsapha CSO (wood storage facility) and Thonkwane
(wood treatment facility) _______________________________________________9
Figure 1.3 Wood storage site in Matsapha CSO ___________________________10
Figure 1.4 Creosote wood treatment facility at Thonkwane___________________13
Figure 2.1 Pathways of PAHs in the environment __________________________25
Figure 2.2 The chemical structure of common PAHs________________________26
Figure 3.1 Sampling points at the Thonkwane wood treatment facility __________50
Figure 4.1 An example of a calibration curve prepared for naphthalene _________56
Figure 4.2 Chromatogram for reference standard with 10 ppm ________________57
Figure 4.3 Chromatogram showing concentration of various PAHs in sample H1 _57
Figure 4.4 PAH levels from various sampling sites at Thonkwane _____________62
Figure 4.5. Graphical representation of PAHs next to effluent ponds (A) ________64
Figure 4.6. Graphical representation of PAHs detected below effluent trench (B) _65
Figure 4.7 Graphical representation of PAHs detected below the effluent tank (C) 66
Figure 4.8. Graphical representation of PAHs detected on the pine logs (D) _____67
Figure 4.9. Graphical representation of PAHs at the road (E) _________________68
Figure 4.10 Graphical representation of PAHs in 15cm and 60cm layers ________71
Figure 4.11 A variable tree diagram for the study area ______________________73
Figure 4.12 PCA plot projecting the variables along the PC1, PC2 plane ________74
Figure 4.13. PCA plot projecting the variables along the PC1, PC3 plane _______75
Figure 4.14 PCA plot projecting the sites along the PC1, PC2 plane ___________76
Figure 4.15 PCA plot projecting the sites along the PC1, PC3 plane ___________78
Figure 4.16 PCA plot projecting the sites along the PC1, PC3 plane ___________79
Figure 5.1 Recommended mitigation measures in the Thonkwane creosote wood
treatment facility ____________________________________________________87

x
LIST OF TABLES
Table 2.1 Polycyclic Aromatic Hydrocarbons (PAHs) constituents in creosote _____ 19
Table 2.2 Chemical characteristics of PAHs _______________________________ 20
Table 4.1 Retention times of various PAHs ________________________________ 58
Table 4.2 Detection limits for 16 PAHs ___________________________________ 59
Table 4.3 PAH concentration in creosote plant _____________________________ 61
Table 4.4 Concentration of PAHs from various sampling points (in mg/kg)________ 64
Table 4.5 Variable to variable linear dependence correlation matrix _____________ 72
LIST OF PLATES
Plate 1 Photos taken in Matsapha CSO and Lusushwana River _______________ 12
Plate 2 Creosote wood treatment facility at Thonkwane ______________________ 14
Plate 3 Photos showing sampling sites at Thonkwane _______________________ 51

1
CHAPTER 1
BACKGROUND
1.1 Introduction
Electricity is the vital ingredient for modernisation and economic development in
the world today. However, the production and transmission of electricity comes at
a cost, namely the various factors that have an impact on the environment.
These factors are of particular relevance to this study.
The Swaziland Electricity Board (SEB) is a parastatal under the Ministry of
Natural Resources and Energy. It is the sole supplier of electricity in Swaziland
and its main customers are the agricultural, manufacturing and residential
sectors. It contributes about 30% to Swaziland’s Gross Domestic Product (GDP).
In 2006 the revenue from this industry was E394 206 million (Emalangeni) and
855 MG/h units were sold (SEB, 2006).
The mission of this company is to supply cheap, reliable and adequate electricity
to its customers. To achieve this mission SEB has engaged in various projects
such as the 400 kVA line from South Africa to Maputo, 132 kV Integration project
and the rural electrification project funded by the Republic of China (SEB, 2004).
The ongoing implementation of these projects has increased the customer base
by 11.32%. The distribution network has been increased by 6 183 km.
All the above projects are aimed at improving the quality of supply of electricity
and ensuring security of supply in Swaziland. The projects are also aimed at
expanding the SEB network so that 36% of the residents in the country are
connected to the electricity supply grid. The Swaziland Electricity Board is also
involved in ongoing projects such as system reinforcement and maintenance of
2
infrastructure. These projects ensure that electricity is supplied efficiently and
adequately at all times (SEB, 2003).
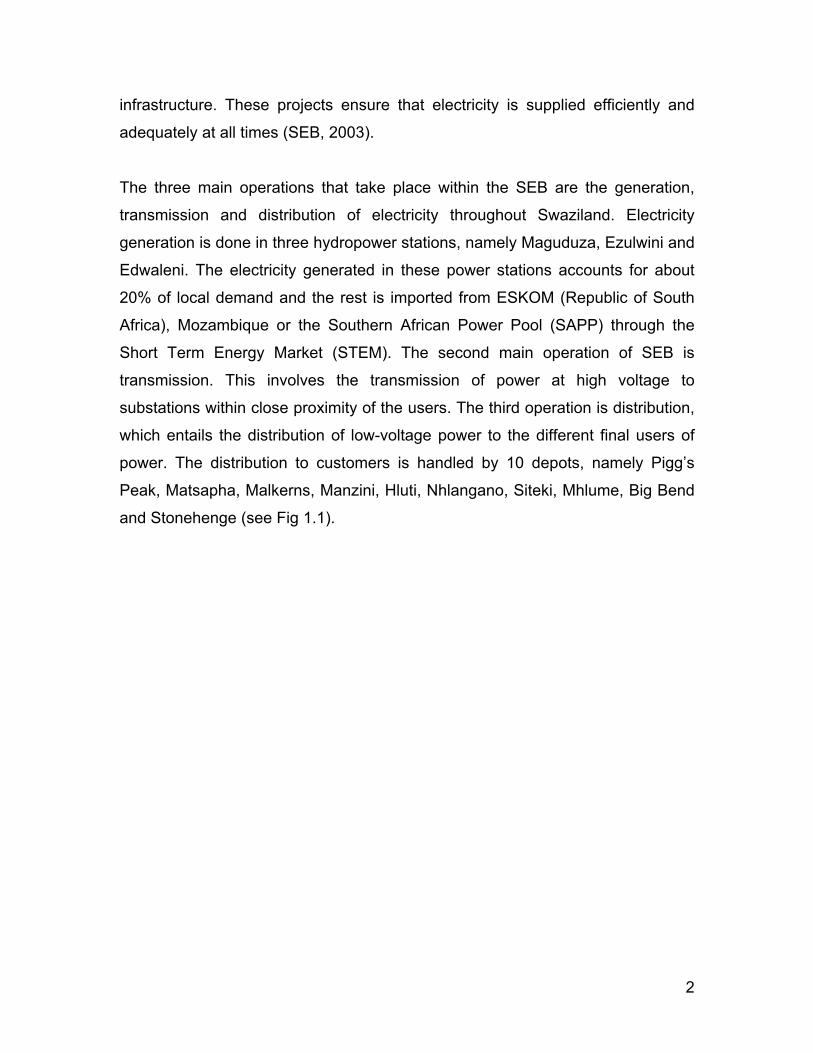
The three main operations that take place within the SEB are the generation,
transmission and distribution of electricity throughout Swaziland. Electricity
generation is done in three hydropower stations, namely Maguduza, Ezulwini and
Edwaleni. The electricity generated in these power stations accounts for about
20% of local demand and the rest is imported from ESKOM (Republic of South
Africa), Mozambique or the Southern African Power Pool (SAPP) through the
Short Term Energy Market (STEM). The second main operation of SEB is
transmission. This involves the transmission of power at high voltage to
substations within close proximity of the users. The third operation is distribution,
which entails the distribution of low-voltage power to the different final users of
power. The distribution to customers is handled by 10 depots, namely Pigg’s
Peak, Matsapha, Malkerns, Manzini, Hluti, Nhlangano, Siteki, Mhlume, Big Bend
and Stonehenge (see Fig 1.1).

3
Figure 1.1 Location of power stations and transmission and distribution lines in
Swaziland (Source: SEB Drawing Office)

4
In the Environmental Policy of the SEB the company commits itself to
Protect the environment by adhering to all existing laws and regulations on the environment, and creating environmental awareness amongst its employees, contractors, suppliers and customers.
The policy principles state that the SEB will employ processes and technologies
that seek to prevent and/or minimise negative environmental interactions on
SEB’s resources and infrastructure. It will also disseminate a sound
environmental culture and practices amongst its employees, contractors,
suppliers and customers, and implement systems such as ISO 14001. In
implementing ISO 14001 one of the requirements is pollution prevention. One of
the impacts that the SEB has on the environment is polycyclic aromatic
hydrocarbons (PAH) pollution resulting from the treatment of transmission and
distribution poles with creosote in order to extend the lifespan of the poles.
The Swaziland Electricity Board obtains transmission and distribution poles from
a company called Swazi Timber and Planks (Pty) Ltd, also known as Thonkwane.
Once these poles are purchased from Swazi Timber and Planks (Pty) Ltd they
are transported to the SEB Central Stores in Matsapha where they are stored
before being used in electricity distribution and transmission projects across
Swaziland.
1.2 Problem statement
Electricity transmission and distribution facilities are known to create a number of
environmental impacts. The main impacts result from poles and transformers that
are used in transmission and distribution. These contain chemical substances
that pollute the environment. One of these substances, creosote, is applied to
poles that will be used as transmission and distribution poles in order to increase
their lifespan. Creosote is the primary concern of this study. Creosote is made up
of hundreds of different organic constituents of which many are known to be

5
highly toxic to the environment. Usually creosote is constituted of around 85%
polycyclic aromatic hydrocarbons (PAHs) and between 5 and 15% monocyclic
aromatic hydrocarbons, phenolic compounds, and N-, S-, and O-heterocyclics
(Mueller, Chapman & Pritchard, 1997; Bestari, Robinson & Steel, 1998). PAHs
are a group of hazardous organic substances detrimental to public health due to
their carcinogenic properties and bioaccumulation. Thus they are a concern to
the environment (April, Sims, Sims & Matthews, 1990).
The U.S. Environmental Protection Agency (US EPA) lists 16 PAHs as priority
pollutants (Mihelcic & Luthy, 1988). These chemical properties have led to
legislative restrictions on their release in the environment. PAH pollutants are
present in the air, water, and soil and have been a world-wide concern for a
considerable period of time. The determination of the concentration of PAH-
contaminated sites is therefore of critical concern. Thus the primary interest of
the study lies in the determination of the PAH levels in the soil and surface
waters surrounding the Matsapha Central Stores of the SEB as well as the Swazi
Timber and Planks (Pty) Ltd creosote treatment plant in Thonkwane.
1.3 Justification for the study
The literature review process revealed that no study has been done in Swaziland
to investigate the impact of electricity transmission and distribution facilities on
soils and water. Most studies undertaken in the Southern African regions have
not focused on Swaziland specifically. These studies focused on the impact of
transmission lines on the environmental health aspects and general ecology. This
study adds a new dimension to previous investigations, as it focuses on the likely
impact of the operations in the transmission and distribution of electricity (i.e. the
storage facility) on soils and water. The main focus of this study will be on PAHs
derived from a storage facility for electricity transmission poles as well as from
the wood treatment plant.

6
There has been a growing concern within SEB about environment and pollution.
This has put pressure on the industry to control the environmental impact of its
activities. The Swaziland Electricity Board is striving towards the implementation
and accreditation of ISO 14001. The company needs to have a sound
environmental management system, both to demonstrate their responsibility to
society and to meet the applicable legislative requirements for environmental
control. ISO 14001 has proven to be a useful tool to evolve from maintaining
regulatory compliance to a position of improved productivity and enhanced
competitive advantage. The ISO 14001 Environmental Management System
standard requires an organisation to establish an environmental policy and
objectives for the prevention of pollution, commitment to legal compliance and
continual improvement. The industry standard provided guidelines that aim to
integrate the need for environmental protection and prevention of pollution with
socioeconomic needs.
When implementing ISO 14001, the first step is to identify the impacts and
aspects associated with the organisation. When doing that one has to take into
account the inputs and outputs of the organisation. In addition, one of the ISO
14001 requirements is pollution prevention from processes, resources, and so
forth. Therefore it was necessary for study to be undertaken to ensure that both
the SEB and its suppliers comply with environmental regulations, which is a
prerequisite for the SEB to attain ISO 14001 accreditation.
Thonkwane, the supplier of creosote-treated wooden poles, would also have to
adhere to ISO 14001 standards. According to Neilson (1998), the creosote used
in the treatment of wood contains PAHs that are considered priority pollutants.
These are a large group of compounds consisting of molecules containing two or
more fused benzene rings. PAHs, also known as polyarenes, are widespread
environmental contaminants of anthropogenic or natural origin. Owing to their
ubiquitous distribution, PAHs are frequently detected in soils and sediments and
are thus of ongoing interest in the field of analytical chemistry.

7
According to Edlund (2001), PAHs are regarded as priority pollutants. They
exhibit properties such as persistence, bioaccumulation, mutagenicity,
carcinogenicity, toxicity and potential for long-range environmental transportation
to a certain extent. Low-molecular-weight PAHs (containing less than four
benzene rings) are acutely toxic, some having effects on the reproduction and
mortality rates of aquatic animals, and most high-molecular-weight PAHs
(containing four or more benzene rings) are mutagenic and carcinogenic
(Boonchan, Britz & Stanley, 2000).
Edlund (2001) further states that due to the low vapour pressure, some PAHs are
present at ambient temperatures in air, both as gases and associated with
particles. However, most PAH compounds are predominantly found in the
particulate phase under ambient conditions, attached to dust or fine particles,
especially particles with high carbon content, such as coal and soot. The extent
of the association of PAH compounds with particulate matter varies with
individual compounds, the nature of the particles (e.g. size, surface area,
chemical properties etc) and, most importantly, with temperature. The heavier
PAHs, such as benzo(a)pyrene, are almost totally adsorbed onto particles, and
the lighter, such as phenanthrene, are found most exclusively in the gas phase.
The semi-volatile property of PAHs makes them highly mobile throughout the
environment via deposition and re-volatilisation between air, soil and water
bodies. Therefore, a proportion of PAHs released into the atmosphere is
deposited in the oceans and/or undergoes long-range transport making it both a
local and a global environmental problem.
Due to their hydrophobic nature, most PAHs in aquatic and terrestrial ecosystems
bind to particulates in soil and sediments, rendering them less available for
biological uptake, and they also bioaccumulate in food chains (Boonchan et al.,
2000). The bioaccumulating properties of PAHs result in a magnification of the
substances in the trophic levels of food webs. The longer the food chain, the

8
more is accumulated at the top, leaving top-predators especially sensitive. These
properties lead to increased concern for the toxic effects that they can exert,
even at extremely low levels in the ambient environment. Effects include cancers,
birth defects, disruption of the immune system, nervous system damages, which
disrupt the hormone systems of humans and wildlife and cause subtle
undesirable effects in infants.
A number of countries have legislation to regulate persistent organic pollutants
(POPs). The domestic regulatory arrangements in many countries could not
adequately control POPs due to their transboundary nature. This therefore
became a concern for many nations. As a global instrument for POPs regulation,
the Stockholm Convention on Persistent Organic Pollutants (POPs) was signed
in May 2001 by 127 countries. This treaty seeks to globally eliminate or strongly
restrict the production and use of intentionally produced POPs and the continuing
minimisation and, where feasible, the elimination of unintentionally produced
POPs. Currently, 12 substances are regulated by the convention, and the work
on finding new candidate chemicals to the convention has started. One group of
substances in focus is polycyclic aromatic hydrocarbons (PAHs). Thus since
Swaziland is party to this convention, it is necessary to conduct a study to
provide baseline data estimating the amount of PAHs released by the
impregnated wood source. This data will be used to determine if the treated
wooden poles pose a threat to the environment.
Other conventions interrelated to the Stockholm Convention are the Basel
Convention and the Rotterdam Convention. The Basel Convention strictly
regulates the trans-boundary movements of hazardous wastes and provides
obligations to its parties to ensure that such wastes are managed and disposed
of in an environmentally sound manner, whilst the Rotterdam Convention enables
the world to monitor and control very dangerous substances (UNEP, 2002).
Since Swaziland is a signatory of all three conventions, it has to adhere to the
requirements of the three conventions. The PAHs of concern in this study are

9
listed as hazardous substances in the conventions; therefore this study would
also be an indication of whether the country is in conformance with these
conventions.
1.4 Study area
This study was conducted in two study areas, Matsapha CSO and the
Thonkwane wood treatment plant. Figure1.2 indicates the general orientation of
the study sites in Swaziland.
Figure 1.2 Study areas: Matsapha CSO (wood storage facility) and Thonkwane.
(wood treatment facility)
Thonkwane site
Matsapha CSO site
Study areas

10
1.4.1 Study area 1, Matsapha Central Stores (wood storage facility)
The Matsapha Central Stores office or CSO is situated in the Matsapha industrial
site (Figure 1.3). This storage area has been in use since 1998. The stores
consist of three platforms where materials are stored. Platform one is a bare soil
area used for the storage of creosote treated poles. Approximately 20 000 to 30
000 poles are stored here at any one time throughout the year. This platform has
an unlined drain at its lowest section, which drains to a concrete v-drain along an
access road. The second platform is used for the storage of transformers,
conductors, insulators and other construction material. The third platform consists
of offices, general stores and a wash bay. The three platforms discharge their
runoff into the concrete drain bordering the study site. This drain finally
discharges into the Lusushwana River.
Matsapha CSO
Lusushwana River
N
Scale: 1: 7500
Figure 1.3 Wood storage site in Matsapha CSO
11
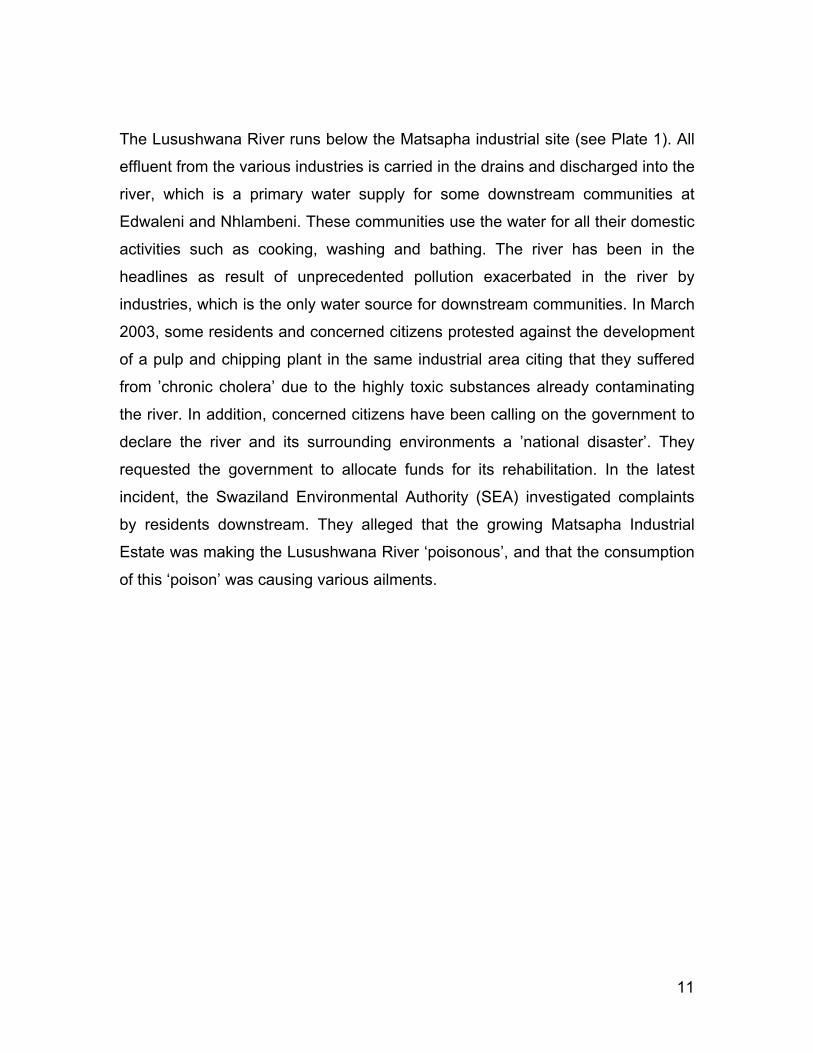
The Lusushwana River runs below the Matsapha industrial site (see Plate 1). All
effluent from the various industries is carried in the drains and discharged into the
river, which is a primary water supply for some downstream communities at
Edwaleni and Nhlambeni. These communities use the water for all their domestic
activities such as cooking, washing and bathing. The river has been in the
headlines as result of unprecedented pollution exacerbated in the river by
industries, which is the only water source for downstream communities. In March
2003, some residents and concerned citizens protested against the development
of a pulp and chipping plant in the same industrial area citing that they suffered
from ’chronic cholera’ due to the highly toxic substances already contaminating
the river. In addition, concerned citizens have been calling on the government to
declare the river and its surrounding environments a ’national disaster’. They
requested the government to allocate funds for its rehabilitation. In the latest
incident, the Swaziland Environmental Authority (SEA) investigated complaints
by residents downstream. They alleged that the growing Matsapha Industrial
Estate was making the Lusushwana River ‘poisonous’, and that the consumption
of this ‘poison’ was causing various ailments.

12
Plate 1 Photos taken in Matsapha CSO and Lusushwana River
a) Treated wood pole storage area in Matsapha Central Stores
b) Leaking transformer oil drums c) Used transformer storage site
1.4.2 Study area 2, Thonkwane (wood treatment facility)
The second study area was Swazi Timber and Planks (Pty) Ltd, which is located
in the Highveld of Swaziland, approximately 8 km from Mbabane city. This site is
also known as Thonkwane (Figure 1.4 and Plate 2). The treatment plant is
situated on a flat area, which is surrounded by gentle slopes that are planted with
plantations. On the western side of the treatment plant various species of weeds
are now occurring as a result of a fire that devastated the pine plantation two
years ago. The treatment plant consists of a pretreatment plant, a treatment
plant, an effluent storage site and an effluent disposal area. The final effluent is
discharged into a waterway that drains down slope.

13
?
Thonkwane Creosote Wood Treatment Plant
N
Scale 1: 7500
Figure 1.4 Creosote wood treatment facility in Thonkwane
Since effluent from the Matsapha Central Stores and Thonkwane is discharged
into drains that lead directly into surface waters, it is critical that this discharge as
well as surrounding soils must be monitored for PAH contamination.

14
Plate 2 Creosote wood treatment facility at Thonkwane
a) Creosote storage tank b) Rail with untreated wood
c) Creosote cylinder d) Steamer
e) Effluent ponds and trench f) Effluent ponds

15
g) Effluent from trench and h) Effluent tank discharge point
discharge point
i) Effluent movement down slope from pine logs to the road
1.5 Hypotheses
The hypotheses of this study are the following:
1.5.1 Hypothesis 1 H1 The pole storage site in Matsapha CSO is contaminating soils and
surrounding surface waters with PAHs.
1.5.2 Hypothesis 2 H2 The wood creosote treatment plant in Thonkwane (Swazi Timber Sales) is
contaminating soils and surrounding surface waters with PAHs.

16
1.6 Aims and objectives
The following aims and objectives have been formulated in an attempt to answer
both Hypothesis1 and Hypothesis 2 as stated above.
1.6.1 Aims of the study
The main aim of this study was to determine the impact of the SEB storage
facility as well as the creosote treatment plant by investigating the extent of PAH
in surrounding environments (soil, sediments and surface waters).
1.6.2 Objectives of the study
The main objectives of the study were the following:
1 To determine PAH levels in soils and water at the Matsapha Central
Stores and Thonkwane.
2 To determine leachability and distribution of PAHs in Matsapha Central
Stores and Thonkwane.
3 To compare levels with standards to determine compliance with US EPA
and the Swaziland Environment Authority (SEA).
1.7 Chapter outline
The outline below provides an indication of the different chapters in this study
and assists the reader in understanding the flow of the investigation procedure
that was followed and the main sections that are dealt with in each chapter.
The thesis consists of five chapters. Chapter 1 provides the background and the
purpose of this investigation. It briefly explores the issues of polycyclic aromatic
hydrocarbons. The study areas as well as the hypothesis, aims and objectives of
the study are discussed.
The next chapter, Chapter 2, explores the literature relevant to the study. It
describes the characteristics of PAHs, the sources of PAH and the uses of PAH.

17
The chapter also explores the relevant chemical and environmental properties of
PAHs as well as the main risks and human exposure to PAHs. It also provides
international and national standards with regard to PAHs. Finally it discusses
trends in PAH research as well as the shortcomings of the research.
Chapter 3 describes the methodology and experimental procedures used in the
study. It also describes the sampling procedure and the data-collection
procedure.
The following chapter, Chapter 4, presents an analysis of the data collected, and
provides illustrations and the discussion of the results. It also compares the
results with international and national standards.
Finally, Chapter 5 seeks to answer the research problem, and to accept or reject
the hypotheses. It suggests possible solutions and provides conclusions to the
study.
Literature on these issues is reviewed in the next chapter, Chapter 2, which lays
the theoretical foundations for the study.

18
CHAPTER 2
LITERATURE REVIEW
2.1 Introduction
This chapter discusses the arguments and findings of a number of researchers
with regard to PAHs in creosote, with special attention to the issues raised in the
study. Issues that will be addressed in this chapter include the history, use of
creosote, properties as well as health and environmental effects of creosote and
creosote derived PAHs. It also examines the various methods used by other
researchers worldwide to determine PAHs in soil samples.
2.2 Theoretical studies
2.2.1 Identity and properties of creosote
Many sites worldwide have been polluted by creosote as a result of wood-
preserving activities. Past practices of applying creosote and coal tar
preservatives to wood, such as the use of unlined pits and trenches, have
contaminated the surface and groundwater at thousands of sites. According to
Choudhary, Citra, McDonald and Riviera (2002), creosote is a complex mixture of
different chemicals such as polycylic aromatic hydrocarbons (PAHs) (Table 2.1),
phenols, and metals. The American Wood Preservation Association (AWPA)
describes creosote (CAS Registry Number 8001-58-9) as:
[A] distillate of coal-tar produced by high temperature carbonization of
bituminous coal; it consists principally of liquid and solid aromatic
hydrocarbons and contains appreciable quantities of tar acids and tar
19
bases; it is heavier than water, and has a continuous boiling range of
approximately 275oC, beginning at about 175 oC (AWPA, 1977).
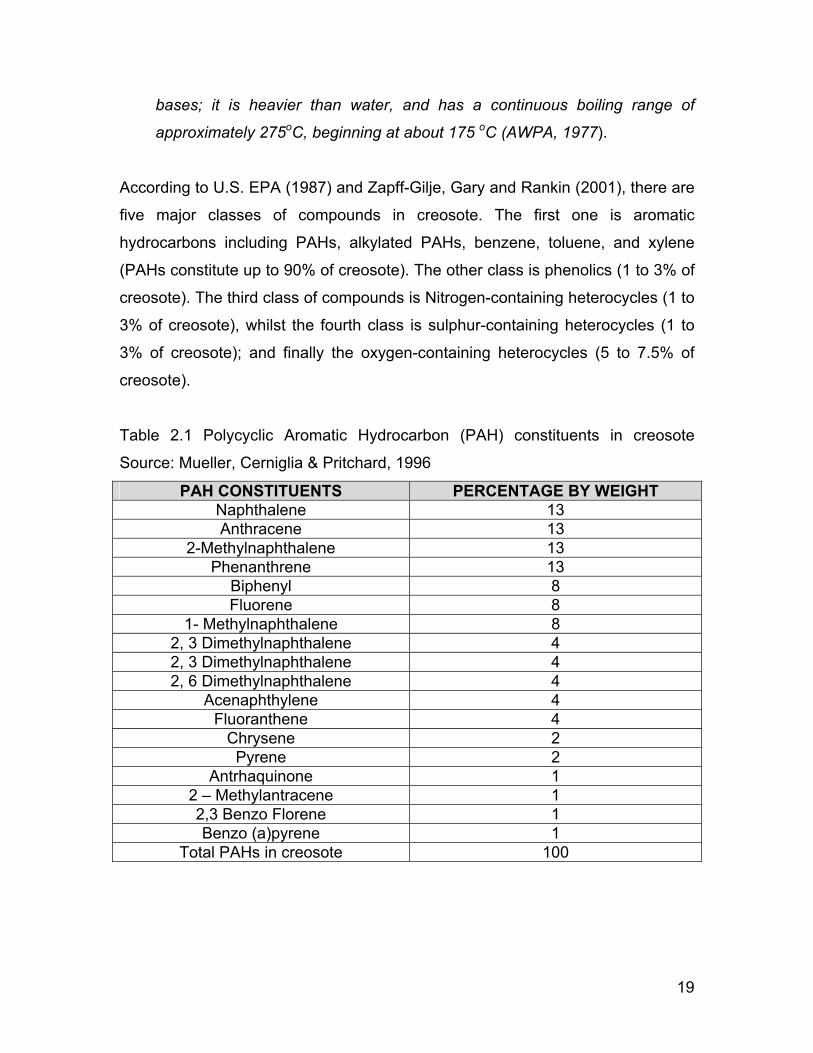
According to U.S. EPA (1987) and Zapff-Gilje, Gary and Rankin (2001), there are
five major classes of compounds in creosote. The first one is aromatic
hydrocarbons including PAHs, alkylated PAHs, benzene, toluene, and xylene
(PAHs constitute up to 90% of creosote). The other class is phenolics (1 to 3% of
creosote). The third class of compounds is Nitrogen-containing heterocycles (1 to
3% of creosote), whilst the fourth class is sulphur-containing heterocycles (1 to
3% of creosote); and finally the oxygen-containing heterocycles (5 to 7.5% of
creosote).
Table 2.1 Polycyclic Aromatic Hydrocarbon (PAH) constituents in creosote
Source: Mueller, Cerniglia & Pritchard, 1996
PAH CONSTITUENTS PERCENTAGE BY WEIGHT Naphthalene 13 Anthracene 13
2-Methylnaphthalene 13 Phenanthrene 13
Biphenyl 8 Fluorene 8
1- Methylnaphthalene 8 2, 3 Dimethylnaphthalene 4 2, 3 Dimethylnaphthalene 4 2, 6 Dimethylnaphthalene 4
Acenaphthylene 4 Fluoranthene 4
Chrysene 2 Pyrene 2
Antrhaquinone 1 2 – Methylantracene 1 2,3 Benzo Florene 1 Benzo (a)pyrene 1
Total PAHs in creosote 100

20
2.2.2 Properties of creosote
The general characteristics common to the polycyclic aromatic hydrocarbons are
high melting and boiling points, low vapour pressure, and very low solubility in
water, as can be observed in Table 2.2 (IARC, 1983). The physical properties of
creosote that largely determine its behaviour in subsurface include its specific
gravity (which is near that of water), its high viscosity and low interfacial tension.
Table 2.2 Chemical characteristics of PAHs
Source: ATSDR, 1993
PAH
Chemical
formula
Molecular
weight
Water
solubility
Melting
point
°C
Boiling
point
°C
Log
KOW
Log
KOC
Naphthalene C10H12 128 3.169 81 218 3.37 2.97
Acenaphthylene C12H8 152 3.93 4.07 1.40
Acenaphthene C10H12 154.21 3.93 3.98 3.68
Fluorene C13H10 166.2 1.68-1.98 4.18 3.86
Phenanthrene C14H10 178.2 1-1.6 100 340 4.45 4.15
Anthracene C14H10 178.2 0.0446 218 342 4.45 4.15
Fluoranthene C16H10 202.26 0.206 107 384 4.90 4.58
Pyrene C16H10 202.3 0.129-
0.165
147 404 4.88 4.58
Chrysene C18H12 228.3 0.0015-
0.0022
5.61 5.30
Benzo(b)fluorant
hene
C20H12 252.3 0.0012 6.04 5.74
Creosote is denser than water. For some wood preservation uses, creosote is
mixed 1:1 with fuel oil. In these uses, the density will be less than pure creosote,
but will still be heavier than water (Hoffman & Hrudey, 1990). The vast majority of
the components of creosote have low aqueous solubility. This limits the degree to
which these components can dissolve in water, which causes them to be
available to the environmental microbial community (Reid, Stokes & Jones,

21
2004). In line with this statement, Romanowski, Funcke, Grossmann, Konig &
Balfanza, (1983) state that creosote is insoluble in water although the
components have a wide range of solubilities, from the readily soluble tar acids
and bases (i.e. phenols, cresols, acridines) to the insoluble six-ring PAHs.
Creosote is soluble in many organic solvents, including oil and diesel fuel (U.S.
EPA, 1987; Bos, Hulshof, Theuws & Henderson, 1983). It is an effective
preservative, almost insoluble in water and therefore resistant to leaching. Other
attributes are that it is normally not corrosive to metals, it protects timber against
splitting and weathering and it has a high electrical resistance.
Creosote is a non-aqueous liquid that will slowly sink when placed in water.
However, floating and sinking phases have been reported. Viscosity will vary
widely, depending on creosote composition and temperature, but it is typically
much higher than that of water. The viscosity reduces the velocity at which
creosote can migrate through soil. Creosote migration through a porous medium
is determined to a much greater extent by the interfacial tension between
creosote and soil pore water or groundwater. This implies that creosote may
travel further and leave behind much lower residual concentrations in the soil
than would be expected for a comparable petroleum oil (Zapff-Gilje et al., 2001).
According to Miller, Wasik, Huang, Shiu and MacKay (1985), the vapour pressure
(Pv) of creosote is variable because of the number of compounds involved. It is
difficult to characterise. Vapour pressures range from 2.0 x 10⁻¹⁰ Pascals (Pa) for
ibenzo[b]chrysene to 11.6 Pa for naphthalene. The tendency for PAHs to prefer
either biota or water in aquatic systems is given by the Octanol-Water Partition
Coefficient (Kow). The range of log (KOW) values for PAHs is from 3.29 to 7.19.
Other components of creosote have widely varying log KOW values, from 0.65 for
pyridine to 3.95 for biphenyl. The range of log KOC values for PAHs is from 2.97 to
6.74.

22
2.2.3 Uses of creosote
Ikarishi, Kaniwa and Tsuchiya (2005) and Edlund (2001) state that creosote is
used as a wood preservative in poles used in railway sleepers,
telecommunication and electricity transmission. The poles can also be used in
the foundations of houses, as fences, as stakes for agricultural and fruit
production, and for the manufacture of garden furniture and outdoor recreational
facilities in parks. The wood is durable because the chemicals in the preservative
are toxic to decay fungi and insects. However, these chemicals that are beneficial
in protecting the wood are also potentially toxic to aquatic organisms. This has
caused some concern that chemicals might leach out of the wood and
accumulate in the environment to harmful levels (Brooks, 2000). In Swaziland,
Swaziland Treated Poles uses creosote for the preservation of electricity poles.
The extent of the usage has necessitated this study.
2.2.4 Creosote treatment process of wood
According to Holoubek, Kocan, Holoubková, Hilscherová, Kohoulek, Falandysz
and Roots (2000), the methods used for creosote preservation of timber are
spraying, dipping or vacuum high-pressuring. The simplest production process
involves dipping the timber into an open vessel containing creosote oil for
approximately three minutes. Once the timber is taken out of the vessel, the
excess creosote drips off and the timber is dried. All types of wood can be dip-
treated. The pressure-treatment process is done in closed reactors. In principle,
the process consists of three process steps: a pre-vacuum step, an impregnating
step when warm creosote oil is pressured into the timber, and a final vacuum
step when the remaining creosote is sucked from the timber. Through these
methods 20 – 25 litres of creosote oil per cubic meter wood is pressed into the
timber. Following the treatment the timber is dried before use, allowing the
solvent and volatile compounds to evaporate into the atmosphere.

23
Bestari et al. (1998) state that there is concern over the use of creosote because
a wide range of its constituents is released to the environment over a long term.
Kohler, Kunniger, Guger and Crockett (2000) state that PAHs constitute 40% of
the total mass of creosote. These PAHs have been listed as priority pollutants by
US EPA (1995).
2.3 Polycyclic Aromatic Hydrocarbons (PAHs)
Since PAHs constitute a larger portion of creosote, they were used in the study
as an indicator for creosote contamination. This study concentrated only on
compounds that fall in the category of polycyclic aromatic hydrocarbons.
Sometimes the term ‘polynuclear’ is used in the literature instead of ‘polycyclic’ to
describe these compounds. The properties, formation, sources and fate, health
effects and ecological impacts of PAHs will be described in the next section.
2.3.1 Sources and pathways of PAHs
Polycyclic aromatic hydrocarbons (PAHs), also known as polyarenes, are
widespread environmental contaminants of anthropogenic or natural origin
usually occurring in mixtures. Anthropogenic PAH sources include fuel oil or
gasoline spills, natural seeps, combustion of fossil fuels (coal, oil, natural gas)
and wood, as well as creosote releases. The main source of PAHs is to be found
in the incomplete combustion of coal, oil and petrol, as well as in wood-
preservation sites or processes involving the petrochemical industries (Lundstedt
et al., 2003).
They occur naturally in the environment, during such processes as thermal
geological reactions and natural fires. PAHs also occur naturally in peat, lignite,
coal and crude oil. Forest fires and volcanoes are biogenic PAH sources
(Neilson, 1998). Human activities are significant sources in the environment,
since PAHs are formed in all processes involving incomplete combustion
(insufficient oxygen supply) of organic compounds. Hazards associated with

24
these compounds derive from their persistence, their hydrophobic character, their
bioaccumulation and their carcinogenic properties of several individual
polyarenes. Owing to their ubiquitous distribution, PAHs are frequently detected
in soils and sediments and are thus of ongoing interest to analytical chemistry.
PAHs are one of the typical persistent organic compounds (POPs) featured in
regional and global cycling. PAHs are emitted mainly into the atmosphere,
adsorbed to particles, and may then be transported over long distances where
they can be detected. PAHs are thus ubiquitous environmental pollutants that are
generally found in elevated levels near emission sources (Bergknut, Kitti,
Lundstedt, Tysklind & Haglund, 2003). Because of their low vapour pressures,
compounds with five or more aromatic rings exist mainly adsorbed to airborne
particulate matter, such as fly ash and soot. Those with four or fewer rings will
occur both in the vapour phase and adsorbed to particles. PAHs reach the
hydrosphere and pedosphere mainly through dry and wet deposition and road
runoff but additionally from industrial wastes containing PAHs and leaching from
creosote-impregnated wood. PAHs are adsorbed strongly to the organic fraction
of sediments and soils (see Figure 2.1). Therefore it can be concluded that
sediments and soils are usually considered as the main sinks for PAHs in the
environment and PAHs with four or more aromatic rings are persistent in the
environment.

25
Figure 2.1 Pathways of PAHs in the environment
Source: OSPAR commission, 2001
2.3.2 Formation of PAHs
PAH is the commonly used name for numerous benzene rings connected to one
unit. The benzene rings can be fused in a linear, angular, or clustered
arrangement, as shown in Figure 2.2 (Bergknut, 2006; Lundstedt, Haglund &
Orberg, 2003).

26
Figure 2.2 The chemical structure of common PAHs
Source: Sims and Overcash, 1983
One or more hydrogen atoms in a PAH molecule can be substituted for one or
more methyl or ethyl groups. PAHs are formed during organic combustion
processes without sufficient amounts of oxygen present (pyrolysis). The
formation of PAHs can occur in different ways: when parts of the fuel’s polycyclic
hydrocarbon backbone does not completely decompose or through high
temperature processes of smaller alkanes clustering together to form aromatic
compounds. Therefore, PAHs are formed during almost all forms of combustion,
at different ratios depending on the temperature. PAHs have been thoroughly
studied because of their toxicity, persistency and environmental prevalence
(Blumer, 2003). However, these studies have been limited to 16 PAHs,
designated as priority pollutants by the United States Environmental Protection
Agency (US EPA).

27
2.3.3 Properties and environmental fate of PAHs
According to Holoubek et al. (2000), the fate of PAHs is of great environmental
concern due to their toxic, mutagenic and carcinogenic properties. It depends on
several factors such as atmospheric photolysis, sorption, water and lipid
solubility, chemical oxidation, volatisation, and microbial degradation. Zapfft-Gilje
et al. (2001) state that PAHs are a diverse group of organic compounds
composed of hydrogen and carbon atoms arranged in two or more fused
benzene rings. They are grouped into two categories based on their molecular
structure: Low molecular weight (LMW) compounds with fewer than four rings
and high molecular weight (HMW) with four or more rings. About 75% of PAHs
fall in the LMW category.
According to Lundstedt et al. (2003), the PAHs containing three or less benzene
rings LMW have a higher vapour pressure and can normally be found in the gas
phase. This implies that they are semi-volatile and exist in the atmosphere partly
as vapours, which are highly susceptible to atmospheric degradation processes.
Thus they are to be considered a regional pollutant. The semi-volatile property of
PAHs makes them highly mobile throughout the environment via deposition and
re-volatilisation between air, soil and water bodies.
PAHs with five or more rings are less volatile and condense on soot particles
formed during the combustion. Lundstedt et al. (2003) who also mention this
aspect, argue that the high molecular weight HMW PAHs, on the other hand, are
primarily associated with particles in the atmosphere and water, and are
therefore less available for degradation. These are adsorbed to particles.
Condensation on particles makes it less probable that the PAHs will oxidise in the
atmosphere. This enhances their transportation over long distances in the
atmosphere and therefore causes them to be ubiquitous in the environment. The
extent of the association of PAH compounds with particulate matter varies with
individual compounds, the nature of the particles (e.g. size, surface area,

28
chemical properties, etc.) and, most importantly, with temperature. The heavier
PAHs, such as benzo(a)pyrene, are almost totally adsorbed onto particles, and
the lighter ones, such as phenanthrene, are found most exclusively in the gas
phase (OSPAR Commission, 2001).
PAHs are generally insoluble in water but can be readily solubilised in organic
acids. This implies that in an aqueous environment they are found adsorbed on
particulates and solubilised in any oily contaminant that may be present in water,
sediment and soil. In line with this statement, Lundstedt et al. (2003) state that
PAHs are generally lipophilic compounds that show a high affinity for organic
matter. This statement is supported by Quantin, Joner and Portal (2005) and
Yuan, Chang, Yen and Chang (2001) who state that PAHs have high boiling
points, are very lipophilic and are hard to dissolve in water. Due to their
hydrophobicity and their recalcitrance, both increasing with increasing molecular
weight, PAHs can accumulate in sediments in high concentrations.
The low molecular weight (LMW) PAHs are more water soluble and volatile than
the higher molecular weight (HMW) compounds. Thus three-ring PAHs tend to be
more soluble in water than the five ring-compounds (RECETOX TOCOEN and
Associates, 2004). The solubility of PAHs in water is inversely proportional to the
number of rings they contain. Thus, LMW PAHs are much more water soluble
and volatile than their high molecular weight (HMW) relatives, while the HMW
PAHs show higher hydrophobicity than the LMW compounds (Mackay, Shiu &
Ma, 1992). The difference in hydrophobicity is also reflected by the octanol-
water-partitioning coefficient. These physico-chemical properties largely
determine the environmental behaviour of PAHs and indicate that transfer and
turnover will be more rapid for LMW PAHs than for the heavier PAHs (Lundstedt
et al., 2003).

29
2.3.4 PAHs from a creosote treatment facility
Mueller et al. (1997) states that numerous wood-impregnation sites are highly
contaminated with PAHs, and that PAHs consist of approximately 85% of the
components in creosote. The other components in creosote are N-, S-, and O-
heteocyclics (5%) and phenolic compounds (10%). When released into the
environment, creosote does not readily dissolve in groundwater, but persists
largely as a separate non-aqueous-phase liquid (NAPL) in the subsurface. PAH
emission from the creosote-treating installations is mainly due to leakage from
vessels and reactors, and evaporation and drip-off from treated timber. The
potentially negative impact of creosote is not restricted to the treatment process,
as PAHs and other substances are also emitted during the use phase and during
the final disposal. These risks are not necessarily of the same intensity as those
relating to the production plant, but the quantities of treated timber that will be in
service in coming years mean that the issue of widespread low-level
contamination and ultimate disposal is of great significance (UNEP,1994).
2.3.5 PAHs in soil
PAHs in the subsurface are strongly sorbed to the organic matter. This makes
them relatively unavailable for degradation processes (Wild & Jones, 1995).
PAHs can therefore remain in the soil for many centuries, posing a long-term
threat to the environment. The adsorption of the PAHs in different soil matrices
results from their low vapour pressure. Mastral and Callen (2000), indicate that
the hydrophobicity of PAHs is reflected by their low water solubility and the matrix
nature. Also, their hydrophobic and lipophilic properties result in a high tendency
for bioaccumulation and persistence in the environment, a reason for high eco-
toxicological concern (Schwarzenbach, Gschwend & Imboden , 2003).
Alexander (1995), Bossert and Bartha (1986), Lundstedt (2003), Sims and
Overcash (1983) and Wild and Jones (1995), argue that LMW PAHs are partly
lost through degradation processes, volatilisation and leaching. The effect of

30
sorption generally increases as the number of benzene rings in the PAH-
molecule increases since this implies higher lipophilicity. Furthermore, it has
been shown that the degradability and extractability of organic compounds in soil
decrease with the time they have been in contact with the soil: a phenomenon
referred to as ‘aging’ or ‘weathering’. Aging is mainly a result of slow diffusion into
the soil organic matter, but other mechanisms involved include the formation of
bound residues and physical entrapment within soil micropores (Alexander,
1995). On the one hand, the processes of sorption and aging limit the
degradability of the contaminants. On the other, these processes reduce the
toxicity of the soil contaminants by lowering the fraction available for uptake by
living organisms.
2.3.6 Chemical characteristics of monitored PAHs
Two PAHs, such as naphthalene and benzo(b)fluoranthene, can possess very
different chemical properties and behave quite differently in air/water/soil
systems. Naphthalene is the most soluble of the monitored PAHs. Naphthalene
also has the highest vapour pressure of the 10 PAHs and a characteristic
mothball smell. Naphthalene does not adhere strongly to soils or sediments and
can pass through sandy soils with relative ease and readily contaminate
groundwater supplies (ATSDR, 1993). Conversely, benzo(b)fluoranthene has the
lowest solubility of the monitored PAHs. Benzo(b)fluoranthene is a non-volatile
PAH that adheres very strongly to soil and organic matter. Contrasting the
chemically-related parameters of an LMW and HMW PAH demonstrates the
difficulty associated with the remediation of complex mixtures of PAHs, such as
creosote.
PAHs are semi-volatile, and consequently present in both the gas and particulate
phases of air (Gundel, Lee, Mahanama, Stevens & Daisey, 1995). These
ubiquitous compounds have attracted much attention since quite large numbers
of them are carcinogenic. Benzo[a]pyrene (B[a]P) was the first chemical to be

31
proven a carcinogen (IARC, 1983; Van Leeuwen & Hermens, 1995). Its effect
was shown to be due to mixed function oxidises (MFO) activation. B[a]P is
initially transformed to an epoxide that can either be activated or deactivated.
Deactivation normally involves diol formation or conjugation to form glutathione
conjugates, which are easily excreted in the bile or urine. However, in some
cases the initial activation leads to a series of events that finally results in DNA
adduct formation. Such defects may lead to cancer.
2.3.7 Toxicological effects
According to Delistray (1997), a wide range of ecotoxicological effects in diverse
suite of biota including micro organisms, terrestrial plants, aquatic biota,
amphibians, reptiles and terrestrial mammals have been reported. Effects have
been documented on survival, growth, metabolism, and tumour formation, i.e.
acute toxicity, developmental and reproductive toxicity, cytotoxicity, genotoxicity
and carcinogenity. Pickering (1999) states that the primary focus of toxicological
research on PAHs has been on genotoxicity and carcinogenicity. In these
studies, several PAHs have been shown to damage DNA and to cause
mutations, which in some cases may result in cancer. However, for the
unsubstituted PAHs it is not the original compound that reacts with DNA. The
PAHs require metabolic activation and conversion to display their genotoxic and
carcinogenic properties. This happens as the PAHs are metabolised in higher
organisms.
Pickering (1999) further argues that PAHs do not accumulate in the same
manner as some other lipophilic organic compounds such as PCBs. Instead, they
are converted to more water-soluble forms, which facilitates their subsequent
excretion from the organism. Unfortunately, this may also lead to the formation of
reactive intermediates that may react with DNA to form adducts, preventing the
gene involved from functioning normally. The DNA damage may be repaired, but
if the repair fails, i.e. if there is irreparable genetic damage, a mutation will have

32
occurred. Mutations may affect many different functions of a cell, but above all
they may induce cancer.
PAHs have been shown to induce a number of toxic effects. Several PAHs have
been shown to cause death in rodents after short-term exposure to high doses.
On the other hand, no deaths have been reported from short-term occupational
exposure in humans (Mueller et al., 1997). Since the environmental levels are
generally much lower than the occupational exposure, it is extremely unlikely that
short-term exposures to PAHs would lead to death. On the other hand, eye
irritation, photophobia and skin toxicity such as dermatitis and keratosis have
been demonstrated in workers occupationally exposed to PAHs.
Adverse respiratory effects, including acute and subacute inflammation and
fibrosis, have been demonstrated experimentally. With benzo [a] pyrene severe
and long-lasting hyperplasia and metaplasia were observed. These effects
manifest themselves as precancerous lesions and are consistent with the general
assertion that one of the main targets of PAH toxicity is the respiratory tract.
2.3.8 Human exposure and risks of PAHs
Human exposure to PAHs occurs primarily through the smoking of tobacco,
inhalation of polluted air and ingestion of food and water contaminated by
combustion effluents. The main sources of human exposure are emissions from
the combustion of coal, diesel, petrol, kerosene, wood, biomass and synthetic
chemicals such as plastics. Pollution of indoor air by PAHs is mainly due to
tobacco smoking, residential heating and PAHs from outdoor ambient air. The
level of individual PAHs in air tends to be higher in winter than in summer. The
predominant source in winter is residential heating and in summer motor traffic.
Average concentrations of 1-30 ng/m3 of individual PAHs were detected in the
ambient air of various urban areas. In large cities with heavy motor traffic and
extensive use of biomass fuels, such as Calcutta, levels of up to 200 ng/m3 of

33
individual PAHs were found. Near industrial sources, the average concentration
of individual PAHs ranged from 1 to 10 ng/m3. The background values of PAHs
are at least one or two orders of magnitude lower than those near sources like
motor vehicle traffic or industries. For example, the levels in rural areas at
1 100 m ranged from 0.004 to 0.03 ng/m3 (International Programme on Chemical
Safety, 1998).
2.4 International standards
According to WHO (1998) standards, the maximum PAH level allowed in the
wood-preserving industry is 0.05 mg/l. The Environmental Protection Agency has
stipulated (1995) that a lower limit of application of 0,01 mg/kg (expressed as dry
matter) can be ensured for each individual PAH in any type of soil.
2.5 Soil remediation techniques
The term ‘soil remediation’ refers to actions designed to eliminate or minimise the
risk associated with contaminated soil. This goal may be achieved in several
different ways and the selected method depends on factors such as the
contaminants present, the site conditions and the cost. The (US DOD, 1994)
refers to remediation as removing, degrading or transforming contaminants to
harmless substances. Additionally, it includes methods that reduce mobility and
migration of the contaminants, preventing them from spreading to
uncontaminated areas. The toxicity of the contaminants remains unaltered, but
the risk they pose to the environment is reduced.
According to Rabbabah and Matsuzawa (2002), there are various remediation
techniques that can be used for the degradation of PAH-contaminated matrices.
However, these are dependent on various factors such as duration required for
treatment, type of environmental matrix, cost, site sensitivity and climate, PAH
molecular weight and concentration as well as the end use of the site.
Remediation of the contaminated sites can take place without removing the soil

34
in situ or by removing the soil where the excavated soil is treated somewhere
else.
The ultimate goal of any degradation process is complete mineralisation of the
organic contaminants, resulting in carbon dioxide, water and other inorganic
compounds. However, Lundstedt (2003) states that during biological and
chemical degradation processes, partial transformation may lead to the formation
of other organic compounds. This may cause problems if the transformation
products are also hazardous and persistent. In the worst case it could lead to
increased toxicity, even if the original contaminants have been degraded. This
potential problem is seldom considered during remedial monitoring programmes,
in which only the original contaminants are usually analysed.
The most common method is still to excavate the contaminated soil and transport
it to a landfill that is considered to be safe from an environmental point of view.
However, for organic contaminants this is not the preferred solution. Instead, an
environmentally sustainable policy should ideally be based on methods that
permanently destroy the contaminants, i.e. destruction methods. The most
effective and reliable method to destroy organic contaminants in soil is
incineration. However, this method is expensive, it makes the soil sterile and
depletes it of all organic matter. Hence, other methods have been developed.
Biological and chemical remediation methods utilise micro organisms and
reactive chemicals to accomplish the degradation. These methods also have the
potential to degrade a wide variety of soil contaminants, but they usually need
careful optimisation.
Although there is a very wide range of remediation methods available to tackle
contamination, three broad approaches can be distinguished:

35
Engineering approaches – these are primarily the traditional methods of
excavation and disposal to landfill, or the use of appropriate containment
systems
Process-based techniques that include physical, biological, chemical,
stabilisation/ solidification, and thermal processes
Hydraulic measures and natural attenuation.
2.5.1 Engineering approaches
Landfill involves the three stages of soil excavation, transport, and burial at the
landfill site. Contaminants in the soil are not necessarily removed, stabilised or
destroyed on site and are ultimately transferred to another site. Landfills are
designed to ensure that contaminants are either isolated from the environment or
subjected to attenuation processes so that they no longer cause harm to the
environment. Containment measures are those which are designed to prevent or
limit the migration of contaminants that may be either left in place or confined to a
specific storage area, to the wider environment. Approaches include hydraulic
measures, capping, and the use of break layers and low permeability barriers.
Most remediation practices of underground contamination rely on excavating the
soil and treating it in separate areas or treatment facilities. These treatments
include, for example, thermal treatment and land filling. Incineration is a very
effective treatment method, but it is costly and after burning, the soil has lost
most of its nutritional value and structure. Land filling does remove the
contaminants but only relocates the problem (Lageman, Clarke & Pool, 2005).
2.5.2 Process-based techniques
Physical processes used in soil treatment are used to remove contaminants from
the soil matrix, concentrating them in process residues that require further
treatment or safe disposal. Contaminants in the concentrated fractions may
subsequently be destroyed, recovered by some other process (e.g. chemical or

36
thermal), or they may be disposed of at a landfill. The process-based techniques
include the following: bioremediation, phytoremediation, electrokinetic
remediation stabilisation, and chemical processes. These processes are
discussed below.
2.5.2.1 Bioremediation The bioremediation technique involves the breakdown of organic contaminants
by microbial processes. Biological processes of soil treatment depend on the
natural physiological processes of micro organisms, such as bacteria and fungi,
to transform, destroy, fix or mobilise contaminants. In bioremediation, the
microbes or microbial communities capable of degrading the contaminants need
to be present. Furthermore, the groundwater should contain the nutrients to
support this degradation so that they can support the reactions. When
bioremediation is enhanced, these nutrients (typically nitrogen and phosphorus
source), air (oxygen source) or any additional carbon source (easily degradable
organic compound) are added into the ground through wells. The additional
carbon source can facilitate destruction of the contaminants through co-metabolic
reactions. Because the vast majority of the components have low solubilities in
water and hence have limited bioavailability, the remediation technique of
enhanced biodegradation is often not suitable for creosote-contaminated soils.
However, it should be noted that many creosote-contaminated sites are not
intensively being remediated. This means that bioremediation is one of the
processes that result in the slow decontamination of these sites. This is often
termed ‘natural attenuation’, and because of the costs associated with other more
proactive techniques, it is often employed.
2.5.2.2 Phytoremediation Cunningham, Anderson, Schwab and Hsu (1996) and McCutcheon and Schnoor
(2003) define phytoremediation as the in situ use of plants and their associated
micro organisms to degrade, contain or render harmless contaminants in soil or
groundwater or any other contaminated media. It can use higher plants to

37
degrade contaminants, to fix them in the ground, to accumulate them in a
harvestable biomass, or to release them to the atmosphere through transpiration.
Phytoremediation has been used to treat sites contaminated with a variety of
contaminants including heavy metals, solvents, PAHs, PCBs, hydrocarbons,
radionuclides, explosives, and pesticides Studies have confirmed that certain
plant species can take up chlorinated solvents from the groundwater in the root
zone (Chappel, 1997; Schnoor, 1997). Once plant takes up the solvent, it can
store the chemical in its body via covalent bonding with plant lignin (Schnoor,
1997). The plant may metabolise the chemical to other compounds. Research
has also indicated that the growth of plant roots can stimulate degradation of
TCE by micro organisms in the root zone via reductive dechlorination (Chappell,
1997). The plants exude substances through their roots that can stimulate the
growth of microbes required to carry out these reactions. However, this is a time-
consuming technique and it is in the early stages of development.
The main advantages of phytoremediation is that it is a low-cost technique
because it is solar driven and eliminates the need for excavation and ex situ
treatment (see Appendix 1). This type of treatment does not generate secondary
waste. The limitations of the technique are that it is applicable above the water
table and in very shallow groundwater, and it is a very time-consuming technique.
Phytoremediation for the treatment of dissolved chlorinated solvents is in a very
early stage of development.
2.5.2.3 Electrokinetic remediation Electrokinetic remediation has traditionally been used to remove metals and
organic compounds from soils, sludges, and sediments. According to McIntyre
and Lewis (1997), this method has been a subject of research and is now in an
advanced stage. It is used in contaminated soils on a large scale. Electrokinetic
remediation methods use electrodes with a low-level direct current electric field
(usually <10 V/cm or mA/cm2) installed into the contaminated soil. The current
mobilises and transports charged chemicals in the soil’s liquid phase towards the

38
electrodes. Negatively charged anions and organic compounds will move to the
anode, whereas positively charged chemicals, such as metals, will move towards
the cathode.
2.5.3 Chemical processes
Chemical processes in soil treatment systems are used to destroy, fix or
neutralise hazardous compounds. Many processes in other categories may use
chemical processes for the treatment of effluents and gaseous emissions.
2.5.3.1 Stabilisation/solidification Stabilisation/solidification processes involve solidifying contaminated materials,
converting contaminants into less mobile chemical forms and/or binding them
within an insoluble matrix presenting a minimal surface area to leaching agents. It
is when the process results in chemical fixation of contaminating substances that
the term ‘stabilisation’ can be applied. Thermal processes use heat to remove or
destroy contaminants by incineration, gasification, desorption, volatilisation,
pyrolysis or some combination or these.
2.5.3.2 Hydraulic measures and natural attenuation Hydraulic measures entail the control of the groundwater regime so that a
contamination source or contaminated groundwater is separated, isolated,
treated or contained. Natural attenuation is the effective reduction of contaminant
toxicity, mobility or volume by natural processes.
In this study phytoremediation will be recommended as a means for the
remediation of the PAHs-contaminated soil. The literature has indicated that it is
an effective method for the cleanup of polycyclic hydrocarbons from
contaminated soils. Successful trials have involved a variety of plants such as
legumes and grass. See Appendix 2 for a list of plants and micro organisms that
can be used for rehabilitating contaminated areas.

39
In fact, legumes have been found to grow naturally in contaminated sites. Plants
and micro organisms participate both indirectly and directly in the remediation of
the contaminated soils through three main mechanisms, namely degradation,
containment and transfer of contaminants from the soil to the atmosphere
(Cunningham et al., 1996).
Plants and micro organisms accomplish degradation either independently or
through joint interaction, such as in the rhizosphere effect. Plants supply root
exudes (sugars, alcohols and acids) for microbial use, realising root-associated
enzymes that degrade contaminants in the soil and altering the soil to promote
phytoremediation (Cunningham et al., 1996; Sims & Overcash, 1983).
The literature regarding containment and transfer of contaminants focuses on the
direct role of plants. According to April et al. (1990), plants prevent the spread of
petroleum hydrocarbons in soil by taking them from the soil and absorb them
onto their roots or keeping them near their root zone via water uptake. Plants are
also capable of transferring volatile petroleum hydrocarbons, for instance
naphthalene, from the soil to the atmosphere via transpiration. Although this
mechanism removes the contaminants from the soil, it simply moves them into
the atmosphere, which can serve as an alternative source of exposure. Thus
health risks associated with the contaminant may still arise.
Research has, however, suggested that certain petroleum hydrocarbons are
easier to phytoremediate than others. The one- to three-ring PAHs are easier to
remediate than the four- to five-ring PAHS.
40
2.6 Methods survey
According to Lundstedt et al. (2003), the procedure for the analysis of PAHs in
soils follows the following steps: pretreatment, extraction, clean-up and
instrumental analysis.
2.6.1 Sample pretreatment
Sample pretreatment is performed to increase the homogeneity of the soil and to
increase the extractability of the analytes in the soil. It includes sieving, air-drying
and grinding. According to Wischmann, Steinhart, Hupe & Montreson (1996), soil
is acidified in some studies prior to extraction to improve the extractability of
acidic transformation products. Samples are air-dried to facilitate grinding and to
increase contact between soil and the organic solvent for extraction. However,
drying at elevated temperature needs to be avoided since it may result in losses
of volatile analytes such as naphthalene. After drying, the samples are ground to
further increase the homogeneity of the sample and to increase the extractability
of the analytes by increasing the exposed surface area in the soil.
2.6.2 Extraction
Extraction is performed to release contaminants from the solid matrix and to
transfer them quantitatively to another medium, which is usually an organic
solvent. The PAH samples are collected, after being extracted with appropriate
solvents, and the solvent volume reduced prior to instrumental analysis. Methods
used for the extraction of contaminants from analytes include Soxhlet, ultrasonic
extraction, supercritical fluid extraction pressurised liquid extraction (PLE), and
microwave-assisted extraction (MAE), a solid-fluid fluidising series extraction
procedure, and recently solid-phase micro-extraction (SPME).
According to Guerin (1999), PAHs are traditionally extracted from various
matrices by Soxhlet extraction. The Soxhlet method is a very efficient method for
extracting PAHs and it is the preferred procedure in the US EPA method TO-13/A

41
and the ISO standard method 12884 for PAH determination. It is the oldest and
mostly widely used approach for conventional extraction of solid samples. The
main advantage of Soxhlet extraction is that the sample phase is always in
contact with fresh solvent and due to moderate extraction conditions, compounds
are not decomposed. In a comparative study of the Soxhlet extraction and
sonication method carried out by Guerin (1999) it was observed that the Soxhlet
extraction method recovered 95% of the PAHs. However, the Soxhlet extraction
method requires extremely long extraction times, which is a disadvantage. It also
involves the use of environmentally hazardous solvents. In recent years, the
classic Soxhlet extraction of PAHs from solid matrices such as soils and
sediments has been replaced by faster, less solvent-consuming and often-
automated techniques, which include one or more extraction cycles.
Portugal, Disdier, Arfi, Pastor and Pauli (1999) also point out that the Soxhlet
extraction method requires extremely long extraction times (8 hours) and involves
the use of environmentally hazardous solvents, imposes a high cost of analysis.
However in most recent years, instrumental techniques have been developed
which save both time and the solvent. Representative examples of these new
extraction techniques are ultrasonic extraction supercritical fluid extraction
pressurised liquid extraction (PLE), and microwave-assisted extraction (MAE),
and recently, a solid-fluid fluidising series extraction procedure, which provides
for a relative simple and cost-effective alternative.
Lee, Zou, Ho and Chan (2001) state that ultrasonic extraction has been used
instead of Soxhlet extraction. It uses water as agitation energy and total recovery
can be reached within a short time (45 – 50min.). It also extracts non-polar
compounds in a short time. However, it has certain limitations.
According to Manoli and Samara (1999), conventional techniques such as liquid-
liquid extraction (LLE) or solid phase extraction (SPE) have been used for the
determination of PAHs in liquid samples matrices. Compared to SPE, LLE is

42
time-consuming and requires more solvents. Thus LLE has been replaced by
SPE, using a variety of sorbents.
Supercritical fluid extraction (SFE) is being used as a rapid alternative to
conventional solvent extraction from polyurethane foam absorbents (Hawthorne,
Galy, Schmidt & Miller, 1995). It has been in the market for 20 years and was
amongst the first instrumental techniques. According to Portugal et al., (1999),
SFE reduces extraction time (less than 90 min.) and optimises recovery. The
high diffusivity and low density/viscosity of supercritical fluids allows them to
penetrate a sample matrix rapidly and to effect a more rapid extraction of the
PAHs. Supercritical carbon dioxide has been used for the extraction of PAHs in
urban dust samples (Langenfeld, Hawthorne & Miller 1996; Janda, Bartle &
Clifford, 1993) and diesel exhaust particulates. Extraction time is about 90
minutes and little waste is produced. The use of a 10% methanol modifier
increases PAH recoveries considerably. This method is environmentally friendly.
Supercritical fluid extraction (SFE) was initially introduced as a complement to, or
even substitute for, conventional extraction techniques like Soxhlet and liquid-
liquid extraction (LLE). The use of SFE and other recently introduced extraction
techniques has been described by several authors (Janda et al., 1993;
Hawthorne et al., 1995; Neilson, 1998), and some of its limitations have been
discussed in a critical review by Smith (1999). SFE is more rapid and selective
than the conventional techniques, and was therefore used to extract Swedish
adipose tissue samples. It was concluded that SFE is a very good choice for
samples where the analyte-matrix interactions are minor.
The other method is microwave-assisted extraction (MAE), where the solvent and
sample are subjected to radiation. Unlike SFE, where samples are extracted
sequentially, MAE allows up to 14 samples to be extracted simultaneously. The
major limitation of this method is that the solvent has to be physically removed

43
from the sample matrix upon completion of extraction before analysis (Janda et
al., 1993, Hawthorne et al., 1995; Neilson, 1998).
SPE and solid-phase disk extraction (SPDE) are other extraction methods that
have gained popularity for the environmental analysis of organic contaminants
and it has an important role to play in the modern analytical laboratory since it is
both an extraction and a clean-up technique. Other advantages are that it
minimises sample handling and gives high concentration factors, tunable
selectivity (choice of adsorbent), and increased precision. SPE has a number of
advantages, which have made it famous and has allowed it to compete with
procedures such as liquid-liquid extraction. These advantages include a
reduction in the total organic solvent used in the extraction. SPE also provides
cleaner extracts with minimum amounts of contaminants and impurities and the
recoveries are normally high and reproducible with no emulsions (Bergknut,
2006).
According to Dean and Xiong (2000), another extraction method that is used is
pressurised fluid extraction (PFE), which has been available in the market as
accelerated solvent extraction (ASE) since 1995. An organic solvent is used
together with heat and pressure to extract analyte from the matrix. It is automated
and can extract 24 samples in 12 minutes. However, it has its limitations. ASE
was evaluated as a possible rapid, low-solvent replacement for Soxhlet and bath
sonication/shaking extraction in established soil-screening methods. ASE
recoveries were equivalent or superior to bath sonication/shaking, with ASE
giving approximately double the total PAHs content for matrices containing small
stones and/or coal. ASE would be a suitable replacement for existing extraction
methods; however, more work is required to reduce background interference. In
a study by Wilke, Sung and Jung (2002), three extraction methods Soxhlet,
ultrasonic and shaking, were also compared. Recovery rates were determined in
two soils. The study showed that the number of aromatic rings, rather than
extraction procedures, significantly influenced the recovery rates of individual

44
samples. The extraction efficiency decreased in the following order: shaking,
ultrasonic and Soxhlet.
More recently, one technique that is being used increasingly in the isolation and
extraction of environmental contaminants is solid phase microextraction (SPME).
SPME is a solvent-free extraction technique that has been used by various
researchers for a variety of environmental applications. It has been used
principally for the study of PAHs in water samples of different origins (Langenfeld
et al., 1996; Doong, Chang & Sun, 2000a) and in soils (Liu, Hopke, Han, Yi,
Holsen, Cybart, Kozlowski & Milligan, 2003; Doong et al., 2000b; Seduikiene,
Vickackaite & Kazlauskas, 2000), sediments Cam, Gagni, Meldolesi & Galletti,
2000) and air particulate matter. The technique used in many cases is direct
immersion of the fibre in the samples, but it can also be applied to the headspace
(Djozan & Assadi, 1999; Doong et al., 2000b; Waidyanatha, Zheng & Rappaport,
2003), so that liquid and solid samples can be analysed. The main advantage of
this method is its simplicity: besides the SPME only a standard GCMS instrument
is required. It is based on sorption (partitioning of the analytes present in the
sample) into a layer of stationary phase coated on to a syringe-like device.
The SPME method is suitable to determine substances directly without
pretreatment of samples, and especially when analysing and screening volatile
substances in complex matrices such as soil samples (Górecki, Boyd-Boland,
Zhang & Pawliszyn, 1995). It has other advantages over other water-extraction
techniques such as solid phase extraction or liquid-liquid extraction. It is fast and
does not require any organic solvents, which is clearly of environmental benefit.
Many of the more traditional extraction techniques involve multi-step procedures
that always present the risk of analyte loss, while SPME achieves contaminant
extraction and concentration in a single step, thus reducing this risk. The
technique is also relatively inexpensive with a single fibre being capable of
performing between 50 and 100 extractions. In 2001, Erikson, Dalhammar and
Borg-Karlson conducted a study whereby solid-phase micro-extraction was used

45
to screen and determine volatile and non-polar substances in a PAH-
contaminated site in Stockholm Sweden. When compared to liquid extraction, the
detection limits can be increased by using larger samples (gives a higher total
mass of each compound in the samples) but still using the same fibre.
Aqueous samples can be studied directly by immersing the fibres in the solution,
while particulate as well as aqueous samples can be extracted by exposing fibres
to the headspace above the samples. Finally, the technique can be used for in
situ extraction of environmental samples, hence minimising the disturbance of
sample matrices. In a study by King, Readman & Zhou, (2004), the method
showed good linearity up to 10 microgram per litre. The reproducibility of the
measurements expressed as relative standard deviation (RSD) was generally
less than 20%. Due to the advantages and performance of the SPME, this
method was selected for use in this study.
2.6.3 Clean-up
Clean-up is performed to co-extract compounds that could interfere during
subsequent analysis and separate different classes of analytes prior to analysis.
The clean-up of samples can be performed by adsorption chromatography using
open-column chromatography, solid-extraction phase (SPE) or high performance
liquid chromatography (Zdrahal, Karasek, Lojkova, Buckova, Vecera & Vejrosta,
2000; Bodzek, Janoszka, Dobosz, Warzecha & Bodzek, 1997). The high
performance liquid chromatography (HPLC) techniques have the greatest
resolution and reprocibility and may be coupled to a wide range of detectors for
analyte detection. However, the other instruments are simpler to use, less costly
and have higher sample capacity than HPLC and are therefore used in
environmental analysis (Hale & Anerio, 1997).

46
2.6.4 Instrumental analysis
Instrumental analysis is performed to separate, identify and quantify the
individual analytes in the sample. Instrumental methods for the analysis of PAHs
in environmental samples vary depending on the sample type and purpose of the
analysis. Mayer, Vaes, Wijnker, Legierse, Kraaij, Tolls and Hermens (2004)
found that the choice of which method to use for analysis depends on the
advantages and disadvantages of each, based on their sensitivity and specificity.
According to US EPA (1995), other methods such as photo-ionisation detectors
(PIDS) can be used to screen for PAHs in soil samples. The PIDS use an
ultraviolet lamp to ionise organic vapours. They are sensitive to aromatic
hydrocarbons. They have various limitations, such as that they are affected by
humidity and electric currents. According to Lundstedt et al., (2003), PAHs can
be analysed by flame ionisation detection, or by HPLC with UV or florescence
detection. Bestari et al. (1998) point out that HPLC is sensitive to PAHs, but that
identification of individual PAHs by comparison to retention time is less accurate
with GC. Thus, for a more thorough characterisation of the contaminants present
in soil, higher resolution and sensitivity are needed. GC fulfils these requirements
and facilitates the identification and quantification of a large number of
compounds in soil.
According to Fernandez, Vilanova and Grimalt (1999), GC has become more
popular due to its high selectivity, good precision and resolution. Recently, the
mass spectrophotometer has become more important for the analysis of
environmental samples. According to Marcè and Borrull (2000), GCMS is a good
technique, which requires the use of surrogate standards to quantify and clean
up both solid and liquid samples after extraction. It allows for the detection of
small quantities of PAHs in groundwater and air. According to Ikarishi et al.,
Kaniwa and Tsuchiya (2005), PAHs are recovered at high yield 97 – 133% using
gas chromatography. GC/MS is one of the most powerful techniques available for
environmental analysis. Every compound has a specific mass spectrum.

47
Compounds are identified by comparing the spectra with mass spectral
databases. For the purposes of this study, GC/MS coupled with solid phase
micro extraction have been selected as the best instrument for the analysis and
extraction of PAHs in the soil and water samples from the creosote treatment
plant and storage facility. This has been based on the properties and advantages
of GC/MS and SPME over other techniques.
The next chapter (Chapter 3) gives a detailed explanation of the preferred
methodology from the literature, which was used to accomplish the objectives of
the study.

48
CHAPTER 3
METHODOLOGY
3.1 Introduction
This chapter presents the methodology and experimental procedures used in the
study. It also describes the sampling procedure as well as the data-collection
procedure. The experimental research method was used in this study and a
qualitative approach was used for the collection of data. Soil and water samples
were collected for polycyclic aromatic hydrocarbon analysis. The methodology for
the determination of polycyclic aromatic hydrocarbons (PAHs) in environmental
samples involved a preliminary survey to identify sampling sites. This was
followed by a three-step procedure: sampling, extraction by solid phase micro
extraction (SPME) and analysis by gas chromatography (GC/MS). The steps are
described in the next sections.
3.2 Preliminary survey
In order to identify the study sites and assess the content of PAHs, a preliminary
survey was done. The photo ionisation technique was used to select the study
site between Matsapha Central Stores (creosote wood storage facility) and the
Thonkwane creosote treatment plant. Soil and water samples were placed in an
airtight container (Consol bottle), leaving one half to one third empty. The
container was shaken and left to sit for 20 minutes to partition into the headspace
(the air space above the sample). The PAHs were measured using the photo
ionisation detector. Since no PAHs were detected in the Matsapha site, the
Thonkwane creosote treatment plant was selected as the study site.

49
3.3 Sampling
Two sites were used for the collection of soil samples: the Matsapha Central
Stores pole storage sites and the Thonkwane creosote wood treatment plant. At
least 1 kg of soil was collected from each site.
3.3.1 Matsapha site
The study involved the collection of soil samples from the storage site, and water
samples from the drain and the Lusushwana River. Sediment was also collected
from the river and the effluent drains discharging into the river. A raft and a 10cm
hard ground steel auger were used for sampling with polyethylene bags.
The soil samples were collected from Platform 1 of the study sites and nine
sampling points were identified where treated wooden poles are stored. Two
control points were selected out of the pole storage site. In Platform 2 of the
study site, two soil samples were collected below transformers and from a drain
discharging effluent from Platform 1. Other soil samples were collected in a drain
below the Matsapha Central Stores storage site.
The soil samples were collected at depths of 15 cm and 60 cm. Three samples
were collected at each sampling point 3 m apart to get a composite sample.
Water and sediment samples were collected in the drains where the storage site
discharges effluent and at a point where the effluent is discharged into the river.
One sample was collected upstream to act as control point and one downstream
of the industrial site. Three other water and sediment samples were taken at
1900 m intervals. One was taken below sewer ponds and one above the SEB
reservoir. These samples were discarded after the preliminary survey.

50
3.3.2 Thonkwane creosote wood treatment plant
The creosote wood treatment facility was selected as the study site for this
project. The samples in the site were collected in the following areas (see Figure
3.1 and Plate 3):
A. Next to the effluent pond.
B. Next to a trench below that drains effluent to the veld
C. On a sloppy site where the effluent drains from a tank
D. In a donga with pine trees where effluent drains
E. Above a road that acts as a buffer or blocker of effluent
F. Control point.
Figure 3.1 Sampling points at the Thonkwane wood treatment facility

51
Plate 3: Photos showing sampling sites at Thonkwane
a) Sampling point next to creosote tank b) Sampling point below cylinder
c) Sampling point below effluent pond d) Sampling point at effluent trench
e) Sampling point below effluent tank f) Sampling point below pine logs
and the road.

52
Three samples were taken in each site at intervals of 1 m and a homogenised
composite sample was obtained from these. The soil samples were taken at
depths 15 cm and 60 cm.
The soil samples were collected and collected in clean wide-necked Consol
bottles and plastic bags. They were stored in coolers for transport to the
Protechnik Laboratory in Pretoria.
3.4 Laboratory
Due to financial and time constrains EPA methods for PAH extraction from soil
samples was not used. Thus this study used the Protechnik Laboratory, which
adopted the NIOSH 5515 method (see Appendix 3). This method uses extraction
by SPME and analysis by gas chromatography (GC/MS). The methods are
described below.
3.4.1 Sample extraction using SPME
The SPME device and polydimethylsiloxane fibres (100 µm film thickness) were
purchased from Supelco. Fibres were conditioned in the injection port of a gas
chromatography (GC) instrument for one hour before use according to the
manufacturer’s instructions. Blank desorptions of the fibre were carried out to
ensure that no contamination would be present both before and during use.
A total of 19 priority PAHs, including the seven B2-PAHs (probable human
carcinogens) US EPA (1995), were measured in the soil samples. The 19 target
PAHs included: naphthalene, 2-ethylnaphthalene, acenaphthylene,
acenaphthene, phenanthrene, anthracene, fluorene, dibenzofuran, fluoranthene,
pyrene, benzo[a]anthracene, chrysene, benzo[b]fluoranthene,
benzo[k]fluoranthene, benzo[e]pyrene, benzo[a]pyrene (BaP), indeno[1,2,3-
cd]pyrene, benzo[ghi]perylene, and dibenzo[ah]anthracene. The reference

53
standard used was supplied by Chem Service at concentration 2000 µg/ml in
CH2Cl2. The solvent was benzene at ratio (50:50), Lot 340-97A.
A soil sample of 10 g was accurately weighed into a crimp cap vial. The vial was
sealed and placed on a hot plate (60 ºC). The SPME apparatus was inserted into
the vial via the septa and the fibre exposed to the headspace above the soil
sample for 30 minutes. The fibre was then retracted and the SPME assembly
removed from the vial and placed in the inlet of an Agilent GC/MS system where
the fibre was again exposed and the adsorbed components desorbed onto the
GC column (Stack, Fitzgerald, O’Connell, & James, 2000).
3.5 Analyses
The sample extracts and standard solutions were analysed by a 70 eV electron
impact (EI) GC – MS. An Agilent 5973 Mass Selective Detector coupled to an
Agilent 6890 Network GC system was used for the analyses. Data acquisition
and processing were performed with a ChemStation data system. The GC
column (J+W Scientific, Folsom, CA, USA) was a DB-5MS fused silica capillary
(30 m, 0.25 mm ID, 0.25 µm film thickness). Helium was used as the GC carrier
gas. The carrier gas helium was maintained at a constant pressure of 60KPa.
The injector port temperature was set to 250 ºC. Fibre desorption took place in
split less mode with the splitter activated after seven minutes to purge the fibres
of any residual compounds so as to eliminate the risk of carryover of compounds
between extractions. Following injection, the GC column was held at 40 ºC for
two minutes and was temperature programmed to 280 ºC at 10 ºC/minute and
held at 280 ºC for 25 minutes. Peaks monitored were the molecular ion peaks
and associated characteristic fragment ion peaks. Identification of the target
analytes was based on GC retention times relative to a reference standard and
the relative abundance of the monitored ions. Quantification was performed by
comparing the response of the integrated ion current of the target ions to those of

54
the reference standard using average response factors of the target analytes
generated from standard.
In conclusion, the methodology section of the study covered aspects on how the
data required in the study was collected. The sources of primary data were
identified, and the qualitative techniques and approaches of collecting the data
were discussed in terms of how the researcher used them in the field. The
methodology was crucial to the study in the sense that it led to a logical
extraction of data required in the study, in a manner appropriate for the nature of
the study. The methodology, therefore, resulted in the collection of mostly
qualitative data, as the nature of the study is qualitative. The data collected is
presented and analysed in the next chapter (Chapter 4). Discussion and
conclusions are provided in Chapter 5.

55
CHAPTER 4
RESULTS AND DISCUSSION
4.1 Introduction
This chapter presents and analyses the results obtained from the samples taken
from Matsapha CSO and Thonkwane wood treatment facility. The results of
calibration and standards are presented. PAHs were not detected in the
Matsapha site and thus no results are presented for this site.
4.2 Calibration and chromatograms
The soil samples were analysed using Solid phase Micro extraction and Gas
Chromatography. The compounds analysed in the soil samples from the study
area includes the following, naphthalene, acenaphthylene, acenaphthene,
fluorene, phenanthrene, anthracene, fluoranthene, pyrene, benzo[a]anthracene,
chrysene, benzo[b]fluoranthene, benzo[k]fluoranthene, benzo(a)pyrene,
indeno(1.2.3-cd)pyrene, 1.2:5.6-dibenzanthracene and 1.12-benzoperylene.
These compounds are listed as the 16 priority pollutants by EPA.
Calibration curves were prepared for each of the PAH compounds for
concentration ranges between 0.05 ppm to 20 ppm. An example of a calibration
curve is presented in Figure 4.1 where the peak area is plotted against standard
concentration.

56
y = 3E+06x + 31068R2 = 1
0
10000000
20000000
30000000
40000000
50000000
60000000
0 5 10 15 20 25
Concentration in ppm
Peak
Are
a
Figure 4.1 An example of a calibration curve prepared for naphthalene
Linear calibration graphs were obtained for all sample concentration ranges that
were determined. The correlation coefficient ranged from 0.7931 to 1 where the
average correlation coefficient is 0.921. The curves were used to determine each
PAH compound found in the samples.
The chromatogram indicated in Figure 4.2 shows a 10 ppm standard used for the
calibration of the GC/MS. Figure 4.3 shows a chromatogram with results from
sample H1. It indicates that PAHs were detected in the sample at various
retention times (refer to Table 4.1).

57
10.00 12.00 14.00 16.00 18.00 20.00 22.00 24.00 26.00 28.00 30.00 32.00 34.00 36.00
1000000
2000000
3000000
4000000
5000000
6000000
7000000
8000000
9000000
Time-->
Abundance
TIC: 0208_18.D
10.96
14.69 15.11 16.36
18.64 18.77
21.50 22.03 24.95
25.03
27.58 27.66
28.53
32.99 34.28
Figure 4.2 Chromatogram for reference standard with 10 ppm
5.00 10.00 15.00 20.00 25.00 30.00 35.00 40.00
5000000
1e+07
1.5e+07
2e+07
2.5e+07
3e+07
3.5e+07
4e+07
4.5e+07
5e+07
5.5e+07
6e+07
6.5e+07
7e+07
7.5e+07
Time-->
Abundance
TIC: 0208_19.D 2.45
3.72
3.96
10.96 11.07 12.32 12.53 12.81 13.20 13.49 13.60
13.90 14.09 14.27 14.56 14.72 14.85
15.13
15.38 15.49 15.70 15.88 16.12
16.40
16.54
16.81 17.02
17.11
17.36
17.60 17.75 17.94
18.11 18.37
18.51 18.62
18.71
18.84
19.02 19.12 19.29 19.45 19.68
19.77
19.97
20.11
20.50
20.68
20.77
20.97 21.08 21.28 21.46
21.65
21.75
22.18
22.32 22.49
22.67
22.97 23.27
23.54
23.83 24.01 24.22
24.38
24.55 24.65
25.20
25.32 25.44 25.55 25.67
25.97
26.11 26.21 26.30
26.79
27.06 27.29 27.44
27.72
28.04 28.32 28.50 28.65 28.84 29.21 30.18
30.63 31.15 31.82 33.84
Figure 4.3 Chromatogram showing concentration of various PAHs in sample H1

58
Table 4.1 Retention times of various PAHs
COMPOUND Retention
Time COMPOUND Retention Time
Naphthalene 10.96 Benzo[a]anthracene 24.95
Acenaphthylene 14.69 Chrysene 25.03
Acenaphthene 15.11 Benzo[b]fluoranthene 27.58
Fluorene 16.36 Benzo[k]fluoranthene 27.66
Phenanthrene 18.65 Benzo(a)pyrene 28.53
Anthracene 18.77
Indeno(1.2.3-
cd)pyrene 34.28
Fluoranthene 21.51
1.2:5.6-
Dibenzanthracene 32.99
Pyrene 22.03 1.12-Benzoperylene 33.22
4.2.1 Method detection limit
The term ‘detection limit’ refers to the smallest amount that can be detected
above the noise procedure and within a stated confidence limit. Table 4.2 shows
the detection limits for the PAHs in the study. The method detection in this study
ranged from 0.12 µg/g to 20.08 µg/g. Any samples with values less than the
detection limit were recorded as below detection limit.

59
Table 4.2 Detection limits for 16 PAHs
COMPOUND LOD µg/g COMPOUND LOD µg/g
Naphthalene 0.18 Benzo(a)anthracene 20.08
Acenaphthylene 1.52 Chrysene 1.16
Acenaphthene 0.12 Benzo(b)
fluoranthene
0.94
Fluorene 0.14 Benzo(k)
fluoranthene
0.90
Phenanthrene 0.22 Benzo(a)pyrene 7.12
Anthracene 0.20 Indeno1,2,3-
cd)pyrene
2.52
Fluoranthene 0.30
1,2,5,6-
Dibenzoanthracene
2.56
Pyrene 0.30 1.12 benzoperylene 2.87
LOD - Limit of detection
4.2.2 Instrument performance
The performance of a GC/MS is obtained from the number of theoretical plates
usually 4 0000 theoretical plate and the height of the theoretical plates and this is
achieved by using the Van Deemter equation.
According to Van Deemter, Zuiderweg and Klinkenberg (1956), this equation in
chromatography relates the variance per unit length of a separation column to the
linear mobile phase velocity by considering physical, kinetic, and thermodynamic
properties of a separation. The variance per unit length of the column is taken as
the ratio of the column length to the column efficiency in theoretical plates. The
Van Deemter equation is a hyperbolic function that predicts that there is an
optimum velocity at which there will be the minimum variance per unit column
length and, thence, a maximum efficiency.

60
The number of theoretical plates is given as:
N= L/H
Where : N - No. of theoretical plates or plate count
L - Length of the column (which we have from instrument settings)
H - Plate height.
The column used in the GC/MS had 128 400 theoretical plates. This is far above
the recommended number of theoretical plates, which is 40 000. The height of
the theoretical plate was calculated to be 0.023 and is also close to the ideal
figure of 0.
4.3 Sample concentrations
This section outlines and discusses the sample concentrations obtained from the
preliminary survey where the study site was selected and the results obtained
from the soil samples taken in the study site.
4.3.1 Preliminary survey results
PAHs were analysed in two sites, namely Matsapha CSO (wood storage facility)
and Thonkwane (creosote wood treatment facility). Neither the photo ionisation
detector nor the laboratory analysis identified any PAHs in the Matsapha CSO
site soils. Similarly, none were identified in the sediments and water samples
from the Lusushwana River. Therefore no further investigations were made in the
Matsapha CSO site. PAHs were detected in the Thonkwane wood creosote sites
and thus this site was further analysed for PAH contamination.
The results obtained from the Thonkwane site are shown in Table 4.2 and Figure
4.4. The PAHs were detected in three randomly selected sites, namely pure

61
creosote (creosote), contaminated soil below creosote tank (tank site) and a
waste disposal site at the Thonkwane creosote wood treatment facility. These
were naphthalene, acenaphthene, fluorene, phenanthrene, anthracene,
fluoranthene and pyrene. The concentration of the detected PAHs ranged from
0.0001 mg/kg to 0.0793 mg/kg. The dominant PAH compound in the three sites
were acenaphthene, fluorene, phenanthrene and fluoranthene. This can be
attributed to the fact that the above compounds are the predominant PAHs in
creosote. Highest PAH levels were recorded for naphthalene. This can be
attributed to the fact that when the percentage by weight of PAHs in creosote is
compared, naphthalene is found to be amongst the highest.
Table 4.3 PAH concentration in creosote plant (soil)
SAMPLING SITES
Concentrations in mg/kg
Compound Waste site
Tank site Creosote
Naphthalene 0.0166 B/D 0.0793
Acenaphthene 0.0350 0.001 0.0069
Fluorene 0.0039 0.0033 0.0060
Phenanthrene 0.0035 0.0025 0.0046
Anthracene 0.0037 B/D 0.0046
Fluoranthene 0.0002 0.0001 0.0004
Pyrene 0.0001 B/D 0.0002
B/D below detection limit
It can be seen from Figure 4.4 that the sample (pure creosote) contained most of
the PAH compounds and that these were also in high concentrations. The
compounds detected in the creosote are generally those found in creosote.

62
The waste site had many PAHs at high levels when compared to the tank site.
This can be attributed to soil type and the organic matter present in the study
sites. The creosote tank site (tank site) is made up of clay soil without organic
matter whilst the waste site has loamy soils with organic matter. According to
Manahan (2000), soil type determines the mobility of PAHs. The levels of
acenaphthalene and naphthalene from the three sampling sites were more than
the recommended EPA limit, which is 0.01 mg/kg.
Figure 4.4 PAH levels from various sampling sites at Thonkwane
4.3.2 Further investigation of PAHs at the Thonkwane creosote wood treatment facility
The results of the distribution of PAHs in the study area (Thonkwane creosote
wood treatment facility) are presented in Table 4.4. A broad spectrum of the
PAHs listed in the EPA priority pollutants list were detected from the soil samples
even though some were at very low levels. The PAH concentration ranged from
0.01 to 0.29 mg/kg. No PAHs were detected in the control point.
0
0.02
0.04
0.06
0.08
0.1
0.12
Nap
htha
lene
Ace
naph
then
e
Fluo
rene
Phe
nant
hren
e
Ant
hrac
ene
Fluo
rant
hene
Pyr
ene
PAH compound
Con
cent
ratio
n in
mg/
kg
Pure Creosote
Creosote Tanksite
Waste disposal site

63
There are some compounds which were not picked up in some of the sampling
sites. For instance benzo[b]fluoranthene was picked up in only three sampling
sites out of 11 sites.
Table 4.4 Concentration of PAHs from various sampling points (in mg/kg)
EFFLUENT
PONDS (A)
TRENCH
(B)
EFFLUENT
TANKS (C)
PINE LOGS
(D)
ROAD
(E)
CONTROL
(F)
COMPOUND H0 H1 H2 H3 H4 H5 H6 H7
H8
H9 C1 C2
Naphthalene 0.05 0.01 n/d n/d 0.07 n/d n/d n/d 0.14 n/d n/d n/d Acenaphthene 0.01 0.02 0.01 n/d 0.06 0.02 0.04 n/d n/d n/d n/d n/d Fluorene 0.03 0.01 0.04 n/d 0.01 0.06 0.01 0.01 0.29 n/d n/d n/d Phenanthrene 0.03 n/d 0.06 n/d n/d 0.05 0.01 0.01 0.02 n/d 0.02 n/d Anthracene 0.01 n/d 0.06 n/d 0.20 0.02 0.20 0.01 0.03 n/d 0.03 n/d Fluoranthene 0.01 0.03 0.05 n/d 0.06 0.02 0.01 0.01 0.03 n/d 0.04 n/d Pyrene 0.01 0.01 0.06 n/d n/d 0.02 n/d 0.01 0.01 n/d 0.02 n/d Benzo[a]anthracene n/d n/d 0.01 n/d n/d n/d 0.02 n/d 0.01 n/d 0.01 n/d Chrysene n/d n/d 0.01 n/d 0.01 0.01 0.02 n/d 0.11 n/d n/d n/d Benzo[b]fluoranthene n/d n/d 0.01 n/d 0.01 n/d n/d n/d n/d n/d 0.01 n/d
• Units in mg/kg
• n/d= not detectable
H0 15 cm below effluent pond H6 15 cm above pine logs
H1 60 cm below effluent pond H7 60 cm above pine logs
H2 15 cm next to trench H8 15 cm on the road
H3 60 cm next to trench H9 60 cm on the road
H4 15 cm below effluent tank c1 15 cm control
H5 60 cm below effluent tank c2 60 cm control
The dominance of fluorene, anthracene, fluoranthene, phenanthrene and pyrene
in almost all the samples is noted. There is an indication that the creosote
treatment facility has some sites that are contaminated which have PAH levels of
more than 0.01 mg/kg. The levels of PAHs detected in most of the sample areas
were observed to be higher than the control point. This is an indication that the
plant is adding contaminants to the surroundings where the effluent is
discharged.

64
The trench, effluent tank, pine logs and road are contaminated with various
PAHs. The road seems to be more contaminated than all the other sampling
sites.
Figure 4.5 Graphical representation of PAHs next to effluent ponds (A)
Figure 4.5 presents the concentration of PAHs next to the effluent pond (A). The
concentration of the two- to three-ring PAHs, naphthalene, fluorene,
phenanthrene and anthracene is high in this site. The PAH compounds were also
detected in the sample containing creosote from the preliminary survey. This is
an indication that the effluent pond overfills and contaminates its surroundings
with PAHs. The levels of the PAHs are above the recommended limit, as shown
by the bold line. This is an indication that the site has been contaminated by
PAHs and has to be cleaned up.
0
0.01
0.02
0.03
0.04
0.05
0.06
Effluent Ponds 15cm Effluent ponds 60cm Control 15cm Control 60cm
Sampling sites
Con
cent
ratio
n (m
g/kg
)
Naphthalene Acenaphthene Fluorene Phenanthrene
Anthracene Fluoranthene Pyrene Benza[a]anthracene
Chrysene Benzo[b]fluoranthene

65
Figure 4.6. Graphical representation of PAHs detected below effluent trench (B)
PAHs were not detected at 60 cm depths. Most of the PAHs, which are dominant
in creosote, were recorded at the 15 cm depth. The high levels of PAHs in the 15
cm layer can be attributed to the grass vegetation found in this layer. This is in
agreement with the literature, which states that PAHs tend to bind with organic
matter (Lundstedt, 2003).
0
0.01
0.02
0.03
0.04
0.05
0.06
0.07
Trench 15cm Trench 60cm Control 15cm Control 60cm
Sampling sites
Con
cent
ratio
n (m
g/kg
)
Naphthalene Acenaphthene FluorenePhenanthrene Anthracene FluoranthenePyrene Benza[a]anthracene ChryseneBenzo[b]fluoranthene

66
Figure 4.7 Graphical representation of PAHs detected below the effluent tank (C)
Figure 4.7 indicates that the PAH concentrations were higher in the top layer (15
cm) than the 60 cm layer. For instance, high levels of anthracene,
acenaphthalene, fluorene and benzo[b]fluoranthene and fluoranthene were
found. The bold line shows that some the PAHs, for instance fluorene,
anthracene and naphthalene, are above the recommended US EPA limit. This
implies that this site has been contaminated by PAHs. The pattern that some of
the PAHs found in the 60 cm layer shows that some PAHs, for instance pyrene,
are not found in the top 15 cm layer. This is an indication that the PAHs in the 60
cm layer originated from a different source. According to Wilke (2000), the source
can be either anthropogenic or of biopedogenic origin or can be a result of both.
0
0.05
0.1
0.15
0.2
0.25
Effluent tank 15cm Effluent tank 60cm Control 15cm Control 60cm
Sampling sites
Con
cent
ratio
n (m
g/kg
)
Naphthalene Acenaphthene Fluorene Phenanthrene
Anthracene Fluoranthene Pyrene Benza[a]anthracene
Chrysene Benzo[b]fluoranthene

67
Figure 4.8 Graphical representation of PAHs detected on the pine logs (D)
Figure 4.8 shows that no PAHs were recorded in the control point. High levels of
PAHs were observed in the 15 cm layer when compared to the 60 cm layer. The
PAH levels of were quite low when compared to the other sites. This can be
explained by the fact that the physical chemical properties of the PAHs, such as
the octanol / water partitioning coefficient (Kow) and solubility suggest that these
compounds are not easy to biodegrade in the environment. Generally, PAH
compounds have very high Kow values within the family of organic compounds,
indicating that they prefer to adsorb themselves onto biota (plant and animal fatty
tissues) as opposed to the soil matrix. They also have correspondingly high
bioaccumulation factors (BCF), which indicate the tendency of a compound to
bioaccumulate and become part of the food chain.
0
0.05
0.1
0.15
0.2
0.25
Pine logs 15cm Pine logs 60cm Control 15cm Control 60cm
Sampling sites
Con
cent
ratio
n (m
g/kg
)Naphthalene Acenaphthene FluorenePhenanthrene Anthracene FluoranthenePyrene Benza[a]anthracene ChryseneBenzo[b]fluoranthene

68
Figure 4.9 Graphical representation of PAHs at the road (E)
Figure 4.9 indicates that the road sample recorded high levels of fluorene (0.29
mg/kg) followed by naphthalene (0.14 mg/kg) and chrysene (0.11 mg/kg). These
are PAHs that are prevalent in creosote. The only PAH that was not picked up in
the 15 cm layer was acenaphthene. It can be noted that the PAH levels on the
roadside were higher in the upper layer (15 cm) than the lower 60 cm layer of
soil. The results are in line with a study by Wilcke, Krauss, Safrronov, Fokin and
Kaupenjohann (2005), who observed that significant concentrations of PAHs are
deposited and accumulate in surface soils. The effluent, as well as other factors
such as the vehicles using the road, is likely to influence the PAH levels in the
road. The results are in line with a study by Adamczewska, Siepak and
Gramskwa (2000) who observed that the PAH content next to roads is high and
the surface layer is more contaminated. The results of the study are a cause for
concern since the PAHs are likely to get to the food chain and contaminate all
trophic levels with PAHs.
0
0.05
0.1
0.15
0.2
0.25
0.3
0.35
Road 15cm Road 60cm Control 15cm Control 60cmSampling sites
Con
cent
ratio
n (m
g/kg
)
Naphthalene Acenaphthene FluorenePhenanthrene Anthracene FluoranthenePyrene Benza[a]anthracene ChryseneBenzo[b]f luoranthene

69
According to Manahan (2000), soil type is also an important factor determining
the mobility of organic pollutants, such as PAH compounds. The type of soil
found at the roadside, where there were high concentrations, was found to be
loamy and thus rich in organic matter. This would explain why the PAH
compounds preferred to be transported from their source to that point where they
then formed strong complexes with the organic matter. The formation of these
complexes limits the mobility of these compounds in the environment. This is
opposed to the soil type found at the processing plant, which was mostly clay and
so lacked the capacity of having enough organic matter on which pollutants
would adsorp.
The spatial distribution of the PAH compounds revealed that the concentrations
of some of compounds were higher at a distance away from the point of
discharge, where one would expect very high concentrations. For instance, the
concentrations at the sites found at the trench, an outlet from the plant which
discharges the creosote onto the environment, had lower levels than at the
roadside a few metres downward from the trench. Although one would expect
higher levels at the trench due to the constant input from the plant, this is not the
case. This can also be attributed to the low water solubility constants of PAH
compounds in aqueous media, meaning that they are lipophilic. This, therefore,
suggests that these compounds do not dissolve in water but become suspended
in the aqueous solution downslope, so that higher levels are found away from the
processing plant at the road site.
4.3.3 Depth
Figure 4.10 shows that the control point had concentrations of PAHs below
detection limits. The trench at this depth had more types of PAHs (10) followed
by the road with eight types. The dominant PAHs from the various sampling sites
at 15 cm depth were fluorene, phenanthrene, anthracene and fluoranthene.
According to Wilke (2000) and Muller (1989), these are predominant compounds
found in contaminated soil subsurface horizon. The road site recorded the

70
highest PAH level for fluorene (0.29 mg/kg) and naphthalene (0.14 mg/kg). The
highest level for anthracene (0.20 mg/kg) was recorded in the pine logs and
effluent tanks.
The results in Figure 4.10 generally show that the 15 cm layer contained more
PAHs in high levels when compared to the 60 cm layer. The PAHs in the control
site (road 60 cm and trench 60 cm) were below detection limit. The variation in
the PAH concentrations and type can be explained by the differences in the site
conditions such as organic matter content, soil type and structure and leachability
of soil as well as the physicochemical properties of PAHs.
The results are in line with a study by Wilcke et al., (2005), who observed that
significant concentrations of PAHs are deposited and accumulate in surface soils.
This is also explained by Wild and Jones (1995), who state that the top 15 cm of
soil acts as a major repository, containing about 94% of all PAHs in the
environment. The influence of organic matter can be explained by Adamczewska
et al. (2000), who observed that in soils with more organic matter, the PAH
concentration is higher than those with less organic matter.
The observed results can be also largely be attributed to the physicochemical
properties of PAHs. PAHs are liphopholic and hydrophobic, showing a high
affinity for organic matter (Lundstedt, 2003). The octanol / water partitioning
coefficient (Kow) and solubility of PAHs also suggest that these compounds are
not easy to biodegrade in the environment. These have very high Kow values
within the family of organic compounds, indicating that they prefer to adsorb
themselves onto biota (plant and animal fatty tissues) as opposed to the soil
matrix. They also have correspondingly high bioaccumulation factors (BCF),
which indicate the tendency of a compound to bioaccumulate and become part of
the food chain. This then means that the PAH compounds, in as much as they do
not biodegrade easily, become incorporated into the fatty tissues of biota. In this
case they are likely to be found in high concentrations on the upper soil with

71
vegetation. This reduces the overall load of the pollutants in the lower soil, which
explains why the concentrations are lower than expected.
On another note the leaching process of individual PAHs and their persistence
against microbial decomposition can influence the distribution pattern in the soil
profile (Wilke, 2000).
0
0.1
0.2
0.3
0.4
0.5
0.6
0.7
EffluentPonds15cm
Effluentponds60cm
Trench15cm
Trench60cm
Effluenttank15cm
Effluenttank60cm
Pinelogs
15cm
Pinelogs
60cm
Road15cm
Road60cm
Contro l15cm
Contro l60cm
Sampling sites
Naphthalene Acenaphthene Fluorene PhenanthreneAnthracene Fluoranthene Pyrene Benza[a]anthraceneChrysene Benzo[b]fluoranthene
Figure 4.10 Graphical representation of PAHs in 15 cm and 60 cm layers
4.4 Chemometric data analyses
The raw data from the analysis containing the relative concentrations of the PAH
compounds was treated for any variations, correlations and the spatial
distribution of the variables. Chemometrical data analysis deals with the
manipulation of the multivariate data set so that any hidden trends in the data are
magnified and explained. This was done using a software-based approach, the
knowledge of the sites and the chemistries of the pollutants under investigation.
The software Statistica 6.1 was used to aid in the analysis of the data.

72
It is important to know if there are any correlations between the variables in the
data set throughout the study area. A correlation matrix was constructed to
assess the linear dependence of the variables, and the results are shown in
Table 4.5.
Table 4.5 Variable to variable linear dependence correlation matrix
Naph Acen Fluore Phen Anthr Fluora Pyren Benz[a]a Chrys Benz[b]f
Naph
1.00 0.14 0.83 -0.02 0.90 0.34 -0.14 0.09 0.83 -0.06
Acen 1.00 -0.18 -0.08 0.29 0.50 -0.16 0.17 -0.07 0.41
Fluore 1.00 0.25 0.78 0.18 0.11 0.26 0.97 0.03
Phen 1.00 0.04 0.34 0.85 0.24 0.12 0.63
Anthr 1.00 0.58 0.01 0.22 0.82 0.14
Fluora 1.00 0.52 0.21 0.19 0.43
Pyren 1.00 0.25 0.01 0.44
Benz[a]a 1.00 0.41 -0.14
Chrys 1.00 -0.06
Benz[b]f 1.00
The correlation matrix above shows that, throughout the study area, there is a
strong positive correlation between the compound naphthalene with fluorene,
anthracene and chrysene. The data was further treated to observe PAH pollutant
compounds, which have similar pollution signatures with respect to the study
area. This was done by projecting the data onto tree diagrams (dendograms)
which then group the data depending on the type of similarities in their pollution
signatures. The results of this analysis are shown in Figure 4.11.

73
Tree Diagram showing the correlation of the variables.
Anthr Flor Flou benz[b]f Ben[a]a Py rn Phen Acen Chry s Naph0
20
40
60
80
100
120
(Dlink/D
max)*100
Figure 4.11 A variable tree diagram for the study area
Figure 4.11 above identifies three distinct pollutant clusters, at the 40 % linkage
distance, with respect to their pollutant signature and behaviours in the
environment. The tendency of the pollutants to cluster together is a function of
many factors. This includes the fact that they probably have a similar source, or
that their physical chemical properties are similar or that their degradation
patterns and / or mobility indices are similar in the environment. It is evident from
this figure that the compounds chrysene and naphthalene form an independent
cluster and that the compounds, fluoranthene, benzo[b]fluoranthene,
benzo[a]anthracene, pyrene, phenanthrene, and acenaphthalene form a larger
and separate cluster. The last cluster is that involving fluorene and anthracene.
The cluster from this analysis was confirmed using principal component analysis
(PCA). In PCA, the variables are projected onto a few principal components
(PCs), which are selected such that the first PC explains much of the variance or
correlation in the data as far as possible and the second is by definition
orthogonal to the first and explains as much variance or correlation as possible,
not yet explained by the first, and so on. The data was first projected onto the
PC1, PC2 plane and the necessary variations were noted. The results of this
analysis are shown in Figure 4.12.

74
PCA for the variables
Active
Naph
Acen
Flo
Phen
Anthr
Flor
Pyrn
Benz[a]a
Chrys
Benz[b]f
-1.0 -0.5 0.0 0.5 1.0 Factor 1 : 39.31%
-1.0
-0.5
0.0
0.5
1.0
Factor 2 : 25.71%
Figure 4.12 PCA plot projecting the variables along the PC1, PC2 plane
The results from Figure 4.12 confirm the results from Figure 4.11 in that three
clusters of pollutant groups are identified. This then confirms the notion that the
variables contained in those clusters have similar properties or pollution
signatures and they will then become the subject of much discussion.
It is also worth noting from Figure 4.12 that the PAH compounds acenaphthalene
and benzo[a]anthracene form a separate cluster from the others. This confirms
an earlier representation using cluster analysis in Figure 4.11. These approaches
are in agreement that these two pollutants have some common pollution
signatures, which make them behave in a characteristic manner. The variables in
the cluster involving the compounds naphthalene, fluorene, anthracene and
chrysene are also in line with the results from the tree diagrams in Figure 4.11.
According to the principles of PCA, clusters furthest from the origin imply that the
variables contained herein contribute a larger proportion to the observed
variances in the data set. This means that the compounds naphthalene, fluorene,
anthracene and chrysene are the major contributors to the variance, as well as
the group containing pyrene, phenanthrene and benzo[b]fluoranthene.

75
However, the proximity of the cluster containing the compounds acenaphthalene
and benzo[a]anthracene to the origin causes them to have low contributions to
the observed pollution trends in the study. This, according to the premises of the
PCA, necessitates that the analysis be projected along the PC1 and PC3 plane
to observe if there are any changes in the projection of the variables. The
analysis was carried out and the results are projected in Figure 4.13.
Figure 4.13 PCA plot projecting the variables along the PC1, PC3 plane
It is evident from the projections in Figure 4.13 above that the cluster in question
containing the variables acenaphthalene and benzo[a]anthracene aligns itself
differently along the PC1, PC3 plane. The compound acenaphthalene clearly
shows that it has a strong correlation along the PC3 plane and very weak along
the PC1 plane. This then explains that this variable was masked when the data
was projected along the PC1, PC2 plane, as shown in Figure 4.12. However, the
compound benzo[a]anthracene prefers to align itself with the vicinity of the origin,

76
meaning that even along the PC1, PC3 plane, it does not have any significant
contribution to the overall variance in the analysis.
In summary, the PCA was able to identify four separate clusters, onto which the
variables prefer to align themselves. There are three clusters within the PC1,
PC2 plane and one within the PC1, PC3 plane. The variables are discussed
based on this grouping system.
Principal component analysis was further employed to determine the distribution
of the variables in space. The sites were also inputted into the software to
ascertain their preferred clustering, as a function of the variables. The results of
this analysis are shown in Figure 4.14.
Figure 4.14 PCA plot projecting the sites along the PC1, PC2 plane
Figure 4.14 shows the alignment of the sites along the PC1, PC2 plane. This
preferred orientation of the sites depends, to a large extent, on the types of the
dominant pollutant compounds contained in each site, with respect to the PCA
output. This then suggests that in order for one to be able to explain these
observations there is need for a comparative approach. The spatial distribution is

77
explained side to side with the PCA variable plots, as shown in Figures 4.14 and
4.12.
From these plots it can be observed that the cluster which contains the
compounds pyrene, benzo[b]fluorene and phenanthrene contribute significantly
along the PC1 plane, in the variable PCA plot. Interestingly, a closer look at the
spatial distribution of the sites in Figure 4.14 reveals that the preferred trends
depicted by the sites is as a result of the overall pollution signatures of the
compounds. This, therefore, means that the sites, trench 15 cm and effluent tank
60 cm, are enriched with the compounds pyrene, benzo[b]fluorene and
phenanthrene. In the same vein, the compounds naphthalene, fluorene,
anthracene and chrysene have particular pollution signatures which influence the
site, road 15 cm, to have a strong correlation with respect to both the PC1 and
PC2 planes.
The compounds which are located within the vicinity of the origin
(acenaphthalene and benzo[a]anthracene) as shown in Figure 4.12, influence the
orientation of many sites in the study area. These are the sites, road 60 cm, pine
logs 15 cm, pine logs 60 cm, effluent tank 15 cm, effluent tank 60 cm and trench
60 cm. However, due to their proximity to the origin, there is a need to project
them in the PC1, PC3 plane so as to observe any hidden trends. The results are
shown in Figure 4.15.

78
Figure 4.15 PCA plot projecting the sites along the PC1, PC3 plane
The results shown in Figure 4.15 above suggest that even when the data is
projected in this dimension there is still minimum contribution of this whole group
to the observed variances and trends. This then leads one to conclude that their
behaviour is as a result of the signatures of the compound benzo[a]anthracene,
which also failed to contribute much to the variance (see Figure 4.13 above). In
summary, the PCA clusters resulting from the projection of the sites indicate that
there are only three groupings that the compounds prefer to align themselves
onto, with respect to the sites. This would imply that the fourth group identified
with the variables does not contribute much to the observed trends, and so will
not form part of the next discussions.

79
Figure 4.16 PCA plot projecting the sites along the PC1, PC3 plane
Figure 4.16 shows the spatial distribution of the pollutants throughout the study
area, with respect to depth variations. This figure confirms some of the findings
from Figure 4.12, in terms of the clusters observed. For instance, the site road 15
cm has a predominance of the PAH compounds as depicted in Figure 4.12. They
are naphthalene, anthracene, fluorene and chrysene. This explains the preferred
cluster, as they share the same source in terms of pollution signatures at this
site. The position of this site in the PC1 plane also suggests a strong contribution
of this site and the compounds to the overall observed pollution trend. The other
sites, trench15 cm and control 60 cm, also share some similarities in terms of
their correlations. Figure 4.16 explains that the observed relationship between
these sites (though not so strong) is due to the contribution of the PAH
compounds as shown in the cluster in Figure 4.12 above. The last cluster at the
origin of the PCA plane is also explained in terms of the cluster that is around the
origin, which shows that the site, trench 15 cm, pine logs 15 cm and effluent
tanks, have made a minimal contribution to pollution in the study area.
In conclusion it must be stated that the project site has been contaminated with
PAHs. Even though these are not in very high concentrations, for the company to

80
comply with EPA, SEA and the ISO requirements for its major client for the
treated poles (SEB), the site has to be rehabilitated. Phytoremediation is the
mitigation measure recommended for clean-up of the contaminated area.

81
CHAPTER 5
CONCLUSION
5.1 Introduction
The objectives of the study were to determine the presence of Polycyclic
Aromatic Hydrocarbons (PAHs) in soils and water samples in the Matsapha
Central Stores Office (CSO) wood storage facility and the Thonkwane creosote
wood treatment facility, to determine leachability and to compare the results with
SEA and US EPA standards. This chapter answers the research problem,
accepts or rejects the hypothesis, and concludes the findings on the extent of
PAH pollution in the creosote wood storage facility in Matsapha CSO and the
creosote wood treatment facility in Thonkwane, Swaziland. It also presents
mitigation measures and recommendations for future work.
5.2 Total PAHs and pollutant profile
The study investigates the extent of PAH pollution in surrounding environments
(soil, sediments and surface waters), SEB’s wood storage facility in Matsapha
Central Stores Office and a creosote wood treatment facility in Thonkwane. The
results from the Matsapha Central Stores indicated that no PAHs were picked up
from the soils and surface waters where the study area drains, whilst the results
from the wood treatment facility in Thonkwane indicated that the soils in the
project area were contaminated by PAHs and these were concentrated in the
upper 0 – 15 cm soil layer. The PAH levels in the creosote facility were also
observed to be above the recommended US EPA and SEA limit in soils except
for fluoranthene and benzo[a]anthracene.
Therefore, based on the results of the study it can be concluded that the
hypothesis that the pole storage site in Matsapha CSO is contaminating soils and

82
surrounding surface waters with PAHs is rejected. However, the second
hypothesis that the wood creosote treatment plant in Thonkwane (Swazi Timber
Sales) is contaminating soils and surrounding surface waters with PAH is
accepted.
The results from the creosote wood treatment facility in Thonkwane indicated that
the study site was contaminated with a wide range of PAHs. The PAHs and the
detected average concentrations are as follows: naphthalene (0.023 m/kg),
acenaphthene, (0.013 mg/kg) fluorene (0.038 mg/kg), phenanthrene (0.017
mg/kg), anthracene (0.054 mg/kg), fluoranthene (0.022 mg/kg), pyrene (0.012
mg/kg), benzo[a]anthracene (0.004 mg/kg), chrysene (0.013 mg/kg) and benzo[b]
fluoranthene (0.003 mg/kg). The concentrations of the identified PAHs were
beyond the acceptable minimal level, which is 0.01 mg/kg as recommended by
US EPA and SEA. This is an indication that the site is contaminated with the
various PAHs mentioned above. This can only be attributed to the effluent from
the creosote wood treatment plant.
The results from the creosote wood treatment facility in Thonkwane also showed
that PAHs such as anthracene, fluorene, naphthalene and fluoranthene were
dominant in all the sampling sites. The compounds occurred in very high
concentrations (0.64 mg/kg, 0.46 mg/kg, 0.27 mg/kg and 0.26 mg/kg). These
compounds are those found in pure creosote as determined in the sample taken
from the site. The soil samples taken from the road site had the highest PAHs
concentration when compared to all the sites. The high levels of the various
PAHs in the road can be attributed to the effluent as well as to the traffic that
uses the road.
The concentrations of the monitored PAHs generally increased downslope of the
creosote wood treatment works. There were high concentrations of PAHs in the
road, which is at low altitude when compared with the samples taken next to the
effluent ponds, which are on a higher altitude. For instance, the concentration of

83
naphthalene was 0.05 mg/kg next to the effluent ponds and 0.14 mg/kg on the
road. One would have expected the concentration of PAHs to decrease as one
moves away from the creosote plant.
5.3 Regulations
The Matsapha CSO site did not record any PAHs, thus it can be concluded that
the levels were below the recommended US EPA and SEA limit. However, the
levels of most of the PAHs recorded in the Thonkwane site were above the
recommended US EPA limit in soil, which is 0.1 mg/kg. The results indicate that
significant soil pollution takes place in all the study sites. The top layer (0 – 15
cm) generally contained many PAHs, and at levels above the recommended US
EPA and SEA limit. The concentration of PAHs in the 60 cm layer ranged from
0.01 mg/kg to 0.06 mg/kg. These levels are also above the recommended levels
of PAHs in soil.
5.4 Depth/leachability of PAHs
The understanding that PAHs have a tendency to bind strongly with organic
matter has been found to be true in this study. There was a general decrease of
the PAH concentrations with depth in the various soil samples. According to
Lundstedt (2003) PAHs have a tendency to bind with organic matter. This has
ecotoxicological implications to burrowers such as earthworms and grazers such
as livestock and caterpillars, since their habitat as well as their food is in this
layer of soil. These organisms are exposed to the toxic effects of the PAHs,
which bind with their tissues and hence are introduced to the food chain. The
PAH levels at the Thonkwane site tend to be higher in the 15 cm layer than in the
lower 60 cm layer. This is a serious problem to livestock that graze in the study
site as well as to burrowers such as earthworms that feed at this trophic level.
This is in agreement with the literature, which states that PAHs tend to bind with
organic matter. There is, however, low mobility between the 15 and 60 cm layers

84
as a result of the fact that lower concentrations are found in the 60 cm layer when
compared to the 15 cm layer.
It was observed that the trench, effluent tank, pine logs and road were
contaminated with various PAHs. The trench was noted to be more contaminated
than all the other sampling sites. It is worth noting that the highest PAH
concentrations were found away from the effluent pond. It was expected that the
PAHs would be concentrated next to the effluent pond and at the discharge point
after the effluent tank. The soil type, the amount of organic matter present in the
site, and other sources are important components responsible for the
concentration and mobility of the PAHs in the study site.
The use of chemometrical approaches to the results obtained from the study site
made it easier to draw conclusions on the potential sources of PAHs. The PCA
was able to identify four groups of clusters, onto which the variables preferred to
align themselves. The cluster with compounds naphthalene, fluorene, anthracene
and chrysene, and the cluster with phenanthrene and benzo[b]fluoranthene are
the major contributors to the variance. Acenaphthene and benzo[a]anthracene
have low contributions to the observed pollution trends.
The PCA was further used to determine the distribution of variables in space. The
sites next to the trench 15 cm and next to the effluent pond 60 cm had high PC
values along the PC2 plane due to the presence of acenaphthalene. The second
cluster has a single site, which is next to the effluent ponds at 15 cm. This site is
enriched with benzo[b]fluorene and fluorene. The third cluster has one site, and
the road has 15, which has a strong correlation to the PC1 and PC2 planes. The
compounds naphthalene, fluorene, anthracene, and chrysene have particular
pollution signatures, which influence the road 15 cm. The sites which are located
within the vicinity of the origin such as the road 60 cm, tank 60 cm, trench 60 cm,
pine logs 15 cm and pine logs 60 cm have hidden compounds influencing them
which could not be picked up in the analyses. However, when the data are further

85
analysed it was observed that the fourth group identified with the variables still
have low contributions to the pollution trends in the study.
The study was able to achieve its intended objectives, which were firstly to
determine PAH levels in soils and water at the Matsapha Central Stores and
Thonkwane, and secondly to determine leachability and distribution of PAHs in
SEB sites and Thonkwane. PAHs were only detected in the creosote treatment
plant in Thonkwane. Thus the study on the Matsapha storage site and river was
not pursued. The PAH levels were also compared with standards to determine
compliance with US EPA and the Swaziland Environment Authority (SEA).
There are no known studies undertaken in Swaziland on PAHs. Therefore the
data from this study will be used as baseline data for PAH studies in Swaziland. It
will also assist the Swaziland Environment Authority who are currently conducting
an inventory of persistent organic pollutants in the country as a requirement by
the Stockholm Convention, which Swaziland is party to. It will also enable SEA to
know the pollution status of the project site for any monitoring initiatives
according to the Environmental Management Act (2002).
5.5 Recommendations and mitigation
5.5.1 Mitigation measures for health and safety in the study areas
In order to minimise the potential and existing environmental pollution impacts,
the Thonkwane creosote treatment plant and the SEB are advised to adhere to
occupational health and safety rules and regulations and implement best
environmental practices.
The urgent issue which has to be addressed on the safety aspect of the
mitigation measure would be to supply the workers in the creosote plant and pole
storage facility with the right protective clothing such as gloves, respirators,
overalls and boots. The employees, suppliers, contractors and clients must also

86
be made aware of the dangers of creosote and how they must manage the
products in a safe and environmentally sound manner.
5.5.2 The best environmental practices
5.5.2.1 Thonkwane The best environmental practices will include waste minimisation and stormwater
management. Wastewater volumes must be minimised by eliminating leaks,
spills and drips, and by segregating stormwater runoff and improving general
maintenance. Furthermore, oil separators, which can be purchased from Drizit,
can be installed and used to clean up water from the effluent ponds. Following
the removal of the oil the remaining water in the pond can be evaporated. The
principle behind the evaporation of wastewater is to dispose the water fraction
whilst leaving the organic constituents for subsequent recycling or disposal. The
facility should also install basins and drip trays to capture all creosote from
drippings to be reused.
The cylinder and treated wood storage facility should be covered to prevent rain
from collecting on the pads (see Figure 5.1). Stormwater must also be diverted
away from the contaminated areas. The reduction and diversion of water flows
also allow for the more reliable and consistent operation of the wastewater
treatment system (Morgan & Burdell, 1978).
5.5.2.2 Matsapha CSO (wood storage facility) A concrete slab must be constructed and the treated wood must be stored on this
area. Drains must be constructed around the pole storage facility and these must
drain into an oil separator before the effluent is discharge into the Matsapha
drainage system. The water must be continually monitored to check if the effluent
is within the water quality guidelines.

87
Finally, awareness must be increased amongst workers on best management
practices, waste reduction techniques and the environmental impacts of the
processes, products and waste.
Figure 5.1 Recommended mitigation measures in the Thonkwane creosote wood
treatment facility
5.5.3 Mitigation for contaminated soil
The remediation of soils contaminated with organic chemicals can be achieved
by using various techniques such as phytoremediation, bioremediation,
engineering and natural attenuation. Due to the limitations of bioremediation,
engineering and natural attenuation, the phytoremediation technique has been
selected as the most suitable technology for the remediation of the contaminated

88
sites in the creosote treatment facility in Thonkwane. The other remediation
techniques are expensive and produce secondary waste.
According to Molobela (2005), Madsen (2003) and Cunningham et al. (1996),
phytoremediation is quicker than natural attenuation and conversely slower but
less expensive than most of the engineering techniques and traditional
bioremediation methods. It is solar-driven and does not generate secondary
waste. Phytoremediation does not require intensive engineering techniques or
excavations and thus limits environmental disturbance. The public and
government regulators also favour phytoremediation since it involves exploiting
the natural ability of the environment to restore itself. The technique is also
considered to be more aesthetically pleasing than the other techniques. It is a
self-sustaining technology since the soil is reusable after treatment.
To date studies of plant species for the remediation of petrochemical
contaminated soils showed that various grasses and leguminous plants were
suitable for phytoremediation. However, Kuiper, Lagendijk, Bloembergs and
Lugtenburg (2004) state that grasses have proved to be the most efficient plants
in phytoremediation. This is due to the fact that grasses have a highly developed
branch root system that harbours a large number of bacteria which are useful in
cleaning up contaminated environments. According to Mehmannavaz, Prasher
and Ahmad (2002), the roots provide ideal attachment sites for microbes and a
supply of exudates consisting of complex carbohydrates. Therefore it is
recommended that grasses such as Cyperus esclentus, Panicum maximum and
Elucine coracana be planted on the contaminated site. The contaminated area
must be irrigated at least twice a week until the plants have become established.
5.6 Conclusion and recommendations
In order to determine PAHs resulting from the pole storage area Matsapha CSO
and the creosote wood treatment facility at Thonkwane, soil and water samples

89
were collected for the purposes of this study. A preliminary survey was
undertaken on both sites and no PAHs were detected from the Matsapha CSO
site. No further investigations were made on this site. PAHs were detected in the
Thonkwane site and thus the site was further analysed for PAHs contamination.
Soil samples were taken at depths of 15 cm and 60 cm at strategic points within
the project area to determine PAH distribution and leachability. The results were
compared with the US EPA and SEA limit in soil, which is 0.1mg/kg. The results
showed that the 15 cm layer had high PAH levels. In most of the samples these
were above the SEA and US EPA limit, which is 0.1mg/kg. No leaching of PAH
compounds was observed to be taking place in the project area. The results
confirmed findings by other researchers that PAHs accumulate in the surface
layer and do not leach.
Based on the above it is suggested that further investigations be undertaken in
future to broaden the scope of the study. This study was not extensive since it
focused on soil samples and water samples in the Matsapha Central Stores and
soil samples only at depths of 15 cm and 60 cm in the creosote wood treatment
plant in Thonkwane. For future work it is recommended that more soil samples
are taken to depths up to 1 m. A future study should further analyse water
samples in the streams below the creosote treatment plant in Thonkwane.
It is clear from the results that the study site has PAH levels that are above the
recommended levels determined by national and international laws. Therefore it
is necessary that a clean-up by phytoremediation, as well as a monitoring
programme be implemented to minimise the impacts of these toxic elements on
the environment. However, it is recommended that future work be undertaken to
explore the best option for remediating the site.

90
REFERENCES
Adamczewska, J., Siepak, H., & Gramwska, H. (2000). Studies of Levels of
PAHs in soils subject to anthropopressure in city of Poznan. Polish Journal of
Environmental Studies. 9 (4), 305-321.
ATSDR: See Agency for Toxic Substances and Disease Registry.
Agency for Toxic Substances and Disease Registry (ATSDR). (1993).
Toxicological Profile for Polycyclic Aromatic Hydrocarbons (PAHs). Draft for
Public Comment. Update, prepared by Clement International Corporation,
under Contract No. 205-88-0608, for the U.S. Department of Health and
Human Services, Public Health Service.
Alexander, M. (1995). How toxic are toxic chemicals in soil? Environmental
Science and Technology. 29 (11), 2713-2717.
April, W., Sims. R.C., Sims, J.L., & Matthews, J.E. (1990). Assessing
Detoxification and degradation of wood preserving and petroleum waste in
contaminated soil. Journal of Waste management and Research. 8. 45-65.
AWPA: See American Wood Preservation Association.
American Wood Preservation Association (AWPA) (1977). Book of Standards.
American Wood Preservation Association, Bethesda, MD.
Arthur, C.L., Killam, L.M., Motlagh, S., Lim, M., Potter, D.W., Pawliszyn, J.
(1992). Analysis of substituted benzene compounds in groundwater using

91
solid phase micro extraction. Journal of Environmental Science and
Technology. 26 (5) 979-983.
Bergknut, M. Kitti, A., Lundstedt, S., Tysklind, M., & Haglund, P. (2003)
Assessment of the availability of PAHs from gasworks soil using different
extraction solvents and techniques. Manuscript
Bergknut, M. (2006). Characterization of PAH -contaminated soils focusing on
availability, chemical composition and biological effects. Environmental
Toxicology and Chemistry, 23 (8), 1861-1866.
Bestari, K.T.J, Robinson, R. D., & Steel, T. S. (1998) Distribution of PAH in
microcosm treated with impregnated creosote. Journal of environmental
Toxicological Chemistry. 17, 2369-2377.
Blumer, M. (2003) Polyclic aromatic compounds in nature. Scientific American
Journal. 234, 34-35.
Bodzek, D., Janoszka, B., Dobosz, C., Warzecha, L., & Bodzek, M. (1997).
Determination of polycyclic aromatic compounds and heavy metals in sludges
from biological sewage treatment plants. Journal of Chromatography. A 774,
177-192.
Boonchan, S., Britz, M. L.,& Stanley, G. A. (2000). Surfactant-enhanced
biodegradation of high molecular weight polycyclic aromatic hydrocarbons by
Stenotrophomonas maltophilia. Journal of Biotechnology Bioengineering.
59,482-494.
Bos, R.P., Hulshof, C.T., Theuws, J.L., & Henderson, P. (1983). Mutagenicity
of Creosote in the Salmonella/Microsome Assay. Journal of Mutagenicity
Research. 119, 21-25.

92
Bossert, I.D., & Bartha, R. (1986). Structure-biodegradability relationships of
polycyclic aromatic hydrocarbons in soil. Bulletin of Environmental
Contamination and Toxicology. 37, 490-495.
Brooks, K.M. (2000). Assessment of the environmental effects associated
with bridges. Naphthenic Acid Technology, Merichem, Houston, TX.
Cam, D., Gagni, S., Meldolesi, L., & Galletti, G. (2000). Determination of
polycyclic aromatic hydrocarbons in sediment using solid phase
microextraction with gas chromatography-mass spectrometry. Journal of
Chromatographical Science. 38, 55–60.
Cerniglia, C.E. (1992). Biodegradation of polycyclic aromatic hydrocarbons.
Biodegradation. 3, 351–368.
Chappell, J. (1997). Phytoremediation of TCE using Populus. EPA
Technology Innovation Office, Washington D.C..
Choudhary, G., Citra, M., McDonald, A., & Riveria, A. (2002). Toxicological
profile for wood creosote, coal tar, coal tar pitch and coal tar pitch volatiles.
U.S. Department of health and human services. 1-30.
Cunningham, S. D., Anderson, T. A., Schwab, A. P., & Hsu, F. C. (1996).
Phytoremediation of soils contaminated with organic pollutants. Advances in
Agronomy. 56, 55-114.
Dean, J.R., & Xiong, G. (2000). Extraction of organic pollutants from
environmental matrices; selection of extraction technique. Trends in analytical
chemistry. 19, 553-564.

93
Delistray, D. (1997). Toxic equivalency factor approach for risk Assessment of
PAH. Toxicological Environment Chemistry. 64, 81-108.
Djozan, D., & Assadi, Y. (1999). Monitoring of polycyclic aromatic
hydrocarbons in water using headspace solid phase micro extraction and
capillary gas chromatography. Microchemistry Journal. 63, 276–284.
Doong, R.A., Chang, S.M. & Sun, Y.C. (2000a). Solid phase microextraction
for determining the distribution for sixteen US Environmental Protection
Agency Poly Aromatic Hydrocarbons in water samples. Journal of
Chromatography. A 879, 177-188.
Doong, R.A., Chang, S.M., & Sun Y.C. (2000b). Solid phase microextraction
and headspace solid phase micro extraction for the determination of high
molecular-weight polycyclic aromatic hydrocarbons in water and soil samples.
Journal of Chromatographical Sciences. 38, 528–534.
Edlund, S. (2001). PAH as a POP. Possibilities, implications and
appropriateness of regulating global emissions of Polycyclic Aromatic
Hydrocarbons through the Stockholm Convention on Persistent Organic
Pollutants. IIIEE Reports 2001, 9.
Erikson, M., Dalhammar, G., & Borg-Karlson, A. K. (2001). Determination of
PAH in old contaminated soil using solid phase microextraction and GCMS.
Journal of Chemosphere. 44, 1641-1648.
Fernandez. P., Vilanova, R.M., & Grimalt, J.O. (1999). Sediment fluxes of
polycyclic aromatic hydrocarbons in European high altitude mountain lakes.
Journal of Environmental Science and Technology. 33, 3716-3722.
94
Frick, C.M., Farrell, R.E., & Germida, J.J. (1999). Assessment of
Phytoremediation as an In-Situ Technique for Cleaning Oil-Contaminated
Sites., Calgary: Petroleum Technology Alliance of Canada.
Gardner, W.P. (2001). Statistical analytical methods for chemistry: A software
based approach. Glasgow: Caledonean university.
Górecki, T., Boyd-Boland, A., Zhang, Z., & Pawliszyn, J. (1995). Mcbryde
medal award lecture solid phase extraction: a unique tool for chemical
measurements. Canadian Journal of Chemistry. 1297-1308.
Guerin, T. (1999). The extraction of aged PAH residues from a clay soil using
sonication and a soxhelt procedure: a comparative study. Journal of
environmental monitoring. (1) 63-67.
Gundel, L. A., Lee, V. C., Mahanama, K. R. R., Stevens, R. K., & Daisey, J.
M. (1995). Direct determination of the phase distribution of semivolatile
polycyclic aromatic hydrocarbons using annular denuders. Journal of
Atmospheric Environment. 29, 1719-1733.
Hale, R.C. & Anerio K.M. (1997). Determination of coal tar creosote
constituents in aquatic environment. Journal of Chromatography. A925, 197 –
205.
Hawthorne, S. B., Galy, A. D., Schmitt, V. O., & Miller, D. J. (1995). Effect of
SFE flow rate on extraction rates: Classifying sample extraction behavior.
Journal of Analytical Chemistry. 67, 2723-2732.
Hoffman, R.E. &. Hrudey, S.E. (1990). Evaluation of the Reclamation of
Decommissioned Wood Preserving Plant Sites in Alberta. Edmonton, Alta,
Alberta Environment.

95
Holoubek, I., Kocan, A., Holoubková, I., Hilscherová, K., Kohoulek, J.,
Falandysz, J., & Roots, O. (2000). Persistent, Bioaccumulations and Toxic
Compounds in Central and Eastern European Countries.- State-of-the-art
Report. TOCOEN. Report No 150a.
IARC: See International Agency for Research on Cancer.
Ikarishi, Y., Kaniwa, M., & Tsuchiya, T. (2005). Monitoring of PAH and water
extractable phenols in creosotes and creosote woods made and procurable in
Japan. Chemosphere. 60 (9), 1279-1287.
International Agency for Research on Cancer (IARC). (1983). Monograph on
the evaluation of the carcinogenic risk of chemicals to humans. 32. Lyon,
IARC.
International Programme on Chemical Safety. (1998). Environmental Health
Criteria 202. Selected Non-Heterocyclic Polycyclic.
Janda, V., Bartle, K.D., & Clifford, A.A. (1993). Supercritical fluid extraction in
environmental analysis. Journal of Chromatography. 642, 283-299.
King, A.J., Readman, J.W., & Zhou, J. (2004). Determination of polycyclic
aromatic hydrocarbons in water by solid phase micro extraction–gas
chromatography–mass spectrometry. Analytica Chimica Acta. 523, 259–267.
Kohler, M., Kunniger, T., Guger, E., & Crokett, R. (2000). Inventory and
emission factors of creosote, PAHs and phenols from railroad tiles treated
with creosote. Journal of Environmental Science and Technology. 34, 4766-
4772.

96
Kuiper, I., Lagendijk, E.L., Bloembergs, S., & Lugtenburg, B.J.J. (2004).
Rhizoremediation : A beneficial plant microbe interaction. MPMI. 17, 6-15.
Lageman, R., Clarke, R. & Pool, W. (2005). Electro-reclamation, a versatile
soil remediation solution. Journal of Engineering Geology. 77 (3-4), 191-201.
Langenfeld, J.J., Hawthorne, S.B., & Miller, D.J. (1996). Quantitative analysis
of fuel-related hydrocarbons in surface water and wastewater samples by
solid phase micro extraction. Journal of Analytical Chemistry. 68, 144–155.
Lee, S.C., Zou, S.C., Ho, K.F., & Chan, L.Y. (2001) Direct ultrasonic agitation
for rapid extraction of organic matter from airborne particulate, Fresenius
Journal of Analytical Chemistry. 166-169.
Liu, W., Hopke, P.K., Han, Y., Yi, S.M., Holsen, T.M., Cybart, S., Kozlowski,
K., & Milligan, M. (2003) Application of receptor modeling to atmospheric
constituents at Potsdam and Stockton, NY, Journal of Atmospheric
Environment. 37, 4997-5007.
Lundstedt, S., Haglund, P., & Orberg, L. (2003). Degradation and formation of
polycyclic aromatic compounds during bioslurry treatment of an aged
gasworks soil. Journal of Environmental Toxicological Chemistry. 22, 1413.
Lundstedt, S. (2003). Analysis of PAHs and their transformation products in
contaminated soil and remediation process. Thesis. Urmea University.
Netherlands.
Mackay, D., Shiu, W.Y., & Ma, K.C. (1992). Illustrated handbook of physical-
chemical properties and environmental fate for organic chemicals:
Polynuclear aromatic hydrocarbons, polychlorinated dioxins and
dibenzofurans. Chelsea, Michigan: Lewis Publishers.

97
Madsen, E.L. (2003). Report on bioavailability of chemical wastes with
respect to potential for soil bioremediation. US EPA Report EPA/600/R-
03/076.
Manahan, S. E. (2000). Environmental Chemistry. (7th edition). Chelsea,
Michigan: Lewis Publishers.
Manoli, E., & Samara, C. (1999). Polycyclic aromatic hydrocarbons in natural
waters: sources, occurrence and analysis, Trends in Analytical Chemistry.
18(6), 417-428.
Marcè, R.M., & Borrull, F. (2000). Solid Phase extraction of polycyclic
aromatic compounds, Journal of Chromatography. A885, 273-290.
Mastral, A.M., & Callen, M.S. (2000). A review on polycyclic aromatic
hydrocarbon (PAH) emissions from energy generation. Environmental
Science and Technology. 34, 3051-3057.
Mayer, P., Vaes, W.H.J., Wijnker, F., Legierse, K.C.H.M., Kraaij, R.H., Tolls,
J., & Hermens, J.L.M. (2004). Sensing dissolved sediment pore water
concentrations of persistent and bioaccumulative pollutants using disposable
solid phase microextraction fibers. Journal of Environmental Science
Technology. 34, 5177-5183.
Mehmannavaz, R., Prasher, S.O., & Ahmad, D. (2002). Rhizospheric effects
of alfalfa on biotransformation of polychlorinated biphenyls in a contaminated
soil augmented with Sinorhizobium meliloti. Process. Biochemistry. 37 (9),
955-963.

98
McCutcheon, S.C. & Schnoor, J.L. (2003). Phytoremediation. Hoboken NJ.:
John Wiley and Sons.
McIntyre, T., & Lewis, S.M. (1997). The advancement of phytoremediation an
innovative environmental technology for stabilization, remediation or
restoration of contaminated sites in Canada. A discussion paper. Journal of
soil contamination. 6(3), 227-241.
Mihelcic, J.R., & Luthy, R.G. (1988). Microbial Degradation of Acenaphthene
and Naphthalene under Denitrification Conditions in Soil-Water Systems.
Journal of Applied Environmental Microbiology. 54, 1188-1198.
Miller, M.M., Wasik, S.P., Huang G.L., Shiu, W.Y., & MacKay, D. (1985).
Relationships Between Octanol-water Partition Coefficient and Aqueous
Solubility. Journal of Environmental Science and Technology. 19 (6), 522-529.
Miller J.N., & Miller, J.C. (2000) Statistics and Chemometrics for analytical
chemistry. New Jersey: Prentice Hall.
Molobela, I.P. (2005). Development of rhizoremidiation as a treatment
technology for PAHs from the environment. Thesis. University of Pretoria.
Morgan, J., & Burdell, C.A. (1978). Zero discharge of wood treatment plant
effluent and specified rainwater runoff. Wood Preservers Association. 74.
Mueller, J.G., Cerniglia, C.E., & Pritchard, P.H. (1996). Bioremediation of
environments contaminated by polycyclic aromatic hydrocarbons. 125–194. In
R.L. Crawford and D.L. Crawford (ed.) Bioremediation: Principles and
applications. New York: Cambridge Univ. Press.

99
Mueller, J.G., Chapman, P. &. Pritchard, P. (1997). Creosote-contaminated
Sites. Journal of Environmental Science and Technology. 23, 1197-1201.
Muller, J.F. (1989). Occurrence and Distribution Processes of Semi-volatile
Organic Chemicals in the Atmosphere and Leaves. PhD thesis submitted to
Faculty of Environmental Sciences, Griffith University, Queensland.
Neilson, A. H. (1998). PAHs and related compounds. Berlin: Springer.
OSPAR Commission (2001). Draft OSPAR background document on
Polycyclic Aromatic Hydrocarbons (PAH).
Pickering, R.W. (1999). A toxicological review of polycyclic aromatic
hydrocarbons. Journal of Toxicology. 18, 101-135.
Portugal, H.B., Disdier, C., Arfi, J., Pastor, V., & Pauli, A.M. (1999). Analysis
by GC-MS of monocyclic aromatic hydrocarbons in thermolised waste
products. Analussis. 27, 235-241.
Quantin, C., Joner, E.J., & Portal, J.M. (2005). PAH dissipation in
contaminated river sediment under oxic and anoxic conditions. Journal of
Environmental Pollution. 134 (2), 315-322.
Rabbabah, A., & Matsuzawa, S. (2002). Treatment system for solid matrix
contaminated with fluoranthene recirculating photodegradation techniques.
Journal of Chemistry. 40, 49-57.
RECETOX TOCOEN and Associates. (2004). Persistent, bioaccumulative
and toxic chemicals in central and eastern European countries-state of the art
report. Brno 17.08.

100
Reid, B.J., Stokes, J.D., & Jones, K.C. (2004). Influence of hydroxypropyl-
beta-cyclodextrin on the extraction and biodegradation of phenanthrene in
soil. Journal of Environmental Toxicological Chemistry. 23 (3), 550-556.
Romanowski, T., Funcke, W., Grossmann, I., Konig, J., & Balfanz, E. (1983).
Gas Chromatographic/Mass Spectrometric Determination of High-Molecular-
Weight Polycyclic Aromatic Hydrocarbons in Coal Tar. Journal of Analytical
Chemistry. 55, 1030-1033.
Schnoor, J.L. (1997). Phytoremediation. Pittsburgh:Groundwater Remediation
Technologies Analysis Center.
Schwarzenbach, R.P., Gschwend, P.M., & Imboden, D.M. (2003).
Environmental Organic Chemistry. (2nd edition). New York: John Wiley.
SEB: See Swaziland Electricity Board.
Seduikiene, I., Vickackaite, V., & Kazlauskas, R. (2000). Solid phase
microextraction of polycyclic aromatic hydrocarbons from soil. Journal of
Analytical Chemistry. 45, 835–842.
Shine, P., Ika, R., & Ford, T. (1995). Multivariate statistical analysis
examination of spatial and temporal patterns of heavy metals contamination in
Bedford Harbour Marine sediments. Journal of environmental science and
technology. 29, 7.
Sims, R.C., & Overcash, M.R. (1983). Fate of polynuclear aromatic
compounds (PNAs) in soil-plant systems. Res.Rev. 88, 1-67.
Smith, R. M. (1999). Supercritical fluids in separation science-the dreams, the
reality and the future. Journal of Chromatography. A856, 83-115.

101
Stack, M.A., Fitzgerald, G., O’Connell, S., & James, K.J. (2000). Solid Phase
Microextraction. A powerful sample preparation tool prior to mass
spectrometry analysis. Journal of Chemosphere. 41, 1821.
Swaziland Electricity Board (2003). SEB Annual Report. Mbabane, SEB.
Swaziland Electricity Board (2004). SEB Annual Report. Mbabane, SEB.
Swaziland Electricity Board (2006). SEB Annual Report. Mbabane, SEB.
US DOD: See US Department of Defence.
US Department of Defence (U.S. DOD) Environmental Technology Transfer
Committee (1994). Remediation technologies screening matrix and reference
guide. (2nd edition).,EPA/542/B-94/013. NTIS PB95-104782.
US EPA: See US Environmental Protection Agency.
US Environmental Protection Agency (EPA). (1987). Health Affects
Assessment for Creosote., Washington, D.C.: US EPA, Report No.
EPA/600/8-88/025.
US Environmental Protection Agency. (1995) Integrated Risk Information
System (IRIS). Cincinnati, OH: Office of Research and Development, US
EPA.
UNEP: See United Nations Environment Programme.
United Nations Environment Programme (UNEP). (2002) Preparation of a
national implementation plan for POPs. Guidance Document. 3rd Draft.

102
United Nations Environment Programme (UNEP) (1994). Environmental
Aspects of Industrial Wood Preservation. A technical guide. 18.
Van Leeuwen, C.J., & Hermens, J.L.M. (1995). Risk assessment of
chemicals: an introduction. Dordrecht: Kluwer.
Van Deemter, J.J., Zuiderweg, F. J., & Klinkenberg, A. (1956). Longitudinal
diffusion and resistance to mass transfer as causes of non ideality in
chromatography. Journal of Chemical Engineering Science. 5, 271–289.
Waidyanatha, S., Zheng, Y., & Rappaport, S.M. (2003). Determination of
polycyclic aromatic hydrocarbons in urine of coke oven workers by headspace
solid phase micro extraction and gas chromatography-mass spectrometry.
Journal of Chemical Biological Interaction. 145, 165–174.
WHO (1998). Pollution prevention handbook, toward cleaner production.
Washington, D.C.: The World Bank.
Wilcke, W., Krauss, M., Safrronov, G., Fokin, A.B., & Kaupenjohann, M.
(2005). PAHs in soils of Moscow region concentrations, temporal trends and
small scale distribution. Journal of environmental quality. 34, 1581-1590.
Wild, S.R. & Jones, K.C. (1995). Polynuclear aromatic hydrocarbons in the
United Kingdom environment: a preliminary source inventory and budget.
Journal of Environmental Pollution. 88, 91-108.
Wilke, B., Sung, Y.F., & Jung, X. (2002). A comparative study of Extraction
methods for the extraction of PAHs from soils and sediments. Chemosphere
Journal. 48, 993-1000.

103
Wilke, W. (2000). PAHs in soil a review. Journal of plant nutrition soil science.
63, 229-248.
Wischmann, H., Steinhart, K., Hupe, G., & Montresori, R. (1996). Degradation
of selected PAHs in soil and identification of intermediates. International
Journal of Analytical Chemistry. 64, 247-255.
Yuan, S.Y., Chang, J.S., Yen, J.H., & Chang, B. (2001). Biodegradation of
Phenanthrene in River sediment. Chemosphere Journal. 43, 273-278.
Zapff-Gilje, R., Gary, E., & Rankin, M.G. (2001). Aquatic Risk Assessment
and Fisheries Act. Are they compatible? Canadian Journal of Engineering. 28.
(1), 1-5.
Zdrahal, Z., Karasek, P., Lojkova, L., Buckova, M., Vecera, Z., & Vejrosta, J.
(2000). Pressurised liquid extraction of ketones of polycyclic aromatic
hydrocarbons from soil. Journal of Chromatography. A 893, 201-206.

104
APPENDICES

10
5
App
endi
x 1
Com
paris
on o
f phy
tore
med
iatio
n to
alte
rnat
ive
rem
edia
tion
met
hods
, nat
ural
atte
nuat
ion,
eng
inee
ring
and
bior
emed
iatio
n
(Fric
k, F
arre
l & G
erm
ida,
199
9)
Cha
ract
eris
tics
P
hyto
rem
edia
tion
Nat
ural
atte
nuat
ion
Eng
inee
ring
Bio
rem
edia
tion
1. E
x si
tu o
r in
situ
In
situ
In
situ
E
x si
tu o
r in
situ
E
x si
tu o
r in
situ
2.
Gen
eral
des
crip
tion
U
se
mic
robe
s an
d pl
ants
to
de
grad
e,
cont
ain
or
trans
fer
cont
amin
ants
Use
mic
robe
s an
d pl
ants
to
de
grad
e,
cont
ain
or
trans
fer c
onta
min
ants
.
Ex
situ
exc
avat
ions
, la
nd
fillin
g, in
cine
ratio
n In
si
tu
= so
il va
pour
ex
tract
ion,
ch
emic
al
or
ther
mal
tre
atm
ent,
solid
ifica
tion,
pu
mp
and
treat
, va
cuum
ex
tract
ion
and
spar
ging
Use
m
icro
bes
and
plan
ts.
to
Deg
rade
, co
ntai
n or
tra
nsfe
r co
ntam
inan
ts.
Ex
situ
in
volv
es
exca
vatio
ns
coup
led
with
so
lid-p
hase
sl
urry
ph
ase
treat
men
t.
3. H
uman
inte
rven
tion
Y
es.
Agr
onom
ic
, til
lage
,, til
lage
and
ferti
lizer
, ino
cula
tion
and
plan
ting
No
Y
es, e
xten
sive
Y
es, e
xten
sive
. P
rovi
de
prop
er
tem
pera
ture
, ox
ygen
, an
d nu
trien
ts t
o op
timis
e m
icro
bial
act
ivity
. 4.
Dire
ct b
enef
its
In s
itu: s
olar
driv
en, w
ell s
uite
d to
la
rge
area
s of
su
rface
co
ntam
inat
ion,
go
od
aest
hetic
s,
favo
urab
le
publ
ic
perc
eptio
n, p
lant
s as
indi
cato
rs
of c
onta
min
atio
n.
Pla
nts
degr
ade
a va
riety
of
co
ntam
inan
ts.
Pla
nts
trans
fer
oxyg
en
to
rhiz
osph
ere.
P
lant
s he
lp
cont
ain
cont
amin
ants
. R
elat
ivel
y ea
sy to
app
ly
In s
itu
No
dist
urba
nce
Dep
enda
ble,
lea
ves
clea
n si
te,
has
defin
ite
star
ting
and
end
poin
ts,
espe
cial
ly
fast
er
than
ot
her
rem
edia
tion
met
hods
. ,
Pro
ven
to
be
effe
ctiv
e.
Vac
uum
ex
tract
ion
not
limite
d by
de
pth
to
grou
ndw
ater
.
Lim
ited
dist
urba
nce
with
in
si
tu,
prov
en to
be
effe
ctiv
e.
5. In
dire
ct b
enef
its
Impr
oves
soi
l qua
lity.
, P
reve
nts
soil
eros
ion.
P
lant
s el
imin
ate
seco
ndar
y ai
r an
d w
ater
born
e w
aste
s su
ch
as g
reen
hous
e ga
ses.
Har
dy
plan
ts
can
help
ot
her
less
har
dy p
lant
s to
gr
ow
on
cont
amin
ated
ar
eas
once
es
tabl
ishe
d pl
ants
pre
vent
ero
sion
and

10
6
Tree
s ca
n re
duce
noi
se
from
in
dust
rial s
ites.
H
ardy
pl
ants
ca
n he
lp
othe
r le
ss
hard
y pl
ats
to
grow
on
co
ntam
inat
ed a
reas
.
help
el
imin
ate
seco
ndar
y ai
r and
wat
erbo
rne
was
tes.
6. L
imita
tions
C
onta
min
atio
n m
ust
typi
cally
be
sha
llow
. P
lant
s m
ay
not
grow
if
cont
amin
atio
n is
hig
h.
Slo
wer
tha
n ex
situ
met
hods
. C
onta
min
ants
m
ay
not
be
bioa
vaila
ble.
E
nviro
nmen
tal c
ondi
tions
hav
e to
be
right
. Le
achi
ng
or
vita
lisat
ion
may
oc
cur b
efor
e ph
ytor
emed
iatio
n.
Slo
wer
th
an
any
othe
r re
med
iatio
n m
etho
d,
ther
efor
e lo
nger
per
iod
of
high
er r
isks
to
hum
an a
nd
ecos
yste
m h
ealth
. P
lant
s,
mic
robe
s,
or
envi
ronm
enta
l co
nditi
ons
mos
t be
nefic
ial
to
rem
edia
tion
may
no
t be
na
tura
lly p
rese
nt.
Hig
hly
disr
uptiv
e,
espe
cial
ly
exca
vatio
n.
Land
fill
only
tra
nsfe
rs
cont
amin
ants
to
a se
cond
si
te.
Dis
posa
l is
sues
of
fly a
sh
exis
t with
inci
nera
tion.
P
ump
and
treat
doe
s no
t tre
at s
oils
dire
ctly
and
is
very
slo
w.
Hig
hly
disr
uptiv
e w
ith
ex
situ
ex
cava
tions
. In
situ
req
uire
s ex
tens
ive
colle
ctio
n sy
stem
s,
treat
men
t lo
nger
en
gine
erin
g bu
t no
t as
lo
ng
as
atte
nuat
ion.
M
ay n
ot w
ork
if co
ntam
inan
t is
toxi
c to
mic
robe
s.
Req
uire
s in
tens
ive
mon
itorin
g
7. C
ost
$17
to $
3US
/m3 e
ach
year
;
crop
ping
sy
stem
=
$0.0
2-$1
.00U
S/m
3
No
oper
atio
nal c
osts
. M
ay h
ave
cost
s as
soci
ated
w
ith m
onito
ring.
Gen
eral
ly
$10
to
over
$1
,00/
m3 ,
$10-
100U
S/ m
3 fo
r vol
atile
or w
ater
-sol
uble
co
ntam
inan
ts in
situ
. $2
00-7
00U
S/
m3
for
spec
ial
land
fil
ling,
in
cine
ratio
n or
se
cure
d la
ndfil
l cos
ts o
f $2
60-1
064
per m
3
$50
to $
133
for
in s
itu,
$133
to
$400
/ m3 fo
r ex
situ

107
Appendix 2 Genera of hydrocarbon-degrading micro organisms isolated from soil (Cerniglia, 1992; Bossert & Bartha,1986; Frick et al., 1999). Bacteria Hydrocarbon Fungi Hydrocarbon Acidovorax Phenanthrene and
Anthracene Cunninghamella Benzo [a] pyrene
Alcaligenes Phenanthrene, Fluoranthene and Fluorene
Fusarium Benzene, Naphthalene, Phenanthrene and (n-alkanes (C10 to C40)
Arthrobacter Benzene, Naphthalene and Phenanthrene and (n-alkanes (C10 to C40)
Penicillium Benzene, Naphthalene and Phenanthrene and (n-alkanes (C10 to C40)
Mycobacterium 2-methylnaphthalene, Phenanthrene , Pyrene and benzo [a] pyrene
Pesuedomonas Phenanthrene , Benzo[a]pyrene, Fluoranthene
Spingomonas Phenanthrene , Fluoranthene and Anthracene
Rhodococcus Benzene and benzo[a]pyrene
Other bacteria Achromabacter Norcadia Acremonium Monilla Acinetobacter Proteus Aspergillus Mortierella Micrococcus Sarcina Aureobasidium Paecilomyces Spirillum Serratia Beaveria Phoma Brevibacterium Streptomyces Botrytis Rhodotorula Vibrio Erwinia Candida Saccharomyces Flavobacterium Cytophaga Chrsosporium Scolecobasidium Corynebacterium Cladosporium Sporobolomyces

108
Appendix 3
Plants with a potential to tolerate petroleum hydrocarbons (Frick et al., 1999) Plant and Scientific Name Crested wheat grass (Agropyron desertorum)
Cattails (Typha latifolia)
Oat (Avena sativa) Field pea (Pisium arvense) Water sedge (Carex aquatilis ) Three square bulrush (Scirpus
pungens) Rock sedge (Carex rupestris) White clover (Trifolim repens) Tall cotton grass (Eriophorum angustifolium)
Reed grass (Phragmites australis)
Sunflower (Helianthus annus) Round sedge (Carex rotundata) Birdsfoot trefoil (Lotus cornilatus) Barley (Hordeum vulgare) Maize (Zea mays L) Wheat (Trichum aestivum) Faba bean (Vicia faba) Jack pine (Pinus banksiana) Soy bean (Glycine max) Carrot (Doucus carota)

109
Appendix 4
Polyaromatic hydrocarbons Method EVALUATION:
PARTIAL ISSUE : 15 AUGUST 1994
COMPOUNDS Acenaphthene Acenaphthylene Anthracene Benzo [a] anthracene Benzo [b] fluoranthene Benzo [k] fluoranthene
Benzo[ghi]perylene Benzo[a]pyrene Benzo[e]pyrene Chrysene Dibenz[a,h]anthraceneFluoranthene
Fluorene Indeno[1,2,3-cd]pyrene Naphthalene Phenanthrene Pyrene
Sampling Measurement Sampler : Filter and sorbent
(2-µm, 37mm PTFE+ washed XAD-2 100mg/50mg)
Method: Gas Chromatography capillary column FID
Flow rate : 2L//min
Analyte: Compounds above
Vol. - Min: Max:
200L 1000L
Extraction: 5ml organic solvent appropriate to sample matrix
Shipment: Transfer filters to culture tubes , wrap sorbent and culture tubes in A1 foil ship at 0 °C
Injection volume: 4µL; 10:1 split
Sample stability: Unknown protect from heat and uv radiation
Column: 30m×0.32-mmID fused capillary 1-µm DB 5
Field Blanks: 2 to 10 field per set
Temperature injector: 200 °C Dejector: 250 °C Programme: 130 to 290 °C at 4 °C/min
Media Blanks: 6 to 10 Gases – carrier : Helium at 1 mL/min Makeup: He at 20 mL/min
Area Samples: 8 Replicates on preweighed filters for solvent selection
LOD: ca. 0.3 to 0.5 µg per sample Calibration: external standards in toluene

110
Accuracy Range studied accuracy , bias and overall precision (not measured
Applicability: The working range for B[a]P is to 150 µg/m3 for 400-L air sample . Specific sample sets may require modification in filter extraction solvent, choice of measurement method and conditions. Interferences: Any compound which elutes at the same GC retention time may interfere. Heat ozone, nitrogen or UV light may cause degradation. NIOSH Manual of Analytical Methods Fourth Edition 8/15/1994
111
Appendix 5
Principal Component Analysis (PCA)
Principal component analysis is an analytical tool for simplifying data by reducing
multidimensional data sets to lower dimensions for analysis. It is a component of
multivariate analysis in statistics. According to Gardner (2001), the main interest
of PCA lies in assessing the variables as a set of interrelationships (correlations)
between them and the information these relationships contain jointly about the
samples on which measurement has taken place. PCA can help understand the
interrelationship between variables, help determine the dimensionality of data set
and finally help derive a low dimensional representation of data (Miller & Miller,
2000).
Miller and Miller (2000) further states that variables are projected onto a few
principal components (PCs). The first PC explains variation in the data and the
second one is orthogonal and explains variation not explained by the first one.
According to Shine, Ika and Ford, (1995), subsequent PCs are calculated to each
other and retain increasingly smaller variances. The projection of a variable on a
PC is called the score of that variable. When the scores of the variables, for
example, PC1 and PC2, are plotted against each other this is referred to as a
score plot. Therefore, objects that plot out next to each other have similar
variables. Mathematically the weighted sum of the original variable is called a PC
and the weights are called loadings. Therefore, when an object has a high score
for a certain PC then that variable has high values for those variables that have
high loadings for the PC.
The PCA is preferred above other multivariate statistical approaches because it
gives a better indication of the similarities of variable patterns than comparison

112
between individual variables. It also allows for the examination of relationships
between and among variables, through the variable loading plot. Finally, the
location of variables in the loading plot indicates their effect on the placement of
the samples on the PC plot.