result update (parent basis): q3 cy15 cmp 440.20 buy...
TRANSCRIPT
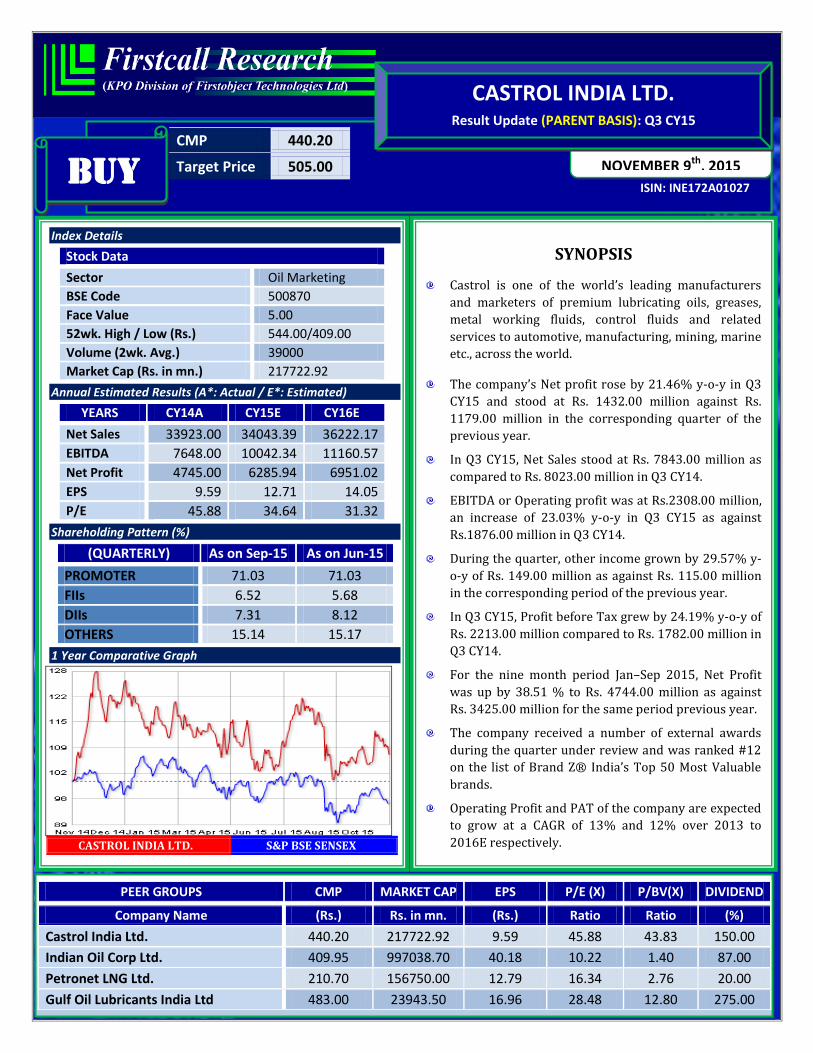
CMP 440.20
Target Price 505.00
ISIN: INE172A01027
NOVEMBER 9th, 2015
12th h, 2013
CASTROL INDIA LTD.
Result Update (PARENT BASIS): Q3 CY15
BUY
Index Details
Stock Data
Sector Oil Marketing
BSE Code 500870
Face Value 5.00
52wk. High / Low (Rs.) 544.00/409.00
Volume (2wk. Avg.) 39000
Market Cap (Rs. in mn.) 217722.92
Annual Estimated Results (A*: Actual / E*: Estimated)
YEARS CY14A CY15E CY16E
Net Sales 33923.00 34043.39 36222.17
EBITDA 7648.00 10042.34 11160.57
Net Profit 4745.00 6285.94 6951.02
EPS 9.59 12.71 14.05
P/E 45.88 34.64 31.32
Shareholding Pattern (%)
(QUARTERLY) As on Sep-15 As on Jun-15
PROMOTER 71.03 71.03
FIIs 6.52 5.68
DIIs 7.31 8.12
OTHERS 15.14 15.17
1 Year Comparative Graph
CASTROL INDIA LTD. S&P BSE SENSEX
SYNOPSIS
Castrol is one of the world’s leading manufacturers
and marketers of premium lubricating oils, greases,
metal working fluids, control fluids and related
services to automotive, manufacturing, mining, marine
etc., across the world.
The company’s Net profit rose by 21.46% y-o-y in Q3
CY15 and stood at Rs. 1432.00 million against Rs.
1179.00 million in the corresponding quarter of the
previous year.
In Q3 CY15, Net Sales stood at Rs. 7843.00 million as
compared to Rs. 8023.00 million in Q3 CY14.
EBITDA or Operating profit was at Rs.2308.00 million,
an increase of 23.03% y-o-y in Q3 CY15 as against
Rs.1876.00 million in Q3 CY14.
During the quarter, other income grown by 29.57% y-
o-y of Rs. 149.00 million as against Rs. 115.00 million
in the corresponding period of the previous year.
In Q3 CY15, Profit before Tax grew by 24.19% y-o-y of
Rs. 2213.00 million compared to Rs. 1782.00 million in
Q3 CY14.
For the nine month period Jan–Sep 2015, Net Profit
was up by 38.51 % to Rs. 4744.00 million as against
Rs. 3425.00 million for the same period previous year.
The company received a number of external awards
during the quarter under review and was ranked #12
on the list of Brand Z® India’s Top 50 Most Valuable
brands.
Operating Profit and PAT of the company are expected
to grow at a CAGR of 13% and 12% over 2013 to
2016E respectively.
PEER GROUPS CMP MARKET CAP EPS P/E (X) P/BV(X) DIVIDEND
Company Name (Rs.) Rs. in mn. (Rs.) Ratio Ratio (%)
Castrol India Ltd. 440.20 217722.92 9.59 45.88 43.83 150.00
Indian Oil Corp Ltd. 409.95 997038.70 40.18 10.22 1.40 87.00
Petronet LNG Ltd. 210.70 156750.00 12.79 16.34 2.76 20.00
Gulf Oil Lubricants India Ltd 483.00 23943.50 16.96 28.48 12.80 275.00

QUARTERLY HIGHLIGHTS (PARENT BASIS)
Results updates- Q3 CY15,
Castrol India manufactures and markets a range of automotive and industrial lubricants. The business continues
to be driven by strong performance in personal mobility segment with Castrol Active increasing its market share
and strengthening its leadership position in the two-wheeler engine oil category. Continuing on the automotive
performanc has reported its financial results for the quarter ended 30th September, 2015.
The company has achieved a turnover of Rs. 7843.00million for the 3rd quarter of the calendar year 2015 as
against Rs. 8023.00 million in the corresponding quarter of the previous year. Net profit rose by 21.46% y-o-y in
Q3 CY15 and stood at Rs. 1432.00 million against Rs. 1179.00 million in the corresponding quarter of the
previous year. EBITDA or Operating profit was at Rs.2308.00 million, an increase of 23.03% y-o-y in Q3 CY15 as
against Rs.1876.00 million in Q3 CY14. EPS of Rs. 2.90 for the 3rd quarter of CY15 as against an EPS of Rs. 2.38 in
the corresponding quarter of the previous year.
Break up of Expenditure:
Break up of Expenditure
Rs. Millions
Q3 CY15 Q3 CY14 Chg %
Cost of Materials Consumed 3352.00 4204.00 -20%
Depreciation 94.00 84.00 12%
Employees Benefit Expenses 467.00 445.00 5%
Other Expenditure 1398.00 1338.00 4%
Purchase of Stock-in-Trade 549.00 402.00 37%
MONTHS Sep-15 Sep-14 % Change
Net Sales 7843.00 8023.00 (2.24)
PAT 1432.00 1179.00 21.46
EPS 2.90 2.38 21.46
EBITDA 2308.00 1876.00 23.03
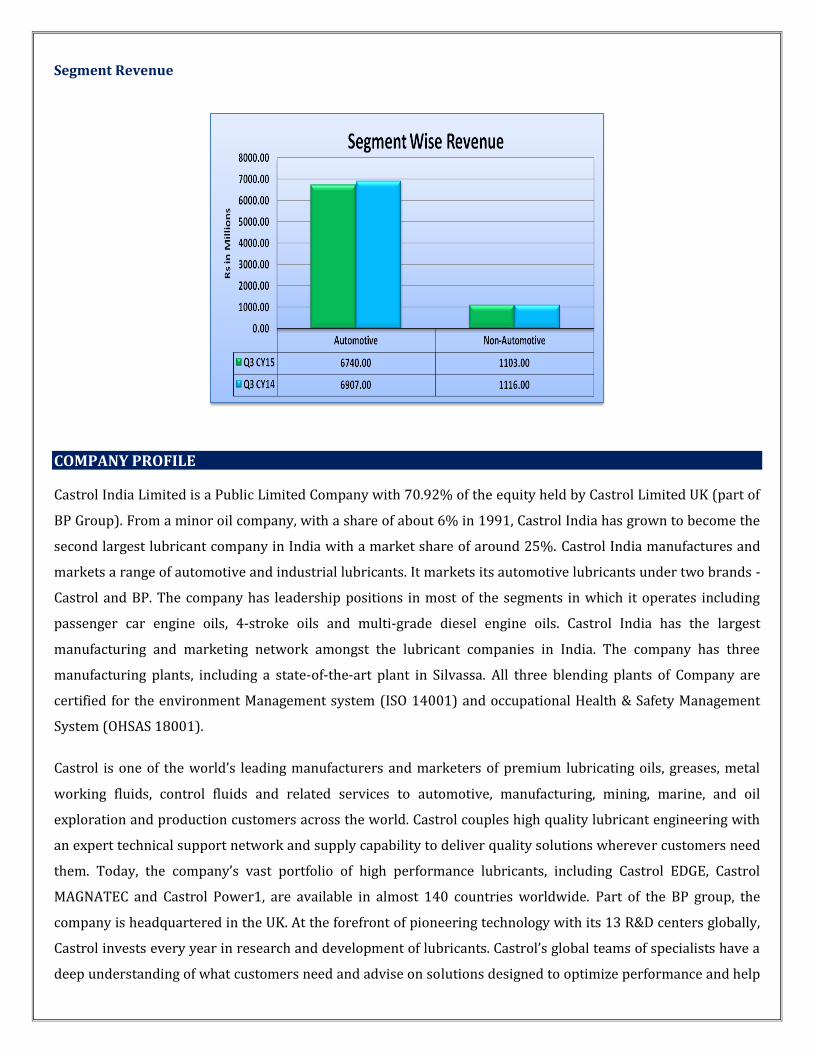
Segment Revenue
COMPANY PROFILE
Castrol India Limited is a Public Limited Company with 70.92% of the equity held by Castrol Limited UK (part of
BP Group). From a minor oil company, with a share of about 6% in 1991, Castrol India has grown to become the
second largest lubricant company in India with a market share of around 25%. Castrol India manufactures and
markets a range of automotive and industrial lubricants. It markets its automotive lubricants under two brands -
Castrol and BP. The company has leadership positions in most of the segments in which it operates including
passenger car engine oils, 4-stroke oils and multi-grade diesel engine oils. Castrol India has the largest
manufacturing and marketing network amongst the lubricant companies in India. The company has three
manufacturing plants, including a state-of-the-art plant in Silvassa. All three blending plants of Company are
certified for the environment Management system (ISO 14001) and occupational Health & Safety Management
System (OHSAS 18001).
Castrol is one of the world’s leading manufacturers and marketers of premium lubricating oils, greases, metal
working fluids, control fluids and related services to automotive, manufacturing, mining, marine, and oil
exploration and production customers across the world. Castrol couples high quality lubricant engineering with
an expert technical support network and supply capability to deliver quality solutions wherever customers need
them. Today, the company’s vast portfolio of high performance lubricants, including Castrol EDGE, Castrol
MAGNATEC and Castrol Power1, are available in almost 140 countries worldwide. Part of the BP group, the
company is headquartered in the UK. At the forefront of pioneering technology with its 13 R&D centers globally,
Castrol invests every year in research and development of lubricants. Castrol’s global teams of specialists have a
deep understanding of what customers need and advise on solutions designed to optimize performance and help

improve quality, productivity and the environmental, health and safety profiles of their customers. The brand
represents over 100 years’ experience in ‘liquid engineering’ : producing advanced lubricants for a wide range of
applications, from manufacturing processes and metalworking to mining, shipping and marine activities and
energy production. Castrol’s products and services play a critical role in lubricating the global economy through
what is mined, made and moved around the world.
Products & Services
Passenger Car Oil
Which Oil
Motorcycles
Engine Oil
Gearless Scooter Oil
Commercial Vehicle Oil
Specialty Range
Castrol Professional
Castrol Pitstop
Castrol Bike Point
GLOBAL BUSINESSES
Marine
Oil & Gas
Automotive Manufacture
Aerospace
Power Generation
Machinery
Metals
Mining
Aviation
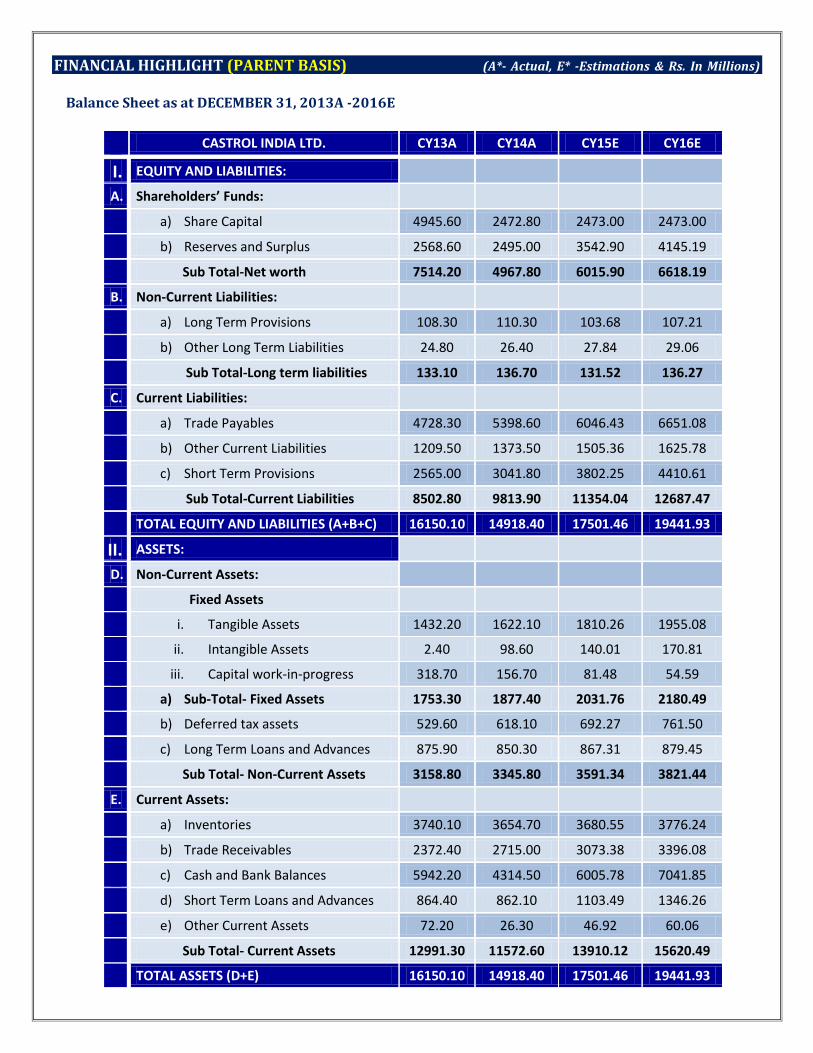
FINANCIAL HIGHLIGHT (PARENT BASIS) (A*- Actual, E* -Estimations & Rs. In Millions)
Balance Sheet as at DECEMBER 31, 2013A -2016E
CASTROL INDIA LTD. CY13A CY14A CY15E CY16E
I. EQUITY AND LIABILITIES:
A. Shareholders’ Funds:
a) Share Capital 4945.60 2472.80 2473.00 2473.00
b) Reserves and Surplus 2568.60 2495.00 3542.90 4145.19
Sub Total-Net worth 7514.20 4967.80 6015.90 6618.19
B. Non-Current Liabilities:
a) Long Term Provisions 108.30 110.30 103.68 107.21
b) Other Long Term Liabilities 24.80 26.40 27.84 29.06
Sub Total-Long term liabilities 133.10 136.70 131.52 136.27
C. Current Liabilities:
a) Trade Payables 4728.30 5398.60 6046.43 6651.08
b) Other Current Liabilities 1209.50 1373.50 1505.36 1625.78
c) Short Term Provisions 2565.00 3041.80 3802.25 4410.61
Sub Total-Current Liabilities 8502.80 9813.90 11354.04 12687.47
TOTAL EQUITY AND LIABILITIES (A+B+C) 16150.10 14918.40 17501.46 19441.93
II. ASSETS:
D. Non-Current Assets:
Fixed Assets
i. Tangible Assets 1432.20 1622.10 1810.26 1955.08
ii. Intangible Assets 2.40 98.60 140.01 170.81
iii. Capital work-in-progress 318.70 156.70 81.48 54.59
a) Sub-Total- Fixed Assets 1753.30 1877.40 2031.76 2180.49
b) Deferred tax assets 529.60 618.10 692.27 761.50
c) Long Term Loans and Advances 875.90 850.30 867.31 879.45
Sub Total- Non-Current Assets 3158.80 3345.80 3591.34 3821.44
E. Current Assets:
a) Inventories 3740.10 3654.70 3680.55 3776.24
b) Trade Receivables 2372.40 2715.00 3073.38 3396.08
c) Cash and Bank Balances 5942.20 4314.50 6005.78 7041.85
d) Short Term Loans and Advances 864.40 862.10 1103.49 1346.26
e) Other Current Assets 72.20 26.30 46.92 60.06
Sub Total- Current Assets 12991.30 11572.60 13910.12 15620.49
TOTAL ASSETS (D+E) 16150.10 14918.40 17501.46 19441.93

Annual Profit & Loss Statement for the period of 2013 to 2016E
Value(Rs.in.mn) CY13A CY14A CY15E CY16E
Description 12m 12m 12m 12m
Net Sales 31796.00 33923.00 34043.39 36222.17
Other Income 836.00 481.00 854.60 1054.58
Total Income 32632.00 34404.00 34898.00 37276.75
Expenditure -24692.00 -26756.00 -24855.65 -26116.18
Operating Profit 7940.00 7648.00 10042.34 11160.57
Interest -17.00 -24.00 -7.25 -6.16
Gross profit 7923.00 7624.00 10035.09 11154.40
Depreciation -305.00 -361.00 -418.38 -476.95
Profit Before Tax 7618.00 7263.00 9616.71 10677.45
Tax -2532.00 -2518.00 -3330.77 -3726.43
Net Profit 5086.00 4745.00 6285.94 6951.02
Equity capital 4946.00 2473.00 2473.00 2473.00
Reserves 2568.00 2495.00 3542.90 4145.19
Face value 10.00 5.00 5.00 5.00
EPS 10.28 9.59 12.71 14.05
Quarterly Profit & Loss Statement for the period of 31st Mar, 2015 to 31st Dec, 2015E
Value(Rs.in.mn) 31-Mar-15 30-June-15 30-Sep-15 31-Dec-15E
Description 3m 3m 3m 3m
Net sales 7992.00 9236.00 7843.00 8972.39
Other income 435.00 152.00 149.00 118.60
Total Income 8427.00 9388.00 7992.00 9091.00
Expenditure -6085.00 -6474.00 -5684.00 -6612.65
Operating Profit 2342.00 2914.00 2308.00 2478.34
Interest -3.00 -2.00 -1.00 -1.25
Gross profit 2339.00 2912.00 2307.00 2477.09
Depreciation -111.00 -94.00 -94.00 -119.38
Profit Before Tax 2228.00 2818.00 2213.00 2357.71
Tax -761.00 -973.00 -781.00 -815.77
Net Profit 1467.00 1845.00 1432.00 1541.94
Equity capital 2473.00 2473.00 2473.00 2473.00
Face value 5.00 5.00 5.00 5.00
EPS 2.97 3.73 2.90 3.12
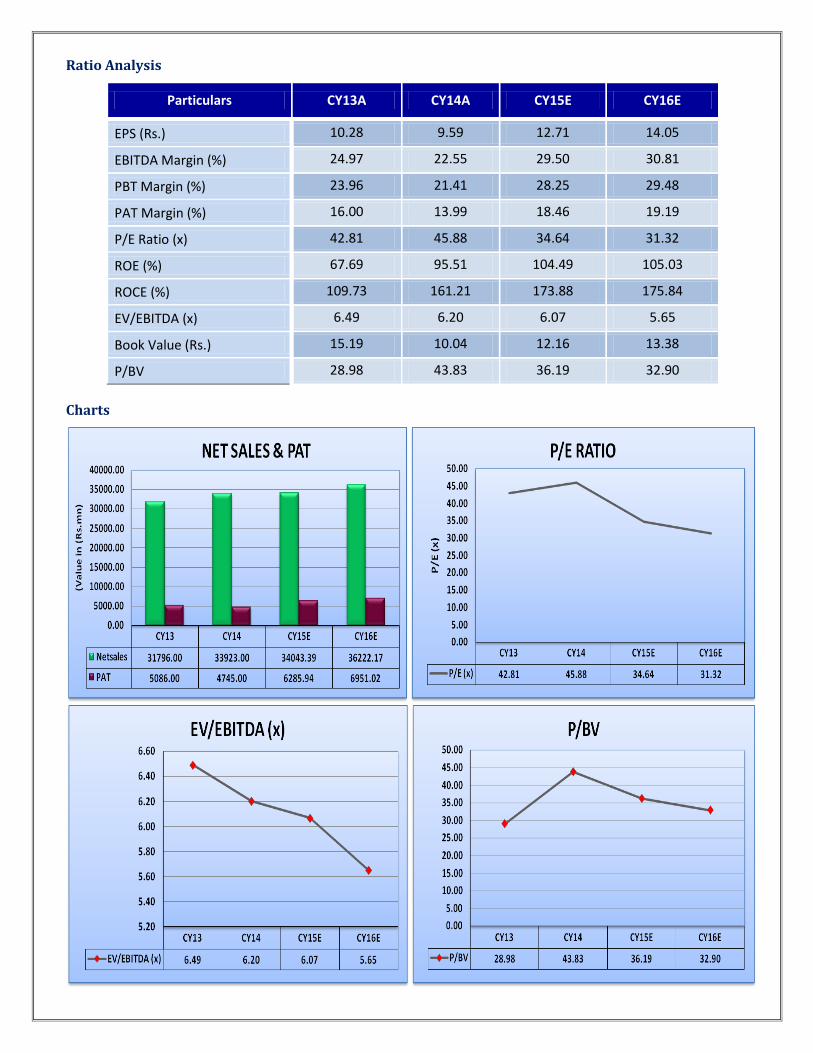
Ratio Analysis
Particulars CY13A CY14A CY15E CY16E
EPS (Rs.) 10.28 9.59 12.71 14.05
EBITDA Margin (%) 24.97 22.55 29.50 30.81
PBT Margin (%) 23.96 21.41 28.25 29.48
PAT Margin (%) 16.00 13.99 18.46 19.19
P/E Ratio (x) 42.81 45.88 34.64 31.32
ROE (%) 67.69 95.51 104.49 105.03
ROCE (%) 109.73 161.21 173.88 175.84
EV/EBITDA (x) 6.49 6.20 6.07 5.65
Book Value (Rs.) 15.19 10.04 12.16 13.38
P/BV 28.98 43.83 36.19 32.90
Charts
OUTLOOK AND CONCLUSION
At the current market price of Rs.440.20, the stock P/E ratio is at 34.64 x CY15E and 31.32 CY16E
respectively.
Earning per share (EPS) of the company for the earnings for CY15E and CY16E is seen at Rs. 12.71 and Rs.
14.05 respectively.
Operating profit and PAT of the company are expected to grow at a CAGR of 13% and 12% over 2013 to
2016E respectively.
On the basis of EV/EBITDA, the stock trades at 6.07 x for CY15E and 5.65 x for CY16E.
Price to Book Value of the stock is expected to be at 36.19 x and 32.90 x respectively for CY15E and CY16E.
The strong result during the first nine months of the year have been achieved in an environment which
continues to be challenging for Commercial Vehicle Oils and Industrial lubricant oils. Looking ahead, although
the drop in crude oil price has translated into lower base oil cost, the company is likely to experience
volatility in the cost of goods due to volatile Rupee exchange rate. In the longer run, the company continues
to remain optimistic about the Indian lubricant market and its business growth. The company is in a strong
position to benefit from growth prospects on account of its strong brand. Hence, we recommend ‘BUY’ in this
particular scrip with a target price of Rs. 505.00 for Medium to Long term investment.
INDUSTRY OVERVIEW
The oil and gas sector is one of the six core industries in India. It is of strategic importance and plays a pivotal
role in influencing decisions across other important spheres of the economy. The oil and gas industry in India is
anticipated to be worth US$ 139,814.7 million by 2015. With India’s economic growth closely linked to energy
demand, the need for oil and gas is projected to grow further, rendering the sector a fertile ground for
investment.
To cater to the increasing demand, the Government of India has adopted several policies, including allowing 100
per cent foreign direct investment (FDI) in many segments of the sector, such as natural gas, petroleum products,
and refineries, among others. The government’s participation has made the oil and gas sector in the country a
better target of investment. Today, it attracts both domestic and foreign investment, as attested by the presence
of Reliance Industries Ltd (RIL) and Cairn India.
Market Size
Backed by new oil fields, domestic oil output is anticipated to grow to 1 MBPD by FY16.
IOCL operates 11,214 km network of crude, gas and product pipelines, with a capacity of 1.6 MBPD of oil and 10
million metric standard cubic metre per day (MMSCMD) of gas. This is around 30 per cent of the nation’s total
pipeline network. IOCL is the largest company, operating 10 out of 22 Indian refineries, with a combined capacity
of 1.3 MBPD.
Investment
Kirloskar Oil Engines Ltd (KOEL) and MTU Friedrichshafen, GmbH have signed a memorandum of
understanding (MoU). The MoU lays down exclusive cooperation on the building and commissioning of
emergency diesel gensets (EDG).
CDP Bharat Forge GmbH has acquired 100 per cent equity shares of Mécanique Générale Langroise (MGL) for
€ 11.8 million (US$ 12.91 million). The acquisition would consolidate Bharat Forge’s position in the oil and
gas sector by enhancing service offerings and geographical reach.
Technip has won a € 100 million (US$ 109.37 million) contract from Oil and Natural Gas Corporation (ONGC)
to build an onshore oil and gas terminal in Andhra Pradesh
RIL and Mexican state-owned company Petroleos Mexicanos (Pemex) entered into a memorandum of
understanding (MoU) for cooperation in the oil and gas sector.
GAIL Global USA LNG LLC (GGULL) signed an agreement with the US-based WGL Midstream Inc to source gas
required to produce 2.5 MT of liquefied natural gas (LNG) a year at the Cove Point Terminal in Maryland, US.
Russian oil major Rosneft and the Essar Group have entered into a contract for Rosneft to buy 49 per cent
stake in Essar’s Vadinar refinery and supply 100 million tonnes of oil to Essar for the next 10 years.
The Carlyle Group plans to invest US$ 500 million in Magna Energy Ltd, an India-focused upstream oil and
gas company that aims to secure local licenses in India with a primary focus on development and production.
RIL aims to invest US$ 31.7 billion in core oil and petrochemical business over the next 12-18 months.
IOCL targets to increase the capacity of its Panipat refinery by 34 per cent, to 20.2 million tonnes by 2020
through an investment of US$ 2.38 billion. IOC also plans to increase capacity of Koyali and Mathura
refineries.
Government Initiatives
Some of the major initiatives taken by the Government of India to promote oil and gas sector are:
Government of India entered into bilateral discussion with Norway to extend co-operation between the two
countries in the field of oil and natural gas and hydrocarbon exploration.

To strengthen the country`s energy security, oil diplomacy initiatives have been intensified through
meaningful engagements with hydrocarbon rich countries.
PAHAL - Direct Benefit Transfer for LPG consumer (DBTL) scheme launched in 54 districts on November 11,
2014 and expanded to rest of the country on January 1, 2015 will cover 15.3 crore active LPG consumers of
the country.
24 x 7 LPG service via web launched to provide LPG consumers an integrated solution to carry out all
services at one place, through MyLPG.in, from the comfort of their home.
The Government of India launched the 'Give It Up' campaign on LPG subsidy that helped it save Rs 140 crore
(US$ 21.11 million) as on 22nd July 2015 with nearly 12.6 lakh Indians registering for the cause. As per
recent statistics from oil ministry, as many as 30,000 to 40,000 households are giving up LPG subsidy each
day.
Special dispensation for North East Region: For incentivising exploration and production in North East
Region, 40 per cent subsidy on gas price has been extended to private companies operating in the region,
along with ONGC and OIL.
The Cabinet Committee on Economic Affairs (CCEA), chaired by Prime Minister has approved a mechanism
for procurement of Ethanol by Public Sector Oil Marketing Companies (OMCs) to carry out the Ethanol
Blended Petrol (EBP) Program.
Road Ahead
By 2015-16, India’s demand for gas may touch 124 MTPA against a domestic supply of 33 MTPA and higher
imports of 47.2 MTPA, leaving a shortage of 44 MTPA, as per projections by the Petroleum and Natural Gas
Ministry of India. Business Monitor International (BMI) predicts that India would account for 12.4 per cent of
Asia-Pacific regional oil demand by 2015.
Disclaimer:
This document is prepared by our research analysts and it does not constitute an offer or solicitation for the
purchase or sale of any financial instrument or as an official confirmation of any transaction. The information
contained herein is from publicly available data or other sources believed to be reliable but we do not represent that
it is accurate or complete and it should not be relied on as such. Firstcall Research or any of its affiliates shall not be
in any way responsible for any loss or damage that may arise to any person from any inadvertent error in the
information contained in this report. Firstcall Research and/ or its affiliates and/or employees will not be liable for
the recipients’ investment decision based on this document.

Firstcall India Equity Research: Email – [email protected]
C.V.S.L.Kameswari Pharma & Diversified
U. Janaki Rao Capital Goods
B. Anil Kumar Auto, IT & FMCG
M. Vinayak Rao Diversified
G. Amarender Diversified
Firstcall Research Provides
Industry Research on all the Sectors and Equity Research on Major Companies
forming part of Listed and Unlisted Segments
For Further Details Contact:
Tel.: 022-2527 2510/2527 6077 / 25276089 Telefax: 022-25276089
040-20000235 /20000233
E-mail: [email protected]
www.firstcallresearch.com