indian telecom services: initiating coverage: advantage...
TRANSCRIPT

EQUITY RESEARCH 9 November 2011
INDIAN TELECOM SERVICES Initiating coverage: Advantage incumbents
Four years post the grant of new mobile licenses in India, the wheel has turned full circle. Hobbled by the tough credit market, new players continue to lose value and relevance with the stilted regulatory framework in India limiting any corporate restructurings or new investments. This should allow incumbents to further expand their lead in the market. Our expectations of strong operating profit growth for incumbent players leads us to initiate with an 1-Overweight ratings on Bharti Airtel and Reliance Communication while we initiate with a 2-Equal Weight on Idea Cellular. We also highlight SingTel (1-OW, S$3.60PT) as benefiting from its Bharti exposure and add Bharti as one of our top picks in our Asian telecom coverage universe.
Regulatory stand still favours incumbents: The murky regulatory regime limits fresh investments in the sector and, hence, is a positive for the incumbents. The new players that have launched services are being distracted by investigations of possible impropriety in license/spectrum allocations. We agree that there remains a regulatory cloud of a) spectrum re-farming, b) return of excess spectrum and c) license renewal/extension charges on incumbent GSM players, but we believe that the final impact could be lesser than feared. Given weakening competitive intensity, we believe that Bharti should be able to grow its India mobile revenue by a 17% CAGR over FY2012-14 with EBITDA margins expanding by 440 bps for the same period.
Bharti’s Africa acquisition appears a master stroke: Instead of looking through the lens of revenue, EBITDA or even operating cash flow, we believe that cheap financing could be key to the success for Bharti’s African acquisition. Indeed, although we expect Bharti to miss its target FY2013 EBITDA of US$2bn from Africa (our estimate is US$1.54bn), the extended period of low interest rates should make the financing of this acquisition (at Libor + 195bps) very attractive. We initiate coverage of Bharti with a 1-Overweight rating and a price target of Rs500 for 26% potential upside.
Idea remains a highly leveraged play on India: Given its pure play India mobile model, we believe that Idea could deliver a CAGR of 19% for EBITDA in 2012-14. However, its late entry into India’s mobile market implies that returns will always remain below Bharti’s. At an EV/EBITDA of 7.2x FY2013, Idea looks expensive, and hence, we initiate with a 2-Equal Weight rating and a price target of Rs100 for 2% potential upside.
RCOM carries higher risks but could now be supported by asset valuations: While both Bharti and Idea are plays on operating performance, RCOM is a play on corporate restructuring/asset valuations. While we do not expect a quick turnaround in operations, RCOM’s stock could be supported by a) possible disposal of international cable or DTH operations and b) increased utilisation of domestic fibre and tower assets. We also believe that market is undervaluing RCOM’s 800MHz CDMA spectrum. Thus, we initiate with a 1-Overweight rating and a price target of Rs130 for 56% potential upside.
Barclays Capital does and seeks to do business with companies covered in its research reports. As aresult, investors should be aware that the firm may have a conflict of interest that could affect the objectivity of this report.
Investors should consider this report as only a single factor in making their investment decision.
This research report has been prepared in whole or in part by research analysts based outside the USwho are not registered/qualified as research analysts with FINRA.
PLEASE SEE ANALYST(S) CERTIFICATION(S) AND IMPORTANT DISCLOSURES BEGINNING ON PAGE 41.
INITIATING COVERAGE Asia ex-Japan Telecom Services 2-NEUTRAL Unchanged For a full list of our ratings, price target and earnings changes in this report, please see table on page 2.
Asia ex-Japan Telecom Services Bhuvnesh Singh +91 22 6719 6314 [email protected] BSIPL, Mumbai Vaibhav Dhasmana +91 22 6719 6043 [email protected] BSIPL, Mumbai Anand Ramachandran, CFA +852 290 34360 [email protected] Barclays Bank, Hong Kong

Barclays Capital | Indian Telecom Services
9 November 2011 2
Summary of our Ratings, Price Targets and Earnings Changes in this Report (all changes are shown in bold)
Company Rating Price Price Target EPS FY1 (E) EPS FY2 (E)
Old New 04-Nov-11 Old New %Chg Old New %Chg Old New %Chg
Asia ex-Japan Telecom Services 2-Neu 2-Neu
Bharti Airtel Ltd. (BHARTI IN / BRTI.NS) N/A 1-OW 397.95 N/A 500.00 - N/A 14.18 - N/A 26.48 -
Idea Cellular Ltd, (IDEA IN / IDEA.NS) N/A 2-EW 97.80 N/A 100.00 - N/A 2.42 - N/A 4.46 -
Reliance Communications Ltd. (RCOM IN / RLCM.NS) N/A 1-OW 83.20 N/A 130.00 - N/A 4.32 - N/A 6.97 -
Source: Barclays Capital Share prices and target prices are shown in the primary listing currency and EPS estimates are shown in the reporting currency.
FY1(E): Current fiscal year estimates by Barclays Capital. FY2(E): Next fiscal year estimates by Barclays Capital.
Stock Rating: 1-OW: 1-Overweight 2-EW: 2-Equal Weight 3-UW: 3-Underweight RS: RS-Rating Suspended
Sector View: 1-Pos: 1-Positive 2-Neu: 2-Neutral 3-Neg: 3-Negative

Barclays Capital | Indian Telecom Services
9 November 2011 3
INVESTMENT SUMMARY
We initiate coverage on Indian Telecom Services subsector within our Asia ex-Japan Telecom Services sector with 1-Overweight ratings on Bharti Airtel (price target of Rs500 for potential upside of 26%) and Reliance Communication (price target of Rs130 for potential upside of 56%) and a 2-Equal Weight rating on Idea Cellular (price target of Rs100 for potential upside of 2%). We believe that competitive intensity within the sector has come down, which should lead to pricing power and margin improvements for the key players in the sector. We forecast EBITDA CAGRs of 25% for Bharti, 16% for RCOM and 19% for Idea over FY2012-14E. While regulatory uncertainty is still a concern, we believe that the end result could be better than the current fears in the market. Thus, we initiate with a positive view on the Indian sub-sector although we maintain our 3-Neutral view for the Asia ex-Japan Telecom Services sector overall.
Stock price drivers We see three primary stock price drivers for the next 12 months for three companies under our coverage in the Indian Telecom subsector:
Regulatory overhang – More clarity around the Indian regulations and specifically around spectrum allocation and M&A rules in the sector. While a continuation of current uncertainty could be somewhat beneficial for Bharti and Idea, RCOM could benefit with a quicker resolution of the regulatory issues.
Figure 1: Indian Telecom Services – key regulatory issues
Issue Comments
Spectrum pricing
Limited availability of spectrum for mobile players had made spectrum expensive in India as visible in recent auctions for 3G and BWA
This could also make license renewal expensive as renewal price is proposed to be linked to spectrums market price
Government is indicating that it could make available 300-500MHz of spectrum across various bands in next 10 years
Increased spectrum availability should lead to lower capex (or higher revenues) and also reduce spectrum cost
Spectrum allocation
Current policy is a mix of subsidized allocation (as in first-come-first-served policy in 2G) and market determined auctions (as in 3G and BWA)
Government has indicated that all further allocations would be done on the basis of auctions
However, there is still a lack of clarity for further allocation of 2G spectrum (900 and 1800 MHz)
Spectrum re-farming Regulator has proposed that 900MHz spectrum should be taken away at the time of license renewal and instead substituted by 1800MHz spectrum
Government has still not accepted this proposal
M&A policy
Current policy restricts consolidation in the industry
Further, the current flux in the telecom policy is limiting investments by new players
Government is planning to come up with a comprehensive framework of exit policy soon
Source: India’s Department of Telecommunications, Telecom Regulatory Authority of India, Barclays Capital
Bharti Airtel 1-Overweight Price Target: Rs500 Potential Upside: +26%
Reliance Communication 1-Overweight Price Target: Rs130 Potential Upside: +56%
Idea Cellular 2-Equal Weight Price Target: Rs100 Potential Upside: +2%

Barclays Capital | Indian Telecom Services
9 November 2011 4
Credit issues – Similarly, tough credit conditions are impacting competition negatively to the benefit of Bharti and Idea. RCOM with its high debt levels could benefit if credit conditions improve.
Figure 2: Indian Telecom Services – debt/equity and debt/EBITDA levels, FY12 & FY13
2.22.5
4.4
1.62.0
3.6
1.0 0.90.7 0.8 0.8 0.7
0.00.51.0
1.52.02.53.03.5
4.04.55.0
Bharti Idea RCom Bharti Idea RCom
Net debt/Ebitda Net debt/Equity
FY12 FY13
Source: Barclays Capital
Strong growth expected – Although growth has come off in India, we believe that the Indian Telecom Services subsector remains one of the few growth spots in telecom industry globally. We forecast a CAGRs for revenue of 15% and EBITDA of 22% over 2012-14 for the industry in India and believe that this growth could allow the shares of Bharti, Idea and RCOM to trade at a premium to those of the rest of the industry.
Figure 3: Indian Telecom Services – CAGRS for revenue, EBITDA and EPS (FY12-14)
17%13%
9%
25%19% 16%
64%61% 62%
0%
10%
20%
30%
40%
50%
60%
70%
80%
Bharti Idea R Com
Revenue Ebitda EPS
Source: Barclays Capital

Barclays Capital | Indian Telecom Services
9 November 2011 5
Figure 4: Indian Telecom Services – our projections vs. consensus estimates
Barclays Capital estimates Consensus forecasts Percentage differences
FY12E FY13E FY14E FY12E FY13E FY14E FY12E FY13E FY14E
Bharti
Revenue (Rs m) 705,617 831,741 973,921 717,392 826,766 910,868 -2% 1% 7%
EBITDA (Rs m) 246,886 310,140 383,664 248,847 303,714 348,850 -1% 2% 10%
EPS (Rs) 14.18 26.48 38.16 17.59 26.97 34.04 -19% -2% 12%
Idea
Revenue (Rs m) 186,855 214,228 237,267 192,520 229,534 260,071 -3% -7% -9%
EBITDA (Rs m) 49,922 61,449 70,833 50,564 63,686 76,345 -1% -4% -7%
EPS (Rs) 2.42 4.46 6.26 2.26 4.31 6.81 7% 3% -8%
RCOM
Revenue (Rs m) 212,697 231,993 253,821 219,578 241,901 261,824 -3% -4% -3%
EBITDA (Rs m) 69,214 80,742 93,795 71,047 80,063 88,501 -3% 1% 6%
EPS (Rs) 4.32 6.97 11.41 4.67 7.01 9.47 -7% -1% 21%
Source: Barclays Capital estimates, Bloomberg consensus forecasts
Initiating coverage
Bharti Airtel (1-OW; PT Rs500) We initiate coverage of Bharti with a 1-Overweight rating and a price target of Rs500, implying 26% potential upside. We believe that reducing competitive intensity in Indian wireless should lead to strong EBITDA growth for Bharti’s India business. Furthermore, the low interest rate environment should lead to better-than-expected cash flows from its Africa business. Thus, we forecast CAGRs of 24% for EBITDA for FY2011-14E and 35% for EPS. Given our good growth assumptions, we find Bharti’s valuations reasonable at an EV/EBITDA of 6.5x FY2013 on our estimates and initiate with a 1-Overweight rating. We also note that Bharti is to be included in MSCI India from November, which could act as a catalyst for stock outperformance.
Reliance Communication (1-OW; PT Rs130) We initiate coverage of RCOM with a 1-Overweight rating and a price target of Rs130, implying 56% potential upside. We agree that RCOM would continue to face three issues going forward: a) weak execution, b) poor cash flows and high debt burden, and c) regulatory uncertainties. However, we believe that an increasing possibility of corporate restructuring could lead to the stock being supported by asset valuations. Specifically, management has mentioned possibility of disposal of a) the international long distance cable and b) the DTH business, which we find credible. Furthermore, we also believe that there remains a likelihood of improving utilisation of company’s domestic fibre and telecom tower assets. We also believe that the current market value (P/B of 0.4x) could be significantly undervaluing RCOM’s 800MHz CDMA spectrum.
Idea Cellular (1-EW; PT Rs100) We initiate coverage of Idea with a 2-Equal Weight rating and a price target of Rs100 compared with the current price of Rs98. Given its pure play Indian wireless exposure, we believe that Idea could be best leveraged to the improvement in Indian mobile industry. Thus, we forecast a CAGR of 23% for EBITDA for FY2011-14 and 32% for EPS. However, we

Barclays Capital | Indian Telecom Services
9 November 2011 6
find valuations are not cheap at an EV/EBITDA multiple of 7.2x FY3/13, and thus, we initiate with a 2-EW rating. We note that both Bharti and Idea are a play on improving operating performance. Between the two, we prefer Bharti due to its stronger growth and cheaper valuations. We agree that there could be an M&A premium to Idea but believe that it is unlikely to be realised short term.
Valuations and risks We use discounted cash flows as our primary valuation method for Indian Telecom Services vendors. We believe DCF is the most appropriate valuation methodology because it correctly captures the long-term effects of the investment cycle and the consequent profitability for the companies in the sector.
We also sanity check our numbers with EV/EBITDA multiples and the future growth prospects of the companies. We also focus on P/E and ROE values of the companies as another check point for our price targets.
Our DCF assumptions for the three companies are provided in the respective company sections of this report.
With in the sub-sector, Bharti is our top pick due to its leading industry position, geographical diversification and superior return profile. We also like Reliance Communications due to its inexpensive asset valuations (0.4x FY13 book). We note that our call on Bharti and Idea is largely based on operating performance while our call on RCOM is based on corporate restructuring/asset valuations.
We believe that the regulatory environment in India could be a wild card. A quick resolution of regulatory imbroglio could be positive while a further deterioration could negatively impact the stocks. Bharti and Idea also benefit from the tough credit situation, which is negatively affecting their competition. On the other hand, RCOM with its high debt levels could benefit if credit conditions ease.

Barclays Capital | Indian Telecom Services
9 November 2011 7
VALUATION MATRIX
Figure 5: Asia ex- Japan Telecom Services – top picks
Stock Mkt Cap PT TSR P/E (x) EV/EBITDA (x) Price/ Book (x) Dividend Yield (%) EPS Growth (%) EBITDA Growth (%)
Price (US$bn) Rating (LCY) (%) '11/FY12 '12/FY13 '11/FY12 '12/FY13 '11/FY12 '12/FY13 '11/FY12 '12/FY13 '11/FY12 '12/FY13 '11/FY12 '12/FY13
Bharti Airtel Rs 397.3 30.7 1-OW Rs500 26.4% 28.0 15.0 8.3 6.5 2.7 2.3 0.3% 0.5% -8.7% 86.7% 23.7% 25.6%
China Unicom HK$16.56 50.2 1-OW HK$21 27.4% 53.7 27.7 6.2 5.4 1.5 1.5 0.6% 1.4% 54.1% 93.8% 10.2% 15.4%
HTHKH HK$3.09 1.9 1-OW HK$3.5 18.3% 14.8 13.4 7.8 7.1 1.4 1.3 5.0% 5.6% 33.0% 10.7% 14.1% 8.2%
SingTel S$$3.15 39.7 1-OW S$3.5 16.6% 12.7 11.5 6.0 5.5 2.1 1.9 5.5% 6.1% 3.4% 10.7% 8.3% 5.8%
Far EasTone NT$53.7 5.8 1-OW NT$54 4.8% 20.6 17.9 7.7 7.0 2.4 2.4 4.3% 5.0% -3.8% 15.2% -0.1% 7.5%
Note: Stock Rating: 1-OW: 1-Overweight, 2-EW: 2-Equal Weight, 3-UW: 3-Underweight. Share prices are as of the close of trading on 7 November 2011 in local currency. Source: Barclays Capital estimates
Figure 6: Asia ex-Japan Telecom Services – valuation comparisons of integrated operators
Stock Mkt Cap PT TSR P/E (x) EV/EBITDA (x) Price/ Book (x) Dividend Yield (%) EPS Growth (%) EBITDA Growth (%)
Price (US$bn) Rating (LCY) (%) '11/FY12'12/FY13 '11/FY12 '12/FY13 '11/FY12'12/FY13'11/FY12'12/FY13'11/FY12'12/FY13'11/FY12 '12/FY13
China Telecom HK$4.76 49.6 1-OW HK$5.4 15.3% 18.0 15.4 4.4 3.9 1.3 1.2 1.9% 1.9% 10.1% 16.8% 3.5% 6.1%Telstra A$ 3.13 40.3 NR NA NA 10.8 10.4 4.9 4.8 3.2 3.2 8.9% 8.9% 11.1% 3.4% 2.8% 0.3%Chunghwa Telecom NT$99.8 25.8 3-UW NT$92 -2.3% 16.3 15.9 8.3 7.9 2.4 2.3 5.6% 5.7% 25.2% 2.4% -5.2% 3.3%PT Telkom IDR7600 17.1 NR NA NA 12.6 11.7 4.2 3.9 3.1 2.7 4.3% 4.7% 3.2% 7.7% -1.9% 7.3%PLDT PHP 2360 10.3 NR NA NA 11.3 11.2 6.2 6.0 4.6 4.4 8.7% 8.6% -1.6% 0.7% -3.5% 3.0%KT KRW 37100 8.7 NR NA NA 6.6 7.0 1.9 1.9 0.8 0.8 6.6% 6.8% 16.2% -5.0% 1.7% 0.4%Telekom Malaysia RM 4.19 4.8 NR NA NA 26.2 22.1 6.0 5.7 2.1 2.1 6.4% 5.3% 6.0% 18.8% 2.2% 7.3%Telecom New Zealand NZ$ 2.63 4.0 NR NA NA 11.0 10.5 4.0 3.8 2.2 2.0 7.6% 8.0% 19.4% 4.2% 0.2% 0.1%StarHub S$2.87 3.9 3-UW S$2.75 2.8% 15.8 15.0 8.4 8.1 215.1 671.9 7.0% 7.0% 18.5% 5.0% 9.5% 2.8%LG Uplus KRW 6830 3.2 NR NA NA 16.0 12.8 2.4 2.2 0.9 0.8 4.4% 4.4% -66.7% 25.0% -23.3% 11.5%PCCW HK$3.13 2.9 NR NA NA 11.6 9.8 6.1 5.7 NM NM 5.1% 6.1% -2.9% 18.5% -7.9% 1.4%True Corp THB 2.9 1.4 NR NA NA - 32.2 96.7 5.4 5.4 2.2 2.1 0.0% 0.0% -148.9% -133.3% -7.1% 1.8%
Average 14.1 12.8 5.4 5.1 2.4 2.3 5.8% 5.9% -6.5% -2.4% -0.8% 4.1%
Median 12.7 12.8 6.0 5.4 2.1 2.1 5.5% 5.7% 10.1% 7.7% 1.7% 3.3%
Stock ratings: 1-OW: 1-Overweight, 2-EW: 2-Equal Weight, 3-UW: 3-Underweight. For full disclosures on each rated company, including details of company-specific valuation methodology and risks, please refer to: http://publicresearch.barcap.com. Share prices are as of the close of trading on 7 November 2011 in local trading currency. For not-rated (NR) companies, estimates are IBES consensus estimates from Datastream. Source: Thomson Reuters Datastream, Barclays Capital estimates

Barclays Capital | Indian Telecom Services
9 November 2011 8
Figure 7: Asia ex-Japan Telecom Services – valuation comparisons of wireless operators
StockMkt Cap PT TSR P/E (x) EV/EBITDA (x) Price/ Book (x) Dividend Yield (%) EPS Growth (%) EBITDA Growth (%)
Price (US$bn) Rating (LCY) (%)'11/FY12 '12/FY13 '11/FY12 '12/FY13 '11/FY12 '12/FY13 '11/FY12 '12/FY13 '11/FY12 '12/FY13 '11/FY12 '12/FY13
China Mobile HK$ 75.25 196.9 2-EW HK$ 78 8.0% 9.9 9.6 3.8 3.5 1.9 1.7 4.3% 4.5% 5.0% 4.0% 6.3% 4.0%Bharti Airtel Rs 397.3 30.7 1-OW Rs500 25.8% 28.0 15.0 8.3 6.5 2.7 2.3 0.4% 0.6% -8.7% 86.7% 23.7% 25.6%Advanced Info THB 135 13.1 NR NA NA 16.4 14.5 7.4 7.1 9.9 9.6 6.4% 6.7% 19.0% 12.5% 9.6% 4.2%Axiata RM 4.79 13.0 NR NA NA 14.5 13.3 5.8 5.2 2.0 1.8 2.5% 3.5% 6.8% 9.1% 2.6% 6.3%Maxis Berhad RM 3.11 12.7 NR NA NA 17.0 16.4 9.7 9.5 4.8 5.0 7.0% 6.8% 1.3% 3.2% 3.6% 2.6%SK Telecom KRW146500 10.7 NR NA NA 6.4 6.2 2.6 2.5 0.9 0.9 6.4% 6.5% 18.5% 3.3% 6.8% 3.3%Taiwan Mobile NT$91.7 9.8 2-EW NT$92 5.3% 17.7 15.7 9.6 8.9 5.0 4.7 5.0% 5.7% 3.0% 12.8% -0.7% 6.0%Idea Cellular Rs 97.9 6.6 2-EW Rs100 2.1% 40.5 22.0 9.0 7.2 2.5 2.2 0.0% 0.0% -11.2% 84.4% 31.7% 23.1%DTAC THB 74.5 5.8 NR NA NA 15.3 16.1 6.2 6.3 2.6 2.7 9.4% 6.4% 5.9% -5.1% 4.7% -3.2%XL Axiata IDR5300 5.0 NR NA NA 13.3 11.8 4.6 4.3 3.2 2.7 2.4% 3.3% 17.0% 12.7% 13.7% 6.7%Reliance Comm Rs 83.3 3.5 1-OW Rs130 56.0% 19.3 11.9 6.9 5.7 0.4 0.4 1.3% 1.7% -33.7% 61.3% -23.8% 16.7%PT Indosat IDR5250 3.2 NR NA NA 24.8 16.5 2.9 2.6 1.5 1.4 1.8% 2.8% 77.9% 49.7% 7.9% 10.2%Globe PHP 920 2.8 NR NA NA 12.0 11.5 4.8 4.6 2.5 2.4 7.2% 7.5% 4.9% 4.5% 3.8% 3.2%SmarTone HK$14.48 1.9 2-EW NT$1616.9% 15.6 13.7 4.9 4.4 5.0 4.9 6.4% 7.3% 27.4% 13.9% 34.5% 11.9%Mobile One S$2.47 1.8 2-EW S$2.7 15.4% 13.0 12.4 7.9 7.5 6.9 6.3 6.1% 6.5% 8.6% 5.3% 2.3% 4.1%
Average 18.1 14.5 6.6 6.0 3.4 3.2 4.4% 4.7% 7.9% 22.4% 8.2% 8.2%
Median 16.4 14.5 6.9 6.3 2.6 2.4 5.0% 5.0% 5.0% 12.5% 6.3% 6.3%
Stock ratings: 1-OW: 1-Overweight, 2-EW: 2-Equal Weight, 3-UW: 3-Underweight. For full disclosures on each rated company, including details of company-specific valuation methodology and risks, please refer to: http://publicresearch.barcap.com. Share prices are as of the close of trading on 7 November 2011 in local trading currency. For not-rated (NR) companies estimates are IBES consensus estimates from Datastream. Source: Thomson Reuters Datastream, Barclays Capital estimates

Barclays Capital | Indian Telecom Services
9 November 2011 9
CONTENTS
INVESTMENT SUMMARY..................................................................................................................3 Stock price drivers...................................................................................................................................... 3 Initiating coverage...................................................................................................................................... 5 Valuations and risks................................................................................................................................... 6
VALUATION MATRIX.........................................................................................................................7
CONTENTS...........................................................................................................................................9
REGULATORY UNCERTAINTY BENEFITING INCUMBENTS........................................................10 Spectrum availability and pricing .........................................................................................................10 Exit policy ...................................................................................................................................................11 What could be some possible outcomes? ..........................................................................................12
POSITIVE TRENDS IN INDIAN WIRELESS MARKET.....................................................................14 From price competition to price increases .........................................................................................14 Limited market share gains despite price competition ...................................................................14 New mobile operators are struggling ..................................................................................................15 MNP also favours incumbent GSM operators ...................................................................................17
VALUATIONS AND FORECASTS ....................................................................................................20
BHARTI AIRTEL (1-OW; PT RS500; 26% POTENTIAL UPSIDE)................................................24 The sector bellwether..............................................................................................................................24 Valuation ....................................................................................................................................................27 Risks ............................................................................................................................................................27
RELIANCE COMMUNICATION (1-OW; PT RS130; 56% POTENTIAL UPSIDE).......................28 Undervalued asset play ...........................................................................................................................28 Valuation ....................................................................................................................................................31 Risks ............................................................................................................................................................31
IDEA CELLULAR (2-EQUAL WEIGHT; PT RS100; 2% POTENTIAL UPSIDE) ...........................32 The wireless pure play.............................................................................................................................32 Valuation ....................................................................................................................................................35 Risks ............................................................................................................................................................35
APPENDIX: BHARTI AFRICA...........................................................................................................36 Entry into Rwanda....................................................................................................................................36 Comments from Bharti and its Africa peers.......................................................................................36 Currency volatility remains a risk..........................................................................................................37

Barclays Capital | Indian Telecom Services
9 November 2011 10
REGULATORY UNCERTAINTY BENEFITING INCUMBENTS
We agree with the need for a significant overhaul of India’s telecom regulations. The current uncertainty on a) spectrum allocation, b) spectrum pricing and c) exit policy is clearly hampering further investments in this industry. This uncertainty has also led to a significant volatility in the business of incumbent operator for whom the allotment of four to eight new subsidised 2G licenses across circles in 2007 could have come as a shock. Since then, ensuing controversy around the 2G license issuance in 2007 has forced government to focus on a more transparent policy. Recent pronouncements of the telecom minister suggest that the government is cognizant of various issues impacting the sector and could significantly alter the spectrum and exit policy to suit the current business environment.
Spectrum availability and pricing
The spectrum crunch in India was clearly visible in the recent auction of 3G and BWA spectrum by the government. Contrary to initial expectations of a US$1.5-2.0bn value of a pan-India 3G spectrum, the value climbed to US$3.7bn with no operator winning spectrum auction across 22 circles.
Figure 8: Indian Telecom Services – 3G auction prices
Amount payable (Rs bn) Total number of circles
Total 677 Pan India 168 22 Aircel 65 13 Bharti 123 13 Idea 58 11 Reliance 86 13 S Tel 3 3 Tata Tele 59 9 Vodafone 116 9 BSNL 102 20 MTNL 66 2
Source: India’s Department of Telecommunications (DoT)
Figure 9: Indian Telecom Services – BWA auction prices
Amount payable (Rs bn) Total number of circles
Total 385 Pan India 128 22 Aircel 34 8 Augere 1 1 Bharti 33 4 Infotel 128 22 Qualcomm 49 4 Tikona 11 5 BSNL 83 20 MTNL 45 2
Source: India’s Department of Telecommunications (DoT)

Barclays Capital | Indian Telecom Services
9 November 2011 11
We agree that the auction was designed well. The government also ensured that it got the auction price within 30 days of the auction conclusion, preventing a repeat of spectrum auction in mid-1990s in which most operators defaulted on the high headline auction prices. However, we believe that the key reason behind high auction prices could have been the limited availability of spectrum to the incumbent players.
Figure 10: Indian Telecom Services – 2G spectrum availability with various players (MHz)
Service Area Category Bharti Vodafone Idea Reliance Comm Aircel BSNL Spice MTNL Datacom TTSL Uninor Loop
Andhra Pradesh A 9.2 6.2 8.0 4.4 4.4 10.0 4.4 4.4 4.4 4.4 4.4
Assam C 6.2 4.4 6.2 6.2 10.0
Bihar C 8.0 4.4 4.4 8.0 4.4 10.0
Chennai Metro 9.2 8.0 4.4 4.4 8.6 10.0 4.4 4.4 4.4
Delhi Metro 10.0 10.0 8.0 4.4 4.4 12.4
Gujarat A 6.2 9.8 6.2 4.4 4.4 7.4
Haryana B 6.2 6.2 6.2 4.4 4.4 10.0
Himachal Pradesh C 6.2 4.4 4.4 6.2 4.4 10.0
J&K C 6.2 4.4 4.4 4.4 8.0
Karnataka A 9.8 8.0 4.4 4.4 4.4 10.0 6.2 4.4 4.4 4.4 4.4
Kerela B 6.2 6.2 8.0 4.4 4.4 10.0 4.4 4.4 4.4 4.4
Kolkata Metro 8.0 9.8 6.2 4.4 10.0
Madhya Pradesh B 6.2 4.4 8.0 6.2 4.4 10.0
Maharashtra A 6.2 6.2 9.8 4.4 4.4 10.0
Mumbai Metro 9.2 10.0 4.4 4.4 4.4 12.4 10.0
North East C 4.4 4.4 6.2 4.4 10.0
Orissa C 8.0 4.4 4.4 6.2 4.4 10.0 4.4 4.4 4.4 4.4
Punjab B 7.8 6.2 4.4 4.4 6.2 7.8 4.4
Rajasthan B 6.2 6.2 6.2 4.4 4.4 8.0
Tamil Nadu A 9.2 7.2 4.4 4.4 9.8 10.0 4.4 4.4 4.4
Uttar Pradesh (East) B 6.2 8.0 6.2 4.4 4.4 10.0
Uttar Pradesh (West) B 6.2 6.2 8.0 4.4 4.4 10.0
West Bengal B 6.2 6.2 6.2 4.4 8.0
Source: Telecom Regulatory Authority of India (TRAI)
We believe that the spectrum allocation in India is artificially constrained by government policy. For example, with 5-11 players in each circle, India could have the most fragmented telecom market in the world. Fragmentation of spectrum also leads to loss of efficiency and a higher capex for operators. It is possible that Indian telecom regulators fear spectrum hoarding by a few players; however, as India’s mobile market has developed over the past few years, the spectrum allocation rules have failed to keep up.
Exit policy The Indian telecom M&A policy was formulated with a view to prevent monopolisation or cartelisation of the Indian telecom sector in early parts of the century. Since then, though TRAI has made a number of recommendations, the policy has essentially remained unchanged for the past decade. With one operator, Loop Telecom already having expressed its desire to surrender its license, clarity on this front could see other operators such Aircel and Uninor, which have indicated that their balance sheets are stretched and have been unable to turn profitable, could follow suit for specific circles. Recent pronouncements indicate that TRAI could have come up with some suggestions for an exit policy in 2012 followed by more detailed rules by department of telecom (DoT).

Barclays Capital | Indian Telecom Services
9 November 2011 12
Figure 11: Indian Telecom Services – Current wireless regulations vs TRAI recommendations
Current regulation per DoT (April 2008)
TRAI recommendations (May 2010)
Cap on number of operators M&A to result in no fewer than four operators per circle M&A to result in no fewer than five operators per circle
Market share Share of new entity not greater than 40% in terms of subscribers or adjusted gross revenue (AGR)
Share of new entity not greater than 30% in terms of subscribers or Adjusted gross revenue (AGRs). Recent (2011 Nov) paper indicated that TRAI could be comfortable with market share up to 60% on case to case basis.
Exit policy 3-year lock in for owner's equity in new licenses; no lock in if fresh equity
Minimum 3-year period from date of license for M&A to be done away with unless government has provided subsidies
Spectrum cap 15MHz for metros and A circles and 12.4MHz for B and C circles
14.4MHz for GSM, 10MHz for CDMA, excess spectrum to be returned
Spectrum price – Entitlement for merged entity to 6.2 MHz/5 MHz for the entry fee paid and either party in merger to pay spectrum price.
In addition, 5% spectrum transfer charge for the difference between transaction price and current price
Equity holding No entity to hold equity of 10% or more in more than one licensee company
–
Source: India’s Department of Telecommunications, Telecom Regulatory Authority of India
From a government and regulator perspective, this solves two major purposes:
To weed out operators who would not be able to roll out adequate services due to stretched financials. Indeed, the DoT has been looking to clamp down on operators who have failed to meet rollout obligations in certain circles.
To clear out the overcrowded mobile market post the 2008 allocation.
However, we believe that the key problem with the policy is its lack of clarity on spectrum consolidation. Furthermore, due to issues around 2G spectrum/license allocation in 2007, the government and regulator have dropped clear hints of their disapproval to any spectrum consolidation.
What could be some possible outcomes? We believe that the recent pronouncements of India’s telecom minister on the new National Telecom Policy 2011 (NTP 2011) could give us some hints towards the possible resolution of the regulatory issues. We have highlighted the key issues in Figure 11.
Increased spectrum allocation The NTP 2011 aims to make more spectrum available immediately as well as incremental 300 MHz of spectrum by 2017 and another 200MHz by 2020.
An increase in spectrum allocation should resolve the spectrum crunch in the sector. This should lead to lower prices of the spectrum in future auctions. Given that government has indicated that license renewal would be linked to the market price of the spectrum, it could also reduce the cost of license renewal for incumbents.

Barclays Capital | Indian Telecom Services
9 November 2011 13
Figure 12: Indian Telecom Services – key point of the new National Telecom Policy 2011 (NTP 2011)
Key issue NTP comments Our view
Increased spectrum allocation The NTP 2011 aims to make more spectrum available and incremental 300MHz of spectrum by 2017 and another 200MHz by 2020
Positive for the industry, reduce spectrum crunch and spectrum pricing
Roaming charges Remove the roaming charges across the country Negative for the incumbents with wide network coverage
One Nation – One License Single license would allow operators to provide all kinds of services
Lack of clarity on whether it would also include voice services under the broadband license
National Long Distance (NLD) Aiming at convergence of access network, carriage network and broadcast network
Operators would be able to provide national roaming on their own networks
Separation of unified licenses New unified licenses are envisaged to be two separate categories – Network Service Operators (NSO) and Service Delivery Operators (SDO)
Requires more clarity in the future on whether the tower operators would now need a separate NSO license
Source: India’s Department of Telecommunications
Spectrum Sharing The NTP 2011 also proposes the sharing of networks and delinking the licensing of networks from the delivery of service to the end users to facilitate faster roll out of services.
Looking from a different perspective, a proper framework of spectrum sharing could allow new entrants to get some value out of their spectrum holdings by sharing this spectrum with other operators who are facing spectrum crunch. While not an exit policy that many could be hoping for, this could act as an interim solution while the government tries to resolve the entire issue.

Barclays Capital | Indian Telecom Services
9 November 2011 14
POSITIVE TRENDS IN INDIAN WIRELESS MARKET
In the past two years, India’s wireless market could have moved from hyper competition to a more stable phase, in our view. While the flux in Indian telecom regulations could be the main factor that has restricted investments in the sector, we believe that a deterioration in credit market have also significantly hobbled new players and CDMA players. This could be the key reason behind the reduced competitive intensity.
From price competition to price increases India’s wireless market faced significant price competition in 2H09 when Tata Teleservices came out with its innovative per second plans and RCOM reduced its tariff to Rs0.50 per minute (compared with the Rs0.65-0.75 effective tariff of Bharti at that time).
The situation has now changed with the first tariff increase done by Bharti Airtel in July 2011, which was matched up by the other operators. Smaller operators such as Uninor, while not having explicitly announced price increases have either readjusted the price of the starter packs or reduced the airtime available per recharge pack. We view this as the first sign that the price war might be coming to an end. Though it could have a negative impact on the volume growth in short term, it could be more than compensated by a positive impact of pricing on margins.
Figure 13: Indian Telecom Services – details of price increases across wireless operators since July 2011
Company Details
Bharti 20% increase in tariffs across its 6 strongest circles, for pre-paid and net access
Idea 20% increase in call rates across 6 circles
Vodafone Increase in call rates across 12 circles
Reliance Comm 20% increase across most circles in line with larger peers
Tata DoCoMo Increase of SMS rates to Re1, no free SMS, call rates hiked in Tamil Nadu and Karnataka
Source: Media and industry sources
Limited market share gains despite price competition
Large incumbents like Bharti, Vodafone and Idea were largely able to maintain their revenue market share despite significant competition from new entrants from 2H09 to end 2010. Instead, we saw continued loss in market share by the government owned players (BSNL and MTNL) and RCOM.

Barclays Capital | Indian Telecom Services
9 November 2011 15
Figure 14: Indian Telecom Services – Mobile market share by revenue
0
5
10
15
20
25
30
35
40
Sep-
06
Dec
-06
Mar
-07
Jun-
07
Sep-
07
Dec
-07
Mar
-08
Jun-
08
Sep-
08
Dec
-08
Mar
-09
Jun-
09
Sep-
09
Dec
-09
Mar
-10
Jun-
10
Sep-
10
Dec
-10
Mar
-11
Jun-
11
Bharti RCOM Idea Vodafone%
Only RCOM amongst the large incumbents has lost share
Source: Cellular Operators Association of India (COAI)
New mobile operators are struggling
While most of the license winners of 2007 have not even launched, many of players who managed to launch have not been able to perform well. In the figures below, we present Uninor as a case study. Uninor is a 67:33 joint venture between Telenor and Unitech that was formed in 2009.
When the JV began, Telenor injected US$1.2bn of equity, valuing the joint venture at c.US$1.8bn. Telenor recently announced its intention to raise US$1.8bn of fresh equity, which Unitech has disputed. According to Telenor, it now values the total JV at a mere US$120m, which Unitech has disputed vociferously.
Figure 15: Indian Telecom Services – New entrants Aircel andTata have struggled
Figure 16: Indian Telecom Services – State run players have continued to bleed on service issues
0
2
4
6
8
10
12
14
16
Sep-
06
Mar
-07
Sep-
07
Mar
-08
Sep-
08
Mar
-09
Sep-
09
Mar
-10
Sep-
10
Mar
-11
Aircel Tata
%
0
5
10
15
20
25
Sep-
06
Mar
-07
Sep-
07
Mar
-08
Sep-
08
Mar
-09
Sep-
09
Mar
-10
Sep-
10
Mar
-11
MTNL+BSNL%
Source: COAI Source: COAI

Barclays Capital | Indian Telecom Services
9 November 2011 16
Figure 19: Uninor – subscriber base in India
12.2
3.9
7.9
12.3
17.4
21.423.8
0
5
10
15
20
25
4Q2009 1Q2010 2Q2010 3Q2010 4Q2010 1Q2011 2Q2011 3Q2011
# of subscribers (mn)
Source: Telenor reports
Figure 20: Uninor – Telenor’s initial targets in 2009 (during the setting up of the Uninor JV) vs current situation
Target Current situation Situation vs initial plans
Nearer term
EBITDA breakeven 3 years post launch Barclays Capital Research forecasts EBITDA breakeven in four years X
OCF breakeven 5 years after launch In line per Barclays Capital Research forecasts II
Initial capex plan of US$1.2bn for 2009 and US$600mn for 2010
Actual capex of c.US$630mn in 2009 and US$270mn in 2010. Low levels of control on the front, problems with tower sharing, downward capex revisions and high 3G license fee means that the company will likely fall short of expectations going forward
X
Peak funding lower than Rs155bn (c.US$3.2bn) Invested US$1.2bn in 2009, debt of US$1bn on balance sheet. Planning to raise US$1.8bn of fresh equity
X
Longer term
8% pan-India market share c.2.6% market share ?
30% EBITDA margin Barclays Capital Research forecasts at 19.5% in 2020 X
10% capex/sales ratio Even after subsequent rounds of capex cuts, ratio reached only in 2015 II
Source: Telenor reports, Barclays Capital estimates
Figure 17: Uninor – capex Figure 18: Uninor – free cash flow and operating profit
0
100
200
300
400
500
600
700
800
2009 2010 2011E 2012E 2013E
US$mCumulative capex of
>US$1.5bn over 5 years
-1200
-1000
-800
-600
-400
-200
0
2009 2010 2011E 2012E 2013E
Op FCF Op Profit
US$m
Source: Company data, Barclays Capital estimates Source: Company data, Barclays Capital estimates

Barclays Capital | Indian Telecom Services
9 November 2011 17
Figure 21: Uninor – equity valuation in 2009 (formation of JV) vs now (US$mn)
1,800
120
0
200
400
600
800
1000
1200
1400
1600
1800
2000
2009 Current*
Value of the JV drops down to 1/15th of the original value
JV has c.US$1bn in debt, equity valuations and growth prospects
erode book value by US$1.7bn
Source: Telenor presentations, Barclays Capital estimates
MNP also favours incumbent GSM operators
The rollout of mobile number portability (MNP) in India in January 2011 was expected to start off another round of price wars especially in the post-paid segment between the operators clamouring to take market share. In reality, the impact of MNP has been quite muted with just over 2% of the total subscriber base opting for number porting as of the end of August-2010.
While this percentage number has risen steadily, this has been driven by subscriber base maturity, which has now started to focus on coverage and network quality rather than just cheapest tariffs. We believe this is why the larger incumbents with good coverage and better services such as Bharti, Vodafone and Idea are getting net port ins while companies such as MTNL, BSNL, Tata and Reliance are net losers.
Figure 22: Indian Telecom Services – Mobile number porting requests as a percentage of total subscribers
0.8%
1.0%
1.3%
1.5%
1.8%
2.1%
0.0%
0.5%
1.0%
1.5%
2.0%
2.5%
Mar-11 Apr-11 May-11 Jun-11 Jul-11 Aug-11
Source: Telecom Regulatory Authority of India, Barclays Capital

Barclays Capital | Indian Telecom Services
9 November 2011 18
Figure 23: Indian Telecom Services – Mobile number porting requests by area (‘000)
Jul-11 Aug-11 % of total mobile
subs
Zone 1 Delhi 839 1,010 2.5% Gujarat 1,551 1,763 3.6% Himachal Pradesh 65 74 1.0% Haryana 867 972 4.2% Jammu & Kashmir 3 4 0.1% Maharashtra 1,262 1,477 2.2% Mumbai 574 673 1.9% Punjab 701 792 2.6% Rajasthan 1,109 1,292 3.0% Uttar Pradesh - East 739 855 1.7% Uttar Pradesh - West 915 1,062 1.6% Zone 2 Andhra Pradesh 1,166 1,394 2.0% Assam 42 48 0.4% Bihar 363 418 0.7% Karnataka 1,194 1,401 2.8% Kerala 732 886 2.7% Kolkata 387 441 1.9% Madhya Pradesh 1,002 1,159 2.4% North East 11 13 0.2% Orissa 356 426 1.8% Tamil Nadu 1,075 1,236 2.1% West Bengal 591 664 1.50%
Total 15,548 18,059 2.1%
Source: Telecom Regulatory Authority of India
Figure 24: Indian Telecom Services – net additions from mobile number porting as of Aug-11
-800-600-400-200
0200400600800
1,0001,200
Idea
Vod
afon
e
Bhar
ti
Swan
HFC
L-C
DM
A
Tata
-GSM
MTN
L-G
SM
Vid
eoco
n
Tata
-CD
MA
Rel
ianc
e-G
SM
BSN
L-G
SM
Rel
ianc
e-C
DM
A
000 net requests
Source: COAI
Lower competitive intensity is better for the health of the larger players We agree that revenue growth for Indian wireless players could come down. Indeed, our revenue growth estimates build in top-line growth trending to below the nominal GDP growth rates of the country. However, reduced competitive intensity in India should lead to a positive impact on margins of the companies, thereby impacting ROIC positively.

Barclays Capital | Indian Telecom Services
9 November 2011 19
Figure 25: Bharti – revenue growth stabilizes, margins trend up
0%
5%
10%
15%
20%
25%
30%
35%
40%
45%
FY05 FY06 FY07 FY08 FY09 FY10 FY11 FY12E FY13E FY14E0%
10%
20%
30%
40%
50%
60%
70%Ebitda margins Rev growth y/y RHS
Source: Barclays Capital estimates
Figure 26: Idea – losing steam on revenue growth, margins improve
0%
5%
10%
15%
20%
25%
30%
35%
40%
FY05 FY06 FY07 FY08 FY09 FY10 FY11 FY12E FY13E FY14E0%
10%
20%
30%
40%
50%
60%
70%
80%Ebitda margins Rev growth y/y RHS
Source: Barclays Capital estimates
Figure 27: RCOM – rebounding to positive revenue growth, margins improve
0%
5%
10%
15%
20%
25%
30%
35%
40%
45%
50%
FY07 FY08 FY09 FY10 FY11 FY12E FY13E FY14E-15%
-10%
-5%
0%
5%
10%
15%
20%
25%
30%
35%
40%Ebitda margins Rev growth y/y RHS
Source: Barclays Capital estimates

Barclays Capital | Indian Telecom Services
9 November 2011 20
VALUATIONS AND FORECASTS In Figures 28-45, we display key historical valuation measures for the three Indian telecom companies.
Bharti The stock is trading below its 5-year average valuations on both 12-month forward earnings and book value. Even as the revenue and EBITDA forecasts for FY12 and FY13 have seen upgrades on account of better competitive environment in India and improvements in Africa, forex losses have taken a toll on the EPS that has gone through a round of downgrades.
Idea The stock trades around its 5-year average on a 12 month forward earnings basis and below average on a book value basis. While the company has seen on marginal increase in revenue forecasts, earnings have seen an upgrade on account of improving operating metrics. The stocks trades on very similar levels on a price to book as Bharti despite having an inferior return profile.
RCOM The company has gone through a round of revenue and earnings downgrades but what stands out is the stock’s valuation on a book value basis (0.4x 12-month forward book).

Barclays Capital | Indian Telecom Services
9 November 2011 21
Figure 28: Bharti –12-month forward P/E (x) Figure 29: Bharti – 12-month forward P/B (x)
0
5
10
15
20
25
30
35
Jan-
06
Jul-
06
Jan-
07
Jul-
07
Jan-
08
Jul-
08
Jan-
09
Jul-
09
Jan-
10
Jul-
10
Jan-
11
Jul-
11
max
min
avg
0
1
2
3
4
5
6
7
8
9
10
Jan-
06
Jul-
06
Jan-
07
Jul-
07
Jan-
08
Jul-
08
Jan-
09
Jul-
09
Jan-
10
Jul-
10
Jan-
11
Jul-
11
max
min
avg
Source: Datastream Source: Datastream
Figure 30: Bharti – 12-month forward EV/EBITDA Figure 31: Bharti – changes in EPS forecasts
0
2
4
6
8
10
12
14
16
Nov
-06
May
-07
Nov
-07
May
-08
Nov
-08
May
-09
Nov
-09
May
-10
Nov
-10
May
-11
10
12
14
16
18
20
22
24
26
28
30
Nov
-10
Dec
-10
Jan-
11
Feb-
11
Mar
-11
Apr
-11
May
-11
Jun-
11
Jul-
11
Aug
-11
Sep-
11
Oct
-11
FY12E FY13E
Rs
Source: Datastream Source: Datastream (IBES consensus forecasts)
Figure 32: Bharti – changes to revenue forecasts Figure 33: Bharti – changes in EBITDA forecasts
600,000
650,000
700,000
750,000
800,000
850,000
900,000
Nov
-10
Dec
-10
Jan-
11
Feb-
11
Mar
-11
Apr
-11
May
-11
Jun-
11
Jul-
11
Aug
-11
Sep-
11
Oct
-11
FY12E FY13ERs m
200,000
220,000
240,000
260,000
280,000
300,000
320,000
340,000
Nov
-10
Dec
-10
Jan-
11
Feb-
11
Mar
-11
Apr
-11
May
-11
Jun-
11
Jul-
11
Aug
-11
Sep-
11
Oct
-11
FY12E FY13ERs m
Source: Datastream (IBES consensus estimates) Source: Datastream (IBES consensus estimates)

Barclays Capital | Indian Telecom Services
9 November 2011 22
Figure 34: Idea – 12-month forward P/E (x) Figure 35: Idea – 12-month forward P/B (x)
0
5
10
15
20
25
30
35
40
Apr
-07
Oct
-07
Apr
-08
Oct
-08
Apr
-09
Oct
-09
Apr
-10
Oct
-10
Apr
-11
Oct
-11
max
min
avg
0
1
2
3
4
5
6
7
8
9
Apr
-07
Aug
-07
Dec
-07
Apr
-08
Aug
-08
Dec
-08
Apr
-09
Aug
-09
Dec
-09
Apr
-10
Aug
-10
Dec
-10
Apr
-11
Aug
-11
max
min
avg
Source: Datastream Source: Datastream
Figure 36: Idea – 12-month forward EV/EBITDA Figure 37: Idea – changes in EPS forecasts
0
2
4
6
8
10
12
14
16
Apr
-07
Oct
-07
Apr
-08
Oct
-08
Apr
-09
Oct
-09
Apr
-10
Oct
-10
Apr
-11
Oct
-11
0
1
2
3
4
5
6
Nov
-10
Dec
-10
Jan-
11
Feb-
11
Mar
-11
Apr
-11
May
-11
Jun-
11
Jul-
11
Aug
-11
Sep-
11
Oct
-11
FY12E FY13E
Rs
Source: Datastream Source: Datastream (IBES consensus estimates)
Figure 38: Idea – changes in revenue forecasts
Figure 39: Idea – changes in EBITDA forecasts
150,000
160,000
170,000
180,000
190,000
200,000210,000
220,000
230,000
240,000
250,000
Nov
-10
Dec
-10
Jan-
11
Feb-
11
Mar
-11
Apr
-11
May
-11
Jun-
11
Jul-
11
Aug
-11
Sep-
11
Oct
-11
FY12E FY13ERs m
40,000
45,000
50,000
55,000
60,000
65,000
70,000
Nov
-10
Dec
-10
Jan-
11
Feb-
11
Mar
-11
Apr
-11
May
-11
Jun-
11
Jul-
11
Aug
-11
Sep-
11
Oct
-11
FY12E FY13ERs m
Source: Datastream (IBES consensus estimates) Source: Datastream (IBES consensus estimates)

Barclays Capital | Indian Telecom Services
9 November 2011 23
Figure 40: RCOM – 12-month forward P/E (x) Figure 41: RCOM – 12-month forward P/B (x)
0
5
10
15
20
25
30
Aug
-06
Feb-
07
Aug
-07
Feb-
08
Aug
-08
Feb-
09
Aug
-09
Feb-
10
Aug
-10
Feb-
11
Aug
-11
max
min
avg
0
1
2
3
4
5
6
Aug
-06
Feb-
07
Aug
-07
Feb-
08
Aug
-08
Feb-
09
Aug
-09
Feb-
10
Aug
-10
Feb-
11
Aug
-11
max
min
avg
Source: Datastream Source: Datastream
Figure 42: RCOM – 12-month forward EV/EBITDA Figure 43: RCOM – changes in EPS forecasts
0
2
4
6
8
10
12
14
16
Nov
-06
May
-07
Nov
-07
May
-08
Nov
-08
May
-09
Nov
-09
May
-10
Nov
-10
May
-11
0
2
4
6
8
10
12
14
Nov
-10
Dec
-10
Jan-
11
Feb-
11
Mar
-11
Apr
-11
May
-11
Jun-
11
Jul-
11
Aug
-11
Sep-
11
Oct
-11
FY12E FY13E
Rs
Source: Datastream Source: Datastream (IBES consensus estimates)
Figure 44: RCOM – changes in revenue forecasts Figure 45: RCOM – changes in EBITDA forecasts
200,000
210,000
220,000
230,000
240,000
250,000
260,000
270,000
280,000
Nov
-10
Dec
-10
Jan-
11
Feb-
11
Mar
-11
Apr
-11
May
-11
Jun-
11
Jul-
11
Aug
-11
Sep-
11
Oct
-11
FY12E FY13ERs m
60,000
65,000
70,000
75,000
80,000
85,000
90,000
95,000
100,000
Nov
-10
Dec
-10
Jan-
11
Feb-
11
Mar
-11
Apr
-11
May
-11
Jun-
11
Jul-
11
Aug
-11
Sep-
11
Oct
-11
FY12E FY13ERs m
Source: Datastream (IBES consensus estimates) Source: Datastream (IBES consensus estimates)

Barclays Capital | Indian Telecom Services
9 November 2011 24
BHARTI AIRTEL (1-OW; PT RS500; 26% POTENTIAL UPSIDE)
The sector bellwether
We initiate coverage on Bharti with a 1-Overweight rating and a price target of Rs500, implying 26% potential upside. We believe that reducing competitive intensity in Indian wireless should lead to strong EBITDA growth for Bharti’s India business. Furthermore, the low interest rate environment should lead to better-than-expected cash flows from its Africa business. Thus, we forecast CAGRs of 25% for EBITDA for FY2011-14E and 35% for EPS. Given our good growth assumptions, we find Bharti’s valuations reasonable at an EV/EBITDA of 6.5x FY2013 on our estimates and initiate with a 1-Overweight rating. We also note that Bharti is to be included in MSCI India from November, which could act as a catalyst for stock outperformance.
Reducing competitive intensity in India business We believe that the twin impact of tough credit conditions and regulatory uncertainty has hobbled the competition in Indian telecom market. This is visible in ability of Bharti to raise prices in this market. While this increase in pricing could impact volumes in short term, we believe it reflects a stronger margin/return profile over a medium term for the company
Bharti’s Africa business has challenges but remains a good buy We believe that Bharti could miss its target for EBITDA of US$2bn from its African business by FY3/13. However, market’s expectations for the business appear lower, and hence, this miss should largely be already reflected in Bharti’s current share price. Furthermore, the likelihood of a continuation of the current low interest rate environment should allow Bharti to fund this acquisition cheaply (6 month Libor + 195bps). This should help cash flows.
Reasonable valuations for the sector bellwether Strong execution, visionary management and comprehensive suite of services make Bharti a bellwether for the Indian Telecom Services subsector, in our view. Valuations at EV/EBITDA of 6.5x and P/E of 15x FY3/13 are reasonable compared with our growth assumptions.
Induction in MSCI India should act as a catalyst MSCI has recently indicated that it plans to include Bharti in MSCI India index from November 2011. This could be a catalyst for the share to outperform.
Figure 46: Bharti Airtel – statistical abstract
Year to Net profit EPS EPS P/E P/B ROE Div. yield
31-March (Rs mn) (Rs) growth (%) (x) (x) (%) (%)
2011A 58,992 15.53 -36% 25.6 2.9 12.2% 0.3%
2012E 53,848 14.18 -9% 28.0 2.7 10.0% 0.5%
2013E 100,544 26.48 87% 15.0 2.3 16.6% 1.0%
2014E 144,917 38.16 44% 10.4 2.0 20.4% 1.5%
Source: Company data, Barclays Capital estimates
BHARTI IN / BRTI.NS
Stock Rating 1-OVERWEIGHT
Sector View 2-NEUTRAL
Price Target INR 500.00
Price (04-Nov-2011) INR 397.95
Potential Upside/Downside +26%

Barclays Capital | Indian Telecom Services
9 November 2011 25
COMPANY SNAPSHOT
Bharti Airtel Asia ex-Japan Telecom Services
Income statement (Rs mn) 2011A 2012E 2013E 2014E CAGR
Revenue 594,672 705,617 831,741 973,921 17.9% Stock Rating 1-OVERWEIGHTEBITDA 199,664 246,886 310,140 383,664 24.3% Sector View 2-NEUTRALEBIT 97,598 119,545 178,851 245,128 35.9% Price (07-Nov-2011) Rs 398Pre-tax income 76,839 79,775 148,954 214,692 40.8% Price Target Rs 500Net income 58,992 53,848 100,544 144,917 34.9% Ticker BHARTI IN / BRTI.NSEPS (R) 15.53 14.18 26.48 38.16 34.9%
Diluted shares (mn) 3,798 3,798 3,798 3,798 0.0% Investment case
Margin and return data (%) Average
EBITDA margin 33.6 35.0 37.3 39.4 36.3
EBIT margin 16.4 16.9 21.5 25.2 20.0
Pre-tax margin 12.9 11.3 17.9 22.0 16.0
Net margin 9.9 7.6 12.1 14.9 11.1
ROIC 9.2 7.2 10.7 14.3 10.3
ROA 4.0 3.5 6.1 8.2 5.5 Upside case Rs 575ROE 12.2 10.0 16.6 20.4 14.8
Balance sheet and cash flow (Rs mn) CAGR
Fixed assets 931,873 1,059,674 1,235,556 1,414,129 14.9%
Cash and equivalents 15,799 71,050 71,334 95,753 82.3%
Total assets 1,465,064 1,559,060 1,646,389 1,757,753 6.3%
Current liabilities 369,845 408,885 450,966 479,045 9.0%
Long term liabilities 578,988 587,691 547,585 508,739 -4.2% Downside case Rs 414Total liabilities 948,833 996,576 998,551 987,784 1.4%
Net debt/(funds) 600,909 545,658 495,374 404,081 -12.4%
Shareholders' equity 516,231 562,484 647,838 769,970 14.3%
Change in working capital 121,277 21,078 21,662 21,934 -43.4%
Cash flow from operations 315,945 250,740 293,285 346,977 3.2%
Capital expenditure 303,357 127,801 175,882 178,573 -16.2%
Free cash flow 12,589 122,939 117,403 168,404 137.4%Upside/downside scenarios
Valuation and leverage metrics Average
P/E (x) 25.6 28.0 15.0 10.4 19.8
EV/EBITDA (x) 10.6 8.3 6.5 5.0 7.6
FCF yield (%) 0.8 8.1 7.8 11.1 7.0
EV/sales (x) 3.5 2.9 2.4 2.0 2.7
Price/BV (x) 2.9 2.7 2.3 2.0 2.5
Dividend yield (%) 0.3 0.5 1.0 1.5 0.8
EV/IC (x) 1.9 1.9 1.8 1.6 1.8
Net debt/EBITDA (x) 3.0 2.2 1.6 1.1 2.0
Source: Thomson Reuters Datastream, Barclays Capital est.
Selected operating metrics EPS projections
Mobile traffic (mn mins) 792,132 932,781 1,118,461 1,295,116
Revenue per minute (Rs) 0.46 0.44 0.43 0.42
EBITDA per minute 0.16 0.16 0.16 0.17
Source: Company data, Barclays Capital estimates Note: FY end Mar
The possibility of deterioration in the India business(easing credit situation leading to strongercompetition) could possibly impact the FY13EEBITDA number negatively by 7-8%. This coupledwith a lower target EV?EBITDA multiple (~10%) couldlead to a share price of Rs414.
Why a 1-Overweight? Reducing competitiveness inthe India and a stabilization in the Africa businessshould allow Bharti to return EBITDA/EPS CAGRs of24/36% for FY11E-14E. Valuations at a P?E of 15xand EV?EBITDA of 6.5x for FY13E thus appearinexpensive. Based on our DCF model, we value theshare at Rs500, implying upside of 26%.
Stronger-that-expected improvement in the Indiabusiness or management meeting its guidance forAfrica (compared with our expectation of asignificant miss) coupled with a slight (5%) increasein our target EV?EBITDA multiple could lead to ashare price of Rs575.
0
2
4
6
8
10
2011A 2012E 2013E 2014E1.21.251.31.351.41.451.5
Line item 1 L ine item 2
28
48
68
88
108
1
0
10
20
30
40
50
2011A 2012E 2013E 2014E
INR
125
325
525
725
1
INR414(4.2%)
DownsideCase
INR500(25.8%)
PriceTarget
INR575(44.7%)
UpsideCase
157
257
357
457
557
657
25-Nov-10 7-Nov-11

Barclays Capital | Indian Telecom Services
9 November 2011 26
Figure 51: Bharti Airtel – 12-month forward P/B (x) Figure 52: Bharti Airtel – 12-month forward EV/EBITDA
0
1
2
3
4
5
6
7
8
9
10
Jan-
06
Jul-
06
Jan-
07
Jul-
07
Jan-
08
Jul-
08
Jan-
09
Jul-
09
Jan-
10
Jul-
10
Jan-
11
Jul-
11
max
min
avg
0
2
4
6
8
10
12
14
16
Nov
-06
May
-07
Nov
-07
May
-08
Nov
-08
May
-09
Nov
-09
May
-10
Nov
-10
May
-11
Source: Datastream Source: Datastream
Figure 47: Bharti Airtel – revenue growth y/y Figure 48: Bharti Airtel – EBITDA growth y/y
0%
10%
20%
30%
40%
50%
60%
70%FY
05
FY06
FY07
FY08
FY09
FY10
FY11
FY12
E
FY13
E
FY14
E
0%
10%
20%
30%
40%
50%
60%
70%
80%
90%
FY05
FY06
FY07
FY08
FY09
FY10
FY11
FY12
E
FY13
E
FY14
E
Source: Company data, Barclays Capital estimates Source: Company data, Barclays Capital estimates
Figure 49: Bharti Airtel – EPS growth y/y Figure 50: Bharti Airtel – 12 month forward P/E (x)
-60%
-40%
-20%
0%
20%
40%
60%
80%
100%
FY06 FY08 FY10 FY12E FY14E
0
5
10
15
20
25
30
35
Jan-
06
Jul-
06
Jan-
07
Jul-
07
Jan-
08
Jul-
08
Jan-
09
Jul-
09
Jan-
10
Jul-
10
Jan-
11
Jul-
11
max
min
avg
Source: Company data, Barclays Capital estimates Source: Datastream

Barclays Capital | Indian Telecom Services
9 November 2011 27
Figure 53: Bharti Airtel – return profile
0%
5%
10%
15%
20%
25%
30%
35%
40%
FY05 FY06 FY07 FY08 FY09 FY10 FY11 FY12E FY13E FY14E
ROE ROIC
Source: Barclays Capital estimates
Valuation
Our 12-month price target of Rs500 is based on our discounted cash flow analysis in which assumptions for which are given in Figure 54.
The stock is trading at 6.5x FY13 EV/EBITDA, which we believe is attractive given the 35% EPS CAGR we forecast for FY11-14 (one of the best in our coverage universe in Asia).
Given the valuations and our forecast of 26% upside, we rate the stock 1-OW.
Figure 54: Bharti – Barclays Capital’s discounted cash flow assumptions
Mar-11 Mar-12 Mar-13 Mar-14 Mar-15 Mar-16 Mar-17 Mar-18 Mar-19 Mar-20
Total Sales Growth % 42.10% 18.70% 17.90% 17.10% 13.30% 9.60% 7.10% 5.60% 4.30% 3.50%
NOPAT Margin 12.30% 11.40% 14.50% 17.00% 18.40% 19.40% 20.20% 20.70% 21.10% 21.60%
Year End NetWC turns -3.14 -3.36 -3.59 -3.84 -4.11 -4.41 -4.73 -5.09 -5.48 -5.91
Year End Fixed asset turns 0.91 1.07 1.17 1.28 1.37 1.45 1.5 1.55 1.6 1.65
ROIC 9.20% 7.20% 10.70% 14.30% 17.10% 19.30% 20.90% 22.10% 23.10% 24.20%
Source: Barclays Capital estimates
Risks The key risks that might keep our price target from being achieved, in our view, include the nature and timeline of new telecom regulations in India and the company’s execution in Africa (revenue growth and margin expansion).

Barclays Capital | Indian Telecom Services
9 November 2011 28
RELIANCE COMMUNICATION (1-OW; PT RS130; 56% POTENTIAL UPSIDE)
Undervalued asset play
We initiate coverage of RCOM with a 1-Overweight rating and a price target of Rs130, implying 56% potential upside. However, we believe that the three key issues with the company going forward are a) weak execution, b) poor cash flows and high debt burden, and c) regulatory uncertainties. Given the improving business environment, we believe that company’s operating margins should improve going forward, which would help cash flows. Furthermore, we believe that some of the RCOM’s assets, such as its 800MHz of CDMA spectrum and its long-distance business, could be undervalued its current share prices implying a P/B multiple of just 0.4x.
Business environment should reduce execution risk Weak execution has been a bane of the company for the past few years, in our view. However, with our expectations of an improving environment for Indian wireless, we believe that RCOM should also benefit. Thus, we forecast a 440bps improvement in EBIDTA margins and 9% revenue CAGR from FY2012-14E.
Cash position constrained, but RCOM should be able to meet debt obligations RCOM is highly leveraged with a net debt/EBITDA ratio of 4.4x FY12. Management is cognizant of this fact and has tried to conserve cash significantly over past two years. We expect company to have an operating cash flow of Rs75bn in the current year and expect it to be able to pay its upcoming FCCBs in February from internal accruals and current credit lines.
Possibility of business disposals RCOM’s management has clearly indicated that it is not averse to seeking strategic partners to some of the company’s businesses. We believe that RCOM’s long distance business and its digital TV business could be attractive targets. These business disposals could also help RCOM reduce its high debt burden.
Cheap relative to asset value: RCOM is currently trading at P/B of 0.4x, which we view as inexpensive relative to the value of its underlying assets such as the long distance business and the CDMA spectrum.
Figure 55: RCOM – statistical abstract
Year to Net profit EPS EPS P/E P/B ROE Div. yield
31-March (Rs mn) (Rs) growth (%) (x) (x) (%) (%)
2011A 13,457 6.52 -71% 12.8 0.4 3.2% 1.2%
2012E 8,922 4.32 -34% 19.3 0.4 2.2% 1.3%
2013E 14,394 6.97 61% 11.9 0.4 3.4% 1.7%
2014E 23,559 11.41 64% 7.3 0.4 5.4% 2.8%
Source: Company data, Barclays Capital estimates
RCOM IN / RLCM.NS
Stock Rating 1-OVERWEIGHT
Sector View 2-NEUTRAL
Price Target INR 130.00
Price (04-Nov-2011) INR 83.20
Potential Upside/Downside +56%

Barclays Capital | Indian Telecom Services
9 November 2011 29
COMPANY SNAPSHOT
Reliance Communications Asia ex-Japan Telecom Services
Income statement (Rs mn) 2011A 2012E 2013E 2014E CAGR
Revenue 231,076 212,697 231,993 253,821 3.2% Stock Rating 1-OVERWEIGHTEBITDA 90,816 69,214 80,742 93,795 1.1% Sector View 2-NEUTRALEBIT 25,777 30,297 39,976 50,997 25.5% Price (05-Oct-2011) Rs 83Pre-tax income 15,055 10,116 16,882 28,619 23.9% Price Target Rs 130Net income 13,457 8,922 14,394 23,559 20.5% Ticker RCOM IN / RLCM.NSEPS (R) 6.52 4.32 6.97 11.41 20.5%
Diluted shares (mn) 2,064 2,064 2,064 2,064 0.0% Investment case
Margin and return data (%) Average
EBITDA margin 39.3 32.5 34.8 37.0 35.9
EBIT margin 11.2 14.2 17.2 20.1 15.7
Pre-tax margin 6.5 4.8 7.3 11.3 7.5
Net margin 5.8 4.2 6.2 9.3 6.4
ROIC 2.9 3.0 4.1 5.3 3.8
ROA 1.4 1.0 1.6 2.5 1.6 Upside case Rs 200ROE 3.2 2.2 3.4 5.4 3.6
Balance sheet and cash flow (Rs mn) CAGR
Fixed assets 1,050,287 1,066,488 1,114,548 1,163,535 3.5%
Cash and equivalents 54,361 40,990 52,926 49,725 -2.9%
Total assets 947,227 892,996 916,463 923,978 -0.8%
Current liabilities 139,608 128,504 140,162 153,350 3.2%
Long term liabilities 402,627 352,627 352,627 327,627 -6.6% Downside case Rs 45Total liabilities 542,235 481,131 492,789 480,976 -3.9%
Net debt/(funds) 340,021 303,392 291,456 269,657 -7.4%
Shareholders' equity 404,992 411,865 423,674 443,002 3.0%
Change in working capital (50,340) 7,039 7,422 8,660 NA
Cash flow from operations 60,462 75,059 85,675 97,395 17.2%
Capital expenditure 97,102 16,201 48,059 48,988 -20.4%
Free cash flow (36,640) 58,858 37,616 48,408 NAUpside/downside scenarios
Valuation and leverage metrics Average
P/E (x) 12.8 19.3 11.9 7.3 12.8
EV/EBITDA (x) 5.6 6.9 5.7 4.7 5.7
FCF yield (%) (21.4) 34.4 22.0 28.3 15.8
EV/sales (x) 2.2 2.2 2.0 1.7 2.0
Price/BV (x) 0.4 0.4 0.4 0.4 0.4
Dividend yield (%) 1.2 1.3 1.7 2.8 1.7
EV/IC (x) 0.7 0.7 0.6 0.6 0.6
Net debt/EBITDA (x) 3.7 4.4 3.6 2.9 3.7
Source: Thomson Reuters Datastream, Barclays Capital est.
Selected operating metrics EPS projections
Mobile traffic (mn mins) 374,900 432,962 481,439 545,855
Revenue per minute (Rs) 0.44 0.42 0.41 0.39
EBITDA per minute (Rs) 0.13 0.11 0.12 0.13
Source: Company data, Barclays Capital estimates Note: FY end Mar
A deterioration of cash flows, either due to weakbusiness environment or poor execution, would be asignificant negative. A 5% decline in EBITDA couldnegatively impact EPS by close to 35%. Using a P/Emultiple of 15x on the lower EPS, we come to a shareprice of Rs45.
Why a 1-Overweight? RCOM is a play on corporaterestructuring or asset valuations. While operatingperformance could remain weak near term, thecompany’s efforts on business disposals orincreased asset sweating could lead to asset valuesupport. Based on our DCF model, we value theshare at Rs130, implying upside of 56%.
A quick asset disposal or an agreement to lease itstower assets or domestic fibre business could be abig positive for the company. Assuming that the dealhappens at close to the cost of equity, we believethat the share could trade up to 1x P/B for a shareprice of Rs200.
0
2
4
6
8
10
2011A 2012E 2013E 2014E1.21.251.31.351.41.451.5
Line item 1 L ine item 2
HK$56(-33.9%)Downside
Case28
48
68
88
108
25-Nov-10 7-Nov-11
02468
1012
2011A 2012E 2013E 2014E
INR
INR485(10.2%)
PriceTarget
INR725(64.7%)Upside
Case125
325
525
725
25-Nov-10 7-Nov-11
INR45(-45.9%)Downside
Case
INR130(56.1%)
PriceTarget
INR200(140.%)
UpsideCase
22
72
122
172
222
25-Nov-10 7-Nov-11

Barclays Capital | Indian Telecom Services
9 November 2011 30
Figure 56: RCOM – revenue growth y/y Figure 57: RCOM – EBITDA growth y/y
-10%
-5%
0%
5%
10%
15%
20%
25%
30%
35%
FY08 FY09 FY10 FY11 FY12E FY13E FY14E
-30%
-20%
-10%
0%
10%
20%
30%
40%
50%
FY08 FY09 FY10 FY11 FY12E FY13E FY14E
Source: Company data, Barclays Capital estimates Source: Company data, Barclays Capital estimates
Figure 58: RCOM – EPS growth y/y Figure 59: RCOM – 12-month forward P/E (x)
-80%
-60%
-40%
-20%
0%
20%
40%
60%
80%
FY08 FY09 FY10 FY11 FY12E FY13E FY14E
0
5
10
15
20
25
30
Aug
-06
Feb-
07
Aug
-07
Feb-
08
Aug
-08
Feb-
09
Aug
-09
Feb-
10
Aug
-10
Feb-
11
Aug
-11
max
min
avg
Source: Company data, Barclays Capital estimates Source: Datastream
Figure 60: RCOM – 12-month forward P/B (x) Figure 61: RCOM – –12-month forward EV/EBITDA
0
1
2
3
4
5
6
Aug
-06
Feb-
07
Aug
-07
Feb-
08
Aug
-08
Feb-
09
Aug
-09
Feb-
10
Aug
-10
Feb-
11
Aug
-11
max
min
avg
0
2
4
6
8
10
12
14
16
Nov
-06
May
-07
Nov
-07
May
-08
Nov
-08
May
-09
Nov
-09
May
-10
Nov
-10
May
-11
Source: Datastream Source: Datastream

Barclays Capital | Indian Telecom Services
9 November 2011 31
Figure 62: RCOM – return profile
0%
5%
10%
15%
20%
25%
FY08 FY09 FY10 FY11 FY12E FY13E FY14E
ROE ROIC
Source: Barclays Capital estimates
Valuation
Our 12-month price target of Rs130 is based on our discounted cash flow analysis assumptions for which are given in Figure 63.
The stock is trading at 0.4x times forward book, which is a significant discount to its 5-year average valuation and which we believe significantly undervalues the underlying assets of the company.
Given the inexpensive valuations on a book value basis and our forecast of 56% upside, we rate the stock 1-OW.
Figure 63: RCOM – Barclays Capital’s discounted cash flow assumptions
Mar-11 Mar-12 Mar-13 Mar-14 Mar-15 Mar-16 Mar-17 Mar-18 Mar-19 Mar-20
Total Sales Growth % 4.4% -8.0% 9.1% 9.4% 7.8% 6.4% 5.3% 4.5% 4.0% 3.8%
NOPAT Margin 8.9% 10.6% 12.9% 15.2% 16.4% 16.7% 16.8% 16.7% 16.6% 16.9%
Year End NetWC turns -9.8 -6.9 -6.1 -5.4 -5.4 -5.4 -5.4 -5.4 -5.4 -5.4
Year End Fixed asset turns 0.3 0.3 0.3 0.3 0.4 0.4 0.4 0.4 0.4 0.5
ROIC 2.9% 3.0% 4.1% 5.3% 6.2% 6.7% 7.2% 7.5% 7.8% 8.3%
Source: Barclays Capital estimates
Risks The key risks that might keep our price target from being achieved, in our view, include interest rate movements due to the high net debt and execution risks both from a business perspective and restructuring and asset disposal perspective.

Barclays Capital | Indian Telecom Services
9 November 2011 32
IDEA CELLULAR (2-EQUAL WEIGHT; PT RS100; 2% POTENTIAL UPSIDE)
The wireless pure play
We initiate coverage on Idea with a 2-Equal Weight rating and a price target of Rs100 compared with the current price of Rs98. Given its pure play Indian wireless exposure, we believe that Idea could be best leveraged to the improvement in Indian mobile industry. Thus, we forecast a CAGR of 23% for EBITDA for FY2011-14 and 32% for EPS. However, we find valuations are not cheap at an EV/EBITDA multiple of 7.2x FY3/13, and thus, we initiate with a 2-EW rating.
Expect growth to remain strong Despite the turmoil in Indian mobile market, Idea management has executed well over the past few years, in our view. Going forward, we expect EBITDA margins to expand by 540bps over three years as competitive intensity comes off and profitability of new circles improve. This should lead to an EBITDA CAGR of 23% and EPS CAGR of 32% over FY3/11-3/14
Debt burden should reduce Due to recent spending on 3G auctions, Idea’s net debt to EBITDA increased to 3.1x (FY3/11 end). We believe that an improvement in EBITDA margins along with restrained capex spending over next three years should allow Idea to reduce this to a more sustainable 2.0x FY3/13 without resorting to asset sales or equity raising.
However, the stock is not inexpensive Idea is trading at a P/B of 2.2x FY3/13 with an FY3/13 ROE of 10.6%. In contrast, Bharti also trades at a P/B of 2.3x FY3/13 but sports an ROE of 16.6%. We would thus prefer Bharti over Idea.
Figure 64: Idea Cellular – statistical abstract
Year to Net profit EPS EPS P/E P/B ROE Div. yield
31-March (Rs mn) (Rs) growth (%) (x) (x) (%) (%)
2011A 8,987 2.72 -7% 35.9 2.6 7.6 0.0
2012E 7,976 2.42 -11% 40.5 2.5 6.3 0.0
2013E 14,707 4.46 84% 22.0 2.2 10.6 0.0
2014E 20,662 6.26 40% 15.6 2.0 13.4 1.2
Source: Company data, Barclays Capital estimates
IDEA IN / IDEA.NS
Stock Rating 2-EQUAL WEIGHT
Sector View 2-NEUTRAL
Price Target INR 100.00
Price (04-Nov-2011) INR 97.80
Potential Upside/Downside +2%

Barclays Capital | Indian Telecom Services
9 November 2011 33
COMPANY SNAPSHOT
Idea Cellular Asia ex-Japan Telecom Services
Income statement (Rs mn) 2011A 2012E 2013E 2014E CAGR
Revenue 155,032 186,855 214,228 237,267 15.2% Stock Rating 2-EQUAL WEIGHTEBITDA 37,907 49,922 61,449 70,833 23.2% Sector View 2-NEUTRALEBIT 13,933 21,846 32,800 41,278 43.6% Price (07-Nov-2011) Rs 98Pre-tax income 9,969 11,395 21,628 30,385 45.0% Price Target Rs 100Net income 8,987 7,976 14,707 20,662 32.0% Ticker IDEA IN / IDEA.NSEPS (R) 2.72 2.42 4.46 6.26 32.0%
Diluted shares (mn) 3,300 3,300 3,300 3,300 0.0% Investment case
Margin and return data (%) Average
EBITDA margin 24.5 26.7 28.7 29.9 27.4
EBIT margin 9.0 11.7 15.3 17.4 13.3
Pre-tax margin 6.4 6.1 10.1 12.8 8.9
Net margin 5.8 4.3 6.9 8.7 6.4
ROIC 5.5 6.0 8.1 10.0 7.4
ROA 3.0 2.4 3.9 5.3 3.6 Upside case Rs 115ROE 7.6 6.3 10.6 13.4 9.5
Balance sheet and cash flow (Rs mn) CAGR
Fixed assets 336,977 342,291 390,352 422,076 7.8%
Cash and equivalents 4,577 16,562 34,675 49,042 120.5%
Total assets 299,036 337,080 376,367 391,793 9.4%
Current liabilities 55,331 65,399 74,980 83,043 14.5%
Long term liabilities 120,705 140,705 155,705 145,705 6.5% Downside case Rs 75Total liabilities 176,036 206,104 230,685 228,748 9.1%
Net debt/(funds) 116,128 124,143 121,030 96,663 -5.9%
Shareholders' equity 122,999 130,976 145,682 163,044 9.9%
Change in working capital 22,401 (12,534) 7,819 9,174 -25.7%
Cash flow from operations 58,574 33,969 62,347 66,983 4.6%
Capital expenditure 95,332 31,533 48,061 31,724 -30.7%
Free cash flow (36,758) 2,436 14,286 35,259 NAUpside/downside scenarios
Valuation and leverage metrics Average
P/E (x) 35.9 40.5 22.0 15.6 28.5
EV/EBITDA (x) 11.6 9.0 7.2 5.9 8.4
FCF yield (%) (13) 0.9 5.2 12.8 1.4
EV/sales (x) 2.8 2.4 2.1 1.8 2.3
Price/BV (x) 2.6 2.5 2.2 2.0 2.3
Dividend yield (%) 0.0 0.0 0.0 1.2 0.3
EV/IC (x) 1.9 1.7 1.6 1.5 1.7
Net debt/EBITDA (x) 3.1 2.5 2.0 1.4 2.2
Source: Thomson Reuters Datastream, Barclays Capital est.
Selected operating metrics EPS projections
Mobile traffic (mn mins) 362,565 450,150 530,268 605,842
Revenue per minute (Rs) 0.43 0.41 0.40 0.39
EBITDA per minute 0.07 0.09 0.09 0.09
Source: Company data, Barclays Capital estimates Note: FY end Mar
The possibility of deterioration in the India business(easing credit situation leading to strongercompetition) could possibly impact FY13E EBITDAnegatively by 12-15%. This coupled with a lowertarget EV?EBITDA multiple (~10$) could lead to ashare price of Rs75.
Why a 2-Equal Weight? We agree that businessconditions in India should allow Idea to returnEBITDA?EPSCAGRs of 23%?32%over FY11E-14E.However, with the stock at a P/E of 22x andEV?EBITDAof 7.2x for FY13E, we do not find theshare inexpensive. Based on our DCF model, wevalue the share at Rs100, implying upside of 2%.
Stronger-than-expected improvement in the Indiabusiness could lead to EBITDA coming in about 10%above our estimate for FY13E. This coupled with aslight (5%) increase in our target EV?EBITDAmultiplecould lead to a share price of Rs115.
0
2
4
6
8
10
2011A 2012E 2013E 2014E1.21.251.31.351.41.451.5
Line item 1 L ine item 2
HK$56(-33.9%)
DownsideCase
HK$69(-18.6%)
PriceTarget
28
48
68
88
108
25-Nov-10 7-Nov-11
0
2
4
6
8
2011A 2012E 2013E 2014E
INR
125
325
525
725
25-Nov-10 7-Nov-11
INR75(-23.3%)
DownsideCase
INR100(2.1%)
PriceTarget
INR115(17.5%)
UpsideCase
28
48
68
88
108
128
25-Nov-10 7-Nov-11

Barclays Capital | Indian Telecom Services
9 November 2011 34
Figure 65: Idea Cellular – revenue growth y/y Figure 66: Idea Cellular – EBITDA growth y/y
0%
10%
20%
30%
40%
50%
60%
FY08 FY09 FY10 FY11 FY12E FY13E FY14E
0%
10%
20%
30%
40%
50%
60%
FY08 FY09 FY10 FY11 FY12E FY13E FY14E
Source: Company data, Barclays Capital estimates Source: Company data, Barclays Capital estimates
Figure 67: Idea Cellular – EPS growth y/y Figure 68: Idea Cellular – 12-month forward P/E (x)
-40%
-20%
0%
20%
40%
60%
80%
100%
FY08 FY09 FY10 FY11 FY12E FY13E FY14E
0
5
10
15
20
25
30
35
40
Apr
-07
Oct
-07
Apr
-08
Oct
-08
Apr
-09
Oct
-09
Apr
-10
Oct
-10
Apr
-11
Oct
-11
max
min
avg
Source: Company data, Barclays Capital estimates Source: Datastream
Figure 69: Idea Cellular – 12 month forward P/B (x) Figure 70: Idea Cellular – 12-month forward EV/EBITDA
0
1
2
3
4
5
6
7
8
9
Apr
-07
Aug
-07
Dec
-07
Apr
-08
Aug
-08
Dec
-08
Apr
-09
Aug
-09
Dec
-09
Apr
-10
Aug
-10
Dec
-10
Apr
-11
Aug
-11
max
min
avg
0
2
4
6
8
10
12
14
16
Apr
-07
Oct
-07
Apr
-08
Oct
-08
Apr
-09
Oct
-09
Apr
-10
Oct
-10
Apr
-11
Oct
-11
Source: Datastream Source: Datastream

Barclays Capital | Indian Telecom Services
9 November 2011 35
Figure 71: Idea Cellular – return profile
0%
5%
10%
15%
20%
25%
30%
35%
40%
FY08 FY09 FY10 FY11 FY12E FY13E FY14E
ROE ROIC
Source: Barclays Capital estimates
Valuation
Our 12-month price target of Rs100 is based on our discounted cash flow analysis assumptions for which are as given in Figure 72.
The stock is trading at an EV/EBITDA of 7.2x FY13, which given its growth and return profile is unattractive and draws our preference towards Bharti.
Given the valuations and our forecast of 2% price target upside based on DCF, we rate the stock 2-EW.
Figure 72: Idea Cellular – Barclays Capital’s discounted cash flow assumptions
Mar-11 Mar-12 Mar-13 Mar-14 Mar-15 Mar-16 Mar-17 Mar-18 Mar-19 Mar-20
Total Sales Growth % 25.0% 20.5% 14.6% 10.8% 7.8% 5.8% 6.1% 3.4% 2.7% 2.3%
NOPAT Margin 7.5% 8.0% 10.3% 11.8% 12.8% 13.6% 14.8% 15.2% 15.6% 15.9%
Year End NetWC turns -6.3 -732.7 -66.7 -23.5 -10.8 -10.8 -10.8 -10.8 -10.8 -10.8
Year End Fixed asset turns 0.6 0.7 0.8 0.8 0.9 1.0 1.0 1.1 1.1 1.1
ROIC 5.5% 6.0% 8.1% 10.0% 12.2% 14.2% 16.4% 17.7% 18.8% 19.8%
Source: Barclays Capital estimates
Risks
The key risks that might keep our price target from being achieved, in our view, include the regulatory changes on the mobile side, new licenses and emergence of competition and execution risks on 3G business.

Barclays Capital | Indian Telecom Services
9 November 2011 36
APPENDIX: BHARTI AFRICA
Entry into Rwanda
Bharti has continued its strong progress in Africa, extending its reach to 17 countries. The latest addition is Rwanda where it recently secured 2G/3G licenses and where it intends to invest US$100mn over the next three years. While the company’s growth intentions was made evident by the Bharti Africa CEO, entry into Rwanda could provide an opportunity to capture market share in a country that still has a fairly low penetration rate at 38% according to the Rwanda Utilities Regulatory Agency (RURA) with only two existing competitors, MTN and Millicom.
Figure 73: Rwanda – mobile telecom market shares
MTN68%
Millicom32%
- 4.13m subs-Penetration rate of 38%
Source: Rwanda Utilities Regulatory Agency (RURA), Barclays Capital
Comments from Bharti and its Africa peers
Although comments from the company and most competitors is pointing towards healthy long-term growth for most of the peers across the African continent, MTN’s comments regarding Nigeria, the largest African market for Bharti at one-third of total revenue globally and Uganda are the most pertinent, in our view. The two countries show sharp contrasts with Nigeria showing signs of excessive competition with price cuts causing market share volatility and Uganda showing the first signs of inflationary pressures where price increases by operators could provide an opportunity for Bharti to improve margins.
Figure 74: Bharti Airtel – recent commentary of its peers
Recent comments
MTN • MTN’s price cuts in Nigeria in Aug-Sept resulted in it regaining share with net adds of 567K
• Price increases in Uganda indicate inflationary pressures.
Millicom • Further decline of ARPU in Africa (down 9.7% y/y) with declines in Ghana and Senegal
• Promotional activity will cause a volatility in market share. • Overall market continues to grow well (+7.8% y/y in constant currency) with non-
SMS VAS seeing good growth, up 1.1% q/q
Vodacom • Service revenue is seeing a strengthening recovery driven by tariff stability in Tanzania and the DRC
• Strong subscriber growth (+22% y/y)
Source: Company data, Barclays Capital

Barclays Capital | Indian Telecom Services
9 November 2011 37
Figure 75: Bharti Airtel – key developments for Africa
Country Key developments
Chad Regulator conducted a survey in May 2011 in which Airtel was shown to be the operator providing the best quality network
Congo 3G license terms discussed, agreed and signed with regulator
Gabon Signed a MoU with Gabon Telecom that will give Airtel access to the SAT-3 submarine cable
Ghana MNP officially launched in July 2011
Kenya Communication commission suspended the previously announced glide path for up to 12 months; new interconnect rate implementation delayed
Madagascar Import of 3G equipments has been authorized by the regulator
Malawi Airtel along with other operators formally objected to the regulator's intention for the monitoring and control of international incoming calls along with an increase of the termination rates charged into the country
Nigeria Announcement of implementation of MNP with the anticipated timeline for rollout being March 2012
Tanzania Draft industry regulations issued in June 2011 for co-location and site sharing, account separation, competition, tariff, frequency, licensing, quality of service, mobile number portability, consumer protection, broadcasting, equipment identification register, emergency response and numbering
Uganda Regulator has informed that a frequency reallocation of the 900MHz band is to be implemented
Zambia Regulator issued draft Quality of Service (QOS) guidelines in May 2011
Rwanda Secures 2G/3G license, plans investment of US$100mn in Africa
Source: Company data
In addition, mandatory SIM registration in markets like Nigeria, Ghana and Kenya has caused a deceleration of the net subscriber addition rate towards the middle of the year. However, this is has again revived in the September 2011 quarter with monthly additions showing a significant increase in new subscriber additions.
Figure 76: Nigeria – wireless market subscriber additions
Mar-11 Jun-11 Sep-11
GSM active subscribers 83,857,798 84,093,173 87,417,508
Monthly adds 887,371 78,458 1,108,112
Source: Nigerian Communications Commission, Barclays Capital
Currency volatility remains a risk
The impact of the Indian rupee’s depreciation on Bharti’s profitability is significant given the un-hedged US$9bn loan for the Zain asset acquisition and more than US$1bn of foreign currency loans. Bharti’s disclosures in the FY11 annual reports suggest that a 1% change in the Rs/US$ has a negative 1.7% impact on EPS while a 1% change in Rs/JPY has a negative 0.3% impact. For FY2011, 20% of Bharti’s revenues came from its Africa business. The recent depreciation of African currencies should provide some mitigation to the impact of the rupee’s depreciation.

Barclays Capital | Indian Telecom Services
9 November 2011 38
Figure 79: Bharti Airtel – quarterly revenue growth for Bharti Africa
0
200
400
600
800
1000
1200
Jun-10 Sep-10 Dec-10 Mar-11 Jun-11 Sep-110%
1%
2%
3%
4%
5%
6%
7%
8%
9%
10%Revenue q/q
Source: Company data, Barclays Capital
Figure 80: Bharti Airtel – margins likely to expand but fall short of management expectations
0%
5%
10%
15%
20%
25%
30%
35%
40%
FY11 FY12E FY13E FY14E
Ebitda margin
Management expectat ion of a 120 bps margin expectation in FY13,
actual might only be 100bps
Source: Company data, Barclays Capital estimates
Figure 77: Rupee has depreciated 11% since 1 July 2011 Figure 78: African currencies too have shown depreciation against the US$
40
42
44
46
48
50
52
54
Jul-
11
Aug
-11
Sep-
11
Oct
-11
Nov
-11
INR/USD
90
100
110
120
130
Jul-
11
Aug
-11
Sep-
11
Oct
-11
Nov
-11
Nigerian Naira
Ugandan Shilling
Zambian Kwacha
Source: Bloomberg Source: Bloomberg
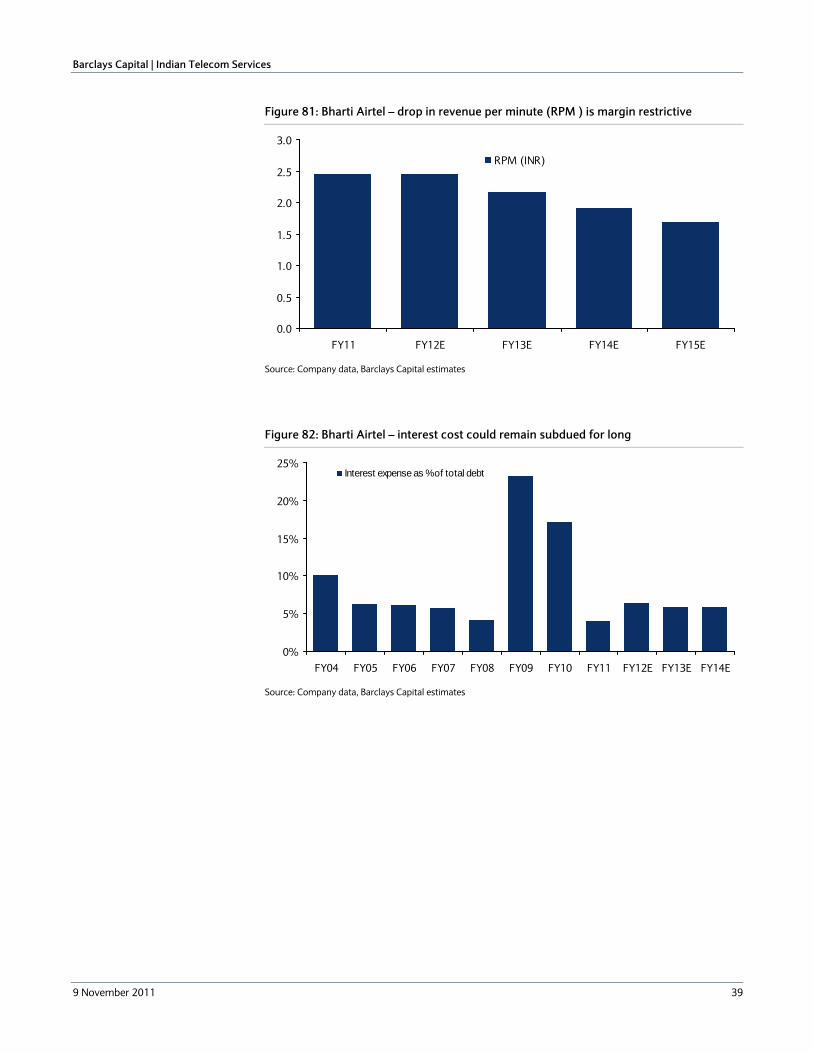
Barclays Capital | Indian Telecom Services
9 November 2011 39
Figure 81: Bharti Airtel – drop in revenue per minute (RPM ) is margin restrictive
0.0
0.5
1.0
1.5
2.0
2.5
3.0
FY11 FY12E FY13E FY14E FY15E
RPM (INR)
Source: Company data, Barclays Capital estimates
Figure 82: Bharti Airtel – interest cost could remain subdued for long
0%
5%
10%
15%
20%
25%
FY04 FY05 FY06 FY07 FY08 FY09 FY10 FY11 FY12E FY13E FY14E
Interest expense as % of total debt
Source: Company data, Barclays Capital estimates

Barclays Capital | Indian Telecom Services
9 November 2011 40
Valuation Methodology and Risks
Asia ex-Japan Telecom Services
Bharti Airtel Ltd. (BHARTI IN / BRTI.NS)
Valuation Methodology: Our 12-month price target of Rs500 is based on our discounted cash flow analysis in which we assume a double-digit c.10% average reveue growth and margin expansion of almost 900bps through the decade, a 3% terminal growth rate and a WACC of 12%.
Risks which May Impede the Achievement of the Price Target: The key risks that might keep our price target from being achieved, in our view, include the nature and timeline of new telecom regulations in India and the company's execution in Africa (revenue growth and margin expansion).
Idea Cellular Ltd, (IDEA IN / IDEA.NS)
Valuation Methodology: Our 12-month price target of Rs100 is based on our discounted cash flow analysis in which we assume a c.10% average reveue growth and margin expansion of almost 800bps through the decade, a 3% terminal growth rate and a WACC of 12%.
Risks which May Impede the Achievement of the Price Target: The key risks that might keep our price target from being achieved, in our view, include the regulatory changes on the mobile side, new licenses and emergence of competition and execution risks on 3G business.
Reliance Communications Ltd. (RCOM IN / RLCM.NS)
Valuation Methodology: Our 12-month price target of Rs130 is based on our discounted cash flow analysis in which we assume 5% average reveue growth and margin expansion of almost 800bps through the decade, a 3% terminal growth rate and a WACC of 13%.
Risks which May Impede the Achievement of the Price Target: The key risks that might keep our price target from being achieved, in our view, include interest rate movements due to the high net debt and execution risks both from a business perspective and restructuring and asset disposal perspective.
Source: Barclays Capital

Barclays Capital | Indian Telecom Services
9 November 2011 41
ANALYST(S) CERTIFICATION(S)
I, Bhuvnesh Singh, hereby certify (1) that the views expressed in this research report accurately reflect my personal views about any or all of thesubject securities or issuers referred to in this research report and (2) no part of my compensation was, is or will be directly or indirectly related tothe specific recommendations or views expressed in this research report.
IMPORTANT DISCLOSURES CONTINUED
For current important disclosures, including, where relevant, price target charts, regarding companies that are the subject of this research report,please send a written request to: Barclays Capital Research Compliance, 745 Seventh Avenue, 17th Floor, New York, NY 10019 or refer tohttp://publicresearch.barcap.com or call 1-212-526-1072.
The analysts responsible for preparing this research report have received compensation based upon various factors including the firm's totalrevenues, a portion of which is generated by investment banking activities.
Research analysts employed outside the US by affiliates of Barclays Capital Inc. are not registered/qualified as research analysts with FINRA.These analysts may not be associated persons of the member firm and therefore may not be subject to NASD Rule 2711 and incorporated NYSE Rule 472 restrictions on communications with a subject company, public appearances and trading securities held by a research analyst’saccount.
Barclays Capital produces a variety of research products including, but not limited to, fundamental analysis, equity-linked analysis, quantitative analysis, and trade ideas. Recommendations contained in one type of research product may differ from recommendations contained in othertypes of research products, whether as a result of differing time horizons, methodologies, or otherwise.
Primary Stocks (Ticker, Date, Price)
Bharti Airtel Ltd. (BRTI.NS, 04-Nov-2011, INR 397.95), 1-Overweight/2-Neutral
Idea Cellular Ltd, (IDEA.NS, 04-Nov-2011, INR 97.80), 2-Equal Weight/2-Neutral
Reliance Communications Ltd. (RLCM.NS, 04-Nov-2011, INR 83.20), 1-Overweight/2-Neutral
Materially Mentioned Stocks (Ticker, Date, Price)
China Unicom (0762.HK, 04-Nov-2011, HKD 16.56), 1-Overweight/2-Neutral
Far EasTone (4904.TW, 04-Nov-2011, TWD 53.70), 1-Overweight/2-Neutral
Hutchison Telecom Hong Kong Holdings (0215.HK, 04-Nov-2011, HKD 3.09), 1-Overweight/2-Neutral
Singapore Telecom (STEL.SI, 04-Nov-2011, SGD 3.15), 1-Overweight/2-Neutral
Guide to the Barclays Capital Fundamental Equity Research Rating System:
Our coverage analysts use a relative rating system in which they rate stocks as 1-Overweight, 2-Equal Weight or 3-Underweight (see definitions below) relative to other companies covered by the analyst or a team of analysts that are deemed to be in the same industry sector (the “sector coverage universe”).
In addition to the stock rating, we provide sector views which rate the outlook for the sector coverage universe as 1-Positive, 2-Neutral or 3-Negative (see definitions below). A rating system using terms such as buy, hold and sell is not the equivalent of our rating system. Investors should carefully read the entire research report including the definitions of all ratings and not infer its contents from ratings alone.
Stock Rating
1-Overweight - The stock is expected to outperform the unweighted expected total return of the sector coverage universe over a 12-month investment horizon.
2-Equal Weight - The stock is expected to perform in line with the unweighted expected total return of the sector coverage universe over a 12-month investment horizon.
3-Underweight - The stock is expected to underperform the unweighted expected total return of the sector coverage universe over a 12-month investment horizon.
RS-Rating Suspended - The rating and target price have been suspended temporarily due to market events that made coverage impracticable or to comply with applicable regulations and/or firm policies in certain circumstances including when Barclays Capital is acting in an advisorycapacity in a merger or strategic transaction involving the company.
Sector View
1-Positive - sector coverage universe fundamentals/valuations are improving.
2-Neutral - sector coverage universe fundamentals/valuations are steady, neither improving nor deteriorating.
3-Negative - sector coverage universe fundamentals/valuations are deteriorating.
Below is the list of companies that constitute the "sector coverage universe":
Asia ex-Japan Telecom Services
Bharti Airtel Ltd. (BRTI.NS) China Mobile (0941.HK) China Telecom (0728.HK)

Barclays Capital | Indian Telecom Services
9 November 2011 42
IMPORTANT DISCLOSURES CONTINUED
China Unicom (0762.HK) Chunghwa Telecom (2412.TW) Far EasTone (4904.TW)
Hutchison Telecom Hong Kong Holdings (0215.HK) Idea Cellular Ltd, (IDEA.NS) M1 (MONE.SI)
Reliance Communications Ltd. (RLCM.NS) Singapore Telecom (STEL.SI) SmarTone Telecommunications Holdings Ltd. (0315.HK)
StarHub Limited (STAR.SI) Taiwan Mobile (3045.TW)
Distribution of Ratings:
Barclays Capital Inc. Equity Research has 1942 companies under coverage.
43% have been assigned a 1-Overweight rating which, for purposes of mandatory regulatory disclosures, is classified as a Buy rating; 57% of companies with this rating are investment banking clients of the Firm.
42% have been assigned a 2-Equal Weight rating which, for purposes of mandatory regulatory disclosures, is classified as a Hold rating; 50% ofcompanies with this rating are investment banking clients of the Firm.
12% have been assigned a 3-Underweight rating which, for purposes of mandatory regulatory disclosures, is classified as a Sell rating; 38% ofcompanies with this rating are investment banking clients of the Firm.
Guide to the Barclays Capital Price Target:
Each analyst has a single price target on the stocks that they cover. The price target represents that analyst's expectation of where the stock willtrade in the next 12 months. Upside/downside scenarios, where provided, represent potential upside/potential downside to each analyst's pricetarget over the same 12-month period.
Barclays Capital offices involved in the production of equity research:
London
Barclays Capital, the investment banking division of Barclays Bank PLC (Barclays Capital, London)
New York
Barclays Capital Inc. (BCI, New York)
Tokyo
Barclays Capital Japan Limited (BCJL, Tokyo)
São Paulo
Banco Barclays S.A. (BBSA, São Paulo)
Hong Kong
Barclays Bank PLC, Hong Kong branch (Barclays Bank, Hong Kong)
Toronto
Barclays Capital Canada Inc. (BCC, Toronto)
Johannesburg
Absa Capital, a division of Absa Bank Limited (Absa Capital, Johannesburg)
Mexico City
Barclays Bank Mexico, S.A. (BBMX, Mexico City)
Taiwan
Barclays Capital Securities Taiwan Limited (BCSTW, Taiwan)
Seoul
Barclays Capital Securities Limited (BCSL, Seoul)
Mumbai
Barclays Securities (India) Private Limited (BSIPL, Mumbai)
Singapore
Barclays Bank PLC, Singapore branch (Barclays Bank, Singapore)

Barclays Capital | Indian Telecom Services
9 November 2011 43
IMPORTANT DISCLOSURES CONTINUED
Bharti Airtel Ltd. (BHARTI IN / BRTI.NS) Stock Rating Sector View
INR 397.95 (04-Nov-2011) 1-OVERWEIGHT 2-NEUTRAL
Rating and Price Target Chart - INR (as of 04-Nov-2011) Currency=INR
Closing Price
Jan- 09 Jul- 09 Jan- 10 Jul- 10 Jan- 11 Jul- 11
250
300
350
400
450
500
Date Closing Price Rating Price Target
Link to Barclays Capital Live for interactive charting
Barclays Bank PLC and/or an affiliate is a market-maker and/or liquidity provider in securities issued by Bharti Airtel Ltd. or one of its affiliates.
Barclays Bank PLC and/or an affiliate has received compensation for investment banking services from Bharti Airtel Ltd. in the past 12 months.
Barclays Bank PLC and/or an affiliate expects to receive or intends to seek compensation for investment banking services from Bharti Airtel Ltd.within the next 3 months.
Barclays Bank PLC and/or an affiliate trades regularly in the securities of Bharti Airtel Ltd..
Barclays Bank PLC and/or an affiliate has received non-investment banking related compensation from Bharti Airtel Ltd. within the past 12months.
Bharti Airtel Ltd. is, or during the past 12 months has been, an investment banking client of Barclays Bank PLC and/or an affiliate.
Bharti Airtel Ltd. is, or during the past 12 months has been, a non-investment banking client (securities related services) of Barclays Bank PLCand/or an affiliate.
Valuation Methodology: Our 12-month price target of Rs500 is based on our discounted cash flow analysis in which we assume a double-digit c.10% average reveue growth and margin expansion of almost 900bps through the decade, a 3% terminal growth rate and a WACC of 12%.
Risks which May Impede the Achievement of the Price Target: The key risks that might keep our price target from being achieved, in our view,include the nature and timeline of new telecom regulations in India and the company's execution in Africa (revenue growth and margin expansion).

Barclays Capital | Indian Telecom Services
9 November 2011 44
IMPORTANT DISCLOSURES CONTINUED
Idea Cellular Ltd, (IDEA IN / IDEA.NS) Stock Rating Sector View
INR 97.80 (04-Nov-2011) 2-EQUAL WEIGHT 2-NEUTRAL
Rating and Price Target Chart - INR (as of 04-Nov-2011) Currency=INR
Closing Price
Jan- 09 Jul- 09 Jan- 10 Jul- 10 Jan- 11 Jul- 11
37.5
45.0
52.5
60.0
67.5
75.0
82.5
90.0
97.5
105.0
Date Closing Price Rating Price Target
Link to Barclays Capital Live for interactive charting
Barclays Bank PLC and/or an affiliate is a market-maker and/or liquidity provider in securities issued by Idea Cellular Ltd, or one of its affiliates.
Barclays Bank PLC and/or an affiliate trades regularly in the securities of Idea Cellular Ltd,.
Valuation Methodology: Our 12-month price target of Rs100 is based on our discounted cash flow analysis in which we assume a c.10%average reveue growth and margin expansion of almost 800bps through the decade, a 3% terminal growth rate and a WACC of 12%.
Risks which May Impede the Achievement of the Price Target: The key risks that might keep our price target from being achieved, in our view,include the regulatory changes on the mobile side, new licenses and emergence of competition and execution risks on 3G business.

Barclays Capital | Indian Telecom Services
9 November 2011 45
IMPORTANT DISCLOSURES CONTINUED
Reliance Communications Ltd. (RCOM IN / RLCM.NS) Stock Rating Sector View
INR 83.20 (04-Nov-2011) 1-OVERWEIGHT 2-NEUTRAL
Rating and Price Target Chart - INR (as of 04-Nov-2011) Currency=INR
Closing Price
Jan- 09 Jul- 09 Jan- 10 Jul- 10 Jan- 11 Jul- 11
50
100
150
200
250
300
350
Date Closing Price Rating Price Target
Link to Barclays Capital Live for interactive charting
Barclays Bank PLC and/or an affiliate is a market-maker and/or liquidity provider in securities issued by Reliance Communications Ltd. or one ofits affiliates.
Barclays Bank PLC and/or an affiliate has received compensation for investment banking services from Reliance Communications Ltd. in the past12 months.
Barclays Bank PLC and/or an affiliate expects to receive or intends to seek compensation for investment banking services from Reliance Communications Ltd. within the next 3 months.
Barclays Bank PLC and/or an affiliate trades regularly in the securities of Reliance Communications Ltd..
Barclays Bank PLC and/or an affiliate has received non-investment banking related compensation from Reliance Communications Ltd. within thepast 12 months.
Reliance Communications Ltd. is, or during the past 12 months has been, an investment banking client of Barclays Bank PLC and/or an affiliate.
Reliance Communications Ltd. is, or during the past 12 months has been, a non-investment banking client (securities related services) of Barclays Bank PLC and/or an affiliate.
Valuation Methodology: Our 12-month price target of Rs130 is based on our discounted cash flow analysis in which we assume 5% average reveue growth and margin expansion of almost 800bps through the decade, a 3% terminal growth rate and a WACC of 13%.
Risks which May Impede the Achievement of the Price Target: The key risks that might keep our price target from being achieved, in our view, include interest rate movements due to the high net debt and execution risks both from a business perspective and restructuring and assetdisposal perspective.

DISCLAIMER:
This publication has been prepared by Barclays Capital, the investment banking division of Barclays Bank PLC, and/or one or more of its affiliates as provided below. It isprovided to our clients for information purposes only, and Barclays Capital makes no express or implied warranties, and expressly disclaims all warranties of merchantability or fitness for a particular purpose or use with respect to any data included in this publication. Barclays Capital will not treat unauthorized recipients ofthis report as its clients. Prices shown are indicative and Barclays Capital is not offering to buy or sell or soliciting offers to buy or sell any financial instrument.
Without limiting any of the foregoing and to the extent permitted by law, in no event shall Barclays Capital, nor any affiliate, nor any of their respective officers, directors,partners, or employees have any liability for (a) any special, punitive, indirect, or consequential damages; or (b) any lost profits, lost revenue, loss of anticipated savingsor loss of opportunity or other financial loss, even if notified of the possibility of such damages, arising from any use of this publication or its contents.
Other than disclosures relating to Barclays Capital, the information contained in this publication has been obtained from sources that Barclays Capital believes to be reliable, but Barclays Capital does not represent or warrant that it is accurate or complete. The views in this publication are those of Barclays Capital and are subject tochange, and Barclays Capital has no obligation to update its opinions or the information in this publication.
The analyst recommendations in this publication reflect solely and exclusively those of the author(s), and such opinions were prepared independently of any otherinterests, including those of Barclays Capital and/or its affiliates. This publication does not constitute personal investment advice or take into account the individualfinancial circumstances or objectives of the clients who receive it. The securities discussed herein may not be suitable for all investors. Barclays Capital recommends that investors independently evaluate each issuer, security or instrument discussed herein and consult any independent advisors they believe necessary. The value of andincome from any investment may fluctuate from day to day as a result of changes in relevant economic markets (including changes in market liquidity). Theinformation herein is not intended to predict actual results, which may differ substantially from those reflected. Past performance is not necessarily indicative of future results.
This communication is being made available in the UK and Europe primarily to persons who are investment professionals as that term is defined in Article 19 of theFinancial Services and Markets Act 2000 (Financial Promotion Order) 2005. It is directed at, and therefore should only be relied upon by, persons who have professionalexperience in matters relating to investments. The investments to which it relates are available only to such persons and will be entered into only with such persons. Barclays Capital is authorized and regulated by the Financial Services Authority ('FSA') and member of the London Stock Exchange.
Barclays Capital Inc., U.S. registered broker/dealer and member of FINRA (www.finra.org), is distributing this material in the United States and, in connection therewith accepts responsibility for its contents. Any U.S. person wishing to effect a transaction in any security discussed herein should do so only by contacting a representativeof Barclays Capital Inc. in the U.S. at 745 Seventh Avenue, New York, New York 10019.
Non-U.S. persons should contact and execute transactions through a Barclays Bank PLC branch or affiliate in their home jurisdiction unless local regulations permitotherwise.
This material is distributed in Canada by Barclays Capital Canada Inc., a registered investment dealer and member of IIROC (www.iiroc.ca). To access Barclays Capitalpolicy on the dissemination of research reports, please go to http://www.barcap.com/Client+offering/Research/Research+Policy.
Subject to the conditions of this publication as set out above, Absa Capital, the Investment Banking Division of Absa Bank Limited, an authorised financial servicesprovider (Registration No.: 1986/004794/06), is distributing this material in South Africa. Absa Bank Limited is regulated by the South African Reserve Bank. Thispublication is not, nor is it intended to be, advice as defined and/or contemplated in the (South African) Financial Advisory and Intermediary Services Act, 37 of 2002, or any other financial, investment, trading, tax, legal, accounting, retirement, actuarial or other professional advice or service whatsoever. Any South African person orentity wishing to effect a transaction in any security discussed herein should do so only by contacting a representative of Absa Capital in South Africa, 15 Alice Lane,Sandton, Johannesburg, Gauteng 2196. Absa Capital is an affiliate of Barclays Capital.
In Japan, foreign exchange research reports are prepared and distributed by Barclays Bank PLC Tokyo Branch. Other research reports are distributed to institutionalinvestors in Japan by Barclays Capital Japan Limited. Barclays Capital Japan Limited is a joint-stock company incorporated in Japan with registered office of 6-10-1 Roppongi, Minato-ku, Tokyo 106-6131, Japan. It is a subsidiary of Barclays Bank PLC and a registered financial instruments firm regulated by the Financial ServicesAgency of Japan. Registered Number: Kanto Zaimukyokucho (kinsho) No. 143.
Barclays Bank PLC, Hong Kong Branch is distributing this material in Hong Kong as an authorised institution regulated by the Hong Kong Monetary Authority.Registered Office: 41/F, Cheung Kong Center, 2 Queen's Road Central, Hong Kong.
This material is issued in Taiwan by Barclays Capital Securities Taiwan Limited. This material on securities not traded in Taiwan is not to be construed as'recommendation' in Taiwan. Barclays Capital Securities Taiwan Limited does not accept orders from clients to trade in such securities. This material may not be distributed to the public media or used by the public media without prior written consent of Barclays Capital.
This material is distributed in South Korea by Barclays Capital Securities Limited, Seoul Branch.
All equity research material is distributed in India by Barclays Securities (India) Private Limited (SEBI Registration No: INB/INF 231292732 (NSE), INB/INF 011292738(BSE), Registered Office: 208 | Ceejay House | Dr. Annie Besant Road | Shivsagar Estate | Worli | Mumbai - 400 018 | India, Phone: + 91 22 67196363). Other research reports are distributed in India by Barclays Bank PLC, India Branch.
Barclays Bank PLC Frankfurt Branch distributes this material in Germany under the supervision of Bundesanstalt für Finanzdienstleistungsaufsicht (BaFin).
This material is distributed in Malaysia by Barclays Capital Markets Malaysia Sdn Bhd.
This material is distributed in Brazil by Banco Barclays S.A.
This material is distributed in Mexico by Barclays Bank Mexico, S.A.
Barclays Bank PLC in the Dubai International Financial Centre (Registered No. 0060) is regulated by the Dubai Financial Services Authority (DFSA). Barclays Bank PLC-DIFC Branch, may only undertake the financial services activities that fall within the scope of its existing DFSA licence.
Barclays Bank PLC in the UAE is regulated by the Central Bank of the UAE and is licensed to conduct business activities as a branch of a commercial bank incorporatedoutside the UAE in Dubai (Licence No.: 13/1844/2008, Registered Office: Building No. 6, Burj Dubai Business Hub, Sheikh Zayed Road, Dubai City) and Abu Dhabi(Licence No.: 13/952/2008, Registered Office: Al Jazira Towers, Hamdan Street, PO Box 2734, Abu Dhabi).
Barclays Bank PLC in the Qatar Financial Centre (Registered No. 00018) is authorised by the Qatar Financial Centre Regulatory Authority (QFCRA). Barclays Bank PLC-QFC Branch may only undertake the regulated activities that fall within the scope of its existing QFCRA licence. Principal place of business in Qatar: Qatar Financial Centre, Office 1002, 10th Floor, QFC Tower, Diplomatic Area, West Bay, PO Box 15891, Doha, Qatar.
This material is distributed in Dubai, the UAE and Qatar by Barclays Bank PLC. Related financial products or services are only available to Professional Clients as defined by the DFSA, and Business Customers as defined by the QFCRA.

This material is distributed in Saudi Arabia by Barclays Saudi Arabia ('BSA'). It is not the intention of the Publication to be used or deemed as recommendation, option oradvice for any action (s) that may take place in future. Barclays Saudi Arabia is a Closed Joint Stock Company, (CMA License No. 09141-37). Registered office Al Faisaliah Tower | Level 18 | Riyadh 11311 | Kingdom of Saudi Arabia. Authorised and regulated by the Capital Market Authority, Commercial Registration Number: 1010283024.
This material is distributed in Russia by OOO Barclays Capital, affiliated company of Barclays Bank PLC, registered and regulated in Russia by the FSFM. Broker License#177-11850-100000; Dealer License #177-11855-010000. Registered address in Russia: 125047 Moscow, 1st Tverskaya-Yamskaya str. 21.
This material is distributed in Singapore by the Singapore branch of Barclays Bank PLC, a bank licensed in Singapore by the Monetary Authority of Singapore. For matters in connection with this report, recipients in Singapore may contact the Singapore branch of Barclays Bank PLC, whose registered address is One Raffles QuayLevel 28, South Tower, Singapore 048583.
Barclays Bank PLC, Australia Branch (ARBN 062 449 585, AFSL 246617) is distributing this material in Australia. It is directed at 'wholesale clients' as defined byAustralian Corporations Act 2001.
IRS Circular 230 Prepared Materials Disclaimer: Barclays Capital and its affiliates do not provide tax advice and nothing contained herein should be construed to be taxadvice. Please be advised that any discussion of U.S. tax matters contained herein (including any attachments) (i) is not intended or written to be used, and cannot beused, by you for the purpose of avoiding U.S. tax-related penalties; and (ii) was written to support the promotion or marketing of the transactions or other mattersaddressed herein. Accordingly, you should seek advice based on your particular circumstances from an independent tax advisor.
Barclays Capital is not responsible for, and makes no warranties whatsoever as to, the content of any third-party web site accessed via a hyperlink in this publication and such information is not incorporated by reference.
© Copyright Barclays Bank PLC (2011). All rights reserved. No part of this publication may be reproduced in any manner without the prior written permission of BarclaysCapital or any of its affiliates. Barclays Bank PLC is registered in England No. 1026167. Registered office 1 Churchill Place, London, E14 5HP. Additional information regarding this publication will be furnished upon request.

US08-000001