restructuring crocs, inc. - turnaround...
TRANSCRIPT

RESTRUCTURING CROCS, INC.
Turnaround Management Columbia Business School
Advisor: Professor Laura Resnikoff April 26, 2010
Molly Bennard Kevin Sayles Ron Schulhof Julie Thaler John Wolff
1
TABLE OF CONTENTS
EXECUTIVE SUMMARY............................................................................................................ 2 INDUSTRY.....................................................................................................................................3 COMPANY...................................................................................................................................11 HISTORICAL FINANCIAL OVERVIEW...................................................................................22 DISCUSSION OF VALUATION ................................................................................................35 TURNAROUND PLAN ...............................................................................................................47 RECOMMENDATION.................................................................................................................51 EXHIBITS.....................................................................................................................................55 MARKETING MATERIAL……..................................................................................................65
2
EXECUTIVE SUMMARY
Crocs, Inc. is a designer, manufacturer and retailer of footwear for men, women and children. Crocs uses
its proprietary closed cell-resin, Croslite, to make shoes that are comfortable, lightweight and odor-
resistant. Since its introduction in 2002, Crocs has sold more than 120 million pairs of shoes in over 125
countries.
During the past two years, Crocs experienced a rapid decline in revenue, from a peak of $847.4 million in
2007 to a trough of $645.8 million in 2009. This decline proliferated throughout all regions in which the
Company operates, with the exception of Asia. Management attributes the deterioration in operating and
financial performance to a combination of macroeconomic factors (the global economic crisis resulted in
a reduction in consumer spending and decreased volume in malls and retail establishments) and difficulty
in executing Crocs’ long-term business strategy (significant challenges in merchandising an expanded
product line through existing wholesale channels, and both the declining demand for mature products and
the increasing competition from imitation products).
In response to these threats, the Company began a restructuring program and other downsizing activities
during FY08 and FY09. The combination of declining revenues, restructuring costs and other one-time
expenses resulted in the Company recording a loss of $185.1 million and $42.1 million during FY08 and
FY09, respectively.
We have reviewed trends in the footwear and apparel industry, closely examined the Company’s strategic,
operational and financial situation, and diagnosed the reasons for its distress. Despite recent
improvements in sales, margins, and the Company stock price, we believe that Crocs is in danger of
returning to the distress of 2008-2009. We recommend that Crocs implement a turnaround strategy with
the following key features:
Realign the distribution model in U.S. Crocs should forgo its retail expansion and instead
focus on a small number of profitable flagship stores and its wholesale and internet channels
Focus on the shoes and key customer segments. Crocs should refocus its entire organization
(design, manufacturing, marketing) on the unique appeal of its shoes
Management Information Systems and Supply Chain Logistics. Systems and supply chain
improvements should occupy a significant portion of management’s time until the issues are
satisfactorily resolved.
3
INDUSTRY
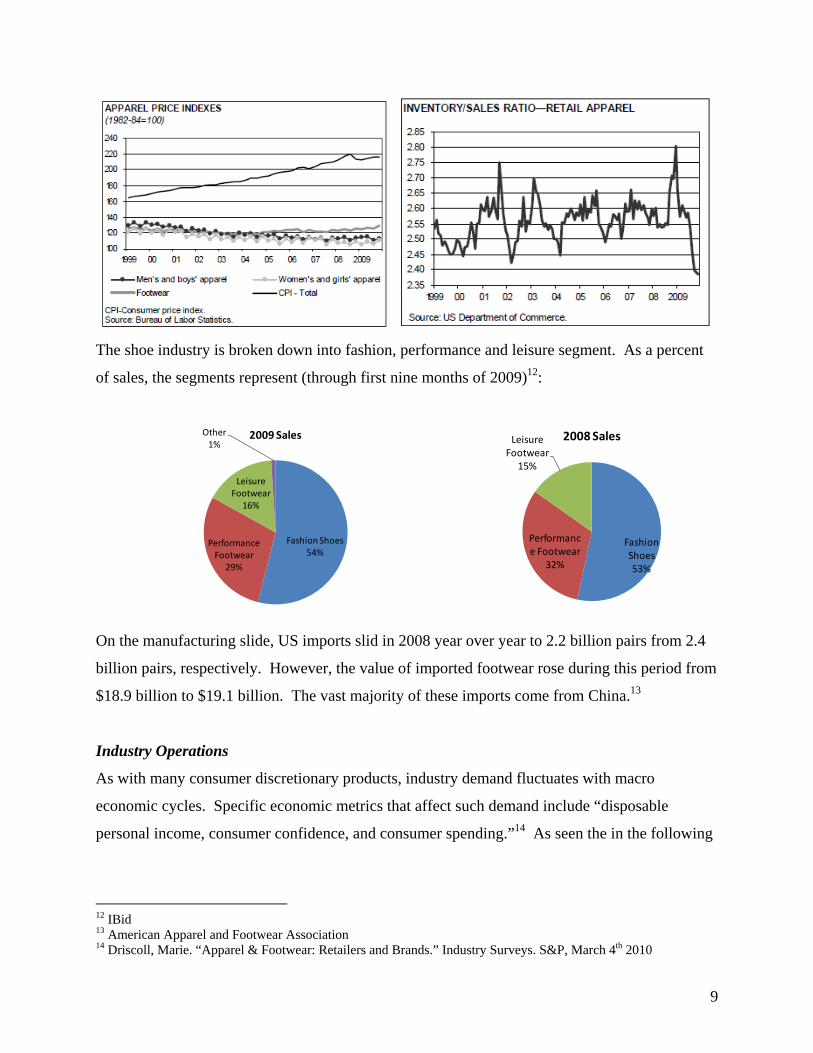
Overview & Recent Developments The general sentiment among industry experts and executives is that the apparel and footwear
industry continues to improve but has not fully recovered from the economic downturn. At the
National Retail Federation’s convention in January 2010, the outlook was optimistic when
compared to the 2009 convention and attendance was up 27%.
A group of 20 comparable retailers (including department stores, mass merchants, and
warehouse clubs) that are tracked by S&P experienced a 3.9% increase in December 2009 on a
sales-weighted basis. Although holiday season sales were not strong during 2009, retailers and
apparel vendors did record a modest 1.1% holiday sales gain (November – December) versus a
3.4% decline in the same period during 2008. Further, retailers were able to protect some profit
margin during the holiday by capping markdowns at 30% to 40% instead of the 60% to 85%
offered a year earlier.1
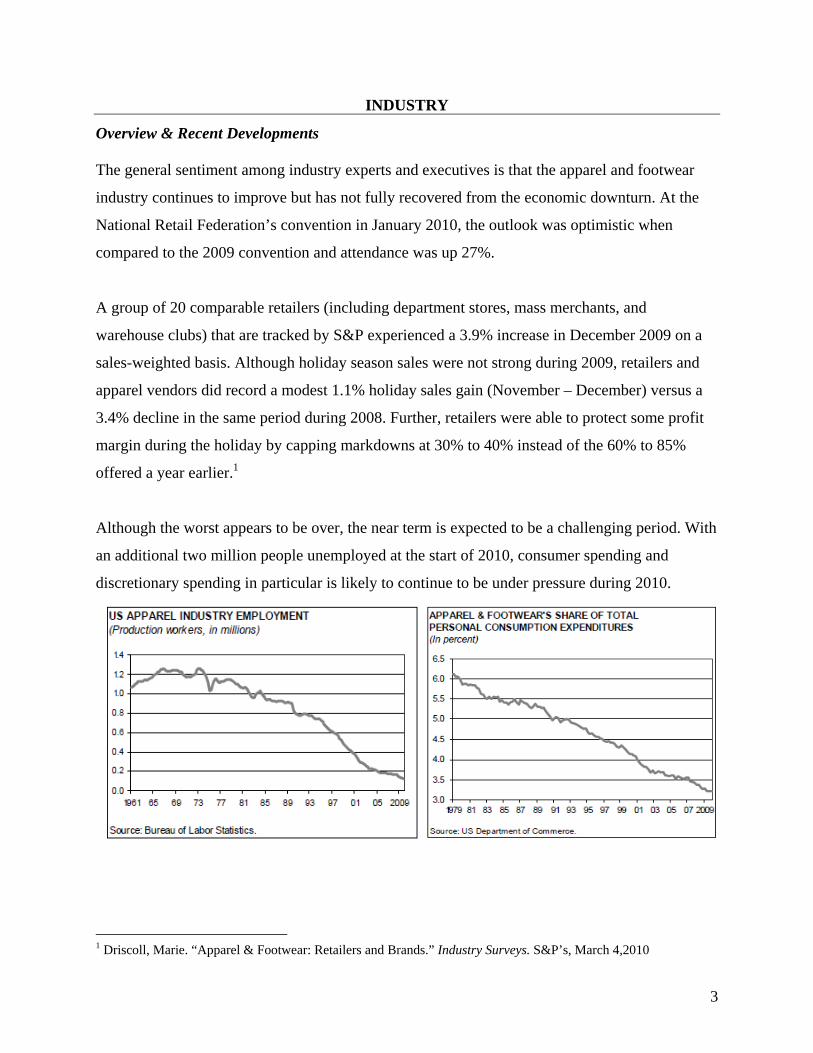
Although the worst appears to be over, the near term is expected to be a challenging period. With
an additional two million people unemployed at the start of 2010, consumer spending and
discretionary spending in particular is likely to continue to be under pressure during 2010.
1 Driscoll, Marie. “Apparel & Footwear: Retailers and Brands.” Industry Surveys. S&P’s, March 4,2010
4
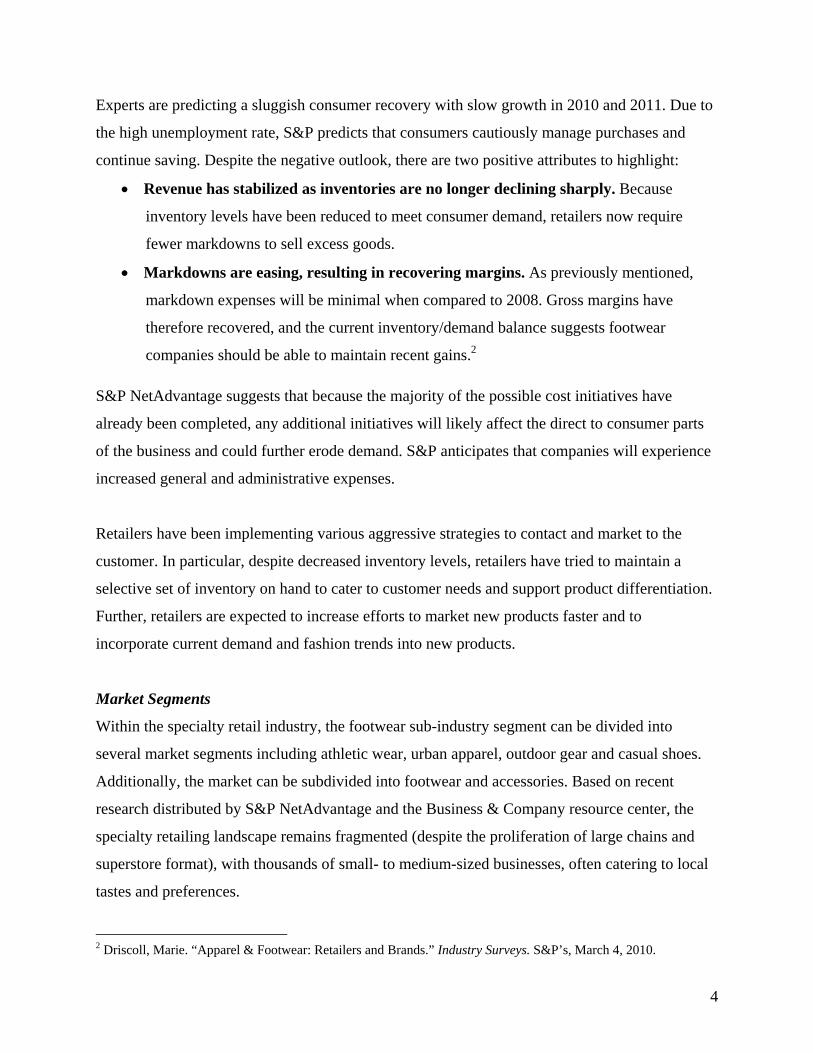
Experts are predicting a sluggish consumer recovery with slow growth in 2010 and 2011. Due to
the high unemployment rate, S&P predicts that consumers cautiously manage purchases and
continue saving. Despite the negative outlook, there are two positive attributes to highlight:
Revenue has stabilized as inventories are no longer declining sharply. Because
inventory levels have been reduced to meet consumer demand, retailers now require
fewer markdowns to sell excess goods.
Markdowns are easing, resulting in recovering margins. As previously mentioned,
markdown expenses will be minimal when compared to 2008. Gross margins have
therefore recovered, and the current inventory/demand balance suggests footwear
companies should be able to maintain recent gains.2
S&P NetAdvantage suggests that because the majority of the possible cost initiatives have
already been completed, any additional initiatives will likely affect the direct to consumer parts
of the business and could further erode demand. S&P anticipates that companies will experience
increased general and administrative expenses.
Retailers have been implementing various aggressive strategies to contact and market to the
customer. In particular, despite decreased inventory levels, retailers have tried to maintain a
selective set of inventory on hand to cater to customer needs and support product differentiation.
Further, retailers are expected to increase efforts to market new products faster and to
incorporate current demand and fashion trends into new products.
Market Segments
Within the specialty retail industry, the footwear sub-industry segment can be divided into
several market segments including athletic wear, urban apparel, outdoor gear and casual shoes.
Additionally, the market can be subdivided into footwear and accessories. Based on recent
research distributed by S&P NetAdvantage and the Business & Company resource center, the
specialty retailing landscape remains fragmented (despite the proliferation of large chains and
superstore format), with thousands of small- to medium-sized businesses, often catering to local
tastes and preferences.
2 Driscoll, Marie. “Apparel & Footwear: Retailers and Brands.” Industry Surveys. S&P’s, March 4, 2010.
5
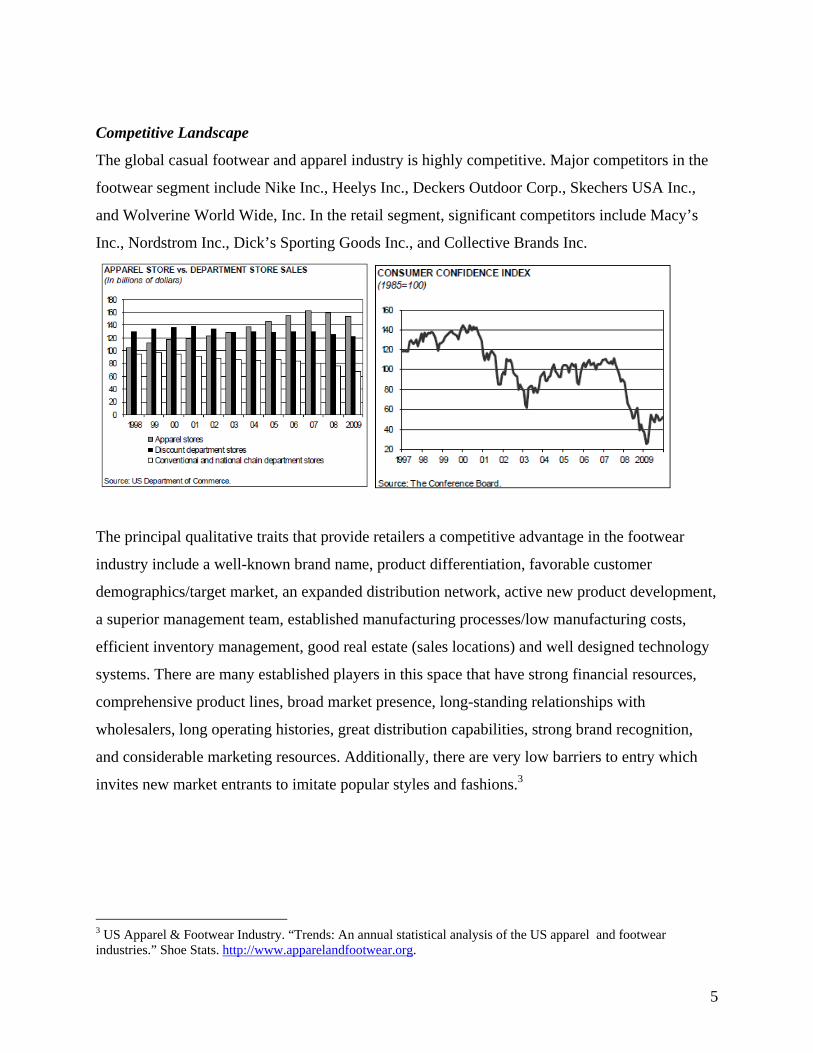
Competitive Landscape
The global casual footwear and apparel industry is highly competitive. Major competitors in the
footwear segment include Nike Inc., Heelys Inc., Deckers Outdoor Corp., Skechers USA Inc.,
and Wolverine World Wide, Inc. In the retail segment, significant competitors include Macy’s
Inc., Nordstrom Inc., Dick’s Sporting Goods Inc., and Collective Brands Inc.
The principal qualitative traits that provide retailers a competitive advantage in the footwear
industry include a well-known brand name, product differentiation, favorable customer
demographics/target market, an expanded distribution network, active new product development,
a superior management team, established manufacturing processes/low manufacturing costs,
efficient inventory management, good real estate (sales locations) and well designed technology
systems. There are many established players in this space that have strong financial resources,
comprehensive product lines, broad market presence, long-standing relationships with
wholesalers, long operating histories, great distribution capabilities, strong brand recognition,
and considerable marketing resources. Additionally, there are very low barriers to entry which
invites new market entrants to imitate popular styles and fashions.3
3 US Apparel & Footwear Industry. “Trends: An annual statistical analysis of the US apparel and footwear industries.” Shoe Stats. http://www.apparelandfootwear.org.
6
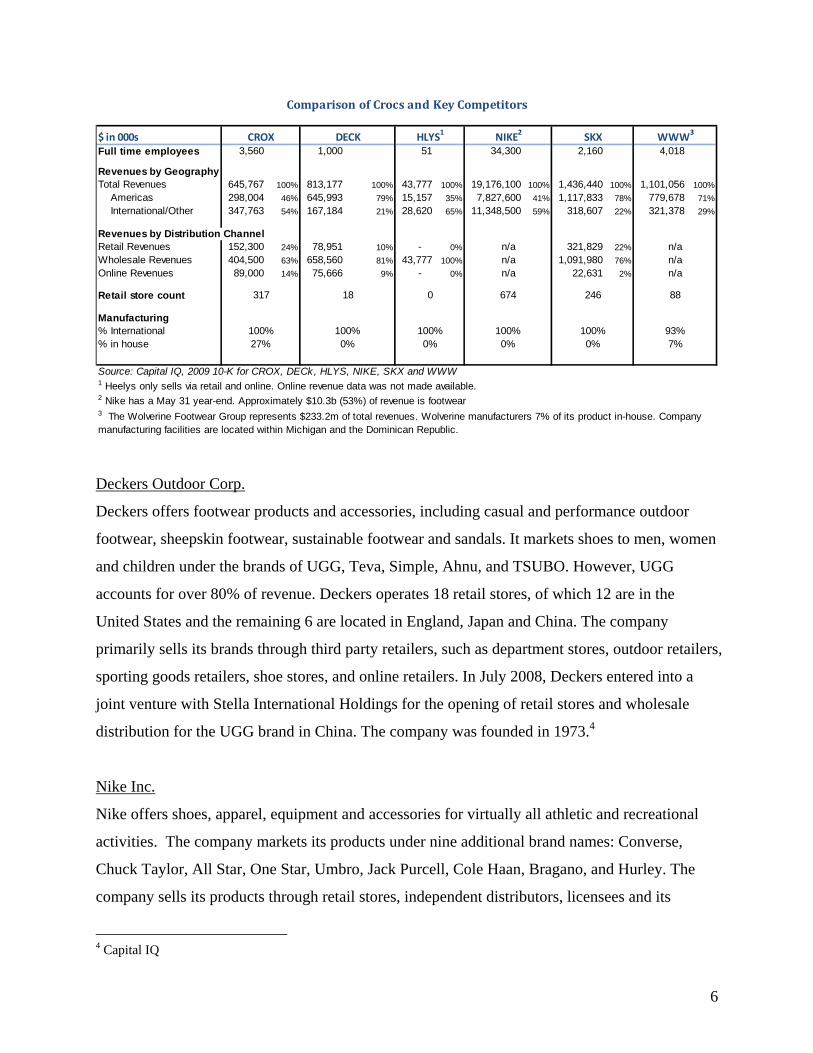
$ in 000sFull time employees 3,560 1,000 51 34,300 2,160 4,018
Revenues by GeographyTotal Revenues 645,767 100% 813,177 100% 43,777 100% 19,176,100 100% 1,436,440 100% 1,101,056 100%
Americas 298,004 46% 645,993 79% 15,157 35% 7,827,600 41% 1,117,833 78% 779,678 71%
International/Other 347,763 54% 167,184 21% 28,620 65% 11,348,500 59% 318,607 22% 321,378 29%
Revenues by Distribution ChannelRetail Revenues 152,300 24% 78,951 10% - 0% 321,829 22%
Wholesale Revenues 404,500 63% 658,560 81% 43,777 100% 1,091,980 76%
Online Revenues 89,000 14% 75,666 9% - 0% 22,631 2%
Retail store count
Manufacturing% International% in house
Source: Capital IQ, 2009 10-K for CROX, DECk, HLYS, NIKE, SKX and WWW1 Heelys only sells via retail and online. Online revenue data was not made available.2 Nike has a May 31 year-end. Approximately $10.3b (53%) of revenue is footwear
Comparison of Crocs and Key Competitors
3 The Wolverine Footwear Group represents $233.2m of total revenues. Wolverine manufacturers 7% of its product in-house. Company manufacturing facilities are located within Michigan and the Dominican Republic.
n/an/an/an/a
n/an/a
100%27%
93%7%0%
100%100%0%
317 18 0 674 246
0%100%0%
100%
88
CROX DECK HLYS1
NIKE2
SKX WWW3
Deckers Outdoor Corp.
Deckers offers footwear products and accessories, including casual and performance outdoor
footwear, sheepskin footwear, sustainable footwear and sandals. It markets shoes to men, women
and children under the brands of UGG, Teva, Simple, Ahnu, and TSUBO. However, UGG
accounts for over 80% of revenue. Deckers operates 18 retail stores, of which 12 are in the
United States and the remaining 6 are located in England, Japan and China. The company
primarily sells its brands through third party retailers, such as department stores, outdoor retailers,
sporting goods retailers, shoe stores, and online retailers. In July 2008, Deckers entered into a
joint venture with Stella International Holdings for the opening of retail stores and wholesale
distribution for the UGG brand in China. The company was founded in 1973.4
Nike Inc.
Nike offers shoes, apparel, equipment and accessories for virtually all athletic and recreational
activities. The company markets its products under nine additional brand names: Converse,
Chuck Taylor, All Star, One Star, Umbro, Jack Purcell, Cole Haan, Bragano, and Hurley. The
company sells its products through retail stores, independent distributors, licensees and its
4 Capital IQ
7
website. Nike has a significant presence abroad and a majority of their 2009 sales were
international. In addition, footwear revenues of $10.3 billion accounted for approximately 55%
of total revenues. Nike operates 338 retail stores in the United States and 336 retail stores
internationally. The company was founded in 1964.5
Heelys, Inc.
Heelys primarily offers their own branded wheeled shoes that allow wearers to easily transition
from walking or running to rolling (by shifting weight to the heel). The company also markets
non-wheeled footwear and accessories. Heelys sells its products to sporting goods retailers,
specialty apparel and footwear retailers, department stores, family footwear stores and online
retailers. The company was founded in 2000.6
Skechers USA, Inc.
Skechers offers a large variety of footwear products for men, women and kids. The company
markets its own brands, including Skechers Sport, Skechers Cali, Skechers Work and Skechers
Kids. The company sells its products at its own retail stores and website as well as through
department stores, specialty stores, athletic retailers, boutiques and catalog and internet retailers.
Skechers operates 219 retail stores in the United States, as well as 27 internationally. The
company was founded in 1992.7
Wolverine World Wide, Inc.
Wolverine World Wide offers footwear, apparel, and accessories in approximately 180 countries.
The company markets its products under the brands of Bates, Harley-Davidson Footwear, Hush
Puppies, Merrell, Patagonia Footwear and Wolverine. The company sells its products at
department stores, national chains, catalogs, specialty retailers, mass merchants, internet retailers
and governments and municipalities in the United States. Wolverine also operates 83 retail stores
in North America and 5 in the United Kingdom. The company was founded in 1883.8
5 Capital IQ, Company annual reports 6 Capital IQ 7 Ibid 8 Ibid
8
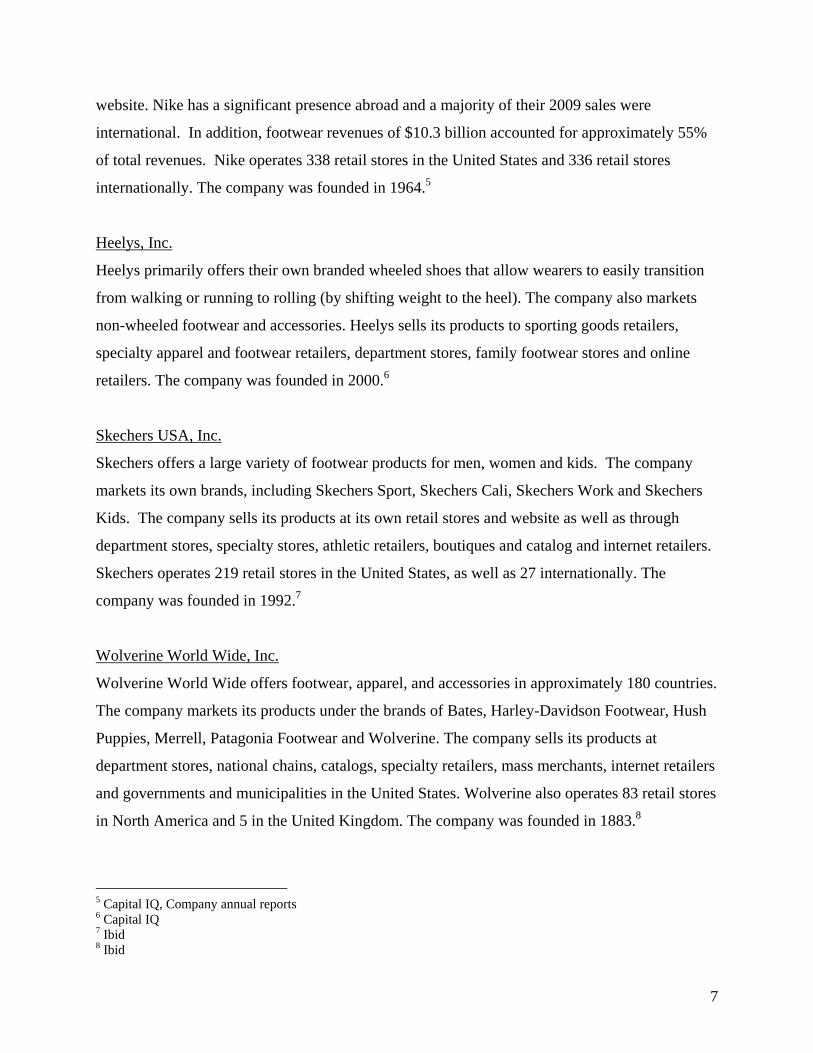
Summary of Crocs and Competitors9
Company Name CROX DECK HLYS NIKE SKX WWW Avg*
Market Cap 939 2,027 76 37,836 1,934 1,610 8,697
Net Debt (77) (357) (60) (3,471) (278) (84) (850)
EV 862 1,671 16 34,366 1,660 1,526 7,848
Total Revenue LTM 646 835 44 18,650 1,436 1,131 4,419
EBITDA LTM 33 202 (2) 2,810 94 149 651
Diluted EPS Excl. Extra Items LTM (1) 9 (0) 4 1 2 3
Gross Margin % LTM 47.7 46.7 35.8 45.2 43.2 39.9 42.2
EBITDA Margin % LTM 5.1 24.2 (4.5) 15.1 6.5 13.1 10.9
EBIT Margin % LTM (0.5) 23.0 (6.4) 13.2 5.1 11.6 9.3
Net Income Margin % LTM (6.5) 14.7 (11.7) 9.3 3.8 7.0 4.6
Total Revenues, 1 Yr Growth % LTM (10.5) 15.0 (38.1) (4.6) (0.3) (4.8) (6.6)
Total Debt/Capital % 0.5 ‐ ‐ 5.7 2.4 0.2 2.8
Total Debt/EBITDA LTM 0.0x ‐ ‐ 0.2x 0.2x 0.0x 0.1x
TEV/EBITDA LTM 26.0 8.7 NM 12.2 17.7 10.3 12.2
P/E LTM NM 17.7 NM 22.2 35.7 20.4 24.0
P/TangBV LTM 3.7 4.3 1.0 4.3 2.6 3.4 3.1
*Simple Average
Operating Statistics
Trading
Multiples
Financial Data
Current Environment
As a result of recent economic conditions, consumers have become more “value-focused”
purchasers. The middle-class group “is the most challenged and this has lead to an even greater
bifurcation in retail thereby benefiting luxury positioned retailers on one end and off-price
warehouse clubs on the other.”10 According to the Bureau of Labor Statistics, unemployment
reached 15.3 million in 2009, a yearly increase of 3.9 million. According to the NPD Group,
“total footwear dollar sales decreased 3.6% to $42.4 billion in 2009, while total unit sales
dropped 7.3%. In 2008, footwear sales totaled $44 billion, a decrease of 2.6% from the previous
year.”11
9 Ibid 10 Driscoll, Marie. “Apparel & Footwear: Retailers and Brands.” Industry Surveys. S&P, March 4th, 2010 11 IBid
9
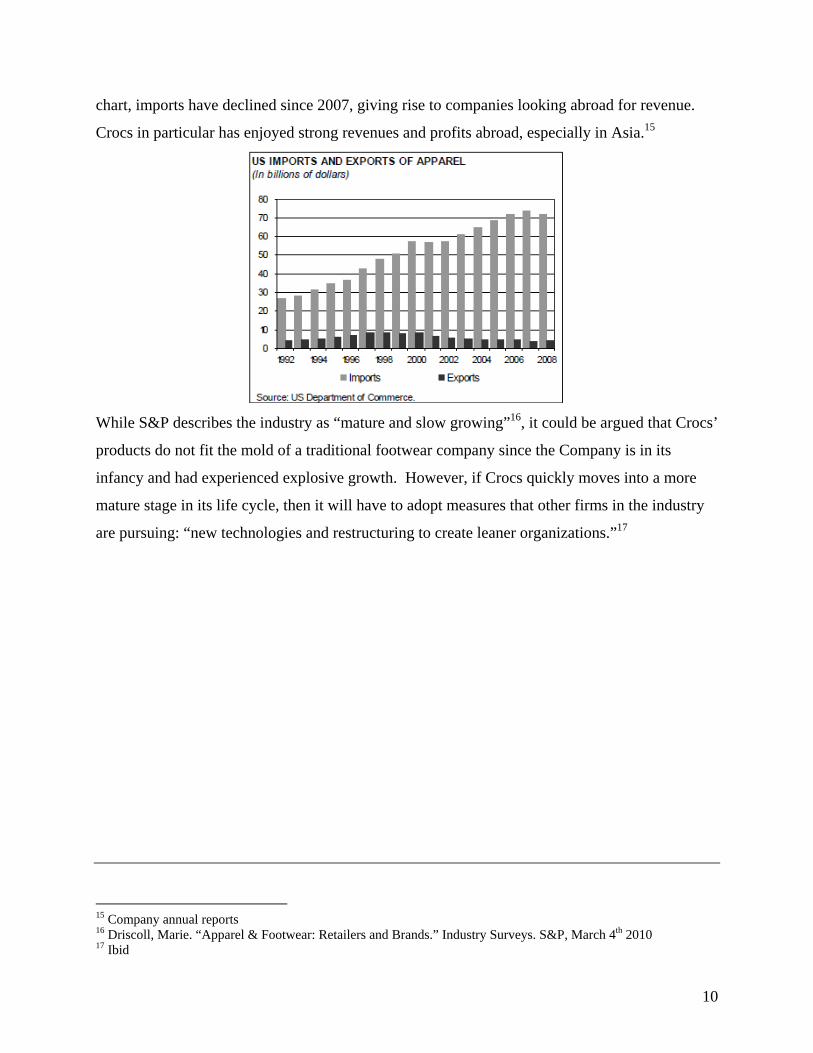
The shoe industry is broken down into fashion, performance and leisure segment. As a percent
of sales, the segments represent (through first nine months of 2009)12:
Fashion Shoes54%
Performance Footwear
29%
Leisure Footwear
16%
Other1%
2009 Sales
Fashion Shoes53%
Performance Footwear
32%
Leisure Footwear
15%
2008 Sales
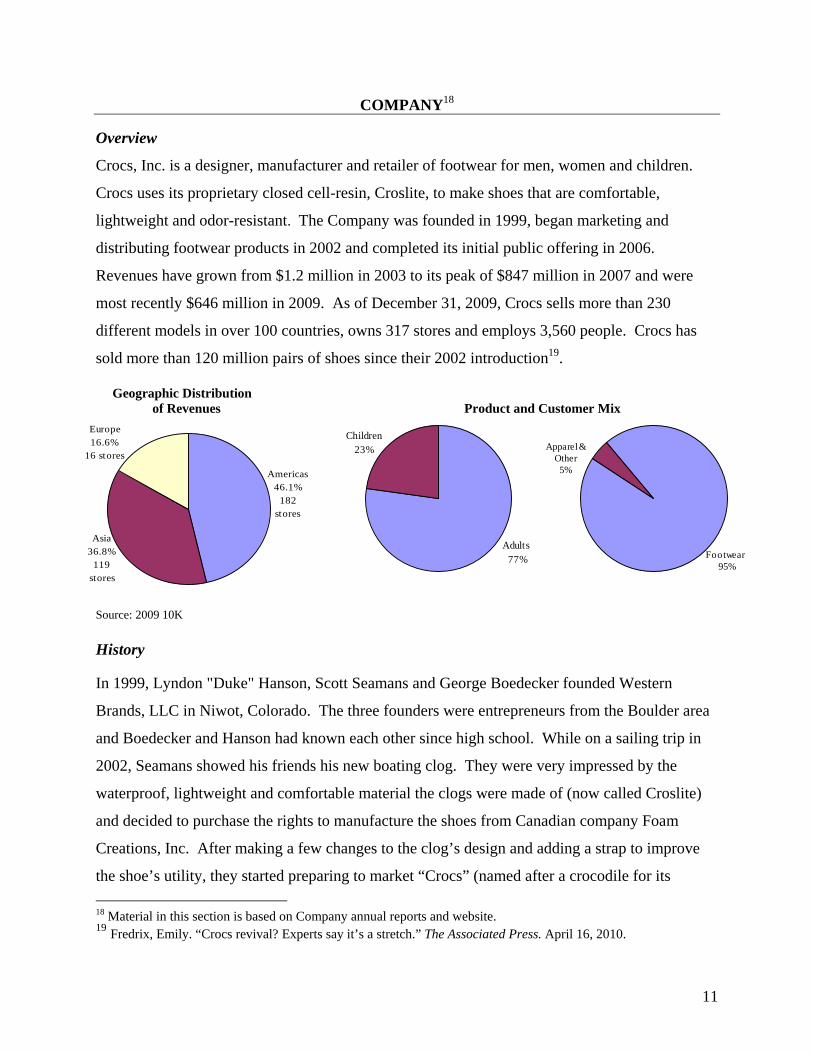
On the manufacturing slide, US imports slid in 2008 year over year to 2.2 billion pairs from 2.4
billion pairs, respectively. However, the value of imported footwear rose during this period from
$18.9 billion to $19.1 billion. The vast majority of these imports come from China.13
Industry Operations
As with many consumer discretionary products, industry demand fluctuates with macro
economic cycles. Specific economic metrics that affect such demand include “disposable
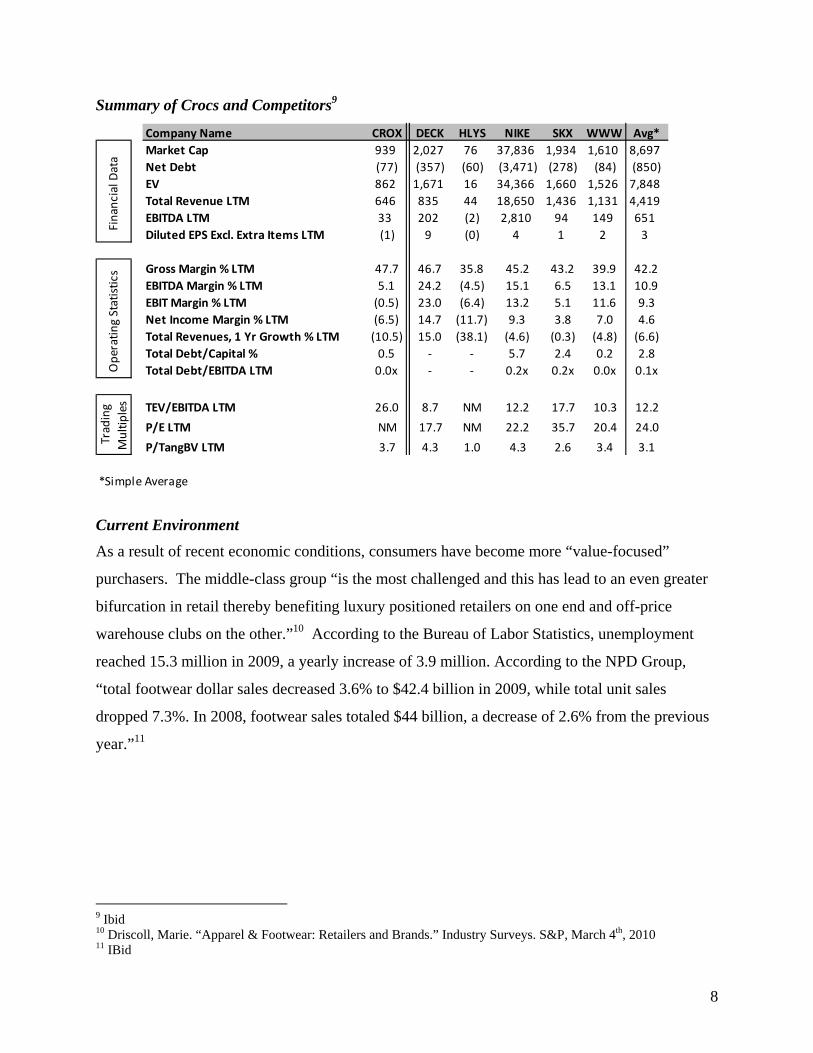
personal income, consumer confidence, and consumer spending.”14 As seen the in the following
12 IBid 13 American Apparel and Footwear Association 14 Driscoll, Marie. “Apparel & Footwear: Retailers and Brands.” Industry Surveys. S&P, March 4th 2010
10
chart, imports have declined since 2007, giving rise to companies looking abroad for revenue.
Crocs in particular has enjoyed strong revenues and profits abroad, especially in Asia.15
While S&P describes the industry as “mature and slow growing”16, it could be argued that Crocs’
products do not fit the mold of a traditional footwear company since the Company is in its
infancy and had experienced explosive growth. However, if Crocs quickly moves into a more
mature stage in its life cycle, then it will have to adopt measures that other firms in the industry
are pursuing: “new technologies and restructuring to create leaner organizations.”17
15 Company annual reports 16 Driscoll, Marie. “Apparel & Footwear: Retailers and Brands.” Industry Surveys. S&P, March 4th 2010 17 Ibid
11
COMPANY18
Overview
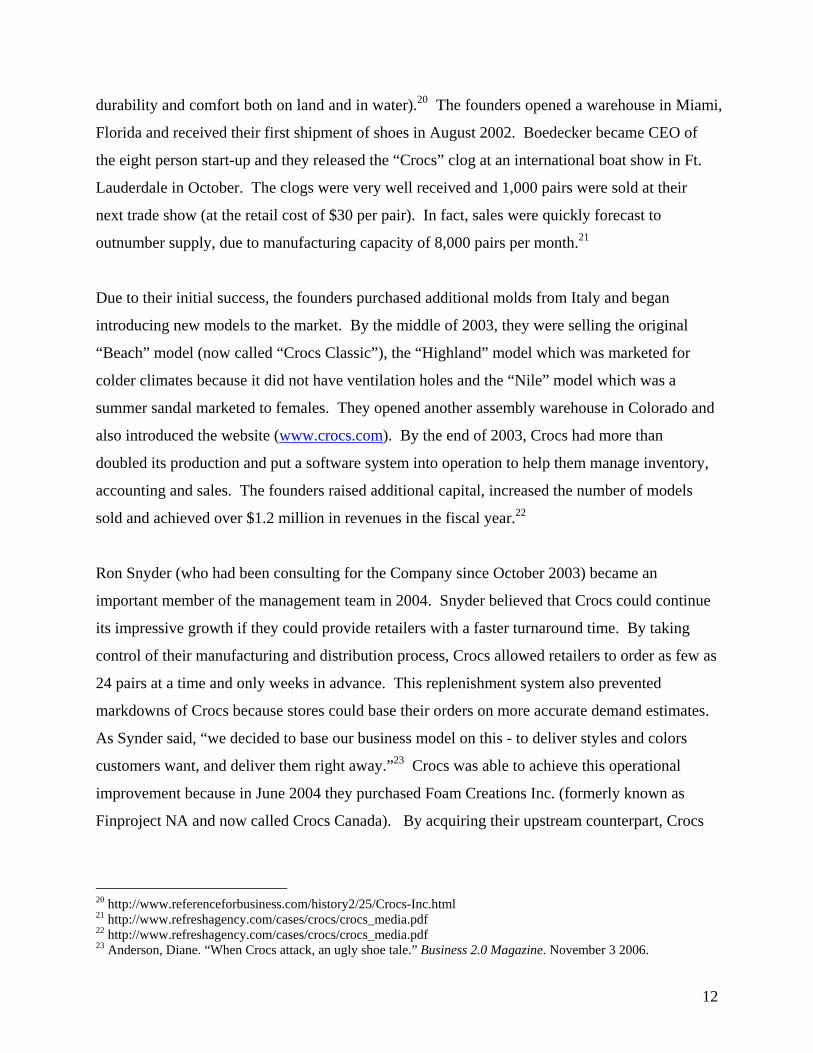
Crocs, Inc. is a designer, manufacturer and retailer of footwear for men, women and children.
Crocs uses its proprietary closed cell-resin, Croslite, to make shoes that are comfortable,
lightweight and odor-resistant. The Company was founded in 1999, began marketing and
distributing footwear products in 2002 and completed its initial public offering in 2006.
Revenues have grown from $1.2 million in 2003 to its peak of $847 million in 2007 and were
most recently $646 million in 2009. As of December 31, 2009, Crocs sells more than 230
different models in over 100 countries, owns 317 stores and employs 3,560 people. Crocs has
sold more than 120 million pairs of shoes since their 2002 introduction19.
Geographic Distribution of Revenues Product and Customer Mix
Americas46.1%
182 stores
Asia36.8%
119 stores
Europe16.6%
16 stores
Adults 77%
Children23%
Footwear 95%
Apparel & Other5%
Source: 2009 10K
History In 1999, Lyndon "Duke" Hanson, Scott Seamans and George Boedecker founded Western
Brands, LLC in Niwot, Colorado. The three founders were entrepreneurs from the Boulder area
and Boedecker and Hanson had known each other since high school. While on a sailing trip in
2002, Seamans showed his friends his new boating clog. They were very impressed by the
waterproof, lightweight and comfortable material the clogs were made of (now called Croslite)
and decided to purchase the rights to manufacture the shoes from Canadian company Foam
Creations, Inc. After making a few changes to the clog’s design and adding a strap to improve
the shoe’s utility, they started preparing to market “Crocs” (named after a crocodile for its
18 Material in this section is based on Company annual reports and website. 19 Fredrix, Emily. “Crocs revival? Experts say it’s a stretch.” The Associated Press. April 16, 2010.
12
durability and comfort both on land and in water).20 The founders opened a warehouse in Miami,
Florida and received their first shipment of shoes in August 2002. Boedecker became CEO of
the eight person start-up and they released the “Crocs” clog at an international boat show in Ft.
Lauderdale in October. The clogs were very well received and 1,000 pairs were sold at their
next trade show (at the retail cost of $30 per pair). In fact, sales were quickly forecast to
outnumber supply, due to manufacturing capacity of 8,000 pairs per month.21
Due to their initial success, the founders purchased additional molds from Italy and began
introducing new models to the market. By the middle of 2003, they were selling the original
“Beach” model (now called “Crocs Classic”), the “Highland” model which was marketed for
colder climates because it did not have ventilation holes and the “Nile” model which was a
summer sandal marketed to females. They opened another assembly warehouse in Colorado and
also introduced the website (www.crocs.com). By the end of 2003, Crocs had more than
doubled its production and put a software system into operation to help them manage inventory,
accounting and sales. The founders raised additional capital, increased the number of models
sold and achieved over $1.2 million in revenues in the fiscal year.22
Ron Snyder (who had been consulting for the Company since October 2003) became an
important member of the management team in 2004. Snyder believed that Crocs could continue
its impressive growth if they could provide retailers with a faster turnaround time. By taking
control of their manufacturing and distribution process, Crocs allowed retailers to order as few as
24 pairs at a time and only weeks in advance. This replenishment system also prevented
markdowns of Crocs because stores could base their orders on more accurate demand estimates.
As Synder said, “we decided to base our business model on this - to deliver styles and colors
customers want, and deliver them right away.”23 Crocs was able to achieve this operational
improvement because in June 2004 they purchased Foam Creations Inc. (formerly known as
Finproject NA and now called Crocs Canada). By acquiring their upstream counterpart, Crocs
20 http://www.referenceforbusiness.com/history2/25/Crocs-Inc.html 21 http://www.refreshagency.com/cases/crocs/crocs_media.pdf 22 http://www.refreshagency.com/cases/crocs/crocs_media.pdf 23 Anderson, Diane. “When Crocs attack, an ugly shoe tale.” Business 2.0 Magazine. November 3 2006.
13
gained the manufacturing facilities as well as rights to the proprietary resin-based Croslite material used
to make Crocs.
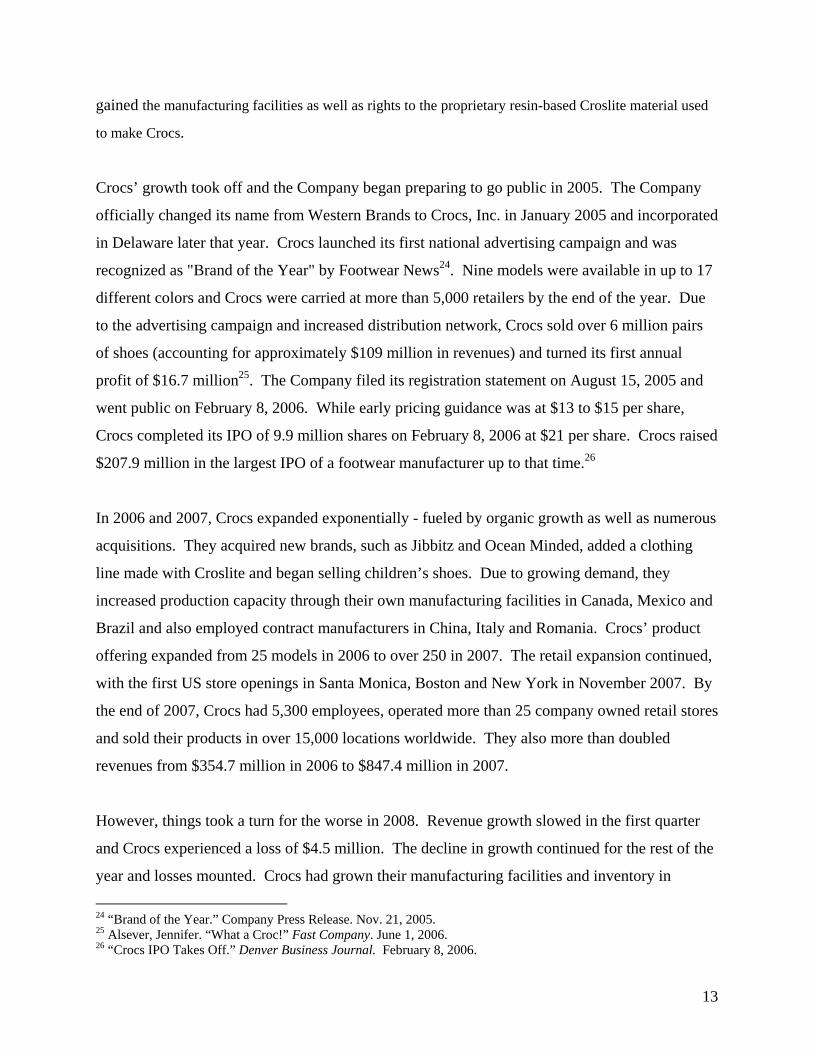
Crocs’ growth took off and the Company began preparing to go public in 2005. The Company
officially changed its name from Western Brands to Crocs, Inc. in January 2005 and incorporated
in Delaware later that year. Crocs launched its first national advertising campaign and was
recognized as "Brand of the Year" by Footwear News24. Nine models were available in up to 17
different colors and Crocs were carried at more than 5,000 retailers by the end of the year. Due
to the advertising campaign and increased distribution network, Crocs sold over 6 million pairs
of shoes (accounting for approximately $109 million in revenues) and turned its first annual
profit of $16.7 million25. The Company filed its registration statement on August 15, 2005 and
went public on February 8, 2006. While early pricing guidance was at $13 to $15 per share,
Crocs completed its IPO of 9.9 million shares on February 8, 2006 at $21 per share. Crocs raised
$207.9 million in the largest IPO of a footwear manufacturer up to that time.26
In 2006 and 2007, Crocs expanded exponentially - fueled by organic growth as well as numerous
acquisitions. They acquired new brands, such as Jibbitz and Ocean Minded, added a clothing
line made with Croslite and began selling children’s shoes. Due to growing demand, they
increased production capacity through their own manufacturing facilities in Canada, Mexico and
Brazil and also employed contract manufacturers in China, Italy and Romania. Crocs’ product
offering expanded from 25 models in 2006 to over 250 in 2007. The retail expansion continued,
with the first US store openings in Santa Monica, Boston and New York in November 2007. By
the end of 2007, Crocs had 5,300 employees, operated more than 25 company owned retail stores
and sold their products in over 15,000 locations worldwide. They also more than doubled
revenues from $354.7 million in 2006 to $847.4 million in 2007.
However, things took a turn for the worse in 2008. Revenue growth slowed in the first quarter
and Crocs experienced a loss of $4.5 million. The decline in growth continued for the rest of the
year and losses mounted. Crocs had grown their manufacturing facilities and inventory in
24 “Brand of the Year.” Company Press Release. Nov. 21, 2005. 25 Alsever, Jennifer. “What a Croc!” Fast Company. June 1, 2006. 26 “Crocs IPO Takes Off.” Denver Business Journal. February 8, 2006.
14
preparation for continued expansion; however the market turned and Crocs was swollen. Crocs
therefore closed their manufacturing facilities in Canada and Brazil and decreased production in
Mexico and China. This resulted in a reduction in force of approximately 1,600 employees. On
the positive side, Crocs attained greater sales from abroad as international sales grew from 32%
of revenues in 2006 to 56% in 2008. Crocs ended the year with a loss of $185.1 million, mostly
due to inventory write-downs and impairments of goodwill and other assets.
In 2009, Crocs continued restructuring and right-sizing the business. They also hired John
Duerden, who previously worked at Reebok to serve as their new CEO in March. Crocs paid
down its outstanding credit facility with UBOC and negotiated a $30 million asset-backed
revolver with PNC in September. Earnings in the second and third quarter beat analyst
expectations. However, Crocs’ demand estimates were too optimistic as growth continued to lag
and the Company reported an annual loss of $42.1 million. In February 2010, Duerden
announced he would be leaving Crocs and John McCarvel was promoted from COO to CEO.
Crocs also recently launched a new advertising campaign called “Feel the Love” to debut new
models for their spring/summer collection and highlight the benefits of Croslite. Lastly, the
Company has provided guidance that they expect revenues to be approximately $160 million in
the first quarter of 2010.
Stock Performance (since IPO)
Crocs IPOFeb-08-2006
4Q loss reported;FY revenues down
10.5% and net loss of $42.1mFeb-25-2010
John McCarvel promoted to CEO
Mar-01-2010
Acquisition of Jibbitz
Dec-05-2006
Revenues increased 227% compared to 2005
Dec-31-2006
Stock split announced after strong 1Q results
May-03-2007
Acquisition of BiteFootwear
Jul-30-2007
Record earnings for 4Q2007 and FY
revenues increased 139% to $847m Dec-31-2007
Crocs lowered sales guidance and
announced expected loss for 1Q2008
Apr-14-2008
1Q loss was $4.5m (0.05 per share)
May-07-2008
Loss of $148mannouncedNov-12-2008
Annual revenues down 14.8% and net loss of $183.6m
(2.22 per share)Feb-19-2009
2Q and 3Q results beat guidance; profit of $22.1m announed in 3Q
Aug-06-2009Nov-05-2009
0
10
20
30
40
50
60
70
80
Feb
-06
Apr
-06
Jun-
06
Aug
-06
Oct
-06
Dec
-06
Feb
-07
Apr
-07
Jun-
07
Aug
-07
Oct
-07
Dec
-07
Feb
-08
Apr
-08
Jun-
08
Aug
-08
Oct
-08
Dec
-08
Feb
-09
Apr
-09
Jun-
09
Aug
-09
Oct
-09
Dec
-09
Feb
-10
Apr
-10
Clo
sing
sto
ck p
rice
15
Source: Capital IQ and Company website
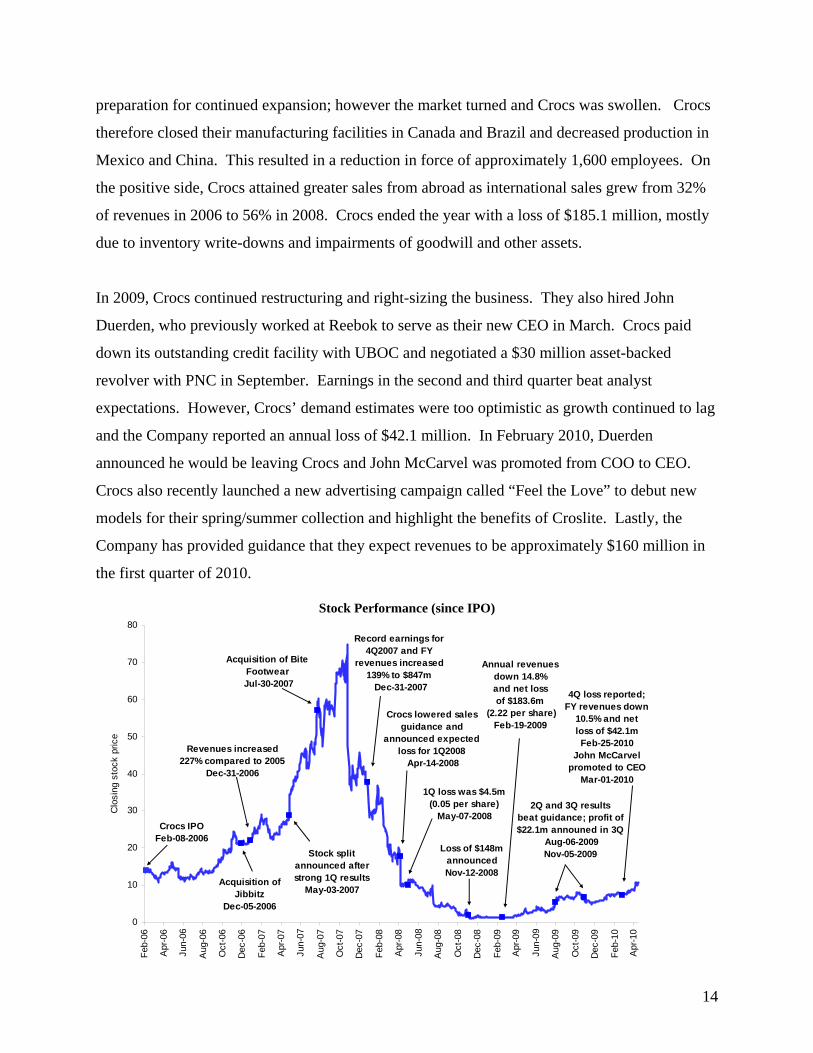
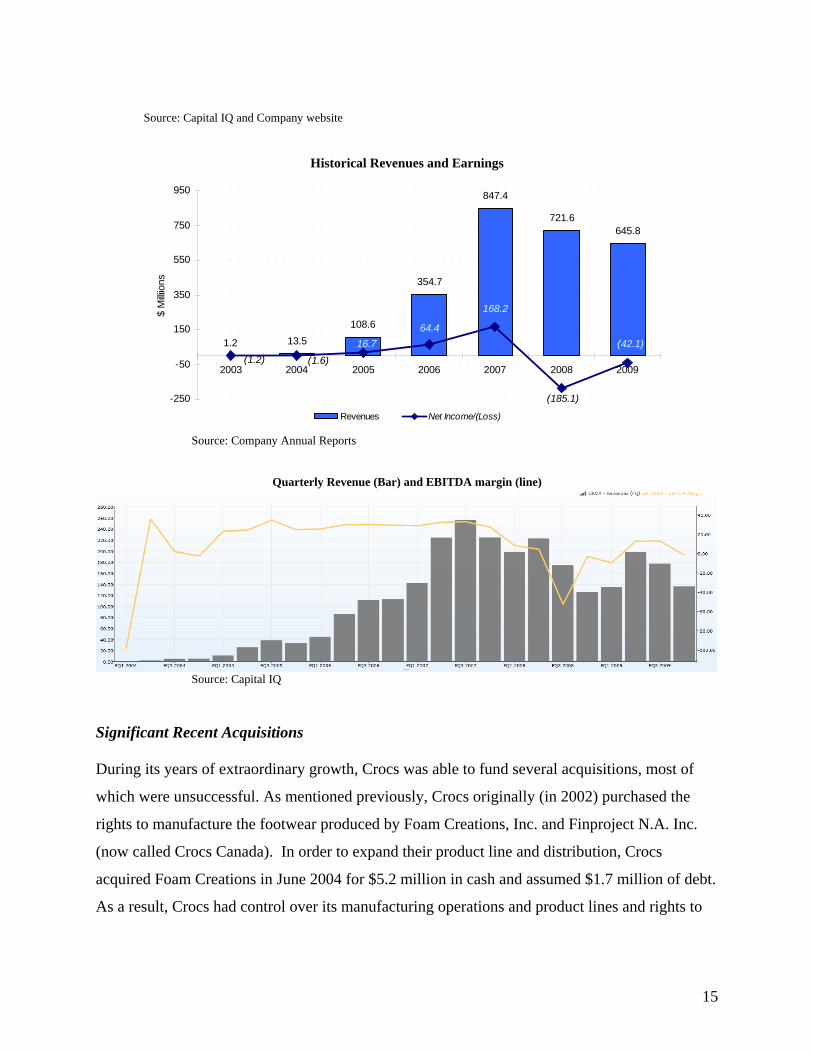
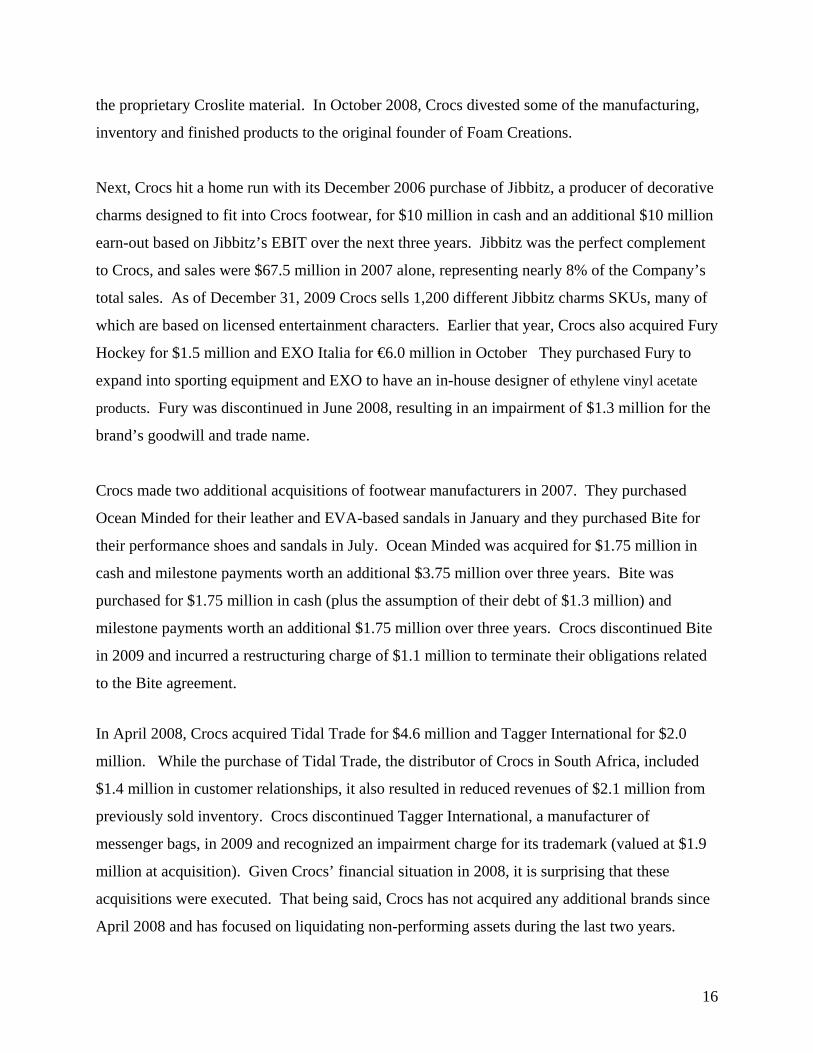
Historical Revenues and Earnings
1.2 13.5
108.6
354.7
847.4
721.6645.8
(1.2) (1.6)
16.7
64.4
168.2
(185.1)
(42.1)
-250
-50
150
350
550
750
950
2003 2004 2005 2006 2007 2008 2009
$ M
illiio
ns
Revenues Net Income/(Loss)
Source: Company Annual Reports
Quarterly Revenue (Bar) and EBITDA margin (line)
Source: Capital IQ
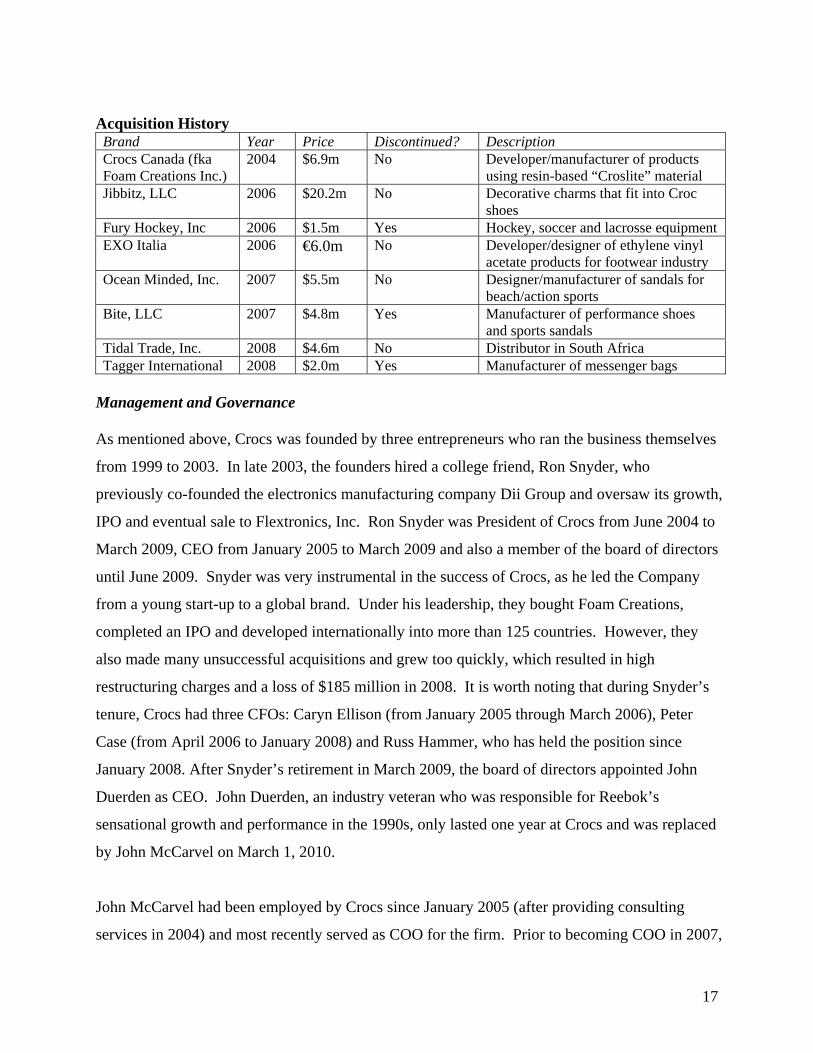
Significant Recent Acquisitions During its years of extraordinary growth, Crocs was able to fund several acquisitions, most of
which were unsuccessful. As mentioned previously, Crocs originally (in 2002) purchased the
rights to manufacture the footwear produced by Foam Creations, Inc. and Finproject N.A. Inc.
(now called Crocs Canada). In order to expand their product line and distribution, Crocs
acquired Foam Creations in June 2004 for $5.2 million in cash and assumed $1.7 million of debt.
As a result, Crocs had control over its manufacturing operations and product lines and rights to
16
the proprietary Croslite material. In October 2008, Crocs divested some of the manufacturing,
inventory and finished products to the original founder of Foam Creations.
Next, Crocs hit a home run with its December 2006 purchase of Jibbitz, a producer of decorative
charms designed to fit into Crocs footwear, for $10 million in cash and an additional $10 million
earn-out based on Jibbitz’s EBIT over the next three years. Jibbitz was the perfect complement
to Crocs, and sales were $67.5 million in 2007 alone, representing nearly 8% of the Company’s
total sales. As of December 31, 2009 Crocs sells 1,200 different Jibbitz charms SKUs, many of
which are based on licensed entertainment characters. Earlier that year, Crocs also acquired Fury
Hockey for $1.5 million and EXO Italia for €6.0 million in October They purchased Fury to
expand into sporting equipment and EXO to have an in-house designer of ethylene vinyl acetate
products. Fury was discontinued in June 2008, resulting in an impairment of $1.3 million for the
brand’s goodwill and trade name.
Crocs made two additional acquisitions of footwear manufacturers in 2007. They purchased
Ocean Minded for their leather and EVA-based sandals in January and they purchased Bite for
their performance shoes and sandals in July. Ocean Minded was acquired for $1.75 million in
cash and milestone payments worth an additional $3.75 million over three years. Bite was
purchased for $1.75 million in cash (plus the assumption of their debt of $1.3 million) and
milestone payments worth an additional $1.75 million over three years. Crocs discontinued Bite
in 2009 and incurred a restructuring charge of $1.1 million to terminate their obligations related
to the Bite agreement.
In April 2008, Crocs acquired Tidal Trade for $4.6 million and Tagger International for $2.0
million. While the purchase of Tidal Trade, the distributor of Crocs in South Africa, included
$1.4 million in customer relationships, it also resulted in reduced revenues of $2.1 million from
previously sold inventory. Crocs discontinued Tagger International, a manufacturer of
messenger bags, in 2009 and recognized an impairment charge for its trademark (valued at $1.9
million at acquisition). Given Crocs’ financial situation in 2008, it is surprising that these
acquisitions were executed. That being said, Crocs has not acquired any additional brands since
April 2008 and has focused on liquidating non-performing assets during the last two years.
17
Acquisition History Brand Year Price Discontinued? Description Crocs Canada (fka Foam Creations Inc.)
2004 $6.9m No Developer/manufacturer of products using resin-based “Croslite” material
Jibbitz, LLC 2006 $20.2m No Decorative charms that fit into Croc shoes
Fury Hockey, Inc 2006 $1.5m Yes Hockey, soccer and lacrosse equipment EXO Italia 2006 €6.0m No Developer/designer of ethylene vinyl
acetate products for footwear industry Ocean Minded, Inc. 2007 $5.5m No Designer/manufacturer of sandals for
beach/action sports Bite, LLC 2007 $4.8m Yes Manufacturer of performance shoes
and sports sandals Tidal Trade, Inc. 2008 $4.6m No Distributor in South Africa Tagger International 2008 $2.0m Yes Manufacturer of messenger bags
Management and Governance As mentioned above, Crocs was founded by three entrepreneurs who ran the business themselves
from 1999 to 2003. In late 2003, the founders hired a college friend, Ron Snyder, who
previously co-founded the electronics manufacturing company Dii Group and oversaw its growth,
IPO and eventual sale to Flextronics, Inc. Ron Snyder was President of Crocs from June 2004 to
March 2009, CEO from January 2005 to March 2009 and also a member of the board of directors
until June 2009. Snyder was very instrumental in the success of Crocs, as he led the Company
from a young start-up to a global brand. Under his leadership, they bought Foam Creations,
completed an IPO and developed internationally into more than 125 countries. However, they
also made many unsuccessful acquisitions and grew too quickly, which resulted in high
restructuring charges and a loss of $185 million in 2008. It is worth noting that during Snyder’s
tenure, Crocs had three CFOs: Caryn Ellison (from January 2005 through March 2006), Peter
Case (from April 2006 to January 2008) and Russ Hammer, who has held the position since
January 2008. After Snyder’s retirement in March 2009, the board of directors appointed John
Duerden as CEO. John Duerden, an industry veteran who was responsible for Reebok’s
sensational growth and performance in the 1990s, only lasted one year at Crocs and was replaced
by John McCarvel on March 1, 2010.
John McCarvel had been employed by Crocs since January 2005 (after providing consulting
services in 2004) and most recently served as COO for the firm. Prior to becoming COO in 2007,
18
McCarvel was senior vice president for global operations (from October 2005 to February 2007)
and vice president for Asia. McCarvel successfully moved up the ranks at Crocs, proving
himself on projects such as the expansion of Crocs’ direct channel business, consolidation of
their global warehouse capacity and investments in customer systems. McCarvel is taking
charge of Crocs after a very difficult period of substantial losses and overall economic distress;
however, he already knows the Company inside and out and is hopeful that they will be able to
turn the business around. As he said, “We’ve spent the last 18 months stabilizing the Company
while reinvigorating our product line and brand, and realigning our cost structure. I look forward
to guiding the Company back to profitable growth, with the help of our talented management
team and employees around the world and the support of our board.”27
Of the three founders, Hanson and Seamans are still involved in the firm’s operations. Lyndon
Hanson is currently VP of Customer Relations and Scott Seamans serves as Vice President of
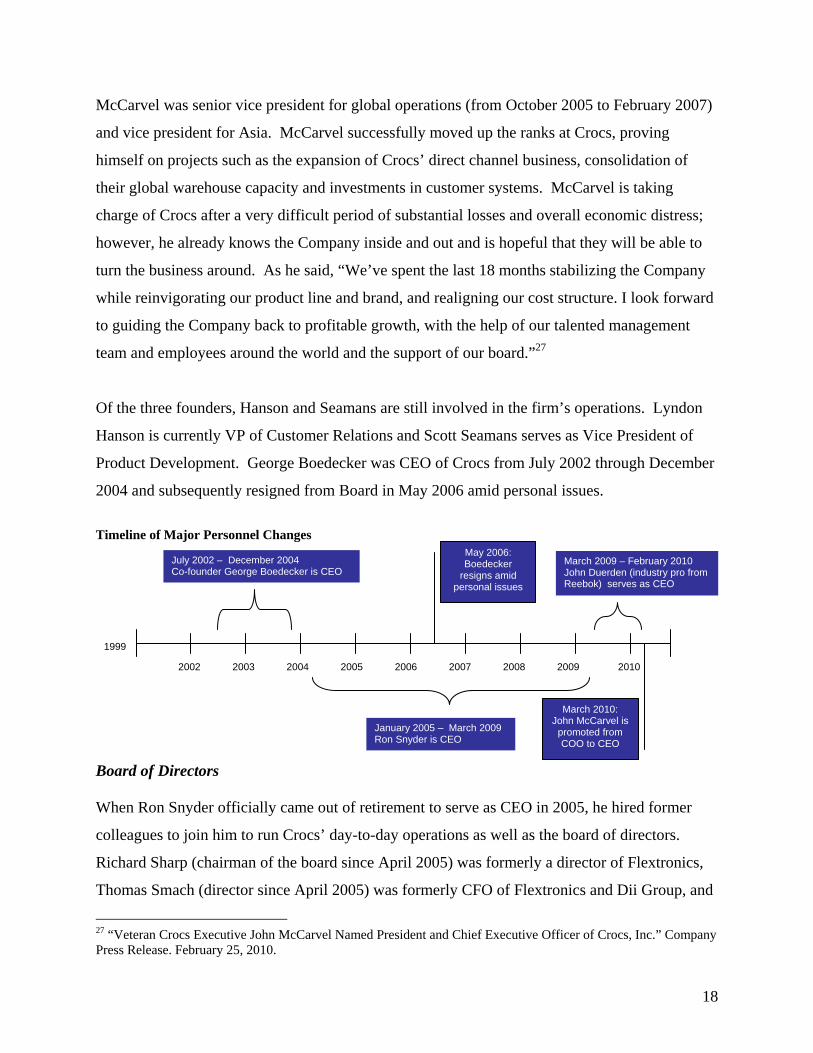
Product Development. George Boedecker was CEO of Crocs from July 2002 through December
2004 and subsequently resigned from Board in May 2006 amid personal issues.
Timeline of Major Personnel Changes
Board of Directors When Ron Snyder officially came out of retirement to serve as CEO in 2005, he hired former
colleagues to join him to run Crocs’ day-to-day operations as well as the board of directors.
Richard Sharp (chairman of the board since April 2005) was formerly a director of Flextronics,
Thomas Smach (director since April 2005) was formerly CFO of Flextronics and Dii Group, and
27 “Veteran Crocs Executive John McCarvel Named President and Chief Executive Officer of Crocs, Inc.” Company Press Release. February 25, 2010.
2002
1999
2003 2004 2005 2006 2007 2008 2009 2010
May 2006: Boedecker
resigns amid personal issues
July 2002 – December 2004 Co-founder George Boedecker is CEO
January 2005 – March 2009 Ron Snyder is CEO
March 2009 – February 2010 John Duerden (industry pro from Reebok) serves as CEO
March 2010: John McCarvel is
promoted from COO to CEO
19
John McCarvel (Crocs’ current CEO) was formerly Vice President of the design, test and
semiconductor division at Flextronics. Over the past five years, the board has experienced some
turnover. In addition to the CEO, two new directors Peter Jacobi and Stephen Cannon (Richard
Sharp’s former General Counsel at Circuit City) have been appointed to the board in the past two
years.
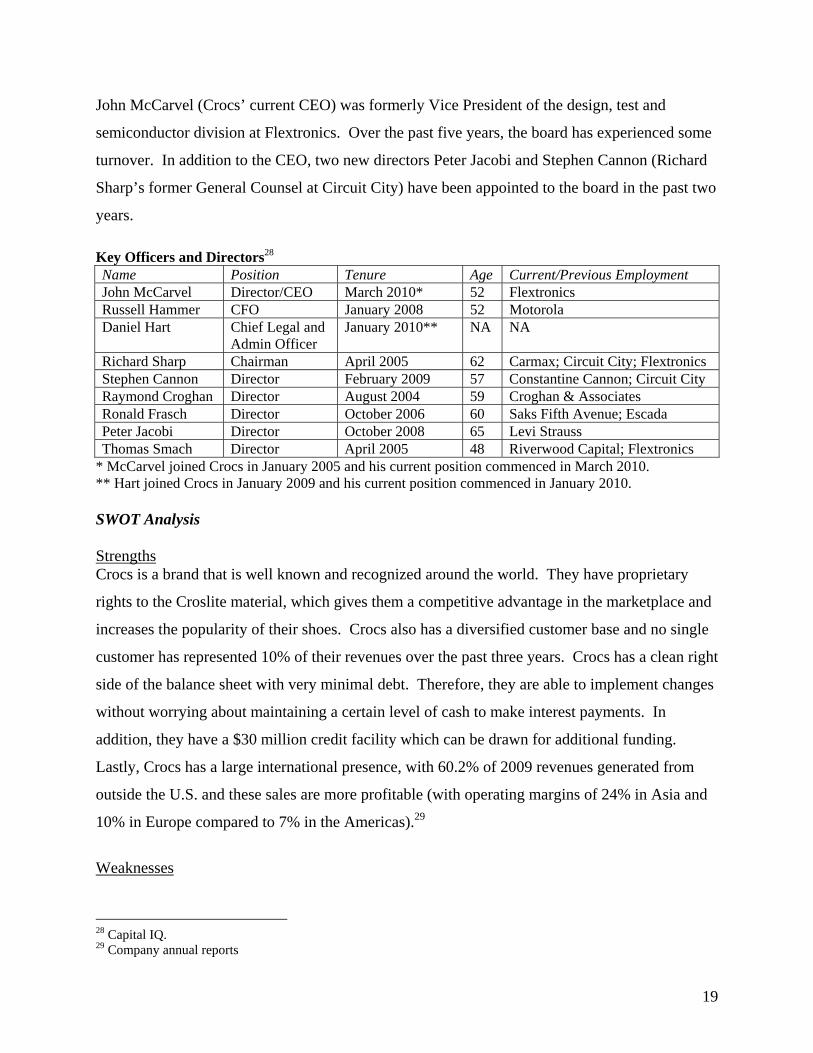
Key Officers and Directors28 Name Position Tenure Age Current/Previous Employment John McCarvel Director/CEO March 2010* 52 Flextronics Russell Hammer CFO January 2008 52 Motorola Daniel Hart Chief Legal and
Admin Officer January 2010** NA NA
Richard Sharp Chairman April 2005 62 Carmax; Circuit City; Flextronics Stephen Cannon Director February 2009 57 Constantine Cannon; Circuit City Raymond Croghan Director August 2004 59 Croghan & Associates Ronald Frasch Director October 2006 60 Saks Fifth Avenue; Escada Peter Jacobi Director October 2008 65 Levi Strauss Thomas Smach Director April 2005 48 Riverwood Capital; Flextronics
* McCarvel joined Crocs in January 2005 and his current position commenced in March 2010. ** Hart joined Crocs in January 2009 and his current position commenced in January 2010. SWOT Analysis Strengths Crocs is a brand that is well known and recognized around the world. They have proprietary
rights to the Croslite material, which gives them a competitive advantage in the marketplace and
increases the popularity of their shoes. Crocs also has a diversified customer base and no single
customer has represented 10% of their revenues over the past three years. Crocs has a clean right
side of the balance sheet with very minimal debt. Therefore, they are able to implement changes
without worrying about maintaining a certain level of cash to make interest payments. In
addition, they have a $30 million credit facility which can be drawn for additional funding.
Lastly, Crocs has a large international presence, with 60.2% of 2009 revenues generated from
outside the U.S. and these sales are more profitable (with operating margins of 24% in Asia and
10% in Europe compared to 7% in the Americas).29
Weaknesses
28 Capital IQ. 29 Company annual reports
20
Crocs does not have a diversified product offering beyond footwear, which causes revenues to be
seasonal (since most of their footwear is worn in summer) and also very cyclical (dependent on
consumer spending and performance of the retail sector). Demand for “Crocs Classic” shoes has
been declining over time (from 30% of total sales in 2007 to 16% in 2009) as they transition to a
mature product and therefore, revenues are contingent upon the success of new models and fads.
Crocs also relies too heavily on key suppliers and manufacturers. In 2009, Crocs only produced
27% of footwear products at company-owned facilities in Mexico and Italy. Another 36% of
2009’s footwear products were produced by their largest third-party supplier in China and Crocs
does not have written supply agreements with their primary third-party manufacturers in China.
Crocs has poor IT systems and depends on manual processes which are not efficient or scalable
as the Company grows. Another weakness is Crocs’ capital markets valuation, as their stock is
currently trading at $10.96, down from a high of $74.75 in October 2007. Lastly, Crocs has also
experienced management turnover in the past year; their CEO John Duerden retired in February
2010, they promoted John McCarvel from COO to CEO (leaving the COO position unfilled) and
their general counsel resigned in December 2009.30
Opportunities Crocs has the ability to expand through growth in direct to consumer sales and internet sales.
Given Crocs’ success internationally, they can continue expanding abroad by reaching untapped
markets. In addition, it’s possible that the Crocs “fad” is in a different part of the fashion trend
cycle abroad and Crocs can even take advantage of further growth in countries where it already
has a presence. Lastly, there is an industry movement towards more comfortable and casual
shoes, so Crocs has the opportunity to attract new consumers by highlighting the benefits of
Croslite.
Threats Given that Crocs does not have patent protection on its proprietary Croslite material, other
companies have been replicating the material or creating close substitutes, which eliminates
Crocs’ competitive advantage. In addition, there are limited barriers to entry and many knock-
offs have been created. While Crocs has filed suits against numerous copycats, this process is
costly and takes time (and important executives) away from their core business. Due to the lack
30 IBid
21
of advanced IT systems, Crocs is more susceptible to human error or fraud. Also, Crocs does not
hedge its exposure to foreign exchange and could therefore face significant losses if the US
dollar strengthens. Crocs likely has over-capacity from its rapid growth pre-2008 which may
add additional difficulty as they come out of the recent economic crisis. Another threat is their
unknown ability to tap the capital markets, given that Crocs may need additional capital if there
are losses in 2010. The revolver with PNC pledges their assets as collateral, therefore the
Company would need to find an unsecured lender. Lastly, there is anti-Crocs sentiment in the
market, as evidenced by the website “I Hate Crocs.com”31 which could reduce demand for its
products.32
31 http://ihatecrocs.com/ 32 IBid

22
HISTORICAL FINANCIAL OVERVIEW Crocs experienced rapid revenue growth and had difficulty meeting the demand for its footwear
products from the Company’s inception to the year ended December 31, 2007. In fact, many
people ‘felt the love’ for the brand when the shoes were introduced in 2002. Revenue reached
$354.7 million in 2006, the year the Company went public. A year later, that figure had more
than doubled to $847.4 million. During this period, the Company significantly increased
production capacity, warehouse space and inventory in an effort to meet demand. This trend
rapidly ended in 2008. But by 2009, sales had fallen nearly a quarter to $645.8 million.
2005A 2006A 2007A 2008A 2009A
Sales growth rate 703.1% 226.7% 138.9% (14.8%) (10.5%)
COGS / Sales 44.0% 43.5% 41.3% 67.5% 52.3%
Gross margin 56.0% 56.5% 58.7% 32.4% 46.6%
SG&A / Sales 31.2% 29.7% 31.7% 47.3% 48.3%
FX transaction losses (gains), net / Sales 0.0% 0.0% ‐1.2% 3.5% ‐0.1%
Net profit margin 15.6% 18.2% 19.9% ‐25.6% ‐6.5%
Capex / PP&E, net (Prev Yr) 309.5% 161.4% 164.7% 63.0% 20.9%
Fiscal Year Ended
Key Financial Ratios, 2005 ‐ 2009
Management believes that both the large decline in revenues in the Americas and Europe, and
the moderation of revenue growth in Asia, are largely attributable to the following factors:
a. The global economic crisis, which impacted the United States, Europe and Asia, causing
a reduction in consumer spending and decreased foot traffic at shopping malls. This
resulted in the Company’s inability to execute its long-term growth strategy or maintain
current revenue levels.
b. A less successful than anticipated attempt to face the following challenges:
a. Merchandising expanded product lines in existing wholesale channels while
responding to lessening demand for mature products.
b. Effectively responding to competitors entering the market with imitation products
that are sold at substantially lower prices.
Revenue – Trends and Drivers
23
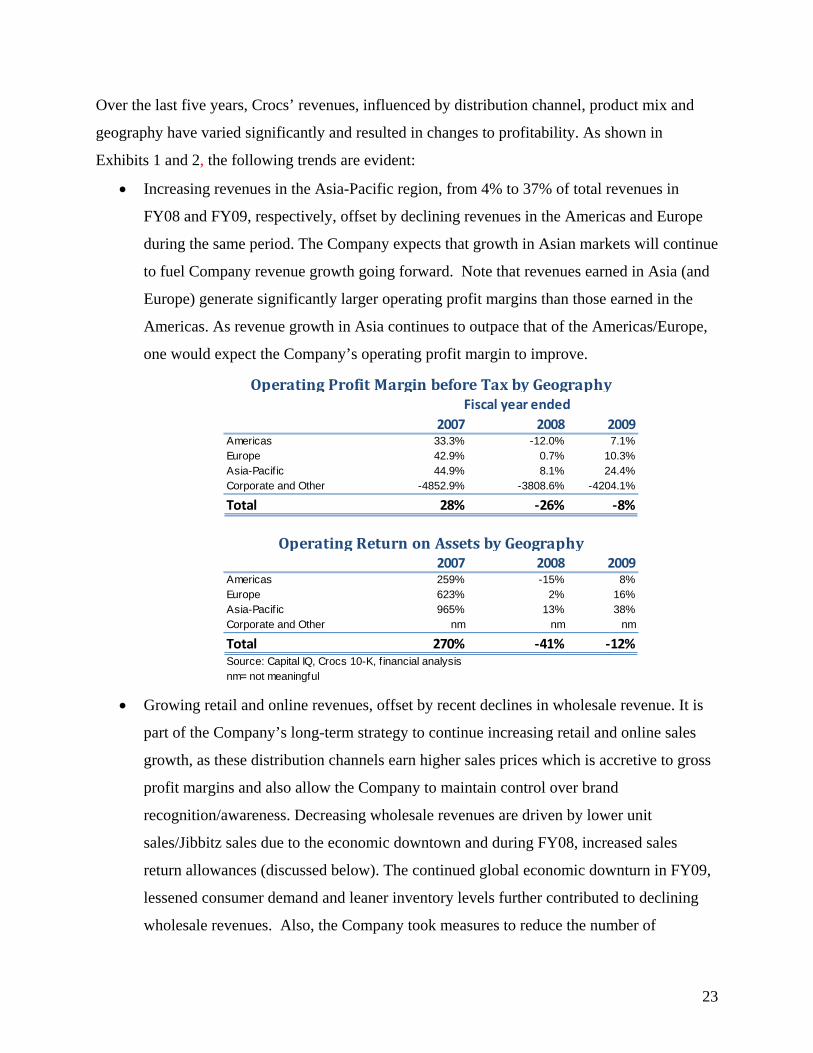
Over the last five years, Crocs’ revenues, influenced by distribution channel, product mix and
geography have varied significantly and resulted in changes to profitability. As shown in
Exhibits 1 and 2, the following trends are evident:
Increasing revenues in the Asia-Pacific region, from 4% to 37% of total revenues in
FY08 and FY09, respectively, offset by declining revenues in the Americas and Europe
during the same period. The Company expects that growth in Asian markets will continue
to fuel Company revenue growth going forward. Note that revenues earned in Asia (and
Europe) generate significantly larger operating profit margins than those earned in the
Americas. As revenue growth in Asia continues to outpace that of the Americas/Europe,
one would expect the Company’s operating profit margin to improve.
2007 2008 2009Americas 33.3% -12.0% 7.1%Europe 42.9% 0.7% 10.3%Asia-Pacif ic 44.9% 8.1% 24.4%Corporate and Other -4852.9% -3808.6% -4204.1%
Total 28% ‐26% ‐8%
2007 2008 2009Americas 259% -15% 8%Europe 623% 2% 16%Asia-Pacif ic 965% 13% 38%Corporate and Other nm nm nm
Total 270% ‐41% ‐12%Source: Capital IQ, Crocs 10-K, f inancial analysisnm= not meaningful
Operating Profit Margin before Tax by GeographyFiscal year ended
Operating Return on Assets by Geography
Growing retail and online revenues, offset by recent declines in wholesale revenue. It is
part of the Company’s long-term strategy to continue increasing retail and online sales
growth, as these distribution channels earn higher sales prices which is accretive to gross
profit margins and also allow the Company to maintain control over brand
recognition/awareness. Decreasing wholesale revenues are driven by lower unit
sales/Jibbitz sales due to the economic downtown and during FY08, increased sales
return allowances (discussed below). The continued global economic downturn in FY09,
lessened consumer demand and leaner inventory levels further contributed to declining
wholesale revenues. Also, the Company took measures to reduce the number of
24
wholesalers selling its product in order to be in a better position to brand the product in
the marketplace.
Change in sales mix, from primarily the classic/core Crocs products to newly introduced
shoe models. Per management, a wider range of products requires additional materials
(such as canvas, cloth, lining and suede) and additional processes (such as stitching) to
manufacture. This results in a higher cost of sales and decreased gross margins.
Expenses33
As shown within the Company’s income statement contained within Exhibit 3, the Company
experienced significant changes to both cost of sales and operating expenses during FY08 and
FY09. Given the sharp decline in sales, the Company commenced restructuring efforts and other
downsizing activities during FY08, which resulted in various material non-recurring items being
recorded in the Crocs’ financial statements.
Cost of Sales
Inventory write-down/charge on future purchase commitment: During FY08, Crocs inventory
included certain styles and colors with substantially diminished demand. Based on decreased
demand for these products, the Company discontinued them and implemented a plan for the
disposal of the discontinued product inventories. This plan included structured sales to
established discount retailers, sales through Company-operated outlet stores, warehouse sales
and other disposition activities as well as charitable product donations. In connection with
these efforts, the Company recorded approximately $76.3 m of inventory write-down charges
and an additional $4.2 m in charges related to losses on future purchase commitments for
inventory with a market value lower than cost.
Sales returns and allowances: In light of then-prevailing economic conditions, the Company
granted certain return requests and allowances to a number of customers it believed were
strategically important to the Company’s ongoing business; this resulted in an increase in
sales returns and allowances. The expense recorded for the reserve for sales returns and
allowances increased from $7,168,000 in FY07 to $52,597,000 in FY08 and went back to
$8,368,000 in FY09. Per the MD&A within the Company’s 10-K filing, amounts recorded in
33 Company annual reports
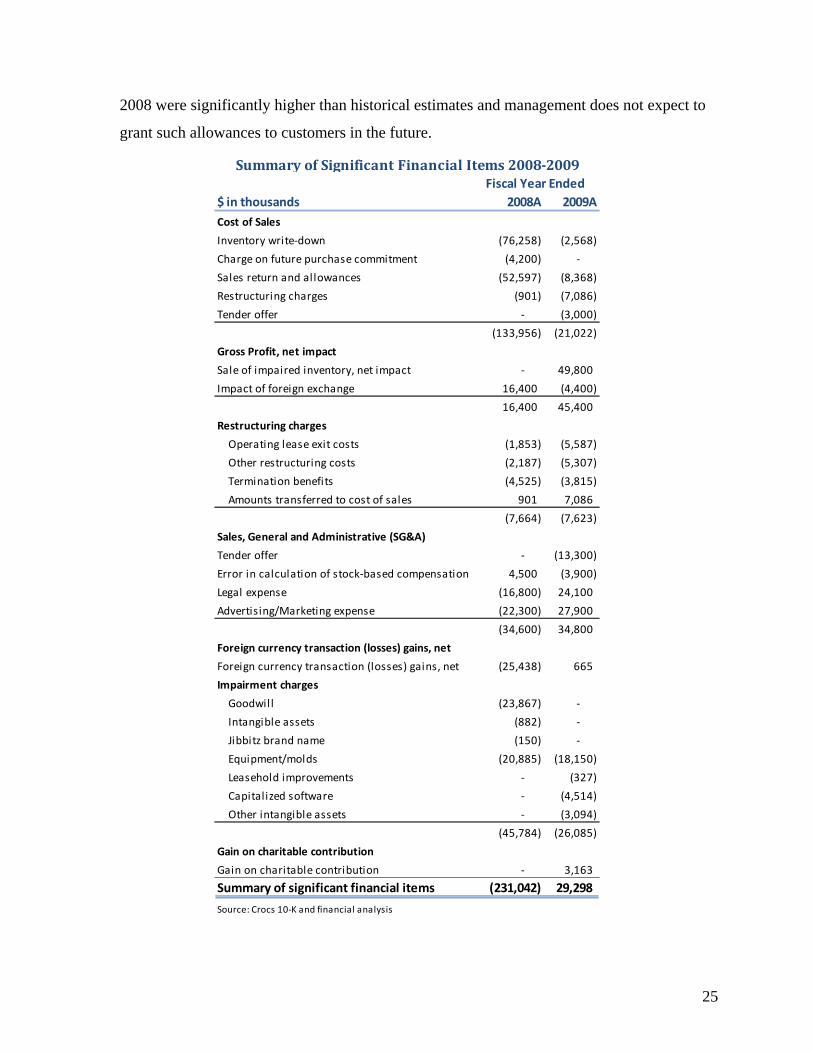
25
2008 were significantly higher than historical estimates and management does not expect to
grant such allowances to customers in the future.
$ in thousands 2008A 2009A
Cost of Sales
Inventory write‐down (76,258) (2,568)
Charge on future purchase commitment (4,200) ‐
Sales return and allowances (52,597) (8,368)
Restructuring charges (901) (7,086)
Tender offer ‐ (3,000)
(133,956) (21,022)
Gross Profit, net impact
Sale of impaired inventory, net impact ‐ 49,800
Impact of foreign exchange 16,400 (4,400)
16,400 45,400
Restructuring charges
Operating lease exit costs (1,853) (5,587)
Other restructuring costs (2,187) (5,307)
Termination benefits (4,525) (3,815)
Amounts transferred to cost of sales 901 7,086
(7,664) (7,623)
Sales, General and Administrative (SG&A)
Tender offer ‐ (13,300)
Error in calculation of stock‐based compensation 4,500 (3,900)
Legal expense (16,800) 24,100
Advertising/Marketing expense (22,300) 27,900
(34,600) 34,800
Foreign currency transaction (losses) gains, net
Foreign currency transaction (losses) gains, net (25,438) 665
Impairment charges
Goodwill (23,867) ‐
Intangible assets (882) ‐
Jibbitz brand name (150) ‐
Equipment/molds (20,885) (18,150)
Leasehold improvements ‐ (327)
Capitalized software ‐ (4,514)
Other intangible assets ‐ (3,094)
(45,784) (26,085)
Gain on charitable contribution
Gain on charitable contribution ‐ 3,163
Summary of significant financial items (231,042) 29,298
Source: Crocs 10‐K and financial analysis
Fiscal Year Ended
Summary of Significant Financial Items 2008‐2009
26
Gross Profit, net impact
Sale of impaired inventory: Related to the inventory write-down described above, the
Company was able to sell $58.3m of impaired product at substantially higher prices than
what management had previously estimated. The gross profit related to these units was
accretive to gross margin in the amount of $49.8m.
Impact of foreign exchange: According to the Company’s MD&A, changes in foreign
currency exchange rates year-on-year impact gross margin. Management expects that sales at
subsidiary companies with functional currencies other than the US dollar will continue to
generate a substantial portion of overall gross profit. Changes in foreign currency exchange
rates can impact gross margins and/or comparability of gross margins from period to period.
Restructuring Charges
Given declines in revenue, the Company evaluated its production capacity and operations
structure and recorded the restructuring costs outlined below. Of total amounts recorded, the
Company recorded $7.6 million recorded in restructuring charges and $7.1 million in cost of
sales during FY09 and $7.6 million in restructuring charges and $0.9 million in cost of sales
during FY08.
Operating lease exit costs: Includes costs related to the restructuring/discontinuation of
operations in Canada and Brazil during FY08 and the consolidation of warehouse and
distribution facilities in FY09.
Other restructuring costs: Other restructuring costs for FY08 includes the cancellation of
purchase obligations and freight and duty charges related to transferring inventory and
equipment to its United States and Mexico facilities. FY09 amounts include costs related to
the termination of a manufacturing agreement with third party in Bosnia and the termination
of the Company’s sponsorship agreement with the Association of Volleyball Professionals, a
$1.1 million charge to release the Company from obligations under an earn-out agreement
with Bite, LLC, and $0.5 million in charges related to the termination of consulting
agreements with former key employees.
Termination benefits: Represents employee termination costs related to headcount reductions.
27
SG&A costs
Tender offer: During FY09, the Company offered to purchase stock options with exercise
prices equal to or greater than $10.50 per share in order to restore the incentive value of its
long-term performance award programs and in response to the fact that the exercise prices of
a substantial number of outstanding options were under water. Of the $16.3 million charge,
$13.3 million was recorded to SG&A and $3 million was recorded to cost of sales.
Error in calculation of stock-based compensation: During FY09, management identified an
error in the calculation of stock-based compensation for prior periods. The error resulted in a
$4.5 million understatement of stock-based compensation in FY08. Amounts were corrected
during FY09 through both the tender offer expense described above and a direct adjustment
to the financial statements.
Legal expense: During FY08, the Company experienced an increase in legal expense of
$16.8 million due to ongoing litigation and intellectual property enforcement. During FY09,
legal expense decreased $24.1 million when compared to FY08.
Advertising/Marketing expense: The Company’s advertising/marketing expenses fluctuated
significantly during FY08/FY09. Expense increases in FY08 include $5.4m related to
corporate sponsorships and $12m related to advertising expense. During FY09, expenses
decreased $27.9m, due to an $11.1m expense decrease related to corporate sponsorship and a
$16.8m decrease in advertising as the Company exited corporate sponsorships.
Foreign currency transaction gains and losses
Expenses related to recording transactions denominated and settled in a currency other than the
functional currency (USD) have resulted in significant swings in the Company’s income
statement, including a gain of $10.1 million, a loss of $25.4 million and a gain of $665, 000 in
F07, FY08 and FY09, respectively. Per the Company’s 10-K, management intends to engage in
foreign exchange hedging contracts to reduce economic exposure in the future.
Impairment Charges
In conjunction with the restructuring activities described above, the Company recorded various
charges during FY08 and FY09 related to equipment and molds that represented excess capacity,
28
goodwill, intangibles assets including trade names and patents, and other assets/equipment used
in manufacturing, distribution and sales that were considered impaired.
Gain on charitable contribution
As part of the Company’s plan to dispose of discontinued and impaired product inventories,
impaired product donations were made to the Company’s Crocs Cares! charitable organization.
The inventory items consisted of end of life units, some of which were fully valued, partially
impaired or fully impaired. The contributions made were expensed at their fair value of $7.5
million during FY09. Because the fair value of the inventory contributed exceeded its carrying
amount, the Company recognized a gain of $3.2 million.
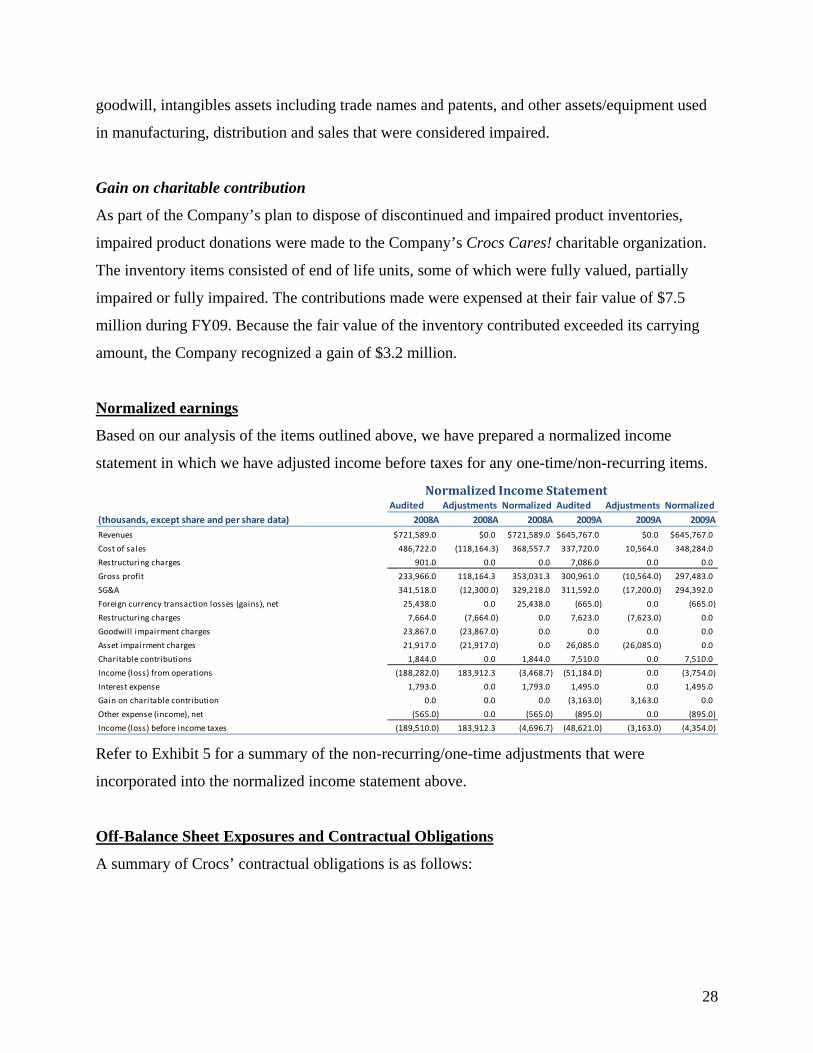
Normalized earnings
Based on our analysis of the items outlined above, we have prepared a normalized income
statement in which we have adjusted income before taxes for any one-time/non-recurring items.
Exhibit 3 ‐ Income Statement Normalized Income StatementAudited Adjustments Normalized Audited Adjustments Normalized
(thousands, except share and per share data) 2008A 2008A 2008A 2009A 2009A 2009A
Revenues $721,589.0 $0.0 $721,589.0 $645,767.0 $0.0 $645,767.0
Cost of sales 486,722.0 (118,164.3) 368,557.7 337,720.0 10,564.0 348,284.0
Restructuring charges 901.0 0.0 0.0 7,086.0 0.0 0.0
Gross profit 233,966.0 118,164.3 353,031.3 300,961.0 (10,564.0) 297,483.0
SG&A 341,518.0 (12,300.0) 329,218.0 311,592.0 (17,200.0) 294,392.0
Foreign currency transaction losses (gains), net 25,438.0 0.0 25,438.0 (665.0) 0.0 (665.0)
Restructuring charges 7,664.0 (7,664.0) 0.0 7,623.0 (7,623.0) 0.0
Goodwill impairment charges 23,867.0 (23,867.0) 0.0 0.0 0.0 0.0
Asset impairment charges 21,917.0 (21,917.0) 0.0 26,085.0 (26,085.0) 0.0
Charitable contributions 1,844.0 0.0 1,844.0 7,510.0 0.0 7,510.0
Income (loss) from operations (188,282.0) 183,912.3 (3,468.7) (51,184.0) 0.0 (3,754.0)
Interest expense 1,793.0 0.0 1,793.0 1,495.0 0.0 1,495.0
Gain on charitable contribution 0.0 0.0 0.0 (3,163.0) 3,163.0 0.0
Other expense (income), net (565.0) 0.0 (565.0) (895.0) 0.0 (895.0)
Income (loss) before income taxes (189,510.0) 183,912.3 (4,696.7) (48,621.0) (3,163.0) (4,354.0)
Refer to Exhibit 5 for a summary of the non-recurring/one-time adjustments that were
incorporated into the normalized income statement above.
Off-Balance Sheet Exposures and Contractual Obligations
A summary of Crocs’ contractual obligations is as follows:
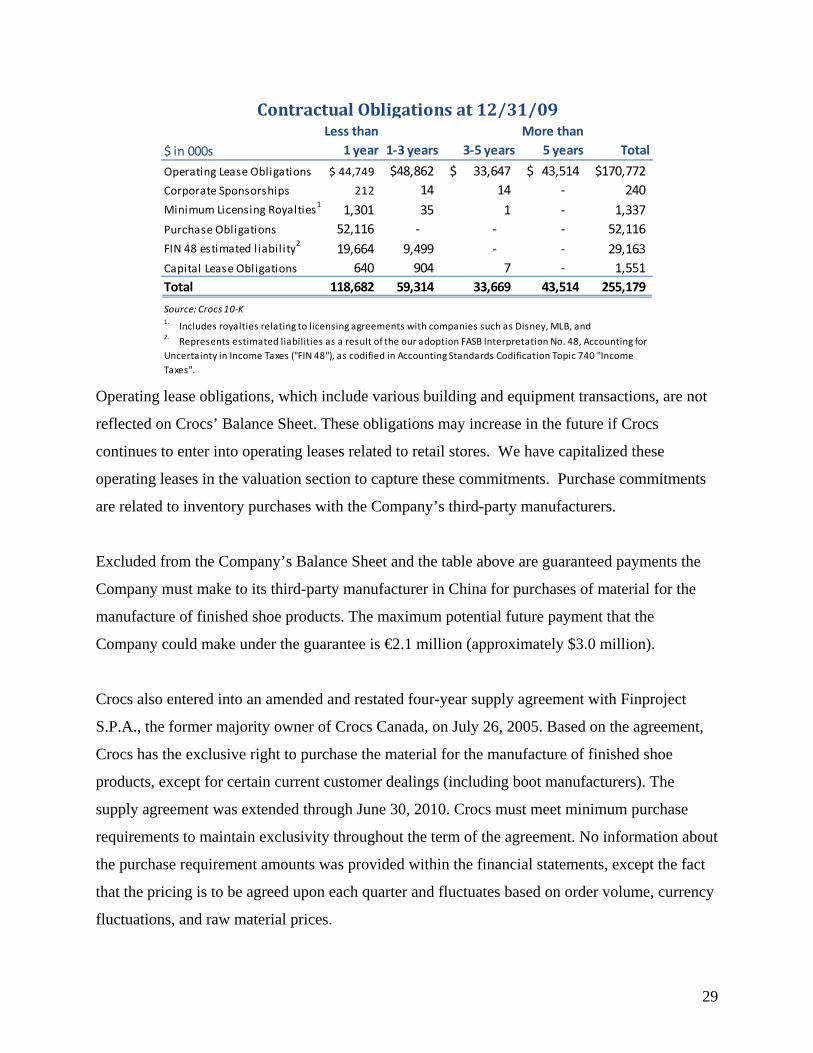
29
$ in 000s
Less than
1 year 1‐3 years 3‐5 years
More than
5 years Total
Operating Lease Obligations 44,749$ 48,862$ 33,647$ 43,514$ 170,772$
Corporate Sponsorships 212 14 14 ‐ 240
Minimum Licensing Royalties1
1,301 35 1 ‐ 1,337
Purchase Obligations 52,116 ‐ ‐ ‐ 52,116
FIN 48 estimated l iabil ity2
19,664 9,499 ‐ ‐ 29,163
Capital Lease Obligations 640 904 7 ‐ 1,551
Total 118,682 59,314 33,669 43,514 255,179
Source: Crocs 10‐K
Contractual Obligations at 12/31/09
2. Represents estimated liabilities as a result of the our adoption FASB Interpretation No. 48, Accounting for
Uncertainty in Income Taxes ("FIN 48"), as codified in Accounting Standards Codification Topic 740 "Income
Taxes".
1. Includes royalties relating to licensing agreements with companies such as Disney, MLB, and
Operating lease obligations, which include various building and equipment transactions, are not
reflected on Crocs’ Balance Sheet. These obligations may increase in the future if Crocs
continues to enter into operating leases related to retail stores. We have capitalized these
operating leases in the valuation section to capture these commitments. Purchase commitments
are related to inventory purchases with the Company’s third-party manufacturers.
Excluded from the Company’s Balance Sheet and the table above are guaranteed payments the
Company must make to its third-party manufacturer in China for purchases of material for the
manufacture of finished shoe products. The maximum potential future payment that the
Company could make under the guarantee is €2.1 million (approximately $3.0 million).
Crocs also entered into an amended and restated four-year supply agreement with Finproject
S.P.A., the former majority owner of Crocs Canada, on July 26, 2005. Based on the agreement,
Crocs has the exclusive right to purchase the material for the manufacture of finished shoe
products, except for certain current customer dealings (including boot manufacturers). The
supply agreement was extended through June 30, 2010. Crocs must meet minimum purchase
requirements to maintain exclusivity throughout the term of the agreement. No information about
the purchase requirement amounts was provided within the financial statements, except the fact
that the pricing is to be agreed upon each quarter and fluctuates based on order volume, currency
fluctuations, and raw material prices.
30
Liquidity and Capital Resources
At December 31, 2009, Crocs had $77.3 million in cash and cash equivalents. Refer to Exhibit 6
for the Company’s historical Statement of Cash Flows.
During FY09, the Company fully repaid its Revolving Credit Facility with Union Bank of
California, N.A. (approximately $23 million). In order to secure additional liquidity for the
future, on September 25, 2009, the Company entered into a Revolving Credit and Security
Agreement with PNC Bank, N.A, which matures on September 25, 2012. As outlined within the
Company’s 10-K, this agreement provides for an asset-backed revolving credit facility of up to
$30 million in total, and contains the following sublimits:
$17.5 million sublimit for borrowings against eligible inventory
$2 million sublimit for borrowings against the Company’s eligible inventory in-transit
$4 million sublimit for letters of credit asset-backed revolving lines of credit.
The total borrowings available under the Credit Agreement are also subject to customary
reserves and reductions to the extent the Company’s asset borrowing base changes. Borrowings
are secured by all Company assets, including all receivables, equipment, general intangibles,
inventory, investment property, subsidiary stock and leasehold interests. The Company must
prepay borrowings under the agreement in the event of certain dispositions of property.
Per the Company’s financial statements, interest due on domestic principal amounts outstanding
is charged as a 2% premium over the rate that is the greater than either:
(i) PNC's published reference rate,
(ii) The Federal Funds Open Rate in effect on such day plus 0.5% , or
(iii) The sum of the daily LIBOR rate and 1.0%, with respect to domestic rate loans.
Eurodollar denominated principal amounts (Eurodollar loans) outstanding bear interest of 3.50%
premium over a rate that is the greater of:
i. The Eurodollar rate, or
ii. 1.50%.
31
The credit agreement requires monthly interest payments with respect to domestic rate loans and
at the end of each period with respect to Eurodollar rate loans.
Restrictive and financial covenants applicable to the credit agreement include the maintenance of
a certain level of tangible net worth and a minimum fixed-charge coverage ratio, calculated on a
quarterly basis. The agreement also contains certain restrictive covenants that limit and may
prohibit the Company’s ability to incur additional debt, sell, lease or transfer its assets, pay
dividends, make capital expenditures and investments, guarantee debts or obligations, create
liens, enter into transactions with Company affiliates, and enter into certain merger,
consolidation or other reorganizations transactions. According to its financial statements, Crocs
was in compliance with these financial covenants as December 31, 2009. An immaterial amount
was outstanding under the credit agreement at December 31, 2009.
Crocs’ ability to fund working capital needs and planned capital expenditures is directly
dependent on its future operating performance and cash flow, which is ultimately impacted by
economic conditions and financial, business and other factors. Although management asserts
within its 10-K that the Company’s recent downsizing / cost reduction actions will be sufficient
to maintain a level of liquidity necessary to meet the Company’s ongoing operational needs,
further economic deterioration, and/or the Company’s inability to implement strategic goals may
require additional financing beyond the Company’s credit agreement; this factor must be
considered when projected the Company’s future cash position.
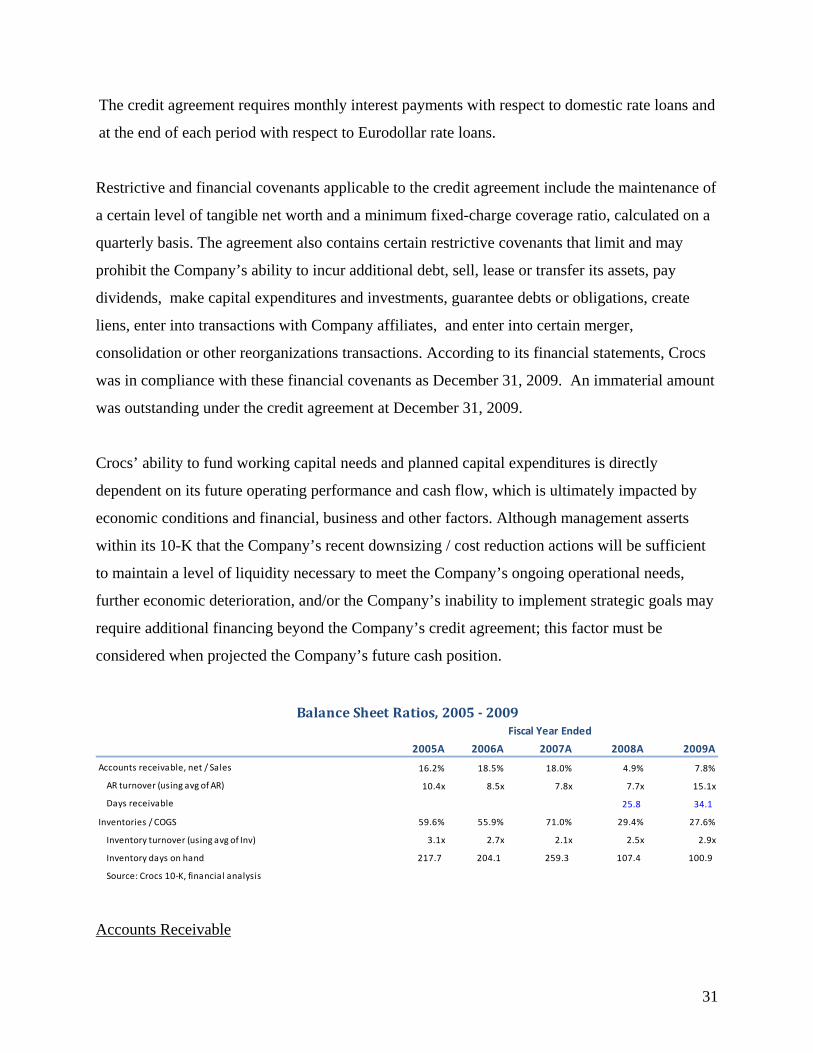
2005A 2006A 2007A 2008A 2009A
Accounts receivable, net / Sales 16.2% 18.5% 18.0% 4.9% 7.8%
AR turnover (using avg of AR) 10.4x 8.5x 7.8x 7.7x 15.1x
Days receivable 25.8 34.1
Inventories / COGS 59.6% 55.9% 71.0% 29.4% 27.6%
Inventory turnover (using avg of Inv) 3.1x 2.7x 2.1x 2.5x 2.9x
Inventory days on hand 217.7 204.1 259.3 107.4 100.9
Source: Crocs 10‐K, financial analysis
Fiscal Year Ended
Balance Sheet Ratios, 2005 ‐ 2009
Accounts Receivable
32
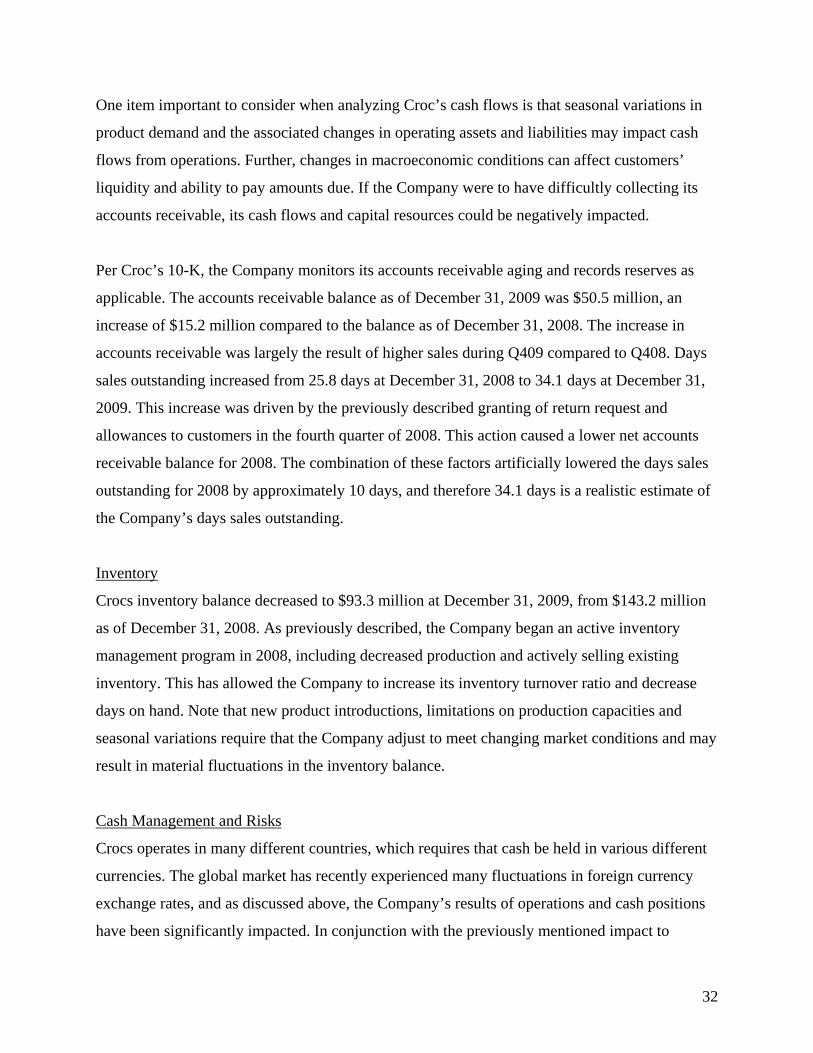
One item important to consider when analyzing Croc’s cash flows is that seasonal variations in
product demand and the associated changes in operating assets and liabilities may impact cash
flows from operations. Further, changes in macroeconomic conditions can affect customers’
liquidity and ability to pay amounts due. If the Company were to have difficultly collecting its
accounts receivable, its cash flows and capital resources could be negatively impacted.
Per Croc’s 10-K, the Company monitors its accounts receivable aging and records reserves as
applicable. The accounts receivable balance as of December 31, 2009 was $50.5 million, an
increase of $15.2 million compared to the balance as of December 31, 2008. The increase in
accounts receivable was largely the result of higher sales during Q409 compared to Q408. Days
sales outstanding increased from 25.8 days at December 31, 2008 to 34.1 days at December 31,
2009. This increase was driven by the previously described granting of return request and
allowances to customers in the fourth quarter of 2008. This action caused a lower net accounts
receivable balance for 2008. The combination of these factors artificially lowered the days sales
outstanding for 2008 by approximately 10 days, and therefore 34.1 days is a realistic estimate of
the Company’s days sales outstanding.
Inventory
Crocs inventory balance decreased to $93.3 million at December 31, 2009, from $143.2 million
as of December 31, 2008. As previously described, the Company began an active inventory
management program in 2008, including decreased production and actively selling existing
inventory. This has allowed the Company to increase its inventory turnover ratio and decrease
days on hand. Note that new product introductions, limitations on production capacities and
seasonal variations require that the Company adjust to meet changing market conditions and may
result in material fluctuations in the inventory balance.
Cash Management and Risks
Crocs operates in many different countries, which requires that cash be held in various different
currencies. The global market has recently experienced many fluctuations in foreign currency
exchange rates, and as discussed above, the Company’s results of operations and cash positions
have been significantly impacted. In conjunction with the previously mentioned impact to
33
earnings, foreign exchange fluctuations impacted Croc’s cash balance in the amounts of
$3,758,000, ($2,697,000), and $12,491,000 during FY07, FY08 and FY09, respectively. Any
future fluctuation in foreign currencies may have a material impact on Crocs’ cash flows and
capital resources.
Although Crocs has substantial cash requirements in the U.S., the majority of its cash is
generated and maintained abroad. Management considers unremitted earnings of subsidiaries
operating outside of the U.S. to be indefinitely reinvested, and to be used for the ongoing
operations of the international location of business. Although management does not intend to
change this position, most of the cash held outside of the U.S. could be repatriated to the U.S. but
would be subject to U.S. federal and state income taxes, less applicable foreign tax credits. To
further complicate matters, repatriation of certain foreign balances is restricted by local laws and
could have adverse tax consequences if the Company were to move cash from one country to
another.
At December 31, 2009, $64.8 million of the total $77.3 million in cash was held in international
locations. Of the $64.8 million, $16.0 million could potentially be restricted, as described above.
If the remaining $48.8 million were repatriated to the U.S., the Company would be required to
pay approximately $1.7 million in international withholding taxes with no offsetting foreign tax
credit.
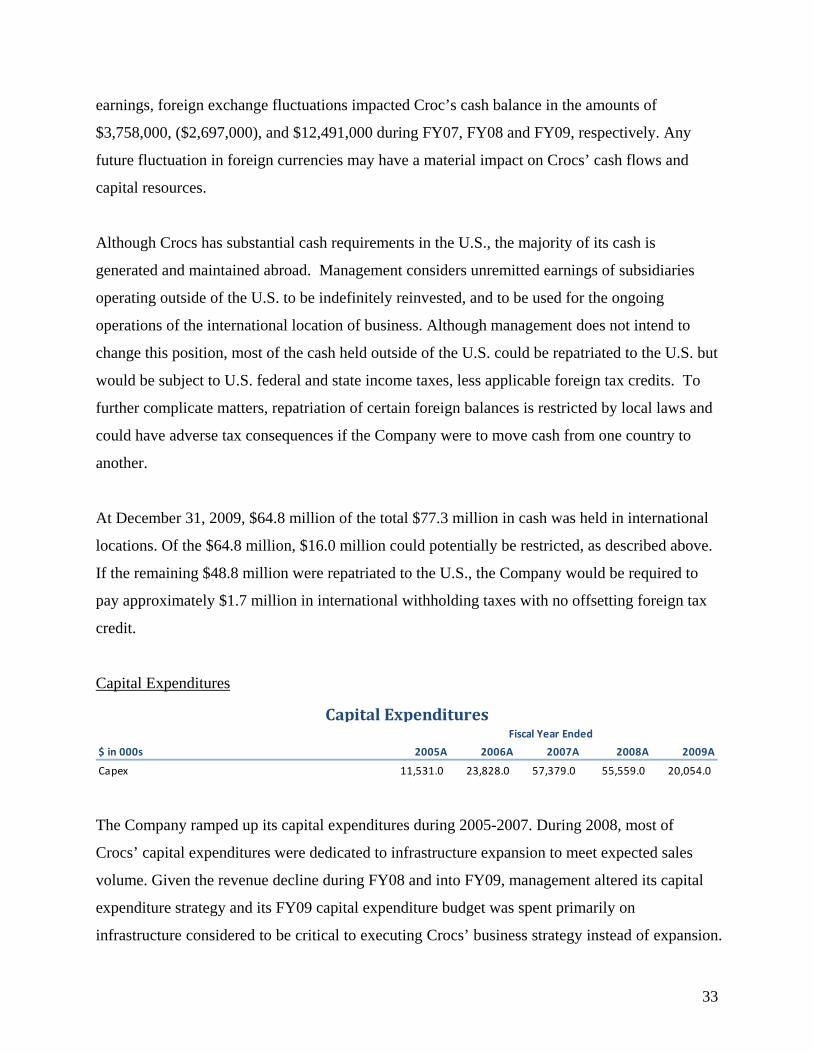
Capital Expenditures
$ in 000s 2005A 2006A 2007A 2008A 2009A
Capex 11,531.0 23,828.0 57,379.0 55,559.0 20,054.0
Fiscal Year Ended
Capital Expenditures
The Company ramped up its capital expenditures during 2005-2007. During 2008, most of
Crocs’ capital expenditures were dedicated to infrastructure expansion to meet expected sales
volume. Given the revenue decline during FY08 and into FY09, management altered its capital
expenditure strategy and its FY09 capital expenditure budget was spent primarily on
infrastructure considered to be critical to executing Crocs’ business strategy instead of expansion.
34
Management plans to continue to make ongoing capital investments in molds and other tooling
equipment related to manufacturing new products and footwear styles as well as those related to
opening additional retail stores. Management also plans to continue to invest in its global
information systems infrastructure to further strengthen its management information and
financial reporting capabilities. Note, however, that the Company:
Has slowed the pace at which it is opening new retail stores
Plans to reduce expenditures in its distribution and manufacturing activities due to a
reduction in revenues, and
Is currently in the process of implementing new software systems which management
hopes to bring greater efficiencies to the Company’s distribution strategy in the long
term.
These capital expenditures also do not capture implied Capex the company would need if they
owned the stores instead of using operating leases. In the following valuation section, we have
capitalized these operating leases and therefore included an estimated amount of Capex needed
for these stores.
35
VALUATION SUMMARY
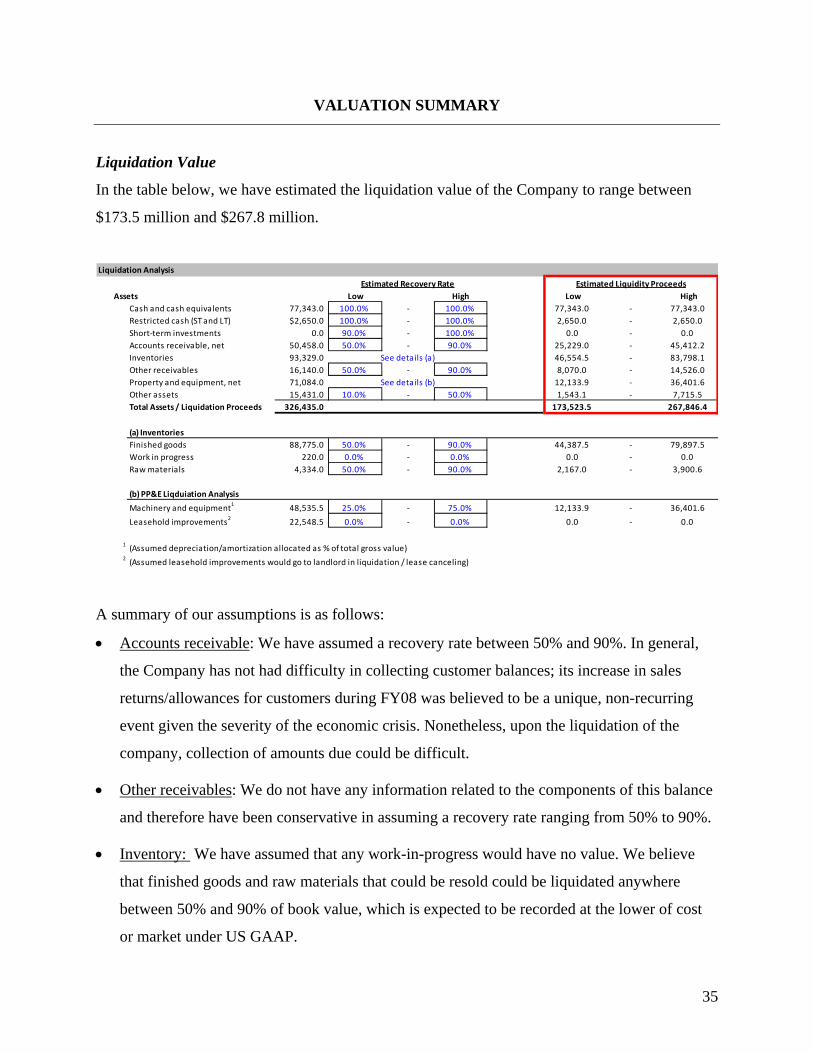
Liquidation Value
In the table below, we have estimated the liquidation value of the Company to range between
$173.5 million and $267.8 million.
Liquidation Analysis
Estimated Recovery Rate
Assets Low High Low High
Cash and cash equivalents 77,343.0 100.0% ‐ 100.0% 77,343.0 ‐ 77,343.0
Restricted cash (ST and LT) $2,650.0 100.0% ‐ 100.0% 2,650.0 ‐ 2,650.0
Short‐term investments 0.0 90.0% ‐ 100.0% 0.0 ‐ 0.0
Accounts receivable, net 50,458.0 50.0% ‐ 90.0% 25,229.0 ‐ 45,412.2
Inventories 93,329.0 See details (a) 46,554.5 ‐ 83,798.1
Other receivables 16,140.0 50.0% ‐ 90.0% 8,070.0 ‐ 14,526.0
Property and equipment, net 71,084.0 See details (b) 12,133.9 ‐ 36,401.6
Other assets 15,431.0 10.0% ‐ 50.0% 1,543.1 ‐ 7,715.5
Total Assets / Liquidation Proceeds 326,435.0 173,523.5 267,846.4
(a) Inventories
Finished goods 88,775.0 50.0% ‐ 90.0% 44,387.5 ‐ 79,897.5
Work in progress 220.0 0.0% ‐ 0.0% 0.0 ‐ 0.0
Raw materials 4,334.0 50.0% ‐ 90.0% 2,167.0 ‐ 3,900.6
(b) PP&E Liqduiation Analysis
Machinery and equipment1
48,535.5 25.0% ‐ 75.0% 12,133.9 ‐ 36,401.6
Leasehold improvements2
22,548.5 0.0% ‐ 0.0% 0.0 ‐ 0.0
1(Assumed depreciation/amortization allocated as % of total gross value)
2(Assumed leasehold improvements would go to landlord in liquidation / lease canceling)
Estimated Liquidity Proceeds
A summary of our assumptions is as follows:
Accounts receivable: We have assumed a recovery rate between 50% and 90%. In general,
the Company has not had difficulty in collecting customer balances; its increase in sales
returns/allowances for customers during FY08 was believed to be a unique, non-recurring
event given the severity of the economic crisis. Nonetheless, upon the liquidation of the
company, collection of amounts due could be difficult.
Other receivables: We do not have any information related to the components of this balance
and therefore have been conservative in assuming a recovery rate ranging from 50% to 90%.
Inventory: We have assumed that any work-in-progress would have no value. We believe
that finished goods and raw materials that could be resold could be liquidated anywhere
between 50% and 90% of book value, which is expected to be recorded at the lower of cost
or market under US GAAP.
36
Property, Plant and Equipment: We have assumed that all leasehold improvements would
have no recovery value, as the improvements are likely connected to the leased property and
would therefore be returned to the landlord upon liquidation/lease termination. We allocated
the total depreciation/amortization on PP&E to each leasehold improvements and machinery
& equipment based on relative gross values. As it pertains to machinery & equipment, we
assumed a low recovery value, somewhere between 25% and 75%.
Other assets: Similar to the other receivables balance, we do not know the components of
this balance. Given the nature of other assets accounts, we have assumed that the recovery
rate would be extremely low, somewhere between 10% and 50%.
Valuation – Turnaround Strategy, No Liquidation
We have utilized a discounted cash flow model to determine the value of Crocs. Refer to Exhibit
3 for financial statement projections.
Note that prior to projecting the FY10-FY15 financial statements, we normalized FY08 and
FY09 earnings as described in the Financial Overview section so that we had a more realistic
base year upon which we could perform our projections. Refer to Exhibit 5 and the Financial
Overview section of this report for additional information on the items we considered as non-
recurring that have been incorporated into our model. We have also capitalized the operating
leases and restated rent expense as interest expense and depreciation.
Key assumptions included in our free cash flow calculation are as follows:
Revenues: We have analyzed and projected revenue growth both by geography and
distribution channel. Refer Exhibit 8 for projected revenue drivers. We have assumed
revenue growth based on various factors:
o GDP growth by geography: We have utilized 2010/2011 GDP growth estimates
recently published by the World Bank34 as our base for growth projections by
geography as we believe GDP growth will fuel the trend in shoe purchases (volume).
Based on expert estimates, GDP growth will continue to be slow within the US and
34 http://siteresources.worldbank.org/INTGEP2010/Resources/GEP2010-Full-Report.pdf
37
Europe over the next two to five years. We have therefore assumed a growth rate of
4% in both regions over the next 5 years. We have assumed a significantly higher
growth rate of 13% for China over the same period; this is slightly more optimistic
than GDP growth expectation for the country but we believe the Crocs product is still
within its growth phase in this region and therefore expect continued significant
revenue growth in this region. We expect the Americas and Europe revenue
contribution to decline while Asia-Pacific revenue contribution increases. Ultimately,
we envision revenues to be comprised of 37.3%, 13.4% and 48.9% associated with
the Americas, Europe and Asia-Pacific, respectively. Also note that our growth
projections are above GDP growth estimates due to our expectation that revenues will
continue to grow in the retail and online space (as described below), where the
Company is able to charge higher sales prices; total retail and online revenues are
expected to represent 49% of total revenues in 2015, compared to 37% in 2009.
o Distribution channel mix: Given our turnaround strategy, detailed in a later section, of
renewing focus on wholesale relationships, continuing growth in retail kiosks, closing
various retail locations in the Americas and maintaining retail stores internationally,
we have assumed retail growth of 6% and wholesale growth of 4% throughout the
projected period. We anticipate continued online revenue growth given the constant
increase in ecommerce and the use of the internet. We do, however, expect growth to
slightly taper over the 5 year period. Ultimately, we project revenues to be comprised
of 21.4%, 50.7% and 28.0% associated with Retail, Wholesale and Online revenues,
respectively
Cost of Sales: Over the last three years, Crocs’ cost of sales has increased significantly, from
41.3% to 50.9% to 55.1% of FY07, FY08 normalized and FY09 normalized revenue,
respectively. This increase reflects increased salaries related to retail business growth and
increased component costs related to a greater variety of product lines. Although we expect
further decreases in product variety, we do not anticipate reaching historical cost of sale %
levels. We also expect cost of sales to slightly decline with an increase in online sales as
online distribution is a low cost form of distribution. We have therefore selected a COS/Sales
ratio of 52% for FY10 and 50% for FY11-FY15. Also note that we anticipate the closure of
50 retail stores in conjunction with our turnaround plan and have calculated the net impact to
38
the cost of sales; this impact has been incorporated into projected cost of sales. Refer to
Exhibit 9 for a summary of the financial impact of our turnaround plan actions.
Restructuring Charges: Although the Company has recorded significant restructuring charges
over the FY08/FY09 period, we believe there will be additional charges recorded in the near
future. We anticipate further product consolidation will result in the write-down of additional
product molds/equipment molds related to redundant/discontinued product lines. Refer to
Exhibit 9.
SG&A: Recent increases in SG&A expense, from 31.7% to 45.6% to 45.6% of FY07, FY08
normalized and FY09 normalized revenues, respectively, reflect the Company’s efforts to
expand its retail business, which has a significantly higher cost structure than wholesale and
online distribution. Despite our anticipated turnaround efforts to close 50 retail stores in the
US, Crocs has non-cancellable operating leases for the majority of its retail space; given
recent difficulty the Company has had in subleasing rental property, we have conservatively
assumed this property will not be subleased and therefore the related rent expense will not
decline until the least terminates. Given the Company’s contractual obligation table as
previously summarized, it appears the majority of these leases do not renew/terminate for
approximately 5 years. Although we believe our turnaround strategy will slightly decrease
SG&A costs to approximately 40% of revenues, we do not believe further decreases will be
possible given the existing lease situation. Note that projected SG&A also incorporates the
financial impact of turnaround activities, including additional marketing expense to
strengthen brand awareness, as outlined within the turnaround plan section of this document
and within Exhibit 9.
Foreign currency transaction gains and losses: The Company’s public filings do not provide
clarity regarding the full financial impact of foreign currency transactions and translation.
Various numbers reported in the MD&A and financial statement notes outline the impact to
Other Comprehensive Income (financial statement translation), Cash, Gross Profit and
SG&A; it is extremely difficult to piece the information together to get a full picture of the
financial impact of foreign currency fluctuations. Further, the foreign exchange impact
reported in FY07-FY09 is not intuitive given the movements in the US dollar exchange rate
against the Euro and Yuan. Nonetheless, it is clear the foreign exchange impact is significant.
39
As mentioned within the turnaround plan section of this report, we recommend that the
Company begin to hedge some of its foreign currency transactions to mitigate some of its
exposure to exchange rate risk. Due to our inability to obtain complete information on
foreign exchange and the complexity in projecting the foreign exchange impact, we have not
incorporated the impact of foreign exchange within our projections.
Capital Expenditures/Depreciation: We expect capital expenditures to be similar to those
levels recorded during FY09, which was primarily comprised of maintenance capital
expenditures. Given our strategic plan to close various retail stores and focus more on kiosks
from a retailing perspectives, large capital expenditures will no longer be required. Further,
as previously mentioned, we intend to eventually move all production off-shore to third-party
manufacturers in China. We therefore do not intend on making significant capital
expenditures related to the growth of facilities and instead will make maintenance capital
expenditure related to manufacturing facilities. Note that capital expenditures recorded in
FY10/FY11 included additional amounts related to the systems improvement implementation
described within the turnaround plan and contained within Exhibit 9. Resulting from lower
capital expenditures, our annual depreciation expense will decline over time. Included in
both capitalize expenditures and depreciation are amounts relating to the capitalization of
operating leases. We made assumptions regarding future amounts, taking into consideration
our recommendation to close stores going forward.
Taxes: We have assumed a marginal tax rate of 40%.
Changes in Working Capital: Given the lack of clarity around the components of various
current asset and liability balances, including other receivables, prepaid expenses, other
assets and accrued expenses, we have projected the balances as either constant (e.g. other
receivables/other assets) or as a percentage of sales based on historical averages (e.g. accrued
expenses). For the most significant working capital accounts, we assumed as follows:
o Accounts Receivable: Due to lack of information regarding historical credit sales, we
were only able to utilize the FY08/FY09 days receivable information as reported
within the 10-K for our projections. Based on management commentary within the
filing, it appears the 2009 days receivable of 34.1 is generally representative of the
Company’s operations. We have used 34.1 for FY10 but believe the Company will be
40
able to slightly improve this number to 32 days outstanding (14.3x) for the FY11-
FY15 period given Company efforts to improve cash management and be more
selective about wholesale vendors.
o Inventory: Based on historical information, the Company has improved inventory
days on hand period-over-period. As previously described, the Company has
commenced an active inventory management program to decrease production and
actively sell existing inventory. This has allowed the Company to increase its
inventory turnover ratio and decrease days outstanding from 259 days in FY07 to 101
days in FY09. We believe this trend will continue but days on hand will slightly
increase to 110 going forward.
o Accounts Payable: Accounts payable as a percentage of cost of sales has gradually
decreased over time, primarily due to the fact that accounts payable are comprised of
some fixed components that don’t vary directly with revenue/cost of sales and
therefore the ratio was exorbitantly high during the Company’s first few years of
operations. Since revenues have grown and we believe somewhat stabilized, we
expect days payable will be more or less consistent going forward. We have assumed
days payable to be 50 days during the projected period, which results in accounts
payable representing 10% of cost of sales.
Capitalized Operating Leases:
o To capture the effect of mandatory future lease payments, we capitalized the
operating leases as an asset and liability on the balance sheet. We feel this most
accurately represents the company’s debt and debt-like obligations. Accordingly, we
restated rent expense as interest expense and depreciation. Although we do not have
exact data regarding the company’s cost of debt for real estate and stores, we assumed
this discount rate to be the company’s cost of debt at 10%. We also assumed
obligations after year 5, which are aggregated, to have yearly amounts equal to the
year 5 minimum payment.
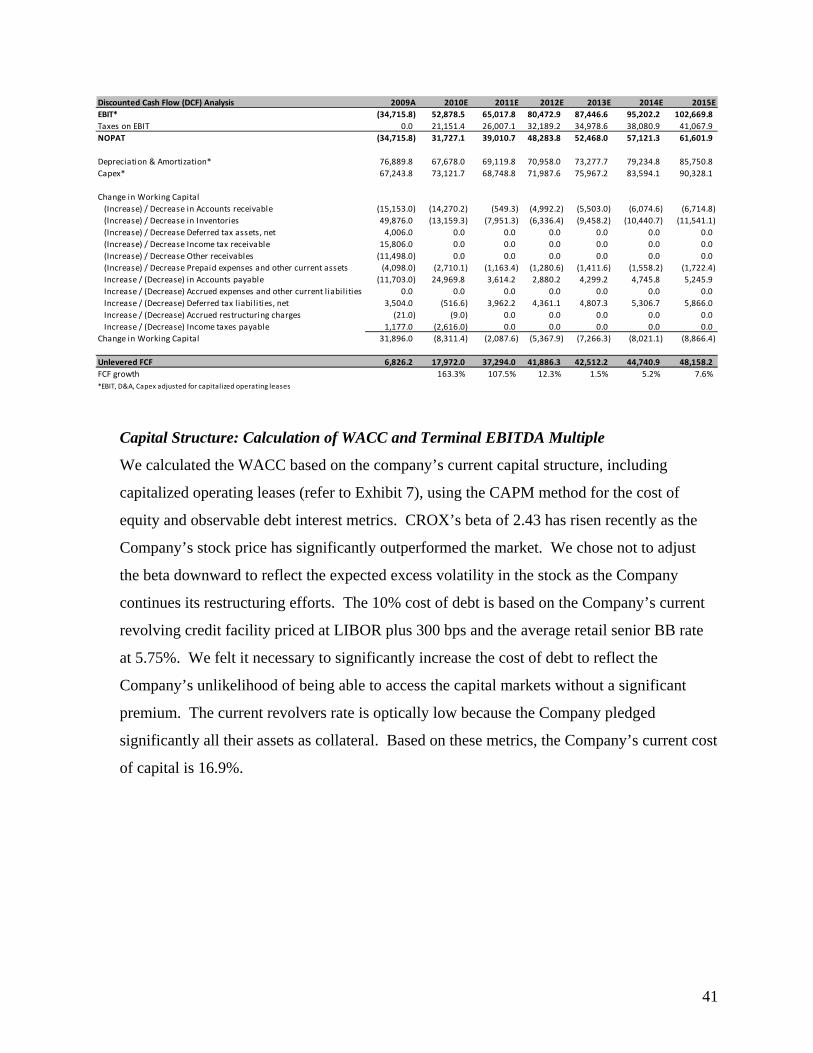
41
Discounted Cash Flow (DCF) Analysis 2009A 2010E 2011E 2012E 2013E 2014E 2015E
EBIT* (34,715.8) 52,878.5 65,017.8 80,472.9 87,446.6 95,202.2 102,669.8
Taxes on EBIT 0.0 21,151.4 26,007.1 32,189.2 34,978.6 38,080.9 41,067.9
NOPAT (34,715.8) 31,727.1 39,010.7 48,283.8 52,468.0 57,121.3 61,601.9
Depreciation & Amortization* 76,889.8 67,678.0 69,119.8 70,958.0 73,277.7 79,234.8 85,750.8
Capex* 67,243.8 73,121.7 68,748.8 71,987.6 75,967.2 83,594.1 90,328.1
Change in Working Capital
(Increase) / Decrease in Accounts receivable (15,153.0) (14,270.2) (549.3) (4,992.2) (5,503.0) (6,074.6) (6,714.8)
(Increase) / Decrease in Inventories 49,876.0 (13,159.3) (7,951.3) (6,336.4) (9,458.2) (10,440.7) (11,541.1)
(Increase) / Decrease Deferred tax assets, net 4,006.0 0.0 0.0 0.0 0.0 0.0 0.0
(Increase) / Decrease Income tax receivable 15,806.0 0.0 0.0 0.0 0.0 0.0 0.0
(Increase) / Decrease Other receivables (11,498.0) 0.0 0.0 0.0 0.0 0.0 0.0
(Increase) / Decrease Prepaid expenses and other current assets (4,098.0) (2,710.1) (1,163.4) (1,280.6) (1,411.6) (1,558.2) (1,722.4)
Increase / (Decrease) in Accounts payable (11,703.0) 24,969.8 3,614.2 2,880.2 4,299.2 4,745.8 5,245.9
Increase / (Decrease) Accrued expenses and other current l iabil ities 0.0 0.0 0.0 0.0 0.0 0.0 0.0
Increase / (Decrease) Deferred tax l iabilities, net 3,504.0 (516.6) 3,962.2 4,361.1 4,807.3 5,306.7 5,866.0
Increase / (Decrease) Accrued restructuring charges (21.0) (9.0) 0.0 0.0 0.0 0.0 0.0
Increase / (Decrease) Income taxes payable 1,177.0 (2,616.0) 0.0 0.0 0.0 0.0 0.0
Change in Working Capital 31,896.0 (8,311.4) (2,087.6) (5,367.9) (7,266.3) (8,021.1) (8,866.4)
Unlevered FCF 6,826.2 17,972.0 37,294.0 41,886.3 42,512.2 44,740.9 48,158.2
FCF growth 163.3% 107.5% 12.3% 1.5% 5.2% 7.6%
*EBIT, D&A, Capex adjusted for capitalized operating leases
Capital Structure: Calculation of WACC and Terminal EBITDA Multiple
We calculated the WACC based on the company’s current capital structure, including
capitalized operating leases (refer to Exhibit 7), using the CAPM method for the cost of
equity and observable debt interest metrics. CROX’s beta of 2.43 has risen recently as the
Company’s stock price has significantly outperformed the market. We chose not to adjust
the beta downward to reflect the expected excess volatility in the stock as the Company
continues its restructuring efforts. The 10% cost of debt is based on the Company’s current
revolving credit facility priced at LIBOR plus 300 bps and the average retail senior BB rate
at 5.75%. We felt it necessary to significantly increase the cost of debt to reflect the
Company’s unlikelihood of being able to access the capital markets without a significant
premium. The current revolvers rate is optically low because the Company pledged
significantly all their assets as collateral. Based on these metrics, the Company’s current cost
of capital is 16.9%.
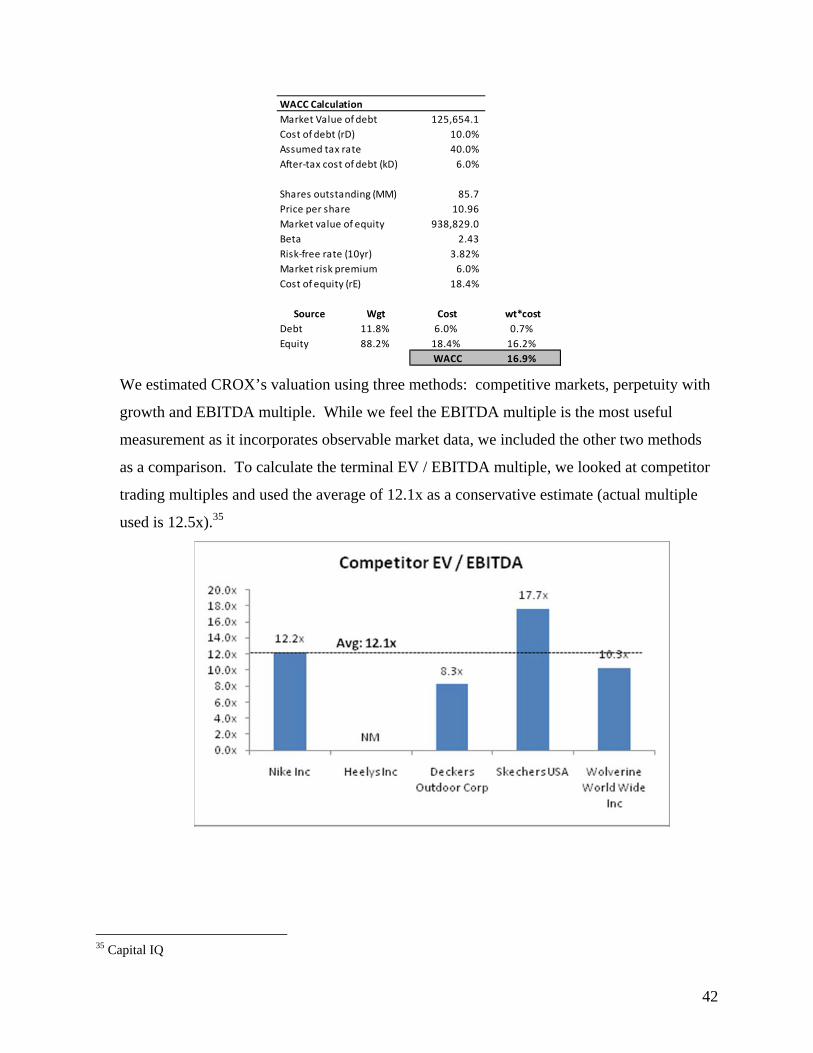
42
WACC Calculation
Market Value of debt 125,654.1
Cost of debt (rD) 10.0%
Assumed tax rate 40.0%
After‐tax cost of debt (kD) 6.0%
Shares outstanding (MM) 85.7
Price per share 10.96
Market value of equity 938,829.0
Beta 2.43
Risk‐free rate (10yr) 3.82%
Market risk premium 6.0%
Cost of equity (rE) 18.4%
Source Wgt Cost wt*cost
Debt 11.8% 6.0% 0.7%
Equity 88.2% 18.4% 16.2%
WACC 16.9%
We estimated CROX’s valuation using three methods: competitive markets, perpetuity with
growth and EBITDA multiple. While we feel the EBITDA multiple is the most useful
measurement as it incorporates observable market data, we included the other two methods
as a comparison. To calculate the terminal EV / EBITDA multiple, we looked at competitor
trading multiples and used the average of 12.1x as a conservative estimate (actual multiple
used is 12.5x).35
35 Capital IQ
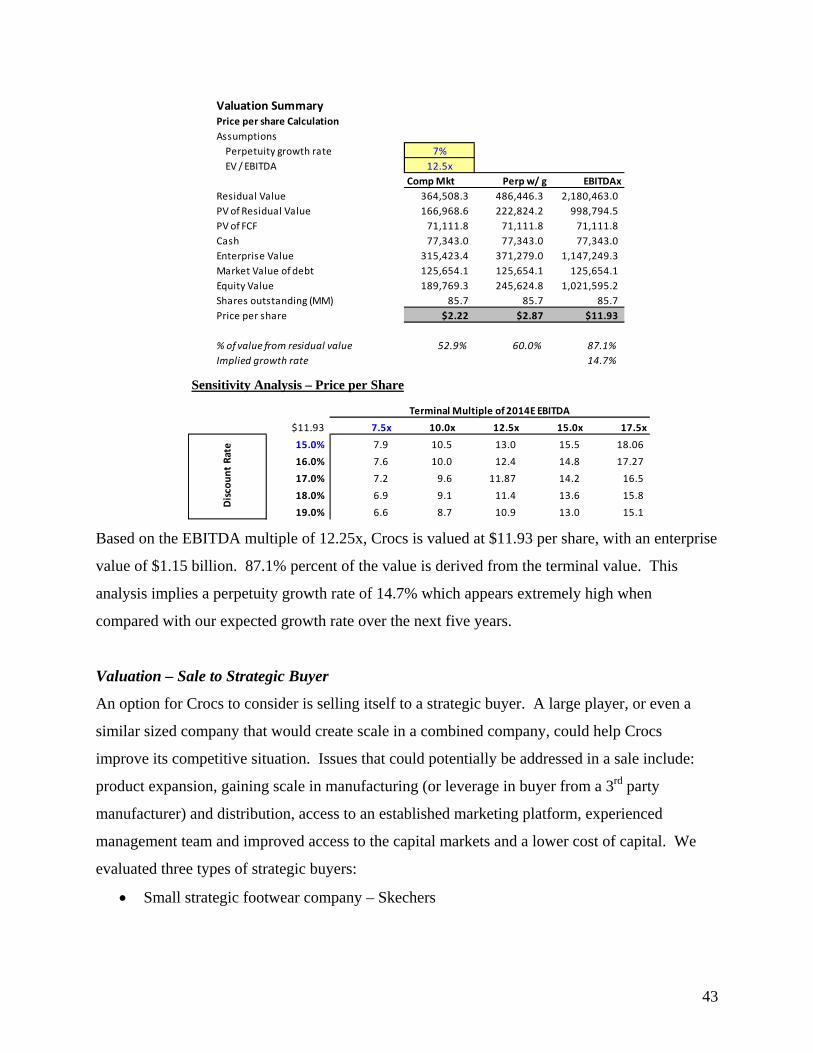
43
Valuation SummaryPrice per share Calculation
Assumptions
Perpetuity growth rate 7%
EV / EBITDA 12.5x
Comp Mkt Perp w/ g EBITDAx
Residual Value 364,508.3 486,446.3 2,180,463.0
PV of Residual Value 166,968.6 222,824.2 998,794.5
PV of FCF 71,111.8 71,111.8 71,111.8
Cash 77,343.0 77,343.0 77,343.0
Enterprise Value 315,423.4 371,279.0 1,147,249.3
Market Value of debt 125,654.1 125,654.1 125,654.1
Equity Value 189,769.3 245,624.8 1,021,595.2
Shares outstanding (MM) 85.7 85.7 85.7
Price per share $2.22 $2.87 $11.93
% of value from residual value 52.9% 60.0% 87.1%
Implied growth rate 14.7% Sensitivity Analysis – Price per Share
Terminal Multiple of 2014E EBITDA
$11.93 7.5x 10.0x 12.5x 15.0x 17.5x
15.0% 7.9 10.5 13.0 15.5 18.06
16.0% 7.6 10.0 12.4 14.8 17.27
17.0% 7.2 9.6 11.87 14.2 16.5
18.0% 6.9 9.1 11.4 13.6 15.8
19.0% 6.6 8.7 10.9 13.0 15.1
Discount Rate
Based on the EBITDA multiple of 12.25x, Crocs is valued at $11.93 per share, with an enterprise
value of $1.15 billion. 87.1% percent of the value is derived from the terminal value. This
analysis implies a perpetuity growth rate of 14.7% which appears extremely high when
compared with our expected growth rate over the next five years.
Valuation – Sale to Strategic Buyer
An option for Crocs to consider is selling itself to a strategic buyer. A large player, or even a
similar sized company that would create scale in a combined company, could help Crocs
improve its competitive situation. Issues that could potentially be addressed in a sale include:
product expansion, gaining scale in manufacturing (or leverage in buyer from a 3rd party
manufacturer) and distribution, access to an established marketing platform, experienced
management team and improved access to the capital markets and a lower cost of capital. We
evaluated three types of strategic buyers:
Small strategic footwear company – Skechers
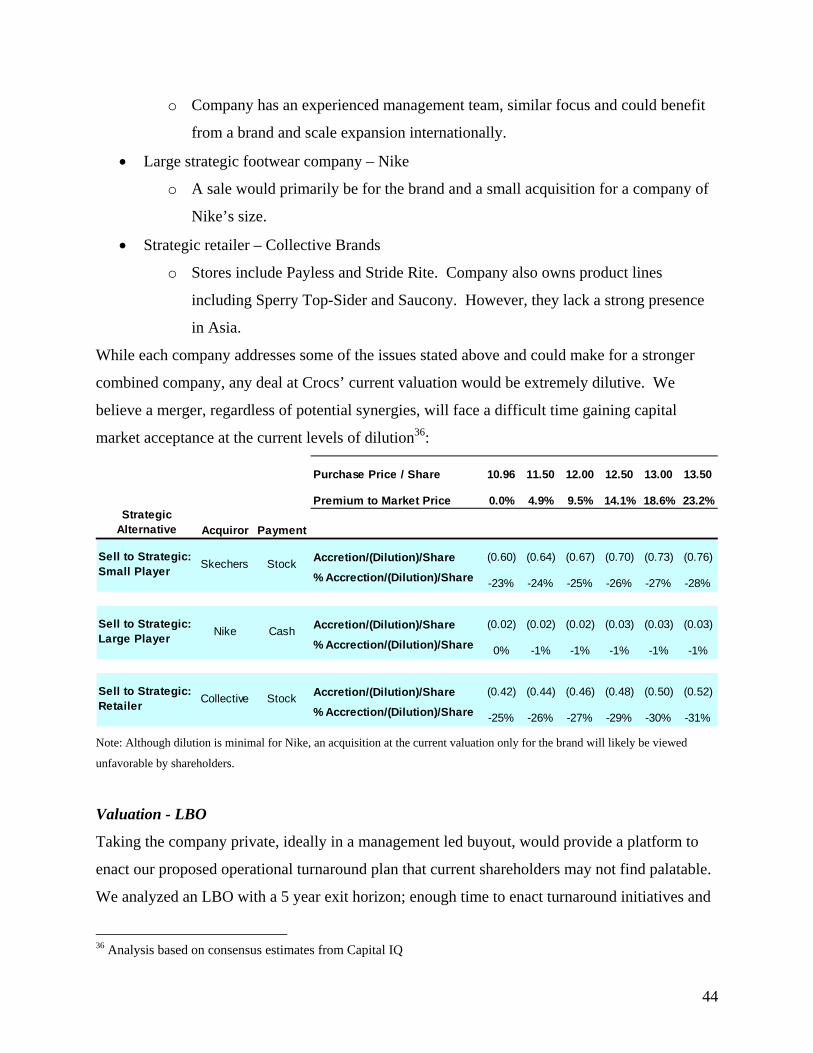
44
o Company has an experienced management team, similar focus and could benefit
from a brand and scale expansion internationally.
Large strategic footwear company – Nike
o A sale would primarily be for the brand and a small acquisition for a company of
Nike’s size.
Strategic retailer – Collective Brands
o Stores include Payless and Stride Rite. Company also owns product lines
including Sperry Top-Sider and Saucony. However, they lack a strong presence
in Asia.
While each company addresses some of the issues stated above and could make for a stronger
combined company, any deal at Crocs’ current valuation would be extremely dilutive. We
believe a merger, regardless of potential synergies, will face a difficult time gaining capital
market acceptance at the current levels of dilution36:
Purchase Price / Share 10.96 11.50 12.00 12.50 13.00 13.50
Premium to Market Price 0.0% 4.9% 9.5% 14.1% 18.6% 23.2%Strategic
Alternative Acquiror Payment
Accretion/(Dilution)/Share (0.60) (0.64) (0.67) (0.70) (0.73) (0.76)
% Accrection/(Dilution)/Share -23% -24% -25% -26% -27% -28%
Accretion/(Dilution)/Share (0.02) (0.02) (0.02) (0.03) (0.03) (0.03)
% Accrection/(Dilution)/Share 0% -1% -1% -1% -1% -1%
Accretion/(Dilution)/Share (0.42) (0.44) (0.46) (0.48) (0.50) (0.52)
% Accrection/(Dilution)/Share -25% -26% -27% -29% -30% -31%
Cash
Sell to Strategic:Retailer
Collective Stock
Sell to Strategic: Small Player
Skechers Stock
Sell to Strategic: Large Player
Nike
Note: Although dilution is minimal for Nike, an acquisition at the current valuation only for the brand will likely be viewed
unfavorable by shareholders.
Valuation - LBO
Taking the company private, ideally in a management led buyout, would provide a platform to
enact our proposed operational turnaround plan that current shareholders may not find palatable.
We analyzed an LBO with a 5 year exit horizon; enough time to enact turnaround initiatives and
36 Analysis based on consensus estimates from Capital IQ
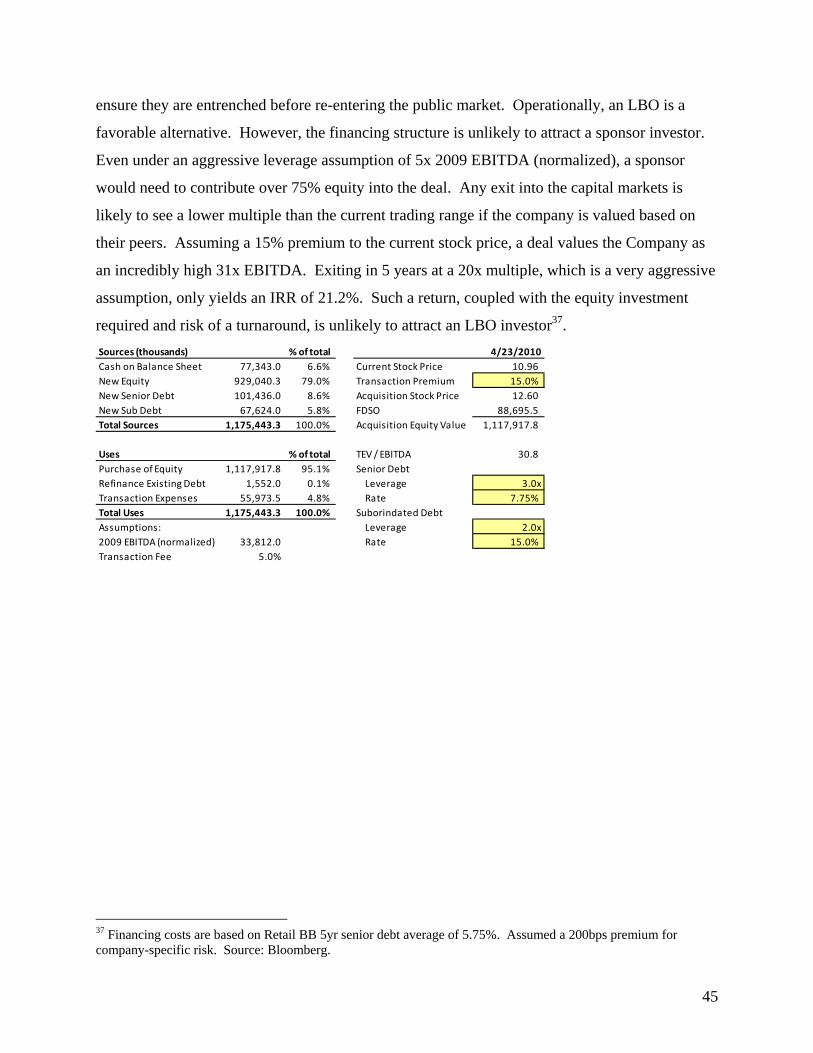
45
ensure they are entrenched before re-entering the public market. Operationally, an LBO is a
favorable alternative. However, the financing structure is unlikely to attract a sponsor investor.
Even under an aggressive leverage assumption of 5x 2009 EBITDA (normalized), a sponsor
would need to contribute over 75% equity into the deal. Any exit into the capital markets is
likely to see a lower multiple than the current trading range if the company is valued based on
their peers. Assuming a 15% premium to the current stock price, a deal values the Company as
an incredibly high 31x EBITDA. Exiting in 5 years at a 20x multiple, which is a very aggressive
assumption, only yields an IRR of 21.2%. Such a return, coupled with the equity investment
required and risk of a turnaround, is unlikely to attract an LBO investor37.
Sources (thousands) % of total 4/23/2010
Cash on Balance Sheet 77,343.0 6.6% Current Stock Price 10.96
New Equity 929,040.3 79.0% Transaction Premium 15.0%
New Senior Debt 101,436.0 8.6% Acquisition Stock Price 12.60
New Sub Debt 67,624.0 5.8% FDSO 88,695.5
Total Sources 1,175,443.3 100.0% Acquisition Equity Value 1,117,917.8
Uses % of total TEV / EBITDA 30.8
Purchase of Equity 1,117,917.8 95.1% Senior Debt
Refinance Existing Debt 1,552.0 0.1% Leverage 3.0x
Transaction Expenses 55,973.5 4.8% Rate 7.75%
Total Uses 1,175,443.3 100.0% Suborindated Debt
Assumptions: Leverage 2.0x
2009 EBITDA (normalized) 33,812.0 Rate 15.0%
Transaction Fee 5.0%
37 Financing costs are based on Retail BB 5yr senior debt average of 5.75%. Assumed a 200bps premium for company-specific risk. Source: Bloomberg.
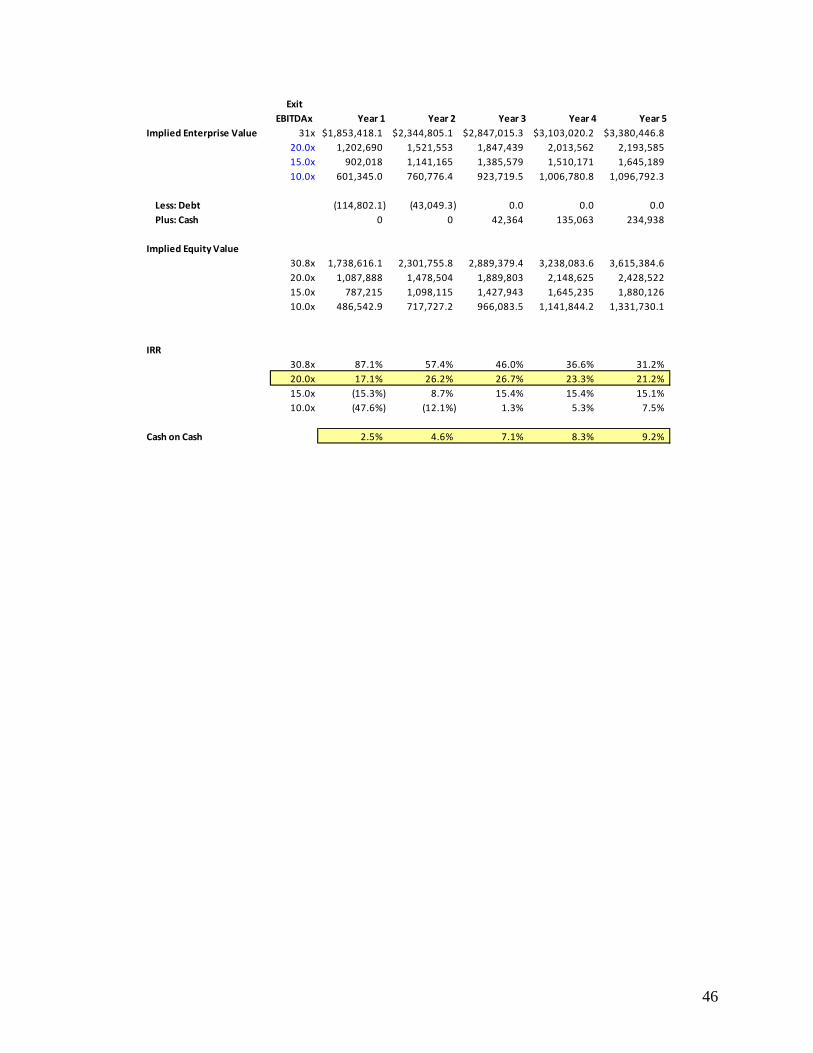
46
Exit
EBITDAx Year 1 Year 2 Year 3 Year 4 Year 5
Implied Enterprise Value 31x $1,853,418.1 $2,344,805.1 $2,847,015.3 $3,103,020.2 $3,380,446.8
20.0x 1,202,690 1,521,553 1,847,439 2,013,562 2,193,585
15.0x 902,018 1,141,165 1,385,579 1,510,171 1,645,189
10.0x 601,345.0 760,776.4 923,719.5 1,006,780.8 1,096,792.3
Less: Debt (114,802.1) (43,049.3) 0.0 0.0 0.0
Plus: Cash 0 0 42,364 135,063 234,938
Implied Equity Value
30.8x 1,738,616.1 2,301,755.8 2,889,379.4 3,238,083.6 3,615,384.6
20.0x 1,087,888 1,478,504 1,889,803 2,148,625 2,428,522
15.0x 787,215 1,098,115 1,427,943 1,645,235 1,880,126
10.0x 486,542.9 717,727.2 966,083.5 1,141,844.2 1,331,730.1
Exit
IRR EBITDAx
30.8x 87.1% 57.4% 46.0% 36.6% 31.2%
20.0x 17.1% 26.2% 26.7% 23.3% 21.2%
15.0x (15.3%) 8.7% 15.4% 15.4% 15.1%
10.0x (47.6%) (12.1%) 1.3% 5.3% 7.5%
Cash on Cash 2.5% 4.6% 7.1% 8.3% 9.2%
47
TURNAROUND PLAN
As we have discussed throughout our analysis, in an effort to stimulate sales growth and become
the “global leader in active casual footwear products”38, Crocs management has embarked upon
an ill-fated strategy to dramatically expand the Company’s retail store presence in order to more
effectively sell its non-core products (classic Cayman and Beach models and their closely-related
spinoffs). This strategy led to a series of acquisitions (ice hockey equipment, messenger bags,
specialty textile design firms, etc), a decreased focus on its wholesale business, and an explosion
of new Crocs-branded footwear and clothing styles.
We believe that this new strategy, combined with the Company’s highly questionable
management information systems and its recent senior management turnover, is in danger of
returning Crocs to the distress of 2008-2009. Despite recent improvements in sales, margins,
and the Company stock price, we believe that Crocs remains in a precarious position, for the
following reasons:
Primary Concerns:
Retail store expansion. Presumably in an attempt to find the next “hit” product,
Crocs expanded from 25 product models in 2006 to 230 in 2009. The Company’s
stated rationale for the rapid store expansion is the ability to “merchandise the full
breadth and depth of [its] product line.”39 In order to accommodate this strategy,
Crocs expanded its U.S. company-owned and managed retail stores from 25 in 2007
to over 100 North American stores today. As a result Crocs spent approximately
$60 million in rent in 2009, representing 10% of sales, and its SG&A/Sales is
significantly above its competitors (48.3% TTM, versus 23.8% for Deckers, 28.3%
for Wolverine Worldwide, 32.1% for Nike, 38.2% for Skechers and 42.4% for
Heelys).40
One example of Crocs’ difficulty in executing its retail expansion program is the
retail space at 143 Spring Street in New York, NY, for which the Company entered
a 20 year lease agreement in July 2006. Per the Company’s 2006 10-Q, a portion of
38 10K, page 15 39 10K, page 44 40 Capital IQ, 4.25.10
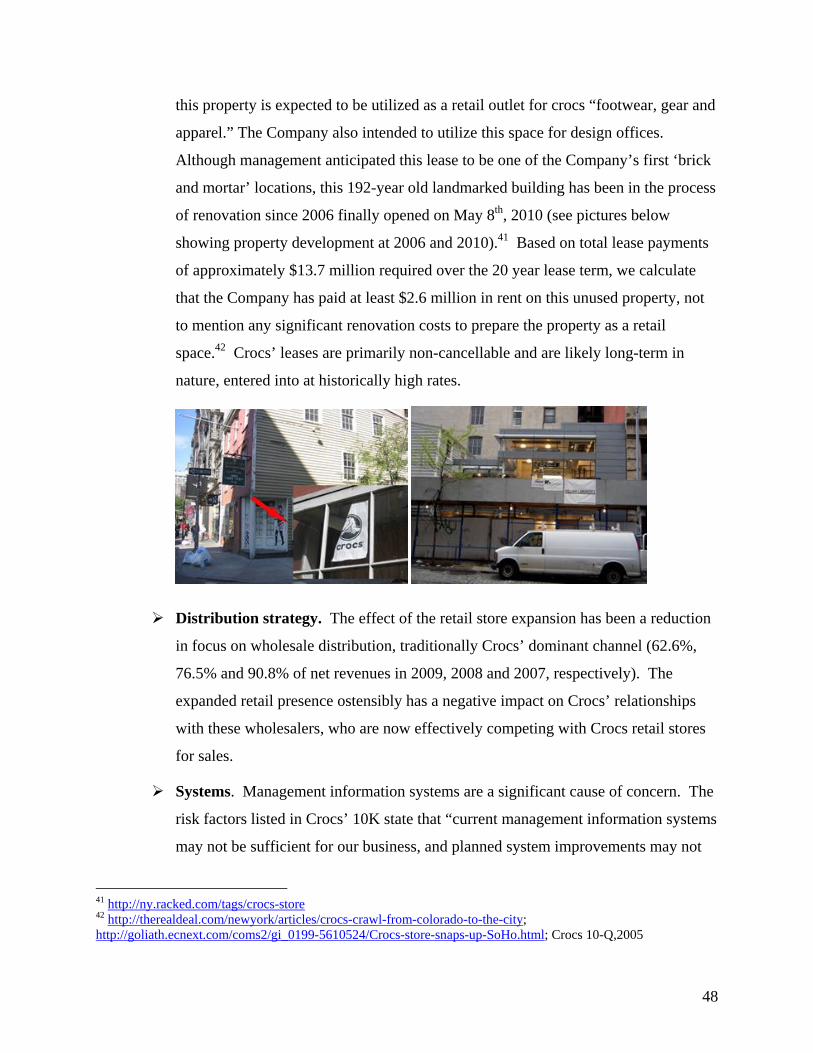
48
this property is expected to be utilized as a retail outlet for crocs “footwear, gear and
apparel.” The Company also intended to utilize this space for design offices.
Although management anticipated this lease to be one of the Company’s first ‘brick
and mortar’ locations, this 192-year old landmarked building has been in the process
of renovation since 2006 finally opened on May 8th, 2010 (see pictures below
showing property development at 2006 and 2010).41 Based on total lease payments
of approximately $13.7 million required over the 20 year lease term, we calculate
that the Company has paid at least $2.6 million in rent on this unused property, not
to mention any significant renovation costs to prepare the property as a retail
space.42 Crocs’ leases are primarily non-cancellable and are likely long-term in
nature, entered into at historically high rates.
Distribution strategy. The effect of the retail store expansion has been a reduction
in focus on wholesale distribution, traditionally Crocs’ dominant channel (62.6%,
76.5% and 90.8% of net revenues in 2009, 2008 and 2007, respectively). The
expanded retail presence ostensibly has a negative impact on Crocs’ relationships
with these wholesalers, who are now effectively competing with Crocs retail stores
for sales.
Systems. Management information systems are a significant cause of concern. The
risk factors listed in Crocs’ 10K state that “current management information systems
may not be sufficient for our business, and planned system improvements may not
41 http://ny.racked.com/tags/crocs-store 42 http://therealdeal.com/newyork/articles/crocs-crawl-from-colorado-to-the-city; http://goliath.ecnext.com/coms2/gi_0199-5610524/Crocs-store-snaps-up-SoHo.html; Crocs 10-Q,2005
49
be successfully implemented on a timely basis or be sufficient for our business” and
for “certain business planning, finance and accounting functions, we still rely on
manual processes that are difficult to control and are subject to human error.”43 “As
a consequence, we may have to disclose in periodic reports we file with the SEC any
material weaknesses in our system of internal controls.44
Counterfeiting. Despite recent successes in legal battles with counterfeiters, the
relative simplicity of the Crocs shoe design makes it an ongoing target. This is a
particular concern for Crocs’ international expansion efforts; any counterfeiting that
occurs in international markets will directly impact authentic Crocs sales. Crocs
may be forced to engage in continuous, costly and distracting legal action to protect
its interests. Unfortunately, even U.S. retailers may be susceptible to Crocs “knock-
offs”; the Company accused Costco of selling unauthorized Crocs to customers in
2008.45 Skechers also settled a patent infringement suit with Crocs in 2008.46
Secondary Concerns:
Senior management. The recent senior management turnover is a significant
concern. Duerden’s reputation as a short term turnaround specialist makes his
departure after only one year more understandable.47 A more cynical view of the
abrupt announcement (Duerden resigned just days after the Company released its
2009 10K) suggests that he believed additional restructuring was necessary but that
other senior managers forced him out. Also, shareholder lawsuits, while possibly
spurious, may indicate a culture of self-interested management.48 In addition, the
concerns mentioned elsewhere (failed acquisitions, inadequate systems, slow
43 10K page 19 44 10K page 25 45 "We have discovered instances where we believe our products were being sold indirectly to Costco and we promptly terminated those relationships upon learning of that behavior," Snyder conceded. https://www.capitaliq.com/CIQDotNet/News/ExternalArticle.aspx?newsItemId=34201205 46 Crocs and Skechers settle patent suit. http://www.reuters.com/article/idUSN0331678820081203 47 Duerden steps down as Crocs CEO; McCarvel fills his shoes. Ed Sealover Denver Business Journal. 48 10K, pages 30-31 “defendants made false and misleading public statements about the Company and its business and prospects and that, as a result, the market price of the Company's stock was artificially inflated.” Also “claims that certain current and former officers and directors traded in the Company's stock on the basis of material non- public information.”
50
product development timelines) combine to suggest a lack of effective managerial
oversight.
Manufacturing. Compared to its peers, Crocs manufactures a high percentage of its
footwear in company owned facilities (27% vs. 7% for Wolverine Worldwide and
0% each for Deckers, Nike, Skechers and Heelys).49 While having company-owned
manufacturing has advantages (oversight of processes, insight into best practices,
ability to meet immediate demand needs), it also implies a higher COS which may
not be sustainable.
Product development timeline.50 Crocs’ product development timeline is a
staggering 6-9 months from concept to full production; add shipping and
merchandising to that timeline and it likely takes Crocs well nearly 12 months to
bring a new style to market.
Supplier power. There are only two manufacturers of the elastomer resins used in
the Croslite resin. These two manufacturers have a degree of pricing power, and
Crocs has not sufficiently addressed its response to this risk in its public documents.
Other Concerns: Other concerns include foreign currency exchange rate risk, the
seeming lack of patents or other enforceable design protection, cash locked up in foreign
subsidiaries, integration (and selection of) acquisitions, and the effect of returns /
markdowns / “outlet” stores on the brand.
49 Respective Company 10Ks 50 10K page 21, “For example, once we begin to design a new footwear model, it can take six to nine months to progress to full production because of the need to fabricate new molds and to implement modified production tooling and revised manufacturing techniques.”
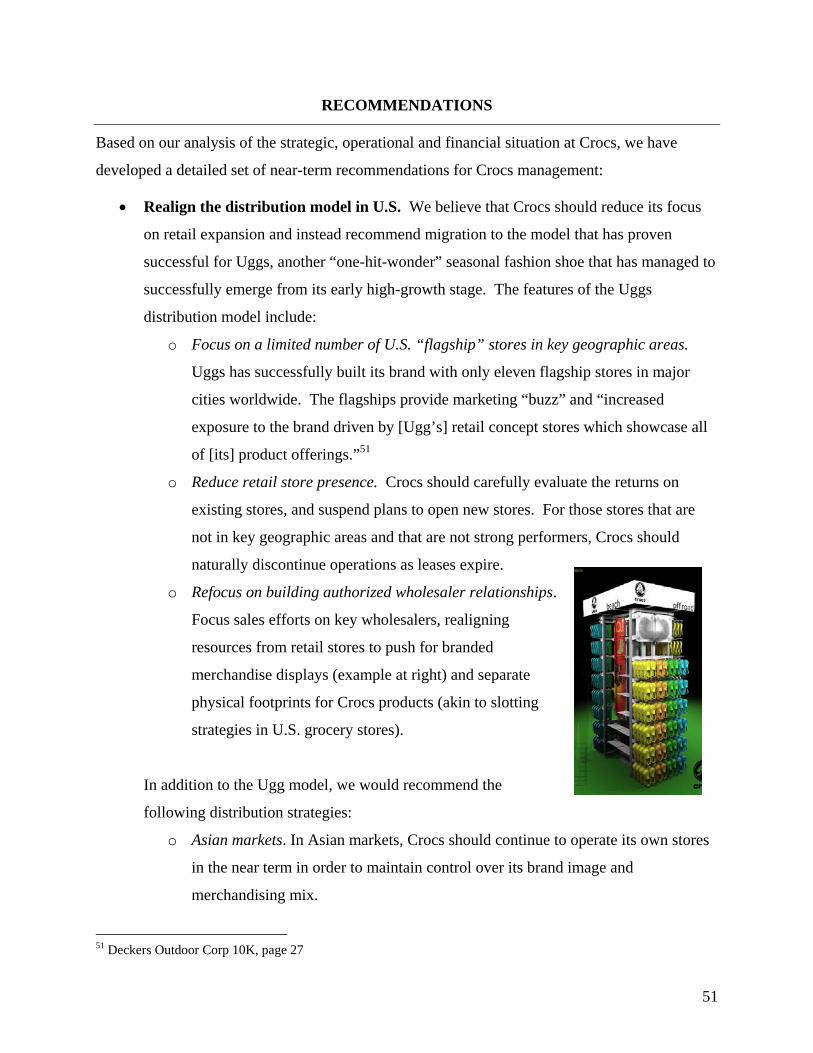
51
RECOMMENDATIONS
Based on our analysis of the strategic, operational and financial situation at Crocs, we have
developed a detailed set of near-term recommendations for Crocs management:
Realign the distribution model in U.S. We believe that Crocs should reduce its focus
on retail expansion and instead recommend migration to the model that has proven
successful for Uggs, another “one-hit-wonder” seasonal fashion shoe that has managed to
successfully emerge from its early high-growth stage. The features of the Uggs
distribution model include:
o Focus on a limited number of U.S. “flagship” stores in key geographic areas.
Uggs has successfully built its brand with only eleven flagship stores in major
cities worldwide. The flagships provide marketing “buzz” and “increased
exposure to the brand driven by [Ugg’s] retail concept stores which showcase all
of [its] product offerings.”51
o Reduce retail store presence. Crocs should carefully evaluate the returns on
existing stores, and suspend plans to open new stores. For those stores that are
not in key geographic areas and that are not strong performers, Crocs should
naturally discontinue operations as leases expire.
o Refocus on building authorized wholesaler relationships.
Focus sales efforts on key wholesalers, realigning
resources from retail stores to push for branded
merchandise displays (example at right) and separate
physical footprints for Crocs products (akin to slotting
strategies in U.S. grocery stores).
In addition to the Ugg model, we would recommend the
following distribution strategies:
o Asian markets. In Asian markets, Crocs should continue to operate its own stores
in the near term in order to maintain control over its brand image and
merchandising mix.
51 Deckers Outdoor Corp 10K, page 27
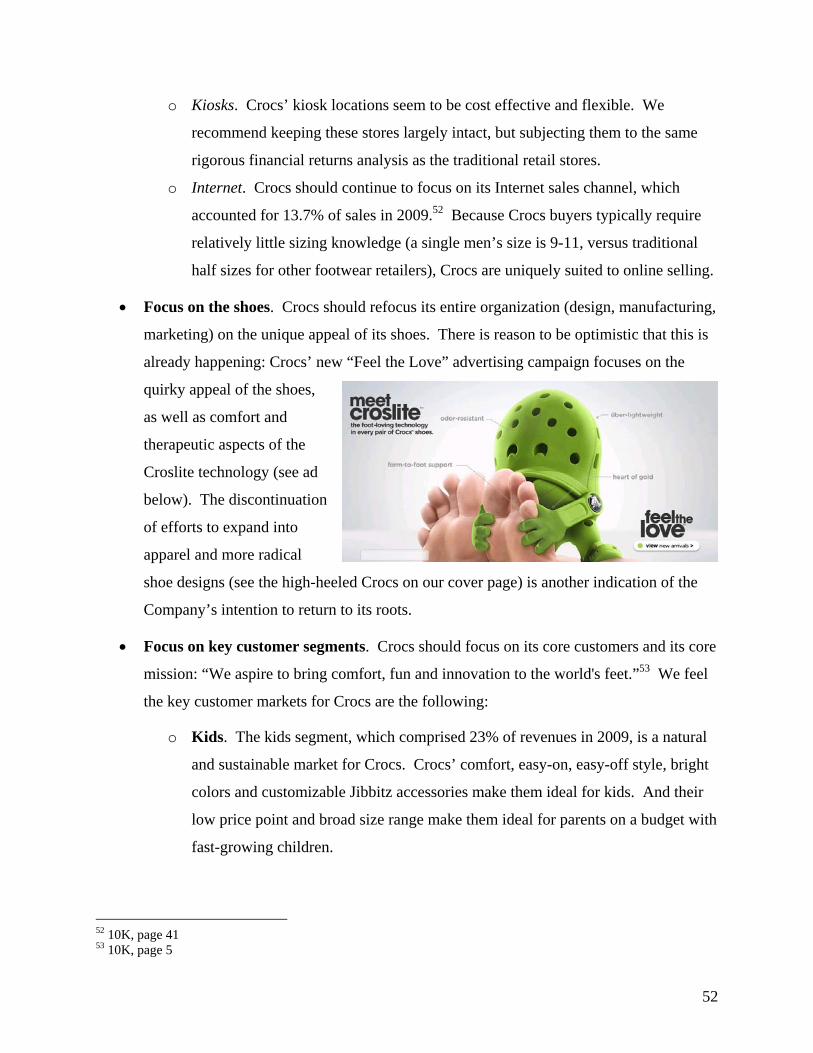
52
o Kiosks. Crocs’ kiosk locations seem to be cost effective and flexible. We
recommend keeping these stores largely intact, but subjecting them to the same
rigorous financial returns analysis as the traditional retail stores.
o Internet. Crocs should continue to focus on its Internet sales channel, which
accounted for 13.7% of sales in 2009.52 Because Crocs buyers typically require
relatively little sizing knowledge (a single men’s size is 9-11, versus traditional
half sizes for other footwear retailers), Crocs are uniquely suited to online selling.
Focus on the shoes. Crocs should refocus its entire organization (design, manufacturing,
marketing) on the unique appeal of its shoes. There is reason to be optimistic that this is
already happening: Crocs’ new “Feel the Love” advertising campaign focuses on the
quirky appeal of the shoes,
as well as comfort and
therapeutic aspects of the
Croslite technology (see ad
below). The discontinuation
of efforts to expand into
apparel and more radical
shoe designs (see the high-heeled Crocs on our cover page) is another indication of the
Company’s intention to return to its roots.
Focus on key customer segments. Crocs should focus on its core customers and its core
mission: “We aspire to bring comfort, fun and innovation to the world's feet.”53 We feel
the key customer markets for Crocs are the following:
o Kids. The kids segment, which comprised 23% of revenues in 2009, is a natural
and sustainable market for Crocs. Crocs’ comfort, easy-on, easy-off style, bright
colors and customizable Jibbitz accessories make them ideal for kids. And their
low price point and broad size range make them ideal for parents on a budget with
fast-growing children.
52 10K, page 41 53 10K, page 5
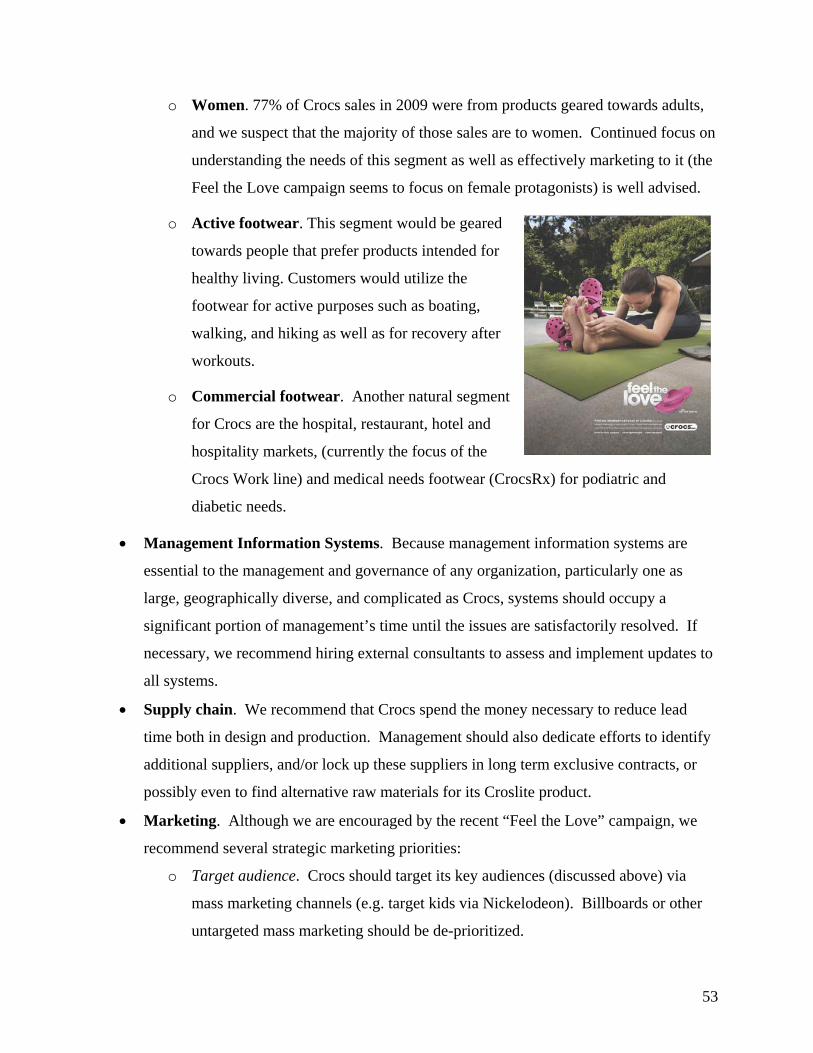
53
o Women. 77% of Crocs sales in 2009 were from products geared towards adults,
and we suspect that the majority of those sales are to women. Continued focus on
understanding the needs of this segment as well as effectively marketing to it (the
Feel the Love campaign seems to focus on female protagonists) is well advised.
o Active footwear. This segment would be geared
towards people that prefer products intended for
healthy living. Customers would utilize the
footwear for active purposes such as boating,
walking, and hiking as well as for recovery after
workouts.
o Commercial footwear. Another natural segment
for Crocs are the hospital, restaurant, hotel and
hospitality markets, (currently the focus of the
Crocs Work line) and medical needs footwear (CrocsRx) for podiatric and
diabetic needs.
Management Information Systems. Because management information systems are
essential to the management and governance of any organization, particularly one as
large, geographically diverse, and complicated as Crocs, systems should occupy a
significant portion of management’s time until the issues are satisfactorily resolved. If
necessary, we recommend hiring external consultants to assess and implement updates to
all systems.
Supply chain. We recommend that Crocs spend the money necessary to reduce lead
time both in design and production. Management should also dedicate efforts to identify
additional suppliers, and/or lock up these suppliers in long term exclusive contracts, or
possibly even to find alternative raw materials for its Croslite product.
Marketing. Although we are encouraged by the recent “Feel the Love” campaign, we
recommend several strategic marketing priorities:
o Target audience. Crocs should target its key audiences (discussed above) via
mass marketing channels (e.g. target kids via Nickelodeon). Billboards or other
untargeted mass marketing should be de-prioritized.
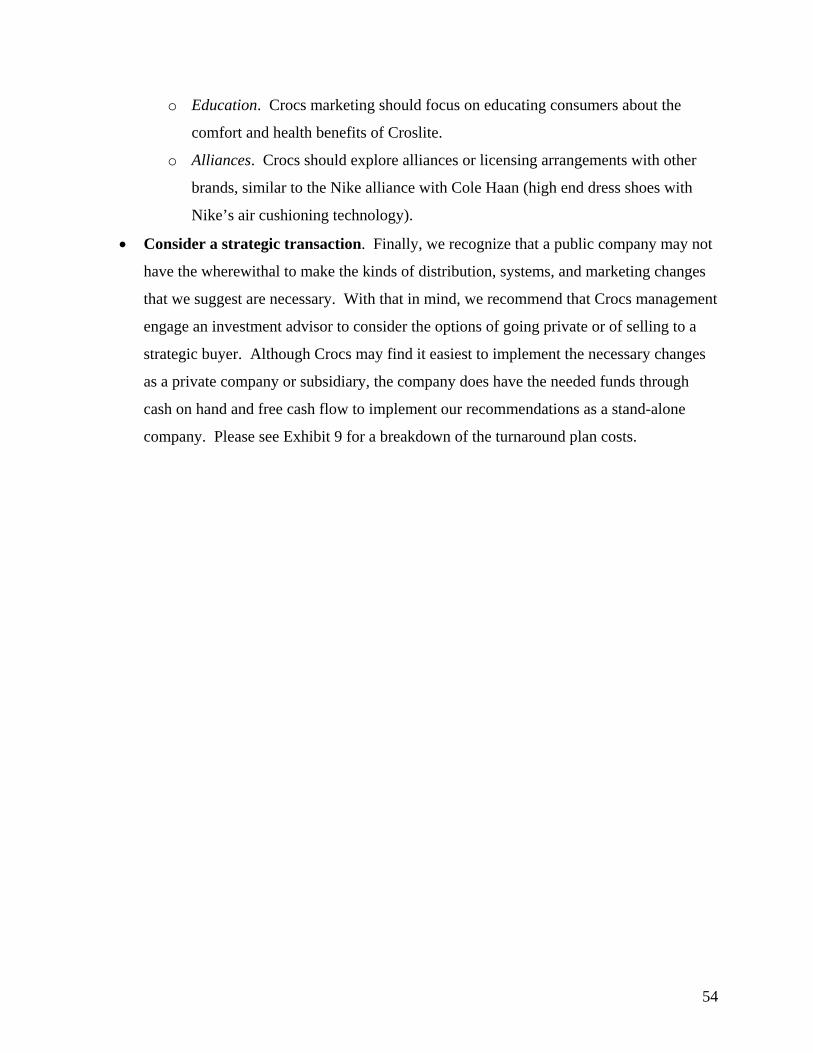
54
o Education. Crocs marketing should focus on educating consumers about the
comfort and health benefits of Croslite.
o Alliances. Crocs should explore alliances or licensing arrangements with other
brands, similar to the Nike alliance with Cole Haan (high end dress shoes with
Nike’s air cushioning technology).
Consider a strategic transaction. Finally, we recognize that a public company may not
have the wherewithal to make the kinds of distribution, systems, and marketing changes
that we suggest are necessary. With that in mind, we recommend that Crocs management
engage an investment advisor to consider the options of going private or of selling to a
strategic buyer. Although Crocs may find it easiest to implement the necessary changes
as a private company or subsidiary, the company does have the needed funds through
cash on hand and free cash flow to implement our recommendations as a stand-alone
company. Please see Exhibit 9 for a breakdown of the turnaround plan costs.
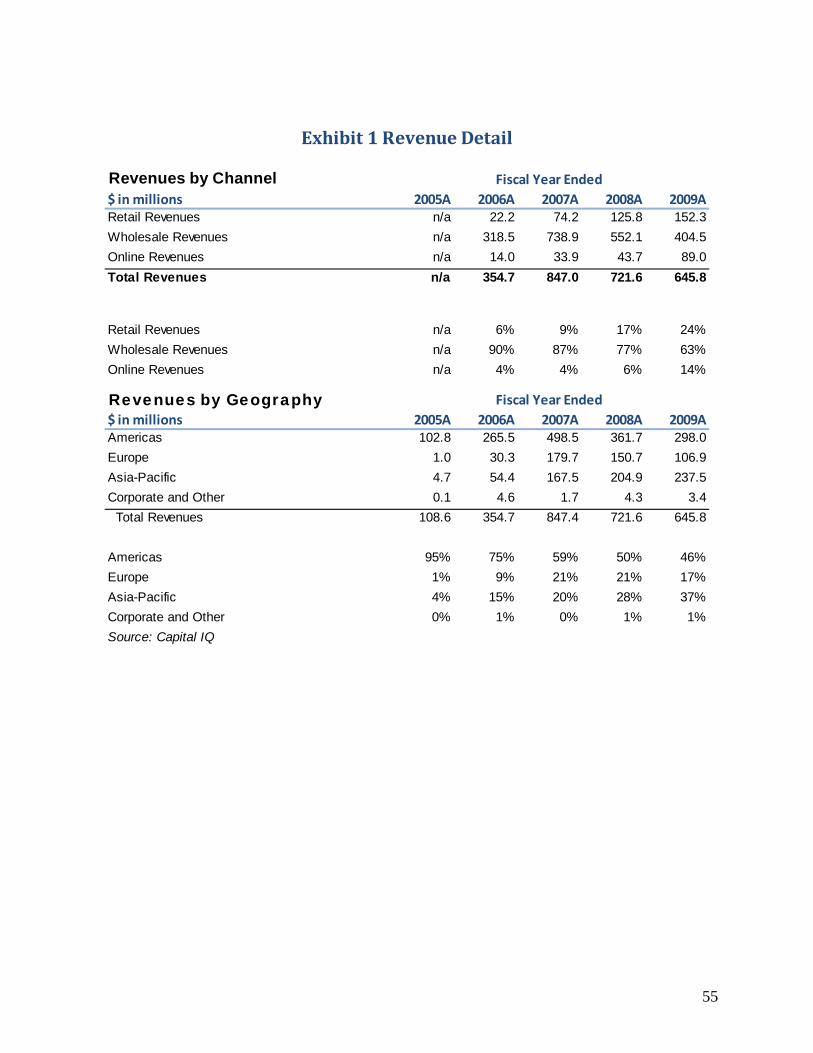
55
Revenues by Channel$ in millions 2005A 2006A 2007A 2008A 2009ARetail Revenues n/a 22.2 74.2 125.8 152.3
Wholesale Revenues n/a 318.5 738.9 552.1 404.5
Online Revenues n/a 14.0 33.9 43.7 89.0
Total Revenues n/a 354.7 847.0 721.6 645.8
Retail Revenues n/a 6% 9% 17% 24%
Wholesale Revenues n/a 90% 87% 77% 63%
Online Revenues n/a 4% 4% 6% 14%
Revenues by Geography$ in millions 2005A 2006A 2007A 2008A 2009AAmericas 102.8 265.5 498.5 361.7 298.0
Europe 1.0 30.3 179.7 150.7 106.9
Asia-Pacific 4.7 54.4 167.5 204.9 237.5
Corporate and Other 0.1 4.6 1.7 4.3 3.4
Total Revenues 108.6 354.7 847.4 721.6 645.8
Americas 95% 75% 59% 50% 46%
Europe 1% 9% 21% 21% 17%
Asia-Pacific 4% 15% 20% 28% 37%
Corporate and Other 0% 1% 0% 1% 1%
Source: Capital IQ
Fiscal Year Ended
Fiscal Year Ended
Exhibit 1 Revenue Detail
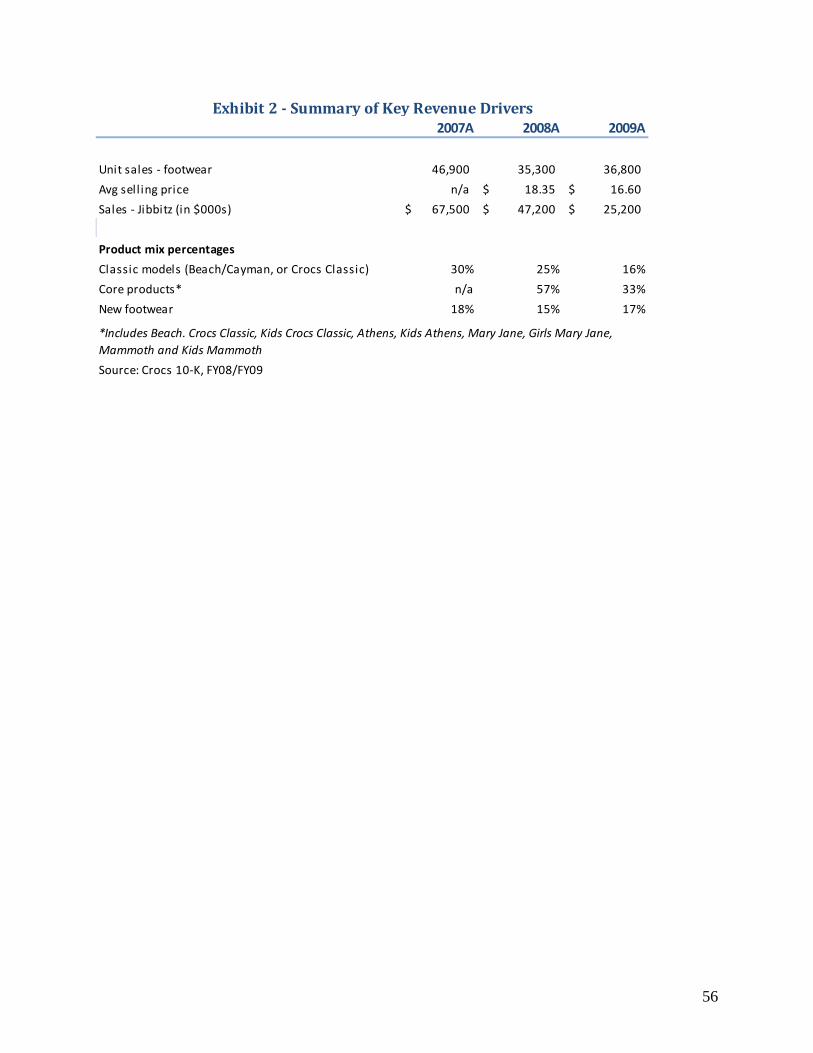
56
2007A 2008A 2009A
Unit sales ‐ footwear 46,900 35,300 36,800
Avg sell ing price n/a 18.35$ 16.60$
Sales ‐ Jibbitz (in $000s) 67,500$ 47,200$ 25,200$
Product mix percentages
Classic models (Beach/Cayman, or Crocs Classic) 30% 25% 16%
Core products* n/a 57% 33%
New footwear 18% 15% 17%
Source: Crocs 10‐K, FY08/FY09
Exhibit 2 ‐ Summary of Key Revenue Drivers
*Includes Beach. Crocs Classic, Kids Crocs Classic, Athens, Kids Athens, Mary Jane, Girls Mary Jane,
Mammoth and Kids Mammoth
57
Exhibit 3
‐ Income Statement
(thousan
ds, e
xcept sh
are an
d per sh
are data)
2005A2006A
2007A2008A
2009A2010E
2011E2012E
2013E2014E
2015E
Reven
ues
$108,581.0
$354,728.0
$847,350.0
$721,589.0
$645,767.0
$692,838.4
$744,571.5
$801,513.9
$864,282.2
$933,570.7
$1,010,161.4
Cost o
f sales
47,773.0
154,158.0
349,701.0
486,722.0
337,720.0
353,347.6
379,731.4
400,756.9
432,141.1
466,785.3
505,080.7
Restru
cturin
g charges
0.0
0.0
0.0
901.0
7,086.0
5,500.0
4,500.0
2,000.0
1,000.0
0.0
0.0
Gross p
rofit
60,808.0
200,570.0
497,649.0
233,966.0
300,961.0
333,990.8
360,340.0
398,756.9
431,141.1
466,785.3
505,080.7
SG&A
33,916.0
105,224.0
268,978.0
341,518.0
311,592.0
293,449.4
305,578.6
328,105.5
353,212.9
380,928.3
411,564.6
Foreign
curren
cy transactio
n lo
sses (gains), n
et0.0
0.0
(10,055.0)
25,438.0
(665.0)
0.0
0.0
0.0
0.0
0.0
0.0
Restru
cturin
g charges
0.0
0.0
0.0
7,664.0
7,623.0
0.0
0.0
0.0
0.0
0.0
0.0
Goodwill im
pairm
ent ch
arges
0.0
0.0
0.0
23,867.0
0.0
0.0
0.0
0.0
0.0
0.0
0.0
Asset im
pairm
ent ch
arges
0.0
0.0
0.0
21,917.0
26,085.0
0.0
0.0
0.0
0.0
0.0
0.0
Charita
ble co
ntrib
utio
ns
0.0
0.0
959.0
1,844.0
7,510.0
0.0
1,861.4
2,003.8
2,160.7
2,333.9
2,525.4
Income (lo
ss) from opera
tions
26,892.0
95,346.0
237,767.0
(188,282.0)
(51,184.0)
40,541.4
52,900.0
68,647.6
75,767.5
83,523.1
90,990.7
Interest exp
ense
611.0
567.0
438.0
1,793.0
1,495.0
(56.0)
(115.5)
(194.7)
(282.3)
(378.0)
(483.2)
Gain on ch
arita
ble co
ntrib
utio
n0.0
0.0
0.0
0.0
(3,163.0)
0.0
0.0
0.0
0.0
0.0
0.0
Other exp
ense (in
come), n
et(8.0)
(1,847.0)
(2,997.0)
(565.0)
(895.0)
0.0
0.0
0.0
0.0
0.0
0.0
Income (lo
ss) befo
re income ta
xes26,289.0
96,626.0
240,326.0
(189,510.0)
(48,621.0)
40,597.4
53,015.5
68,842.3
76,049.9
83,901.1
91,474.0
Income ta
x expense (b
enefit)
9,317.0
32,209.0
72,098.0
(4,434.0)
(6,543.0)
16,238.9
21,206.2
27,536.9
30,419.9
33,560.4
36,589.6
Net in
come (lo
ss)16,972.0
64,417.0
168,228.0
(185,076.0)
(42,078.0)
24,358.4
31,809.3
41,305.4
45,629.9
50,340.7
54,884.4
Divid
end on red
eemable p
referred sh
ares
275.0
33.0
0.0
0.0
0.0
0.0
0.0
0.0
0.0
0.0
0.0
Net in
come (lo
ss) attrib
utable to
common sto
ckholders
$16,697.0
$64,384.0
$168,228.0
($185,076.0)
($42,078.0)
$24,358.4
$31,809.3
$41,305.4
$45,629.9
$50,340.7
$54,884.4
EPS ‐ B
asic
$0.33
$0.86
$2.08
($2.24)
($0.49)
$0.28
$0.37
$0.48
$0.53
$0.59
$0.64
EPS ‐ D
iluted
$0.25
$0.80
$2.00
($2.24)
($0.49)
$0.28
$0.37
$0.48
$0.53
$0.59
$0.64
Wtd Avg C
ommon Sh
ares ‐ B
asic
50,987,154
74,598,400
80,759,077
82,767,540
85,112,461
85,659,581
85,659,581
85,659,581
85,659,581
85,659,581
85,659,581
Wtd Avg C
ommon Sh
ares ‐ D
iluted
67,140,000
80,170,512
84,194,883
82,767,540
85,112,461
85,659,581
85,659,581
85,659,581
85,659,581
85,659,581
85,659,581
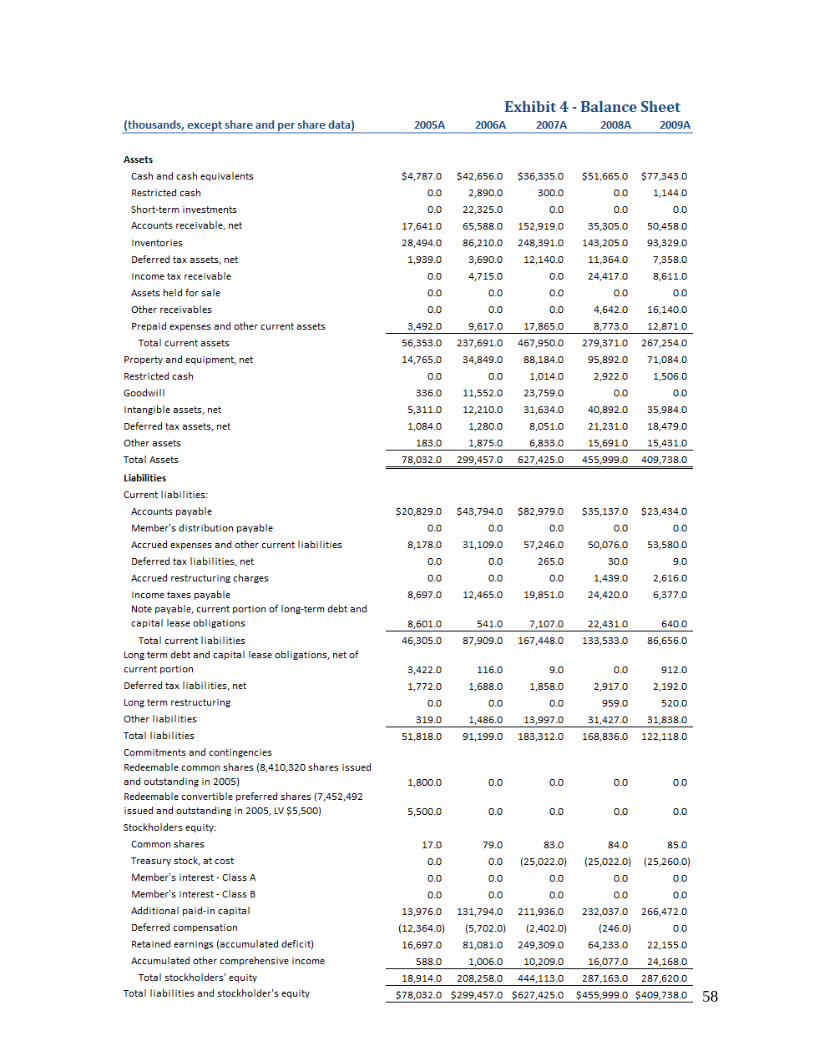
58
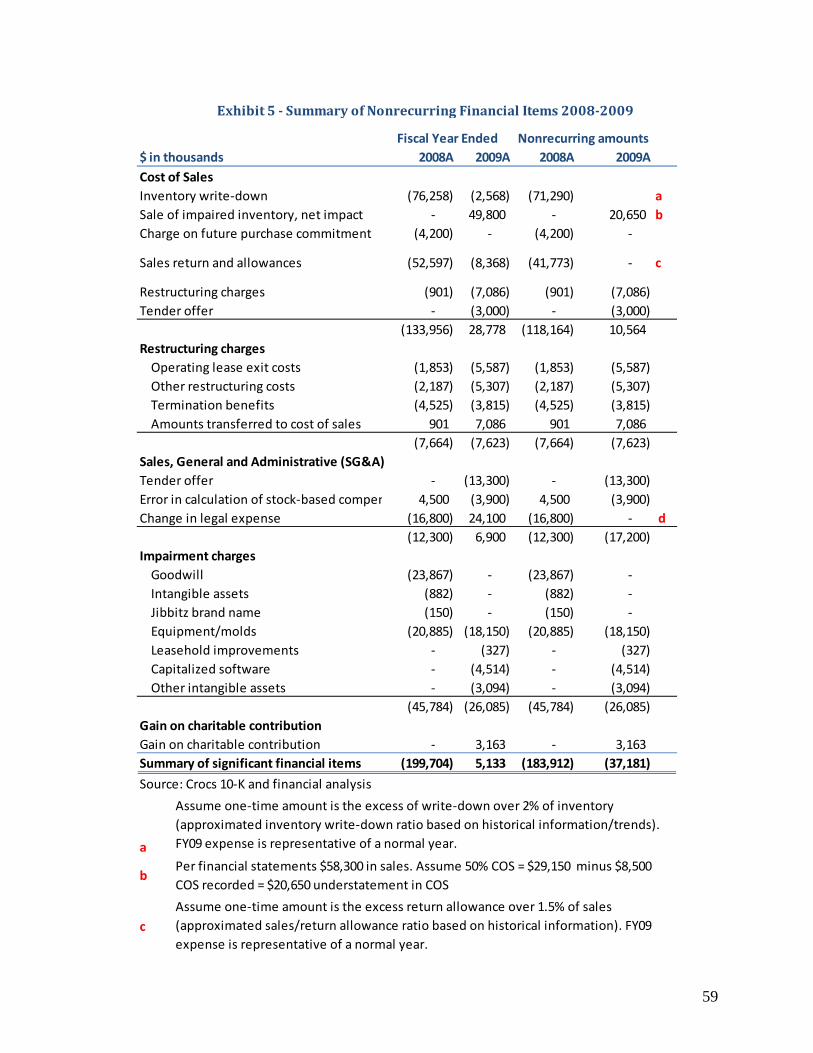
59
$ in thousands 2008A 2009A 2008A 2009A
Cost of Sales
Inventory write‐down (76,258) (2,568) (71,290) a
Sale of impaired inventory, net impact ‐ 49,800 ‐ 20,650 b
Charge on future purchase commitment (4,200) ‐ (4,200) ‐
Sales return and allowances (52,597) (8,368) (41,773) ‐ c
Restructuring charges (901) (7,086) (901) (7,086)
Tender offer ‐ (3,000) ‐ (3,000)
(133,956) 28,778 (118,164) 10,564
Restructuring charges
Operating lease exit costs (1,853) (5,587) (1,853) (5,587)
Other restructuring costs (2,187) (5,307) (2,187) (5,307)
Termination benefits (4,525) (3,815) (4,525) (3,815)
Amounts transferred to cost of sales 901 7,086 901 7,086
(7,664) (7,623) (7,664) (7,623)
Sales, General and Administrative (SG&A)
Tender offer ‐ (13,300) ‐ (13,300)
Error in calculation of stock‐based compen 4,500 (3,900) 4,500 (3,900)
Change in legal expense (16,800) 24,100 (16,800) ‐ d
(12,300) 6,900 (12,300) (17,200)
Impairment charges
Goodwill (23,867) ‐ (23,867) ‐
Intangible assets (882) ‐ (882) ‐
Jibbitz brand name (150) ‐ (150) ‐
Equipment/molds (20,885) (18,150) (20,885) (18,150)
Leasehold improvements ‐ (327) ‐ (327)
Capitalized software ‐ (4,514) ‐ (4,514)
Other intangible assets ‐ (3,094) ‐ (3,094)
(45,784) (26,085) (45,784) (26,085)
Gain on charitable contribution
Gain on charitable contribution ‐ 3,163 ‐ 3,163
Summary of significant financial items (199,704) 5,133 (183,912) (37,181)
Source: Crocs 10‐K and financial analysis
a
b
c
Exhibit 5 ‐ Summary of Nonrecurring Financial Items 2008‐2009
Fiscal Year Ended Nonrecurring amounts
Per financial statements $58,300 in sales. Assume 50% COS = $29,150 minus $8,500
COS recorded = $20,650 understatement in COS
Assume one‐time amount is the excess return allowance over 1.5% of sales
(approximated sales/return allowance ratio based on historical information). FY09
expense is representative of a normal year.
Assume one‐time amount is the excess of write‐down over 2% of inventory
(approximated inventory write‐down ratio based on historical information/trends).
FY09 expense is representative of a normal year.
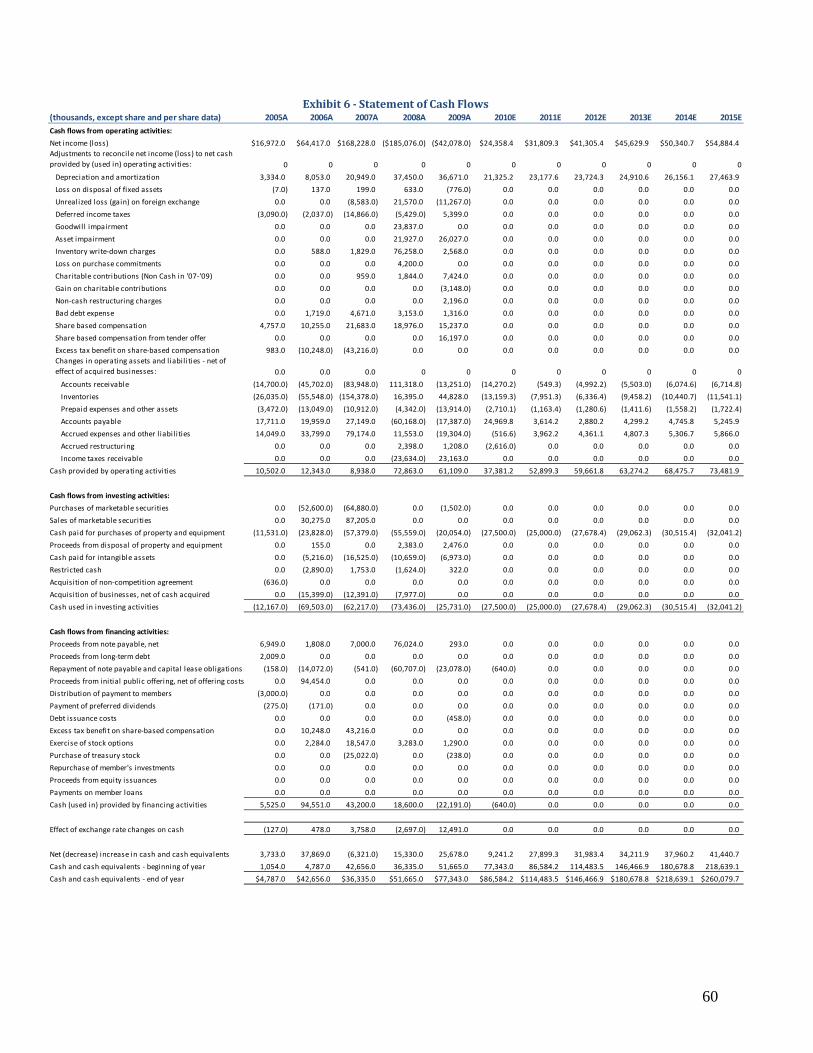
60
Exhibit 6 ‐ Statement of Cash Flows(thousands, except share and per share data) 2005A 2006A 2007A 2008A 2009A 2010E 2011E 2012E 2013E 2014E 2015E
Cash flows from operating activities:
Net income (loss) $16,972.0 $64,417.0 $168,228.0 ($185,076.0) ($42,078.0) $24,358.4 $31,809.3 $41,305.4 $45,629.9 $50,340.7 $54,884.4
Adjustments to reconcile net income (loss) to net cash
provided by (used in) operating activities: 0 0 0 0 0 0 0 0 0 0 0
Depreciation and amortization 3,334.0 8,053.0 20,949.0 37,450.0 36,671.0 21,325.2 23,177.6 23,724.3 24,910.6 26,156.1 27,463.9
Loss on disposal of fixed assets (7.0) 137.0 199.0 633.0 (776.0) 0.0 0.0 0.0 0.0 0.0 0.0
Unrealized loss (gain) on foreign exchange 0.0 0.0 (8,583.0) 21,570.0 (11,267.0) 0.0 0.0 0.0 0.0 0.0 0.0
Deferred income taxes (3,090.0) (2,037.0) (14,866.0) (5,429.0) 5,399.0 0.0 0.0 0.0 0.0 0.0 0.0
Goodwill impairment 0.0 0.0 0.0 23,837.0 0.0 0.0 0.0 0.0 0.0 0.0 0.0
Asset impairment 0.0 0.0 0.0 21,927.0 26,027.0 0.0 0.0 0.0 0.0 0.0 0.0
Inventory write‐down charges 0.0 588.0 1,829.0 76,258.0 2,568.0 0.0 0.0 0.0 0.0 0.0 0.0
Loss on purchase commitments 0.0 0.0 0.0 4,200.0 0.0 0.0 0.0 0.0 0.0 0.0 0.0
Charitable contributions (Non Cash in '07‐'09) 0.0 0.0 959.0 1,844.0 7,424.0 0.0 0.0 0.0 0.0 0.0 0.0
Gain on charitable contributions 0.0 0.0 0.0 0.0 (3,148.0) 0.0 0.0 0.0 0.0 0.0 0.0
Non‐cash restructuring charges 0.0 0.0 0.0 0.0 2,196.0 0.0 0.0 0.0 0.0 0.0 0.0
Bad debt expense 0.0 1,719.0 4,671.0 3,153.0 1,316.0 0.0 0.0 0.0 0.0 0.0 0.0
Share based compensation 4,757.0 10,255.0 21,683.0 18,976.0 15,237.0 0.0 0.0 0.0 0.0 0.0 0.0
Share based compensation from tender offer 0.0 0.0 0.0 0.0 16,197.0 0.0 0.0 0.0 0.0 0.0 0.0
Excess tax benefit on share‐based compensation 983.0 (10,248.0) (43,216.0) 0.0 0.0 0.0 0.0 0.0 0.0 0.0 0.0
Changes in operating assets and l iabil ities ‐ net of
effect of acquired businesses: 0.0 0.0 0.0 0 0 0 0 0 0 0 0
Accounts receivable (14,700.0) (45,702.0) (83,948.0) 111,318.0 (13,251.0) (14,270.2) (549.3) (4,992.2) (5,503.0) (6,074.6) (6,714.8)
Inventories (26,035.0) (55,548.0) (154,378.0) 16,395.0 44,828.0 (13,159.3) (7,951.3) (6,336.4) (9,458.2) (10,440.7) (11,541.1)
Prepaid expenses and other assets (3,472.0) (13,049.0) (10,912.0) (4,342.0) (13,914.0) (2,710.1) (1,163.4) (1,280.6) (1,411.6) (1,558.2) (1,722.4)
Accounts payable 17,711.0 19,959.0 27,149.0 (60,168.0) (17,387.0) 24,969.8 3,614.2 2,880.2 4,299.2 4,745.8 5,245.9
Accrued expenses and other l iabil ities 14,049.0 33,799.0 79,174.0 11,553.0 (19,304.0) (516.6) 3,962.2 4,361.1 4,807.3 5,306.7 5,866.0
Accrued restructuring 0.0 0.0 0.0 2,398.0 1,208.0 (2,616.0) 0.0 0.0 0.0 0.0 0.0
Income taxes receivable 0.0 0.0 0.0 (23,634.0) 23,163.0 0.0 0.0 0.0 0.0 0.0 0.0
Cash provided by operating activities 10,502.0 12,343.0 8,938.0 72,863.0 61,109.0 37,381.2 52,899.3 59,661.8 63,274.2 68,475.7 73,481.9
Cash flows from investing activities:
Purchases of marketable securities 0.0 (52,600.0) (64,880.0) 0.0 (1,502.0) 0.0 0.0 0.0 0.0 0.0 0.0
Sales of marketable securities 0.0 30,275.0 87,205.0 0.0 0.0 0.0 0.0 0.0 0.0 0.0 0.0
Cash paid for purchases of property and equipment (11,531.0) (23,828.0) (57,379.0) (55,559.0) (20,054.0) (27,500.0) (25,000.0) (27,678.4) (29,062.3) (30,515.4) (32,041.2)
Proceeds from disposal of property and equipment 0.0 155.0 0.0 2,383.0 2,476.0 0.0 0.0 0.0 0.0 0.0 0.0
Cash paid for intangible assets 0.0 (5,216.0) (16,525.0) (10,659.0) (6,973.0) 0.0 0.0 0.0 0.0 0.0 0.0
Restricted cash 0.0 (2,890.0) 1,753.0 (1,624.0) 322.0 0.0 0.0 0.0 0.0 0.0 0.0
Acquisition of non‐competition agreement (636.0) 0.0 0.0 0.0 0.0 0.0 0.0 0.0 0.0 0.0 0.0
Acquisition of businesses, net of cash acquired 0.0 (15,399.0) (12,391.0) (7,977.0) 0.0 0.0 0.0 0.0 0.0 0.0 0.0
Cash used in investing activities (12,167.0) (69,503.0) (62,217.0) (73,436.0) (25,731.0) (27,500.0) (25,000.0) (27,678.4) (29,062.3) (30,515.4) (32,041.2)
Cash flows from financing activities:
Proceeds from note payable, net 6,949.0 1,808.0 7,000.0 76,024.0 293.0 0.0 0.0 0.0 0.0 0.0 0.0
Proceeds from long‐term debt 2,009.0 0.0 0.0 0.0 0.0 0.0 0.0 0.0 0.0 0.0 0.0
Repayment of note payable and capital lease obligations (158.0) (14,072.0) (541.0) (60,707.0) (23,078.0) (640.0) 0.0 0.0 0.0 0.0 0.0
Proceeds from initial public offering, net of offering costs 0.0 94,454.0 0.0 0.0 0.0 0.0 0.0 0.0 0.0 0.0 0.0
Distribution of payment to members (3,000.0) 0.0 0.0 0.0 0.0 0.0 0.0 0.0 0.0 0.0 0.0
Payment of preferred dividends (275.0) (171.0) 0.0 0.0 0.0 0.0 0.0 0.0 0.0 0.0 0.0
Debt issuance costs 0.0 0.0 0.0 0.0 (458.0) 0.0 0.0 0.0 0.0 0.0 0.0
Excess tax benefit on share‐based compensation 0.0 10,248.0 43,216.0 0.0 0.0 0.0 0.0 0.0 0.0 0.0 0.0
Exercise of stock options 0.0 2,284.0 18,547.0 3,283.0 1,290.0 0.0 0.0 0.0 0.0 0.0 0.0
Purchase of treasury stock 0.0 0.0 (25,022.0) 0.0 (238.0) 0.0 0.0 0.0 0.0 0.0 0.0
Repurchase of member's investments 0.0 0.0 0.0 0.0 0.0 0.0 0.0 0.0 0.0 0.0 0.0
Proceeds from equity issuances 0.0 0.0 0.0 0.0 0.0 0.0 0.0 0.0 0.0 0.0 0.0
Payments on member loans 0.0 0.0 0.0 0.0 0.0 0.0 0.0 0.0 0.0 0.0 0.0
Cash (used in) provided by financing activities 5,525.0 94,551.0 43,200.0 18,600.0 (22,191.0) (640.0) 0.0 0.0 0.0 0.0 0.0
Effect of exchange rate changes on cash (127.0) 478.0 3,758.0 (2,697.0) 12,491.0 0.0 0.0 0.0 0.0 0.0 0.0
Net (decrease) increase in cash and cash equivalents 3,733.0 37,869.0 (6,321.0) 15,330.0 25,678.0 9,241.2 27,899.3 31,983.4 34,211.9 37,960.2 41,440.7
Cash and cash equivalents ‐ beginning of year 1,054.0 4,787.0 42,656.0 36,335.0 51,665.0 77,343.0 86,584.2 114,483.5 146,466.9 180,678.8 218,639.1
Cash and cash equivalents ‐ end of year $4,787.0 $42,656.0 $36,335.0 $51,665.0 $77,343.0 $86,584.2 $114,483.5 $146,466.9 $180,678.8 $218,639.1 $260,079.7
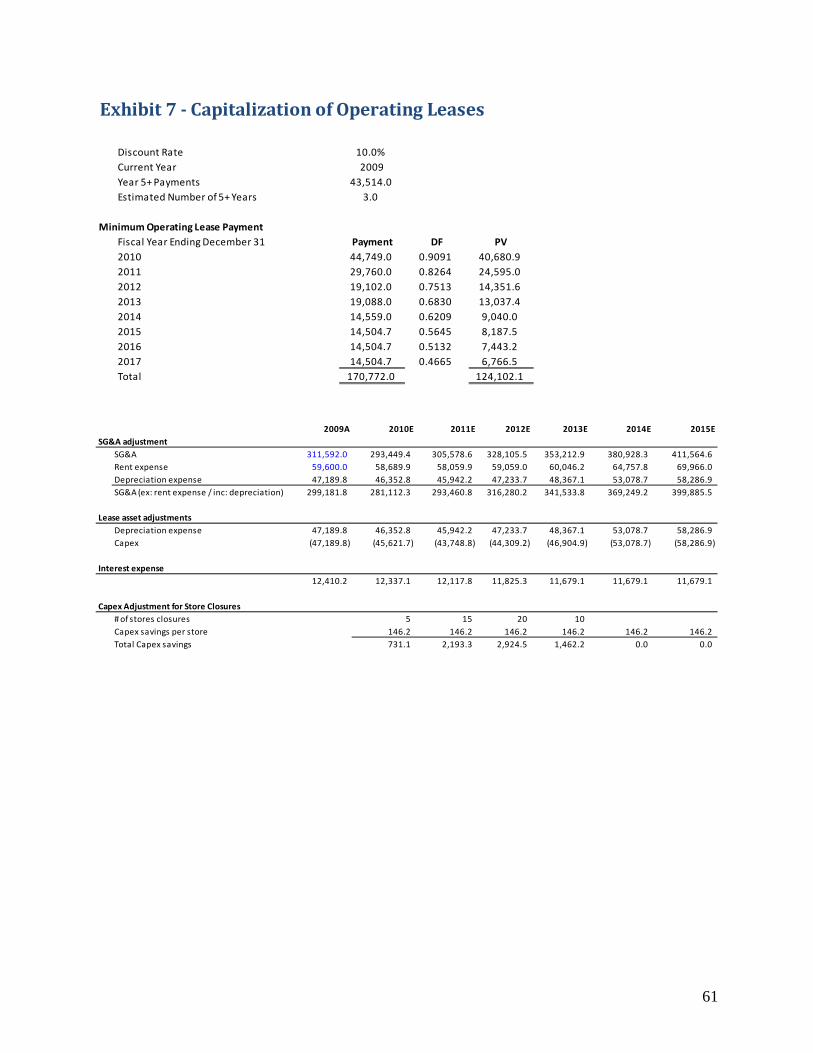
61
Exhibit 7 ‐ Capitalization of Operating Leases
Discount Rate 10.0%
Current Year 2009
Year 5+ Payments 43,514.0
Estimated Number of 5+ Years 3.0
Minimum Operating Lease Payment
Fiscal Year Ending December 31 Payment DF PV
2010 44,749.0 0.9091 40,680.9
2011 29,760.0 0.8264 24,595.0
2012 19,102.0 0.7513 14,351.6
2013 19,088.0 0.6830 13,037.4
2014 14,559.0 0.6209 9,040.0
2015 14,504.7 0.5645 8,187.5
2016 14,504.7 0.5132 7,443.2
2017 14,504.7 0.4665 6,766.5
Total 170,772.0 124,102.1
2009A 2010E 2011E 2012E 2013E 2014E 2015E
SG&A adjustment
SG&A 311,592.0 293,449.4 305,578.6 328,105.5 353,212.9 380,928.3 411,564.6
Rent expense 59,600.0 58,689.9 58,059.9 59,059.0 60,046.2 64,757.8 69,966.0
Depreciation expense 47,189.8 46,352.8 45,942.2 47,233.7 48,367.1 53,078.7 58,286.9
SG&A (ex: rent expense / inc: depreciation) 299,181.8 281,112.3 293,460.8 316,280.2 341,533.8 369,249.2 399,885.5
Lease asset adjustments
Depreciation expense 47,189.8 46,352.8 45,942.2 47,233.7 48,367.1 53,078.7 58,286.9
Capex (47,189.8) (45,621.7) (43,748.8) (44,309.2) (46,904.9) (53,078.7) (58,286.9)
Interest expense
12,410.2 12,337.1 12,117.8 11,825.3 11,679.1 11,679.1 11,679.1
Capex Adjustment for Store Closures
# of stores closures 5 15 20 10
Capex savings per store 146.2 146.2 146.2 146.2 146.2 146.2
Total Capex savings 731.1 2,193.3 2,924.5 1,462.2 0.0 0.0
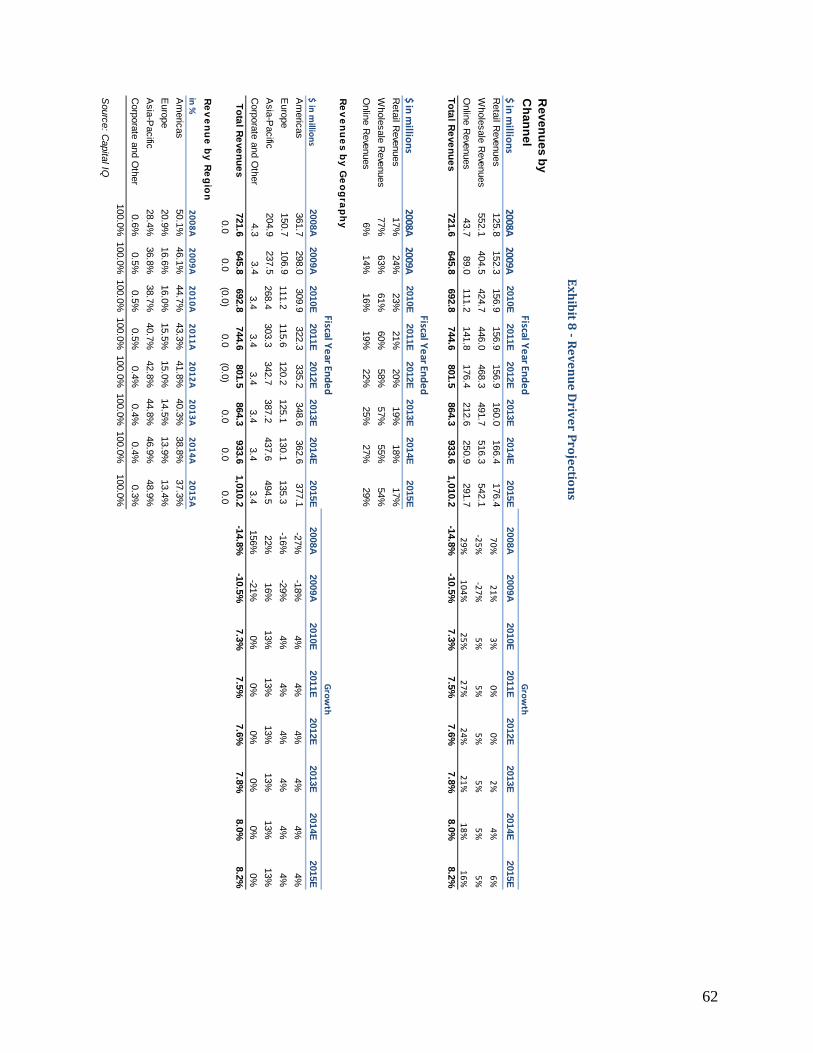
62
Re
ven
ue
s b
y
Ch
an
ne
l
$ in millio
ns
2008A2009A
2010E2011E
2012E2013E
2014E2015E
2008A2009A
2010E2011E
2012E2013E
2014E2015E
Retail R
evenues 125.8
152.3 156.9
156.9 156.9
160.0 166.4
176.4 70%
21%
3%
0%
0%
2%
4%
6%
Wholesale R
evenues 552.1
404.5 424.7
446.0 468.3
491.7 516.3
542.1 ‐25%
‐27%
5%
5%
5%
5%
5%
5%
Online R
evenues 43.7
89.0 111.2
141.8 176.4
212.6 250.9
291.7 29%
104%
25%
27%
24%
21%
18%
16%
To
tal R
eve
nu
es
721.6 645.8
692.8 744.6
801.5 864.3
933.6 1,010.2
-14.8%-10.5%
7.3%7.5%
7.6%7.8%
8.0%8.2%
$ in millio
ns
2008A2009A
2010E2011E
2012E2013E
2014E2015E
Retail R
evenues17%
24%23%
21%20%
19%18%
17%
Wholesale R
evenues77%
63%61%
60%58%
57%55%
54%
Online R
evenues6%
14%16%
19%22%
25%27%
29%
Re
ven
ue
s by
Ge
og
raph
yFiscal Y
ear En
ded
$ in
millio
ns
2008A2009A
2010E2011E
2012E2013E
2014E2015E
2008A2009A
2010E2011E
2012E2013E
2014E2015E
Am
ericas 361.7
298.0 309.9
322.3 335.2
348.6 362.6
377.1 -27%
-18%4%
4%4%
4%4%
4%E
urope 150.7
106.9 111.2
115.6
120.2
125.1
130.1
135.3
-16%
-29%4%
4%4%
4%4%
4%A
sia-Pacific
204.9 237.5
268.4
303.3
342.7
387.2
437.6
494.5
22%16%
13%13%
13%13%
13%13%
Corporate and O
ther 4.3
3.4 3.4
3.4
3.4
3.4
3.4
3.4
156%
-21%0%
0%0%
0%0%
0%
To
tal R
eve
nu
es
721.6 645.8
692.8 744.6
801.5 864.3
933.6 1,010.2
-14.8%-10.5%
7.3%7.5%
7.6%7.8%
8.0%8.2%
0.0
0.0
(0.0)
0.0
(0.0)
0.0
0.0
0.0
Re
ven
ue
by
Reg
ion
in %
2008A
2009A
2010A
2011A
2012A
2013A
2014A
2015A
Am
ericas50.1%
46.1%44.7%
43.3%41.8%
40.3%38.8%
37.3%
Europe
20.9%16.6%
16.0%15.5%
15.0%14.5%
13.9%13.4%
Asia-P
acific28.4%
36.8%38.7%
40.7%42.8%
44.8%46.9%
48.9%
Corporate and O
ther0.6%
0.5%0.5%
0.5%0.4%
0.4%0.4%
0.3%
100.0%100.0%
100.0%100.0%
100.0%100.0%
100.0%100.0%
Source: C
apital IQ
Fiscal Year En
ded
Fiscal Year En
ded
Exhibit 8
‐ Revenue Driver Projectio
ns
Growth
Growth
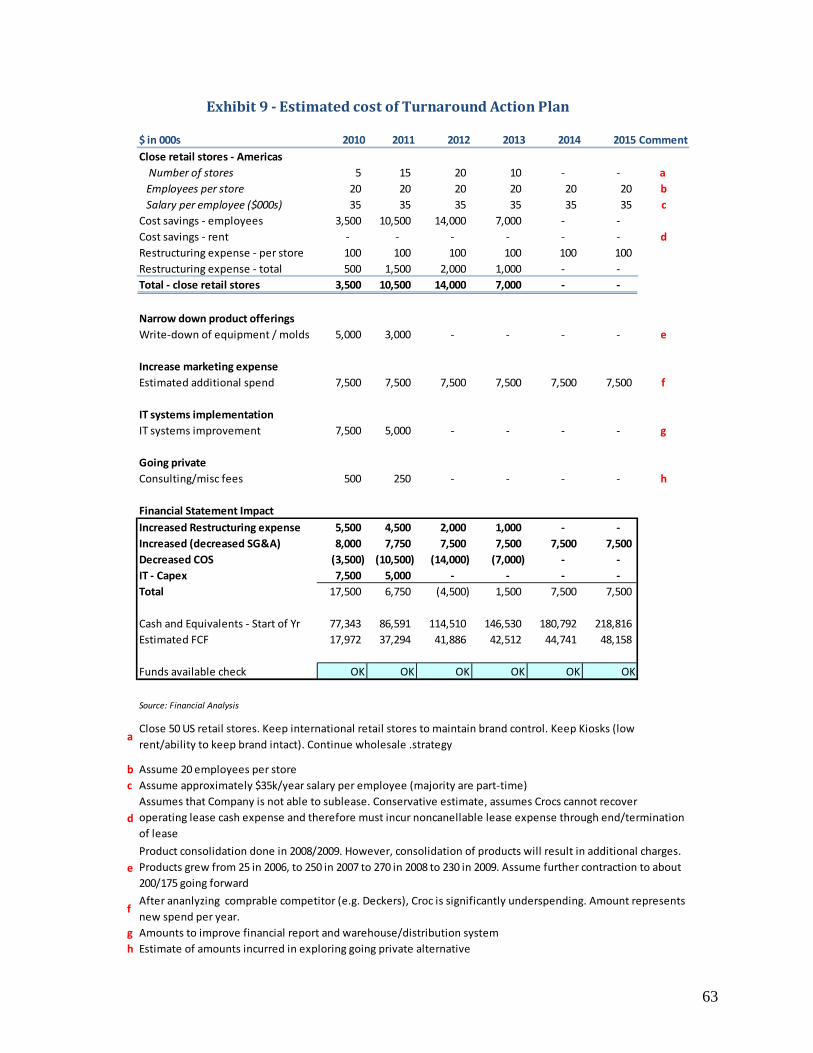
63
$ in 000s 2010 2011 2012 2013 2014 2015 Comment
Close retail stores ‐ Americas
Number of stores 5 15 20 10 ‐ ‐ a
Employees per store 20 20 20 20 20 20 b
Salary per employee ($000s) 35 35 35 35 35 35 c
Cost savings ‐ employees 3,500 10,500 14,000 7,000 ‐ ‐
Cost savings ‐ rent ‐ ‐ ‐ ‐ ‐ ‐ d
Restructuring expense ‐ per store 100 100 100 100 100 100
Restructuring expense ‐ total 500 1,500 2,000 1,000 ‐ ‐
Total ‐ close retail stores 3,500 10,500 14,000 7,000 ‐ ‐
Narrow down product offerings
Write‐down of equipment / molds 5,000 3,000 ‐ ‐ ‐ ‐ e
Increase marketing expense
Estimated additional spend 7,500 7,500 7,500 7,500 7,500 7,500 f
IT systems implementation
IT systems improvement 7,500 5,000 ‐ ‐ ‐ ‐ g
Going private
Consulting/misc fees 500 250 ‐ ‐ ‐ ‐ h
Financial Statement Impact
Increased Restructuring expense 5,500 4,500 2,000 1,000 ‐ ‐
Increased (decreased SG&A) 8,000 7,750 7,500 7,500 7,500 7,500
Decreased COS (3,500) (10,500) (14,000) (7,000) ‐ ‐
IT ‐ Capex 7,500 5,000 ‐ ‐ ‐ ‐
Total 17,500 6,750 (4,500) 1,500 7,500 7,500
Cash and Equivalents ‐ Start of Yr 77,343 86,591 114,510 146,530 180,792 218,816
Estimated FCF 17,972 37,294 41,886 42,512 44,741 48,158
Funds available check OK OK OK OK OK OK
Source: Financial Analysis
a
b Assume 20 employees per store
c Assume approximately $35k/year salary per employee (majority are part‐time)
d
e
f
g
h
Amounts to improve financial report and warehouse/distribution system
Estimate of amounts incurred in exploring going private alternative
Exhibit 9 ‐ Estimated cost of Turnaround Action Plan
Close 50 US retail stores. Keep international retail stores to maintain brand control. Keep Kiosks (low
rent/ability to keep brand intact). Continue wholesale .strategy
Assumes that Company is not able to sublease. Conservative estimate, assumes Crocs cannot recover
operating lease cash expense and therefore must incur noncanellable lease expense through end/termination
of lease
Product consolidation done in 2008/2009. However, consolidation of products will result in additional charges.
Products grew from 25 in 2006, to 250 in 2007 to 270 in 2008 to 230 in 2009. Assume further contraction to about
200/175 going forward
After ananlyzing comprable competitor (e.g. Deckers), Croc is significantly underspending. Amount represents
new spend per year.
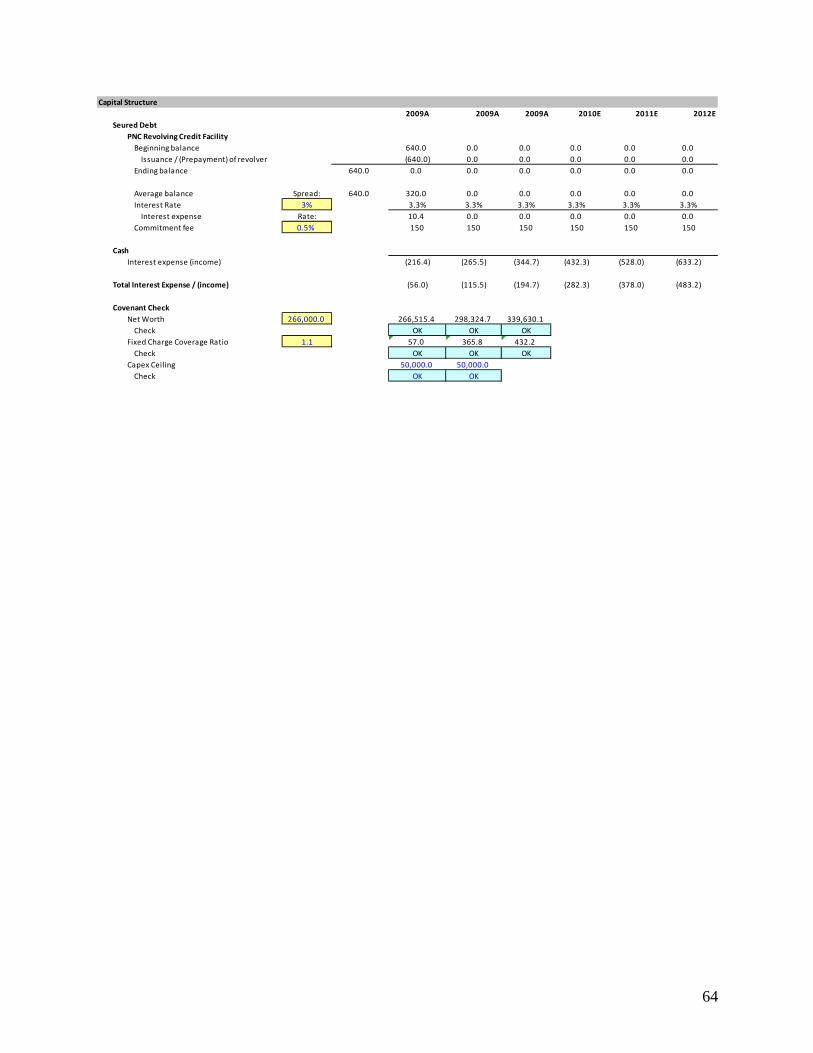
64
Capital Structure
2009A 2009A 2009A 2010E 2011E 2012E
Seured Debt
PNC Revolving Credit Facility
Beginning balance 640.0 0.0 0.0 0.0 0.0 0.0
Issuance / (Prepayment) of revolver (640.0) 0.0 0.0 0.0 0.0 0.0
Ending balance 640.0 0.0 0.0 0.0 0.0 0.0 0.0
Average balance Spread: 640.0 320.0 0.0 0.0 0.0 0.0 0.0
Interest Rate 3% 3.3% 3.3% 3.3% 3.3% 3.3% 3.3%
Interest expense Rate: 10.4 0.0 0.0 0.0 0.0 0.0
Commitment fee 0.5% 150 150 150 150 150 150
Cash
Interest expense (income) (216.4) (265.5) (344.7) (432.3) (528.0) (633.2)
Total Interest Expense / (income) (56.0) (115.5) (194.7) (282.3) (378.0) (483.2)
Covenant Check
Net Worth 266,000.0 266,515.4 298,324.7 339,630.1
Check OK OK OK
Fixed Charge Coverage Ratio 1.1 57.0 365.8 432.2
Check OK OK OK
Capex Ceiling 50,000.0 50,000.0
Check OK OK
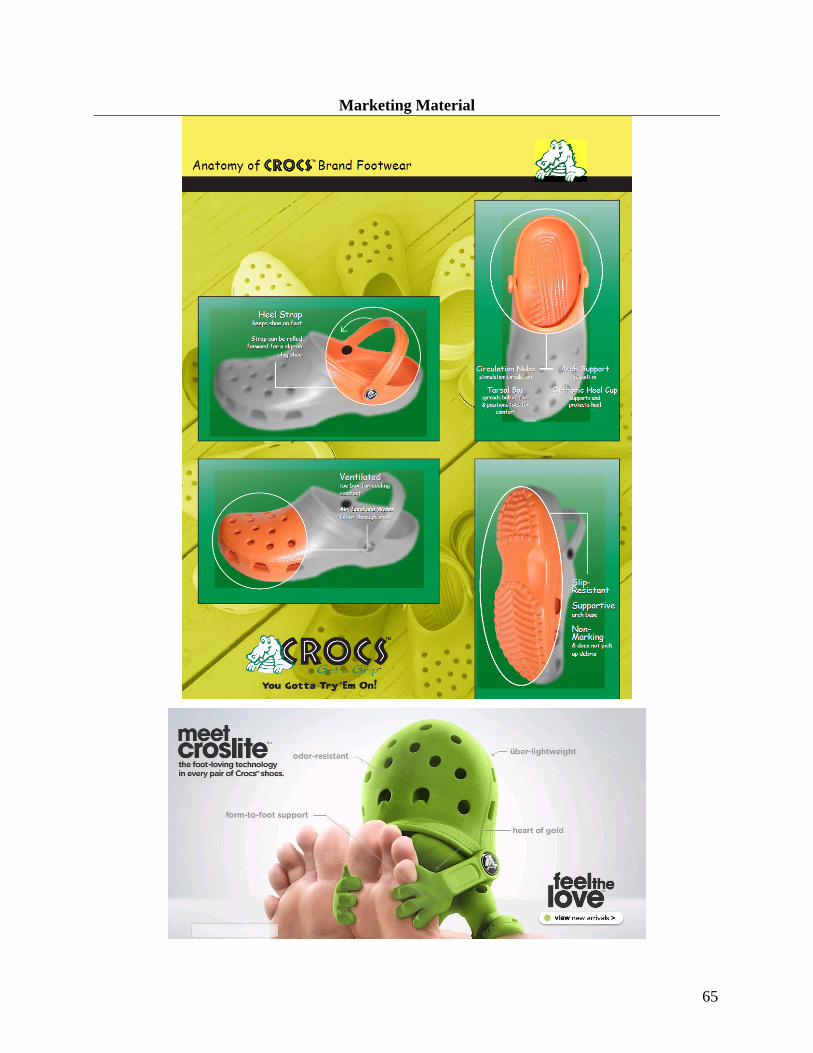
65
Marketing Material
66
Amazon review of Crocs Classic – Most Helpful Favorable Review54
At first I didn't know what to make of this shoe/sandal... it's lightweight, comfortable and "convertible", which is a nice feature that I've never
seen in a sandal before. First, I'll break down the benefits, then give the low-points.
"LIGHTWEIGHT & COMFORTABLE"
This is probably the most attractive feature of the CROC, because it adds to the comfort and makes you feel like you're walking on air. By far the
most comfortable things I've ever worn and I'm a picky shoe person. I have only owned 1 pair of sandals for the past 6 years and have hated every
other sandal I've tried on, so these CROCS are definitely special.
"CONVERTIBLE"
You can turn the "sandal" into a "shoe" simply by pushing forward the strap. In "shoe" mode, it's a tighter more snug fit, so you don't have to
worry about it coming off your feet. In "sandal" mode, it's easy to slip on and off (although it has a tendency to cling to the bottom of your feet),
for that quick trip outside to take out the trash, or pick up your cell phone that you left in the car.
PROBLEM: "SWEATY FEET"
One problem I have with the CROC is that it doesn't ventilate very well. Sure, it's got holes. But the material is such that it traps heat so you're
feet end up sweating in warm weather.
PROBLEM: "HOLES ALLOW DEBRIS IN"
Another problem is that the holes allow all sorts of debris into the sandal while you're walking, such as loose rocks, wood chips at the playground,
sand and dirt (when you're not at the beach), and rain water (puddles in the parking lot). This means that you're feet get dirty rather quickly and
can be uncomfortable at places where there is a lot of debris - eg, playgrounds.
"SIZE & PRICE"
Sizing is a bit weird. I'd recommend going to a store first to try it on and see what size you are. It's hard to find a good selection at a store, so it's
best just to dip in for sizing and then purchase the one you want on Amazon. Turned out to be the best thing for me, as I was able to score Army
Green Caymans from Amazon, while searching at numerous stores I've only been able to find blue and black Caymans in sizes way too big. For
$29.99 I think it's a bit pricey actually, but if you're picky about sandals like me, there's nothing you can do about it.
"STYLE"
One other thing you'll have to get used to is how aesthetically disgusting it is. Let's be frank: it's a damn ugly shoe and there's no way getting
around it. It's not the prettiest thing to wear, but it's hands-down the most comfortable. Just be careful where you tread. Definitely not an all-
terrain/purpose sandal. Good for beach and casual sidewalk/short trip walking.
"DIFFERENCE BETWEEN THE BEACH AND CAYMAN STYLES"
None. Except that the sizes for Beach version are "ranges" and are more roomy for your feet. Cayman sizes are exact and are more narrow. Try
on before you buy as the versions are not the same.
Amazon review of Crocs Classic – Most Helpful Critical Review55
I ordered two pairs of Crocs - one pair of thongs and one pair of cayman crocs. I used the sizing chart provided and ordered both pairs in M5/W7.
However, when they arrived, while the Thongs fit perfectly, with room to wiggle, the Caymans were way too small (I'd almost say a full size too
small). The Thongs were "made in China" and the Caymans "made in Mexico". I went to my local store and discovered that they receive Croc
orders which are often made in multiple countries. It would appear to me that there is no "standard" mold used. So beware - just because you have
54 http://www.amazon.com/review/R3OL74Z5NX0Z0B/ref=cm_cr_pr_viewpnt#R3OL74Z5NX0Z0B 55 http://www.amazon.com/review/R2UE3K74BI3F49/ref=cm_cr_pr_viewpnt#R2UE3K74BI3F49

67
tried them on in a store and think you have the correct size - you may end up getting a larger or smaller size, depending on where they are
manufactured.