restructuring and strategic alliances among northeast asia’s
TRANSCRIPT

Restructuring and Strategic Alliances among Northeast Asia’s Large Steel Firms
Eric D. Ramstetter
Chief, Research Division, ICSEAD and Visiting Professor, Graduate School of Economics, Kyushu University
Oleksandr Movshuk
Research Assistant Professor, ICSEAD, and Visiting Associate Professor, Graduate School of Economics, Kyushu University
Working Paper Series Vol. 2002-37 December 2002
The views expressed in this publication are those of the author(s) and do not necessarily reflect those of the Institute. No part of this book may be used reproduced in any manner whatsoever without written permission except in the case of brief quotations embodied in articles and reviews. For information, please write to the Centre.
The International Centre for the Study of East Asian Development, Kitakyushu

1
Restructuring and Strategic Alliances among Northeast Asia’s Large Steel Firms
Eric D. Ramstetter,
Chief, Research Division, International Centre for the Study of East Asian Development
and Visiting Professor, Graduate School of Economics, Kyushu University
and
Oleksandr Movshuk
Research Assistant Professor, International Centre for the Study of East Asian Development
and Visiting Associate Professor, Graduate School of Economics, Kyushu University
Abstract
In Japan, Korea, and China, many large steel firms aggressively restructured their
operations in the last decade. This restructuring was far-reaching with some firms being
liquidated, others merging, and strategic alliances being strengthened. Partially as a result of this
restructuring, employment in steel firms began to fall rapidly after the early-1990s. The Asian
financial crisis also had an especially large impact on Korean firms as domestic demand contracted
sharply in 1997 and 1998. There was a surge in exports from these three economies and Taiwan
in the late 1990s, and the United States charged numerous steel producers in Northeast Asia and
other regions of the world with dumping. This charge was not made in the early-mid 1990s, but
this firm-level analysis reveals few differences in firm performance between these periods that
would substantiate such charges. Moreover, even after the export surge, Northeast Asia’s large
firms sold most of their output in local markets and the vast majority of their exports went to other
Asian countries, not to North America or Europe. However, the recent mergers and proliferation
of strategic alliances among the regions largest steel makers raises potentially important anti-trust
questions in addition to providing an interesting case study of industry adjustment.

2
1. Introduction
This paper examines the performance of the largest steel firms in Northeast Asia (defined
here as China, Japan, Korea, and Taiwan) in the 1990s. The primary purpose of the paper is to
describe trends in indicators of corporate performance and speculate about the factors behind those
trends. In the late 1990s the United States charged numerous steel producers in Northeast Asia
and other regions of the world with dumping, a charge that was not made in the early-mid 1990s,
and it is thus interesting to see if there are any differences in firm performance that might suggest
dumping actually occurred.
Three periods with differing economic and political environments are identified. The
first period is 1990-1992, when Japan and other Asian countries were experiencing an economic
boom and the beginning of the end to the Japanese boom, and exports were restricted by a
U.S.-Japan agreement to limit Japanese exports to the United States and the political fallout of this
agreement. The third period starts in 1997, when the Asian financial crisis greatly reduced
demand for steel exports from Northeast Asian steel makers and the United States renewed its
pursuit of limitations on steel imports amidst the U.S. economic boom in the late 1990s. The
second period is an interim one when major export markets, Asian economies and United States,
and the even larger domestic markets were generally doing very well. The major exception was
Japan, where the collapse of the bubble reduced domestic and import demand after 1992.
The paper proceeds to examine trends firm size and product mix (section 2), profitability,
productivity, factor intensities, and labor costs (section 3), exports and export propensities (section
4), and corporate finance (section 5). Then section 6 describes a number of cases illustrating the
large corporate restructuring that has been going on among Northeast Asia’s steel firms in recent
years and section 7 offers some concluding remarks.
2. Size and Product Mix
Table 1 shows two measures of corporate size, sales (turnover) and employment on a

3
non-consolidated basis, and reveals a number of interesting trends. First, with the possible
exception of Taiwan, Northeast Asia’s steel industry has been contracting in terms of employment
since the mid-1990s. The declines were largest in Japan, where 120,000 steel jobs were lost over
the last decade, or about one-third of the average in 1990-1992. China also experienced very
large decline in steel employment of over 700,000 jobs or 20 percent of the total compared to the
early 1990s. The percentage decline in Korea was similar (16 percent) but the absolute number of
jobs lost was much smaller because Korea’s steel industry is much smaller than China’s or Japan’s
in terms of employment. Comprehensive annual data for Taiwan are not available but
employment actually increased between 1991 and 1996, the years in which comprehensive
industrial and commercial surveys were conducted. Annual data from the less comprehensive
earnings surveys suggest that employment rose through 1993, remained rather constant in
1994-1995 and 1997-2000, but fell markedly in 1996 and 2001.1
Second, in Japan sales also declined markedly. When measured in US dollars, sales
were 28 percent lower in 2001 than the average in 1990-1992. In marked contrast, the value of
sales measured in U.S. dollars increased rapidly through 2000 in Korea and China. Again, it is
difficult to get comprehensive statistics for Taiwan but data through 1996 indicate increasing sales
there as well, and the sales of the top two firms also trended upwards thereafter. Thus, although
Japan’s steel industry appears to be in steep decline with both employment and the value of sales
falling, the picture in the other three countries is mixed, with employment falling but the value of
sales rising as restructuring takes place.
Despite the large declines in Japan, Japan still has the largest steel industry in Northeast
Asia in terms of turnover, with sales of US$113 billion in 2000, compared to US$45 billion in
China, and US$28 billion in Korea, and probably a somewhat smaller amount in Taiwan (Table 1).
A very large portion of these sales is accounted for by Japan’s largest five steel companies (Nippon
Steel, NKK, Sumitomo Metal Industries, Kobe Steel, and Kawasaki Steel), which had combined
sales of US$48 billion on a non-consolidated basis in 2000, though this figure fell markedly to
1 Estimates (in thousands) from the less comprehensive earnings surveys were 1991=71.7, 1992=76.0, 1993=80.4, 1994=83.9, 1995=82.7, 1996=81.2, 1997=83.3, 1998=83.5, 1999=82.3, 2000=82.9, and 2001=80.5 (Directorate-General of Budget, Accounting and Statistics 2002).

4
US$39 billion in 2001. Altogether, there are 16 steel firms in Japan that had annual sales of US$1
billion or more for some years in 1990-2001. Three of these firms, Hitachi Metals, Nisshin Steel,
and Daido Steel, are of intermediate size with non-consolidated sales of US$2-3 billion in 2000
and 2001. The other eight firms are much smaller and sales in several of the smaller firms fell
below US$1 billion in recent years. In Korea, there is one very large, formerly state-owned firm,
Pohang Steel, with sales of close to US$10 billion in recent years and four others that had sales of
about US$1-2 billion in recent years.2 In Taiwan, the national government still owns two-fifths of
the largest firm, China Steel, but this company is relatively small with sales of about US$3 billion
in recent years.3 In Taiwan, there is only one other firm with sales of US$1 billion or more in
recent years and it was very small before the late 1990s. In China, the largest firm, Baosteel
Group, was created as the result of a recent merger of Baoshan, Shanghai Steel Plants and
Shanghai Meishan, but it is still slightly smaller than Pohang in Korea and the big-5 in Japan.
There are three other firms with sales of US$2-3 billion in recent years and a number of other
smaller firms.
One reason Japanese steel industry looks so much larger than corresponding industries in
the other three economies is because this compilation is based on firm-level data and several of
Japan’s steel firms are diversified, engaging in a number of activities other than steel. For
example, sales are much larger on a consolidated basis than on a non-consolidated basis, US$79
billion in 2000 and US$64 billion in 2001, reflecting the fact that these firms own a number of
subsidiaries.4 In addition many of these subsidiaries and the core company itself are engaged in
activities other than steel production. Comprehensive data comparing steel operations and
non-steel operations are only available on a consolidated basis and these data show that steel sales
accounted for only about two-fifths of consolidated sales in Kobe Steel, a little under two-thirds of
consolidated sales in Sumitomo Metal Industries, and about three-fourths or slightly less of
2 Note that a sixth firm, Kang Won Industries, merged with one of the top five, INI Steel, and this was largely responsible for the rise in sales and employment in INI Steel in 2000 3 In Taiwan, the government decreased its ownership share of China Steel from almost 100 percent in 1990 to 40 percent in 2001. In Korea the Ministry of Finance, the Korea Development Bank, and other government-related entities held over one third of Pohang’s shares but the government divested these holdings and by 2000 Pohang was a private company. 4 See Appendix Table 1c for sales on a consolidated basis in Japanese firms.

5
consolidated sales in the other three large firms, Nippon Steel, NKK, and Kawasaki Steel.5 These
ratios were generally larger in the smaller steel firms in this sample, Daido Steel after 1999 and
Japan Steel Works being the major exceptions. Moreover, ratios would probably be larger in all
firms if they could be compiled on a non-consolidated basis because subsidiaries tend to be
concentrated in non-steel activities while the main company tends to be concentrated in steel.
Available data for steel firms from Korea and Taiwan on a non-consolidated basis suggest that steel
operations account for the vast majority of sales in these companies, often 95 percent or more of
total sales. These firms thus appear to be far less diversified and Japanese firms, especially the
large ones. Thus, large Japanese firms would not appear as large relative to their smaller Japanese
counterparts or their counterparts from Korea and Taiwan if comparisons could be limited to steel
operations on a non-consolidated basis.6
In addition to the long-term trends identified above, the data appear to reveal two
important turning points in this period. First, compared to the 1990-1992 period, sales of steel
firms rose markedly in 1993-1996 (Table 1). This mini-boom followed the removal of Japan’s
voluntary restraints on exports of steel to the United States and it is likely that the removal of these
restrictions was one reason for the increase in sales in these years. However, as will be seen
below, exports account for a relatively small proportion of sales and exports to the United States
account for a small share of exports in most of the firms examined here. Thus, it appears likely
that high economic growth in domestic markets was a more important cause of the increased sales
in China, Korea, and Taiwan. The economic boom in other Asian economies also benefited steel
exporters in Japan, even though the domestic market stagnated after the collapse of the asset
market bubble in 1992. Second, sales also stagnated or fell in 1998-1999, following the Asian
economic crisis, but rebounded rather strongly in 2000. In this case, both domestic and external
demand was adversely by the crisis and the subsequent recovery in 2000.
5 See Appendix Table 1c for details. 6 For Korean and Taiwanese steel makers see sources cited in Appendix Tables 9a, 9b. There are no data on the structure of sales for Chinese firms.

6
3. Profitability, Productivity, Factor Intensities, and Labor Costs
The data on profitability in large steel firms further underscore the importance of cyclical
and long-term patterns in the economic environment surrounding these companies (Table 2). In
Japan, profit rates tended to be highest in 1990-1992, when domestic demand was still relatively
robust, but fell markedly thereafter. In addition, voluntary export restraints probably contributed
to relatively high profit rates in the early 1990s, though it is impossible to ascertain how large this
contribution was. Since 1993 net profit rates for the industry have been negative on average and
operating profit rates have averaged less than 3 percent. In most years, the operating profit rates
of the largest 5 integrated steel makers exceeded the industry average. However, in some years
the net profit rate was much lower than the operating profit rate, reflecting relatively large negative
flows of non-operating income (often interest payments) and/or extraordinary income items.
Many of the large negative net profit rates are related to efforts to pay off costs related to large
losses incurred on investments made during the late 1980s and early 1990s when profits were high.
In some contrast, operating profit rates tended to be relatively high in Korea and Taiwan
and actually tended to increase over the decade in Korea (Table 2). Both operating and net profit
rates of Pohang Steel and China Steel were particularly high, reflecting in part the high
concentration of these two businesses in their comparatively profitable core activities. The high
concentration on core activities may be one positive aspect of these companies’ experience as
government-owned enterprises in which financial and property investments were often restricted.
Nonetheless, given the general perception that state-owned firms tend to be relatively inefficient, it
is somewhat paradoxical that these two firms with a history of state-ownership are among the most
profitable of steel companies in Northeast Asia. Among the remaining smaller firms there were
some large negative net profit rates in a few companies and years, reflecting again large losses in
non-operating income and/or extraordinary income. However, for the smaller Korean firms,
operating profit rates remained positive throughout the period and rebounded to high levels after
the crisis in 2000 and 2001, indicating that the core steel-related businesses of these companies
remained rather profitable.
7
In China, the only available figures appear to refer to a measure similar to net profits and
these profit rates fell from relatively high levels through 1996 to very low levels in 1997-1998 and
2000 (Table 2).7 Among Chinese firms, profits were relatively high in recent years in Baosteel
Group and Taiyuan and relatively low in a number of firms, including Shanghai Meishan, Anshan,
Baotou, Benxi, and Maanshan Iron & Steel. Three of these firms, the profitable Baoshan and the
less profitable Shanghai Meishan and Maanshan Iron & Steel, have been involved in restructuring
efforts as described below.
There are many reasons for changes in profitability over time and one of the more
important supply-side causes of variability is the efficiency of the firm. Two partial measures of
efficiency, sales per employee (a measure of average labor productivity) and sales per unit of fixed
assets (a measure of physical capital productivity) are presented in Table 3.8 For all Japanese
firms, average labor productivity rose slightly over the period, rising between 1990-1992 and
1993-1996, but then falling back in 1997-1998 before rebounding some in 1999-2000 and then
falling again in 2001. This measure of average labor productivity was generally relatively high in
the largest 5 firms, and in several of the medium- and smaller-sized Japanese firms (e.g., Nisshin
Steel, Yodogawa Steel Works, Nippon Yakin Kogyo, Tokyo Steel Manufacturing and Toyo Kohan).
These productivity measures tended to be much lower when measured on a consolidated basis (see
Appendix Table 3c), another indicator that the core businesses concentrated in the group’s main
firm are relatively efficient (and thus rather profitable).
Figures for Korea indicate some large gains in this measure of average labor productivity
in recent years. The increase in 1990-2000 was almost double for all Korean firms, but somewhat
less for the larger firms listed in Table 3. Increases of sales per employee were also quite rapid
for all firms in Taiwan in 1991-1996 and for all firms in China in 1990-2000. In Taiwan,
7 Note that the source used does not provide a precise definition of the profit term used and that Chinese accounting practices often differ markedly from accounting practices in other countries. This is especially true in steel where most firms are state-owned and often have access to undocumented sources of public funds. 8 It is usually preferable to calculate these measures of average factor productivity with value added, not sales in the numerator, in order to remove the effects of transactions in intermediate goods on the productivity measures. However, in the case of the steel companies the influence of such transactions on productivity rankings may not be large and data on value added are not available for a large number of sample firms.
8
increases were relatively slow in the large firm, China Steel, but the pattern in China contrasted
with increases being relatively large in a number of large firms. In addition, there is a very large
gap in average labor productivity between China’s large firms and the industry as a whole, a gap
that is much larger than in the other three countries. This is partially related to China’s relatively
low income and labor productivity levels in general; for example for all steel firms in 2000,
China’s average labor productivity was 24 times lower than in both Korea and Japan at market
exchange rates.9 A related factor is the general inefficiency of China’s steel industry, which stems
from a combination of low economic development levels (e.g., poor infrastructure, poorly educated
workers) and past mismanagement in the industry’s firms and related government agencies.
Another factor was excessive fragmentation of the steel industry, which resulted from the policy of
self-sufficiency at the regional level during the Cultural Revolution.
In contrast to the increases observed in average labor productivity in some countries, the
measure of average physical capital productivity used here, the sales-fixed asset ratio, has
generally been stagnant or declining in these countries, the 1999-2000 period in Korea being the
major exception (Table 3). In Japan, most of the decline occurred between 1990-1992 and
1993-1996, with average capital productivity remaining largely unchanged thereafter. Notably,
this measure of average capital productivity tended to be relatively low in the five largest firms and
relatively high in the two of the three mid-size firms (Hitachi Metals and Daido) and one smaller
firm, Kurimoto. In Korea and Taiwan as well, the large firms (Pohang and China Steel) have
relatively low average capital productivity, indicating an inverse relationship between size and
average capital productivity in these samples. Moreover, average capital productivity tended to
be lowest in Taiwan and China, indicating a relatively inefficient use of physical capital in these
firms. A noted exception in China was the Shanghai Steel Plants, which had unusually high
average capital productivity in 1994-1997.
For large Japanese firms it is also possible to compare operating profit rates and sales per
employee on a consolidated basis between steel and non-steel operations for most firms (Table 4).
In 1993-1996, the number of cases where the operating profit sales ratio in steel was higher than 9 Note that this gap would be much smaller if exchange rates based on purchasing power parity were used (e.g., International Centre for the Study of East Asian Development 2002, p. 28)

9
the firm-wide average (7) was only slightly larger than the number of cases where this measure of
profitability was relatively low (6). However, since 1996 there have been far more cases where
operating profit rates in steel were higher than for the firm as a whole (9 of 13 in 1997-1998, 10 of
13 in 1999, 11 of 13 in 2000, and 8 of 13 in 2001). Thus, steel-related activities have tended to
generate relatively high profits in recent years compared to other operating activities.10
Comparisons of labor productivity are only possible for 1999-2000 but here again there are many
more cases where productivity is relatively high in steel operations (11 of 14 in both 1999 and
2000). Thus, in recent years, Japanese steel firms appear to make a better return on sales and
have higher labor productivity in their steel operations than in their non-steel operations.
One reason for the marked increases in average labor productivity combined with reduced
or stagnant levels of average capital productivity is the fact that fixed capital intensity has
increased rapidly in some of the region’s large steel firms, with increases in fixed assets per
employee being especially rapid in Korea, Taiwan, and China (Table 5). For example, an equally
high level of fixed assets per employee accompanies the unusually high level of sales per employee
in Baoshan in 1994-2000. Moreover, in China, Taiwan and Korea, large firms tend to be much
more capital intensive than the industry average by this measure. The marked rise in physical
capital intensity in three Korean firms, Dongkuk, Dongbu, and Hyundai Hysco is particularly
conspicuous as these firms have rapidly expanded capacity from 1997 forward. In contrast,
physical capital intensity has remained relatively constant in the larger, semi-state-owned firms,
Pohang and China Steel. In Japan there was a sharp increase between 1990-1992 and 1993-1996,
but capital intensity has not changed much thereafter.
A final point of interest is trends in compensation per employee (Table 6). Here again
there was some increase in Japan between 1990-1992 and 1993-1996 that partially reflect the
appreciation of the yen between the two periods. Thereafter, there has been little change in U.S.
dollar terms. Trends are rather similar in Korea and in Taiwan to 1996 as wages have increased
far less than average labor productivity. The fallout of the Asian economic crisis, which badly
affected Korea, and the continued stagnation of the Japanese economy a decade after the asset 10 Note that this comparison is not precise because the totals for the firm net out intra-firm transactions that are not netted out from the steel division figures.

10
bubble’s collapse, has continued to put downward pressure on wages in the steel and other
industries. The modest rises in wages combined with large declines in employment, mean that the
wage share of the cost bill has tended to fall, especially in Japan and Korea. Large firms in Korea
and Japan do tend to pay relatively high wages compared to the industry average, however.
Patterns in China are also similar in that larger firms tend to pay relatively high wages. They
differ in that wages in China’s steel industry have continued to rise rapidly, reflecting high
economic growth in that economy.
4. Exports and Export Propensities
Table 6 shows trends in exports and in ratios of exports to total sales (export propensities).
In the case of all Taiwanese firms and China Steel, exports are proxied with foreign sales, the
difference between foreign sales and exports being that both exports and the overseas sales of
foreign affiliates are included in foreign sales.11 However, foreign affiliates generally play a
relatively small role in the steel industry compared to other industries such as electronics or autos
and this is probably especially true in the of Taiwanese firms, including China steel.12 This is not
all of the discrepancy between country steel exports and foreign sales of all steel firms, however.
This is because Taiwan’s steel exports are compiled on a commodity basis while foreign sales data
are compiled from firm-level data and include some exports of non-steel products.
Correspondingly, export data for steel firms from other countries include some non-steel exports,
and these non-steel exports likely to be relatively large in Japan’s large, diversified steel makers.
11 This is one reason that foreign sales could conceivably exceed export sales in comparisons when all Taiwanese firms are compared with Taiwanese exports in Table 6. Another reason is that firm-level data include exports of non-steel products. However, in the Taiwanese case, both of the factors are not very important. First, steel firms are not very diversified (in marked contrast to the Japanese case). Second, foreign affiliates generally play a relatively small role in the steel industry compared to industries such as electric and electric machinery and transportation machinery, primarily because the costs of easily transferable intangible assets such as patents or marketing networks are a relatively small portion of total costs for steel firms, which in turn makes it costly for them to diversify geographically (e.g., Markusen 1991; Plummer and Ramstetter 1991). 12 Correspondingly differences between foreign sales and exports tend to be relatively small for steel firms compared to firms in other industries.

11
However, even though these data include non-steel exports and sales of foreign affiliates, foreign
sales accounted for a very small, though rapidly rising share of total sales for all Taiwanese firms,
8.9 percent in 1991 and 14.0 percent in 1996. These ratios were much larger in China Steel, but
did not rise rapidly until 2001, going from 19 percent or less before 1997 to 23 percent in 2000 and
32 percent in 2001.
In value, Japan’s exports of steel increased from US$13.6 billion in 1990-1992 to
US$15.8-16.0 billion in 1993-1996, 1997-1998, and 2000, but were only US$14.4 billion or less in
1999 and 2001 (Table 6). The export propensity, measured as the ratio of exports to industry sales,
was rather constant in early-mid 1990s at 10-11 percent before 1996 but then rose rapidly to over
14 percent in 1997-1998, 2000, and 2001, partially because domestic demand stagnated and/or fell.
Export-sales ratios tended to be much larger in the sample of large firms here. One statistical
reason is that some non-steel exports are included in the firm-level estimates as described above.
However, it also appears that large Japanese firms are much more dependent on exports than the
industry as a whole in Japan. Kawasaki Steel and Japan Steel Works were the most dependent on
exports, which accounted for over one third of sales in some years. However, even in these
companies, domestic sales accounted for the vast majority of all sales and large Japanese firms
generally earned only about one-fifth to one-fourth of their sales from exports.
Korea’s export propensities were much larger than Japanese and Taiwanese propensities,
but the rose less over time, from 23 percent or less before 1996 to 30 percent in 1997-1998, before
falling back to 25-27 percent thereafter. As in Japan and Taiwan export propensities were larger
in large firms, rising from 36 percent or less before 1996 to 38 percent in 1997-1998 and 42
percent in 1999. The absolute value of exports also climbed during this period. However, both
export values and export propensities fell markedly in 2000 and 2001, the main cause probably
being relatively buoyant local demand. The largest firm, Pohang Steel, accounted for the majority
of these exports and its export propensity was relatively high, 41-44 percent through 1999, before
falling rapidly to 25-26 percent in subsequent years. Thus, Korean firms tend to be the most
dependent on exports of the firms examined here, but even these firms sell the majority of their
output on the local market. In China, there are no export data for firms but China’s overall export

12
values and export propensities rose rapidly and with export propensities approached Korean levels
in 1997-1998 and 2000.
One would be tempted to look at trends in export propensities for indications of dumping.
In this respect, the marked increase of these ratios in 1997-1998 in Japan, Korea, and China could
be viewed as indications that dumping contributed to unusually large export values in these
economies, especially if the products being exported are thought to have a high price elasticity of
demand. However, these were crisis years in Asia and two other factors were also important for
Korean firms in particular. First, domestic demand collapsed in many Asian countries and this
explains slow growth of domestic sales in Korea. Second, the rapid won depreciation led to large
increases in export quantities and the value of those exports priced in U.S. dollars. These factors
were not that relevant to the Japanese and Chinese cases, where domestic demand remained rather
buoyant and currencies were more stable.
Finally, it is important to underscore that other Asian economies, not North America or
Europe, are by far the largest export markets for firms that report the direction of exports in recent
years. For example, Asia accounted for one-half to two-thirds of all exports for four of the largest
five four major steel makers in Japan (Nippon Steel, Sumitomo Metal Industries, Kobe Steel, and
Kawasaki Steel) and Pohang in Korea, as well as over 90 percent of China Steel’s exports (Table 7).
On the other hand, the U.S. market is not a very large export market for most of these companies,
and most companies reporting the direction of sales do not even report exports to North America.
The major known exception is the second largest Japanese producer NKK, which sent about
three-fifths of its exports to North America in 1997-2001. Nonetheless, North America’s total
share of steel exports was never over 21 percent in any of the four countries during the period
studied. Thus, if these firms were dumping in the North American market in the late 1990s, the
amounts of exports involved were relatively small, amounting to no more than 6 percent of total
sales in Korea (1997-2000), 4 percent in China (2000), 3 percent in Japan (1997-1998), and 1
percent Taiwan (1991 and 1996). On the other hand, Asia was a much more important market
with exports to this region accounting for as much as 21 percent of sales in Korea (1997-1998), 19
percent in China (1997-1998), 11 percent in Japanese firms (2001), and 12 percent in Taiwan

13
(1996).
5. Corporate Finance Structure
Corporate finance is a final topic that has attracted particular attention since the financial
difficulties began in Japan in 1991-1992 and in Korea and other Asian economies in 1997.
During the booms that preceded these financial difficulties, many firms in a variety of industries
made a large number of investments at relatively high cost and had subsequent difficulty servicing
related debts. These financial difficulties have been a major reason for the large number of
bankruptcies in recent years in Japan and Korea, in particular. In Taiwan and China, financial
difficulties have been less pressing to date, but it seems clear that weaknesses in the financial
systems and in corporate governance have led similar difficulties in a number of Taiwanese and
Chinese firms as well.
One important indicator of the total debt burden in a company is the ratio of total
(long-term and current) liabilities to total assets.13 Another indicator that highlights the
short-term debt burden is the ratio of current liabilities to total assets and Table 7 depicts trends in
both of these ratios. In the Japanese steel industry as a whole the total liability-total asset ratio
was more or less constant at 70-73 percent while the current liability-total asset ratio fell from 41
percent in 1990-1992 to 35 percent in 1999-2000. Although these ratios are high compared to
other countries, there are no sudden changes in the trends observed, suggesting that on average the
firms in this industry had little difficulty servicing this debt burden. The sharp increase in the
total liability-total asset ratio in Toa prior to its liquidation by its parent (NKK) in fiscal 1998 was a
conspicuous exception to this pattern.14 The total debt burden, and in recent years the short-term
debt burden as well, has generally been higher in the largest five companies than in the industry as
a whole. The total debt burden in particular has been quite high in four of the largest five firms
13 Equivalently one could examine two other common measures, (1) the ratio of equity to total assets or (2) the ratio of total liabilities to equity (also called the debt-equity ratio). 14 Note that Japanese fiscal years usually begin on 1 April and end on 31 March of the following calendar year.

14
(all but Nippon Steel) and is probably an important factor spurring consolidation in the industry
such as the merger of NKK and Kawasaki Steel into the JFE Group and strengthening of strategic
alliances between Nippon Steel, Sumitomo Metals Industries, and Nippon Steel.
In Korea, both of these measures of corporate debt were much smaller, but they both
tended to increase in the mid-1990s and then decrease in the late-1990s after the financial crisis
broke. This indicates that Korean steel makers also took on debt at a relatively rapid rate during
the boom of the mid-1990s and were subsequently forced to reduce their debt burdens after the
crisis. The decline in the short-term debt burden was particularly conspicuous after the crisis.
Among sample firms, Pohang Steel has always had relatively low debt burdens and generally
reduced them throughout the period studied. However, some of the other firms, notably INI Steel,
Dongkuk, and Hyundai Hysco, had higher debt burdens that spiked in the mid-1990s as described
above. The rise in the debt burden in Kang Won Industries was also one factor behind its
subsequent takeover by INI Steel.
In Taiwan, the only available data pertain to China Steel, which had very low and
declining debt burdens during these periods. The data on Chinese firms indicate that long-term
debt burdens tended to be somewhat lower than in Korea but that short-term debt burdens were
relatively high. One must be careful in comparing absolute levels of these ratios because of large
differences in accounting practices in China and the other countries, but it is significant that the
debt burdens tended to fall far less in China over this period than in the other countries.
When interpreting data for China’s companies, it is important to keep in mind that
creative accounting is still rife in China, resulting in potentially biased picture of their financial
condition. While the collapse of Enron demonstrated that the problem is not endemic to China
alone, the scale of the problem is still quite extensive15. One common distortion is that current
assets are inflated by including in receivables steel products that were given away to customers on
credit that will never be paid. Besides, the debt burden of many state enterprises was greatly
alleviated in the late 1990s, when the government allowed them to write off huge amounts of
long-term debt in exchange for shares, issued and deposited in state-owned asset management 15 Pomfret (2001) reported that when the Finance Ministry of China did a random check of 276 state-owned enterprises, almost all of them were found to cook their financial statements.

15
companies. After this debt transfer, many debt-ridden firms did not have to pay interest on their
accumulated debt, producing a sudden surge in their profitability, even though were no substantial
improvements in the productive performance of these firms. For these reasons, recent reports
about sudden improvements in previously chronically indebted Chinese companies should be taken
with a grain of salt.
6. Corporate Restructuring and Strategic Alliances
The preceding sections illustrate how Northeast Asia’s steel firms have come under
extreme competitive pressure in recent years, both from each other and from firms in other regions
of the world. Partially as a result of the extreme competitive pressure, there has been a large
amount of restructuring among large steel firms in Japan, Korea, and China, as well as led to the
establishment and strengthening of a number of strategic alliances in among the region’s major
steel makers. This section reviews the largest of these changes in the corporate landscape. The
corporate landscape also changed in Taiwan with the rapid growth of Yieh United in recent years.
The largest restructuring efforts to date relate to the merger of two of the five giant
Japanese firms, NKK and Kawasaki Steel, into the JFE Group in October 2002. The resulting
JFE Group is projected to rival the region’s largest firm, Nippon Steel, in terms of both sales and
employment. The merger may also have contributed to large consolidations in both NKK and
Kawasaki Steel before the merger with combined sales falling 18 percent between 2000 and 2001,
while combined employment fell 9 percent. Before this merger was negotiated, NKK also
liquidated its large affiliate Toa Steel in fiscal 1998. As noted above, this firm experienced a
sharp decline in profitability and a sharp rise in debt before its liquidation. In 2001, similar large
declines in sales and employment (20 percent and 8 percent, respectively) were observed in major
rival Nippon Steel, while Sumitomo Metal Industries experienced also an even larger decline in
sales (22 percent) and a much larger decline in employment (also 22 percent). Thus, the merger
of NKK and Kawasaki Steel into the JFE Group may be this group’s way of facilitating
consolidation that is similar to the consolidation going on within other major Japanese steel makers
16
in important respects.
Recent restructuring in Korean steel industry was prompted by bankruptcies of a number
of smaller firms, Hanbo Steel, Sammi Specialty Steel, and Kia Specialty Steel, and INI Steel’s
takeover of Kang Won Industries in the late 1990s.16 Although it was a relatively small firm, the
collapse of Hanbo Steel hit the Korean economy especially hard because the company was to be
the major domestic competitor to Pohang Steel, and the government provided direct and indirect
financial support to its ambitious expansion. In the mid-1990s, Hanbo Steel borrowed US$5.8
billion from the Korean Development Bank and other Korean banks to finance expansion plans.
As a result, its already high total liability-total asset ratio skyrocketed from 78 percent in 1992 to
84 percent in 1995 (Asia-Pacific Infoserv, various years b) and 96 percent in 1997 (Far Eastern
Economic Review, 11 June 1998, p. 66), when the company was forced into bankruptcy.17 The
bankruptcy was one of the first in the Korean financial crises of 1997-1998, and created concerns
that the huge bad loan would undermine the financial stability of Korean banks. The government
subsequently took over the debts of Hanbo Steel and tried to sell the defunct steel maker with great
difficulty. Initially, Pohang Steel was considered a potential buyer, but the deal failed to
materialize, and only in the late 2002 Hanbo Steel was purchased by a consortium AK Capital,
which is partially financed by the U.S. steel firm Nucor Corporation.
In addition to mergers and consolidation, Japanese steel makers in particular have pursued
a number of strategic alliances, many of them with other major steel makers in Northeast Asia. In
this respect, Nippon Steel has perhaps been the most active. According to its 2002 annual report,
Nippon Steel has four prominent strategic alliances that have been initiated “in response to
fluctuations in steel demand and intensifying competition worldwide, and the partners involved
aim at benefiting from the joint implementation of collaborative measures”.18 These strategic
alliances involve two large Japanese steel makers, Kobe Steel (from December 2001) and
Sumitomo Metals Industries (from February 2002), the large Korean steelmaker Pohang Steel
16 None of these firms ever had sales approaching the US$1 billion cutoff used in this paper. 17 The 1997 ratio is calculated from an estimated debt-equity ratio of 22. The loan figure is taken from “Statement of Peter J. Visclosky (D-IN) on the Asian Financial Crisis” (http://www.house.gov/visclosky/t_asia.htm). 18 See http://www0.nsc.co.jp/shinnihon_english/investor/pdf/2002e.pdf, p. 5.

17
(from August 2000), and the European Union’s largest steel producer Arcel (formerly UNISOR,
from January 2001). More specifically, the alliance with Kobe Steel and Sumitomo Metals
Industries appear aimed at promoting cost reduction in materials procurement, certain production
lines, and distribution. According to its 2001 annual report, the other two alliances appear less
well developed when the partners involved were said to be studying possible specific measures.19
Nonetheless, it is significant that Nippon Steel, the world’s third largest steel maker if measured in
tonnage, has chosen world’s two largest steel makers (Arcel is number 1 and Pohang number 2, see
International Iron and Steel Institute 2002) and the two other large Japanese steel makers not that
were involved in the JFE merger.
Other Japanese and Korean firms have also pursued an increasing number of strategic
alliances in recent years. Of particular interest in this context is Kawasaki Steel’s “basic”
agreement with Dongkuk Steel in Korea in July 1999 and “comprehensive” agreement with Hyudai
Hysco in November 2000.20 Sumitomo Metals Industries’ “Medium Term Business Plan” also
expresses the intention to expand contracts with Nippon Steel and Kobe Steel and to expand its
cooperation with China Steel Corporation, including the initiation of negotiations to form a joint
venture with the latter firm.21 Still another example was INI Steel’s takeover of Kang Won
Industries in Korea in March 2000, and subsequent takeover of a smaller company Sammi Steel in
December 2000.22
These trends indicate that two major steel groups may be emerging in Northeast Asia, one
centered on the JFE Group and involving Dongkuk Steel and Hyundai Hysco, among others, and
the other centered on Nippon Steel, with Pohang Steel, Kawasaki Steel, Sumitomo Metals
Industries, and China Steel, among others, participating. This expansion of mergers and strategic
alliances can be viewed in at least two perspectives. On the one hand, as documented in this
paper, Northeast Asia’s large steel firms have come under intense competitive pressure in recent
19 http://www0.nsc.co.jp/shinnihon_english/investor/pdf/2001e.pdf, p. 4. 20 See http://www.kawasaki-steel.co.jp/e_basic/profile/index_history.html. 21 See http://www.sumitomometals.co.jp/e/pdf/medium-term-business-plan.pdf, pp. 2-3. 22 Sammi Steel was a smaller Korean steel maker with sales of about $0.35 billion in 2000. Note that the INI Steel web site calls these mergers, but our understanding is that they were takeovers (http://www.inisteel.co.kr/english/about/about_all.htm).
18
years and this has forced a large amount of restructuring and consolidation as these firms seek to
survive in a more competitive environment. In this respect, these moves may be a natural
reaction to tough times and illustrate that there are a variety of ways in which firms can restructure
and consolidate. On the other hand, these moves could eventually limit competition in the
industry as the larger firms and alliances move to exercise their market power. Thus, these trends
will be of interest to policy makers that implement competition and anti-trust policies, as well as to
the industry participants themselves.
Steel makers in Taiwan were also actively pursuing a number of strategic alliances, the
most prominent of which was the acquisition of Yieh Loong Steel, a manufacturer of hot-rolled and
cooled-rolled steel, by China Steel in early 2000. The acquisition allowed China Steel to expand
its domestic market shares, to about 84 percent for hot-rolled steel and 68 percent for hot-rolled
steel. On the other hand, the market for special steel was increasingly dominated by Yieh United
Steel. Although this firm was only created in 1988, it already operates the largest integrated
stainless steel plant in South East Asia (Industrial Technology Intelligence Services, 2002).
The recent wave of mergers and acquisitions in China’s iron and steel industry was
encouraged by government-led campaign to revitalize state-owned enterprises (SOEs) by ‘grasping
the big, releasing the small’ enterprises. By ‘grasping the big’, the government sought to
agglomerate the largest SOEs into larger enterprise groups that could compete on equal footing
with rival foreign groups, such as the Japanese keiretsu or Korean chaebol. The campaign has
been implemented particularly vigorously in the iron and steel industry. The Baosteel merger,
which resulted after Baoshan Steel effectively bailed out the financially troubled Shanghai Steel
Plants and Meishan Iron and Steel (Organisation for Economic Cooperation and Development,
2000, p. 44-45), was perhaps the major result of this policy’s implementation in the steel industry.
However, the majority of Baosteel’s profits are still derived from Baoshan and the merger had not
increased profitability in the rest of the firm by 2000 (Table 2). In contrast, the merger of four smaller
steel mills in Hunan province into the Hunan Hualing Group resulted in much more successful financial
restructuring and substantial cost reductions (Woetzel, 2001). Another noteworthy restructuring
project was the split of Magang Iron and Steel into two companies: Maanshan Iron and Steel

19
Company and Maanshan Magang Holding Company in the mid-1990s. After the split, Maanshan
Iron and Steel became responsible for the core steel-producing activity, while Maanshan Magang
Holding Company became responsible for dealing with huge debts accumulated by Magang Iron
and Steel. This financial restructuring helped make it possible for the shares of Maanshan Iron
and Steel to be listed on the Hong Kong and Shanghai stock exchanges. However, a plan to
reduce the workforce ran into difficulties, because the company is the biggest industrial enterprise
in Anhui Province and the local authorities were concerned that the potentially enormous increase
in unemployment would undermine social stability.
7. Conclusions
This paper first examined recent restructuring activity among largest steel firms in Japan,
Korea, Taiwan and China in the 1990-2001 period. Many of these firms began serious
restructuring by the early- to mid-1990s, and employment fell in most firms after this period, with
particularly large declines observed in Japan after the early-1990s and in Korea, and China after
the mid-1990s. Taiwanese firms, particularly Yieh United Steel, were exceptions experiencing
relatively slow declines in employment and rapid increases in sales were exceptions to these
general trends. Profits also fell markedly and remained depressed in Japan while the Asian
financial crisis had large effects on the profitability of Korean firms. Throughout the period
studied, a crude measure of labor productivity, sales per employee, generally increased, while a
similarly crude measure of capital productivity, sales per unit of fixed assets, fell as
capital-intensity rose. Despite increases in sales per employee, compensation per employee
generally fell after the mid-1990s in Japanese and Korean firms, but continued to increase in
China.
By comparing firm performance in the early-mid 1990s and in the late 1990s, the paper
tried to find evidence that might substantiate the U.S. Government’s charge that Northeast Asian
steel producers in were engaged in dumping after the onset of Asian financial crises in 1997-1998.
Although there was a surge in exports to North America and other regions during this period, the

20
firm-level analysis in this paper revealed few differences in firm performance between these
periods that would substantiate dumping charges. Moreover, even during this period, Northeast
Asia’s large firms sold most of their output in local markets and the vast majority of their exports
went to other Asian countries, not to North America or Europe. Thus, even if Northeast Asia’s
firms were dumping in the United States, this dumping accounted for a very small portion of their
sales.
The paper concluded discussed several large-scale mergers and strategic alliances among
Northeast Asia’s large steel makers. These mergers and alliances suggest that two major steel
groups may be emerging in Northeast Asia. The first one is centered on the JFE Group, which
was created by the merger of NKK and Sumitomo Metals Industries, and involves Dongkuk Steel
and Hyundai Hysco, among others. The second group is centered on Nippon Steel and involves
Pohang Steel, Kawasaki Steel, Sumitomo Metals Industries, and China Steel, among others. This
consolidation may lead to increased concentration and reduced competition in the market-based
economies of Japan, Korea, and Taiwan. This raises potentially important anti-trust questions in
addition to providing an interesting case study of industry adjustment. A similar consolidation is
also going on in China as the government strives to rationalize excess capacity in the state-owned
firms that dominate this industry.

21
References: Asia-Pacific Infoserv, various years a. Korea Company Handbook, Spring 1992, Autumn 1995, Spring 1998, Autumn 1999, Spring 2001, and Spring 2002 issues. Seoul: Asia Pacific Infoserv. Asia-Pacific Infoserv, various years b. Korea Company Yearbook, 1995/1996, 1996/1997, 1997/1998, 1998/1999, 1999/2000, 2000/2001 issues. Seoul: Asia Pacific Infoserv. Bank of Korea, various years. Financial Statement Analysis, 1991-2001 issues. Seoul: Bank of Korea. Business Korea, various years. Yearbook on the Korean Economy and Business, 1989/90, 1990/91, 1992/93, 1993/94 issues. Seoul: Business Korea. China Credit Information Service, various years. The Largest Corporations in Taiwan, 1998-2001 issues. Taipei: China Credit Information Service. Directorate General of Budget, Accounting and Statistics, 1993. The Report on 1991 Industrial and Commercial Census Taiwan - Fukien Area, the Republic of China, Vol. 3. Taipei: Directorate General of Budget, Accounting and Statistics. Directorate General of Budget, Accounting and Statistics, 1998. The Report on 1996 Industrial and Commercial Census Taiwan - Fukien Area, the Republic of China, vol. 3. Taipei: Directorate General of Budget, Accounting and Statistics. Directorate-General of Budget, Accounting and Statistics, 2002. Yearbook of Earnings and Productivity Statistics, Taiwan Area, Republic of China, 2001. Taipei: Directorate General of Budget, Accounting and Statistics. Industrial Technology Intelligence Services, 2002. Taiwan Industrial Outlook 2001 (Steel Industry). Taipei: Industrial Technology Intelligence Services, http://www.itis.org.tw/english/N15.pdf. International Centre for the Study of East Asian Development, 2002. “Recent Trends and Prospects for Major Asian Economies”, East Asian Economic Perspectives, Vol. 13, Special Issue (February). International Iron and Steel Institute, 2002. “The Largest Steel Producing Companies in 2000 and 2001”, http://www.worldsteel.org/wsif200202.php. International Monetary Fund, 2002. International Financial Statistics, May CD-ROM. Washington, D.C.: International Monetary Fund.

22
Markusen, James R., 1991. "The Theory of the Multinational Enterprise: A Common Analytical Framework," in Eric D. Ramstetter, ed., Direct Foreign Investment in Asia's Developing Economies and Structural Change in the Asia-Pacific Region, Boulder, Co: Westview Press, pp. 11-32. Ministry of Finance, various years. Zaisei Kinyu Tokei Geppou [Monetary and Financial Statistics Monthly], Special issues on Hojin Kigyou Tokei (corporation statistics), October 1991, September issues 1992-1994, August issues 1995-2001. Tokyo: Ministry of Finance. Ministry of Metallurgical Industry of China, various years. Zhongguo Gangtie Gongye Nianjian (The Yearbook of Iron and Steel Industry of China), 1990-2001 issues. Beijing: Chinese Metallurgy Press. National Statistical Office, various years. Report on the Census of Mining and Manufacturing Industries, 1990-2000 issues. Seoul: National Statistical Office. Nihon Keizai Shinbunsha, various years. Kaisha Nenkan [Annual Corporation Reports], 1992-1995 and 1997-2002 issues. Tokyo: Nihon Keizai Shinbunsha. Nihon Keizai Shinbunsha, 2001. Nikkei Zaimu De-ta CD-ROM: Ippan Jigyou Kaisha Ban [Nikkei’s Financial Data CD-ROM: General Corporations]. Tokyo: Nihon Keizai Shinbunsha. Nihon Keizai Shinbunsha, 2002. Kaisha Jouho [Company Information], September CD-ROM. Tokyo: Nihon Keizai Shinbunsha. Organisation for Economic Cooperation and Development, 2000. Reforming China’s Enterprises. OECD, Paris. Organisation for Economic Cooperation and Development, 2002. International Trade By Commodities Statistics-ITCI, Rev. 2, CD-ROMs. Paris: Organisation for Economic Cooperation and Development. Plummer, Michael G. and Eric D. Ramstetter, 1991. "Multinational Affiliates and the Changing Division of Labor in the Asia-Pacific Region," in Eric D. Ramstetter, ed., Direct Foreign Investment in Asia's Developing Economies and Structural Change in the Asia-Pacific Region, Boulder, Co: Westview Press, pp. 11-32. Pomfret, John, 2001. Legacy of Socialism Keeps China’s State Firms in Red”, Washington Post, June 20, 2001, page A01. Saturn Communications, various years a. Korea Investment Handbook, 2001-2002 issues. Seoul: Saturn Communications.

23
Saturn Communications, various years b. Korea Company Yearbook, 2001/2002, 2002/2003 issues. Seoul: Saturn Communications. Statistics Canada, 2002. World Trade Analyzer, 2002 CD-ROM. Ottawa: Statistics Canada. Toyo Keizai, various years. Asia Company Handbook, 1990-1994, 1995/1996, 1997-1999 issues. Tokyo: Toyo Keizai. Woetzel, J. R., 2001. Remaking the China's giant steel industry. The McKinsey Quarterly, 2001 (4) pp. 93-102.

Table 1: Annual Average Sales and Employment, Non-consolidated AccountingSales (US$billions) Employment (thousands)
Firm1990-1992
1993-1996
1997-1998 1999 2000 2001
1990-1992
1993-1996
1997-1998 1999 2000 2001
All Japanese Firms 135.39 148.55 114.06 119.20 112.75 97.70 370.3 339.9 294.5 277.8 261.3 252.1Sum of Large Firms 73.39 81.04 63.02 61.86 62.83 50.49 163.1 138.5 110.4 98.5 89.6 81.9 Nippon Steel 19.05 20.56 16.48 16.24 16.73 13.44 37.3 29.5 22.0 19.8 18.9 17.4 NKK 9.79 11.38 8.49 8.88 9.14 7.64 22.7 19.1 15.4 11.7 11.7 10.5 Sumitomo Metal I. 8.58 9.96 7.88 8.15 7.80 6.18 21.2 18.6 14.4 14.5 10.7 8.4 Kobe Steel 9.51 10.66 8.21 7.51 7.39 6.35 20.8 16.6 12.1 10.6 9.8 9.7 Kawasaki Steel 8.73 9.22 7.18 6.87 7.04 5.70 18.1 14.8 11.2 10.4 9.9 9.3 Hitachi Metals 2.49 2.94 2.42 2.73 2.69 1.89 8.3 8.1 7.7 7.3 6.6 6.1 Nisshin Steel 3.16 3.64 2.79 2.80 2.92 2.23 7.6 7.1 5.8 5.0 4.3 4.0 Daido Steel 2.24 2.50 1.97 2.05 2.22 1.63 7.5 6.8 5.8 5.3 4.7 4.4 Yodogawa St. Wk. 1.35 1.37 1.05 1.05 1.00 0.75 2.0 2.0 1.9 1.9 1.8 1.7 Nippon Yakin K. 0.73 0.81 0.62 0.60 0.70 0.56 1.7 1.6 1.3 1.1 1.1 1.0 Kurimoto 1.05 1.44 1.18 1.04 1.10 0.88 3.5 3.3 3.0 2.7 2.6 2.3 Toa Steel Co., Ltd. 1.56 1.32 1.07 na na na 1.8 1.7 1.4 na na na Tokyo Steel Mfg. 1.63 1.44 1.17 0.96 1.06 0.73 1.5 1.5 1.3 1.2 1.1 1.1 Aichi Steel 1.33 1.52 1.11 1.10 1.20 0.94 3.4 3.3 3.0 2.9 2.7 2.7 Japan Steel Works 1.25 1.19 1.04 0.97 0.94 0.93 3.7 3.1 2.8 2.6 2.2 2.1 Toyo Kohan 0.94 1.11 0.90 0.90 0.89 0.65 1.9 2.0 2.0 1.5 1.5 1.4
All Korean Firms 17.92 25.07 23.86 23.67 28.23 na 77.3 74.3 66.9 66.5 64.2 na Sum of Large Firms 11.32 15.00 14.00 13.32 16.55 14.43 35.6 32.2 29.3 26.4 28.2 27.8 Pohang Steel 7.55 9.72 9.08 9.00 10.34 8.59 24.2 21.5 19.4 19.5 19.3 19.2 INI Steel 1.10 1.65 1.49 1.37 2.31 2.23 2.9 3.2 2.9 2.7 4.7 4.6 Kang Won Ind. 0.55 0.83 0.99 na na na 2.4 2.4 2.2 na na na Dongkuk 0.82 1.19 1.08 1.20 1.37 1.38 2.7 2.0 1.8 1.6 1.6 1.6 Dongbu 0.95 1.13 0.92 0.99 1.31 1.12 2.4 2.0 1.8 1.3 1.4 1.3 Hyundai Hysco 0.35 0.49 0.44 0.76 1.23 1.11 0.9 1.1 1.3 1.3 1.3 1.1
All Taiwanese Firms 13.22 19.77 na na na na 88.5 91.3 na na na naSum of Large Firms 2.26 2.96 3.81 3.66 4.43 na 9.7 9.7 10.6 10.4 10.3 na China Steel 2.26 2.81 3.17 2.79 3.22 2.52 9.7 9.3 9.1 9.0 8.9 9.0 Yieh United Steel na 0.31 0.64 0.88 1.21 na na 1.6 1.4 1.4 1.4 na
All Chinese Firms 27.66 37.69 35.19 na 45.22 na 3,218.2 3,374.7 2,880.5 na 2,515.9 naSum of Large Firms 12.12 17.65 16.65 17.55 22.28 na 1,173.3 1,257.5 1,075.8 1,157.9 892.8 naBaosteel Group na na na 5.46 8.23 na na na na 143.9 154.4 na Shanghai Steel Pl. 2.35 2.95 2.55 na na na 117.7 98.0 90.8 na na na Baoshan 1.58 2.89 3.30 3.43 3.74 na 31.8 33.3 34.3 32.6 14.6 na Shanghai Meishan 0.22 0.30 0.28 0.43 0.53 na 23.6 25.8 24.7 23.4 20.9 na Shougang 1.66 2.35 2.25 2.20 2.78 na 201.5 249.6 214.9 206.6 136.0 na Anshan 2.03 2.55 2.04 2.03 2.49 na 217.8 199.8 176.0 170.7 na na Wuhan 1.40 1.90 1.95 1.69 2.13 na 138.2 137.9 117.5 115.9 102.7 na Panzhihua 0.47 0.86 1.18 1.23 1.21 na 65.5 103.1 95.8 105.7 80.5 na Baotou 0.52 0.99 1.03 1.02 1.07 na 79.1 100.6 91.9 90.3 80.3 na Taiyuan 0.18 0.25 0.28 0.28 0.30 na 67.5 70.6 71.9 76.1 62.1 na Benxi 0.59 0.97 1.40 0.91 1.21 na 98.6 101.2 90.3 87.7 99.4 na Maanshan na na na na 1.08 na na na na na 69.5 na Maanshan Magang na 0.74 na na na na na 51.8 45.7 na na na Maanshan Ir & St 0.61 0.73 0.88 0.76 na na 79.4 56.1 35.0 45.0 na na Hunan Hualing na na 0.82 0.78 0.90 na na na 55.2 58.0 54.6 na Xiangtan 0.21 0.28 na 0.31 0.38 na 25.6 25.2 25.7 25.9 22.3 na Lianyuan 0.19 0.32 na 0.35 0.37 na 21.0 23.7 22.9 24.6 24.4 na Hengyang 0.10 0.12 na 0.11 0.12 na 6.0 6.6 6.6 7.4 6.6 naNote: Data coverage is incomplete for some companies and variables; see Appendix for details and sources.
24

Table 2: Mean Operating Profit-Sales and Net Profit-Sales Ratios, Non-consolidated Accounting (percent)Operating Profit-Sales Ratios Net Profit-Sales Ratios
Firm1990-1992
1993-1996
1997-1998 1999 2000 2001
1990-1992
1993-1996
1997-1998 1999 2000 2001
All Japanese Firms 6.56 2.53 2.66 2.33 4.29 1.44 2.24 -0.17 -0.90 -1.62 -0.50 -2.44 Nippon Steel 5.78 3.65 6.37 4.95 6.35 1.89 1.86 0.28 0.82 0.01 0.99 -1.67 NKK 5.39 2.95 2.15 4.52 5.81 1.27 1.50 0.29 -1.98 0.34 0.15 -1.94 Sumitomo Metal I. 8.72 5.54 5.80 3.32 7.43 4.19 2.03 -0.81 -0.98 -10.18 0.69 0.13 Kobe Steel 7.92 6.11 5.81 6.40 6.64 3.83 1.67 -0.28 -0.91 -1.81 -7.42 -2.64 Kawasaki Steel 6.63 2.66 4.82 3.85 6.93 2.99 1.83 -0.86 -3.18 0.85 -3.55 -1.50 Hitachi Metals 4.96 2.95 1.39 3.97 2.42 -7.22 2.66 1.87 -0.04 -4.19 1.21 -9.75 Nisshin Steel 6.52 3.64 1.29 4.25 7.21 -4.74 1.14 1.58 0.02 -1.73 0.67 -8.31 Daido Steel 3.06 1.40 0.75 3.68 4.66 0.70 1.64 0.88 -0.08 0.29 1.35 0.42 Yodogawa St. Wk. 7.70 5.87 4.55 0.84 0.99 0.57 3.97 3.59 2.79 1.20 1.00 -3.52 Nippon Yakin K. 6.37 0.90 -5.23 -1.76 3.23 1.25 1.54 -2.08 -6.20 -7.38 -1.28 1.20 Kurimoto 5.56 5.33 3.22 1.07 2.00 -1.79 2.59 2.71 0.70 0.52 0.17 -4.38 Toa Steel Co., Ltd. 11.07 -2.32 -14.81 na na na 8.47 -3.13 -18.20 na na na Tokyo Steel Mfg. 20.22 -6.22 -5.85 -7.92 -1.98 -7.03 12.37 -7.01 -7.76 -11.80 -2.90 -6.10 Aichi Steel 3.07 1.45 1.66 4.59 4.78 1.84 1.53 0.64 0.47 2.39 0.38 1.06 Japan Steel Works 6.58 0.56 4.29 2.10 3.31 2.48 5.83 -1.47 0.19 -2.54 -1.94 0.32 Toyo Kohan 5.45 6.82 5.47 4.51 4.86 1.78 2.99 3.13 1.89 2.57 3.30 1.03
All Korean Firms 6.58 8.77 8.99 8.74 10.00 na 1.80 3.24 -0.47 10.60 -5.59 na Pohang Steel 7.33 14.53 16.96 17.01 17.95 12.89 2.38 6.78 8.79 14.57 14.00 7.39 INI Steel 8.10 4.54 7.63 6.01 9.34 7.46 3.30 1.47 0.19 3.72 2.44 1.19 Kang Won Ind. 7.29 6.17 7.21 na na na 2.71 1.44 -2.85 na na na Dongkuk 7.20 5.57 2.62 4.06 3.93 8.67 4.22 3.65 3.96 3.55 -9.69 0.58 Dongbu 4.58 5.42 7.65 6.13 6.25 6.01 1.05 2.11 0.84 2.58 0.24 -0.29 Hyundai Hysco 3.32 3.48 5.77 1.68 8.10 10.38 0.95 -1.50 1.08 -4.77 -5.77 1.13
All Taiwanese Firms 8.25 10.81 na na na na na na na na na na China Steel na 19.29 20.61 16.46 21.09 8.69 17.19 10.85 17.32 16.82 18.46 8.77 Yieh United Steel na na na na na na na 0.21 -3.66 4.61 2.67 na
All Chinese Firms na na na na na na 5.57 6.28 0.33 na 3.06 na Baosteel Group na na na na na na na na na 3.32 2.27 na Shanghai Steel Pl. na na na na na na 1.15 2.92 2.11 na na na Baoshan na na na na na na 12.06 18.33 6.03 5.29 9.67 na Shanghai Meishan na na na na na na 7.40 2.60 2.10 0.08 0.04 na Shougang na na na na na na 21.81 14.51 1.45 1.38 -0.19 na Anshan na na na na na na 8.81 6.45 0.48 0.49 0.01 na Wuhan na na na na na na 12.23 10.34 2.18 2.37 3.44 na Panzhihua na na na na na na 3.92 3.05 0.05 0.08 3.45 na Baotou na na na na na na 4.25 9.84 1.37 0.82 0.06 na Taiyuan na na na na na na 25.58 26.24 7.08 8.23 4.51 na Benxi na na na na na na 11.88 9.89 0.61 0.80 0.02 na Maanshan na na na na na na na na na na 1.85 na Maanshan Magang na na na na na na na 0.80 na na na na Maanshan Ir & St na na na na na na 6.30 10.61 -0.66 0.21 na na Hunan Hualing na na na na na na na na 2.08 2.60 3.75 na Xiangtan na na na na na na 7.62 4.66 na 1.19 1.02 na Lianyuan na na na na na na 6.87 9.74 na 4.20 0.52 na Hengyang na na na na na na 7.06 2.05 na 1.71 5.14 naNote: Data coverage is incomplete for some companies and variables; see Appendix for details and sources.
25
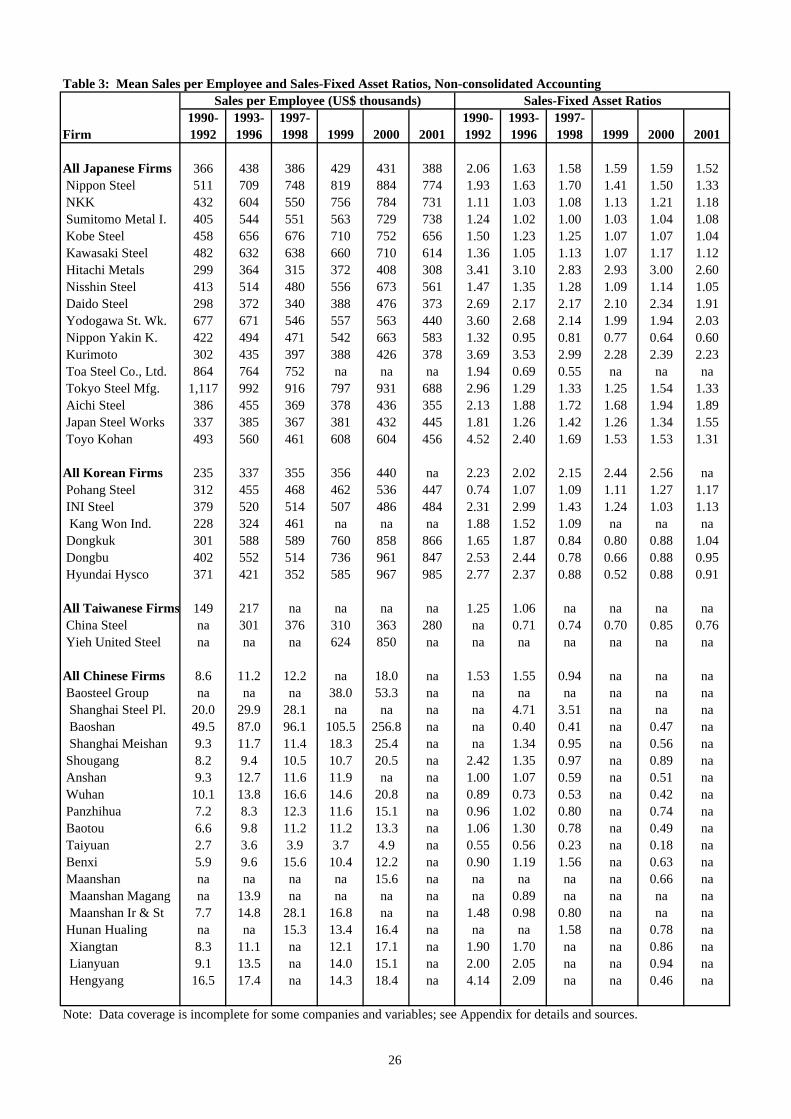
Table 3: Mean Sales per Employee and Sales-Fixed Asset Ratios, Non-consolidated AccountingSales per Employee (US$ thousands) Sales-Fixed Asset Ratios
Firm1990-1992
1993-1996
1997-1998 1999 2000 2001
1990-1992
1993-1996
1997-1998 1999 2000 2001
All Japanese Firms 366 438 386 429 431 388 2.06 1.63 1.58 1.59 1.59 1.52 Nippon Steel 511 709 748 819 884 774 1.93 1.63 1.70 1.41 1.50 1.33 NKK 432 604 550 756 784 731 1.11 1.03 1.08 1.13 1.21 1.18 Sumitomo Metal I. 405 544 551 563 729 738 1.24 1.02 1.00 1.03 1.04 1.08 Kobe Steel 458 656 676 710 752 656 1.50 1.23 1.25 1.07 1.07 1.04 Kawasaki Steel 482 632 638 660 710 614 1.36 1.05 1.13 1.07 1.17 1.12 Hitachi Metals 299 364 315 372 408 308 3.41 3.10 2.83 2.93 3.00 2.60 Nisshin Steel 413 514 480 556 673 561 1.47 1.35 1.28 1.09 1.14 1.05 Daido Steel 298 372 340 388 476 373 2.69 2.17 2.17 2.10 2.34 1.91 Yodogawa St. Wk. 677 671 546 557 563 440 3.60 2.68 2.14 1.99 1.94 2.03 Nippon Yakin K. 422 494 471 542 663 583 1.32 0.95 0.81 0.77 0.64 0.60 Kurimoto 302 435 397 388 426 378 3.69 3.53 2.99 2.28 2.39 2.23 Toa Steel Co., Ltd. 864 764 752 na na na 1.94 0.69 0.55 na na na Tokyo Steel Mfg. 1,117 992 916 797 931 688 2.96 1.29 1.33 1.25 1.54 1.33 Aichi Steel 386 455 369 378 436 355 2.13 1.88 1.72 1.68 1.94 1.89 Japan Steel Works 337 385 367 381 432 445 1.81 1.26 1.42 1.26 1.34 1.55 Toyo Kohan 493 560 461 608 604 456 4.52 2.40 1.69 1.53 1.53 1.31
All Korean Firms 235 337 355 356 440 na 2.23 2.02 2.15 2.44 2.56 na Pohang Steel 312 455 468 462 536 447 0.74 1.07 1.09 1.11 1.27 1.17 INI Steel 379 520 514 507 486 484 2.31 2.99 1.43 1.24 1.03 1.13 Kang Won Ind. 228 324 461 na na na 1.88 1.52 1.09 na na na Dongkuk 301 588 589 760 858 866 1.65 1.87 0.84 0.80 0.88 1.04 Dongbu 402 552 514 736 961 847 2.53 2.44 0.78 0.66 0.88 0.95 Hyundai Hysco 371 421 352 585 967 985 2.77 2.37 0.88 0.52 0.88 0.91
All Taiwanese Firms 149 217 na na na na 1.25 1.06 na na na na China Steel na 301 376 310 363 280 na 0.71 0.74 0.70 0.85 0.76 Yieh United Steel na na na 624 850 na na na na na na na
All Chinese Firms 8.6 11.2 12.2 na 18.0 na 1.53 1.55 0.94 na na na Baosteel Group na na na 38.0 53.3 na na na na na na na Shanghai Steel Pl. 20.0 29.9 28.1 na na na na 4.71 3.51 na na na Baoshan 49.5 87.0 96.1 105.5 256.8 na na 0.40 0.41 na 0.47 na Shanghai Meishan 9.3 11.7 11.4 18.3 25.4 na na 1.34 0.95 na 0.56 na Shougang 8.2 9.4 10.5 10.7 20.5 na 2.42 1.35 0.97 na 0.89 na Anshan 9.3 12.7 11.6 11.9 na na 1.00 1.07 0.59 na 0.51 na Wuhan 10.1 13.8 16.6 14.6 20.8 na 0.89 0.73 0.53 na 0.42 na Panzhihua 7.2 8.3 12.3 11.6 15.1 na 0.96 1.02 0.80 na 0.74 na Baotou 6.6 9.8 11.2 11.2 13.3 na 1.06 1.30 0.78 na 0.49 na Taiyuan 2.7 3.6 3.9 3.7 4.9 na 0.55 0.56 0.23 na 0.18 na Benxi 5.9 9.6 15.6 10.4 12.2 na 0.90 1.19 1.56 na 0.63 na Maanshan na na na na 15.6 na na na na na 0.66 na Maanshan Magang na 13.9 na na na na na 0.89 na na na na Maanshan Ir & St 7.7 14.8 28.1 16.8 na na 1.48 0.98 0.80 na na na Hunan Hualing na na 15.3 13.4 16.4 na na na 1.58 na 0.78 na Xiangtan 8.3 11.1 na 12.1 17.1 na 1.90 1.70 na na 0.86 na Lianyuan 9.1 13.5 na 14.0 15.1 na 2.00 2.05 na na 0.94 na Hengyang 16.5 17.4 na 14.3 18.4 na 4.14 2.09 na na 0.46 na
Note: Data coverage is incomplete for some companies and variables; see Appendix for details and sources.
26

Table 4: Operating Profit-Sales Ratios and Sales per Employee in Japanese Firms, Consolidated AccountingOperating Profit-Sales Ratios (%) Sales per Employee (US$ thousands)
Firm1990-1992
1993-1996
1997-1998 1999 2000 2001
1990-1992
1993-1996
1997-1998 1999 2000 2001
All Operations Nippon Steel 5.93 3.50 4.63 4.49 5.91 2.83 na na na 438 476 na NKK 4.49 3.14 1.86 3.67 4.51 -0.46 325 426 374 382 406 na Sumitomo Metal I. 7.07 5.09 3.82 0.65 6.05 2.97 440 381 308 326 366 na Kobe Steel 8.25 6.67 4.66 6.60 7.75 2.96 392 436 380 389 412 na Kawasaki Steel 6.85 2.32 4.21 3.57 6.03 3.61 395 na na 367 396 na Hitachi Metals 4.98 4.17 2.63 4.57 5.29 -2.69 216 209 154 155 182 na Nisshin Steel 6.86 4.38 1.99 3.62 5.80 -2.63 394 440 379 465 534 na Daido Steel 3.54 1.94 0.79 3.49 4.89 1.62 307 373 321 300 337 na Yodogawa St. Wk. 7.74 6.42 4.93 2.24 1.85 1.26 667 614 527 492 467 na Nippon Yakin K. 5.57 0.59 -2.96 0.17 3.52 1.41 411 447 401 401 457 na Kurimoto 5.88 5.93 3.24 2.31 2.66 -1.08 305 427 385 380 411 na Toa Steel Co., Ltd. 9.93 -2.00 -13.86 na na na na na na na na na Tokyo Steel Mfg. na na na na na na na na na na na na Aichi Steel na 1.66 1.70 4.49 4.29 1.44 na 367 331 310 365 na Japan Steel Works 6.59 1.01 4.16 2.61 3.86 3.25 264 270 218 235 238 na Toyo Kohan 6.04 7.17 5.39 4.98 5.33 2.84 450 454 338 364 361 na
Steel Operations only Nippon Steel 5.93 2.91 6.01 3.90 5.89 1.28 na na na 770 526 na NKK na 2.51 2.30 4.59 4.63 -2.72 na na na 414 427 na Sumitomo Metal I. na 6.63 6.04 2.07 7.43 5.82 na na na 481 527 na Kobe Steel na 8.15 8.50 8.42 8.58 2.32 na na na 443 438 354 Kawasaki Steel 7.42 3.65 6.48 3.65 6.65 3.90 na na na 376 410 na Hitachi Metals na 3.44 4.28 5.19 5.55 -0.53 na na na 214 237 na Nisshin Steel na na na na na na na na na 417 475 na Daido Steel na 1.35 0.60 5.57 5.35 0.77 na na na 429 478 343 Yodogawa St. Wk. na 6.35 4.92 2.28 1.87 1.32 na na na 533 531 na Nippon Yakin K. na 1.00 -2.69 -0.63 3.94 1.50 na na na 388 450 na Kurimoto na 8.10 4.35 2.23 3.20 -0.53 na na na 403 438 na Toa Steel Co., Ltd. na -2.69 -17.32 na na na na na na na na na Tokyo Steel Mfg. na na na na na na na na na na na na Aichi Steel na na na 8.81 4.00 1.22 na na na 488 578 na Japan Steel Works na 2.80 3.17 2.91 6.84 8.44 na na na 188 206 na Toyo Kohan na 6.89 5.96 6.28 6.59 3.55 na na na 452 447 na
Note: Data coverage is incomplete for some companies and variables; see Appendix for details and sources.
27
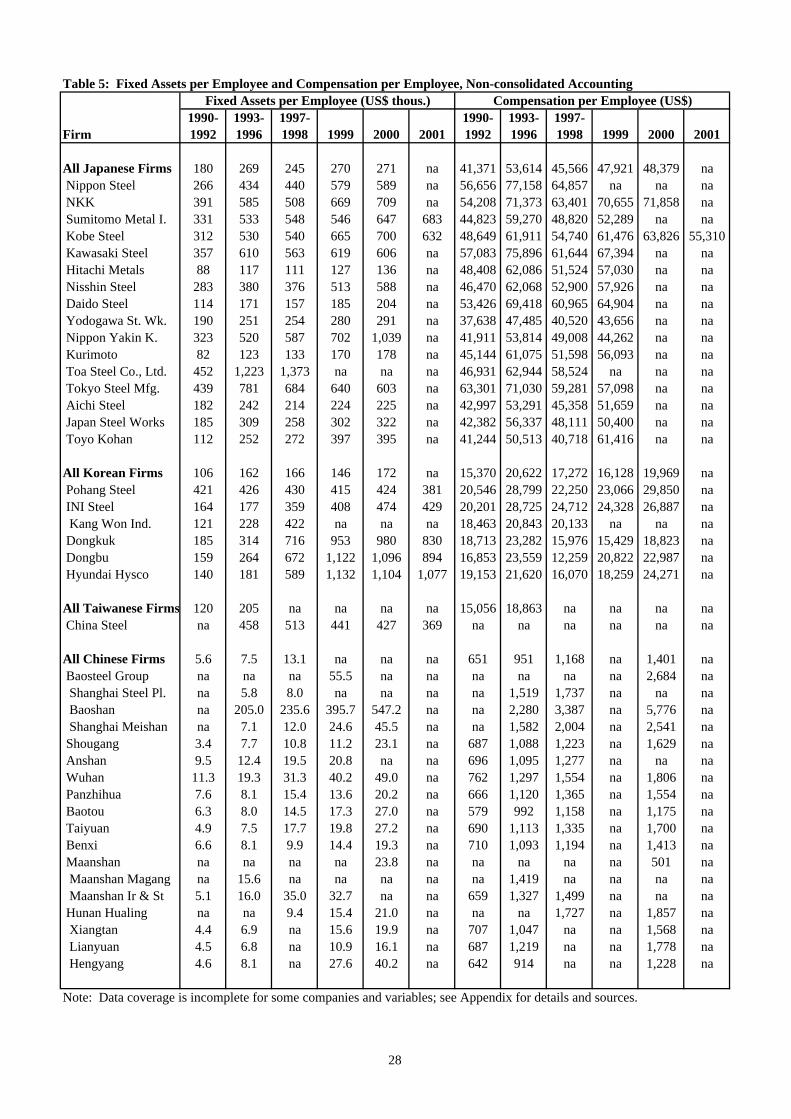
Table 5: Fixed Assets per Employee and Compensation per Employee, Non-consolidated AccountingFixed Assets per Employee (US$ thous.) Compensation per Employee (US$)
Firm1990-1992
1993-1996
1997-1998 1999 2000 2001
1990-1992
1993-1996
1997-1998 1999 2000 2001
All Japanese Firms 180 269 245 270 271 na 41,371 53,614 45,566 47,921 48,379 na Nippon Steel 266 434 440 579 589 na 56,656 77,158 64,857 na na na NKK 391 585 508 669 709 na 54,208 71,373 63,401 70,655 71,858 na Sumitomo Metal I. 331 533 548 546 647 683 44,823 59,270 48,820 52,289 na na Kobe Steel 312 530 540 665 700 632 48,649 61,911 54,740 61,476 63,826 55,310 Kawasaki Steel 357 610 563 619 606 na 57,083 75,896 61,644 67,394 na na Hitachi Metals 88 117 111 127 136 na 48,408 62,086 51,524 57,030 na na Nisshin Steel 283 380 376 513 588 na 46,470 62,068 52,900 57,926 na na Daido Steel 114 171 157 185 204 na 53,426 69,418 60,965 64,904 na na Yodogawa St. Wk. 190 251 254 280 291 na 37,638 47,485 40,520 43,656 na na Nippon Yakin K. 323 520 587 702 1,039 na 41,911 53,814 49,008 44,262 na na Kurimoto 82 123 133 170 178 na 45,144 61,075 51,598 56,093 na na Toa Steel Co., Ltd. 452 1,223 1,373 na na na 46,931 62,944 58,524 na na na Tokyo Steel Mfg. 439 781 684 640 603 na 63,301 71,030 59,281 57,098 na na Aichi Steel 182 242 214 224 225 na 42,997 53,291 45,358 51,659 na na Japan Steel Works 185 309 258 302 322 na 42,382 56,337 48,111 50,400 na na Toyo Kohan 112 252 272 397 395 na 41,244 50,513 40,718 61,416 na na
All Korean Firms 106 162 166 146 172 na 15,370 20,622 17,272 16,128 19,969 na Pohang Steel 421 426 430 415 424 381 20,546 28,799 22,250 23,066 29,850 na INI Steel 164 177 359 408 474 429 20,201 28,725 24,712 24,328 26,887 na Kang Won Ind. 121 228 422 na na na 18,463 20,843 20,133 na na na Dongkuk 185 314 716 953 980 830 18,713 23,282 15,976 15,429 18,823 na Dongbu 159 264 672 1,122 1,096 894 16,853 23,559 12,259 20,822 22,987 na Hyundai Hysco 140 181 589 1,132 1,104 1,077 19,153 21,620 16,070 18,259 24,271 na
All Taiwanese Firms 120 205 na na na na 15,056 18,863 na na na na China Steel na 458 513 441 427 369 na na na na na na
All Chinese Firms 5.6 7.5 13.1 na na na 651 951 1,168 na 1,401 na Baosteel Group na na na 55.5 na na na na na na 2,684 na Shanghai Steel Pl. na 5.8 8.0 na na na na 1,519 1,737 na na na Baoshan na 205.0 235.6 395.7 547.2 na na 2,280 3,387 na 5,776 na Shanghai Meishan na 7.1 12.0 24.6 45.5 na na 1,582 2,004 na 2,541 na Shougang 3.4 7.7 10.8 11.2 23.1 na 687 1,088 1,223 na 1,629 na Anshan 9.5 12.4 19.5 20.8 na na 696 1,095 1,277 na na na Wuhan 11.3 19.3 31.3 40.2 49.0 na 762 1,297 1,554 na 1,806 na Panzhihua 7.6 8.1 15.4 13.6 20.2 na 666 1,120 1,365 na 1,554 na Baotou 6.3 8.0 14.5 17.3 27.0 na 579 992 1,158 na 1,175 na Taiyuan 4.9 7.5 17.7 19.8 27.2 na 690 1,113 1,335 na 1,700 na Benxi 6.6 8.1 9.9 14.4 19.3 na 710 1,093 1,194 na 1,413 na Maanshan na na na na 23.8 na na na na na 501 na Maanshan Magang na 15.6 na na na na na 1,419 na na na na Maanshan Ir & St 5.1 16.0 35.0 32.7 na na 659 1,327 1,499 na na na Hunan Hualing na na 9.4 15.4 21.0 na na na 1,727 na 1,857 na Xiangtan 4.4 6.9 na 15.6 19.9 na 707 1,047 na na 1,568 na Lianyuan 4.5 6.8 na 10.9 16.1 na 687 1,219 na na 1,778 na Hengyang 4.6 8.1 na 27.6 40.2 na 642 914 na na 1,228 na
Note: Data coverage is incomplete for some companies and variables; see Appendix for details and sources.
28

Table 6: Exports and Export-Sales Ratios, Non-consolidated AccountingExports (US$ billions) Export-Sales Ratios (percent)
Company1990-1992
1993-1996
1997-1998 1999 2000 2001
1990-1992
1993-1996
1997-1998 1999 2000 2001
Japanese Exports 13.61 15.84 15.97 14.18 15.79 14.42 10.05 10.68 14.13 11.89 14.01 14.76
Large Japanese Firms, non-consolidated accountingSum of Large firms na 15.76 14.70 14.00 na na na 19.61 23.40 22.64 na na Nippon Steel 4.03 4.62 4.41 3.90 3.83 3.25 21.14 22.48 26.76 24.02 22.87 24.19 NKK 1.86 2.36 2.08 2.24 na na 19.08 20.79 24.64 25.26 na na Sumitomo Metal I. 1.87 2.23 2.15 2.06 na 2.22 21.86 22.44 27.32 25.21 na 36.00 Kobe Steel 1.64 1.92 1.66 1.48 na na 17.24 18.01 20.29 19.76 na na Kawasaki Steel 1.88 2.36 2.32 2.26 2.35 2.22 21.57 25.64 32.38 32.97 33.33 38.94 Hitachi Metals 0.32 0.44 0.41 0.60 0.60 0.35 12.92 14.95 16.91 22.19 22.25 18.69 Nisshin Steel 0.41 0.51 0.46 0.42 na na 13.00 13.97 16.52 15.11 na na Daido Steel 0.17 0.21 0.21 0.21 0.25 0.18 7.74 8.25 10.59 10.22 11.37 11.35 Yodogawa St. Wk. 0.06 0.06 0.06 0.10 na na 4.08 4.00 5.90 9.06 na na Nippon Yakin K. 0.13 0.17 0.14 0.12 na na 17.55 20.24 21.89 20.04 na na Kurimoto 0.04 0.03 0.03 0.02 na na 3.76 2.30 2.78 1.60 na na Toa Steel Co., Ltd. 0.04 0.10 0.08 na na na 2.64 7.25 7.21 na na na Tokyo Steel Mfg. 0.10 0.15 0.18 0.06 0.09 na 5.98 10.31 16.32 6.29 8.64 na Aichi Steel 0.11 0.09 0.08 0.08 na na 7.95 6.18 6.88 7.04 na na Japan Steel Works 0.26 0.36 0.36 0.35 na na 21.59 30.73 35.46 35.82 na na Toyo Kohan 0.04 0.07 0.10 0.10 na na 4.50 6.36 11.60 10.79 na na
Korean Exports 4.24 5.26 6.78 6.31 7.19 6.26 22.65 21.49 29.74 26.65 25.48 na
Large Korean Firms, non-consolidated accountingSum of Large firms 4.02 4.90 5.20 5.64 4.70 4.21 35.55 33.09 38.03 42.39 28.40 29.15 Pohang Steel 3.35 4.02 3.87 3.65 2.62 2.23 44.33 41.69 42.94 40.61 25.34 26.00 INI Steel 0.17 0.32 0.39 0.93 0.62 0.57 14.93 19.56 28.35 67.72 26.84 25.70 Kang Won Ind. 0.07 0.10 0.15 na na na 12.53 12.36 15.77 na na na Dongkuk 0.09 0.12 0.31 0.46 0.47 0.56 10.94 10.63 30.38 38.08 34.69 40.40 Dongbu 0.24 0.23 0.32 0.36 0.56 0.49 25.53 20.38 37.83 36.22 42.50 43.90 Hyundai Hysco 0.11 0.12 0.16 0.25 0.43 0.35 31.44 25.17 39.78 32.53 35.11 31.60
Taiwanese Exports 1.16 2.17 3.46 4.01 5.20 4.30 8.88 14.04 na na na na
Taiwanese Firms, non-consolidated accounting (foreign sales used instead of exports)All Taiwanese Firms 1.09 2.14 na na na na na na na na na na China Steel 0.43 0.49 0.61 na 0.75 0.82 18.97 17.60 18.00 na 23.25 32.62
Chinese Exports 1.51 3.20 4.57 3.39 5.32 3.97 13.09 19.19 27.37 19.81 24.43 na
Note: Data coverage is incomplete for some companies and variables; see Appendix for details and sources.
29

Table 7: Mean Shares of North America and Asia in Total Foreign Sales or Total Exports (percent)North America Asia
Country or Firm1990-1992
1993-1996
1997-1998 1999 2000 2001
1990-1992
1993-1996
1997-1998 1999 2000 2001
Shares of Exports from Northeast Asian CountriesJapan 18.32 12.89 19.77 15.20 13.84 13.38 68.28 76.20 68.21 74.26 77.16 75.30Korea 17.26 12.45 18.03 20.15 20.82 18.23 74.39 83.03 71.33 68.77 67.13 69.54Taiwan 14.70 9.77 10.37 14.73 16.36 9.52 72.65 82.34 78.51 77.03 74.62 83.38China 6.02 9.06 13.14 16.85 17.50 16.29 87.94 80.06 71.20 66.22 68.34 66.38
Shares of Foreign sales in Large Japanese Firms, consolidated accounting Nippon Steel na na na na na na na na 50.00 64.47 65.87 67.42 NKK na na 63.74 58.45 61.70 57.84 na na na na na na Sumitomo Metal I. na na na na na na na na na 56.07 55.71 55.44 Kobe Steel na na na na na na na na 48.20 56.00 55.72 52.25 Kawasaki Steel na na na na na na na na na 62.49 64.09 61.97
Shares of Foreign Sales in Pohang Steel, non-consolidated accounting Pohang Steel na na na 20.48 12.82 10.74 na na na 69.58 76.95 70.40
Shares of Foreign Sales in China Steel, non-consolidated accounting China Steel na na na na na na 99.18 99.38 na na 93.36 95.79
Note: Data coverage is incomplete for some companies and variables; see Appendix for details and sources.
30

Table 8: Total Liability-Total Asset and Current Liability-Total Asset Ratios, Non-consolidated Accounting (%)Total Liability-Total Asset Ratios Current Liability-Total Asset Ratios
Firm1990-1992
1993-1996
1997-1998 1999 2000 2001
1990-1992
1993-1996
1997-1998 1999 2000 2001
All Japanese Firms 72.82 72.97 72.41 71.70 70.07 72.06 41.40 39.11 36.68 34.94 34.64 na Nippon Steel 73.23 73.65 73.48 72.29 69.95 71.03 40.40 34.14 31.43 28.56 31.04 34.50 NKK 79.54 78.86 78.31 78.05 78.25 78.83 44.99 39.97 40.45 34.17 31.51 35.89 Sumitomo Metal I. 73.62 75.11 75.36 78.48 77.40 81.23 35.97 37.30 29.77 24.36 27.12 32.90 Kobe Steel 79.04 79.66 77.81 77.82 79.81 79.51 40.63 43.16 41.39 32.57 31.71 35.78 Kawasaki Steel 69.48 72.70 72.55 69.43 68.36 73.34 33.27 27.08 23.60 21.95 25.30 26.64 Hitachi Metals 58.96 56.34 56.04 60.65 58.51 60.52 28.37 25.97 24.60 22.08 32.67 26.54 Nisshin Steel 63.49 60.31 60.29 60.96 57.98 61.07 32.20 36.01 34.52 32.13 31.94 31.81 Daido Steel 72.44 71.10 65.89 64.15 60.22 58.03 38.20 40.92 41.09 36.58 34.98 37.16 Yodogawa St. Wk. 51.75 45.94 30.81 32.50 31.09 24.60 31.99 28.15 22.49 20.28 23.77 19.84 Nippon Yakin K. 69.09 73.67 79.79 83.93 75.19 76.12 40.66 50.06 56.49 67.24 54.15 60.82 Kurimoto 52.12 48.70 44.63 43.78 44.68 44.94 39.51 39.05 33.27 29.76 29.87 32.01 Toa Steel Co., Ltd. 66.40 75.52 85.89 na na na 43.98 35.90 38.77 na na na Tokyo Steel Mfg. 39.52 32.98 29.31 24.86 24.89 23.92 27.37 21.31 26.89 20.34 20.36 18.34 Aichi Steel 44.20 44.20 41.19 39.62 39.51 36.48 24.42 21.32 25.10 15.02 19.09 18.67 Japan Steel Works 74.07 69.69 69.13 74.38 73.65 72.64 58.93 48.61 43.48 50.78 45.32 47.99 Toyo Kohan 64.68 62.33 60.66 55.73 53.13 48.51 46.32 36.92 36.90 36.04 37.81 35.90
All Korean Firms 62.75 66.22 69.75 65.91 64.77 na 31.07 37.06 35.88 23.16 27.68 na Pohang Steel 56.20 55.35 55.84 47.25 46.92 42.12 20.67 23.70 21.60 17.38 19.76 12.79 INI Steel 57.44 65.63 67.53 54.26 65.73 61.41 38.91 50.63 37.69 31.62 35.23 30.49 Kang Won Ind. 59.17 72.07 70.89 na na na 30.79 41.74 41.57 na na na Dongkuk 55.79 61.68 74.47 56.88 64.42 59.55 33.48 48.81 41.06 25.76 42.40 43.27 Dongbu 74.44 65.60 73.00 67.84 67.52 67.86 27.56 32.44 34.61 32.44 44.91 42.15 Hyundai Hysco 60.91 71.23 83.60 61.24 61.63 59.88 48.58 56.00 44.89 33.26 37.86 27.08
All Taiwanese Firms na na na na na na na na na na na na China Steel na 34.39 36.07 34.50 32.78 31.80 na 22.87 19.75 13.45 14.28 12.87
All Chinese Firms na 57.17 59.45 na 57.01 na na 42.47 40.78 na 39.56 na Baosteel Group na na na 65.79 51.71 na na na na 37.50 35.03 na Shanghai Steel Pl. na 67.80 64.73 na na na na 53.92 49.06 na na na Baoshan na 25.07 34.54 36.41 35.12 na na 19.04 20.09 17.19 20.11 na Shanghai Meishan na 58.41 59.95 84.19 85.57 na na 55.52 54.35 44.47 52.65 na Shougang na 49.11 52.21 49.30 44.65 na na 32.86 38.89 36.98 37.57 na Anshan na 60.17 46.95 51.74 52.25 na na 49.70 35.16 29.33 33.70 na Wuhan na 56.37 56.52 54.00 54.30 na na 33.69 32.47 33.95 34.31 na Panzhihua na 70.28 69.69 66.56 66.26 na na 46.34 34.34 33.18 37.17 na Baotou na 50.39 56.29 60.54 51.52 na na 30.09 35.27 38.03 31.93 na Taiyuan na 52.33 53.72 55.65 58.15 na na 42.27 33.76 28.79 32.13 na Benxi na 60.25 65.37 64.59 65.64 na na 40.24 35.32 30.53 33.97 na Maanshan na na na na 50.76 na na na na na 28.42 na Maanshan Magang na 32.81 na na na na na 27.16 na na na na Maanshan Ir & St na 30.40 35.50 34.59 na na na 22.46 26.31 25.72 na na Hunan Hualing na na 62.47 57.57 56.13 na na na 36.41 37.60 38.16 na Xiangtan na 38.85 na 56.27 54.93 na na 28.14 na 40.33 37.83 na Lianyuan na 49.56 na 80.46 54.31 na na na na 49.63 28.47 na Hengyang na 83.32 na 85.22 47.94 na na na na 40.85 38.25 naNote: Data coverage is incomplete for some companies and variables; see Appendix for details and sources.
31

32
Appendix A: Time Series Detail, Data Sources, and Data Notes
The purpose of this appendix is to (1) present time series detail underlying the text tables
that were omitted from the text to conserve space and (2) detail the sources used when constructing
the series used in the text and appendix tables and (3) present data notes that could not be presented
in the text tables because of space constraints. First, time series detail is presented in Appendix
Tables 1a-8c. Second, Appendix Tables 9a-9b detail the data sources used. Third, this text
details notes to the text tables that could not be presented in the tables themselves because of space
constraints.
Table 1 (Appendix Tables 1a, 1b, 1c, 1d). Annuals sales were converted to US dollars using
average annual exchange rates from International Monetary Fund (2002).
Data omissions for sales: for Toa Steel, 1997-1998 refers to 1997; for all Taiwanese firms,
1990-1992 refers to 1991 and 1993-1996 refers to 1996; for Yieh United Steel, 1993-1996 refers to
1995-1996; for Maanshan Magang, 1993-1996 refers to 1995.
Data omissions for employment: for Toa Steel, 1993-1996 refers to 1993, 1995-1996 and
1997-1998 refers to 1997; for all Taiwanese firms, 1990-1992 refers to 1991 and 1993-1996 refers
to 1996; for China Steel 1997-1198 refers to 1997; for Yieh United Steel, 1993-1996 refers to
1996; for all Chinese firms, 1997-1998 refers to 1998; for Shanghai Steel Plants, 1997-1998 refers
to 1997; for Maanshan Magang, 1993-1996 refers to 1995-1996 and 1997-1998 refers to 1997; for
Hunan Hualing, 1997-1998 refers to 1998; for Xiangtan, 1997-1998 refers to 1998; for Lianyuan,
1997-1998 refers to 1998; for Hengyang, 1997-1998 refers to 1998.
Table 2 (Appendix Tables 2a, 2b, 2c). Operating profits are revenues less operating costs which
include intermediate goods and services, labor compensation, and selling and administration costs.
Net profits are operating profits less non-operating profits (non-operating income less
non-operating expenses), extraordinary items, and taxes.
Data omissions for operating profit-sales ratios: for Toa Steel, 1997-1998 refers to 1997; for all

33
Taiwanese firms, 1990-1992 refers to 1991 and 1993-1996 refers to 1996; for China Steel,
1993-1996 refers to 1994-1996.
Data omissions for net profit-sales ratios: for Toa Steel, 1997-1998 refers to 1997; for Yeih United
Steel, 1993-1996 refers to 1996; for Shanghai Steel Plants, 1997-1998 refers to 1997; for
Maanshan Magang, 1993-1996 refers to 1995.
Table 3 (Appendix Tables 3a, 3b, 3c). Fixed assets are as reported in company’s balance sheets,
and are usually given in their current book values (historical cost). Fixed assets of Chinese firms
are valued at current replacement value (historical cost less depreciation). Annual sales per
employee were converted to US dollars using annual average exchange rates from International
Monetary Fund (2002).
Data omissions for sales per employee ratios: for Toa Steel, 1997-1998 refers to 1997; for Kang
Won Industries, 1993-1996 refers to 1993-1995; for Dongbu, 1993-1996 refers to 1993-1995; for
Nyundai Hysco, 1993-1996 refers to 1993-1995; for all Taiwanese firms, 1990-1992 refers to 1991
and 1993-1996 refers to 1996; for China Steel, 1997-1998 refers to 1997; for Yeih United,
1993-1996 refers to 1996; for all Chinese firms, 1997-1998 refers to 1998; for Maanshan Magang,
1993-1996 refers to 1995; for Hunan Hualing, 1997-1998 refers to 1998.
Data omissions for sales-fixed asset ratios: for Toa Steel, 1997-1998 refers to 1997; for all
Taiwanese firms, 1990-1992 refers to 1991 and 1993-1996 refers to 1996; for China Steel,
1993-1996 refers to 1994-1996; for all Chinese firms, 1997-1998 refers to 1998; for Shanghai Steel
Plants, 1993-1996 refers to 1994-1996 and 1997-1998 refers to 1997; for Baoshan, 1993-1996
refers to 1994-1996; for Shanghai Meishan, 1993-1996 refers to 1994-1996; for Maanshan Magang,
1993-1996 refers to 1995.
Table 4 (Appendix Table 4). Operating profits are as defined in notes to Table 2. Annual sales
per employee were converted to US dollars using annual average exchange rates from International
Monetary Fund (2002).
Data omissions for operating profit-sales ratios: for NKK, 1993-1996 refers to 1993, 1995-1996;

34
for Sumitomo Metal Industries, 1993-1996 refers to 1993, 1995-1996; for Kobe Steel, 1993-1996
refers to 1993, 1995-1996; for Kawasaki Steel, 1990-1992 refers to 1991-1992; for Hitachi Metals,
1993-1996 refers to 1993 and 1995 and 1997-1998 refers to 1998; for Daido Steel, 1993-1996
refers to 1993, 1995-1996; for Yodogawa Steel Works, 1993-1996 refers to 1993, 1995-1996; for
Nippon Yakin Kogyo, 1993-1996 refers to 1993, 1995-1996; for Kurimoto, 1993-1996 refers to
1993, 1995-1996; for Toa Steel Company, 1993-1996 refers to 1993, 1995-1996 and 1997-1998
refers to 1997; for Japan Steel Works, 1993-1996 refers to 1993, 1995-1996; for Toyo Kohan,
1993-1996 refers to 1995-1996.
Table 5 (Appendix Tables 5a, 5b, 5c). Fixed assets are as defined in notes to Table 3. Fixes
assets and employee compensation were converted to US dollars using annual average exchange
rates from International Monetary Fund (2002).
Data omissions for fixed assets per employee ratios: for Toa Steel, 1993-1996 refers to 1993 and
1995-1996 and 1997-1998 refers to 1997; for all Korean firms, 1993-1996 refers to 1993-1994 and
1996; for all Taiwanese firms, 1990-1992 refers to 1991 and 1993-1996 refers to 1996; for China
Steel, 1993-1996 refers to 1994-1996 and 1997-1998 refers to 1997; for all Chinese firms,
1997-1998 refers to 1998; for Shanghai Steel Plants, 1993-1996 refers to 1994-1996 and
1997-1998 refers to 1997; for Baoshan, 1993-1996 refers to 1994-1996; for Shanghai Meishan,
1993-1996 refers to 1994-1996; for Maanshan Magang, 1993-1996 refers to 1995; for Hunan
Hualing, 1997-1998 refers to 1998; for Xiangtan, 1997-1998 refers to 1998; for Lianyuan,
1997-1998 refers to 1998; for Hengyang, 1997-1998 refers to 1998.
Data omissions for compensation per employee ratios: for Toa Steel, 1993-1996 refers to 1993 and
1995-1996 and 1997-1998 refers to 1997; for all Taiwanese firms, 1990-1992 refers to 1991 and
1993-1996 refers to 1996; for all Chinese firms, 1997-1998 refers to 1998; for Shanghai Steel
Plants, 1997-1998 refers to 1997; for Maanshan Magang, 1993-1996 refers to 1995-1996 and
1997-1998 refers to 1997; for Hunan Hualing, 1997-1998 refers to 1998; for Xiangtan, 1997-1998
refers to 1998; for Lianyuan, 1997-1998 refers to 1998; for Hengyang, 1997-1998 refers to 1998.

35
Table 6 (Appendix Tables 6a, 6b, 6c): In the case of all Taiwanese firms and China Steel, exports
are proxied with foreign sales. The major difference between exports and foreign sales is that the
latter include both exports and the overseas sales of foreign affiliates. Exports are converted to
US dollars using annual average exchange rates from International Monetary Fund (2002).
Data omissions for exports: for Toa Steel, 1997-1998 refers to 1997; for all Taiwanese firms,
1990-1992 refers to 1991 and 1993-1996 refers to 1996; for China Steel, 1997-1998 refers to 1997.
Data omissions for export-sales ratios: for large Japanese firms, 1993-1996 refers to 1993 and
1995-1996; for Toa Steel, 1997-1998 refers to 1997; for all Taiwanese firms, 1990-1992 refers to
1991 and 1993-1996 refers to 1996; for China Steel, 1997-1998 refers to 1997.
Table 7 (Appendix Table 7). Data omissions: for NKK, 1997-1998 refers to 1998; for China Steel,
1990-1992 refers to 1992 and 1993-1996 refers to 1993 and 1995.
Table 8 (Appendix Tables 8a, 8b, 8c). Total liabilities include long-term and current liabilities.
Total liabilities and equity are equal to total assets.
Data omissions total liability-total asset ratios: for Toa Steel, 1997-1998 refers to 1997; for China
Steel, 1993-1996 refers to 1994-1996; ; for all Chinese firms, 1993-1996 refers to 1994-1996 and
1997-1998 refers to 1998; for Shanghai Steel Plants, 1993-1996 refers to 1994-1996 and
1997-1998 refers to 1997; for Baoshan, 1993-1996 refers to 1994-1996; for Shanghai Meishan,
1993-1996 refers to 1994-1996; for Shougang, 1993-1996 refers to 1994-1996; for Anshan,
1993-1996 refers to 1994-1996; for Wuhan, 1993-1996 refers to 1994-1996; for Panzhihua,
1993-1996 refers to 1994-1996; for Baotou, 1993-1996 refers to 1994-1996; for Taiyuan,
1993-1996 refers to 1994-1996; for Benxi, 1993-1996 refers to 1994-1996; for Maanshan Magang,
1993-1996 refers to 1995; for Maanshan Iron and Steel, 1993-1996 refers to 1994-1996; for Hunan
Hualing, 1993-1996 refers to 1994-1996; for Xiangtan, 1993-1996 refers to 1994-1996; for
Lianyuan, 1993-1996 refers to 1996; for Hengyuan, 1993-1996 refers to 1996.
Data omissions current liability-total asset ratios: for Toa Steel, 1997-1998 refers to 1997; for
China Steel, 1993-1996 refers to 1994-1996; ; for all Chinese firms, 1993-1996 refers to

36
1994-1996 and 1997-1998 refers to 1998; for Shanghai Steel Plants, 1993-1996 refers to
1994-1996 and 1997-1998 refers to 1997; for Baoshan, 1993-1996 refers to 1994-1996; for
Shanghai Meishan, 1993-1996 refers to 1994-1996; for Shougang, 1993-1996 refers to 1994-1996;
for Anshan, 1993-1996 refers to 1994-1996; for Wuhan, 1993-1996 refers to 1994-1996; for
Panzhihua, 1993-1996 refers to 1994-1996; for Baotou, 1993-1996 refers to 1994-1996; for
Taiyuan, 1993-1996 refers to 1994-1996; for Benxi, 1993-1996 refers to 1994-1996; for Maanshan
Magang, 1993-1996 refers to 1995; for Maanshan Iron and Steel, 1993-1996 refers to 1994-1996;
for Hunan Hualing, 1993-1996 refers to 1994-1996; for Xiangtan, 1993-1996 refers to 1994-1996;
for Lianyuan, 1993-1996 refers to 1996; for Hengyuan, 1993-1996 refers to 1996.

Appendix Table 1a: Sales, Non-consolidated Accounting (US$ billions)Firm 1990 1991 1992 1993 1994 1995 1996 1997 1998 1999 2000 2001
All Japanese Firms 134.12 137.56 134.49 141.68 152.74 163.29 136.50 126.82 101.30 119.20 112.75 97.70Sum of Large Firms 70.94 74.91 74.31 78.51 82.90 87.00 75.75 69.14 56.90 61.86 62.83 50.49 Nippon Steel 18.46 19.72 18.98 20.02 21.04 21.77 19.40 17.97 14.99 16.24 16.73 13.44 NKK 9.39 9.86 10.12 11.16 11.79 12.03 10.52 9.06 7.92 8.88 9.14 7.64 Sumitomo Metal I. 8.19 8.68 8.88 9.67 10.18 10.96 9.02 8.37 7.39 8.15 7.80 6.18 Kobe Steel 9.35 9.76 9.43 9.90 10.72 11.89 10.14 9.09 7.33 7.51 7.39 6.35 Kawasaki Steel 8.39 9.06 8.75 9.32 9.53 9.63 8.39 7.83 6.53 6.87 7.04 5.70 Hitachi Metals 2.48 2.53 2.46 2.58 2.98 3.37 2.84 2.63 2.22 2.73 2.69 1.89 Nisshin Steel 3.04 3.24 3.20 3.47 3.73 3.98 3.37 3.06 2.52 2.80 2.92 2.23 Daido Steel 2.31 2.24 2.16 2.23 2.66 2.75 2.36 2.19 1.75 2.05 2.22 1.63 Yodogawa Steel W. 1.34 1.37 1.34 1.37 1.38 1.45 1.28 1.14 0.95 1.05 1.00 0.75 Nippon Yakin K. 0.73 0.75 0.70 0.71 0.80 0.94 0.80 0.73 0.51 0.60 0.70 0.56 Kurimoto 0.92 1.04 1.19 1.37 1.44 1.53 1.41 1.26 1.10 1.04 1.10 0.88 Toa Steel Co., Ltd. 1.60 1.58 1.49 1.39 1.38 1.33 1.18 1.07 na na na na Tokyo Steel Mfg. 1.65 1.60 1.63 1.42 1.41 1.51 1.42 1.36 0.97 0.96 1.06 0.73 Aichi Steel 1.27 1.40 1.31 1.44 1.57 1.62 1.44 1.28 0.95 1.10 1.20 0.94 Japan Steel Works 0.94 1.11 1.69 1.38 1.10 1.10 1.15 1.12 0.96 0.97 0.94 0.93 Toyo Kohan 0.88 0.97 0.97 1.08 1.19 1.15 1.04 0.98 0.83 0.90 0.89 0.65
All Korean Firms 16.36 18.80 18.61 20.59 23.22 28.09 28.39 27.78 19.94 23.67 28.23 naSum of Large Firms 10.21 11.89 11.84 12.97 14.01 16.48 16.55 15.89 12.11 13.32 16.55 14.43 Pohang Steel 6.79 7.95 7.92 8.62 9.10 10.66 10.50 10.22 7.95 9.00 10.34 8.59 INI Steel 0.95 1.16 1.18 1.35 1.51 1.85 1.88 1.76 1.22 1.37 2.31 2.23 Kang Won Ind. 0.47 0.56 0.63 0.62 0.75 0.90 1.03 1.09 0.89 na na na Dongkuk 0.73 0.87 0.86 1.00 1.13 1.31 1.33 1.17 0.99 1.20 1.37 1.38 Dongbu 0.93 0.98 0.93 0.98 1.06 1.23 1.25 1.11 0.72 0.99 1.31 1.12 Hyundai Hysco 0.33 0.37 0.33 0.40 0.45 0.54 0.56 0.54 0.34 0.76 1.23 1.11
All Taiwanese Firms na 13.22 na na na na 19.77 na na na na na Sum of Large Firms 2.21 2.29 2.29 2.28 2.68 3.28 3.61 4.03 3.59 3.66 4.43 2.52 China Steel 2.21 2.29 2.29 2.28 2.68 3.16 3.11 3.41 2.94 2.79 3.22 2.52 Yieh United Steel na na na na na 0.12 0.50 0.63 0.65 0.88 1.21 na
All Chinese Firms 22.73 25.76 34.49 49.32 32.14 34.96 34.33 35.22 35.17 na 45.22 naSum of Large Firms 9.86 11.50 14.99 21.40 15.33 17.22 16.65 17.15 16.16 17.55 22.28 na Baosteel Group na na na na na na na na na 5.46 8.23 na Shanghai Steel Pl. 2.09 2.25 2.72 4.10 2.53 2.63 2.56 2.55 na na na na Baoshan 1.01 1.58 2.15 3.16 2.52 3.04 2.85 3.12 3.48 3.43 3.74 na Shanghai Meishan 0.20 0.20 0.27 0.49 0.24 0.25 0.21 0.25 0.32 0.43 0.53 na Shougang 1.44 1.49 2.04 2.61 2.25 2.50 2.06 2.17 2.33 2.20 2.78 na Anshan 1.62 1.95 2.53 3.29 2.29 2.23 2.37 2.10 1.98 2.03 2.49 na Wuhan 1.28 1.29 1.62 1.99 1.57 2.19 1.86 1.94 1.95 1.69 2.13 na Panzhihua 0.33 0.42 0.66 0.93 0.60 0.84 1.06 1.17 1.18 1.23 1.21 na Baotou 0.42 0.49 0.65 1.23 0.75 0.97 1.02 1.08 0.98 1.02 1.07 na Taiyuan 0.13 0.20 0.22 0.26 0.23 0.26 0.27 0.28 0.28 0.28 0.30 na Benxi 0.44 0.57 0.75 1.11 0.93 0.94 0.90 0.82 1.98 0.91 1.21 na Maanshan na na na na na na na na na na 1.08 na Maanshan Magang na na na na na 0.74 na na na na na na Maanshan Ir, & St, 0.51 0.57 0.75 1.13 0.79 0.09 0.92 0.90 0.85 0.76 na na Hunan Hualing na na na na na na na 0.79 0.84 0.78 0.90 na Xiangtan 0.19 0.20 0.25 0.44 0.24 0.21 0.21 na na 0.31 0.38 na Lianyuan 0.14 0.17 0.27 0.47 0.29 0.23 0.27 na na 0.35 0.37 na Hengyang 0.08 0.10 0.12 0.20 0.10 0.08 0.08 na na 0.11 0.12 naSources: See Appendix Tables 9a, 9b.
37

Appendix Table 1b: Employment, Non-consolidated Accounting (thousands)Firm 1990 1991 1992 1993 1994 1995 1996 1997 1998 1999 2000 2001
All Japanese Firms 373.8 372.3 364.8 365.9 347.5 335.9 310.4 308.3 280.8 277.8 261.3 252.1Sum of Large Firms 163.2 162.6 163.3 158.0 143.9 132.0 120.1 112.4 108.4 98.5 89.6 81.9 Nippon Steel 38.2 37.4 36.3 34.6 31.1 27.6 24.5 22.6 21.4 19.8 18.9 17.4 NKK 22.3 22.7 22.9 22.2 20.2 17.7 16.2 15.6 15.2 11.7 11.7 10.5 Sumitomo Metal I. 20.3 20.7 22.5 22.1 19.6 17.2 15.4 13.5 15.3 14.5 10.7 8.4 Kobe Steel 21.5 20.6 20.2 19.4 17.8 15.7 13.4 12.6 11.7 10.6 9.8 9.7 Kawasaki Steel 18.0 18.2 18.1 17.3 15.8 13.7 12.3 11.5 11.0 10.4 9.9 9.3 Hitachi Metals 8.4 8.3 8.3 8.0 7.9 8.3 8.1 7.8 7.6 7.3 6.6 6.1 Nisshin Steel 7.5 7.7 7.8 7.7 7.4 6.9 6.4 6.0 5.6 5.0 4.3 4.0 Daido Steel 7.5 7.5 7.5 7.2 7.0 6.6 6.2 5.9 5.7 5.3 4.7 4.4 Yodogawa Steel W. 1.9 2.0 2.1 2.1 2.1 2.0 2.0 1.9 1.9 1.9 1.8 1.7 Nippon Yakin K. 1.7 1.7 1.8 1.7 1.7 1.6 1.6 1.4 1.2 1.1 1.1 1.0 Kurimoto 3.5 3.5 3.5 3.4 3.4 3.3 3.2 3.0 2.9 2.7 2.6 2.3 Toa Steel Co., Ltd. 1.8 1.8 1.8 1.8 na 1.7 1.5 1.4 na na na na Tokyo Steel Mfg. 1.4 1.5 1.5 1.5 1.5 1.4 1.3 1.3 1.3 1.2 1.1 1.1 Aichi Steel 3.4 3.4 3.5 3.5 3.4 3.3 3.2 3.1 3.0 2.9 2.7 2.7 Japan Steel Works 3.7 3.7 3.7 3.5 3.1 2.9 2.8 2.8 2.8 2.6 2.2 2.1 Toyo Kohan 1.9 1.9 1.9 2.0 2.0 2.0 2.0 2.0 2.0 1.5 1.5 1.4
All Korean Firms 88.1 72.6 71.1 73.7 73.4 75.9 74.2 70.1 63.8 66.5 64.2 naSum of Large Firms 35.2 36.4 35.2 33.1 33.3 31.3 31.0 30.2 28.4 26.4 28.2 27.8 Pohang Steel 24.1 25.1 23.6 22.6 22.9 20.4 20.2 19.6 19.3 19.5 19.3 19.2 INI Steel 2.8 2.8 3.1 3.1 3.2 3.2 3.1 3.0 2.8 2.7 4.7 4.6 Kang Won Ind. 2.4 2.5 2.4 2.3 2.2 2.5 2.5 2.3 2.0 na na na Dongkuk 2.7 2.7 2.8 2.1 2.0 2.0 2.0 2.1 1.6 1.6 1.6 1.6 Dongbu 2.3 2.4 2.4 2.0 1.9 2.0 1.9 2.0 1.5 1.3 1.4 1.3 Hyundai Hysco 0.9 0.9 1.0 1.0 1.1 1.2 1.2 1.2 1.3 1.3 1.3 1.1
All Taiwanese Firms na 88.5 na na na na 91.3 na na na na na Sum of Large Firms 9.7 9.7 9.6 9.6 9.4 9.4 10.7 10.6 na 10.4 10.3 na China Steel 9.7 9.7 9.6 9.6 9.4 9.4 9.1 9.1 na 9.0 8.9 9.0 Yieh United Steel na na na na na na 1.6 1.6 1.3 1.4 1.4 na
All Chinese Firms 3,152.3 3,218.2 3,284.0 3,332.8 3,412.9 3,423.4 3,329.8 na 2,880.5 na 2,515.9 naSum of Large Firms 1,141.6 1,174.5 1,203.7 1,290.1 1,262.5 1,254.3 1,223.1 1,087.3 1,064.3 1,157.9 892.8 na Baosteel Group na na na na na na na na na 143.9 154.4 na Shanghai Steel Plant 118.7 118.2 116.1 107.7 101.1 93.5 89.8 90.8 na na na na Baoshan 31.9 31.9 31.8 31.8 33.5 33.9 33.9 34.2 34.4 32.6 14.6 na Shanghai Meishan 22.0 23.5 25.3 25.5 26.2 25.8 25.6 25.5 23.8 23.4 20.9 na Shougang 186.3 195.9 222.3 262.3 259.8 246.4 229.8 218.0 211.9 206.6 136.0 na Anshan 217.3 219.2 216.9 207.9 196.1 197.5 197.5 180.3 171.7 170.7 na na Wuhan 136.7 137.3 140.5 139.4 139.3 138.3 134.6 119.5 115.4 115.9 102.7 na Panzhihua 64.2 66.4 65.9 102.5 99.5 104.8 105.9 95.7 96.0 105.7 80.5 na Baotou 77.3 80.1 80.0 105.1 98.4 100.9 98.1 94.4 89.5 90.3 80.3 na Taiyuan 66.4 67.5 68.7 69.4 70.0 71.5 71.6 67.9 75.8 76.1 62.1 na Benxi 94.0 100.7 101.0 100.7 101.0 102.6 100.6 91.4 89.2 87.7 99.4 na Maanshan na na na na na na na na na na 69.5 na Maanshan Magang na na na na na 53.5 50.1 45.7 na na na na Maanshan Iron & Ste 75.7 80.3 82.1 83.3 84.0 29.6 27.6 23.9 46.1 45.0 na na Hunan Hualing na na na na na na na na 55.2 58.0 54.6 na Xiangtan 25.9 26.0 24.9 24.4 25.1 24.8 26.4 na 25.7 25.9 22.3 na Lianyuan 19.7 21.4 22.1 23.3 21.6 24.5 25.3 na 22.9 24.6 24.4 na Hengyang 5.5 6.2 6.3 6.6 6.9 6.7 6.4 na 6.6 7.4 6.6 naSources: See Appendix Tables 9a, 9b.
38
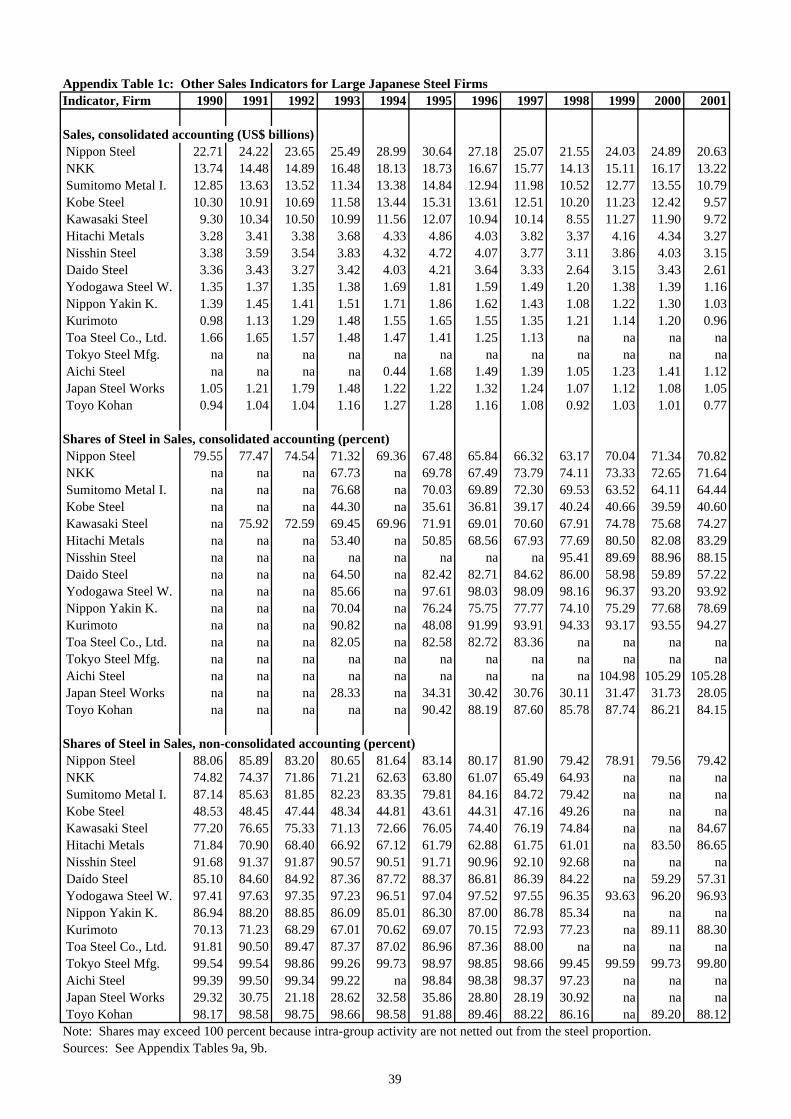
Appendix Table 1c: Other Sales Indicators for Large Japanese Steel FirmsIndicator, Firm 1990 1991 1992 1993 1994 1995 1996 1997 1998 1999 2000 2001
Sales, consolidated accounting (US$ billions) Nippon Steel 22.71 24.22 23.65 25.49 28.99 30.64 27.18 25.07 21.55 24.03 24.89 20.63 NKK 13.74 14.48 14.89 16.48 18.13 18.73 16.67 15.77 14.13 15.11 16.17 13.22 Sumitomo Metal I. 12.85 13.63 13.52 11.34 13.38 14.84 12.94 11.98 10.52 12.77 13.55 10.79 Kobe Steel 10.30 10.91 10.69 11.58 13.44 15.31 13.61 12.51 10.20 11.23 12.42 9.57 Kawasaki Steel 9.30 10.34 10.50 10.99 11.56 12.07 10.94 10.14 8.55 11.27 11.90 9.72 Hitachi Metals 3.28 3.41 3.38 3.68 4.33 4.86 4.03 3.82 3.37 4.16 4.34 3.27 Nisshin Steel 3.38 3.59 3.54 3.83 4.32 4.72 4.07 3.77 3.11 3.86 4.03 3.15 Daido Steel 3.36 3.43 3.27 3.42 4.03 4.21 3.64 3.33 2.64 3.15 3.43 2.61 Yodogawa Steel W. 1.35 1.37 1.35 1.38 1.69 1.81 1.59 1.49 1.20 1.38 1.39 1.16 Nippon Yakin K. 1.39 1.45 1.41 1.51 1.71 1.86 1.62 1.43 1.08 1.22 1.30 1.03 Kurimoto 0.98 1.13 1.29 1.48 1.55 1.65 1.55 1.35 1.21 1.14 1.20 0.96 Toa Steel Co., Ltd. 1.66 1.65 1.57 1.48 1.47 1.41 1.25 1.13 na na na na Tokyo Steel Mfg. na na na na na na na na na na na na Aichi Steel na na na na 0.44 1.68 1.49 1.39 1.05 1.23 1.41 1.12 Japan Steel Works 1.05 1.21 1.79 1.48 1.22 1.22 1.32 1.24 1.07 1.12 1.08 1.05 Toyo Kohan 0.94 1.04 1.04 1.16 1.27 1.28 1.16 1.08 0.92 1.03 1.01 0.77
Shares of Steel in Sales, consolidated accounting (percent) Nippon Steel 79.55 77.47 74.54 71.32 69.36 67.48 65.84 66.32 63.17 70.04 71.34 70.82 NKK na na na 67.73 na 69.78 67.49 73.79 74.11 73.33 72.65 71.64 Sumitomo Metal I. na na na 76.68 na 70.03 69.89 72.30 69.53 63.52 64.11 64.44 Kobe Steel na na na 44.30 na 35.61 36.81 39.17 40.24 40.66 39.59 40.60 Kawasaki Steel na 75.92 72.59 69.45 69.96 71.91 69.01 70.60 67.91 74.78 75.68 74.27 Hitachi Metals na na na 53.40 na 50.85 68.56 67.93 77.69 80.50 82.08 83.29 Nisshin Steel na na na na na na na na 95.41 89.69 88.96 88.15 Daido Steel na na na 64.50 na 82.42 82.71 84.62 86.00 58.98 59.89 57.22 Yodogawa Steel W. na na na 85.66 na 97.61 98.03 98.09 98.16 96.37 93.20 93.92 Nippon Yakin K. na na na 70.04 na 76.24 75.75 77.77 74.10 75.29 77.68 78.69 Kurimoto na na na 90.82 na 48.08 91.99 93.91 94.33 93.17 93.55 94.27 Toa Steel Co., Ltd. na na na 82.05 na 82.58 82.72 83.36 na na na na Tokyo Steel Mfg. na na na na na na na na na na na na Aichi Steel na na na na na na na na na 104.98 105.29 105.28 Japan Steel Works na na na 28.33 na 34.31 30.42 30.76 30.11 31.47 31.73 28.05 Toyo Kohan na na na na na 90.42 88.19 87.60 85.78 87.74 86.21 84.15
Shares of Steel in Sales, non-consolidated accounting (percent) Nippon Steel 88.06 85.89 83.20 80.65 81.64 83.14 80.17 81.90 79.42 78.91 79.56 79.42 NKK 74.82 74.37 71.86 71.21 62.63 63.80 61.07 65.49 64.93 na na na Sumitomo Metal I. 87.14 85.63 81.85 82.23 83.35 79.81 84.16 84.72 79.42 na na na Kobe Steel 48.53 48.45 47.44 48.34 44.81 43.61 44.31 47.16 49.26 na na na Kawasaki Steel 77.20 76.65 75.33 71.13 72.66 76.05 74.40 76.19 74.84 na na 84.67 Hitachi Metals 71.84 70.90 68.40 66.92 67.12 61.79 62.88 61.75 61.01 na 83.50 86.65 Nisshin Steel 91.68 91.37 91.87 90.57 90.51 91.71 90.96 92.10 92.68 na na na Daido Steel 85.10 84.60 84.92 87.36 87.72 88.37 86.81 86.39 84.22 na 59.29 57.31 Yodogawa Steel W. 97.41 97.63 97.35 97.23 96.51 97.04 97.52 97.55 96.35 93.63 96.20 96.93 Nippon Yakin K. 86.94 88.20 88.85 86.09 85.01 86.30 87.00 86.78 85.34 na na na Kurimoto 70.13 71.23 68.29 67.01 70.62 69.07 70.15 72.93 77.23 na 89.11 88.30 Toa Steel Co., Ltd. 91.81 90.50 89.47 87.37 87.02 86.96 87.36 88.00 na na na na Tokyo Steel Mfg. 99.54 99.54 98.86 99.26 99.73 98.97 98.85 98.66 99.45 99.59 99.73 99.80 Aichi Steel 99.39 99.50 99.34 99.22 na 98.84 98.38 98.37 97.23 na na na Japan Steel Works 29.32 30.75 21.18 28.62 32.58 35.86 28.80 28.19 30.92 na na na Toyo Kohan 98.17 98.58 98.75 98.66 98.58 91.88 89.46 88.22 86.16 na 89.20 88.12Note: Shares may exceed 100 percent because intra-group activity are not netted out from the steel proportion.Sources: See Appendix Tables 9a, 9b.
39

Appendix Table 1d: Other Employment Indicators for Large Japanese Steel FirmsFirm 1990 1991 1992 1993 1994 1995 1996 1997 1998 1999 2000 2001
Employment, consolidated accounting (thousands) Nippon Steel na na na na na na na na na 54.9 52.2 50.5 NKK 44.1 44.3 44.3 43.6 43.1 39.9 38.2 38.3 42.0 39.6 39.9 28.4 Sumitomo Metal I. 29.1 30.8 30.9 29.2 38.3 36.2 34.6 34.3 39.5 39.1 37.1 29.9 Kobe Steel 26.7 27.7 27.1 28.7 32.5 31.2 31.1 30.2 29.6 28.9 30.1 27.0 Kawasaki Steel 24.5 25.2 na na na na na na na 30.7 30.1 28.6 Hitachi Metals 15.1 15.7 15.8 14.8 23.3 22.7 21.3 21.9 25.0 26.9 23.8 22.9 Nisshin Steel 8.6 8.9 9.1 9.1 10.1 9.8 9.5 9.2 9.0 8.3 7.5 7.0 Daido Steel 10.6 11.1 11.0 10.6 10.5 10.2 9.7 9.4 9.1 10.5 10.2 9.6 Yodogawa Steel W. 2.0 2.0 2.1 2.6 2.7 2.7 2.5 2.6 2.5 2.8 3.0 2.8 Nippon Yakin K. 3.4 3.4 3.5 3.5 3.7 3.7 4.1 3.6 na 3.0 2.8 2.7 Kurimoto 3.7 3.7 3.7 3.7 3.7 3.6 3.5 3.4 3.2 3.0 2.9 2.7 Toa Steel Co., Ltd. na na na na na na na na na na na na Tokyo Steel Mfg. na na na na na na na na na na na na Aichi Steel na na na na 3.4 3.3 3.2 3.7 3.6 4.0 3.9 3.8 Japan Steel Works 5.0 5.1 5.2 4.9 4.7 4.9 4.9 5.2 5.4 4.8 4.6 4.4 Toyo Kohan na 2.2 2.4 2.4 2.7 2.8 2.9 2.9 3.0 2.8 2.8 2.8
Shares of Steel in Employment, consolidated accounting (percent) Nippon Steel na na na na na na na na na 39.84 64.63 na NKK na na na na na na na na na 67.62 69.01 na Sumitomo Metal I. na na na na na na na na na 43.06 44.51 na Kobe Steel na na na na na na na na na 35.75 37.29 40.70 Kawasaki Steel na na na na na na na na na 73.04 73.17 na Hitachi Metals na na na na na na na na na 58.26 63.32 na Nisshin Steel na na na na na na na na na 100.00 100.00 na Daido Steel na na na na na na na na na 41.31 42.24 na Yodogawa Steel W. na na na na na na na na na 89.09 81.92 na Nippon Yakin K. na na na na na na na na na 77.79 78.93 na Kurimoto na na na na na na na na na 87.91 87.70 na Toa Steel Co., Ltd. na na na na na na na na na na na na Tokyo Steel Mfg. na na na na na na na na na na na na Aichi Steel na na na na na na na na na 66.81 66.43 na Japan Steel Works na na na na na na na na na 39.21 36.63 na Toyo Kohan na na na na na na na na na 70.59 69.52 na
Shares of Steel in Employment, non-consolidated accounting (percent) Nippon Steel na na na na na na na na na na na na NKK na na na na na na na na na na na na Sumitomo Metal I. na na na na na na na na na na na na Kobe Steel na na na na na na na na na na na na Kawasaki Steel na 79.34 78.77 78.20 81.99 80.88 80.49 80.12 81.10 76.68 76.87 na Hitachi Metals na na na na na na na na na na na na Nisshin Steel na na na na na na na na na na na na Daido Steel na na na na na na na na na na na na Yodogawa Steel W. na na na na na na na na na na na na Nippon Yakin K. na na na na na na na na na na na na Kurimoto na na na na na na na na na na na na Toa Steel Co., Ltd. na na na na na na na na na na na na Tokyo Steel Mfg. na na na na na na na na na na na na Aichi Steel na na na na na na na na na na na na Japan Steel Works na na na na na na na na na na na na Toyo Kohan na na na na na na na na na na na naNote: Shares may exceed 100 percent because intra-group activity are not netted out from the steel proportion.Sources: See Appendix Tables 9a, 9b.
40
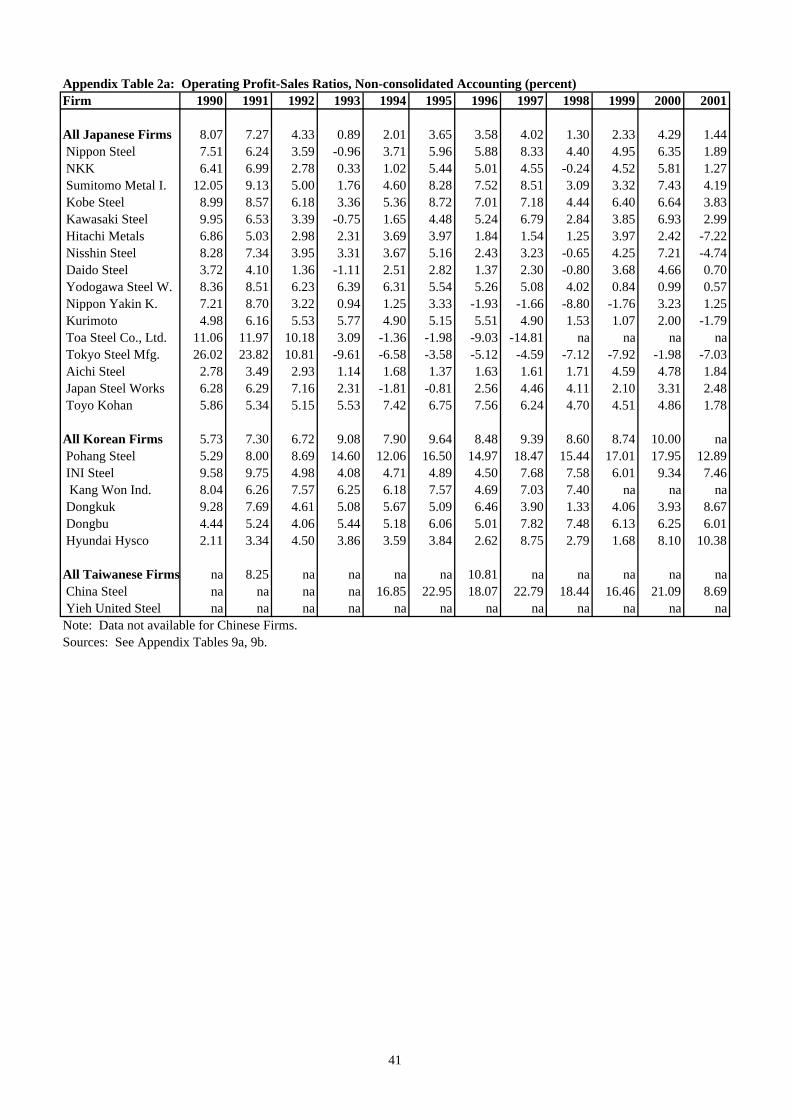
Appendix Table 2a: Operating Profit-Sales Ratios, Non-consolidated Accounting (percent)Firm 1990 1991 1992 1993 1994 1995 1996 1997 1998 1999 2000 2001
All Japanese Firms 8.07 7.27 4.33 0.89 2.01 3.65 3.58 4.02 1.30 2.33 4.29 1.44 Nippon Steel 7.51 6.24 3.59 -0.96 3.71 5.96 5.88 8.33 4.40 4.95 6.35 1.89 NKK 6.41 6.99 2.78 0.33 1.02 5.44 5.01 4.55 -0.24 4.52 5.81 1.27 Sumitomo Metal I. 12.05 9.13 5.00 1.76 4.60 8.28 7.52 8.51 3.09 3.32 7.43 4.19 Kobe Steel 8.99 8.57 6.18 3.36 5.36 8.72 7.01 7.18 4.44 6.40 6.64 3.83 Kawasaki Steel 9.95 6.53 3.39 -0.75 1.65 4.48 5.24 6.79 2.84 3.85 6.93 2.99 Hitachi Metals 6.86 5.03 2.98 2.31 3.69 3.97 1.84 1.54 1.25 3.97 2.42 -7.22 Nisshin Steel 8.28 7.34 3.95 3.31 3.67 5.16 2.43 3.23 -0.65 4.25 7.21 -4.74 Daido Steel 3.72 4.10 1.36 -1.11 2.51 2.82 1.37 2.30 -0.80 3.68 4.66 0.70 Yodogawa Steel W. 8.36 8.51 6.23 6.39 6.31 5.54 5.26 5.08 4.02 0.84 0.99 0.57 Nippon Yakin K. 7.21 8.70 3.22 0.94 1.25 3.33 -1.93 -1.66 -8.80 -1.76 3.23 1.25 Kurimoto 4.98 6.16 5.53 5.77 4.90 5.15 5.51 4.90 1.53 1.07 2.00 -1.79 Toa Steel Co., Ltd. 11.06 11.97 10.18 3.09 -1.36 -1.98 -9.03 -14.81 na na na na Tokyo Steel Mfg. 26.02 23.82 10.81 -9.61 -6.58 -3.58 -5.12 -4.59 -7.12 -7.92 -1.98 -7.03 Aichi Steel 2.78 3.49 2.93 1.14 1.68 1.37 1.63 1.61 1.71 4.59 4.78 1.84 Japan Steel Works 6.28 6.29 7.16 2.31 -1.81 -0.81 2.56 4.46 4.11 2.10 3.31 2.48 Toyo Kohan 5.86 5.34 5.15 5.53 7.42 6.75 7.56 6.24 4.70 4.51 4.86 1.78
All Korean Firms 5.73 7.30 6.72 9.08 7.90 9.64 8.48 9.39 8.60 8.74 10.00 na Pohang Steel 5.29 8.00 8.69 14.60 12.06 16.50 14.97 18.47 15.44 17.01 17.95 12.89 INI Steel 9.58 9.75 4.98 4.08 4.71 4.89 4.50 7.68 7.58 6.01 9.34 7.46 Kang Won Ind. 8.04 6.26 7.57 6.25 6.18 7.57 4.69 7.03 7.40 na na na Dongkuk 9.28 7.69 4.61 5.08 5.67 5.09 6.46 3.90 1.33 4.06 3.93 8.67 Dongbu 4.44 5.24 4.06 5.44 5.18 6.06 5.01 7.82 7.48 6.13 6.25 6.01 Hyundai Hysco 2.11 3.34 4.50 3.86 3.59 3.84 2.62 8.75 2.79 1.68 8.10 10.38
All Taiwanese Firms na 8.25 na na na na 10.81 na na na na na China Steel na na na na 16.85 22.95 18.07 22.79 18.44 16.46 21.09 8.69 Yieh United Steel na na na na na na na na na na na naNote: Data not available for Chinese Firms.Sources: See Appendix Tables 9a, 9b.
41

Appendix Table 2b: Net Profit-Sales Ratios, Non-consolidated Accounting (percent)Firm 1990 1991 1992 1993 1994 1995 1996 1997 1998 1999 2000 2001
All Japanese Firms 2.95 2.84 0.94 -1.14 -1.46 1.47 0.45 0.49 -2.28 -1.62 -0.50 -2.44 Nippon Steel 2.19 3.19 0.21 -1.43 0.45 1.18 0.91 1.61 0.03 0.01 0.99 -1.67 NKK 1.76 2.73 0.02 -2.35 -3.02 5.15 1.37 1.00 -4.97 0.34 0.15 -1.94 Sumitomo Metal I. 4.12 1.95 0.03 -3.30 -2.65 1.53 1.19 0.24 -2.20 -10.18 0.69 0.13 Kobe Steel 1.77 2.24 1.00 -0.09 -8.98 6.05 1.90 0.66 -2.48 -1.81 -7.42 -2.64 Kawasaki Steel 3.21 2.27 0.01 -3.89 -2.95 2.31 1.07 1.08 -7.45 0.85 -3.55 -1.50 Hitachi Metals 3.67 2.67 1.63 1.28 1.82 2.52 1.87 1.81 -1.90 -4.19 1.21 -9.75 Nisshin Steel 5.77 2.04 -4.40 0.57 1.48 3.46 0.80 0.98 -0.93 -1.73 0.67 -8.31 Daido Steel 2.05 2.08 0.78 0.73 1.18 0.91 0.71 0.72 -0.87 0.29 1.35 0.42 Yodogawa Steel W. 4.54 4.13 3.24 3.03 3.50 3.69 4.13 3.66 1.93 1.20 1.00 -3.52 Nippon Yakin K. 1.74 2.84 0.03 -2.08 -3.10 0.83 -3.98 -2.00 -10.39 -7.38 -1.28 1.20 Kurimoto 2.59 2.44 2.74 2.56 2.78 2.93 2.54 1.31 0.08 0.52 0.17 -4.38 Toa Steel Co., Ltd. 8.40 8.87 8.14 1.17 -3.52 -4.89 -5.26 -18.20 na na na na Tokyo Steel Mfg. 15.20 14.74 7.18 -8.04 -6.22 -6.72 -7.06 -6.08 -9.43 -11.80 -2.90 -6.10 Aichi Steel 1.50 1.69 1.41 0.53 0.83 0.52 0.69 0.48 0.45 2.39 0.38 1.06 Japan Steel Works 1.86 14.51 1.13 -0.85 -3.73 -1.75 0.46 0.32 0.05 -2.54 -1.94 0.32 Toyo Kohan 4.03 2.58 2.35 2.34 3.77 3.26 3.13 2.67 1.10 2.57 3.30 1.03
All Korean Firms 1.52 2.78 1.11 2.95 3.19 4.78 2.04 -1.02 0.08 10.60 -5.59 na Pohang Steel 1.64 2.50 2.99 4.26 5.24 10.22 7.39 7.50 10.08 14.57 14.00 7.39 INI Steel 4.72 3.62 1.57 1.06 2.29 1.65 0.89 0.29 0.09 3.72 2.44 1.19 Kang Won Ind. 2.03 3.23 2.87 2.05 1.85 1.84 0.04 0.04 -5.74 na na na Dongkuk 4.74 4.22 3.71 2.01 3.10 2.05 7.44 4.27 3.65 3.55 -9.69 0.58 Dongbu 1.57 1.01 0.56 2.00 1.94 3.29 1.23 0.89 0.80 2.58 0.24 -0.29 Hyundai Hysco 1.44 0.93 0.49 -1.58 -1.01 -1.70 -1.71 0.72 1.44 -4.77 -5.77 1.13
All Taiwanese Firms na na na na na na na na na na na na China Steel 20.13 17.41 14.04 8.86 13.47 9.80 11.25 16.02 18.62 16.82 18.46 8.77 Yieh United Steel na na na na na na 0.21 -4.45 -2.86 4.61 2.67 na
All Chinese Firms 6.12 5.19 5.40 10.21 9.50 3.89 1.54 0.35 0.31 na 3.06 na Baosteel Group na na na na na na na na na 3.32 2.27 na Shanghai Steel Pl. 1.23 0.47 1.74 5.53 2.92 1.77 1.46 2.11 na na na na Baoshan 12.31 15.01 8.87 18.31 26.35 15.39 13.25 8.51 3.56 5.29 9.67 na Shanghai Meishan 9.89 7.76 4.55 5.55 1.67 0.62 2.56 2.30 1.90 0.08 0.04 na Shougang 23.24 21.93 20.27 19.66 22.46 14.87 1.06 1.16 1.75 1.38 -0.19 na Anshan 9.83 9.45 7.16 10.88 11.37 1.77 1.78 0.47 0.50 0.49 0.01 na Wuhan 15.34 13.40 7.96 13.84 15.42 7.25 4.85 2.49 1.87 2.37 3.44 na Panzhihua 0.64 8.30 2.81 6.45 5.65 0.09 0.02 0.03 0.07 0.08 3.45 na Baotou 6.92 2.21 3.63 11.46 16.15 8.43 3.30 1.93 0.81 0.82 0.06 na Taiyuan 39.99 18.63 18.12 33.78 38.93 23.32 8.91 8.90 5.26 8.23 4.51 na Benxi 12.34 11.56 11.75 21.82 9.74 5.89 2.11 0.73 0.50 0.80 0.02 na Maanshan na na na na na na na na na na 1.85 na Maanshan Magang na na na na na 0.80 na na na na na na Maanshan Ir, & St, 8.35 5.34 5.19 30.04 11.44 -0.27 1.25 0.97 -2.29 0.21 na na Hunan Hualing na na na na na na na 2.21 1.96 2.60 3.75 na Xiangtan 9.22 6.16 7.47 8.51 9.43 0.34 0.35 na na 1.19 1.02 na Lianyuan 6.27 4.67 9.68 18.45 16.97 2.40 1.14 na na 4.20 0.52 na Hengyang 7.34 7.59 6.24 6.83 0.35 0.03 1.01 na na 1.71 5.14 naSources: See Appendix Tables 9a, 9b.
42

Appendix Table 2c: Profitability Indicators for Large Japanese Firms, Consolidated Accounting (percent)Indicator, Firm 1990 1991 1992 1993 1994 1995 1996 1997 1998 1999 2000 2001
Operating Profit-Sales Ratios, All Operations Nippon Steel 7.78 6.07 3.93 -0.40 3.20 6.55 4.64 5.90 3.35 4.49 5.91 2.83 NKK 5.62 5.46 2.39 0.21 2.14 5.20 5.03 3.95 -0.23 3.67 4.51 -0.46 Sumitomo Metal I. 9.40 7.36 4.46 1.86 4.17 7.30 7.02 6.71 0.92 0.65 6.05 2.97 Kobe Steel 9.10 8.86 6.78 4.18 6.86 9.30 6.36 5.50 3.83 6.60 7.75 2.96 Kawasaki Steel 9.67 6.79 4.08 -0.48 1.16 3.73 4.87 6.01 2.40 3.57 6.03 3.61 Hitachi Metals 7.56 4.82 2.56 2.55 5.10 5.49 3.52 3.00 2.25 4.57 5.29 -2.69 Nisshin Steel 8.44 7.54 4.61 3.85 4.45 5.75 3.45 3.63 0.36 3.62 5.80 -2.63 Daido Steel 4.18 4.34 2.10 0.10 2.89 2.93 1.83 2.37 -0.79 3.49 4.89 1.62 Yodogawa Steel W. 8.40 8.55 6.25 6.40 6.78 6.89 5.63 6.04 3.83 2.24 1.85 1.26 Nippon Yakin K. 6.38 6.86 3.47 0.98 0.60 1.49 -0.70 -1.31 -4.60 0.17 3.52 1.41 Kurimoto 5.24 6.36 6.04 6.13 5.60 5.77 6.22 5.33 1.14 2.31 2.66 -1.08 Toa Steel Co., Ltd. na na 9.93 3.14 -0.81 -1.52 -8.81 -13.86 na na na na Tokyo Steel Mfg. na na na na na na na na na na na na Aichi Steel na na na na 1.94 1.38 1.65 1.60 1.79 4.49 4.29 1.44 Japan Steel Works 6.42 6.45 6.91 2.44 -1.07 -0.18 2.85 4.28 4.04 2.61 3.86 3.25 Toyo Kohan 6.39 6.04 5.70 5.85 7.89 7.11 7.83 6.34 4.45 4.98 5.33 2.84
Net Profit-Sales Ratios, All Operations Nippon Steel 2.84 2.43 0.06 -1.97 -0.14 1.85 0.11 0.19 0.42 0.42 0.96 -1.10 NKK 1.52 0.42 -0.24 -2.27 -2.13 2.90 0.89 0.74 -6.00 -2.73 5.43 -4.08 Sumitomo Metal I. 2.98 1.65 0.04 -3.17 -2.18 1.50 1.82 0.27 -5.16 -10.19 0.39 -7.76 Kobe Steel 1.81 1.87 -1.07 -0.67 -6.92 6.11 1.14 -0.32 -2.98 -4.24 0.47 -2.38 Kawasaki Steel 3.31 1.04 -2.29 -1.86 -2.76 2.04 0.65 0.68 -10.40 0.99 -1.39 0.56 Hitachi Metals 3.47 1.90 0.74 1.00 2.30 4.25 1.59 0.68 -2.55 -0.27 2.02 -6.63 Nisshin Steel 5.38 2.08 -3.84 1.86 1.87 3.29 1.13 0.71 -1.25 -1.37 0.17 -6.39 Daido Steel 2.31 2.12 0.91 -0.62 1.02 0.93 0.63 0.41 -0.87 0.55 0.69 0.55 Yodogawa Steel W. 4.69 4.16 3.35 2.98 3.39 3.53 2.75 2.94 1.25 1.07 1.53 -2.59 Nippon Yakin K. 1.41 1.60 0.08 -1.92 -2.75 -1.02 -3.56 -2.74 -9.92 -4.55 -0.57 -4.72 Kurimoto 2.56 2.40 2.74 2.52 2.95 2.88 2.58 1.23 -0.88 0.80 -0.69 -4.66 Toa Steel Co., Ltd. 4.33 4.49 4.28 0.86 -3.66 -4.83 -4.31 -17.19 na na na na Tokyo Steel Mfg. na na na na na na na na na na na na Aichi Steel na na na na 0.71 0.53 0.71 0.45 0.42 2.27 0.26 0.45 Japan Steel Works 1.95 13.35 1.19 -0.65 -3.48 -1.39 0.32 0.36 -0.04 -1.80 -1.51 0.57 Toyo Kohan 3.97 2.64 2.35 2.30 3.86 3.21 3.24 2.60 0.70 2.44 2.94 1.23Sources: See Appendix Tables 9a, 9b.
43
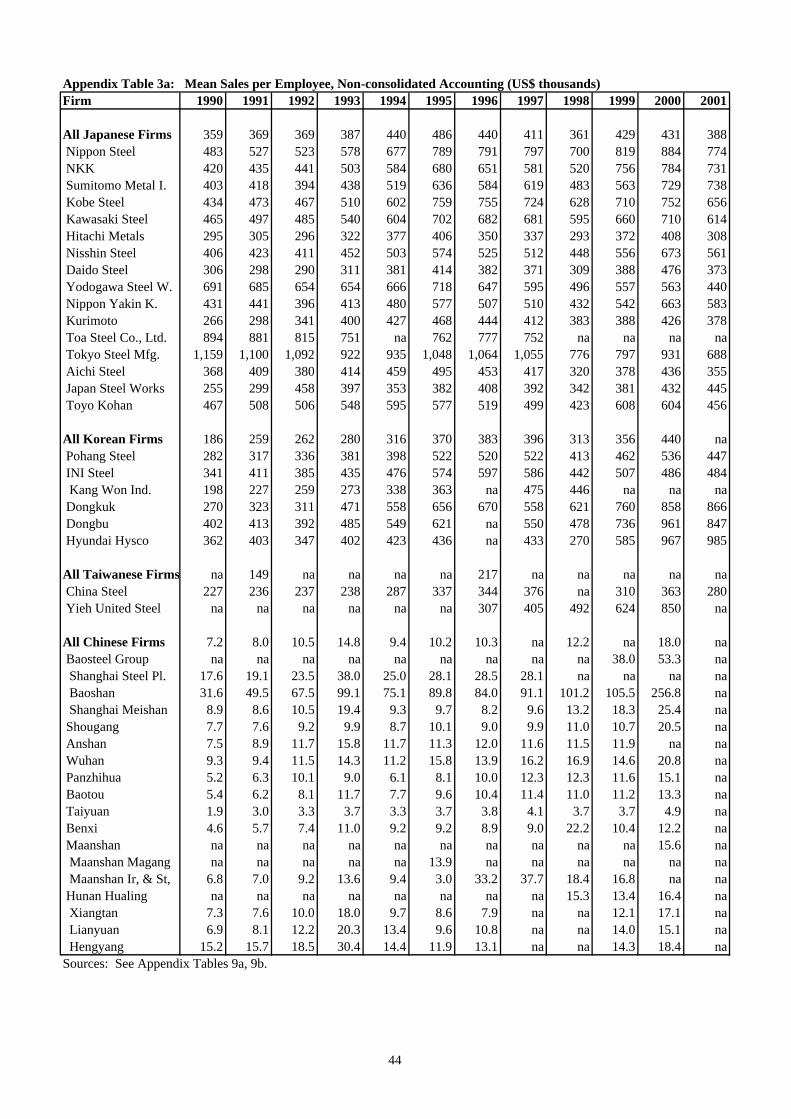
Appendix Table 3a: Mean Sales per Employee, Non-consolidated Accounting (US$ thousands)Firm 1990 1991 1992 1993 1994 1995 1996 1997 1998 1999 2000 2001
All Japanese Firms 359 369 369 387 440 486 440 411 361 429 431 388 Nippon Steel 483 527 523 578 677 789 791 797 700 819 884 774 NKK 420 435 441 503 584 680 651 581 520 756 784 731 Sumitomo Metal I. 403 418 394 438 519 636 584 619 483 563 729 738 Kobe Steel 434 473 467 510 602 759 755 724 628 710 752 656 Kawasaki Steel 465 497 485 540 604 702 682 681 595 660 710 614 Hitachi Metals 295 305 296 322 377 406 350 337 293 372 408 308 Nisshin Steel 406 423 411 452 503 574 525 512 448 556 673 561 Daido Steel 306 298 290 311 381 414 382 371 309 388 476 373 Yodogawa Steel W. 691 685 654 654 666 718 647 595 496 557 563 440 Nippon Yakin K. 431 441 396 413 480 577 507 510 432 542 663 583 Kurimoto 266 298 341 400 427 468 444 412 383 388 426 378 Toa Steel Co., Ltd. 894 881 815 751 na 762 777 752 na na na na Tokyo Steel Mfg. 1,159 1,100 1,092 922 935 1,048 1,064 1,055 776 797 931 688 Aichi Steel 368 409 380 414 459 495 453 417 320 378 436 355 Japan Steel Works 255 299 458 397 353 382 408 392 342 381 432 445 Toyo Kohan 467 508 506 548 595 577 519 499 423 608 604 456
All Korean Firms 186 259 262 280 316 370 383 396 313 356 440 na Pohang Steel 282 317 336 381 398 522 520 522 413 462 536 447 INI Steel 341 411 385 435 476 574 597 586 442 507 486 484 Kang Won Ind. 198 227 259 273 338 363 na 475 446 na na na Dongkuk 270 323 311 471 558 656 670 558 621 760 858 866 Dongbu 402 413 392 485 549 621 na 550 478 736 961 847 Hyundai Hysco 362 403 347 402 423 436 na 433 270 585 967 985
All Taiwanese Firms na 149 na na na na 217 na na na na na China Steel 227 236 237 238 287 337 344 376 na 310 363 280 Yieh United Steel na na na na na na 307 405 492 624 850 na
All Chinese Firms 7.2 8.0 10.5 14.8 9.4 10.2 10.3 na 12.2 na 18.0 na Baosteel Group na na na na na na na na na 38.0 53.3 na Shanghai Steel Pl. 17.6 19.1 23.5 38.0 25.0 28.1 28.5 28.1 na na na na Baoshan 31.6 49.5 67.5 99.1 75.1 89.8 84.0 91.1 101.2 105.5 256.8 na Shanghai Meishan 8.9 8.6 10.5 19.4 9.3 9.7 8.2 9.6 13.2 18.3 25.4 na Shougang 7.7 7.6 9.2 9.9 8.7 10.1 9.0 9.9 11.0 10.7 20.5 na Anshan 7.5 8.9 11.7 15.8 11.7 11.3 12.0 11.6 11.5 11.9 na na Wuhan 9.3 9.4 11.5 14.3 11.2 15.8 13.9 16.2 16.9 14.6 20.8 na Panzhihua 5.2 6.3 10.1 9.0 6.1 8.1 10.0 12.3 12.3 11.6 15.1 na Baotou 5.4 6.2 8.1 11.7 7.7 9.6 10.4 11.4 11.0 11.2 13.3 na Taiyuan 1.9 3.0 3.3 3.7 3.3 3.7 3.8 4.1 3.7 3.7 4.9 na Benxi 4.6 5.7 7.4 11.0 9.2 9.2 8.9 9.0 22.2 10.4 12.2 na Maanshan na na na na na na na na na na 15.6 na Maanshan Magang na na na na na 13.9 na na na na na na Maanshan Ir, & St, 6.8 7.0 9.2 13.6 9.4 3.0 33.2 37.7 18.4 16.8 na na Hunan Hualing na na na na na na na na 15.3 13.4 16.4 na Xiangtan 7.3 7.6 10.0 18.0 9.7 8.6 7.9 na na 12.1 17.1 na Lianyuan 6.9 8.1 12.2 20.3 13.4 9.6 10.8 na na 14.0 15.1 na Hengyang 15.2 15.7 18.5 30.4 14.4 11.9 13.1 na na 14.3 18.4 naSources: See Appendix Tables 9a, 9b.
44

Appendix Table 3b: Sales-Fixed Asset Ratios, Non-consolidated AccountingFirm 1990 1991 1992 1993 1994 1995 1996 1997 1998 1999 2000 2001
All Japanese Firms 2.33 2.10 1.74 1.61 1.60 1.67 1.62 1.73 1.43 1.59 1.59 1.52 Nippon Steel 2.07 1.99 1.74 1.58 1.57 1.62 1.75 1.83 1.58 1.41 1.50 1.33 NKK 1.17 1.14 1.01 0.95 0.98 1.06 1.14 1.09 1.08 1.13 1.21 1.18 Sumitomo Metal I. 1.38 1.25 1.08 1.01 1.00 1.06 1.02 1.02 0.99 1.03 1.04 1.08 Kobe Steel 1.75 1.51 1.24 1.11 1.16 1.30 1.35 1.36 1.15 1.07 1.07 1.04 Kawasaki Steel 1.43 1.40 1.24 1.14 1.01 0.97 1.06 1.16 1.10 1.07 1.17 1.12 Hitachi Metals 3.70 3.35 3.19 2.93 3.31 3.15 3.03 3.01 2.65 2.93 3.00 2.60 Nisshin Steel 1.61 1.47 1.32 1.32 1.34 1.35 1.40 1.42 1.14 1.09 1.14 1.05 Daido Steel 3.36 2.48 2.23 1.98 2.21 2.23 2.28 2.39 1.95 2.10 2.34 1.91 Yodogawa Steel W. 4.02 3.61 3.16 2.82 2.67 2.57 2.68 2.29 2.00 1.99 1.94 2.03 Nippon Yakin K. 1.48 1.34 1.13 0.94 0.95 0.99 0.91 0.92 0.70 0.77 0.64 0.60 Kurimoto 3.78 3.76 3.55 3.49 3.37 3.53 3.75 3.18 2.80 2.28 2.39 2.23 Toa Steel Co., Ltd. 2.20 2.05 1.57 1.07 0.66 0.50 0.54 0.55 na na na na Tokyo Steel Mfg. 4.61 2.53 1.73 1.47 1.38 1.14 1.18 1.39 1.28 1.25 1.54 1.33 Aichi Steel 2.18 2.32 1.89 1.71 1.85 1.94 2.04 1.90 1.54 1.68 1.94 1.89 Japan Steel Works 1.84 1.57 2.03 1.47 1.12 1.08 1.37 1.49 1.35 1.26 1.34 1.55 Toyo Kohan 5.37 4.19 3.99 3.51 2.54 1.73 1.82 1.72 1.66 1.53 1.53 1.31
All Korean Firms 2.28 2.30 2.13 2.06 2.03 na 1.96 2.06 2.25 2.44 2.56 na Pohang Steel 0.66 0.75 0.81 1.02 1.13 1.12 1.02 1.05 1.13 1.11 1.27 1.17 INI Steel 2.23 2.23 2.48 3.24 2.82 3.30 2.60 1.61 1.25 1.24 1.03 1.13 Kang Won Ind. 1.80 1.84 1.99 1.51 1.52 1.56 1.49 1.09 1.10 na na na Dongkuk 1.64 1.88 1.41 1.62 1.89 2.14 1.83 0.93 0.75 0.80 0.88 1.04 Dongbu 2.50 2.69 2.40 2.62 2.76 2.95 1.43 0.92 0.64 0.66 0.88 0.95 Hyundai Hysco 3.54 2.71 2.06 2.31 2.40 2.45 2.31 1.45 0.31 0.52 0.88 0.91
All Taiwanese Firms na 1.25 na na na na 1.06 na na na na na China Steel na na na na 0.70 0.75 0.67 0.73 0.75 0.70 0.85 0.76 Yieh United Steel na na na na na na na na na na na na
All Chinese Firms 1.40 1.48 1.71 2.21 1.55 1.30 1.12 na 0.94 na na na Baosteel Group na na na na na na na na na 0.68 na na Shanghai Steel Pl. na na na na 4.99 4.82 4.33 3.51 na na na na Baoshan na na na na 0.38 0.43 0.40 0.45 0.37 0.27 0.47 na Shanghai Meishan na na na na 1.60 1.51 0.91 0.90 0.99 0.74 0.56 na Shougang 2.15 2.23 2.87 1.89 1.63 1.03 0.85 0.92 1.01 0.95 0.89 na Anshan 0.90 1.14 0.95 1.21 1.26 1.11 0.70 0.62 0.57 0.57 0.51 na Wuhan 0.85 0.88 0.94 0.73 0.80 0.76 0.62 0.58 0.49 0.36 0.42 na Panzhihua 1.01 0.71 1.16 1.00 0.85 1.14 1.07 0.79 0.80 0.86 0.74 na Baotou 0.80 1.03 1.34 2.00 0.99 1.19 1.01 0.86 0.69 0.65 0.49 na Taiyuan 0.39 0.67 0.60 0.64 0.81 0.50 0.30 0.27 0.18 0.19 0.18 na Benxi 0.68 0.94 1.08 1.10 1.32 1.27 1.09 0.94 2.18 0.73 0.63 na Maanshan na na na na na na na na na na 0.66 na Maanshan Magang na na na na na 0.89 na na na na na na Maanshan Ir, & St, 1.36 1.40 1.69 1.62 0.94 0.52 0.83 0.81 0.80 0.51 na na Hunan Hualing na na na na na na na 1.53 1.63 0.87 0.78 na Xiangtan 1.81 1.70 2.18 3.00 1.72 1.03 1.05 na na 0.77 0.86 na Lianyuan 1.76 1.74 2.50 2.64 2.73 1.47 1.36 na na 1.29 0.94 na Hengyang 4.27 5.65 2.51 2.95 2.14 1.70 1.58 na na 0.52 0.46 naSources: See Appendix Tables 9a, 9b.
45
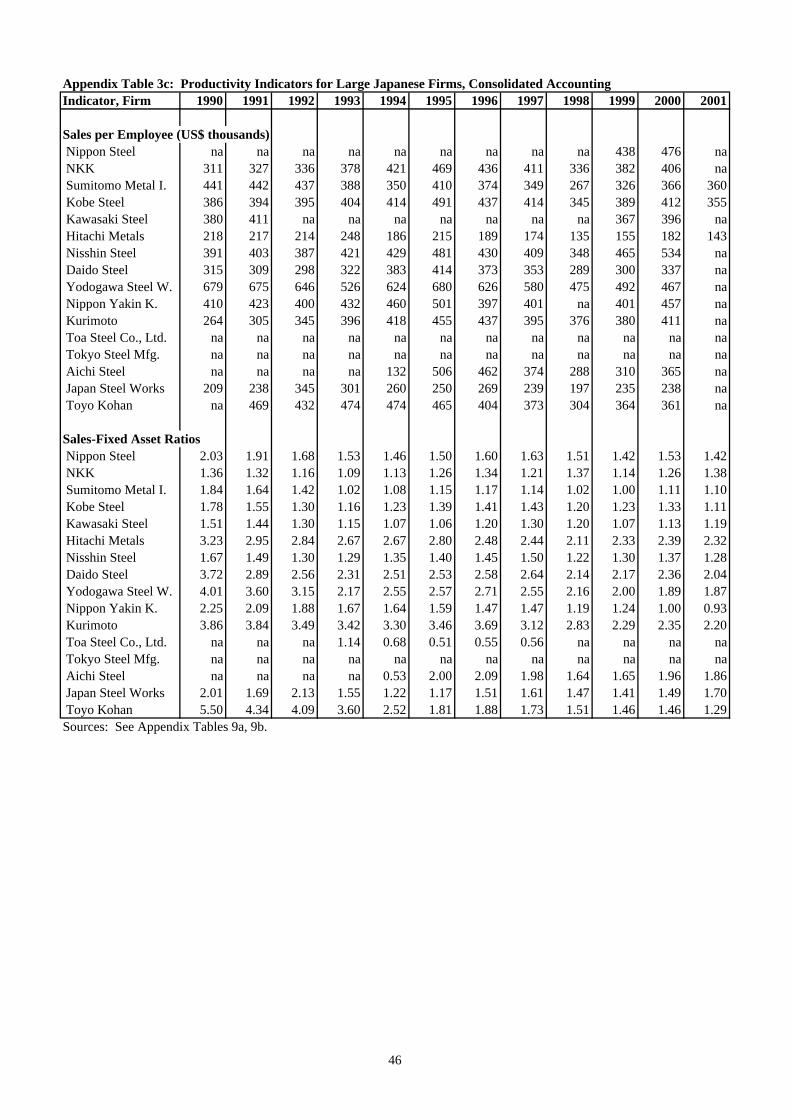
Appendix Table 3c: Productivity Indicators for Large Japanese Firms, Consolidated AccountingIndicator, Firm 1990 1991 1992 1993 1994 1995 1996 1997 1998 1999 2000 2001
Sales per Employee (US$ thousands) Nippon Steel na na na na na na na na na 438 476 na NKK 311 327 336 378 421 469 436 411 336 382 406 na Sumitomo Metal I. 441 442 437 388 350 410 374 349 267 326 366 360 Kobe Steel 386 394 395 404 414 491 437 414 345 389 412 355 Kawasaki Steel 380 411 na na na na na na na 367 396 na Hitachi Metals 218 217 214 248 186 215 189 174 135 155 182 143 Nisshin Steel 391 403 387 421 429 481 430 409 348 465 534 na Daido Steel 315 309 298 322 383 414 373 353 289 300 337 na Yodogawa Steel W. 679 675 646 526 624 680 626 580 475 492 467 na Nippon Yakin K. 410 423 400 432 460 501 397 401 na 401 457 na Kurimoto 264 305 345 396 418 455 437 395 376 380 411 na Toa Steel Co., Ltd. na na na na na na na na na na na na Tokyo Steel Mfg. na na na na na na na na na na na na Aichi Steel na na na na 132 506 462 374 288 310 365 na Japan Steel Works 209 238 345 301 260 250 269 239 197 235 238 na Toyo Kohan na 469 432 474 474 465 404 373 304 364 361 na
Sales-Fixed Asset Ratios Nippon Steel 2.03 1.91 1.68 1.53 1.46 1.50 1.60 1.63 1.51 1.42 1.53 1.42 NKK 1.36 1.32 1.16 1.09 1.13 1.26 1.34 1.21 1.37 1.14 1.26 1.38 Sumitomo Metal I. 1.84 1.64 1.42 1.02 1.08 1.15 1.17 1.14 1.02 1.00 1.11 1.10 Kobe Steel 1.78 1.55 1.30 1.16 1.23 1.39 1.41 1.43 1.20 1.23 1.33 1.11 Kawasaki Steel 1.51 1.44 1.30 1.15 1.07 1.06 1.20 1.30 1.20 1.07 1.13 1.19 Hitachi Metals 3.23 2.95 2.84 2.67 2.67 2.80 2.48 2.44 2.11 2.33 2.39 2.32 Nisshin Steel 1.67 1.49 1.30 1.29 1.35 1.40 1.45 1.50 1.22 1.30 1.37 1.28 Daido Steel 3.72 2.89 2.56 2.31 2.51 2.53 2.58 2.64 2.14 2.17 2.36 2.04 Yodogawa Steel W. 4.01 3.60 3.15 2.17 2.55 2.57 2.71 2.55 2.16 2.00 1.89 1.87 Nippon Yakin K. 2.25 2.09 1.88 1.67 1.64 1.59 1.47 1.47 1.19 1.24 1.00 0.93 Kurimoto 3.86 3.84 3.49 3.42 3.30 3.46 3.69 3.12 2.83 2.29 2.35 2.20 Toa Steel Co., Ltd. na na na 1.14 0.68 0.51 0.55 0.56 na na na na Tokyo Steel Mfg. na na na na na na na na na na na na Aichi Steel na na na na 0.53 2.00 2.09 1.98 1.64 1.65 1.96 1.86 Japan Steel Works 2.01 1.69 2.13 1.55 1.22 1.17 1.51 1.61 1.47 1.41 1.49 1.70 Toyo Kohan 5.50 4.34 4.09 3.60 2.52 1.81 1.88 1.73 1.51 1.46 1.46 1.29Sources: See Appendix Tables 9a, 9b.
46

Appendix Table 4: Operating Profit-Sales Ratios and Sales per Employee for Steel Operations in Large Japanese Firms, Consolidated AccountingFirm 1990 1991 1992 1993 1994 1995 1996 1997 1998 1999 2000 2001
Operating Profit-Sales Ratios (percent) Nippon Steel 7.84 6.35 3.60 -2.73 3.15 5.77 5.44 8.27 3.75 3.90 5.89 1.28 NKK na na na -2.46 na 5.17 4.81 3.93 0.68 4.59 4.63 -2.72 Sumitomo Metal I. na na na 2.34 na 9.14 8.39 8.85 3.23 2.07 7.43 5.82 Kobe Steel na na na 4.55 na 10.51 9.40 9.97 7.03 8.42 8.58 2.32 Kawasaki Steel na 9.09 5.74 0.62 2.05 4.74 7.19 8.59 4.36 3.65 6.65 3.90 Hitachi Metals na na na 2.94 na 3.94 na na 4.28 5.19 5.55 -0.53 Nisshin Steel na na na na na na na na na na na na Daido Steel na na na -0.45 na 2.84 1.65 2.34 -1.15 5.57 5.35 0.77 Yodogawa Steel W. na na na 6.76 na 6.69 5.60 5.58 4.27 2.28 1.87 1.32 Nippon Yakin K. na na na 0.29 na 3.01 -0.30 0.38 -5.77 -0.63 3.94 1.50 Kurimoto na na na 6.25 na 11.52 6.54 7.55 1.16 2.23 3.20 -0.53 Toa Steel Co., Ltd. na na na 5.02 na -2.55 -10.55 -17.32 na na na na Tokyo Steel Mfg. na na na na na na na na na na na na Aichi Steel na na na na na na na na na 8.81 4.00 1.22 Japan Steel Works na na na 5.44 na 1.91 1.04 3.66 2.68 2.91 6.84 8.44 Toyo Kohan na na na na na 6.70 7.07 6.34 5.59 6.28 6.59 3.55
Sales per Employee (US$ thousands) Nippon Steel na na na na na na na na na 770 526 na NKK na na na na na na na na na 414 427 na Sumitomo Metal I. na na na na na na na na na 481 527 na Kobe Steel na na na na na na na na na 443 438 354 Kawasaki Steel na na na na na na na na na 376 410 na Hitachi Metals na na na na na na na na na 214 237 na Nisshin Steel na na na na na na na na na 417 475 na Daido Steel na na na na na na na na na 429 478 343 Yodogawa Steel W. na na na na na na na na na 533 531 na Nippon Yakin K. na na na na na na na na na 388 450 na Kurimoto na na na na na na na na na 403 438 na Toa Steel Co., Ltd. na na na na na na na na na na na na Tokyo Steel Mfg. na na na na na na na na na na na na Aichi Steel na na na na na na na na na 488 578 na Japan Steel Works na na na na na na na na na 188 206 na Toyo Kohan na na na na na na na na na 452 447 naSources: See Appendix Tables 9a, 9b.
47

Appendix Table 5a: Fixed Assets per Employee, Non-consolidated Accounting (US$ thousands)Firm 1990 1991 1992 1993 1994 1995 1996 1997 1998 1999 2000 2001
All Japanese Firms 154 176 211 240 275 290 271 238 252 270 271 255 Nippon Steel 234 265 300 367 431 486 453 436 444 579 589 na NKK 358 380 435 527 594 644 573 532 483 669 709 na Sumitomo Metal I. 292 335 365 436 518 603 575 608 489 546 647 683 Kobe Steel 248 313 376 458 519 583 559 534 546 665 700 632 Kawasaki Steel 324 356 390 474 597 725 643 587 540 619 606 na Hitachi Metals 80 91 93 110 114 129 116 112 110 127 136 na Nisshin Steel 252 288 310 343 377 425 375 360 393 513 588 na Daido Steel 91 120 130 157 173 186 167 155 159 185 204 na Yodogawa Steel W. 172 190 207 232 249 280 241 260 248 280 291 na Nippon Yakin K. 291 329 351 438 506 581 557 555 618 702 1,039 na Kurimoto 70 79 96 115 127 133 119 130 137 170 178 na Toa Steel Co., Ltd. 406 431 518 700 na 1,533 1,437 1,373 na na na na Tokyo Steel Mfg. 251 434 632 629 679 920 898 760 609 640 603 na Aichi Steel 169 177 202 243 248 255 223 219 208 224 225 na Japan Steel Works 139 191 226 270 314 353 298 263 253 302 322 na Toyo Kohan 87 121 127 156 234 334 285 290 254 397 395 na
All Korean Firms 82 113 123 135 156 na 195 193 139 146 172 na Pohang Steel 429 421 414 373 353 464 512 495 364 415 424 381 INI Steel 153 184 155 134 169 174 230 365 352 408 474 429 Kang Won Ind. 110 123 130 180 223 233 275 438 406 na na na Dongkuk 164 172 220 290 294 306 365 601 830 953 980 830 Dongbu 161 154 163 186 199 211 461 599 746 1,122 1,096 894 Hyundai Hysco 102 149 169 174 176 178 197 299 879 1,132 1,104 1,077
All Taiwanese Firms na 120 na na na na 205 na na na na na China Steel na na na na 407 452 513 513 na 441 427 369
All Chinese Firms 5.1 5.4 6.1 6.7 6.1 7.8 9.2 na 13.1 na na na Baosteel Group na na na na na na na na na 55.5 na na Shanghai Steel Pl. na na na na 5.0 5.8 6.6 8.0 na na na na Baoshan na na na na 197.7 207.8 209.6 201.1 270.0 395.7 547.2 na Shanghai Meishan na na na na 5.8 6.5 9.1 10.7 13.3 24.6 45.5 na Shougang 3.6 3.4 3.2 5.3 5.3 9.8 10.5 10.8 10.8 11.2 23.1 na Anshan 8.3 7.8 12.3 13.0 9.2 10.2 17.1 18.8 20.3 20.8 na na Wuhan 11.0 10.7 12.2 19.7 14.0 20.9 22.5 27.9 34.7 40.2 49.0 na Panzhihua 5.1 9.0 8.7 9.0 7.1 7.1 9.4 15.5 15.3 13.6 20.2 na Baotou 6.8 6.0 6.1 5.8 7.7 8.1 10.3 13.2 15.8 17.3 27.0 na Taiyuan 4.9 4.5 5.5 5.8 4.0 7.3 12.8 15.0 20.4 19.8 27.2 na Benxi 6.8 6.0 6.9 10.0 7.0 7.3 8.2 9.6 10.2 14.4 19.3 na Maanshan na na na na na na na na na na 23.8 na Maanshan Magang na na na na na 15.6 na na na na na na Maanshan Ir, & St, 5.0 5.0 5.4 8.4 10.0 5.8 39.9 46.8 23.2 32.7 na na Hunan Hualing na na na na na na na na 9.4 15.4 21.0 na Xiangtan 4.0 4.5 4.6 6.0 5.7 8.3 7.5 na na 15.6 19.9 na Lianyuan 3.9 4.6 4.9 7.7 4.9 6.5 7.9 na na 10.9 16.1 na Hengyang 3.6 2.8 7.4 10.3 6.7 7.0 8.3 na na 27.6 40.2 naSources: See Appendix Tables 9a, 9b.
48

Appendix Table 5b: Compensation per Employee, Non-consolidated Accounting (US$)Firm 1990 1991 1992 1993 1994 1995 1996 1997 1998 1999 2000 2001
All Japanese Firms 37,237 42,115 44,760 50,744 55,545 57,560 50,606 47,435 43,696 47,921 48,379 41,825 Nippon Steel 53,344 56,071 60,553 73,078 78,441 81,594 75,520 66,462 63,251 na na na NKK 51,423 53,626 57,576 65,680 71,766 78,149 69,895 64,964 61,839 70,655 71,858 na Sumitomo Metal I. 42,066 45,707 46,697 54,228 60,569 65,374 56,908 52,593 45,046 52,289 na na Kobe Steel 44,198 49,497 52,251 58,840 63,171 65,866 59,766 57,278 52,202 61,476 63,826 55,310 Kawasaki Steel 52,370 58,876 60,005 69,434 78,129 84,384 71,638 64,292 58,996 67,394 na na Hitachi Metals 45,004 49,727 50,493 58,857 64,529 66,296 58,662 55,463 47,585 57,030 na na Nisshin Steel 43,292 45,798 50,320 57,650 62,208 68,702 59,713 56,378 49,422 57,926 na na Daido Steel 50,163 53,743 56,373 64,245 70,361 76,539 66,526 63,742 58,188 64,904 na na Yodogawa Steel W. 35,080 37,518 40,315 45,330 48,373 50,999 45,237 41,938 39,103 43,656 na na Nippon Yakin K. 38,463 42,220 45,050 51,450 54,288 58,091 51,425 50,076 47,941 44,262 na na Kurimoto 40,811 45,200 49,421 58,138 62,695 64,907 58,560 53,197 49,999 56,093 na na Toa Steel Co., Ltd. 43,650 46,961 50,184 57,682 na 71,237 59,913 58,524 na na na na Tokyo Steel Mfg. 58,708 62,966 68,229 71,097 72,405 73,286 67,332 61,284 57,279 57,098 na na Aichi Steel 39,921 43,569 45,500 50,504 52,878 57,430 52,352 47,394 43,321 51,659 na na Japan Steel Works 38,848 42,819 45,479 52,218 58,552 60,938 53,639 50,100 46,122 50,400 na na Toyo Kohan 37,341 41,946 44,446 50,033 53,215 55,120 43,683 41,320 40,116 61,416 na na
All Korean Firms 13,269 16,264 16,577 17,102 19,399 21,884 24,105 20,859 13,686 16,128 19,969 na Pohang Steel na na 20,546 20,882 30,710 32,094 31,509 27,598 16,902 23,066 29,850 na INI Steel na na 20,201 22,461 26,449 30,349 35,641 28,889 20,534 24,328 26,887 na Kang Won Ind. na na 18,463 19,416 20,182 20,305 23,467 23,585 16,682 na na na Dongkuk na na 18,713 23,187 21,065 23,321 25,555 16,544 15,407 15,429 18,823 na Dongbu na na 16,853 20,912 22,582 26,011 24,730 16,962 7,556 20,822 22,987 na Hyundai Hysco na na 19,153 20,787 22,332 20,442 22,918 20,662 11,478 18,259 24,271 na
All Taiwanese Firms na 15,056 na na na na 18,863 na na na na na China Steel na na na na na na na na na na na na
All Chinese Firms 587 581 785 949 842 961 1,051 na 1,168 na 1,401 na Baosteel Group na na na na na na na na na 2,295 2,684 na Shanghai Steel Pl. 673 701 962 1,534 1,317 1,581 1,643 1,737 na na na na Baoshan 770 831 1,197 1,900 1,853 2,395 2,971 3,135 3,640 4,586 5,776 na Shanghai Meishan 803 759 880 1,391 1,412 1,670 1,857 1,985 2,024 1,981 2,541 na Shougang 669 648 745 1,012 981 1,109 1,251 1,234 1,211 1,203 1,629 na Anshan 658 650 780 1,088 968 1,095 1,227 1,300 1,254 1,244 na na Wuhan 697 725 866 1,226 1,162 1,338 1,461 1,610 1,499 1,539 1,806 na Panzhihua 625 654 721 967 1,028 1,186 1,302 1,405 1,324 1,310 1,554 na Baotou 573 539 625 960 963 936 1,110 1,274 1,041 1,069 1,175 na Taiyuan 661 666 742 1,038 927 1,120 1,366 1,351 1,319 1,391 1,700 na Benxi 699 639 791 1,032 920 1,089 1,333 1,226 1,163 1,146 1,413 na Maanshan na na na na na na na na na na 501 na Maanshan Magang na na na na na 1,368 1,470 1,494 na na na na Maanshan Ir, & St, 635 619 722 1,333 1,119 1,380 1,474 1,525 1,473 1,438 na na Hunan Hualing na na na na na na na na 1,727 1,339 1,857 na Xiangtan 655 624 842 1,139 976 1,037 1,037 na 946 1,188 1,568 na Lianyuan 599 636 826 1,409 1,093 1,200 1,172 na 1,174 1,567 1,778 na Hengyang 578 620 727 971 1,066 793 824 na 1,085 1,113 1,228 naSources: See Appendix Tables 9a, 9b.
49
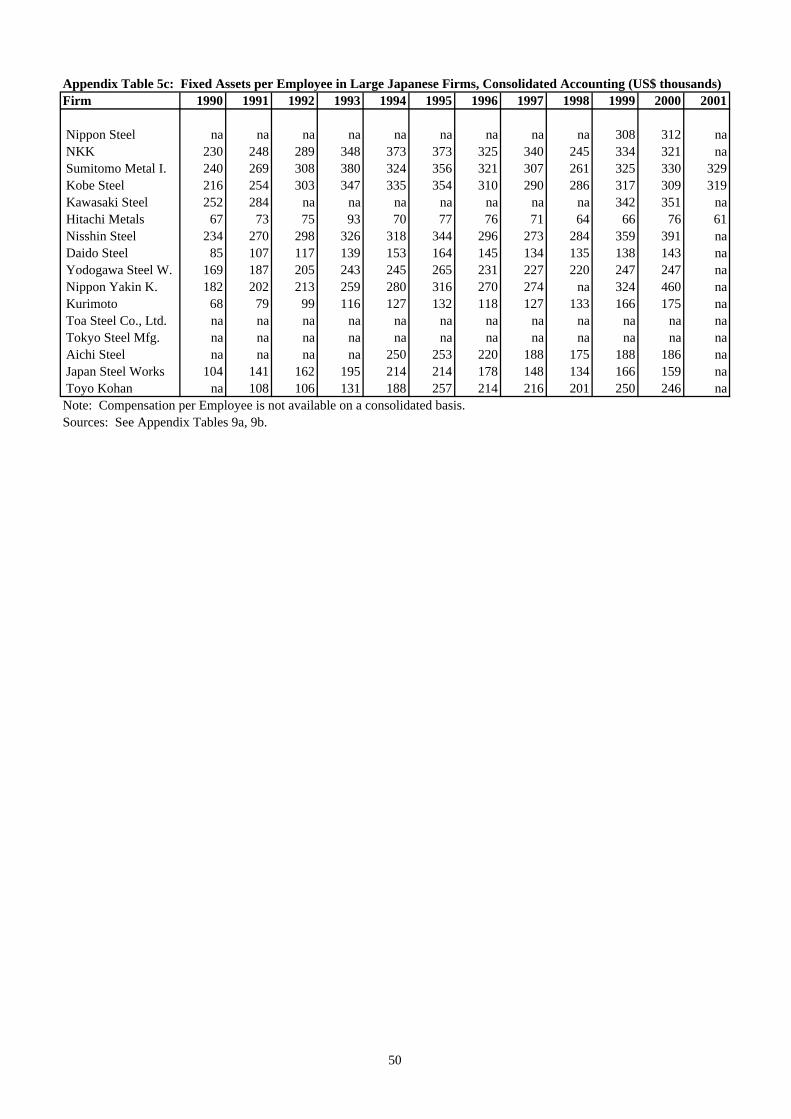
Appendix Table 5c: Fixed Assets per Employee in Large Japanese Firms, Consolidated Accounting (US$ thousands)Firm 1990 1991 1992 1993 1994 1995 1996 1997 1998 1999 2000 2001
Nippon Steel na na na na na na na na na 308 312 na NKK 230 248 289 348 373 373 325 340 245 334 321 na Sumitomo Metal I. 240 269 308 380 324 356 321 307 261 325 330 329 Kobe Steel 216 254 303 347 335 354 310 290 286 317 309 319 Kawasaki Steel 252 284 na na na na na na na 342 351 na Hitachi Metals 67 73 75 93 70 77 76 71 64 66 76 61 Nisshin Steel 234 270 298 326 318 344 296 273 284 359 391 na Daido Steel 85 107 117 139 153 164 145 134 135 138 143 na Yodogawa Steel W. 169 187 205 243 245 265 231 227 220 247 247 na Nippon Yakin K. 182 202 213 259 280 316 270 274 na 324 460 na Kurimoto 68 79 99 116 127 132 118 127 133 166 175 na Toa Steel Co., Ltd. na na na na na na na na na na na na Tokyo Steel Mfg. na na na na na na na na na na na na Aichi Steel na na na na 250 253 220 188 175 188 186 na Japan Steel Works 104 141 162 195 214 214 178 148 134 166 159 na Toyo Kohan na 108 106 131 188 257 214 216 201 250 246 naNote: Compensation per Employee is not available on a consolidated basis.Sources: See Appendix Tables 9a, 9b.
50

Appendix Table 6a: Foreign Sales or Exports, Non-consolidated Accounting (US$ billions)Firm 1990 1991 1992 1993 1994 1995 1996 1997 1998 1999 2000 2001
Japanese Exports 13.016 14.026 13.783 14.938 14.962 17.728 15.726 16.446 15.493 14.178 15.792 14.416
Large Japanese Firms, non-consolidated accountingSum of Large firms na na na 14.631 na 17.137 15.520 15.622 13.772 14.002 na na Nippon Steel 3.671 4.023 4.390 4.352 4.388 5.028 4.698 4.881 3.949 3.900 3.826 3.250 NKK 1.916 1.976 1.699 2.263 2.321 2.483 2.372 2.074 2.090 2.244 na na Sumitomo Metal I. 1.824 1.947 1.852 2.130 2.160 2.511 2.129 2.242 2.058 2.056 na 2.224 Kobe Steel 1.718 1.603 1.595 1.856 1.905 2.037 1.865 1.773 1.544 1.484 na na Kawasaki Steel 1.860 1.897 1.890 2.086 2.507 2.524 2.320 2.451 2.185 2.264 2.348 2.218 Hitachi Metals 0.313 0.315 0.336 0.334 0.423 0.576 0.442 0.420 0.396 0.605 0.599 0.354 Nisshin Steel 0.436 0.393 0.400 0.402 0.509 0.636 0.493 0.494 0.426 0.423 na na Daido Steel 0.162 0.152 0.203 0.179 0.212 0.214 0.218 0.240 0.179 0.209 0.252 0.185 Yodogawa Steel W. 0.062 0.050 0.053 0.047 0.055 0.074 0.046 0.052 0.069 0.095 na na Nippon Yakin K. 0.134 0.121 0.127 0.113 0.152 0.213 0.185 0.168 0.105 0.121 na na Kurimoto 0.033 0.048 0.036 0.037 0.028 0.033 0.033 0.044 0.023 0.017 na na Toa Steel Co., Ltd. 0.029 0.031 0.062 0.123 0.101 0.077 0.082 0.077 na na na na Tokyo Steel Mfg. 0.015 0.153 0.121 0.209 0.103 0.202 0.083 0.168 0.197 0.060 0.092 na Aichi Steel 0.117 0.106 0.093 0.102 0.094 0.097 0.081 0.084 0.068 0.077 na na Japan Steel Works 0.251 0.247 0.270 0.347 0.366 0.355 0.374 0.337 0.389 0.349 na na Toyo Kohan 0.043 0.039 0.044 0.051 0.054 0.078 0.098 0.116 0.094 0.097 na na
Korean Exports 3.845 4.096 4.773 5.142 4.801 5.590 5.504 5.995 7.557 6.309 7.194 6.265
Large Korean Firms, non-consolidated accountingSum of Large firms 3.597 3.921 4.552 5.141 4.713 5.077 4.677 5.006 5.394 5.645 4.700 4.207 Pohang Steel 2.981 3.286 3.778 4.199 3.875 4.200 3.790 4.085 3.647 3.654 2.619 2.233 INI Steel 0.104 0.136 0.261 0.281 0.287 0.350 0.367 0.303 0.480 0.929 0.619 0.572 Kang Won Ind. 0.071 0.075 0.057 0.102 0.112 0.083 0.090 0.116 0.187 na na na Dongkuk 0.079 0.070 0.118 0.207 0.120 0.066 0.081 0.081 0.534 0.458 0.474 0.559 Dongbu 0.255 0.236 0.236 0.234 0.202 0.249 0.229 0.259 0.378 0.358 0.558 0.491 Hyundai Hysco 0.106 0.118 0.102 0.117 0.118 0.128 0.120 0.161 0.169 0.246 0.430 0.352
Taiwanese Exports 1.105 1.174 1.207 1.606 1.736 2.552 2.776 3.294 3.630 4.009 5.201 4.302
Taiwanese Firms, non-consolidated accounting (foreign sales used instead of exports)All Taiwanese Firms na 1.091 na na na na 2.138 na na na na na China Steel 0.420 0.434 0.434 0.433 0.386 0.599 0.560 0.613 na na 0.749 0.821
Chinese Exports 1.314 1.726 1.501 1.243 1.866 5.493 4.199 5.137 4.004 3.388 5.322 3.975
Sources: See Appendix Tables 9a, 9b.
51

Appendix Table 6b: Export-Sales Ratios, Non-consolidated Accounting (percent)Firm 1990 1991 1992 1993 1994 1995 1996 1997 1998 1999 2000 2001
Japanese Exports 9.71 10.20 10.25 10.54 9.80 10.86 11.52 12.97 15.29 11.89 14.01 14.76
Large Japanese Firms, non-consolidated accountingSum of Large firms na na na 18.64 na 19.70 20.49 22.60 24.20 22.64 na na Nippon Steel 19.88 20.40 23.13 21.74 20.86 23.09 24.22 27.16 26.35 24.02 22.87 24.19 NKK 20.41 20.04 16.79 20.27 19.68 20.65 22.55 22.89 26.39 25.26 na na Sumitomo Metal I. 22.28 22.44 20.85 22.03 21.22 22.91 23.60 26.78 27.86 25.21 na 36.00 Kobe Steel 18.37 16.43 16.91 18.74 17.76 17.13 18.40 19.51 21.06 19.76 na na Kawasaki Steel 22.16 20.94 21.60 22.38 26.31 26.22 27.66 31.30 33.46 32.97 33.33 38.94 Hitachi Metals 12.63 12.46 13.66 12.92 14.18 17.12 15.57 15.99 17.83 22.19 22.25 18.69 Nisshin Steel 14.34 12.15 12.50 11.59 13.66 15.99 14.63 16.12 16.93 15.11 na na Daido Steel 7.02 6.77 9.42 8.01 7.98 7.77 9.23 10.96 10.23 10.22 11.37 11.35 Yodogawa Steel W. 4.62 3.67 3.96 3.45 3.94 5.06 3.57 4.56 7.24 9.06 na na Nippon Yakin K. 18.30 16.08 18.27 16.01 18.97 22.73 23.26 23.05 20.74 20.04 na na Kurimoto 3.63 4.62 3.02 2.74 1.94 2.15 2.36 3.51 2.04 1.60 na na Toa Steel Co., Ltd. 1.84 1.95 4.13 8.88 7.35 5.77 7.00 7.21 na na na na Tokyo Steel Mfg. 0.94 9.56 7.43 14.75 7.30 13.36 5.85 12.37 20.27 6.29 8.64 na Aichi Steel 9.26 7.52 7.06 7.11 5.98 5.98 5.65 6.57 7.18 7.04 na na Japan Steel Works 26.64 22.19 15.94 25.03 33.24 32.28 32.38 30.20 40.73 35.82 na na Toyo Kohan 4.95 4.01 4.54 4.68 4.54 6.77 9.44 11.87 11.32 10.79 na na
Korean Exports 23.51 21.79 na 25.51 21.16 19.90 19.39 21.58 37.89 26.65 25.48 na
Large Korean Firms, non-consolidated accountingSum of Large firms 35.23 32.97 38.44 39.63 33.65 30.81 28.25 31.51 44.54 42.39 28.40 29.15 Pohang Steel 43.92 41.35 47.71 48.70 42.56 39.42 36.10 39.99 45.88 40.61 25.34 26.00 INI Steel 10.92 11.69 22.18 20.80 19.02 18.91 19.53 17.20 39.50 67.72 26.84 25.70 Kang Won Ind. 15.06 13.48 9.06 16.40 14.97 9.32 8.75 10.61 20.93 na na na Dongkuk 10.93 8.08 13.80 20.80 10.62 5.03 6.08 6.96 53.81 38.08 34.69 40.40 Dongbu 27.31 23.98 25.31 23.90 18.96 20.34 18.31 23.40 52.27 36.22 42.50 43.90 Hyundai Hysco 31.87 31.63 30.81 29.30 26.23 23.84 21.31 29.77 49.79 32.53 35.11 31.60
Taiwanese Exports na 8.88 na na na na 14.04 na na na na na
Taiwanese Firms, non-consolidated accounting (foreign sales used instead of exports)All Taiwanese Firms na 8.25 na na na na 10.81 na na na na na China Steel 19.00 18.96 18.96 19.00 14.40 19.00 18.00 18.00 na na 23.25 32.62
Chinese Exports 13.63 15.37 10.28 6.00 12.49 32.49 25.77 29.95 24.78 19.81 24.43 na
Sources: See Appendix Tables 9a, 9b.
52

Appendix Table 6c: Foreign Sales and Foreign Sales-Total Sales Ratios for Large Japanese Firms, Consolidated AccountingIndicator, Firm 1990 1991 1992 1993 1994 1995 1996 1997 1998 1999 2000 2001
Foreign Sales (US$ billions) Nippon Steel na na na 4.761 na 6.226 5.792 5.973 3.243 4.700 4.432 4.113 NKK na na na 4.771 na 5.339 5.266 5.267 5.021 5.277 4.932 4.384 Sumitomo Metal I. na na na 2.369 na 2.940 2.757 2.674 2.377 2.646 2.732 2.841 Kobe Steel na na na 2.079 na 3.621 3.013 2.931 2.642 2.492 2.806 1.885 Kawasaki Steel na 1.932 2.053 2.262 2.732 2.819 2.650 2.774 2.481 2.835 2.856 2.721 Hitachi Metals na na na 0.806 na 1.176 0.885 0.882 0.886 1.165 1.276 0.983 Nisshin Steel na na na 0.660 na 1.077 0.923 0.938 0.795 0.765 0.772 0.660 Daido Steel na na na na na na na na na na 0.350 na Yodogawa Steel W. na na na na na 0.415 0.346 0.389 0.312 0.335 0.333 0.369 Nippon Yakin K. na na na 0.134 na 0.247 0.215 0.193 0.115 0.138 0.154 0.131 Kurimoto na na na na na na na na na na na na Toa Steel Co., Ltd. na na na na na na na na na na na na Tokyo Steel Mfg. na na na na na na na na na na na na Aichi Steel na na na na na na na na na 0.084 0.149 0.134 Japan Steel Works na na na 0.352 na 0.365 0.386 0.356 0.400 0.386 0.283 0.267 Toyo Kohan na na na na na na na 0.121 0.100 0.128 0.144 0.143
Foreign Sales-Total Sales Ratios Nippon Steel na na na 18.68 na 20.32 21.31 23.82 15.05 19.56 17.81 19.94 NKK na na na 28.94 na 28.51 31.59 33.41 35.54 34.92 30.50 33.18 Sumitomo Metal I. na na na 20.90 na 19.81 21.30 22.33 22.60 20.73 20.16 26.34 Kobe Steel na na na 17.96 na 23.65 22.13 23.43 25.91 22.19 22.59 19.68 Kawasaki Steel na 18.69 19.56 20.58 23.63 23.35 24.22 27.37 29.03 25.15 24.00 28.00 Hitachi Metals na na na 21.91 na 24.20 21.96 23.11 26.30 28.04 29.41 30.03 Nisshin Steel na na na 17.23 na 22.82 22.70 24.88 25.53 19.80 19.17 20.94 Daido Steel na na na na na na na na na na 10.21 na Yodogawa Steel W. na na na na na 22.92 21.81 26.10 26.06 24.28 23.92 31.84 Nippon Yakin K. na na na 8.88 na 13.23 13.25 13.48 10.69 11.33 11.89 12.74 Kurimoto na na na na na na na na na na na na Toa Steel Co., Ltd. na na na na na na na na na na na na Tokyo Steel Mfg. na na na na na na na na na na na na Aichi Steel na na na na na na na na na 6.83 10.60 11.95 Japan Steel Works na na na 23.88 na 29.88 29.37 28.66 37.56 34.40 26.11 25.30 Toyo Kohan na na na na na na na 11.24 10.91 12.44 14.17 18.57Sources: See Appendix Tables 9a, 9b.
53
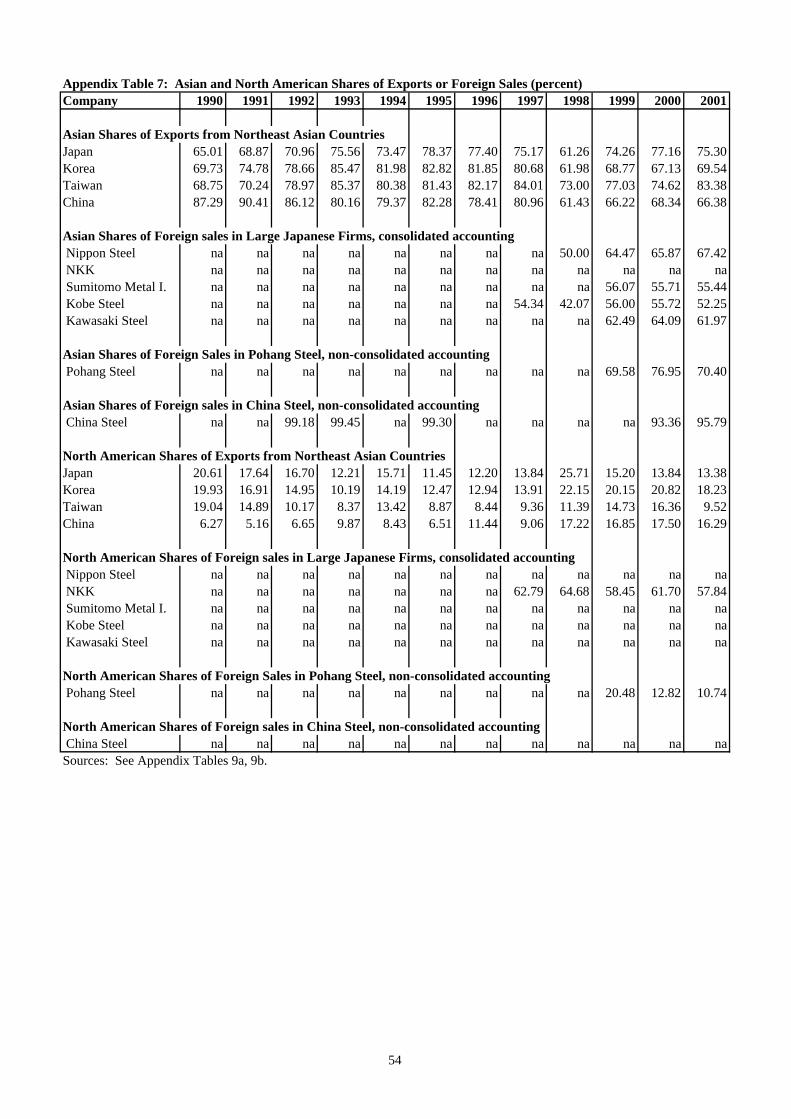
Appendix Table 7: Asian and North American Shares of Exports or Foreign Sales (percent)Company 1990 1991 1992 1993 1994 1995 1996 1997 1998 1999 2000 2001
Asian Shares of Exports from Northeast Asian CountriesJapan 65.01 68.87 70.96 75.56 73.47 78.37 77.40 75.17 61.26 74.26 77.16 75.30Korea 69.73 74.78 78.66 85.47 81.98 82.82 81.85 80.68 61.98 68.77 67.13 69.54Taiwan 68.75 70.24 78.97 85.37 80.38 81.43 82.17 84.01 73.00 77.03 74.62 83.38China 87.29 90.41 86.12 80.16 79.37 82.28 78.41 80.96 61.43 66.22 68.34 66.38
Asian Shares of Foreign sales in Large Japanese Firms, consolidated accounting Nippon Steel na na na na na na na na 50.00 64.47 65.87 67.42 NKK na na na na na na na na na na na na Sumitomo Metal I. na na na na na na na na na 56.07 55.71 55.44 Kobe Steel na na na na na na na 54.34 42.07 56.00 55.72 52.25 Kawasaki Steel na na na na na na na na na 62.49 64.09 61.97
Asian Shares of Foreign Sales in Pohang Steel, non-consolidated accounting Pohang Steel na na na na na na na na na 69.58 76.95 70.40
Asian Shares of Foreign sales in China Steel, non-consolidated accounting China Steel na na 99.18 99.45 na 99.30 na na na na 93.36 95.79
North American Shares of Exports from Northeast Asian CountriesJapan 20.61 17.64 16.70 12.21 15.71 11.45 12.20 13.84 25.71 15.20 13.84 13.38Korea 19.93 16.91 14.95 10.19 14.19 12.47 12.94 13.91 22.15 20.15 20.82 18.23Taiwan 19.04 14.89 10.17 8.37 13.42 8.87 8.44 9.36 11.39 14.73 16.36 9.52China 6.27 5.16 6.65 9.87 8.43 6.51 11.44 9.06 17.22 16.85 17.50 16.29
North American Shares of Foreign sales in Large Japanese Firms, consolidated accounting Nippon Steel na na na na na na na na na na na na NKK na na na na na na na 62.79 64.68 58.45 61.70 57.84 Sumitomo Metal I. na na na na na na na na na na na na Kobe Steel na na na na na na na na na na na na Kawasaki Steel na na na na na na na na na na na na
North American Shares of Foreign Sales in Pohang Steel, non-consolidated accounting Pohang Steel na na na na na na na na na 20.48 12.82 10.74
North American Shares of Foreign sales in China Steel, non-consolidated accounting China Steel na na na na na na na na na na na naSources: See Appendix Tables 9a, 9b.
54

Appendix Table 8a: Total Liability-Total Asset Ratios, Non-consolidated Accounting (percent)Firm 1990 1991 1992 1993 1994 1995 1996 1997 1998 1999 2000 2001
All Japanese Firms 73.90 72.36 72.20 72.92 72.75 73.86 72.34 72.22 72.61 71.70 70.07 72.06 Nippon Steel 73.57 72.91 73.23 73.95 74.20 73.26 73.18 72.64 74.31 72.29 69.95 71.03 NKK 79.47 78.79 80.36 81.54 81.56 76.89 75.43 76.53 80.10 78.05 78.25 78.83 Sumitomo Metal I. 73.05 73.58 74.22 75.20 75.90 74.90 74.44 74.79 75.93 78.48 77.40 81.23 Kobe Steel 78.65 78.77 79.71 79.44 83.47 78.76 76.98 77.22 78.41 77.82 79.81 79.51 Kawasaki Steel 68.94 69.07 70.42 72.16 73.46 73.16 72.00 72.22 72.88 69.43 68.36 73.34 Hitachi Metals 60.52 57.80 58.55 55.80 56.58 56.72 56.27 55.39 56.68 60.65 58.51 60.52 Nisshin Steel 62.53 62.89 65.06 61.68 61.23 59.55 58.76 60.21 60.38 60.96 57.98 61.07 Daido Steel 71.80 73.05 72.46 73.95 72.55 70.64 67.26 65.70 66.09 64.15 60.22 58.03 Yodogawa Steel W. 58.23 50.29 46.73 51.59 45.58 46.75 39.84 29.38 32.24 32.50 31.09 24.60 Nippon Yakin K. 69.94 68.24 69.09 69.95 72.43 75.10 77.21 77.96 81.63 83.93 75.19 76.12 Kurimoto 57.70 49.39 49.26 47.71 47.74 49.57 49.79 46.14 43.12 43.78 44.68 44.94 Toa Steel Co., Ltd. 67.61 64.30 67.30 64.94 76.08 79.59 81.48 85.89 na na na na Tokyo Steel Mfg. 45.09 41.22 32.24 28.63 32.57 35.16 35.54 37.20 21.42 24.86 24.89 23.92 Aichi Steel 45.37 43.58 43.66 43.46 43.52 45.33 44.49 42.66 39.72 39.62 39.51 36.48 Japan Steel Works 75.27 73.81 73.14 69.75 68.86 70.64 69.50 69.51 68.74 74.38 73.65 72.64 Toyo Kohan 66.18 65.72 62.13 60.59 60.85 63.90 64.00 62.41 58.91 55.73 53.13 48.51
All Korean Firms 59.45 63.17 65.62 64.93 65.98 na 67.75 72.51 66.99 65.91 64.77 na Pohang Steel 53.58 56.09 58.95 56.40 57.59 53.80 53.59 58.43 53.24 47.25 46.92 42.12 INI Steel 53.58 58.45 60.30 62.63 65.85 66.57 67.48 72.45 62.61 54.26 65.73 61.41 Kang Won Ind. 56.78 59.25 61.47 65.90 69.88 71.85 80.63 68.63 73.15 na na na Dongkuk 48.82 56.87 61.68 59.90 57.24 61.54 68.03 78.40 70.54 56.88 64.42 59.55 Dongbu 76.35 72.56 74.42 69.89 69.91 69.78 52.83 68.28 77.71 67.84 67.52 67.86 Hyundai Hysco 52.36 64.02 66.35 70.42 70.79 71.90 71.83 87.49 79.71 61.24 61.63 59.88
All Taiwanese Firms na na na na na na na na na na na na China Steel na na na na 26.60 36.52 40.05 40.10 32.03 34.50 32.78 31.80
All Chinese Firms na na na na 58.77 56.76 55.97 na 59.45 na 57.01 na Baosteel Group na na na na na na na na na 65.79 51.71 na Shanghai Steel Pl. na na na na 70.45 67.55 65.40 64.73 na na na na Baoshan na na na na 22.34 24.31 28.56 32.31 36.77 36.41 35.12 na Shanghai Meishan na na na na 59.70 61.50 54.03 57.40 62.50 84.19 85.57 na Shougang na na na na 66.86 29.95 50.53 52.64 51.77 49.30 44.65 na Anshan na na na na 66.94 64.75 48.81 45.85 48.04 51.74 52.25 na Wuhan na na na na 61.77 53.25 54.09 55.88 57.15 54.00 54.30 na Panzhihua na na na na 72.54 70.76 67.54 72.10 67.28 66.56 66.26 na Baotou na na na na 48.02 50.25 52.89 53.94 58.64 60.54 51.52 na Taiyuan na na na na 54.87 52.67 49.45 51.10 56.34 55.65 58.15 na Benxi na na na na 55.78 64.46 60.51 66.41 64.34 64.59 65.64 na Maanshan na na na na na na na na na na 50.76 na Maanshan Magang na na na na na 32.81 na na na na na na Maanshan Ir, & St, na na na na 33.58 20.76 36.86 35.43 35.56 34.59 na na Hunan Hualing na na na na na na na 72.10 52.84 57.57 56.13 na Xiangtan na na na na 34.78 35.16 46.63 na na 56.27 54.93 na Lianyuan na na na na na na 49.56 na na 80.46 54.31 na Hengyang na na na na na na 83.32 na na 85.22 47.94 naSources: See Appendix Tables 9a, 9b.
55

Appendix Table 8b: Current Liability-Total Asset Ratios, Non-consolidated Accounting (percent)Firm 1990 1991 1992 1993 1994 1995 1996 1997 1998 1999 2000 2001
All Japanese Firms 43.57 42.21 38.42 37.78 37.90 40.38 40.37 39.38 33.97 34.94 34.64 37.62 Nippon Steel 38.98 43.27 38.96 33.88 34.67 33.65 34.34 33.52 29.34 28.56 31.04 34.50 NKK 46.99 47.66 40.32 38.39 40.99 41.08 39.43 41.46 39.43 34.17 31.51 35.89 Sumitomo Metal I. 36.69 39.18 32.05 34.98 36.38 40.75 37.09 34.42 25.13 24.36 27.12 32.90 Kobe Steel 42.41 41.17 38.30 41.82 44.70 43.29 42.85 44.79 37.99 32.57 31.71 35.78 Kawasaki Steel 35.71 32.92 31.17 34.32 24.64 24.18 25.18 23.23 23.97 21.95 25.30 26.64 Hitachi Metals 28.80 24.75 31.57 27.40 23.21 24.85 28.45 30.58 18.63 22.08 32.67 26.54 Nisshin Steel 30.16 30.72 35.72 33.03 35.17 35.85 39.98 36.19 32.85 32.13 31.94 31.81 Daido Steel 41.22 36.83 36.55 36.28 33.90 45.09 48.41 43.00 39.17 36.58 34.98 37.16 Yodogawa Steel W. 40.24 30.09 25.64 27.56 20.95 28.85 35.23 24.67 20.32 20.28 23.77 19.84 Nippon Yakin K. 43.72 36.24 42.02 36.79 43.41 59.74 60.30 52.36 60.61 67.24 54.15 60.82 Kurimoto 39.20 39.71 39.61 37.51 37.77 40.41 40.48 37.92 28.62 29.76 29.87 32.01 Toa Steel Co., Ltd. 49.93 40.38 41.64 25.34 35.58 48.01 34.69 38.77 na na na na Tokyo Steel Mfg. 29.07 31.13 21.89 16.74 20.61 24.05 23.84 35.14 18.64 20.34 20.36 18.34 Aichi Steel 26.59 22.96 23.72 18.02 18.65 21.20 27.39 35.60 14.61 15.02 19.09 18.67 Japan Steel Works 62.76 59.90 54.13 47.01 49.72 50.39 47.30 45.22 41.75 50.78 45.32 47.99 Toyo Kohan 52.35 44.85 41.77 39.49 36.72 33.36 38.11 38.11 35.70 36.04 37.81 35.90
All Korean Firms 29.37 31.27 32.56 35.86 36.34 na 38.97 38.93 32.83 23.16 27.68 na Pohang Steel 20.54 20.95 20.50 24.99 23.33 22.98 23.50 23.23 19.97 17.38 19.76 12.79 INI Steel 38.68 37.00 41.04 50.38 48.52 50.47 53.15 48.05 27.32 31.62 35.23 30.49 Kang Won Ind. 24.41 34.25 33.72 31.41 39.01 41.82 54.73 38.96 44.17 na na na Dongkuk 31.76 34.82 33.84 39.37 45.44 51.26 59.15 47.56 34.55 25.76 42.40 43.27 Dongbu 23.69 25.84 33.16 25.18 35.85 42.86 25.85 37.75 31.46 32.44 44.91 42.15 Hyundai Hysco 46.75 50.60 48.38 51.51 58.40 62.37 51.71 56.35 33.43 33.26 37.86 27.08
All Taiwanese Firms na na na na na na na na na na na na China Steel na na na na 20.05 24.21 24.33 25.30 14.20 13.45 14.28 12.87
All Chinese Firms na na na na 44.08 42.34 40.99 na 40.78 na 39.56 na Baosteel Group na na na na na na na na na 37.50 35.03 na Shanghai Steel Pl. na na na na 56.73 53.58 51.45 49.06 na na na na Baoshan na na na na 18.19 19.00 19.92 19.13 21.05 17.19 20.11 na Shanghai Meishan na na na na 57.13 58.33 51.11 52.14 56.55 44.47 52.65 na Shougang na na na na 46.10 13.77 38.71 40.02 37.75 36.98 37.57 na Anshan na na na na 51.19 56.06 41.84 38.05 32.27 29.33 33.70 na Wuhan na na na na 39.70 30.79 30.59 32.38 32.57 33.95 34.31 na Panzhihua na na na na 45.04 50.77 43.20 33.28 35.40 33.18 37.17 na Baotou na na na na 31.56 28.76 29.96 28.42 42.11 38.03 31.93 na Taiyuan na na na na 44.54 45.86 36.40 34.54 32.97 28.79 32.13 na Benxi na na na na 45.61 40.75 34.35 38.69 31.96 30.53 33.97 na Maanshan na na na na na na na na na na 28.42 na Maanshan Magang na na na na na 27.16 na na na na na na Maanshan Ir, & St, na na na na 24.71 15.10 27.59 25.82 26.81 25.72 na na Hunan Hualing na na na na na na na 33.28 39.53 37.60 38.16 na Xiangtan na na na na 27.87 25.81 30.73 na na 40.33 37.83 na Lianyuan na na na na na na 43.92 na na 49.63 28.47 na Hengyang na na na na na na 45.65 na na 40.85 38.25 naSources: See Appendix Tables 9a, 9b.
56

Appendix Table 8c: Debt Indicators for Large Japanese Firms, Consolidated Accounting (percent)Indicator, Firm 1990 1991 1992 1993 1994 1995 1996 1997 1998 1999 2000 2001
Total Liability-Asset Ratios, All Operations Nippon Steel 75.20 75.28 75.46 76.50 79.40 78.63 78.93 80.03 79.31 77.25 75.35 75.87 NKK 82.66 83.20 83.70 85.58 85.38 81.05 79.64 81.07 84.64 86.32 83.09 84.56 Sumitomo Metal I. 76.91 77.54 77.86 76.03 78.39 77.70 76.56 77.31 80.51 85.96 84.79 86.61 Kobe Steel 81.76 82.25 83.70 83.87 87.90 84.03 82.99 83.58 84.36 86.72 86.24 84.98 Kawasaki Steel 70.00 70.38 73.62 75.70 77.57 77.33 76.67 76.87 80.17 83.88 84.54 83.51 Hitachi Metals 64.62 62.44 63.11 61.07 62.38 60.71 60.81 61.75 63.38 65.97 63.32 63.27 Nisshin Steel 62.49 62.77 65.19 61.35 61.27 59.39 58.79 59.95 60.09 62.01 59.76 62.00 Daido Steel 73.12 73.19 71.91 73.76 72.59 70.91 68.69 67.88 68.31 67.44 65.33 62.84 Yodogawa Steel W. 57.69 49.76 46.16 52.35 45.87 46.69 39.73 29.26 31.59 34.51 35.52 29.96 Nippon Yakin K. 76.80 74.81 75.29 76.36 79.88 82.35 84.96 86.57 91.82 94.32 85.47 86.39 Kurimoto 59.21 51.72 51.44 49.81 49.72 51.57 51.65 48.21 45.45 44.86 47.37 47.78 Toa Steel Co., Ltd. na na 67.56 65.22 77.04 80.78 82.35 86.55 na na na na Tokyo Steel Mfg. na na na na na na na na na na na na Aichi Steel na na na na 44.73 45.47 44.60 43.56 40.73 41.54 41.14 37.89 Japan Steel Works 76.82 75.27 74.08 70.71 69.71 71.58 70.18 70.06 68.99 74.15 73.76 72.35 Toyo Kohan 68.18 67.42 64.02 62.40 63.05 65.73 65.56 63.73 62.61 59.48 58.18 53.50
Current Liability-Total Asset Ratios, All Operations Nippon Steel 39.68 43.80 40.98 38.96 41.92 40.61 40.92 42.98 39.54 39.29 40.44 43.26 NKK 45.53 49.16 42.97 41.76 46.20 44.95 43.24 43.94 44.64 42.68 37.48 43.15 Sumitomo Metal I. 45.02 46.40 40.09 35.86 38.79 42.98 39.83 39.92 32.64 38.02 39.41 45.02 Kobe Steel 45.98 45.33 43.14 45.90 48.20 47.29 45.83 49.17 42.36 40.51 40.51 40.98 Kawasaki Steel 38.34 35.43 35.54 38.24 30.92 30.55 32.15 31.60 31.35 33.16 35.96 32.04 Hitachi Metals 34.76 31.67 37.16 34.19 31.92 30.06 33.13 38.01 28.23 31.13 38.36 32.76 Nisshin Steel 30.52 30.76 34.60 32.23 35.77 35.79 39.39 35.63 32.88 34.99 34.66 34.42 Daido Steel 47.39 42.46 41.12 40.22 38.96 46.95 50.69 47.30 43.31 43.48 42.09 42.26 Yodogawa Steel W. 39.89 29.78 25.32 28.09 20.51 28.12 33.73 23.61 19.31 22.84 25.76 22.04 Nippon Yakin K. 55.81 48.84 53.01 49.65 55.68 67.51 69.45 64.94 71.67 78.35 66.30 72.07 Kurimoto 41.59 42.26 42.04 39.88 40.21 43.01 42.96 40.54 31.83 31.45 32.32 34.56 Toa Steel Co., Ltd. na na 42.32 26.36 36.30 49.14 35.98 40.46 na na na na Tokyo Steel Mfg. na na na na na na na na na na na na Aichi Steel na na na na 20.55 21.59 27.70 36.53 16.40 16.74 20.03 19.45 Japan Steel Works 64.44 61.54 55.29 48.40 50.94 51.96 48.16 46.14 42.23 50.98 45.43 47.28 Toyo Kohan 55.33 48.05 45.18 42.82 40.70 37.77 41.13 41.04 38.06 38.33 40.94 38.59Sources: See Appendix Tables 9a, 9b.
57

Appendix Table 9a: Data Sources (for Company Websites see Appendix Table 9b)TextTable
AppendixTables
Firm, Group of Firms, orIndicator Source(s)
1 1a, 1b All Japanese Firms Ministry of Finance (various years)
1 1a, 1b Japanese Firms Nihon Keizai Shinbunsha (2001, 2002, various years); CompanyWebsites
1 1a, 1b All Korean Firms Bank of Korea (various years); National Statistical Office (variousyears)
1 1a, 1b Korean Firms Asia-Pacific Infoserv (various years a, various years b); BusinessKorea (various years) Saturn Communications (various years a,various years b); Toyo Keizai (various years); Company Websites
1 1a, 1b All Taiwanese Firms Directorate General of Budget, Accounting and Statistics (1993,1998)
1 1a, 1b Taiwanese Firms China Credit Information Service (various years); Toyo Keizai(various years); Company Websites
1 1a, 1b All Chinese Firms,Chinese Firms
Ministry of Metallurgical Industry of China (various years);Company Websites
na 1c, 1d Japanese Firms Nihon Keizai Shinbunsha (2001, 2002, various years); CompanyWebsites
1 1a, 1c Exchange Rates International Monetary Fund (2002)
2 2a, 2b All Japanese Firms Ministry of Finance (various years)
2 2a, 2b Japanese Firms Nihon Keizai Shinbunsha (2001, 2002, various years); CompanyWebsites
2 2a, 2b All Korean Firms Bank of Korea (various years); National Statistical Office (variousyears)
2 2a, 2b Korean Firms Asia-Pacific Infoserv (various years a, various years b); BusinessKorea (various years) Saturn Communications (various years a,various years b); Toyo Keizai (various years); Company Websites
2 2a, 2b Taiwanese Firms China Credit Information Service (various years); Toyo Keizai(various years); Company Websites
2 2a, 2b All Chinese Firms,Chinese Firms
Ministry of Metallurgical Industry of China (various years);Company Websites
na 2c Japanese Firms Nihon Keizai Shinbunsha (2001, 2002, various years); CompanyWebsites
3 3a, 3b All Japanese Firms Ministry of Finance (various years)
3 3a, 3b Japanese Firms Nihon Keizai Shinbunsha (2001, 2002, various years); CompanyWebsites
3 3a, 3b All Korean Firms Bank of Korea (various years); National Statistical Office (variousyears)
3 3a, 3b Korean Firms Asia-Pacific Infoserv (various years a, various years b); BusinessKorea (various years) Saturn Communications (various years a,various years b); Toyo Keizai (various years); Company Websites
3 3a, 3b Taiwanese Firms China Credit Information Service (various years); Toyo Keizai(various years); Company Websites
3 3a, 3b All Chinese Firms,Chinese Firms
Ministry of Metallurgical Industry of China (various years);Company Websites
na 3c Japanese Firms Nihon Keizai Shinbunsha (2001, 2002, various years); CompanyWebsites
3 3a, 3c Exchange Rates International Monetary Fund (2002)
4 4 Japanese Firms Nihon Keizai Shinbunsha (2001, 2002, various years); CompanyWebsites
4 4 Exchange Rates International Monetary Fund (2002)
58

Appendix Table 9a: Data Sources (for Company Websites see Appendix Table 9b)TextTable
AppendixTables
Firm, Group of Firms, orIndicator Source(s)
5 5a, 5b All Japanese Firms Ministry of Finance (various years)
5 5a, 5b Japanese Firms Nihon Keizai Shinbunsha (2001, 2002, various years); CompanyWebsites
5 5a, 5b All Korean Firms Bank of Korea (various years); National Statistical Office (variousyears)
5 5a, 5b Korean Firms Asia-Pacific Infoserv (various years a, various years b); BusinessKorea (various years) Saturn Communications (various years a,various years b); Toyo Keizai (various years); Company Websites
5 5a, 5b Taiwanese Firms China Credit Information Service (various years); Toyo Keizai(various years); Company Websites
5 5a, 5b All Chinese Firms,Chinese Firms
Ministry of Metallurgical Industry of China (various years);Company Websites
na 5c Japanese Firms Nihon Keizai Shinbunsha (2001, 2002, various years); CompanyWebsites
5 5a, 5b, 5c Exchange Rates International Monetary Fund (2002)
6 6a, 6b Japanese Firms Nihon Keizai Shinbunsha (2001, 2002, various years); CompanyWebsites
6 6a, 6b Korean Firms Asia-Pacific Infoserv (various years a, various years b); BusinessKorea (various years) Saturn Communications (various years a,various years b); Toyo Keizai (various years); Company Websites
6 6a, 6b Taiwanese Firms Toyo Keizai (various years); Company Websites
na 6c Japanese Firms Nihon Keizai Shinbunsha (2001, 2002, various years); CompanyWebsites
6 6a Country Exports Organisation for Economic Cooperation and Development (2002);Statistics Canada (2002);
6 6b Country Export-SalesRatios
Country Export Sources from Appendix Table 6a and Country SalesSources from Appendix Table 1a.
6 6a, 6c Exchange Rates International Monetary Fund (2002)
7 7 Country Exports Organisation for Economic Cooperation and Development (2002);Statistics Canada (2002);
7 7 Japanese Firms Company Websites7 7 Korean Firms Company Websites7 7 Taiwanese Firms Toyo Keizai (various years); Company Websites
8 8a, 8b All Japanese Firms Ministry of Finance (various years)
8 8a, 8b Japanese Firms Nihon Keizai Shinbunsha (2001, 2002, various years); CompanyWebsites
8 8a, 8b All Korean Firms Bank of Korea (various years); National Statistical Office (variousyears)
8 8a, 8b Korean Firms Asia-Pacific Infoserv (various years a, various years b); BusinessKorea (various years) Saturn Communications (various years a,various years b); Toyo Keizai (various years); Company Websites
8 8a, 8b Taiwanese Firms China Credit Information Service (various years); Toyo Keizai(various years); Company Websites
8 8a, 8b All Chinese Firms,Chinese Firms
Ministry of Metallurgical Industry of China (various years);Company Websites
na 8c Japanese Firms Nihon Keizai Shinbunsha (2001, 2002, various years); CompanyWebsites
8 8a, 8c Exchange Rates International Monetary Fund (2002)
59

Appendix Table 9b: Company WebsitesCompany WebsiteJapanese Firms Nippon Steel www.nsc.co.jp NKK www.nkk.co.jp Sumitomo Metal Industries www.sumitomometals.co.jp Kobe Steel www.kobelco.co.jp Kawasaki Steel www.kawasaki-steel.co.jp Hitachi Metals www.hitachi-metals.co.jp Nisshin Steel www.nisshin-steel.co.jp Daido Steel www.daido.co.jp Yodogawa Steel Works www.yodoko.co.jp Nippon Yakin Kogyo www.nyk.co.jp Kurimoto www.kurimoto.co.jp Toa Steel Co., Ltd. na Tokyo Steel Manufacturing www.tokyosteel.co.jp Aichi Steel www.aichi-steel.co.jp Japan Steel Works www.jsw.co.jp Toyo Kohan www.toyokohan.co.jpKorean Firms Pohang www.posco.co.kr INI Steel www.inisteel.co.kr/ Kang Won Ind. na Dongkuk www.dongkuk.co.kr/ Dongbu www.dongbu.co.kr Hyundai Hysco www.hysco.com/Taiwanese Firms China Steel www.csc.com.tw/ Yieh United Steel www.yusco.com.tw/Chinese Firms All Chinese Firms na Shanghai-Baoshan www.baosteel.com Shanghai Steel Plants na Baoshan na Shanghai Meishan na Shougang www.shougang.com.cn/ Anshan na Wuhan www.wisco.com.cn/ Panzhihua na Baotou www.btsteel.com.cn/ Taiyuan www.china-steeleng.com/ Benxi www.bxsteel.com.cn/ Maanshan www.magang.com.cn Maanshan Magang na Maanshan Iron & Steel na Hunan Hualing na Xiangtan www.hnxg.com.cn/ Lianyuan na Hengyang www.hysteeltube.com/indexe.htm
60