restoration monitoring: a tool to address public concerns? · 3 uncertainty in ecological...
TRANSCRIPT

1
Restoration Monitoring: A Tool to Address Public Concerns?
Stephen R. Clayton, Ph.D.
Philip Williams & Associates, Ltd. (PWA)Boise, ID
Presentation Outline
Current politics/realities surrounding restoration
Study findings investigating potential for detecting responses to restoration
Monitoring considerations/recommendations for restoration practitioners
National Riverine Restoration Science Synthesis (NRRSS) Project
2
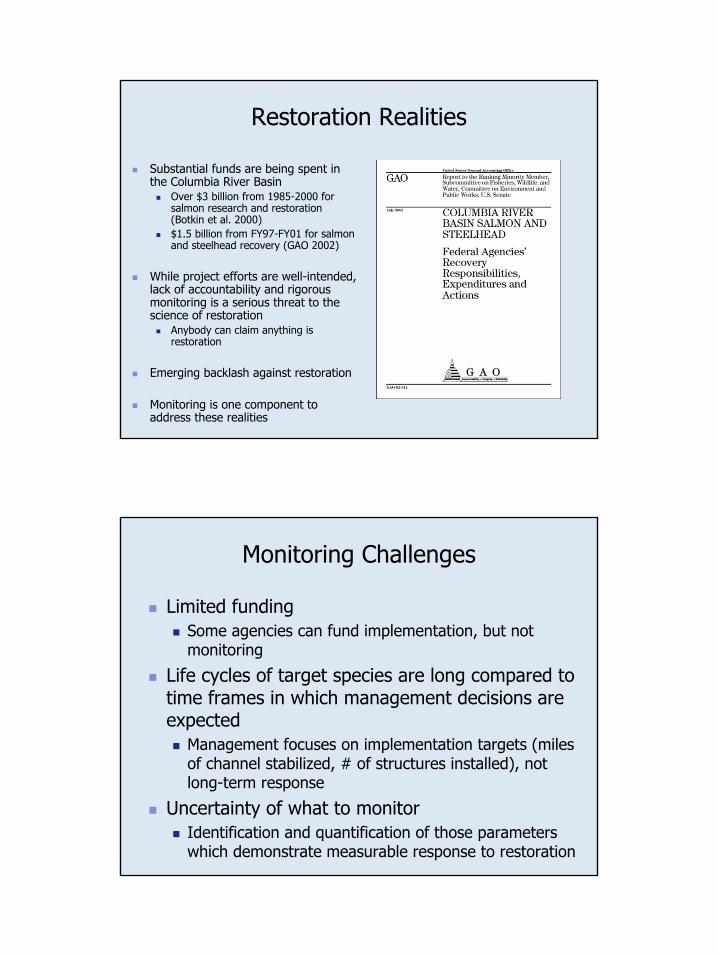
Restoration Realities
Substantial funds are being spent in the Columbia River Basin
Over $3 billion from 1985-2000 for salmon research and restoration (Botkin et al. 2000)$1.5 billion from FY97-FY01 for salmon and steelhead recovery (GAO 2002)
While project efforts are well-intended, lack of accountability and rigorous monitoring is a serious threat to the science of restoration
Anybody can claim anything is restoration
Emerging backlash against restoration
Monitoring is one component to address these realities
Monitoring Challenges
Limited fundingSome agencies can fund implementation, but not monitoring
Life cycles of target species are long compared to time frames in which management decisions are expected
Management focuses on implementation targets (miles of channel stabilized, # of structures installed), not long-term response
Uncertainty of what to monitorIdentification and quantification of those parameters which demonstrate measurable response to restoration

3
Uncertainty in Ecological Restoration Monitoring
Data sets are spatially-sparse and of short-duration.Detectable change from restoration is a small percentage of diurnal, seasonal, or inter-annual variability.Effects occur at multiple spatial and temporal scales.Individual restoration actions may have cumulative responses that are less predictable.
Individual physical responses CumulativeresponsesRestoration
goal
Typicalrestoration
activity Shearstress
Particlesize
Thermalgain Physical Biological
“Restorechannel
geometry”
Reducew/d + + -
“Restorechannel slopeand sinuosity”
Increaselength - - +
? ?
Study Goal and Objectives
Investigate the potential for detecting responses to active stream restoration
Describe natural variability in physical and biological parametersQuantify magnitude and direction of change following restoration

4
Red River Study Reach
Located in north-central Idaho; tributary to SF Clearwater RiverLodgepole and ponderosa pine uplandsElevation=1280 m (4200 ft)Annual ppt (mostly snowmelt)=76 cm (30 in)Drainage area=260 km2 (100 mi2)Bankfull discharge=16.6 cms (580 cfs)Alluvial pool-riffle channel; C and E types
Channel length=4.1 km (2.5 mi)Slope=0.0016; sinuosity=2.7
1996
1936

5
1939
2002
Construction

6
2001
1996
0.00160.00250.0017Slope
2.71.72.4Sinuosity
411525943750Length (m)
After (2000)
Before (1994)
Historic (1936)
Physical Forcing Variables Changed by Active Restoration
Channel alignments

7
1994 2001YEAR
0.0
0.1
0.2
0.3
0.4
0.5
0.6
0.7
0.8
0.9
BA
SEFL
OW
VEL
OC
ITY
(m/s
)
1994 2001YEAR
0.1
0.2
0.3
0.4
0.5
0.6
0.7
0.8
0.9
1.0
1.1
BA
SEFL
OW
DEP
TH (m
)
1994 2001YEAR
0.0
0.1
0.2
0.3
0.4
0.5
0.6
0.7
0.8
BA
SEFL
OW
FR
OU
DE
NO
1994 2001YEAR
0
100
200
300
400
BA
SEFL
OW
WID
TH/D
EPTH
1994 2001YEAR
0.0
0.1
0.2
0.3
0.4
0.5
0.6
0.7
0.8
0.9
BA
S EFL
OW
AB
S A
*
Lower Red River Meadow Restoration Project Cross-Section 43
4214
4216
4218
4220
4222
0 20 40 60 80 100 120
Distance from Left Bank (ft)
Elev
atio
n (ft
)
1997 1998 1999
Typical Before XSLower Red River Meadow Restoration Project
Cross-Section 77 - Camas Bend
4210
4212
4214
4216
4218
4220
4222
0 20 40 60 80 100 120 140 160
Distance from Left Bank (ft)
Elev
atio
n (ft
)
Aug 2000
Typical After XS
1 2
3
?Number of Chinook Redds in Lower Red
River Meadow: 1998-2001
0
2
4
6
8
10
12
14
16
1998 1999 2000 2001
GB (u/s reference) FG (treatment) JH (d/s reference)
Change in Biological Parameters
4
Change in Physical Parameters
Study Hypotheses
Physical parameters
H1: DepthA>DepthB
H1: W/DA<W/DB
H1: A*A>A*B
H1: D50A>D50B
Biological parameters
H1: Resident Salmonid DensityA>Resident Salmonid DensityB
H1: Chinook Parr DensityA>Chinook Parr DensityB
H0: ParameterA=ParameterB

8
Physical Monitoring Variables: Hydraulic, Geomorphic, and Sediment Characteristics
Longitudinal Profile from MIKE11:Post-restoration Conditions at Bankfull Flow
0.0 500.0 1000.0 1500.0 2000.0 2500.0 3000.0 3500.0 4000.0 4500.0 5000.0 5500.0 6000.0[meter]Chainage
1279.0
1279.5
1280.0
1280.5
1281.0
1281.5
1282.0
1282.5
1283.0
1283.5
1284.0
1284.5
1285.0
1285.5
1286.0
1286.5
1287.0
1287.5
1288.0
1288.5
1289.0
1289.5
1290.0
1290.5
1291.0
1291.5
1292.0
1292.5
1293.0
1293.5
1294.0
1294.5
1295.0
1295.5
1296.0
[meter] Water level above msl 15-5-2001 00:00
Bankfull water level
Left top of bankRight top of bank
Rock sill grade control structures
Upstream reference reach Project reach
Downstream reference reach
Thalweg
Dredge piles along channel
Dredged, trapezoidal channel

9
Flood Area Comparison at BankfullDischarge
Pre-Restoration (1994) Post-Restoration (2001)
Biological Monitoring Variables: Habitat Types, Parr Snorkels, and Smolt Traps

10
Parr Snorkel Sites
Physical Results: Changes in Median Particle Size and Percent Fines
1997 (5)
1998 (9)
1999 (11)
2000 (23)
2001 (26)
2002 (26)
YEAR
0
20
40
60
80
D50
(mm
)
1997 (5)
1998 (9)
1999 (11)
2000 (23)
2001 (26)
2002 (26)
YEAR
0
25
50
75
100
FIN
E S (<
6 m
m) (
%)

11
Biological Results: Changes in Age 0 Chinook Density
-100
-80
-60
-40
-20
0
20
40
60
80
100
1986 1987 1988 1989 1990 1991 1992 1993 1994 1995 1996 1997 1998 1999 2000 2001
Chi
nook
(age
0) d
ensi
ty (#
/100
m^2
)
STUDY (RED) CNTL (RED) CNTL (AMER)DIFF (STUDY-CNTL RED) DIFF (STUDY-CNTL AMER)
Before During After
Comparison of Variability in Physical and Biological Parameters at the Project Reach
0
25
50
75
100
125
150
175
200
CV
(%)
Stream temperature (Study reach, upstream) Stream temperature (Study reach, downstream)Thermal gain (Study reach) Omega parameter (Study reach)D16 (Project reach) D50 (Project reach)D84 (Project reach) Percent fines (Project reach)Spawning substrate (Project reach) Cross section area (Project reach)
Age 0 chinook (Project reach GPM/ISS) Age 0 chinook (Project reach)Rainbow trout (Project reach) Mountain whitefish (Project reach)Chinook redds (Project reach)
Physical parameters Biological parameters

12
21
222
2112
νννν
++= sss p
Pooled variance: where υ is degrees of freedom (n-1) and s2 is the variance of each
sample [Zar 1984].
21
212nnnnn
+=
Harmonic mean of two sample sizes, where n is the size of each sample [Zar 1984]
)(2
),1(,
2
νβναδ ttns p +≥
Minimum detectable difference where α is the significance level, υ is the degrees of freedom df=(2(n-1)), β is the probability of a type II error, tα,υ is the value from a one-tailed t-table with probability α and υ df, and tβ,υ is the value from a one-tailed t-table with probability β and υ df [Zar 1984].
Quantification of Detectable Difference
Detectable Impact as a Function of Years of Post-restoration Monitoring
0
25
50
75
100
125
150
175
200
0 10 20 30 40 50
Years of post-restoration monitoring
Det
ecta
ble
impa
ct a
s a p
erce
nt o
fpr
e-re
stora
tion
mea
n
Age 0 chinook densities (Study reach) (B only) Age 0 chinook densities (Study-Control) (B only)Chinook redds (Red River aerial counts) (B only) Percent fines (Project reach) (D&A only)Median particle size (Project reach) (D&A only)
Det
ecta
ble
impa
ct a
s a p
erce
nt o
fpr
e-re
stor
atio
n m
ean

13
Detectable Impact as a Function of Years of Post-restoration Monitoring
0
25
50
75
100
125
150
175
200
0 10 20 30 40 50
Years of post-restoration monitoring
Det
ecta
ble
impa
ct a
s a p
erce
nt o
fpr
e-re
stora
tion
mea
n
Age 0 chinook densities (Study reach) (B only) Age 0 chinook densities (Study-Control) (B only)Chinook redds (Red River aerial counts) (B only) Percent fines (Project reach) (D&A only)Median particle size (Project reach) (D&A only)
Det
ecta
ble
impa
ct a
s a p
erce
nt o
fpr
e-re
stor
atio
n m
ean
Recommendations for Monitoring to Demonstrate Project Effectiveness
Monitor at treatment, control, and reference sites
Monitor as long as possible BEFORE restoration implementation
Focus on those parameters which have high potential for detecting response and which have biological significance

14
Useful ReferencesDownes, B.J., L.A. Barmuta, P.G. Fairweather, D.P. Faith, M.J. Keough, P.S. Lake, B.D. Mapstone, and B.D. Quinn. 2002. Monitoring ecological impacts concepts and practice in flowing waters. Cambridge University Press. New York, NY. 434 p.
Kaufmann, P.R., P. Levine, E.G. Robison, C. Seeliger, and D.V. Peck. 1999. Quantifying physical habitat in wadeable streams. EPA/620/R-99/003. U.S. Environmental Protection Agency. Washington, D.C.
Roper, B.B., J.L. Kershner, E. Archer, R. Henderson, and N. Bouwes. In review. An evaluation of physical stream habitat attributes used to monitor streams. USDA Forest Service. Fish and Aquatic Ecology Unit. Logan, UT.
Conclusions
To distinguish between change due to natural variability and response induced by restoration activity, monitoring must be:
Initiated prior to implementationConducted at control sites (and reference sites if possible) as well as at the treatment site
River restoration curricula and design standards should incorporate topics such as statistics, study design, and monitoring/evaluation.
By incorporating appropriate monitoring procedures, restoration practitioners may help address some public concerns surrounding stream restoration.

15
Bonneville Power AdministrationNational Science Foundation (Award BES-9874754)
Dissertation committee members: Peter Goodwin, John Buffington, Peter Bisson, Jan Boll, Piotr Jankowski
DHI Water and EnvironmentIdaho Dept. of Fish and GameIdaho Soil and Water Conservation DistrictLower Red River Meadow Restoration Project Technical Advisory Committee
LRK CommunicationsNez Perce TribeNSF Career Grant Summer 1999, 2000, 2001 participants Pocket Water, Inc.Professional Operator CompanyRiver Masters EngineeringTerraGraphics Environmental Engineering, Inc.University of Idaho Ecohydraulics Research Group visiting faculty, undergraduate, and graduate students: Dr. Tony Minns, Dr. Nigel Wright, Shawkat Ali, Gloria Beattie, Ken Donley, Dave Fuhrman, Ben Hudson, Aaron Teats, Eric Walton, and Callie WeissUSFS Nez Perce National ForestWildlife Habitat Institute
Acknowledgements
NRRSS NRRSS National Riverine Restoration National Riverine Restoration
Science SynthesisScience Synthesis
M.A. Palmer (coM.A. Palmer (co--PI), J.D. Allan (coPI), J.D. Allan (co--PI), E.S. Bernhardt PI), E.S. Bernhardt National CoordinatorsNational Coordinators
The NRRSS Project aims to provide a national level synthesis that can be used to inform policy on river restoration at local, regional, and national levels.
www.americanrivers.org/feature/riverrestoration.htm
16
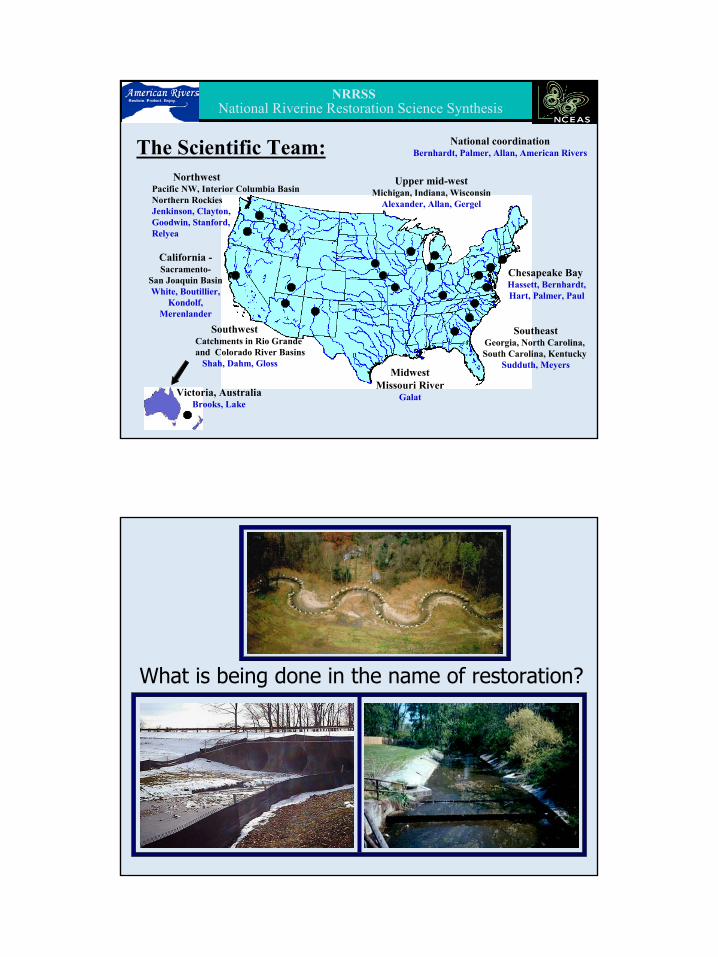
National coordinationBernhardt, Palmer, Allan, American Rivers
Southwest Catchments in Rio Grandeand Colorado River Basins
Shah, Dahm, Gloss
California -Sacramento-
San Joaquin BasinWhite, Boutillier,
Kondolf, Merenlander
Northwest Pacific NW, Interior Columbia BasinNorthern RockiesJenkinson, Clayton, Goodwin, Stanford, Relyea
SoutheastGeorgia, North Carolina, South Carolina, Kentucky
Sudduth, Meyers
Chesapeake Bay Hassett, Bernhardt,Hart, Palmer, Paul
Upper mid-westMichigan, Indiana, Wisconsin
Alexander, Allan, Gergel
The Scientific Team:
Victoria, AustraliaBrooks, Lake
National Riverine Restoration Science SynthesisNRRSS
MidwestMissouri River
Galat
What is being done in the name of restoration?

17
All restoration projects are experiments . . .
What is the role of science in current restoration practice?
• Evaluate the state of the practice of stream restoration nationally and identify factors associated with project success.• Examine the links between ecological theory and stream restoration.• Identify the unanswered questions meriting further research.• Develop specific recommendations for implementing and evaluating stream restoration practice.• Disseminate this information broadly and on an on-going basis.
Project GoalsNRRSS

18
MULTIPLE AGENCIES MULTIPLE LEVELS OF ORGANIZATION
CooperatorsNRRSS