responsible investment trends report 2015 canadian responsible investment trends report reveals that...
TRANSCRIPT
2015 CANADIANRESPONSIBLE INVESTMENT
TRENDS REPORT
SPONSORS:

1
2015 CANADIAN RESPONSIBLE INVESTMENT TRENDS REPORT
ABOUT THE RIAThis report was authored and published by the Responsible Investment Association (RIA). The
RIA is Canada’s membership association for responsible investment (RI). Members include mutual
fund companies, financial institutions, asset management firms, advisors, consultants, investment
research firms, asset owners, individual investors and others interested in RI.
Our members believe that the integration of environmental, social and governance (ESG) factors
into the selection and management of investments can provide superior risk adjusted returns and
positive societal impact.
Statement of Purpose
The Responsible Investment Association’s purpose is to:• support the responsible investment activities of its members.
• promote and support an integrated reporting framework in which there is standardized disclosure of material ESG information.
• promote the integration of ESG factors into investment analysis and decision-making processes.
• promote the practice of responsible investing in Canada.
Learn more at www.riacanada.ca.

2
2015 CANADIAN RESPONSIBLE INVESTMENT TRENDS REPORT
ACKNOWLEDGEMENTS
Project Staff
Supporters
Thank you to the following experts for sharing their insights: Sandra Odendahl (RBC), Jason
Milne (Phillips, Hager & North), Karim Harji (Purpose Capital), Kate Martin (Credit Union Central of
Canada), Benjamin Janzen (Mennonite Savings and Credit Union).
Data provider
We would to thank the Canadian Institutional Investment Network (CIIN) for providing critical data
on the Canadian investment industry.
SPONSORS
The RIA would like to extend a special thank-you to our sponsors. The research, development, and
publication of this report was made possible by generous contributions from RBC and RBC Global
Asset Management.
PROJECT DIRECTORDustyn LanzRIA Director, Research and
Communications
EXECUTIVE ADVISORDeb Abbey
RIA Chief Executive Officer
RESEARCH TEAMDaria SmehCEO/Founder
LoyalTeam Inc.
Derek WentzellMBA Candidate
Lakehead University
Esma MneinaRIA Junior Associate
(Summer 2014 Intern)
3
2015 CANADIAN RESPONSIBLE INVESTMENT TRENDS REPORT
Table of ContentsEXECUTIVE SUMMARY ......................................................................................................... 4
ABOUT RESPONSIBLE INVESTMENT .................................................................................... 6
What is Responsible Investment? .................................................................................................... 6
RESPONSIBLE INVESTMENT IN CANADA ............................................................................ 10
RI Strategies (billions) ..................................................................................................................... 13
Industry Perspectives ..................................................................................................................... 25
IN FOCUS: IMPACT INVESTMENT ....................................................................................... 28
APPENDIX A: METHODOLOGY ........................................................................................... 39
APPENDIX B: LIST OF SURVEY PARTICIPANTS .................................................................... 40
APPENDIX C: CALCULATION OF INVESTMENT INDUSTRY SIZE .......................................... 42

4
2015 CANADIAN RESPONSIBLE INVESTMENT TRENDS REPORT
EXECUTIVE SUMMARYThe 2015 Canadian Responsible Investment Trends Report reveals that Canada’s responsible
investment (RI) market is experiencing rapid growth. RI refers to the integration of environmental,
social, and corporate governance (ESG) criteria into the selection and management of investments.
According to survey data, as of December 31, 2013, assets in Canada being managed using one or
more RI strategies increased from $600 billion to more than $1 trillion in just two years. This robust
growth represents a 68% increase in RI assets under management.
Highlights• $1 trillion in RI assets under management
• 68% increase in two years
• 31% of Canadian investment industry
• RI mutual fund assets up 52.3% vs. 29.8% for non-RI mutual funds.
• Retail assets over $60 billion
• Pension fund assets utilizing RI strategies up 70% in two years
• Canadian impact investment assets now stand at $4.13 billion, reflecting 9.5% growth since 2012.
• 87% of impact investors who target competitive returns either met or outperformed expectations in 2013.
Canadian RI Industry Growth (billions)
$1,010.79
$600.88
$517.93
$566.68
$459.53
2013
2011
2010
2008
2006
The RI industry’s significant growth can be attributed to at least three factors. First, Canada’s large
pension funds under RI guidelines grew by $288.57 billion. RI pension fund assets are at $821.27
billion, which comprises 81.2% of Canadian RI AUM.
Second, there have been many new entrants to the industry, particularly among investment
managers. Whereas only 24 investment management firms reported Canadian RI assets at the
start of 2012, there are now 41. In a similar trend, whereas there were only 12 Canadian investment
manager Signatories to the UN-supported Principles for Responsible Investment (PRI) at the start of
2012, there are now 29. Investment management firms now account for $191.7 billion in RI assets.1
Canadian investment managers are increasingly aware of ESG risks, and they are taking steps to
manage those risks by integrating ESG factors into the investment decision-making process.
Third, qualitative factors including personal values, increased awareness of ESG risks, and
generational transfer of wealth are playing an important role in the growth of RI in Canada,
particularly on the retail side. Total retail assets now stand at $61.9 billion. Retail RI funds, which
include mutual funds and retail venture capital funds, have grown from $13.48 billion to $17.5
1Note that the total for investment managers, $191.7 billion, includes some externally managed pension fund assets already
noted in the pension fund total. We subtracted those assets when calculating total RI AUM in Canada, so they were not double-
counted in the RI industry total of $1.01 trillion.
5
2015 CANADIAN RESPONSIBLE INVESTMENT TRENDS REPORT
billion, or 29.8% over the last two years. RI mutual funds alone have increased by 52.3%, from
$4.36 billion to $6.64 billion compared to 29.8 % growth in non-RI funds during the same period.
Canadian investors and investment managers employ numerous RI strategies, yet four strategies
stand above the rest. The dominant strategy is corporate engagement and shareholder action,
which refers to the use of shareholder influence to improve corporate behaviour. This strategy is
utilized in the management of 86.5% of Canadian RI assets. The top three engagement issues in
2013 were executive compensation, human right issues, and greenhouse gas emissions.
ESG integration is the second most prominent strategy, representing 77.5% of AUM, while norms-
based screening and negative screening represent 56.3% and 50.8%, respectively.
Impact investment is a small but increasingly important category of RI. Impact investing refers to
investments that provide solutions to social or environmental challenges by generating positive,
measurable social or environmental impacts as well as a financial return. Canadian impact
investment assets now stand at $4.13 billion, reflecting 9.5% growth since 2012. Our impact
investment survey found that 87% of impact investors who target competitive returns either met
or outperformed expectations in 2013. This finding supports the case that investing for social or
environmental impact can generate competitive returns.
There’s a growing consensus among investors that accurate valuations and proper risk
management require greater disclosure and consideration of ESG issues (e.g., climate change,
human rights, labour relations, consumer protection, health and safety and aboriginal relations).
This report shows that ESG criteria are increasingly being used to help managers identify risks that
are not adequately addressed by traditional investment analysis. In doing so they are better able
to accurately predict financial performance. And it’s helping them identify opportunities to invest in
sustainable businesses that are involved in energy efficiency, green infrastructure, clean fuels and
other sectors that provide adaptive solutions to some of the most challenging issues of our time.

6
2015 CANADIAN RESPONSIBLE INVESTMENT TRENDS REPORT
ABOUT RESPONSIBLE INVESTMENT
What is Responsible Investment?
Responsible investment (RI) is the integration of environmental, social and governance factors (ESG)
into the selection and management of investments. There is growing evidence that RI reduces risk
and leads to superior long-term financial returns.
In recent years, responsible investment has come to encompass:
• Ethical investing,
• Socially responsible investing,
• Sustainable investing,
• Green investing,
• Community investing,
• Mission-based investing,
• Impact investing.
Evolution of Responsible Investment
Responsible investing has changed. It isn’t just about personal values anymore. It’s about
managing risk to long-term shareholder and stakeholder value. In a world where climate change,
water scarcity and global supply chain issues dominate the business pages, that job has become a
lot more challenging.
Responsible investors have long known that the integration of ESG factors into the selection and
management of investments can provide superior risk-adjusted returns and positive societal impact.
What’s changed in the past decade is that it’s being recognized as a mainstream function of good
investment practice, resulting in better, more informed investment decisions.
Why? Because our world is very complex, and the tools that investment managers have traditionally
used to manage risk simply aren’t up to the task any more. Interpreting quarterly results just isn’t
enough. We need to know how the companies we invest in are managing the future: ESG analysis
gives us a bigger and clearer window into their operations and the quality of their management. It’s
just common sense.
Global Initiatives
There’s a growing consensus among investors that accurate valuations and proper risk
management require greater disclosure and consideration of ESG issues (e.g., climate change,
human rights, labour relations, consumer protection, health and safety and aboriginal relations).
The UN Sustainable Stock Exchanges Initiative has brought together sixteen stock exchanges
including the world’s largest, the NYSE Euronext, to explore how they can work with investors,
regulators and companies to increase transparency on ESG issues.
The goal is to encourage responsible, long-term approaches to investment. Even stock exchanges
are beginning to understand the link between profitability and responsibility. And recent research has
shown that analysts are giving more positive recommendations to companies that address ESG risk.
There’s a growing consensus among
investors that accurate valuations
and proper risk management require
greater disclosure and consideration of
ESG issues

7
2015 CANADIAN RESPONSIBLE INVESTMENT TRENDS REPORT
RI Policy Developments in Canada
With a growing body of evidence that ESG considerations have an impact on the financial
performance of securities, the UK, Australia, France and Germany now require that investment
decision makers disclose the extent to which they take these factors into account. The Ontario
government has recently introduced similar legislation in an amendment to the Ontario Pension
Benefits Act. The Act now requires pension plan administrators to establish a statement
of investment policies and procedures (SIPPs) that contains “information about whether
environmental, social and governance factors are incorporated into the plan’s investment policies
and procedures and, if so, how those factors are incorporated.” This could be a great boon to
responsible investment in Canada, particularly if other provinces follow suit.
Ontario has also taken action to increase the number of women on boards and in senior
management. Companies are now required to disclose information regarding the number of women
in these positions, company policies regarding women on the board, and director term limits. The
Ontario Securities Commission will enforce the new rule through a “comply or explain” model.
Responsible Investment Strategies
In an effort to clarify and standardize the language used to describe RI strategies, we have aligned
our definitions with the UN-supported Principles for Responsible Investment (PRI) and our partner
organizations in the Global Sustainable Investment Alliance (GSIA). There are seven RI strategies
covered in this report:
1. Positive or Best-in-Class Screening
Positive screening or “best in class” investing refers to investment in sectors, companies or projects
selected from a defined universe for positive ESG performance relative to industry peers.
2. Negative or Exclusionary Screening
Negative screening refers to the exclusion, from a fund or portfolio, of sectors, companies, projects
or countries based on ethical, moral or religious beliefs. For example, a fund or pension manager
may decide to exclude specific sectors such as military weapons, tobacco or fossil fuels, or not to
invest in a country involved in human rights abuses, such as Burma. This also includes screening
out companies who do not perform as well as industry peers, such as best-in-class companies.
3. ESG integration
ESG is the term that has emerged globally to describe the environmental, social and corporate
governance factors that concern investors and other stakeholders. The issues are ones that were
traditionally considered non-financial or not material. Recent studies, however, have shown a
correlation between strong ESG performance and financial outperformance.
Integration is different from screening in that integration combines ESG data, research and analysis
together with traditional financial analytics in making investment decisions. Research has shown
that ESG integration combined with a best-in-class approach is more likely to generate superior
portfolio returns than negative screening alone or traditional socially responsible investing which has
typically incorporated both negative and positive screening. The evolution of responsible investment
has produced many funds that are hybrids of the various strategies. And SRI and RI are often
interchangeable terms.

8
2015 CANADIAN RESPONSIBLE INVESTMENT TRENDS REPORT
• Unlike screening, companies are not ‘screened in’ or ‘screened out’ of an investable universe.
• Integration must be verifiable by a transparent and systematic process informed by ESG research & analysis.
4. Corporate engagement and shareholder action
Corporate engagement and shareholder action is defined as using shareholder power to influence
corporate behaviour through direct engagement, filing or co-filing shareholder proposals, and proxy
voting that is guided by ESG guidelines. Many fund managers employ the following strategies as
active shareholders:
• Engaging in dialogue with company management and boards of directors.
• Filing or co-filing shareholder resolutions
• Voting proxies based on ESG criteria
Canadian RI funds have been leaders in bringing forward proposals to press companies to consider
the environmental, social and financial risks associated with issues like oil sands production or
supply chain management.
5. Norms-based screening
Norms-based screening is the screening of investments based on compliance with international
norms and standards such as those issued by the Organization for Economic Cooperation and
Development (OECD), the International Labour Organization (ILO), the United Nations, etc. Norms-
based screening may include exclusions of investments that are not in compliance with globally
recognized norms or standards.
6. Sustainability-themed investing
RI addresses the ESG risks faced by today’s investors but there are many opportunities as well.
Sustainability-themed funds invest in sustainable businesses that are involved in energy efficiency,
green infrastructure, clean fuels, low-carbon transportation infrastructure and those that provide
adaptive solutions to some of the most challenging issues of our time. These are investments that
present solutions to our problems and are great opportunities for investors.
A recent Ceres report says that in order to avoid the worst impacts of climate change, we will need
to invest an additional $36 trillion in sustainable businesses by 2050. That’s $1 trillion dollars a
year in green business development opportunities for investors. In some cases, thematic funds are
fossil fuel free and provide an alternative for investors who choose to exclude resource extraction
companies from their portfolios.
Common themes:
• energy efficiency
• green infrastructure
• clean fuels
• low-carbon transportation infrastructure
• adaptive solutions
9
2015 CANADIAN RESPONSIBLE INVESTMENT TRENDS REPORT
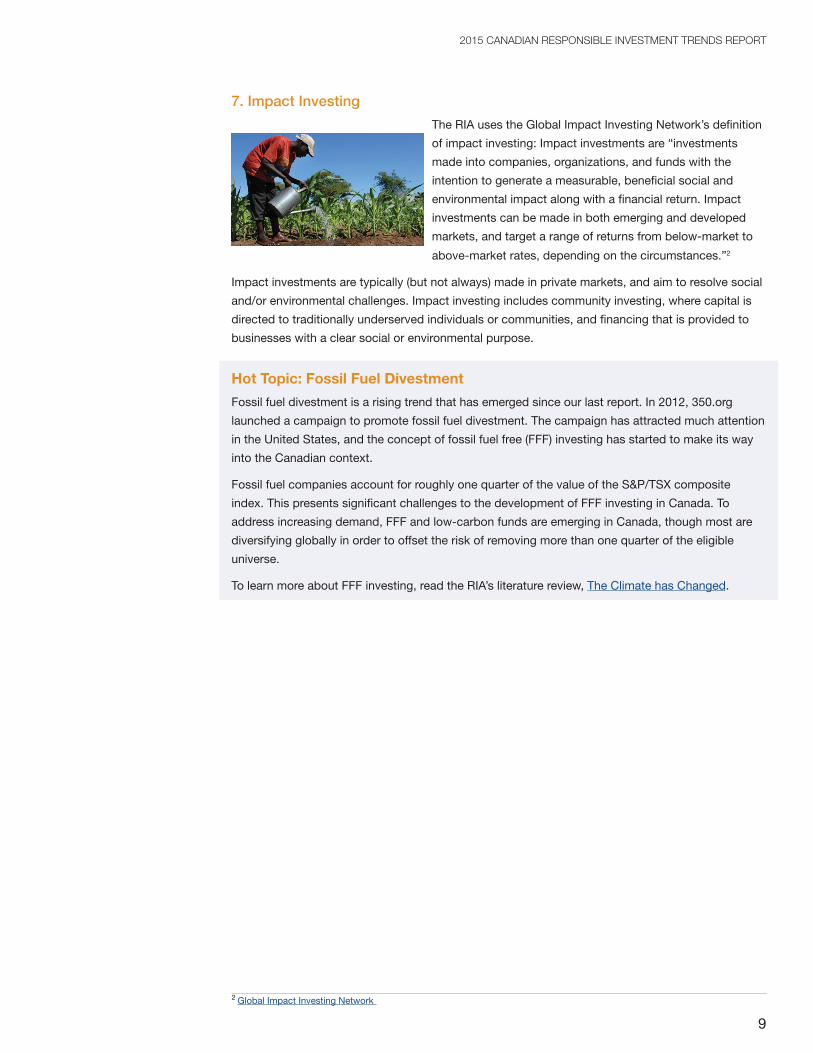
7. Impact Investing
The RIA uses the Global Impact Investing Network’s definition
of impact investing: Impact investments are “investments
made into companies, organizations, and funds with the
intention to generate a measurable, beneficial social and
environmental impact along with a financial return. Impact
investments can be made in both emerging and developed
markets, and target a range of returns from below-market to
above-market rates, depending on the circumstances.”2
Impact investments are typically (but not always) made in private markets, and aim to resolve social
and/or environmental challenges. Impact investing includes community investing, where capital is
directed to traditionally underserved individuals or communities, and financing that is provided to
businesses with a clear social or environmental purpose.
Hot Topic: Fossil Fuel Divestment
Fossil fuel divestment is a rising trend that has emerged since our last report. In 2012, 350.org
launched a campaign to promote fossil fuel divestment. The campaign has attracted much attention
in the United States, and the concept of fossil fuel free (FFF) investing has started to make its way
into the Canadian context.
Fossil fuel companies account for roughly one quarter of the value of the S&P/TSX composite
index. This presents significant challenges to the development of FFF investing in Canada. To
address increasing demand, FFF and low-carbon funds are emerging in Canada, though most are
diversifying globally in order to offset the risk of removing more than one quarter of the eligible
universe.
To learn more about FFF investing, read the RIA’s literature review, The Climate has Changed.
2 Global Impact Investing Network

10
2015 CANADIAN RESPONSIBLE INVESTMENT TRENDS REPORT
RESPONSIBLE INVESTMENT IN CANADA
Total RI Assets in Canada$1.01 trillion
$1,010.79
$600.88
$517.93
$566.68
$459.53
2013
2011
2010
2008
2006
The Canadian responsible investment (RI) industry has grown tremendously over the past two years.
Total assets under management (AUM) using RI strategies have expanded from $600.88 billion at
the start of 2012 to $1.01 trillion at the start of 2014. This reflects an increase of $409.91 billion, or
68%, over two years. Canadian RI assets now account for 31% of Canadian AUM.
Institutional investors account for $948.83 billion, representing 93.87% of the total. Retail investors
account for $61.96 billion, which represents 6.13%. Although most of the RI industry’s growth since
2012 was on the institutional side, the retail market has shown strong growth as well. Assets in retail
RI investment funds grew by 30% since 2011.
The RI industry’s significant growth can be attributed to at least three factors. First, Canada’s large
pension funds under RI guidelines grew by $288.57 billion over the last two years, accounting for
70% of the growth. Pension fund RI assets are now at $821.27 billion, which comprises 81.2% of
Canadian RI AUM.
Second, there have been many new entrants to the industry, particularly among investment
managers. Whereas only 25 investment management firms reported Canadian RI assets at the
start of 2012, there are now 41. In a similar trend, whereas there were only 12 Canadian investment
manager Signatories to the UN-supported Principles for Responsible Investment (PRI) at the start
of 2012, there are now 29. Canadian investment managers are increasingly aware of ESG risks,
and they are taking steps to manage those risks by incorporating ESG issues into the investment
decision-making process.
Third, qualitative factors including personal values, increased awareness of ESG risks, and
generational transfer of wealth are playing an important role in the growth of RI in Canada,
particularly on the retail side. Retail RI assets stand at $61.9 billion. Retail RI funds, which include
mutual funds and retail venture capital funds, have grown by 29.8% over the last two years. RI
mutual funds alone have increased by 52.3%, from $4.36 billion to $6.64 billion compared to 29.8%
growth in non-RI funds during the same period.
Canadian RI assets now account for 31% of
Canadian AUM.
11
2015 CANADIAN RESPONSIBLE INVESTMENT TRENDS REPORT
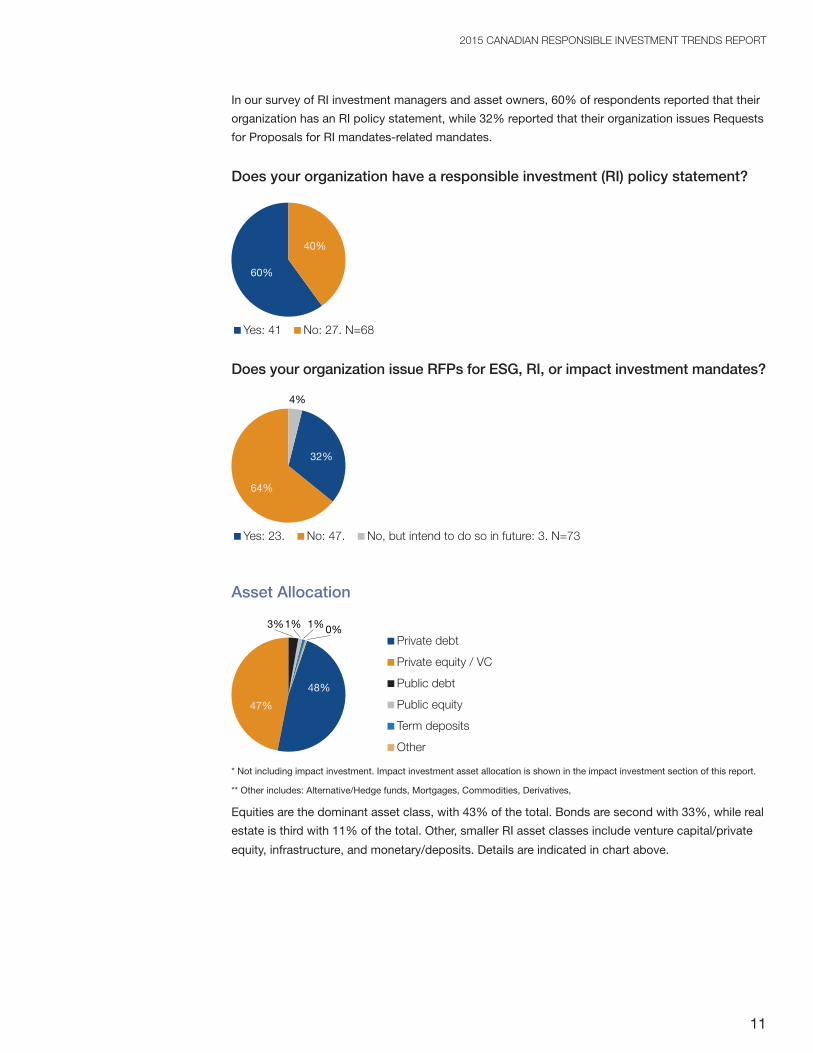
In our survey of RI investment managers and asset owners, 60% of respondents reported that their
organization has an RI policy statement, while 32% reported that their organization issues Requests
for Proposals for RI mandates-related mandates.
Does your organization have a responsible investment (RI) policy statement?
40%
60%
Yes: 41 No: 27. N=68
Does your organization issue RFPs for ESG, RI, or impact investment mandates?
4%
64%
32%
Yes: 23. No: 47. No, but intend to do so in future: 3. N=73
Asset Allocation
3%1% 1%0%
48%
47%
* Not including impact investment. Impact investment asset allocation is shown in the impact investment section of this report.
** Other includes: Alternative/Hedge funds, Mortgages, Commodities, Derivatives,
Equities are the dominant asset class, with 43% of the total. Bonds are second with 33%, while real
estate is third with 11% of the total. Other, smaller RI asset classes include venture capital/private
equity, infrastructure, and monetary/deposits. Details are indicated in chart above.
Private debt
Private equity / VC
Public debt
Public equity
Term deposits
Other

12
2015 CANADIAN RESPONSIBLE INVESTMENT TRENDS REPORT
Green Bonds
Although bonds represent a large portion of Canadian RI assets, our survey respondents who
disclosed bond allocations did not report any allocation to green bonds. Green bonds are broadly
defined as fixed-income securities that raise capital for projects with specific environmental
benefits. Green bond proceeds are typically invested in climate change mitigation or adaptation
efforts such as renewable energy, energy efficiency, sustainable waste management, sustainable
land use, clean transportation and clean water technology.
To date, there have been four Canadian issuers of labeled green bonds: Export Development
Canada, TD Bank, the Government of Ontario, and Tandem Health Partners in partnership with the
Government of British Columbia. These four issuances total $1.53 billion, and were all issued in
2014. All of these green bonds were oversubscribed. So although Canada was a latecomer to the
green bond boom, there is proof of demand coming from Canadian investors. We can expect to see
more Canadian-issued green bonds in 2015.
Green Bond Issuances to Date ($USD Billions)
2014
2013
2012
2011
2010
2009
2008
2007
1.5 32.6
11
2
1
3.7
1
0.5
0.8
Source: Global data was adapted from the Climate Bonds Initiative and Bloomberg New Energy Finance.
Global
Canada

13
2015 CANADIAN RESPONSIBLE INVESTMENT TRENDS REPORT
RI Strategies (billions)
Enga
gem
ent /
shar
ehol
der a
ctio
nES
G Inte
grat
ion
Norm
s-ba
sed
scre
enin
g
Negat
ive /
exclu
siona
ry sc
reen
ing
Sust
ainab
ility
them
ed in
vest
ing
Impa
ct in
vest
ing
Posit
ive / b
est-i
n-cla
ss s
cree
ning
$874.8
$783.4
$569.0
$513.4
$49.4 $4.1 $2.9
* Total RI assets under management: $1.01 trillion as at Dec. 31, 2013
**Many assets are invested using multiple RI strategies, so these dollar amounts sum to an amount that is greater than the total
reported RI AUM.
The chart above indicates the seven RI strategies that Canadian investors are using, and the dollar
amounts for each strategy. At $874.8 billion, corporate engagement and shareholder action is the
leading RI strategy. It is followed by ESG integration with $783.4 billion, norms-based screening
with $569 billion, negative/exclusionary screening with $513.4 billion, sustainability themed
investing with $49.4 billion, impact investing with $4.1 billion, and positive/best in class screening
with $2.9 billion.
1. Corporate Engagement and Shareholder Action $874.8 billion
Corporate engagement and shareholder action is defined as using shareholder power to influence
corporate behaviour through direct engagement (i.e. communicating with management/boards),
filing or co-filing shareholder proposals, and proxy voting that is guided by ESG guidelines. 38% of
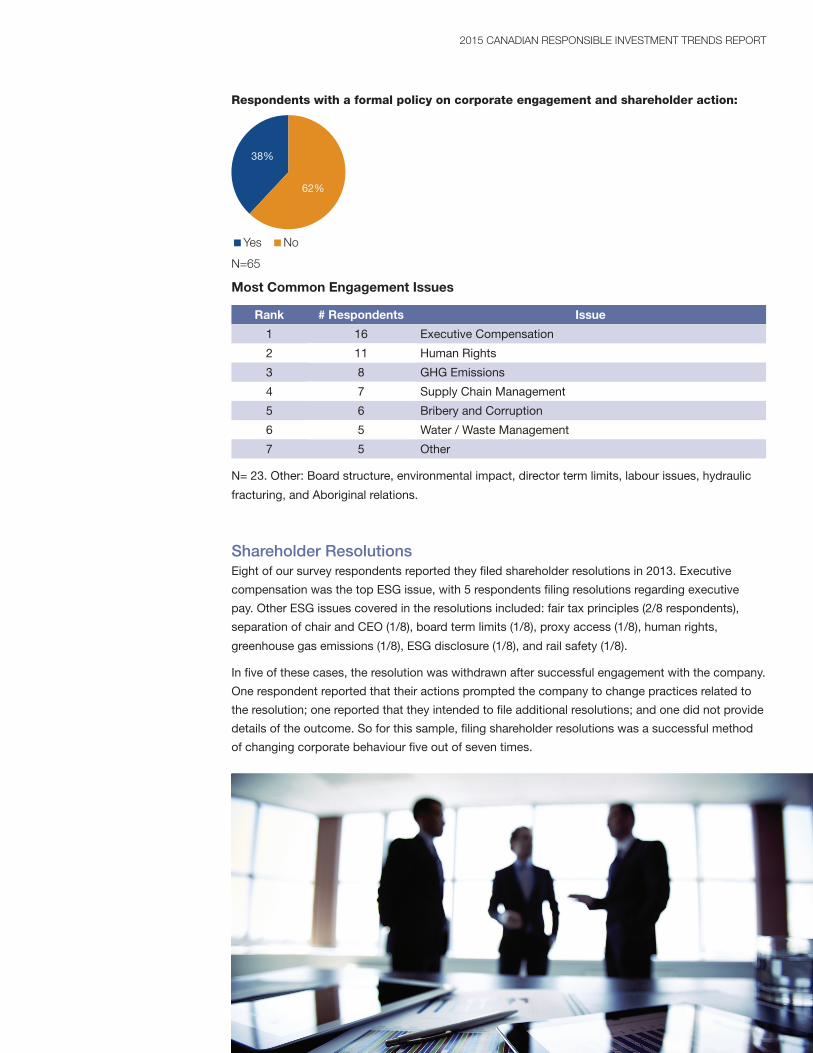
survey respondents have a formal policy on corporate engagement and shareholder action.
14
2015 CANADIAN RESPONSIBLE INVESTMENT TRENDS REPORT
Respondents with a formal policy on corporate engagement and shareholder action:
62%
38%
Yes No
N=65
Most Common Engagement Issues
Rank # Respondents Issue
1 16 Executive Compensation
2 11 Human Rights
3 8 GHG Emissions
4 7 Supply Chain Management
5 6 Bribery and Corruption
6 5 Water / Waste Management
7 5 Other
N= 23. Other: Board structure, environmental impact, director term limits, labour issues, hydraulic
fracturing, and Aboriginal relations.
Shareholder ResolutionsEight of our survey respondents reported they filed shareholder resolutions in 2013. Executive
compensation was the top ESG issue, with 5 respondents filing resolutions regarding executive
pay. Other ESG issues covered in the resolutions included: fair tax principles (2/8 respondents),
separation of chair and CEO (1/8), board term limits (1/8), proxy access (1/8), human rights,
greenhouse gas emissions (1/8), ESG disclosure (1/8), and rail safety (1/8).
In five of these cases, the resolution was withdrawn after successful engagement with the company.
One respondent reported that their actions prompted the company to change practices related to
the resolution; one reported that they intended to file additional resolutions; and one did not provide
details of the outcome. So for this sample, filing shareholder resolutions was a successful method
of changing corporate behaviour five out of seven times.
15
2015 CANADIAN RESPONSIBLE INVESTMENT TRENDS REPORT
Proxy Voting
Most company shares carry voting rights.
Shareholders can vote their shares by proxy
instead of attending company meetings. There
are a variety of matters that shareholders
vote on each year. The most common are the
election of directors, appointment of auditors
and approval of executive compensation. But
there are also votes relating to environmental
reporting, climate change risk management
and many other issues important to responsible
investors. Responsible investors vote to
promote change and integrate ESG into
management decisions.
The RIA conducted a study analyzing Canadian
mutual fund votes on selected categories of
management and ESG-related shareholder
resolutions appearing on the ballots of S&P/TSX
Composite and Russell 3000 companies in the
2013 proxy season.
The study investigated the voting patterns of
25 Canadian fund complexes representing a
cross-section of Canada’s mutual fund industry.
Three of these, including RIA members, Ethical
Funds (NEI), Meritas (OceanRock) and Inhance
(IA Clarington), are historically RI fund groups,
while the remainder cover a broad spectrum
of Canadian mutual fund groupings, including
some of the largest and best-known mutual
fund brand names.
The study revealed that across the board, RI
funds support more ESG-related shareholder
resolutions than their mainstream counterparts.
Most, but not all, of these funds are members of
the Responsible Investment Association.
Read the full study here.
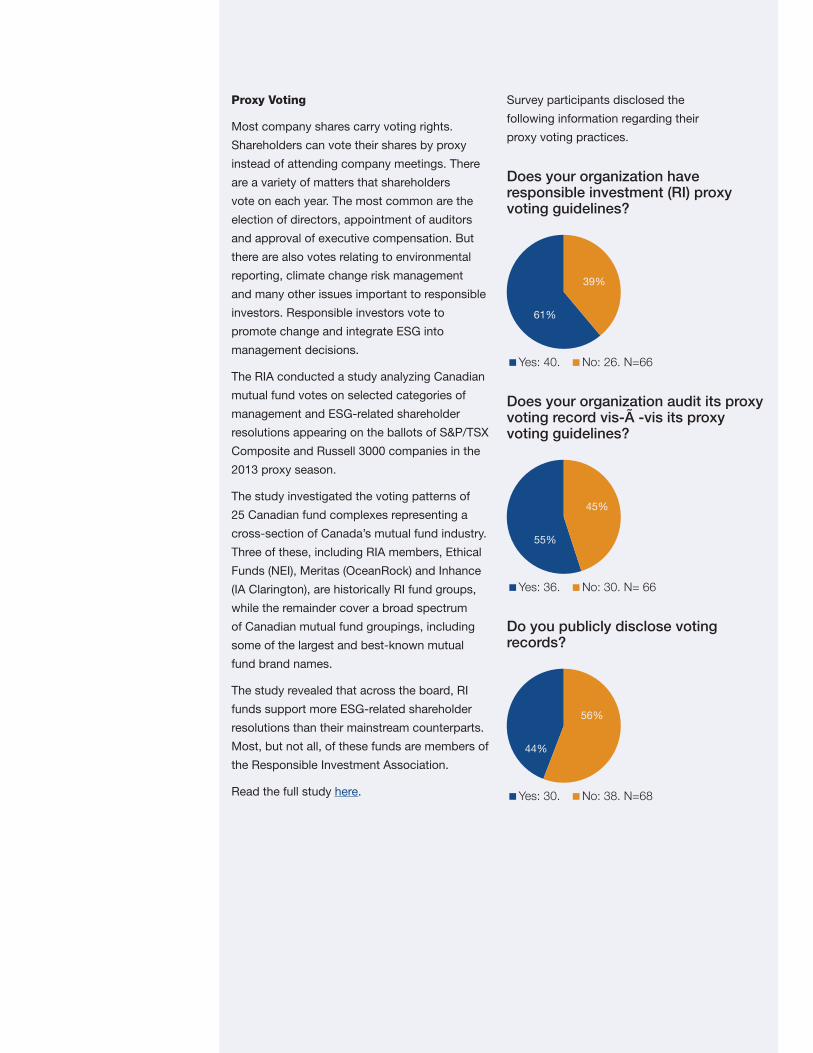
Survey participants disclosed the
following information regarding their
proxy voting practices.
Does your organization have responsible investment (RI) proxy voting guidelines?
61%
39%
Yes: 40. No: 26. N=66
Does your organization audit its proxy voting record vis-Ã -vis its proxy voting guidelines?
55%
45%
Yes: 36. No: 30. N= 66
Do you publicly disclose voting records?
44%
56%
Yes: 30. No: 38. N=68
16
2015 CANADIAN RESPONSIBLE INVESTMENT TRENDS REPORT
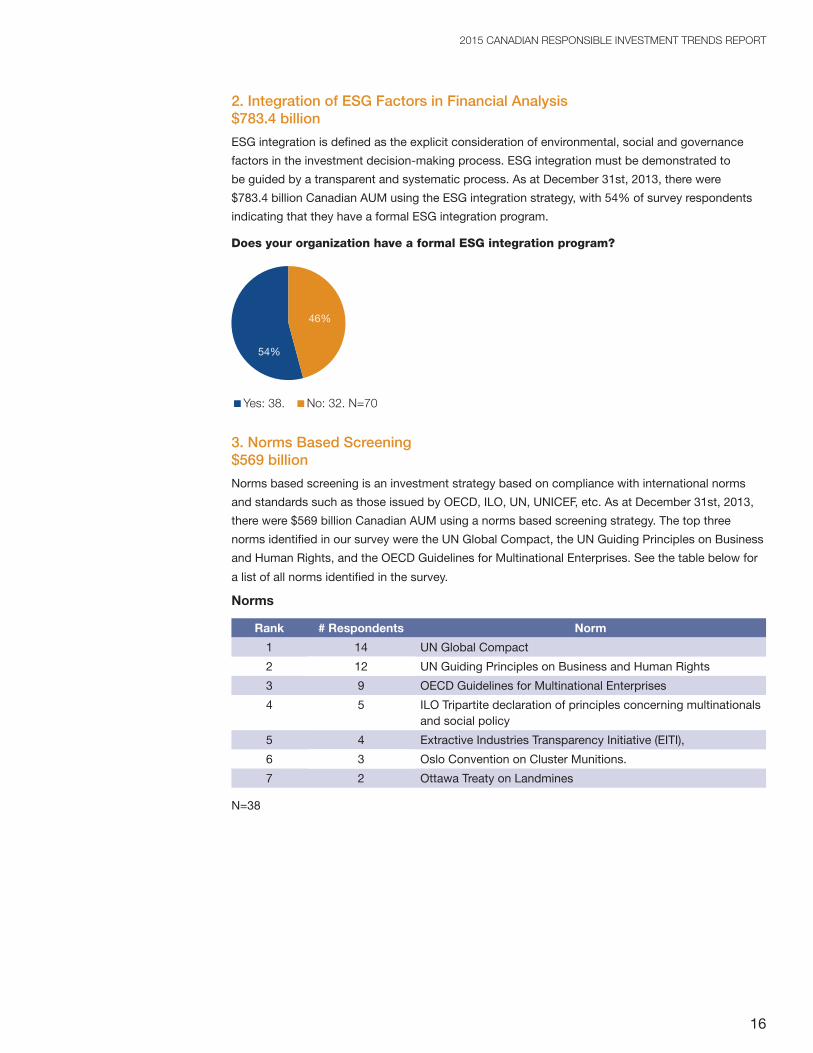
2. Integration of ESG Factors in Financial Analysis $783.4 billion
ESG integration is defined as the explicit consideration of environmental, social and governance
factors in the investment decision-making process. ESG integration must be demonstrated to
be guided by a transparent and systematic process. As at December 31st, 2013, there were
$783.4 billion Canadian AUM using the ESG integration strategy, with 54% of survey respondents
indicating that they have a formal ESG integration program.
Does your organization have a formal ESG integration program?
54%
46%
Yes: 38. No: 32. N=70
3. Norms Based Screening $569 billion
Norms based screening is an investment strategy based on compliance with international norms
and standards such as those issued by OECD, ILO, UN, UNICEF, etc. As at December 31st, 2013,
there were $569 billion Canadian AUM using a norms based screening strategy. The top three
norms identified in our survey were the UN Global Compact, the UN Guiding Principles on Business
and Human Rights, and the OECD Guidelines for Multinational Enterprises. See the table below for
a list of all norms identified in the survey.
Norms
Rank # Respondents Norm
1 14 UN Global Compact
2 12 UN Guiding Principles on Business and Human Rights
3 9 OECD Guidelines for Multinational Enterprises
4 5 ILO Tripartite declaration of principles concerning multinationals and social policy
5 4 Extractive Industries Transparency Initiative (EITI),
6 3 Oslo Convention on Cluster Munitions.
7 2 Ottawa Treaty on Landmines
N=38
17
2015 CANADIAN RESPONSIBLE INVESTMENT TRENDS REPORT
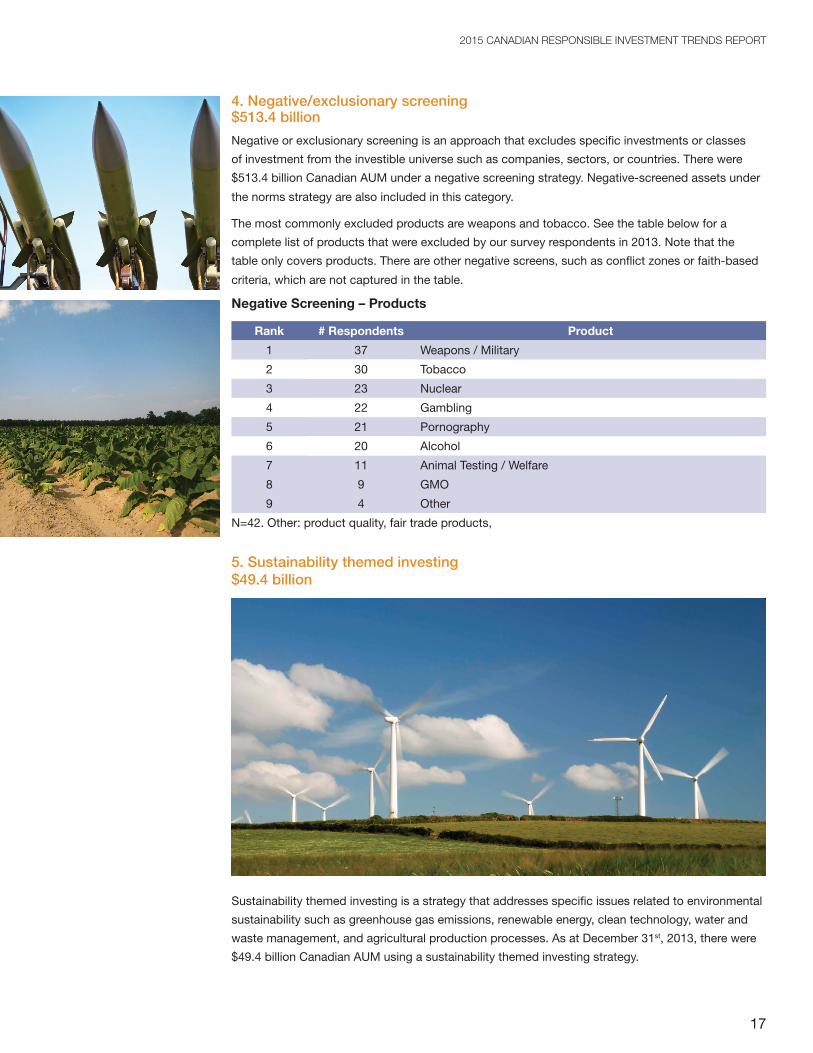
4. Negative/exclusionary screening $513.4 billion
Negative or exclusionary screening is an approach that excludes specific investments or classes
of investment from the investible universe such as companies, sectors, or countries. There were
$513.4 billion Canadian AUM under a negative screening strategy. Negative-screened assets under
the norms strategy are also included in this category.
The most commonly excluded products are weapons and tobacco. See the table below for a
complete list of products that were excluded by our survey respondents in 2013. Note that the
table only covers products. There are other negative screens, such as conflict zones or faith-based
criteria, which are not captured in the table.
Negative Screening – Products
Rank # Respondents Product
1 37 Weapons / Military
2 30 Tobacco
3 23 Nuclear
4 22 Gambling
5 21 Pornography
6 20 Alcohol
7 11 Animal Testing / Welfare
8 9 GMO
9 4 Other
N=42. Other: product quality, fair trade products,
5. Sustainability themed investing $49.4 billion
Sustainability themed investing is a strategy that addresses specific issues related to environmental
sustainability such as greenhouse gas emissions, renewable energy, clean technology, water and
waste management, and agricultural production processes. As at December 31st, 2013, there were
$49.4 billion Canadian AUM using a sustainability themed investing strategy.

18
2015 CANADIAN RESPONSIBLE INVESTMENT TRENDS REPORT
6. Impact Investing $4.1 billion
Impact investing is defined a “investments made into companies, organizations, and funds with the
intention to generate a measurable, beneficial social and environmental impact alongside a financial
return. Impact investments can be made in both emerging and developed markets, and target a
range of returns from below-market to above-market rates, depending upon the circumstances.”3
Impact investments are typically (but not always) made in private markets, and aim to resolve social
and/or environmental challenges. Impact investing includes community investing, where capital is
directed to traditionally underserved individuals or communities, and financing that is provided to
businesses with a clear social or environmental purpose.
As at December 31st, 2013, our researchers were able to verify $4.1 billion in impact investment
assets in Canada. The most comparable recent Canadian data on impact investing is published in
State of the Nation: Impact Investing in Canada.4 Comparing its 2012 data with our 2013 data, we
observe 9.5% growth of the impact investment industry over one year. The vast majority of these
assets, 94%, are invested directly into companies or organizations with a social or environmental
purpose as opposed to being invested indirectly through a fund.
Since impact investing’s characteristics are distinct, and since the impact investing industry is
different from the rest of the RI industry in both composition and scale, we conducted a separate
survey for impact investing. The in-depth results from the impact investment survey are detailed
later in this report in the section titled In Focus: Impact Investment.
7. Positive Screening/Best in Class $2.9 billion
Positive screening or “best in class” investing refers to investment in sectors, companies or projects
selected from a defined universe for positive ESG performance relative to industry peers. As at
December 31st, 2013, there were $2.9 billion Canadian AUM using a positive screening/best–in-
class strategy. Only 11 of our survey participants reported using a positive screening /best in class
approach.
RI ASSETS BY CATEGORYPension Funds: $821.3 billion
2013
2011
2010
2008
2006
$821.30
$532.70
$453.40
$513.50
$396.80
Our researchers tabulated the assets of 10 Canadian pension funds that practice responsible
investing, with combined assets totaling $821.3 billion.5 These pension funds account for the
3 Global Impact Investing Network
4 MaRS and Purpose Capital (2014). State of the Nation: Impact Investing in Canada.
5 There are more than 10 Canadian pension plans or funds that practice responsible investment. To avoid double counting,
however, we implemented two necessary conditions for assets to be included in Pension Fund category: (1) organization must
be either a dedicated pension plan/fund, or their primary business is pension fund management AND (2) externally managed
assets must not be known to be managed by another organization in the Pension Fund category.
we observe 9.5% growth of the impact investment industry
over one year. The vast majority of these assets,
94%, are invested directly into companies
or organizations with a social or
environmental purpose

19
2015 CANADIAN RESPONSIBLE INVESTMENT TRENDS REPORT
majority of Canadian RI assets, representing 81.2% of the total. Pension fund assets account for
70% of the RI industry’s growth since 2011, having grown by $288.6 billion over the last two years.
Pension Funds’ RI Strategies (billions)
$764.50
$703.85
$540.45$505.67
$26.71$0.26 $0.00
Enga
gem
ent /
sha
reho
lder
act
ion
ESG In
tegr
atio
nNor
ms-
base
d sc
reen
ing
Negat
ive /
exclu
siona
ry s
cree
ning
Sust
ainab
ility
them
ed in
vest
ing
Impa
ct in
vest
ing
Posit
ive /
best
-in-c
lass
scre
enin
g
*$821.3 billion total
As the chart above indicates, pension funds primarily used one or more of these four RI strategies:
corporate engagement and shareholder action, ESG integration, norms based screening, and
negative/exclusionary screening. According to our research, Canadian pension funds have allocated
only $26.7 billion, or 3% of their assets, to sustainability-themed investments. Pension funds
reported $260 million utilizing positive screening or a best in class strategy. None reported using an
impact investment strategy.
Canadian pension funds are RI industry leaders in many respects, yet some of Canada’s largest
pension funds still invest in producers of tobacco, weapons, and other products that responsible
investors typically avoid.
Investment Management Firms$191.7 billion
Investment management firms play a major role in the management of assets held by Canadian
institutional and individual investors. Investment management firms invest on behalf of a wide
variety of clients including mutual funds, insurance companies, high net worth individuals,
endowments and foundations, corporations, pension funds, trust funds, sub-advised funds of
various kinds, and other client types.
pension funds primarily used one or more of
these four RI strategies: corporate engagement and shareholder action, ESG integration, norms
based screening, and negative/exclusionary
screening.
20
2015 CANADIAN RESPONSIBLE INVESTMENT TRENDS REPORT
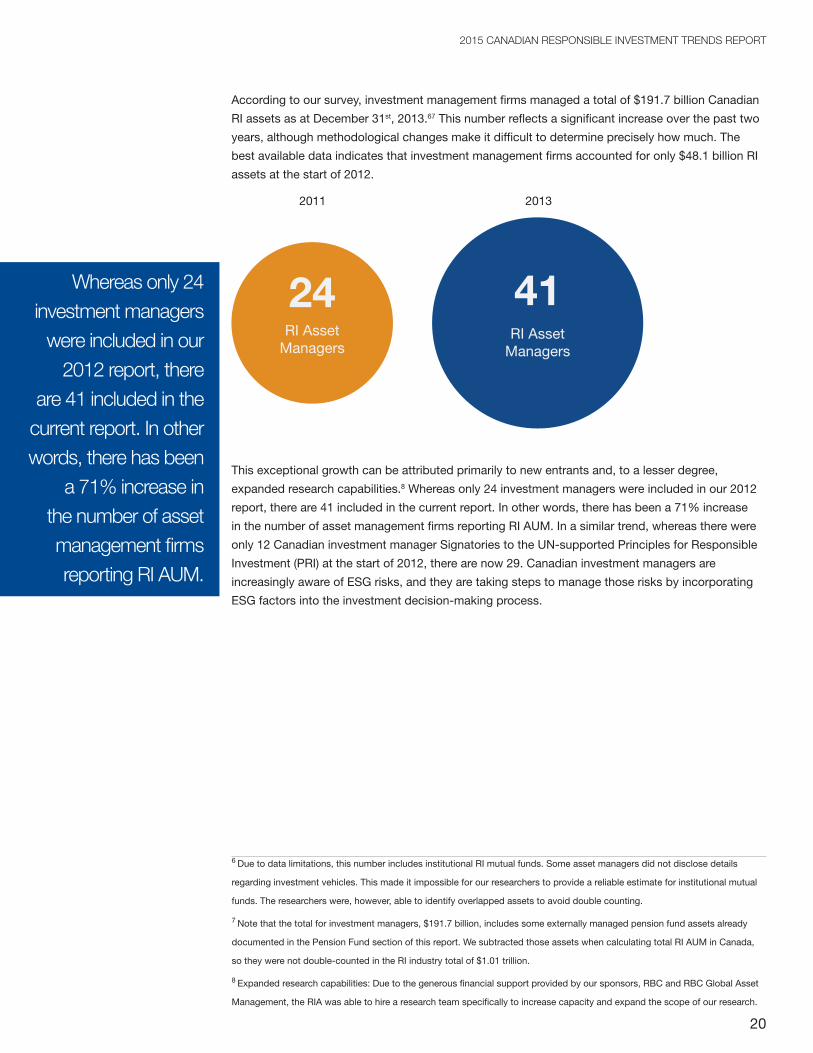
According to our survey, investment management firms managed a total of $191.7 billion Canadian
RI assets as at December 31st, 2013.67 This number reflects a significant increase over the past two
years, although methodological changes make it difficult to determine precisely how much. The
best available data indicates that investment management firms accounted for only $48.1 billion RI
assets at the start of 2012.
2011 2013
24RI Asset
Managers
41RI Asset
Managers
This exceptional growth can be attributed primarily to new entrants and, to a lesser degree,
expanded research capabilities.8 Whereas only 24 investment managers were included in our 2012
report, there are 41 included in the current report. In other words, there has been a 71% increase
in the number of asset management firms reporting RI AUM. In a similar trend, whereas there were
only 12 Canadian investment manager Signatories to the UN-supported Principles for Responsible
Investment (PRI) at the start of 2012, there are now 29. Canadian investment managers are
increasingly aware of ESG risks, and they are taking steps to manage those risks by incorporating
ESG factors into the investment decision-making process.
6 Due to data limitations, this number includes institutional RI mutual funds. Some asset managers did not disclose details
regarding investment vehicles. This made it impossible for our researchers to provide a reliable estimate for institutional mutual
funds. The researchers were, however, able to identify overlapped assets to avoid double counting.
7 Note that the total for investment managers, $191.7 billion, includes some externally managed pension fund assets already
documented in the Pension Fund section of this report. We subtracted those assets when calculating total RI AUM in Canada,
so they were not double-counted in the RI industry total of $1.01 trillion.
8 Expanded research capabilities: Due to the generous financial support provided by our sponsors, RBC and RBC Global Asset
Management, the RIA was able to hire a research team specifically to increase capacity and expand the scope of our research.
Whereas only 24 investment managers
were included in our 2012 report, there
are 41 included in the current report. In other words, there has been
a 71% increase in the number of asset management firms reporting RI AUM.
21
2015 CANADIAN RESPONSIBLE INVESTMENT TRENDS REPORT
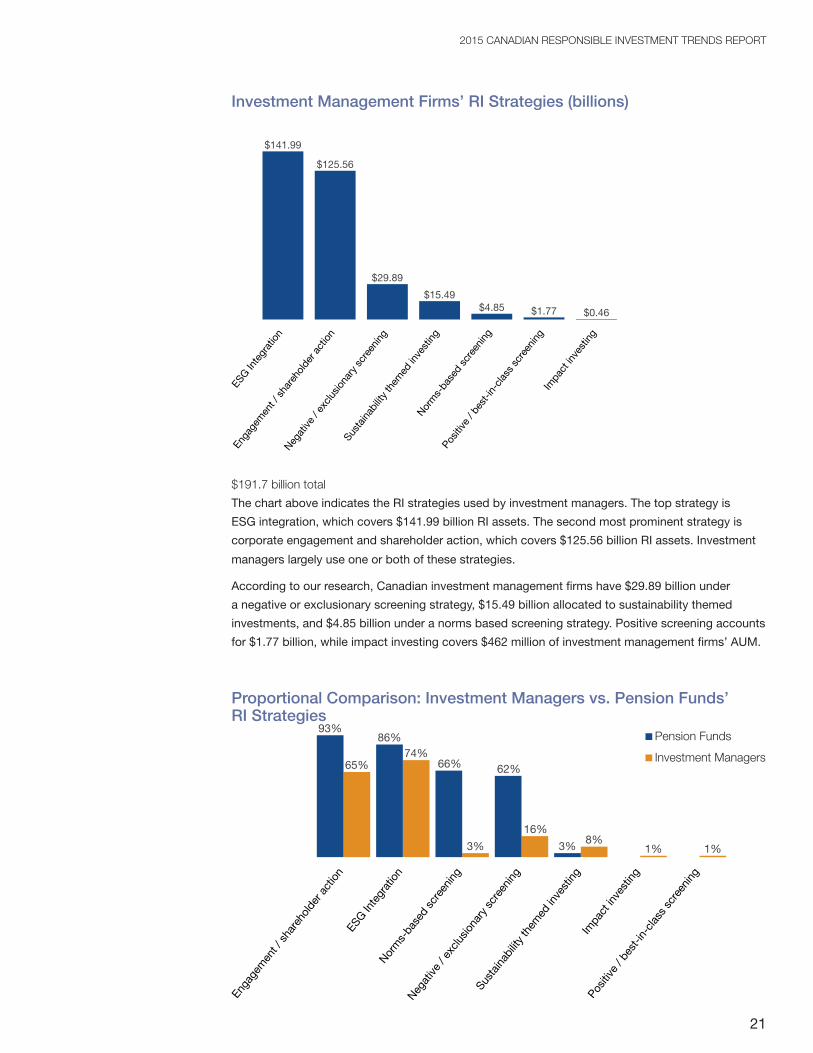
Investment Management Firms’ RI Strategies (billions)
Negat
ive
/ exc
lusio
nary
scr
eeni
ng
Enga
gem
ent /
sha
reho
lder
ac
tion
$141.99
$125.56
$29.89
$15.49$4.85 $1.77 $0.46
ESG In
tegr
atio
n
Norm
s-ba
sed
scre
enin
g
Sust
ainab
ility
them
ed in
vest
ing
Impa
ct in
vest
ing
Posit
ive
/
best
-in-c
lass
scre
enin
g
$191.7 billion total
The chart above indicates the RI strategies used by investment managers. The top strategy is
ESG integration, which covers $141.99 billion RI assets. The second most prominent strategy is
corporate engagement and shareholder action, which covers $125.56 billion RI assets. Investment
managers largely use one or both of these strategies.
According to our research, Canadian investment management firms have $29.89 billion under
a negative or exclusionary screening strategy, $15.49 billion allocated to sustainability themed
investments, and $4.85 billion under a norms based screening strategy. Positive screening accounts
for $1.77 billion, while impact investing covers $462 million of investment management firms’ AUM.
Proportional Comparison: Investment Managers vs. Pension Funds’ RI Strategies
Enga
gem
ent /
shar
ehol
der a
ctio
nES
G Inte
grat
ion
Norm
s-ba
sed
sc
reen
ing
Negat
ive
/
exclu
siona
ry
scre
enin
g
Sust
ainab
ility
th
emed
inve
stin
gIm
pact
inve
stin
g
Posit
ive
/ bes
t-in-
class
scr
eeni
ng
93%
65%
86%74%
62%
16%
3% 1% 1%8%
66%
3%
Pension Funds
Investment Managers
22
2015 CANADIAN RESPONSIBLE INVESTMENT TRENDS REPORT
The above chart compares the proportions of pension funds vs. investment management firms’
assets under each RI strategy. The chart indicates that pension funds are largely using multiple RI
strategies, while investment management firms are employing primarily an engagement or ESG
integration strategy. Investment management firms are, however, allocating a greater proportion of
their assets to sustainability-themed investments.
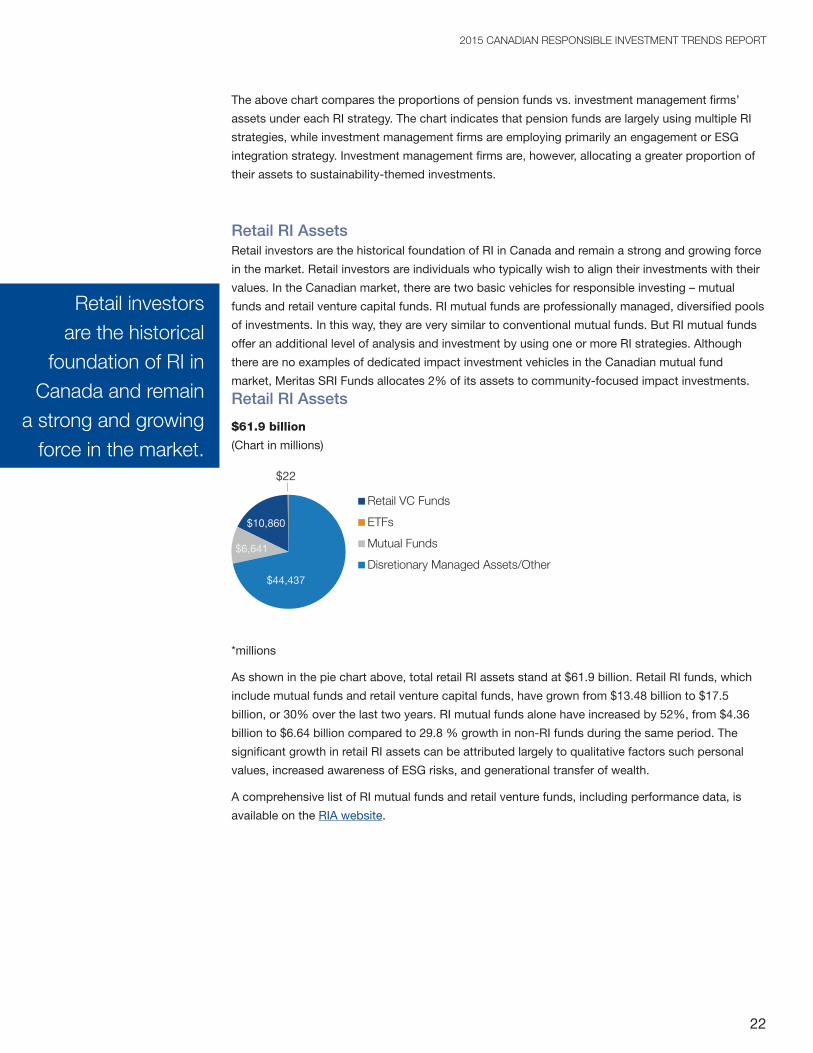
Retail RI AssetsRetail investors are the historical foundation of RI in Canada and remain a strong and growing force
in the market. Retail investors are individuals who typically wish to align their investments with their
values. In the Canadian market, there are two basic vehicles for responsible investing – mutual
funds and retail venture capital funds. RI mutual funds are professionally managed, diversified pools
of investments. In this way, they are very similar to conventional mutual funds. But RI mutual funds
offer an additional level of analysis and investment by using one or more RI strategies. Although
there are no examples of dedicated impact investment vehicles in the Canadian mutual fund
market, Meritas SRI Funds allocates 2% of its assets to community-focused impact investments.
Retail RI Assets
$61.9 billion
(Chart in millions)
$44,437
$10,860
$6,641
$22
Retail VC Funds
ETFs
Mutual Funds
Disretionary Managed Assets/Other
*millions
As shown in the pie chart above, total retail RI assets stand at $61.9 billion. Retail RI funds, which
include mutual funds and retail venture capital funds, have grown from $13.48 billion to $17.5
billion, or 30% over the last two years. RI mutual funds alone have increased by 52%, from $4.36
billion to $6.64 billion compared to 29.8 % growth in non-RI funds during the same period. The
significant growth in retail RI assets can be attributed largely to qualitative factors such personal
values, increased awareness of ESG risks, and generational transfer of wealth.
A comprehensive list of RI mutual funds and retail venture funds, including performance data, is
available on the RIA website.
Retail investors are the historical
foundation of RI in Canada and remain
a strong and growing force in the market.

23
2015 CANADIAN RESPONSIBLE INVESTMENT TRENDS REPORT
Retail RI Funds (billions)
2013
2011
2010
2008
2006
$17.50
$13.48
$12.43
$13.78
$12.13
Includes mutual funds and retail venture capital funds.
Retail RI Mutual Funds (billions)
2013
2011
2010
2008
2006
$6.64
$4.36
$4.11
$5.54
$4.44
Retail RI Venture Capital Funds (billions)
2013
2011
2010
2008
2006
$10.86
$9.12
$8.32
$8.24
$7.69
Retail venture capital funds are professionally- managed pools that invest in small-and-mid- size
companies in the start-up or expansion phase of their development. This group of funds has grown
out of the labour-sponsored venture capital funds that offer federal and provincial tax credits in
many provinces in Canada. RI retail venture capital funds employ the same investment strategies
as mutual funds; but in some cases, funds use a social audit process to examine the employment,
community, supplier and customer record of potential investee companies and this social audit
information is used to determine investment worthiness along with the company’s financial strength.

24
2015 CANADIAN RESPONSIBLE INVESTMENT TRENDS REPORT
ESG CriteriaRI survey participants were asked to identify which environmental, social, and corporate
governance (ESG) issues they incorporate into their investment decisions. The following charts
illustrate their responses.
Environmental Criteria
Rank # Respondents Environmental Issue
1 39 Pollution / Toxics
2 34 Climate Change / Carbon
3 29 Green Building
4 28 Clean Tech
5 26 Sustainable Natural Resources
6 15 Fossil Fuel Divestment
7 14 Other
N=52. Other: Water management, waste management, biodiversity, energy efficiency.
Social Criteria
Rank # Respondents Social Issue
1 47 Human Rights
1 47 Labour
2 26 EEO / Diversity
3 25 Terrorist / Oppressive Regimes
4 12 Other
N=53. Other: Accessibility, health and safety, conflict zone, social inclusion.
Governance Criteria
Rank # Respondents Governance Issue
1 47 Board Issues
2 44 Executive Compensation
3 26 Political Contributions
4 20 Other
N=53. Other: Bribery and corruption, shareholder rights, transparency, code of conduct.
Community Criteria
Rank # Respondents Social Community
1 26 Community Services
1 25 Aboriginal Relations
2 15 Fair Consumer Lending
3 14 Affordable Housing
4 7 Other
N=44. Other: stakeholder engagement, fair trade, support for education.
25
2015 CANADIAN RESPONSIBLE INVESTMENT TRENDS REPORT
INDUSTRY PERSPECTIVES
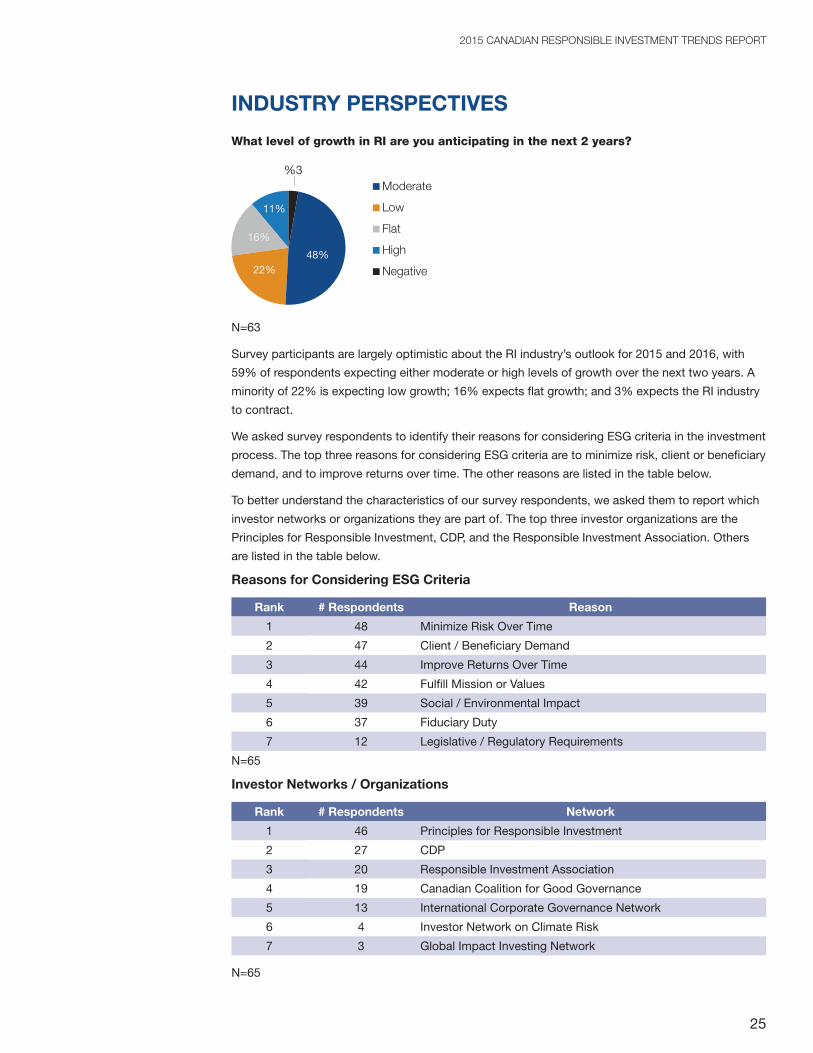
What level of growth in RI are you anticipating in the next 2 years?
48%22%
16%
11%
%3
N=63
Survey participants are largely optimistic about the RI industry’s outlook for 2015 and 2016, with
59% of respondents expecting either moderate or high levels of growth over the next two years. A
minority of 22% is expecting low growth; 16% expects flat growth; and 3% expects the RI industry
to contract.
We asked survey respondents to identify their reasons for considering ESG criteria in the investment
process. The top three reasons for considering ESG criteria are to minimize risk, client or beneficiary
demand, and to improve returns over time. The other reasons are listed in the table below.
To better understand the characteristics of our survey respondents, we asked them to report which
investor networks or organizations they are part of. The top three investor organizations are the
Principles for Responsible Investment, CDP, and the Responsible Investment Association. Others
are listed in the table below.
Reasons for Considering ESG Criteria
Rank # Respondents Reason
1 48 Minimize Risk Over Time
2 47 Client / Beneficiary Demand
3 44 Improve Returns Over Time
4 42 Fulfill Mission or Values
5 39 Social / Environmental Impact
6 37 Fiduciary Duty
7 12 Legislative / Regulatory Requirements
N=65
Investor Networks / Organizations
Rank # Respondents Network
1 46 Principles for Responsible Investment
2 27 CDP
3 20 Responsible Investment Association
4 19 Canadian Coalition for Good Governance
5 13 International Corporate Governance Network
6 4 Investor Network on Climate Risk
7 3 Global Impact Investing Network
N=65
Moderate
Low
Flat
High
Negative
26
2015 CANADIAN RESPONSIBLE INVESTMENT TRENDS REPORT
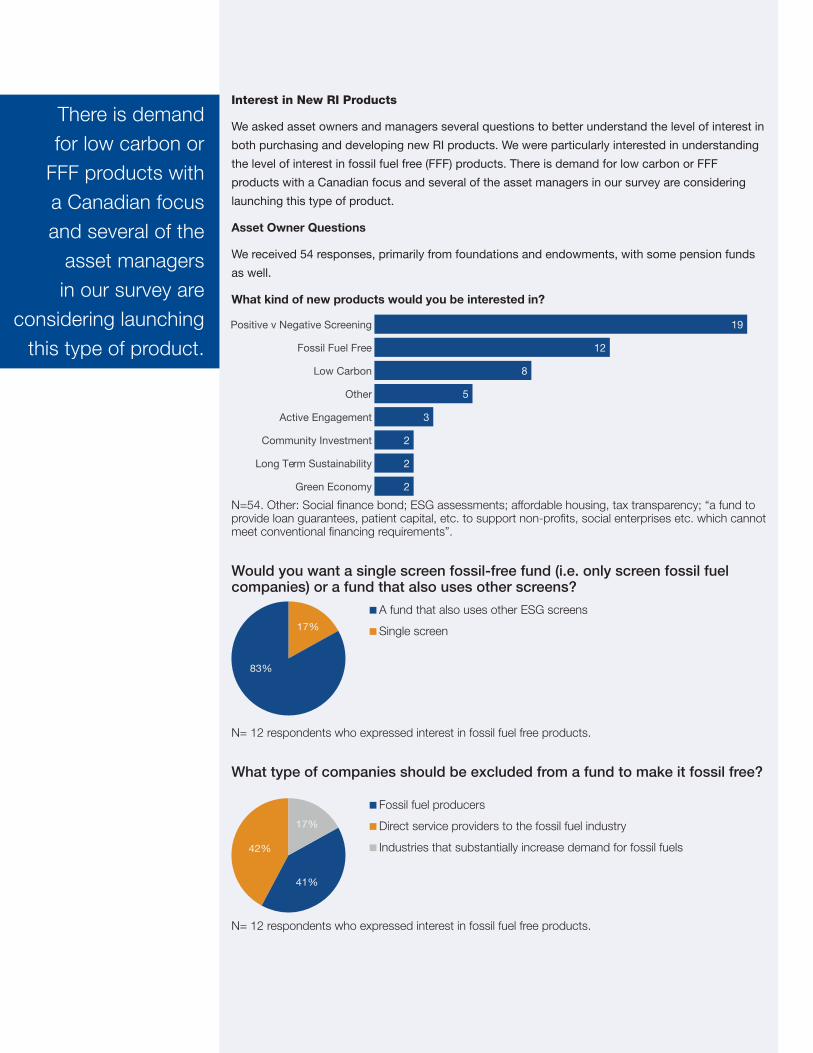
Interest in New RI Products
We asked asset owners and managers several questions to better understand the level of interest in
both purchasing and developing new RI products. We were particularly interested in understanding
the level of interest in fossil fuel free (FFF) products. There is demand for low carbon or FFF
products with a Canadian focus and several of the asset managers in our survey are considering
launching this type of product.
Asset Owner Questions
We received 54 responses, primarily from foundations and endowments, with some pension funds
as well.
What kind of new products would you be interested in?
Positive v Negative Screening
Fossil Fuel Free
Low Carbon
Other
Active Engagement
Community Investment
Long Term Sustainability
Green Economy
19
12
8
5
3
2
2
2
N=54. Other: Social finance bond; ESG assessments; affordable housing, tax transparency; “a fund to provide loan guarantees, patient capital, etc. to support non-profits, social enterprises etc. which cannot meet conventional financing requirements”.
Would you want a single screen fossil-free fund (i.e. only screen fossil fuel companies) or a fund that also uses other screens?
17%
83%
N= 12 respondents who expressed interest in fossil fuel free products.
What type of companies should be excluded from a fund to make it fossil free?
17%
42%
41%
N= 12 respondents who expressed interest in fossil fuel free products.
A fund that also uses other ESG screens
Single screen
Fossil fuel producers
Direct service providers to the fossil fuel industry
Industries that substantially increase demand for fossil fuels
There is demand for low carbon or
FFF products with a Canadian focus and several of the
asset managers in our survey are
considering launching this type of product.
27
2015 CANADIAN RESPONSIBLE INVESTMENT TRENDS REPORT
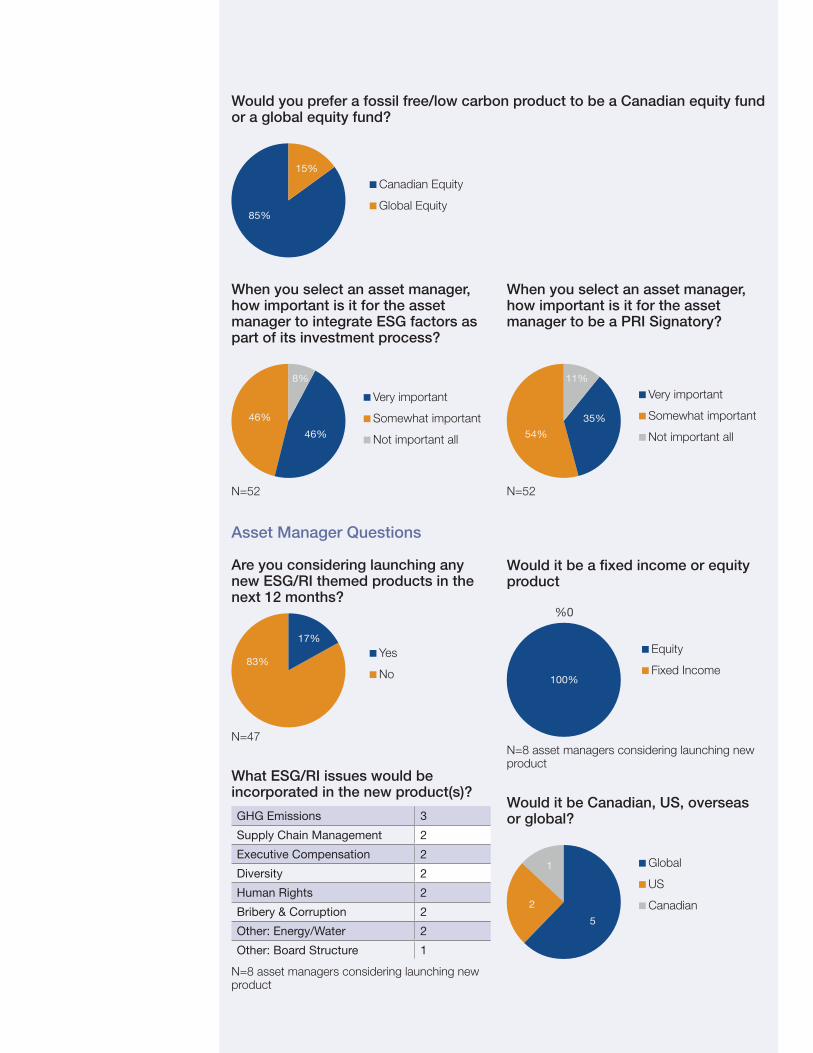
Asset Manager Questions
Are you considering launching any new ESG/RI themed products in the next 12 months?
83%
17%
N=47
What ESG/RI issues would be incorporated in the new product(s)?
GHG Emissions 3
Supply Chain Management 2
Executive Compensation 2
Diversity 2
Human Rights 2
Bribery & Corruption 2
Other: Energy/Water 2
Other: Board Structure 1
N=8 asset managers considering launching new product
Would it be a fixed income or equity product
100%
%0
N=8 asset managers considering launching new product
Would it be Canadian, US, overseas or global?
1
2
5
Would you prefer a fossil free/low carbon product to be a Canadian equity fund or a global equity fund?
15%
85%
Canadian Equity
Global Equity
Yes
No
Equity
Fixed Income
When you select an asset manager, how important is it for the asset manager to integrate ESG factors as part of its investment process?
46%
46%
8%
N=52
When you select an asset manager, how important is it for the asset manager to be a PRI Signatory?
54%
11%
35%
N=52
Very important
Somewhat important
Not important all
Very important
Somewhat important
Not important all
Global
US
Canadian
28
2015 CANADIAN RESPONSIBLE INVESTMENT TRENDS REPORT
IN FOCUS: IMPACT INVESTMENTImpact investment is a small yet dynamic segment of responsible investing in Canada and beyond.
Impact investments are “investments made into companies, organizations, and funds with the
intention to generate a measurable, beneficial social and environmental impact alongside a financial
return. Impact investments can be made in both emerging and developed markets, and target a
range of returns from below-market to above-market rates, depending upon the circumstances.”9
Impact investments are typically, but not always made in private markets, and aim to resolve social
and/or environmental challenges. Impact investing includes community investing, where capital is
directed to traditionally underserved individuals or communities, and financing that is provided to
businesses with a clear social or environmental purpose.
This is the RIA’s first year conducting an in-depth study of the characteristics of the impact
investment industry. Although impact investing was included in our 2012 report, the language has
evolved towards more standardized definitions and classifications since then. In this report, we have
aimed to align our methodology and definition of impact investing with the Global Impact Investing
Network, the MaRS Centre for Impact Investing, Purpose Capital, and our international partners in
the Global Sustainable Investment Alliance. As a result, the current data featured in this report is
not necessarily comparable with the impact investment data in our 2012 report. The downside is
that we have limited ability to show year over year impact investing trends; yet the upside is that our
impact investment data is comparable to national and global data from 2012 onward.
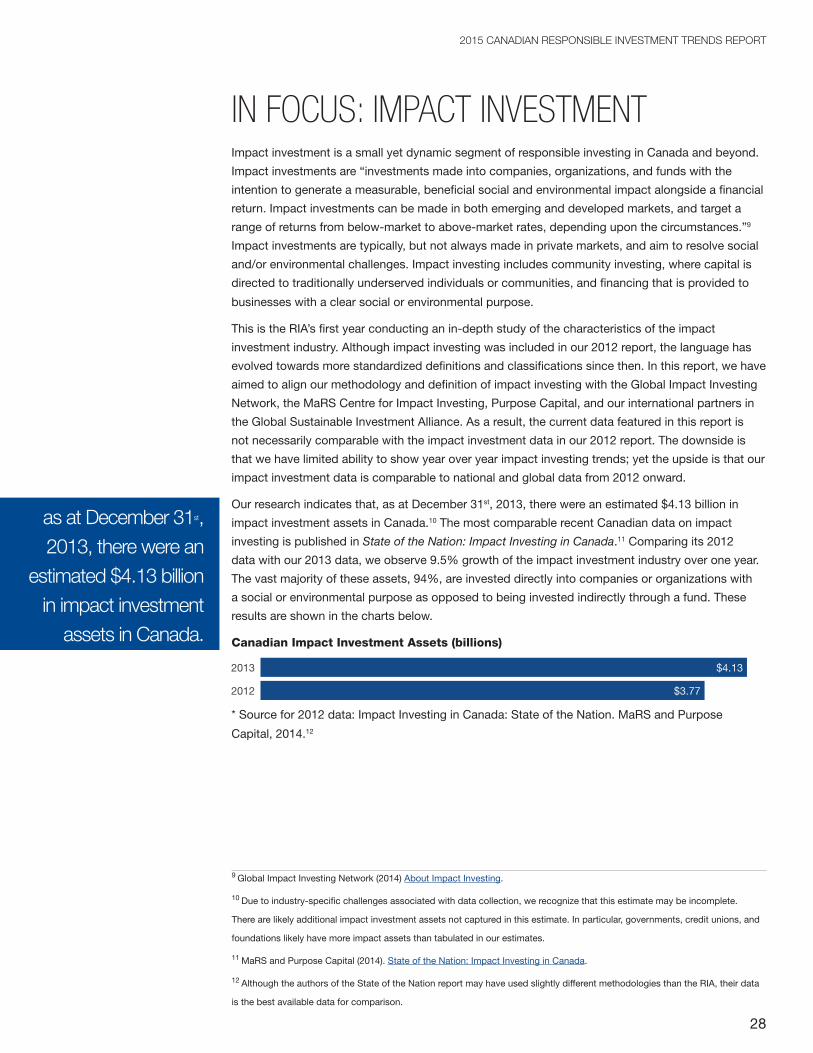
Our research indicates that, as at December 31st, 2013, there were an estimated $4.13 billion in
impact investment assets in Canada.10 The most comparable recent Canadian data on impact
investing is published in State of the Nation: Impact Investing in Canada.11 Comparing its 2012
data with our 2013 data, we observe 9.5% growth of the impact investment industry over one year.
The vast majority of these assets, 94%, are invested directly into companies or organizations with
a social or environmental purpose as opposed to being invested indirectly through a fund. These
results are shown in the charts below.
Canadian Impact Investment Assets (billions)
2013
2012
$4.13
$3.77
* Source for 2012 data: Impact Investing in Canada: State of the Nation. MaRS and Purpose
Capital, 2014.12
9 Global Impact Investing Network (2014) About Impact Investing.
10 Due to industry-specific challenges associated with data collection, we recognize that this estimate may be incomplete.
There are likely additional impact investment assets not captured in this estimate. In particular, governments, credit unions, and
foundations likely have more impact assets than tabulated in our estimates.
11 MaRS and Purpose Capital (2014). State of the Nation: Impact Investing in Canada.
12 Although the authors of the State of the Nation report may have used slightly different methodologies than the RIA, their data
is the best available data for comparison.
as at December 31st, 2013, there were an
estimated $4.13 billion in impact investment
assets in Canada.

29
2015 CANADIAN RESPONSIBLE INVESTMENT TRENDS REPORT
Direct vs. Indirect Impact Investments
94%
6%
Direct
Indirect
A diverse range of Canadian organizations practice impact investing. Québec’s solidarity finance
sector is the largest organizational category by assets with $1.16 billion, or 28% of the Canadian total.
Development finance is the second largest organizational category by assets with $955.6 million, 95%
of which are Québec development capital assets allocated to venture capital for local community
development. The third largest organizational category is credit unions, which account for $698.2
million or 17% of the total. The other categories and corresponding totals are shown in the table below.
Impact Investment Assets in CanadaBy Organization Type
Organization Type Direct Indirect Total
Community Finance Organizations
Aboriginal Financial Institutions
$323,858,974 $0 $323,858,974
Community Loan Funds
$29,990,900 $15,380,000 $45,370,900
Foundations $8,810,000 $16,790,000 $25,600,000
Community Futures / CBDCs
$279,252,549 $0 $279,252,549
Quebec Solidarity Finance
$1,162,900,000 $0 $1,162,900,000
Credit Unions $697,600,000 $560,000 $698,160,000
Impact Investment Funds/Managers
$262,696,500 $199,483,500 $462,180,000
Development Finance $955,260,000 $300,000 $955,560,000
Non-profits $22,900,000 $300,000 $23,200,000
Cooperatives $100,605,000 $1,515,000 $102,120,000
Other $51,436,250 $93,750 $51,530,000
TOTAL $3,895,310,173 $234,422,250 $4,129,732,423
See footnotes for sources13 and methodological comments.14
13 Data was collected through primary and secondary research. Secondary sources include: Mendell et al., (2014) Socially
Responsible Finance in Quebec; Community Futures Network of Canada; and National Aboriginal Capital Corporations
Association.
14 There are likely additional impact investment assets not captured in these estimates. In particular, governments, credit unions,
and foundations likely have more impact assets than tabulated here. We were, however, unable to obtain comprehensive first or
second party data for these categories.

30
2015 CANADIAN RESPONSIBLE INVESTMENT TRENDS REPORT
Impact Investment Assets by Province/Territory (millions)Québec is the Canadian leader on impact investing by total assets, comprising a sizeable 54.8%
of all Canadian impact investment assets. Note that the data presented below is based on office
location of survey respondents, which usually, but not always indicates geographic allocation of
impact capital.
Province / Territory Assets
Quebec $2,263.50
British Columbia $658.30
Ontario $438.00
Saskatchewan $191.70
Manitoba $168.90
Northwest Territories $101.30
Nunavut $91.80
Nova Scotia $80.90
Alberta $77.20
New Brunswick $22.50
Newfoundland and Labrador $14.30
Yukon $11.70
Prince Edward Island $4.10
N/A $5.60
Total $4,129.80
Asset Allocation
47%48%
%3%1 %1
%0
Private debt
Private equity / VC
Public debt
Public equity
Term deposits
OtherAsset allocation data was unavailable, or could not be accurately estimated, for Community Loan Funds and Quebec Solidarity Finance. Due to these data limitations, above estimates are based on 70% of total impact investment assets.
Impact investment asset allocation is shown in the pie chart above. Our data shows an almost even
split between private debt and private equity/venture capital asset classes, with 48% and 47%
respectively. There is one notable divergence between our asset allocation data and the data found
in the State of the Nation report: our participants indicated a much lower allocation to the public
debt class. This divergence is possibly due to different sample characteristics, and our lack of
comprehensive first or second party data for credit unions, governments, and foundations.
Québec is the Canadian leader on impact investing by
total assets, comprising a sizeable 54.8% of all Canadian impact investment assets.

31
2015 CANADIAN RESPONSIBLE INVESTMENT TRENDS REPORT
Sector Allocation
8%
10%
12%
15%
43%
%4
%2%2 %3 %1
Nonprofits / Social Enterprise
Aboriginal Business
Community Development*
Energy
Housing / Real Estate
Food / Agriculture
Microfinance
Healthcare
Other
Info & Communication Tech.
Due to data constraints, sector allocation identified above is an estimate based on 78% of reported impact investment assets. Therefore this estimate represents a large sample of the assets, yet it is nonetheless an approximate estimate based on the best available information.
** Community development = non-specified community investment including local small business, etc.
The chart above provides an estimate of Canadian impact investment assets by sector allocation.
Canadian impact investment capital is placed across numerous sectors, 9 of which are identified
above. The top sector is the nonprofit/social enterprise sector, with 43% of all Canadian impact
investment assets. This number is particularly large due to Québec’s robust and established
social economy. Québec’s ‘solidarity finance’ sector is “made up of those institutions that invest
exclusively in cooperatives, NPOs and associations that have socioeconomic objectives.”15
Québec’s solidarity finance accounted for $1.16 billion alone.
The second largest sector receiving impact investment capital is the Aboriginal business sector,
receiving 15% of impact investment assets. Organizations allocating capital to this category
include Aboriginal Financial Institutions, credit unions and development finance funds. Community
development is the third largest sector, receiving 12% of impact investment capital. Community
development includes community-focused debt and equity financing for local initiatives, small
businesses, and traditionally underserved social groups.16 The remaining sectors receiving impact
capital are shown in the chart above. The “other” category includes education, water and sanitation,
and financial services excluding microfinance.
In what sectors do you plan to increase your exposure?
6%
9%
11%13%
12%
14%
16%8%
%6
%5
Housing
Food & agriculture
Social enterprise / nonprofits
Energy
Healthcare
Education
Info & Communication Tech.
Financial
Microfinance
Other
N=48 respondents provided 80 responses.
Other: Water & sanitation, arts and crafts, exporting companies, water & sanitation, environment, waste management, employment
15 Mendell et al., (2014). Socially Responsible Finance in Quebec: 2013 Overview CAP Finance, Karl Polanyi Institute of Political
Economy, Institut de recherche en économie contemporaine.
16 Excluding Aboriginal business, which is large enough to compose its own category.
32
2015 CANADIAN RESPONSIBLE INVESTMENT TRENDS REPORT
We asked survey respondents to indicate the sector(s) to which they plan to increase their
exposure. The top responses were housing with 16%, food and agriculture with 14%, social
enterprise/ nonprofits with 13%, and healthcare with 11% of respondents.
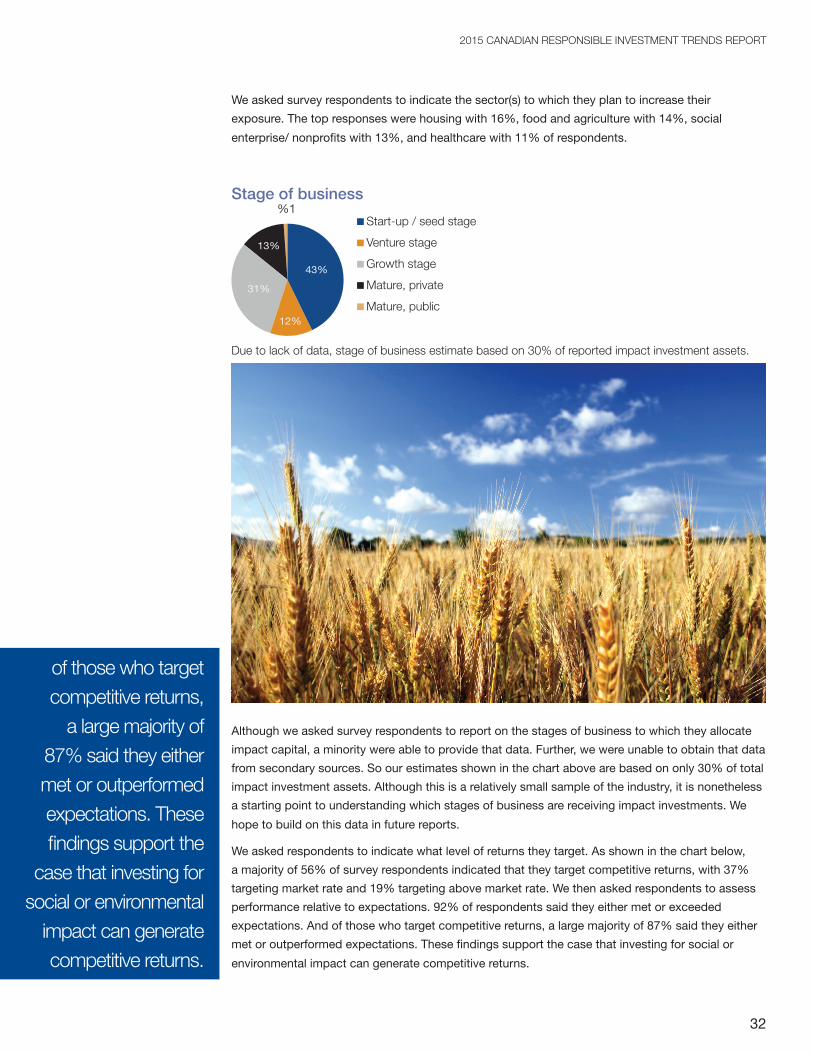
Stage of business
31%
13%
43%
12%
%1
Start-up / seed stage
Venture stage
Growth stage
Mature, private
Mature, public
Due to lack of data, stage of business estimate based on 30% of reported impact investment assets.
Although we asked survey respondents to report on the stages of business to which they allocate
impact capital, a minority were able to provide that data. Further, we were unable to obtain that data
from secondary sources. So our estimates shown in the chart above are based on only 30% of total
impact investment assets. Although this is a relatively small sample of the industry, it is nonetheless
a starting point to understanding which stages of business are receiving impact investments. We
hope to build on this data in future reports.
We asked respondents to indicate what level of returns they target. As shown in the chart below,
a majority of 56% of survey respondents indicated that they target competitive returns, with 37%
targeting market rate and 19% targeting above market rate. We then asked respondents to assess
performance relative to expectations. 92% of respondents said they either met or exceeded
expectations. And of those who target competitive returns, a large majority of 87% said they either
met or outperformed expectations. These findings support the case that investing for social or
environmental impact can generate competitive returns.
of those who target competitive returns,
a large majority of 87% said they either met or outperformed expectations. These findings support the
case that investing for social or environmental
impact can generate competitive returns.

33
2015 CANADIAN RESPONSIBLE INVESTMENT TRENDS REPORT
What level of returns do you target?
37%
17%
27%
19%
Below market rate: closer to capital preservation
Below market rate: closer to market rate
Competitive, market rate returns
Competitive, above market rate returns
N=63
In 2013, how was performance relative to your expectations?
68%
24%
8%
Underperformed expectations
Met expectations
Outperformed expectations
N=63
Contributors of risk to impact investment portfoliosRank Score
1 153 Business model & management risk
2 78 Market demand & competition risk
3 67 Financing risk
4 53 Liquidity & exit risk
5 18 Reputational risk
6 14 Macroeconomic risk
7 5 Currency / country risk
N=65. Scoring methodology in footnotes.17
Survey respondents identified business model and management risk as the top contributor of risk
to impact investment portfolios. Market demand and competition risk were the second lrgest risk
factor, while financing risk was third. The other risk factors are shown in the table above.
Only 11% of respondents said they encountered significant risk events in 2013. These risk events
are listed in the table below. Again, business model and management risk is the top response.
17 Methodology for ranked questions: In a number of cases, we asked respondents to rank their top three choices. For those
questions, scores were calculated as follows: (number of respondents that ranked it first × 3) + (number of respondents that
ranked it second × 2) + (number of respondents that ranked it third × 1).
Only 11% of respondents said they
encountered significant risk events in 2013.
34
2015 CANADIAN RESPONSIBLE INVESTMENT TRENDS REPORT
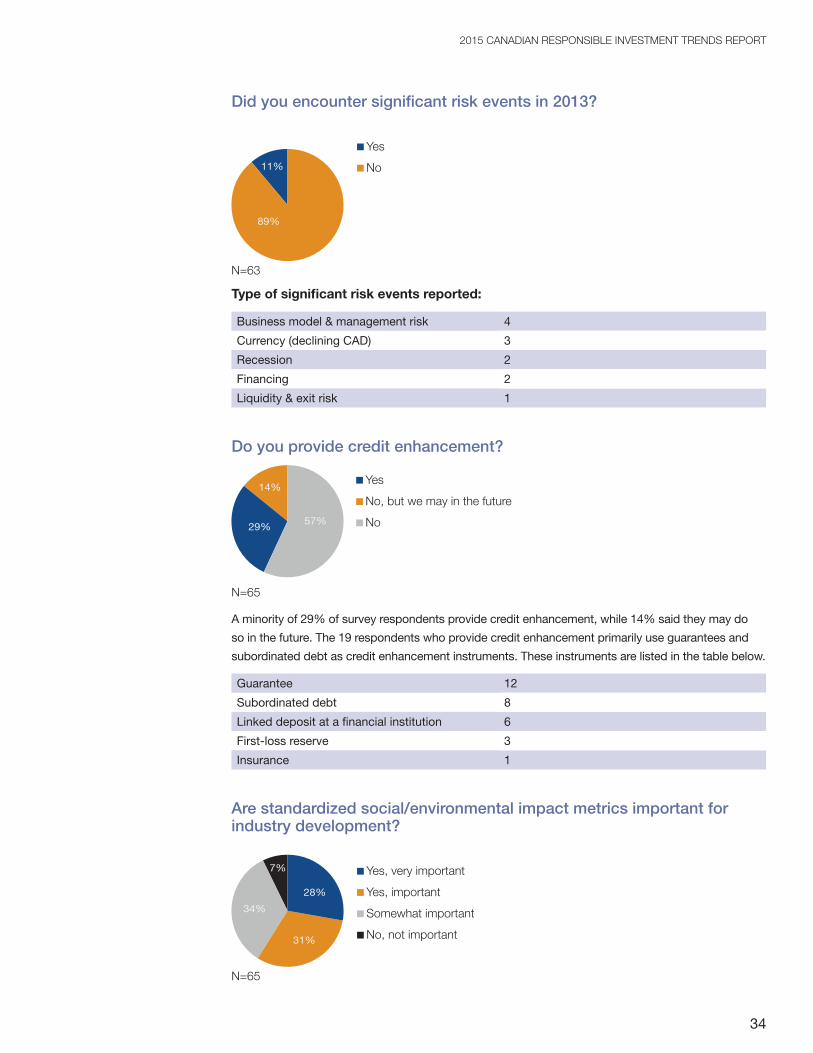
Did you encounter significant risk events in 2013?
11%
89%
Yes
No
N=63
Type of significant risk events reported:
Business model & management risk 4
Currency (declining CAD) 3
Recession 2
Financing 2
Liquidity & exit risk 1
Do you provide credit enhancement?
29%
14%
57%
Yes
No, but we may in the future
No
N=65
A minority of 29% of survey respondents provide credit enhancement, while 14% said they may do
so in the future. The 19 respondents who provide credit enhancement primarily use guarantees and
subordinated debt as credit enhancement instruments. These instruments are listed in the table below.
Guarantee 12
Subordinated debt 8
Linked deposit at a financial institution 6
First-loss reserve 3
Insurance 1
Are standardized social/environmental impact metrics important for industry development?
34%
7%
28%
31%
Yes, very important
Yes, important
Somewhat important
No, not important
N=65
35
2015 CANADIAN RESPONSIBLE INVESTMENT TRENDS REPORT
A majority of respondents, 59%, said that standardized social/environmental impact metrics are
important for industry development, with 28% saying standardized metrics are “very important.”
Nonetheless, the tables below show that relatively few respondents said they use standardized
impact metrics or impact ratings/certifications. An area for further research would be to examine
why so few impact investment organizations are using these types of metrics.
Do you use disclosure metrics to measure social/ environmental impact?
Yes, but our metrics are not aligned with external standards
20
No, but we are considering doing so in the future
20
No 17
Yes, IRIS 4
Yes, other standardized metric 4
Yes, GRI 2
Yes, SROI 1
N=70. Other: NRCan, proprietary ESG score.
Do you use 3rd party ratings and/or certifications to guide your investments?
No 43
No, but we are considering it 15
Yes, GIIRS 5
Yes, other 3
Yes, B-Corp Certification 1
N=66. Other: Planet Rating, MicroFinanza, MicroRate, NRCan.
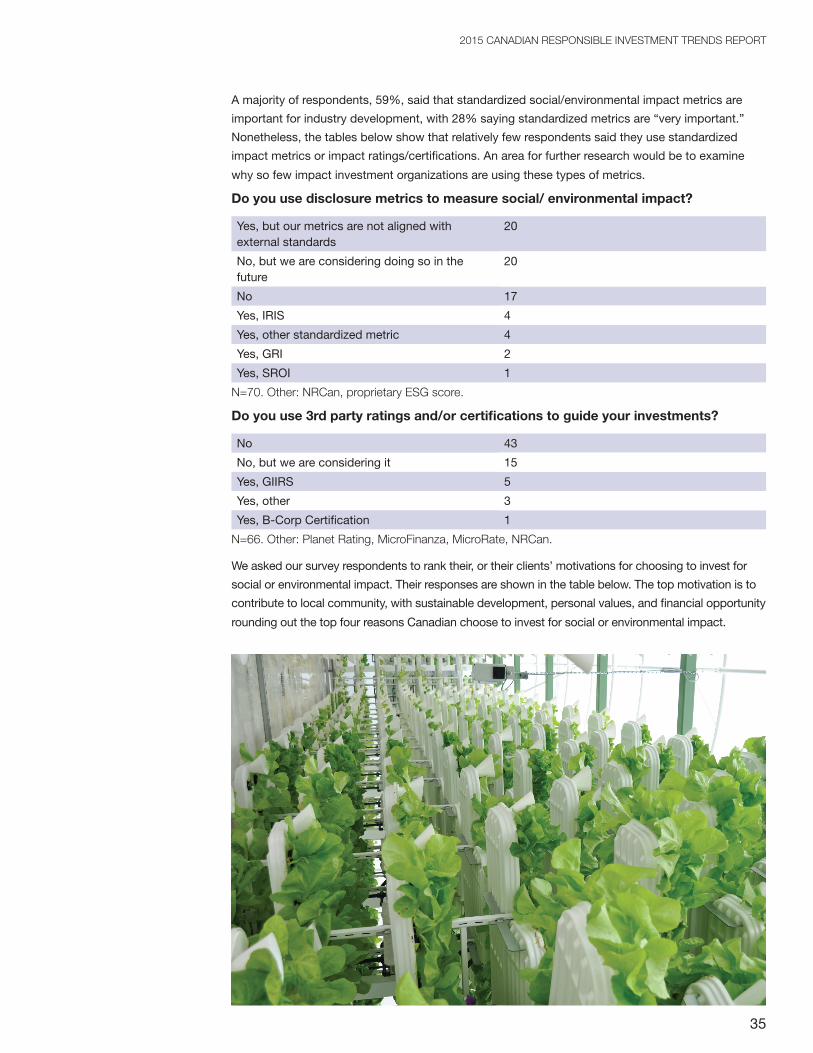
We asked our survey respondents to rank their, or their clients’ motivations for choosing to invest for
social or environmental impact. Their responses are shown in the table below. The top motivation is to
contribute to local community, with sustainable development, personal values, and financial opportunity
rounding out the top four reasons Canadian choose to invest for social or environmental impact.

36
2015 CANADIAN RESPONSIBLE INVESTMENT TRENDS REPORT
What motivates you or your investors to invest for social/environmental impact?
Rank Score
1 126 Contribute to local community
2 88 Contribute to sustainable development
3 47 Personal values/mission
4 46 Financial opportunity
5 19 Looking for stable long-term return
6 19 Responsibility to client/fiduciary duty
7 14 Alternative to philanthropy
8 13 Risk management
9 7 Generational transfer of wealth
10 3 Other: Increase empowerment among disadvantaged populations
10 3 Other: Global solidarity
10 3 Other: International Co-operative Alliance Co-operative Principles
10 3 Other: Build the worker coop sector
11 2 Other: Building financial capacity of nonprofits/social enterprises
11 2 Other: Job creation
12 1 Other: Enhancing Aboriginal participation in the economy
N=65. Italicized rows are write-ins.
To better understand the discouraging factors in the market, we asked survey participants what
factors prevent investors from demanding more impact investments. The top three discouraging
factors are risk concerns, lack of viable products/options, and performance concerns. Yet our
survey data also indicates that 92% of respondents either met or outperformed expectations in
2013. And of those who target competitive returns, 87% said they either met or outperformed
expectations. So performance concerns may be overstated. Lack of qualified advice or expertise
also placed near the top of the ranking.
What prevents you or your investors from demanding more impact investments?
Rank Score
1 95 Risk concerns
2 89 Lack of viable products/options
3 83 Performance concerns
4 40 Lack of qualified advice/expertise
6 12 Mistrust/concerns about greenwashing
7 6 Other: Lack of interest/demand
8 5 Other: Government restrictions
9 3 Other: Small size of each investment
9 3 Other: Lack of access to patient capital
9 3 Other: Lack of awareness
10 2 Other: Lack of liquidity
11 1 Other: Non-market based investing isn’t viable/sustainable
N=67. Italicized rows are write-ins.

37
2015 CANADIAN RESPONSIBLE INVESTMENT TRENDS REPORT
As shown in the table below, survey respondents indicated a shortage of high quality investment
opportunities and lack of appropriate capital across the risk/return spectrum as the top barriers
to growth of impact investing in Canada. Lack of innovative deal/fund structures and inadequate
impact measurement also placed near the top of the list.
What are the top barriers to growth of impact investing in Canada?Rank Score
1 100 Shortage of high quality investment opportunities
2 85 Lack of appropriate capital across the risk/return spectrum
3 45 Lack of innovative deal/fund structures to accommodate investors’ /companies’ needs
4 42 Inadequate measurement of social/environmental impact
5 27 Lack of investment professionals with relevant expertise
6 26 Lack of data on products/performance
7 17 Difficulty exiting investments
8 8 “Business as usual” thinking / resistance from mainstream investors
9 3 Lack of support from financial institutions
9 3 Loan funding shortages
10 2 Difficulty accessing investment due to the lack of liquidity of CEDIF funds. No secondary markets
10 2 Competition in the current market
10 2 Lack of viable business models & management expertise
10 2 Over reliance on government funding for us as Not For Profit
10 2 Lack of specific short term strategic/financial benefit to investors
10 2 Lack of awareness on impact investing opportunities
10 2 Need more funds to lend out
11 1 Lack of patient capital
N=67. Italicized rows are write-ins.
To counteract the barriers to growth identified above, survey respondents identified numerous
mechanisms that could drive growth of impact investing in Canada. These mechanisms are shown
in the table below. The top mechanisms identified are more persuasive evidence to support the
business case for impact investment, and greater awareness of impact investing opportunities.
Public policy changes in favour of hybrids and social enterprises, better expertise among
investment professionals, and easier access to high impact opportunities also scored highly.

38
2015 CANADIAN RESPONSIBLE INVESTMENT TRENDS REPORT
What are the top mechanisms that could drive growth of impact investing in Canada? In other words, what would make you or your clients more likely to invest for social/environmental impact?
Rank Score
1 102 More persuasive evidence to support the business case
2 93 Greater awareness of impact investing opportunities
3 52 Public policy changes in favour of hybrids and social enterprise
4 47 Better expertise on impact investing among investment advisors/professionals
5 41 Easier access to high impact investment opportunities
6 11 Greater adoption of standardized social/environmental reporting guidelines (such as IRIS or GRI)
7 8 Increased supply of social impact bonds or other bond-like instruments
8 3 More viable business models & greater management expertise
8 3 Increase the number of market intermediaries fund between private capital end social economy
8 3 More investment opportunities
9 2 Financial literacy seeking impact investments
10 1 Greater adoption of 3rd-party ratings and/or certification (such as GIIRS or B-Corps)
10 1 Local intermediation options
10 1 Increased supply of patient capital and other bonds
10 1 Appropriate tools to assess, mitigate and manage risk
N=67
Looking to the future, we asked each respondent to identify the level of investment growth they
anticipate in the next two years. A majority of 61% was optimistic about the growth of impact
investing, saying that they expect either moderate or high levels of growth. A minority of 24% was
less optimistic, anticipating low growth, while 15% expected flat growth. No one indicated that they
anticipate a contraction.
What level of investment growth are you anticipating in the next 2 years?
46%
24%
15%
15%
%0
Moderate growth
Low growth
High growth
Flat
Negative growth
N=66
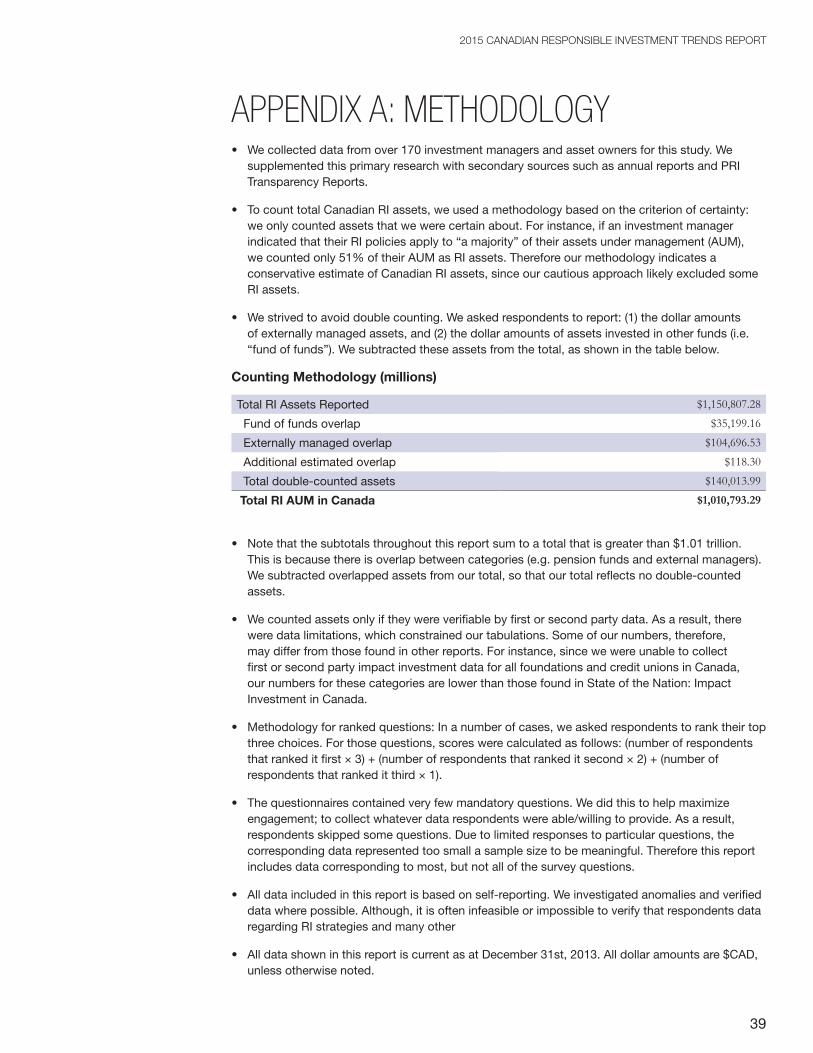
39
2015 CANADIAN RESPONSIBLE INVESTMENT TRENDS REPORT
APPENDIX A: METHODOLOGY• We collected data from over 170 investment managers and asset owners for this study. We
supplemented this primary research with secondary sources such as annual reports and PRI Transparency Reports.
• To count total Canadian RI assets, we used a methodology based on the criterion of certainty: we only counted assets that we were certain about. For instance, if an investment manager indicated that their RI policies apply to “a majority” of their assets under management (AUM), we counted only 51% of their AUM as RI assets. Therefore our methodology indicates a conservative estimate of Canadian RI assets, since our cautious approach likely excluded some RI assets.
• We strived to avoid double counting. We asked respondents to report: (1) the dollar amounts of externally managed assets, and (2) the dollar amounts of assets invested in other funds (i.e. “fund of funds”). We subtracted these assets from the total, as shown in the table below.
Counting Methodology (millions)
Total RI Assets Reported $1,150,807.28
Fund of funds overlap $35,199.16
Externally managed overlap $104,696.53
Additional estimated overlap $118.30
Total double-counted assets $140,013.99
Total RI AUM in Canada $1,010,793.29
• Note that the subtotals throughout this report sum to a total that is greater than $1.01 trillion. This is because there is overlap between categories (e.g. pension funds and external managers). We subtracted overlapped assets from our total, so that our total reflects no double-counted assets.
• We counted assets only if they were verifiable by first or second party data. As a result, there were data limitations, which constrained our tabulations. Some of our numbers, therefore, may differ from those found in other reports. For instance, since we were unable to collect first or second party impact investment data for all foundations and credit unions in Canada, our numbers for these categories are lower than those found in State of the Nation: Impact Investment in Canada.
• Methodology for ranked questions: In a number of cases, we asked respondents to rank their top three choices. For those questions, scores were calculated as follows: (number of respondents that ranked it first × 3) + (number of respondents that ranked it second × 2) + (number of respondents that ranked it third × 1).
• The questionnaires contained very few mandatory questions. We did this to help maximize engagement; to collect whatever data respondents were able/willing to provide. As a result, respondents skipped some questions. Due to limited responses to particular questions, the corresponding data represented too small a sample size to be meaningful. Therefore this report includes data corresponding to most, but not all of the survey questions.
• All data included in this report is based on self-reporting. We investigated anomalies and verified data where possible. Although, it is often infeasible or impossible to verify that respondents data regarding RI strategies and many other
• All data shown in this report is current as at December 31st, 2013. All dollar amounts are $CAD, unless otherwise noted.
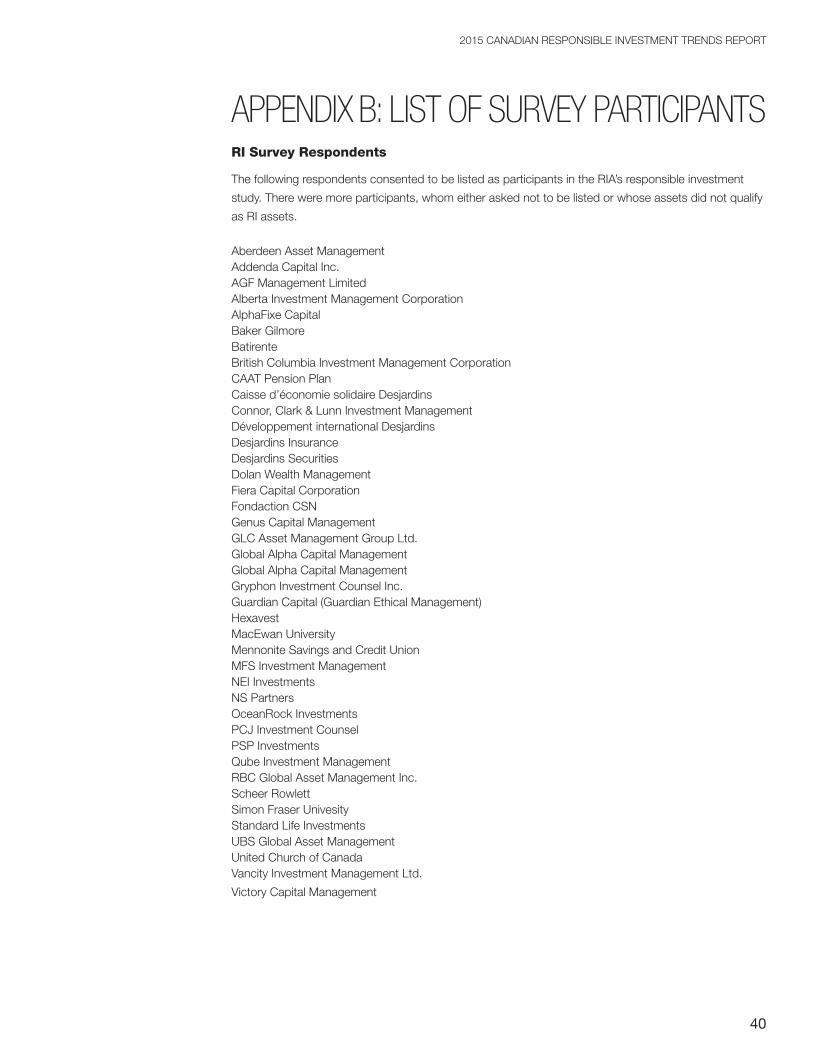
40
2015 CANADIAN RESPONSIBLE INVESTMENT TRENDS REPORT
APPENDIX B: LIST OF SURVEY PARTICIPANTSRI Survey Respondents
The following respondents consented to be listed as participants in the RIA’s responsible investment
study. There were more participants, whom either asked not to be listed or whose assets did not qualify
as RI assets.
Aberdeen Asset ManagementAddenda Capital Inc.AGF Management LimitedAlberta Investment Management CorporationAlphaFixe CapitalBaker GilmoreBatirenteBritish Columbia Investment Management CorporationCAAT Pension PlanCaisse d’économie solidaire Desjardins Connor, Clark & Lunn Investment ManagementDéveloppement international DesjardinsDesjardins InsuranceDesjardins SecuritiesDolan Wealth ManagementFiera Capital CorporationFondaction CSNGenus Capital ManagementGLC Asset Management Group Ltd.Global Alpha Capital ManagementGlobal Alpha Capital ManagementGryphon Investment Counsel Inc.Guardian Capital (Guardian Ethical Management)HexavestMacEwan UniversityMennonite Savings and Credit UnionMFS Investment ManagementNEI Investments NS PartnersOceanRock InvestmentsPCJ Investment CounselPSP InvestmentsQube Investment ManagementRBC Global Asset Management Inc. Scheer RowlettSimon Fraser UnivesityStandard Life InvestmentsUBS Global Asset ManagementUnited Church of CanadaVancity Investment Management Ltd.
Victory Capital Management

41
2015 CANADIAN RESPONSIBLE INVESTMENT TRENDS REPORT
Impact Investment Survey Respondents
The following respondents consented to be listed as participants in the RIA’s impact investment study:Access Community Capital Fund
ACEM, Financement communautaire responsableAffinity Credit UnionAffirmative VenturesAlberta Women EntrepreneursAlterna SavingsAssiniboine Credit Union BC Co-operative AssociationBlack Business Community Investment Fund LtdCanadian Worker Co-operative FederationCAPE Fund ManagementCCEC Credit UnionChantier de l’économie sociale TrustChebucto Pockwock Lake Wind Field LimitedChebucto Terence Bay Wind Field LimitedCommunity Forward Fund Assistance CorpCommunity Foundation of Greater PeterboroughCommunity Foundation of OttawaCommunity Micro Lending SocietyDéveloppement international Desjardins (DID) Deh Cho BDCE-FundFuturpreneur Canada (CYBF)Gestion FONIDI inc.Hamilton Community FoundationInvesteco Capital Corp.Leeat WeinstockMcConnell FoundationMennonite Savings and Credit UnionNorthwest Territories Business Development and Investment CorporationNS Co-operative CouncilNunavut Business Credit CorporationNunavut Development CorporationOikocredit CanadaPique Venture Management Inc.Réseau d’investissement social du Québec (RISQ) Réseau Québécois du Crédit CommunautaireRenewal FundsRoyal Bank of CanadaRoyal Investment Cooperative Ltd.Sarona Asset ManagementSocial Enterprise FundToronto Atmospheric FundTale’awtxw Aboriginal Capital CorporationTecumseh Community Development CorporationThe Calgary FoundationThe Jubilee Fund IncTwo Rivers Community Development CentreWomen Entrepreneurs of Saskatchewan Inc.Women’s Enterprise CentreWomen’s Enterprise Centre of Manitoba
Youth Social Innovation Capital Fund
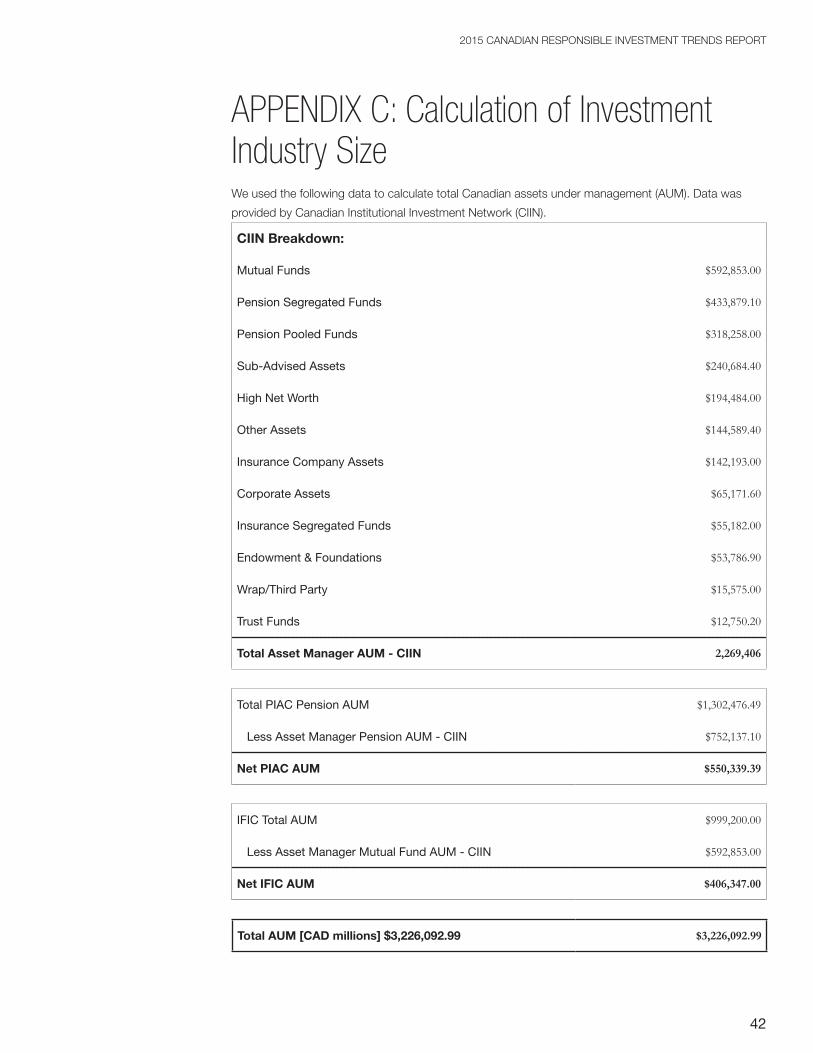
42
2015 CANADIAN RESPONSIBLE INVESTMENT TRENDS REPORT
APPENDIX C: Calculation of Investment Industry SizeWe used the following data to calculate total Canadian assets under management (AUM). Data was
provided by Canadian Institutional Investment Network (CIIN).
CIIN Breakdown:
Mutual Funds $592,853.00
Pension Segregated Funds $433,879.10
Pension Pooled Funds $318,258.00
Sub-Advised Assets $240,684.40
High Net Worth $194,484.00
Other Assets $144,589.40
Insurance Company Assets $142,193.00
Corporate Assets $65,171.60
Insurance Segregated Funds $55,182.00
Endowment & Foundations $53,786.90
Wrap/Third Party $15,575.00
Trust Funds $12,750.20
Total Asset Manager AUM - CIIN 2,269,406
Total PIAC Pension AUM $1,302,476.49
Less Asset Manager Pension AUM - CIIN $752,137.10
Net PIAC AUM $550,339.39
IFIC Total AUM $999,200.00
Less Asset Manager Mutual Fund AUM - CIIN $592,853.00
Net IFIC AUM $406,347.00
Total AUM [CAD millions] $3,226,092.99 $3,226,092.99