responses of biomass growth and grain yield of midseason rice to the anticipated warming with fati...
TRANSCRIPT

Journal Identification = FIELD Article Identification = 5501 Date: July 1, 2011 Time: 11:18 am
Rw
Wa
b
a
ARRA
KGFMBGE
1
sttttImrifPspi
tA
0d
Field Crops Research 123 (2011) 259–265
Contents lists available at ScienceDirect
Field Crops Research
jou rn al h om epage: www.elsev ier .com/ locate / fc r
esponses of biomass growth and grain yield of midseason rice to the anticipatedarming with FATI facility in East China
enjun Donga, Jin Chena, Bin Zhanga, Yunlu Tiana, Weijian Zhanga,b,∗
Institute of Applied Ecology, Nanjing Agricultural University, Nanjing 210095, ChinaInstitute of Crop Sciences, Chinese Academy of Agricultural Sciences/Key Laboratory of Crop Physiology, Ecology & Production, Ministry of Agriculture, Beijing 100081, China
r t i c l e i n f o
rticle history:eceived 22 February 2011eceived in revised form 27 May 2011ccepted 28 May 2011
eywords:lobal warmingree air temperature increaseidseason rice
iomass productionrain yield
a b s t r a c t
Crop model projections and historical data analyses have shown that global warming may cause seri-ous decrease in crop productivity, however, many uncertainities remain on the impact quantificationdue to the unclear understanding of actual crop response. Therefore, we performed a three-year fieldwarming experiment with free air temperature increase (FATI) facility to investigate the actual responseof midseason rice growth in East China. There were four treatments (AW: all-day warming; DW: day-time warming; NW: nighttime warming; CK: ambient control) with three replicates. This FATI facilitypresented a good simulation of the local air temperature pattern with an increase in the daily meantemperature of about 1.1–2.0 ◦C during rice whole growth duration compared to the ambient control.Warming shortened the pre-heading phase respectively by 3.3 d, 1.7 d and 2.0 d in the AW, DW and NWplots, while the post-heading phase stayed almost unchanged. During the three years, warming slightly
ast China decreased the aboveground biomass by an average of 9.1%, 10.3% and 3.3%, and the grain yield by anaverage of 0.9%, 6.4% and 6.1% in the AW, DW and NW plots, respectively. Warming tended to decreaserice photosynthesis rate and stimulate the nighttime respiration rate. It also enlarged the flag leaf areaand increased its chlorophyll content. No significant difference and interaction in the actual response ofrice growth were found between the warming regimes. The above evidences suggest that the expectedwarming less than 2.0 ◦C may not cause significant decrease in rice productivity in East China.
. Introduction
Global mean surface air temperature has increased about 0.74 ◦Cince 100 years ago, and will rise with about 1.1–6.4 ◦C by the end ofhis century (IPCC, 2007). The increase level of the daily maximumemperature was lower than that of the daily minimum tempera-ure, and the increasing trend of the former is expected smaller thanhe later (Karl et al., 1993; Easterling et al., 1997; Price et al., 1999;PCC, 2001; Lobell, 2007). This means that the climate may become
ore warming with a decreasing trend in the diurnal temperatureange (DTR) (IPCC, 2007). Meanwhile, an average annual increasen grain production of 44 million metric tons is required to meet theood demands of the world by 2050 (Tester and Langridge, 2010).revious reports showed that warming might decrease crop yield
ignificantly. For example, a predicted 2.0 ◦C increase in air tem-erature might lead to a 20–40% decrease in cereal yields, mostlyn Asia and Africa (Lele, 2010). However, since most previous quan-
∗ Corresponding author at: Institute of Crop Sciences, Chinese Academy of Agricul-ural Sciences/Key Laboratory of Crop Physiology, Ecology & Production, Ministry ofgriculture, Beijing 100081, China. Tel.: +86 010 62156856; fax: +86 010 62156856.
E-mail addresses: [email protected], [email protected] (W. Zhang).
378-4290/$ – see front matter © 2011 Elsevier B.V. All rights reserved.oi:10.1016/j.fcr.2011.05.024
© 2011 Elsevier B.V. All rights reserved.
titative evaluations of warming impacts were based on crop modelprojection (Tan and Shibasaki, 2003; Lin et al., 2005; Sheehy et al.,2006) and historical data analyses (Peng et al., 2004; You et al.,2009), great uncertainties remain due to the unclear understandingof the actual crop response (Tubiello et al., 2007). A better under-standing of the actual response of crop growth to global warmingwill significantly decrease the uncertainties of warming impactevaluation and projection.
In the past decades, a lot of experiments were performed toinvestigate the impacts of warming on rice (Oryza sativa L.) pro-ductivity (Aronson and McNulty, 2009; Mohammed and Tarpley,2009b). They have greatly enhanced our understanding of riceresponding to warming, and provided important references for theimprovement of crop modeling projection. However, most of themwere performed under controlled conditions, such as close green-houses (Jagadish et al., 2007) and open-top chambers (Ziska et al.,1997). These facilities are convenient to investigate crop responseat single plant or community scale, but not at crop system scalein situ (Aronson and McNulty, 2009). Meanwhile, previous warm-
ing experiments were mainly conducted at some key stages of cropgrowth (Cheng et al., 2009; Kanno et al., 2009), only a few wereperformed through the whole growth duration (Nijs et al., 1996;Wan et al., 2002; Kimball and Conley, 2009). Moreover, the tem-
Journal Identification = FIELD Article Identification = 5501 Date: July 1, 2011 Time: 11:18 am
2 s Research 123 (2011) 259–265
pw2getd(geow
tttrdCiibtrgc
2
2
ACimAtampa
2
dawpw77a1satep
aimt
05
101520253035
6-26 7-11 7-26 8-10 8-25 9-9 9-24 10 -9
Mon th-Day
Dai
ly m
ean
tem
pera
ture
(°C)
CK AWDW NW
60 W. Dong et al. / Field Crop
erature elevation levels performed in the previous experimentsere mostly higher than the projected warming level (Cheng et al.,
009). Since the above reasons, the impacts of warming on ricerowth might be over-estimated in the previous studies. A fieldxperiment across crop whole growth duration in situ is necessaryo learn the actual response to the anticipated warming. Nowa-ays, an ideal warming system with free air temperature increaseFATI) facility has been widely used to study plant response tolobal warming at the ecosystem scale (Wan et al., 2002; Kimballt al., 2008; Kimball and Conley, 2009). This facility gives us a greatpportunity to investigate the realistic response of rice growth toarming in situ.
Rice supports the staple food for more than 50% population ofhe world (Sass and Cicerone, 2002). Moreover, more than 90% ofhe world’s rice is produced and consumed in Asia where 60% ofhe global people live (Khush, 2005). East China is a major area ofice cropping in the world and has experienced a warming trenduring the past times. The average air temperature of 2000s in Easthina was approximately 1.5 ◦C and 0.7 ◦C higher than those dur-
ng the 1980s and 1990s, respectively. The mean air temperatures also expected to rise with an asymmetric trend of elevation leveletween at daytime and at nighttime. Therefore, we conducted ahree-year field experiment under FATI facility with three warmingegimes in East China since 2006. Our objectives were to investi-ate the realistic impacts of the anticipated warming and the DTRhanges on rice biomass growth and grain yield formation.
. Materials and methods
.1. Experimental site
The rice FATI system was set up in June 2006 at Jiangsucademy of Agricultural Science, Nanjing city, Jiangsu province,hina (32◦02′N, 118◦52′E, 11 m a.s.l.) on a brunisolic soil (a Alfisols
n USA-ST). The rice cropping system prevails in this region forore than 1000 years and is a typical cropping system even insia. Relevant soil properties were as follows: total N 2.52 g kg−1,
otal P 0.60 g kg−1, total K 14.0 g kg−1, available P 166.22 mg kg−1,vailable K 165.03 mg kg−1 and soil organic C 8.24 g kg−1. The cli-ate condition is northern subtropics monsoon with mean annual
recipitation being 1050 mm, mean annual temperature 16.7 ◦C,nnual sunshine time 1900 h and frostless period 237 d.
.2. Experimental design
The field warming system was established according to theesign of free air temperature increase (FATI) facility situated in
tallgrass prairie in the Great Plains, USA (Wan et al., 2002). Thereere four treatments with three replicates in a randomized com-lete block design. The treatments were all-day warming (AW:armed from 0:00 to 24:00), daytime warming (DW: warmed from
:00 to 19:00), nighttime warming (NW: warmed from 19:00 to:00 on next day), and ambient control (CK: no warmed). Each plotrea was 5 m × 4 m in size. One 180 cm × 20 cm infrared heater with500 W (Jiangsu Tiande Special Light Source Co., Ltd., China) wasuspended 1.5 m above the ground in each warmed plot. In eachmbient plot, a ‘dummy’ heater with the same shape and size ashe infrared heater was suspended 1.5 m high to imitate the shadingffects of the heater. The distance between the warmed and controllot was approximately 5 m in order to avoid heat contamination.
This FATI facility formed a 2 m × 2 m sampling area with uniform
nd reliable warming effects. This FATI facility caused significantncrease in the daily mean temperature by 2.0 ◦C in the AW treat-ent, the mean temperature during daytime by 1.1 ◦C in the DWreatment and the mean temperature during nighttime by 1.8 ◦C in
Fig. 1. Daily mean temperature variations on crop canopy in 2008 under differ-ent warming regimes. CK, AW, DW, and NW represent the treatments of ambientcontrol, all-day warming, daytime warming, and nighttime warming, respectively.
the NW treatment in rice canopy (Dong et al., 2011). The seasonaland diurnal temperature variations and trends in the warmed plotswere closely coupled with those in the un-warmed (Fig. 1), suggest-ing a good simulation of the projected climate warming and thelocal temperature variation pattern (Wan et al., 2002; Dong et al.,2011).
2.3. Crop management
Two rice cultivars (O. sativa L.) were tested in this experiment.During 2006–2007, the tested cultivar was Wuyunjing 7. Afterlearning the general response trend, another rice cultivar (Nanjing44) was used to compare the difference in responses between cul-tivars in 2008. Since the warming plot size is not large enough,we could only test one cultivar in each year. Thus, we qualita-tively compared the cultivar difference in the responding trends,not quantitatively. These two cultivars are the major local cultivarswith high yield potential. Rice seedlings were transplanted manu-ally into their corresponding field plots in mid-June with hill spaceof 16.7 cm × 20.0 cm. Rice plant was harvested in October depend-ing on the maturity dates of each plots. The N, P and K fertilizers inevery plot were 374 kg ha−1, 187 kg ha−1 and 187 kg ha−1, respec-tively. The whole P, K, and 50% N were applied as basal dressingtwo days prior to transplanting. Half of the remaining 50% N wasapplied as a side dressing at early tillering in the latter of June, andanother half was applied at panicle initiation in the latter of August.
2.4. Sampling and measurement methods
2.4.1. Plant growth and grain yieldThe tilling dynamics was determined by counting the tiller num-
ber (main stem and tillers) in a fixed 10 hills in each plot at 7 daysintervals until anthesis stage. The dates of transplanting, heading,and maturity were recorded for every year. The heading date andthe maturity date in each plot were respectively recorded when 10%of panicles heading and when most of the panicles appeared com-plete loss of green color. Five hills of plant samples were taken fromeach plot at the anthesis and maturity phases, respectively. Theplants were divided into living and dead leaf tissue, stem (includ-ing leaf sheath) and panicles. All plant samples were oven-dried at80 ◦C for 24 h to a constant weight and weighed. The yield in eachplot was determined by harvesting 1 m2 rice plant after maturity.
2.4.2. Leaf photosynthesis and respiration propertiesAt the stages of booting, heading, filling, and maturity, five flag
leaves of main stem were selected in each plot for the measure-
ments of net photosynthesis rate (from 9:00 to 11:00 a.m.) andnight respiration rate (from 22:00 to 23:00 p.m.) by a portable pho-tosynthesis system (Li-6400; Li-Cor, Inc., Lincoln, NE, USA) in 2006and 2008. The average values of the five leaves denoted the values
Journal Identification = FIELD Article Identification = 5501 Date: July 1, 2011 Time: 11:18 am
s Rese
opriaM(m
2
g
Tber
e pe
Snicle
D(leaf
m0
Hity
×
2
std
3
3
tWpt6fbte
TA
Csu
W. Dong et al. / Field Crop
f each plot. Photosynthesis product is photosynthesis rate multi-lied by flag leaf area, nighttime respiration product is nighttimeespiration rate multiplied by flag leaf area. Five hills of rice plantsn each treatment were sampled at anthesis stage. The flag leaf areand total green leaf area were determined by Li-3000 Portable Areaeter (Li-3000; Li-Cor, Inc., Lincoln, NE, USA). Flag leaf chlorophyll
a + b) content was measured by aqueous acetone (80%) extractionethod (Arnon, 1949).
.4.3. Biomass growth efficiencyFour indexes were selected to compare the efficiency of biomass
rowth between treatments and they were as follows:
he panicle rate (%) = effective panicle numthe greatest plant populations at th
eed-setting rate (%) = the number of filled grainthe total number of spikelet per pa
ry matter translocation rate (%) = dry matter at anthesis
dry
arvest index (%) = actual grain yieldtotal aboveground dry matter at matur
.5. Statistical analysis
All the data were analyzed with Excel 2003 for the mean, thetandard error and plots. The ANOVA was performed with the sta-istical package SPSS 11.5. Means were tested by least significantifferent (LSD). Differences were considered significant at P < 0.05.
. Results
.1. Accumulated temperature and biomass growth rate
The impacts of warming with FATI system on the accumulatedemperature and rice growth rate were represented in Table 1.
arming slightly decreased the accumulated temperature of there-heading phase, and significantly increased the accumulatedemperature of the post-heading phase by 130.5 ◦C, 44.2 ◦C and5.7 ◦C in the AW, DW and NW plots, respectively (Table 1). There-
ore, warming increased the accumulated temperature respectivelyy 114.7 ◦C, 15.7 ◦C and 41.6 ◦C in the AW, DW and NW plots duringhe full growth duration in 2008 (Table 1). As compared to the ambi-nt control, warming tended to decrease rice growth rate duringable 1ccumulated temperatures and biomass growth rate under different warming regimes.
Year Cultivar Treatment Accumulated temperatures (◦C)
Pre-heading Post-heading
2006 Wuyunjing 7
CK – –
AW – –
DW – –
NW – –
2007 Wuyunjing 7
CK – –
AW – –
DW – –
NW – –
2008 Nanjing 44
CK 2127.9 ± 20.54a 1022.7 ± 22.68b
AW 2112.1 ± 21.98a 1153.2 ± 19.59a
DW 2099.4 ± 19.01a 1067.0 ± 21.90b
NW 2103.8 ± 20.41a 1088.5 ± 21.66ab
K, AW, DW, and NW represent the treatments of ambient control, all-day warming, dayignificantly different (P < 0.05) within each parameter when followed by a different letter.sing thermometer during 2006–2007.
arch 123 (2011) 259–265 261
sak tillering stage
× 100
× 100
plus stem) − dry matter at maturity (leaf plus stem)atter at anthesis (leaf plus stem)
× 10
100
the post-heading phase while the rate staying almost unchangedduring the pre-heading phase (Table 1). There was no significantdifference in rice growth rate between the three warming treat-ments.
3.2. Rice phenophase and aboveground biomass
Warming significantly advanced rice heading date (Table 2),resulting in shortness in the growth duration (Table 2). The lengthof pre-heading phase was shortened respectively by 3.3, 1.7, and2.0 days in the AW, DW and NW plots on average across the
three years. However, there was no obvious shortness in the post-heading phase caused by the warming (Table 2). The difference inthe shortness was significant between years and between warmingregimes (P < 0.05, Table 3). However, there was no significant inter-action in the phenophase shortness between the warming regimeand the environment (i.e. the year, Table 3).
Experimental warming tended to reduce rice abovegroundbiomass accumulation (Table 2). The aboveground biomass accu-mulation was respectively 9.1%, 10.3% and 3.3% lower in the AW,DW and NW plots than the control on average over the three-year(Table 2). The reduction of aboveground biomass was significant inthe DW treatment (P < 0.05, Table 3). Significant difference in theaboveground biomass was found between years (P < 0.05, Table 3).However, there were no significant interactions in the abovegroundbiomass between the warming regime and the environment (i.e.the year, Table 3).
3.3. Grain yield and its components
Experimental warming also tended to reduce rice grain yield(Table 2). The grain yield was respectively 0.9%, 6.4% and 6.1%lower in the AW, DW and NW plots than the control on average
Biomass growth rate (kg ha−1 d−1)
Whole duration Pre-heading Post-heading Whole duration
– 108.6 ± 1.21a 195.6 ± 12.22a 145.9 ± 2.63a– 112.2 ± 5.62a 151.6 ± 2.42ab 127.2 ± 3.24bc– 130.0 ± 5.29a 119.0 ± 19.23b 121.8 ± 3.01c– 141.4 ± 16.33a 139.2 ± 23.11ab 140.5 ± 6.40ab– 149.3 ± 11.83a 176.8 ± 57.46a 161.0 ± 20.81a– 140.5 ± 18.72a 165.5 ± 12.37a 151.6 ± 5.50a– 137.9 ± 10.33a 142.9 ± 3.45a 140.0 ± 4.39a– 144.9 ± 16.64a 147.4 ± 0.51a 140.2 ± 12.48a3150.7 ± 25.46b 138.8 ± 6.19a 149.9 ± 12.12a 144.2 ± 1.22a3265.3 ± 31.26a 142.2 ± 12.06a 135.8 ± 13.26a 139.8 ± 2.63a3166.4 ± 35.97b 139.3 ± 5.11a 151.7 ± 0.29a 150.1 ± 4.07a3192.3 ± 35.31ab 135.4 ± 5.68a 147.6 ± 17.82a 146.8 ± 4.45a
time warming, and nighttime warming, respectively. Values are means ± 1 SE and ‘–’ means data are not available because the temperatures were manually measured

Journ
al Id
entifi
cation =
FIELD
Article
Iden
tification
= 5501
D
ate: Ju
ly 1,
2011
Time:
11:18 am
262
W.
Dong
et al.
/ Field
Crops R
esearch 123
(2011) 259–265
Table 2Crop phenophase, aboveground biomass, grain yield and its components under different warming regimes from 2006 to 2008.
Year Cultivar Treatment Date (month/day) Abovegroundbiomass (t ha−1)
Grain yield(t ha−1)
Effectivepanicle(104 plants ha−1)
Grainnumber(grains panicle−1)
Grainweight(g 10−3 grains)
Transplanting Heading Maturity
2006 Wuyunjing 7
CK
6/24
8/29a 10/16a 20.6 ± 0.33a 7.5 ± 0.17a 304.1 ± 10.85a 149.7 ± 8.11a 22.6 ± 0.05aAW 8/26b 10/14b 18.1 ± 0.34bc 7.2 ± 0.32ab 321.0 ± 19.84a 143.4 ± 6.79a 19.4 ± 0.52bDW 8/28ab 10/15ab 16.9 ± 0.43c 7.4 ± 0.05ab 326.0 ± 18.15a 144.2 ± 5.09a 20.0 ± 0.48bNW 8/28ab 10/15ab 19.6 ± 0.77ab 6.8 ± 0.03b 301.1 ± 8.20a 147.9 ± 2.19a 19.7 ± 0.33b
2007 Wuyunjing 7
CK
6/16
8/29a 10/21a 23.9 ± 2.60a 6.9 ± 0.13a 224.7 ± 14.98a 160.9 ± 6.80a 27.7 ± 0.35aAW 8/25b 10/18b 22.1 ± 0.90a 6.9 ± 0.19a 234.6 ± 4.99a 151.9 ± 2.74a 26.6 ± 0.77aDW 8/27b 10/19b 20.6 ± 0.13a 6.4 ± 0.23a 237.6 ± 2.00a 153.8 ± 9.36a 27.6 ± 0.22aNW 8/26b 10/19b 23.2 ± 2.64a 6.5 ± 0.14a 234.6 ± 4.99a 152.7 ± 9.09a 27.3 ± 0.42a
2008 Nanjing 44
CK
6/16
8/30a 10/14a 18.3 ± 0.14a 6.9 ± 0.17a 219.7 ± 5.28a 147.3 ± 1.50a 27.2 ± 0.39aAW 8/27b 10/9c 16.9 ± 0.28a 7.0 ± 0.56a 224.7 ± 8.99a 144.6 ± 2.38a 27.0 ± 0.04aDW 8/28b 10/11b 18.5 ± 0.83a 6.2 ± 0.34a 231.7 ± 3.99a 143.0 ± 13.86a 27.2 ± 0.19aNW 8/28b 10/11b 17.9 ± 0.50a 6.7 ± 0.06a 224.7 ± 14.98a 144.8 ± 3.44a 27.2 ± 0.34a
CK, AW, DW, and NW represent the treatments of ambient control, all-day warming, daytime warming, and nighttime warming, respectively. Values are means ± 1 SE and significantly different (P < 0.05) within each parameterwhen followed by a different letter.
Table 3Significance values and degree of freedom of ANOVA analysis (three-way).
Source df1 Headingdate
Maturitydate
Abovegroundbiomass
Grainyield
Effectivepanicle
Grainnumber
1000-grainweight
Seed-settingrate
DMT rate Harvestindex
df2 Panicle rate Flag leafarea
Total greenleaves area
Flag leafchlorophyll(a + b)
Year 2 ** ** ** ** ** ns ** ** ns ** 1 ** ** ** **
DW 1 ** ** * ns ns ns ** ns ns * 1 ns ns ns *NW 1 ** ** ns ns ns ns ** ns ns ns 1 * ns ns nsYear × DW 2 ns ns ns ns ns ns * ns ns ns 1 ns ns ns nsYear × NW 2 ns ns ns ns ns ns * ns ns ns 1 ns ns ns nsAW (DW × NW) 1 ns ns ns ** ns ns ns ns ns ns 1 ns ns * nsYear × DW × NW 2 ns ns ns ns ns ns * ns ns ns 1 ns ns ns nsError 22 14
AW, DW and NW represent the treatments of all-day warming, daytime warming, and nighttime warming, respectively. DMT means dry matter translocation of rice leaf and stem to the grain during post-anthesis phase.ns, mean being insignificant.
* Mean being significant at 0.05 level.** Mean being significant at 0.01 level, respectively.

Journal Identification = FIELD Article Identification = 5501 Date: July 1, 2011 Time: 11:18 am
W. Dong et al. / Field Crops Rese
Table 4Plant biomass growth efficiencies under different warming regimes from 2006 to 2008.
Year Cultivar Treatment Panicle rate (%)
2006 Wuyunjing 7
CK 52.9 ± 0.28a
AW 45.1 ± 3.01b
DW 45.3 ± 3.45b
NW 43.7 ± 1.04b
2007 Wuyunjing 7
CK –AW –DW –
NW –
2008 Nanjing 44
CK 64.2 ± 5.23a
AW 64.3 ± 4.22a
DW 67.3 ± 7.29a
NW 61.6 ± 1.51a
C g, days nt lettp inves
aise
dDbctttsi(g(iw
3
c7ad9atoTir
TL
Cs
K, AW, DW, and NW represent the treatments of ambient control, all-day warminignificantly different (P < 0.05) within each parameter when followed by a differeost-anthesis phase. ‘–’ means data are not available because the indicator was not
cross the three years (Table 2). There was significant differencen the grain yield between years (P < 0.05, Table 3). However, noignificant interactions were found in the grain yield between thenvironment (i.e. the year) and the warming regime (Table 3).
Warming tended to increase the number of effective panicle andecrease the total grain number and 1000-grain weight (Table 2).uring the three-year, the effective panicles increased respectivelyy an average of 4.1%, 6.1% and 1.9% in the AW, DW and NW plotsompared to the ambient control. However, the mean values ofhe grain number per panicle decreased 3.9%, 3.6% and 2.6% inhe AW, DW and NW plots, respectively, and the mean values ofhe 1000-grain weight decreased 6.3%, 3.9% and 4.8% in the corre-ponding treatments (Table 2). There were significant differencesn effective panicle number and 1000-grain weight between yearsP < 0.05, Table 3). Significant interactions were found in the 1000-rain weight between the warming regime and the environmenti.e. the year) (P < 0.05, Table 3). No significant interaction was foundn the effective panicle number and the grain number between the
arming regime and the environment (i.e. the year, Table 3).
.4. Biomass growth efficiency
Table 4 shows the effects of warming on the biomass growth effi-iency of midseason rice. The panicle rate respectively decreased.2%, 4.8% and 10.7% in the AW, DW and NW plots compared to thembient control on average across the experimental duration. Thery matter translocation rate (DMT rate) decreased 1.5%, 8.3%, and.9% in the corresponding treatments. The harvest index showedn increasing trend in the AW and DW plots, and a decreasingrend in the NW plot compared to the ambient control. No obvi-
us impact of warming was found on the seed-setting rate (Table 4).here were significant differences in the biomass growth efficiencyndexes between the years except for the dry matter translocationate (P < 0.05, Table 3). No significant interactions were found in theable 5eaf properties at the anthesis stage under different warming regimes in 2006 and 2008.
Year Cultivar Treatment Flag leaf area (cm2 leaf−1)
2006 Wuyunjing 7
CK 36.3 ± 4.21a 1AW 41.7 ± 1.00a 1DW 44.7 ± 2.76a 1NW 41.5 ± 2.23a 1
2008 Nanjing 44
CK 29.7 ± 2.23a 1AW 29.9 ± 0.96a 1DW 29.8 ± 0.87a 1NW 29.7 ± 1.38a 1
K, AW, DW, and NW represent the treatments of ambient control, all-day warming, dayignificantly different (P < 0.05) within each parameter when followed by a different lette
arch 123 (2011) 259–265 263
Seed-setting rate (%) DMT rate (%) Harvest index (%)
89.8 ± 0.36a 25.0 ± 3.05a 36.4 ± 0.31b89.3 ± 0.66a 22.4 ± 3.21a 39.8 ± 2.44ab89.1 ± 0.61a 21.1 ± 1.55a 42.8 ± 1.43a89.9 ± 0.27a 23.7 ± 0.57a 34.7 ± 1.34b86.2 ± 1.13a 25.8 ± 8.11a 29.4 ± 2.92a85.6 ± 5.65a 25.1 ± 1.79a 31.4 ± 0.67a88.8 ± 0.99a 24.7 ± 3.95a 30.0 ± 1.18a87.2 ± 2.99a 24.7 ± 2.95a 28.8 ± 3.17a79.6 ± 0.27a 25.2 ± 4.94a 37.8 ± 0.85a83.9 ± 1.60a 27.4 ± 7.65a 41.4 ± 3.94a80.8 ± 0.89a 24.0 ± 3.07a 36.2 ± 1.80a81.6 ± 1.92a 20.2 ± 3.47a 37.3 ± 0.68a
time warming, and nighttime warming, respectively. Values are means ± 1 SE ander. DMT means dry matter translocation of rice leaf and stem to the grain during
tigated in the growing season of 2007.
efficiencies between the warming regime and the environment (i.e.the year, Table 3).
3.5. Leaf area and chlorophyll content
Experimental warming tended to enhance the leaf propertiesat anthesis stage (Table 5). Warming increased the flag leaf arearespectively by 7.7%, 11.6% and 7.0%, the flag leaf chlorophyll (a + b)content respectively by 8.3%, 6.1% and 4.6% in the AW, DW andNW plots on average during the two years. At anthesis, the totalgreen leaf areas were respectively 0.2%, 9.5% and 3.8% higher in theAW, DW and NW plots than the control on average across the twoyears. Significant differences in the leaf area, the leaf chlorophyllcontent and total green leaf areas were found between the years(P < 0.05, Table 3). There were no significant interactions in the leafproperties between the warming regime and the environment (i.e.the year, Table 3).
3.6. Rates and products of photosynthesis and respiration
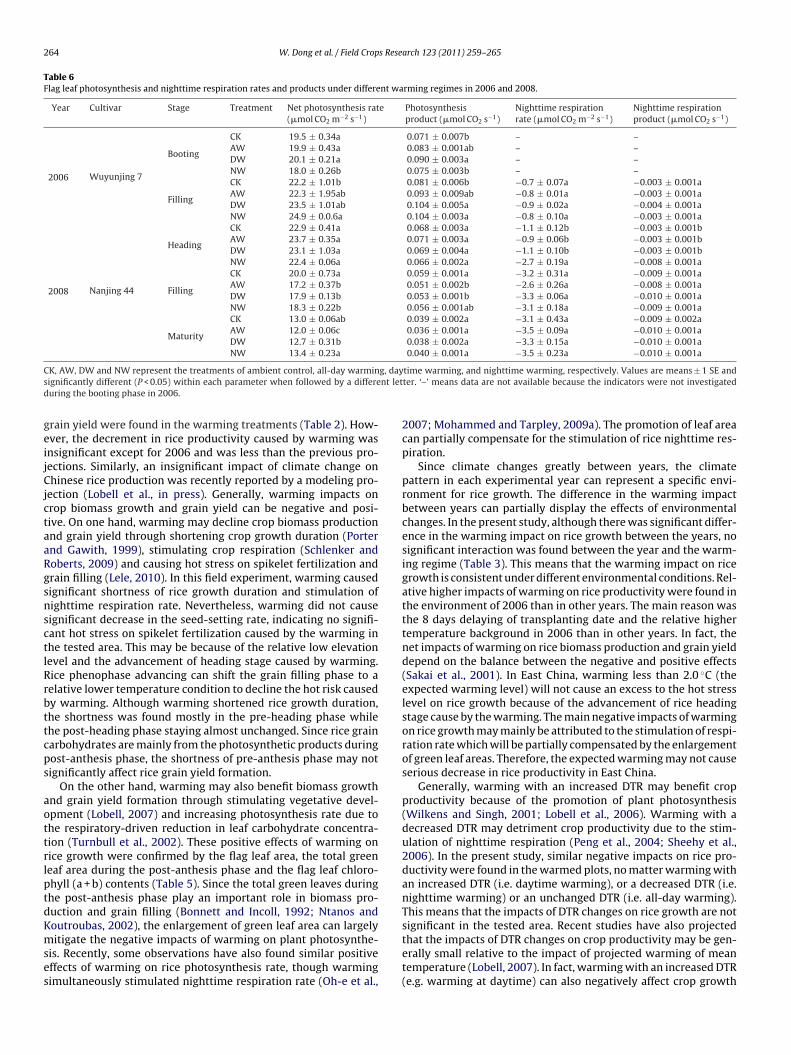
Table 6 shows that warming impacted the net photosynthesisrate and product insignificantly at booting and maturity stages andsignificantly decreased it at grain filling stage in 2008. However,nighttime respiration rate was stimulated by 0.3%, 14.5% and 33.6%,and nighttime respiration product was increased respectively by3.9%, 18.1% and 47.9% in the AW, DW and NW plots on averageacross the two years.
4. Discussion
Total green leaves area (cm2 stem−1) Flag leaf chlorophyll (a + b) (mg g−1)
27.0 ± 12.30a 4.2 ± 0.15a24.8 ± 3.88a 4.5 ± 0.09a40.8 ± 3.29a 4.6 ± 0.19a41.7 ± 2.41a 4.4 ± 0.01a11.3 ± 0.17b 3.5 ± 0.08b13.6 ± 2.93ab 3.8 ± 0.01a20.3 ± 1.74a 3.6 ± 0.05ab07.0 ± 0.78b 3.6 ± 0.05ab
time warming, and nighttime warming, respectively. Values are means ± 1 SE andr.
Previous studies have shown that the expected warming willcause a large decrease in rice yield (Tan and Shibasaki, 2003;Peng et al., 2004; Lin et al., 2005; Lele, 2010). In the presentstudy, similar decreasing trends of rice biomass production and
Journal Identification = FIELD Article Identification = 5501 Date: July 1, 2011 Time: 11:18 am
264 W. Dong et al. / Field Crops Research 123 (2011) 259–265
Table 6Flag leaf photosynthesis and nighttime respiration rates and products under different warming regimes in 2006 and 2008.
Year Cultivar Stage Treatment Net photosynthesis rate(�mol CO2 m−2 s−1)
Photosynthesisproduct (�mol CO2 s−1)
Nighttime respirationrate (�mol CO2 m−2 s−1)
Nighttime respirationproduct (�mol CO2 s−1)
2006 Wuyunjing 7
Booting
CK 19.5 ± 0.34a 0.071 ± 0.007b – –AW 19.9 ± 0.43a 0.083 ± 0.001ab – –DW 20.1 ± 0.21a 0.090 ± 0.003a – –NW 18.0 ± 0.26b 0.075 ± 0.003b – –
Filling
CK 22.2 ± 1.01b 0.081 ± 0.006b −0.7 ± 0.07a −0.003 ± 0.001aAW 22.3 ± 1.95ab 0.093 ± 0.009ab −0.8 ± 0.01a −0.003 ± 0.001aDW 23.5 ± 1.01ab 0.104 ± 0.005a −0.9 ± 0.02a −0.004 ± 0.001aNW 24.9 ± 0.0.6a 0.104 ± 0.003a −0.8 ± 0.10a −0.003 ± 0.001a
2008 Nanjing 44
Heading
CK 22.9 ± 0.41a 0.068 ± 0.003a −1.1 ± 0.12b −0.003 ± 0.001bAW 23.7 ± 0.35a 0.071 ± 0.003a −0.9 ± 0.06b −0.003 ± 0.001bDW 23.1 ± 1.03a 0.069 ± 0.004a −1.1 ± 0.10b −0.003 ± 0.001bNW 22.4 ± 0.06a 0.066 ± 0.002a −2.7 ± 0.19a −0.008 ± 0.001a
Filling
CK 20.0 ± 0.73a 0.059 ± 0.001a −3.2 ± 0.31a −0.009 ± 0.001aAW 17.2 ± 0.37b 0.051 ± 0.002b −2.6 ± 0.26a −0.008 ± 0.001aDW 17.9 ± 0.13b 0.053 ± 0.001b −3.3 ± 0.06a −0.010 ± 0.001aNW 18.3 ± 0.22b 0.056 ± 0.001ab −3.1 ± 0.18a −0.009 ± 0.001a
Maturity
CK 13.0 ± 0.06ab 0.039 ± 0.002a −3.1 ± 0.43a −0.009 ± 0.002aAW 12.0 ± 0.06c 0.036 ± 0.001a −3.5 ± 0.09a −0.010 ± 0.001aDW 12.7 ± 0.31b 0.038 ± 0.002a −3.3 ± 0.15a −0.010 ± 0.001aNW 13.4 ± 0.23a 0.040 ± 0.001a −3.5 ± 0.23a −0.010 ± 0.001a
C g, days nt letd
geijCjctaaRgsnsctlRrbttcps
aottrlptdKmses
K, AW, DW and NW represent the treatments of ambient control, all-day warminignificantly different (P < 0.05) within each parameter when followed by a differeuring the booting phase in 2006.
rain yield were found in the warming treatments (Table 2). How-ver, the decrement in rice productivity caused by warming wasnsignificant except for 2006 and was less than the previous pro-ections. Similarly, an insignificant impact of climate change onhinese rice production was recently reported by a modeling pro-
ection (Lobell et al., in press). Generally, warming impacts onrop biomass growth and grain yield can be negative and posi-ive. On one hand, warming may decline crop biomass productionnd grain yield through shortening crop growth duration (Porternd Gawith, 1999), stimulating crop respiration (Schlenker andoberts, 2009) and causing hot stress on spikelet fertilization andrain filling (Lele, 2010). In this field experiment, warming causedignificant shortness of rice growth duration and stimulation ofighttime respiration rate. Nevertheless, warming did not causeignificant decrease in the seed-setting rate, indicating no signifi-ant hot stress on spikelet fertilization caused by the warming inhe tested area. This may be because of the relative low elevationevel and the advancement of heading stage caused by warming.ice phenophase advancing can shift the grain filling phase to aelative lower temperature condition to decline the hot risk causedy warming. Although warming shortened rice growth duration,he shortness was found mostly in the pre-heading phase whilehe post-heading phase staying almost unchanged. Since rice grainarbohydrates are mainly from the photosynthetic products duringost-anthesis phase, the shortness of pre-anthesis phase may notignificantly affect rice grain yield formation.
On the other hand, warming may also benefit biomass growthnd grain yield formation through stimulating vegetative devel-pment (Lobell, 2007) and increasing photosynthesis rate due tohe respiratory-driven reduction in leaf carbohydrate concentra-ion (Turnbull et al., 2002). These positive effects of warming onice growth were confirmed by the flag leaf area, the total greeneaf area during the post-anthesis phase and the flag leaf chloro-hyll (a + b) contents (Table 5). Since the total green leaves duringhe post-anthesis phase play an important role in biomass pro-uction and grain filling (Bonnett and Incoll, 1992; Ntanos andoutroubas, 2002), the enlargement of green leaf area can largely
itigate the negative impacts of warming on plant photosynthe-is. Recently, some observations have also found similar positiveffects of warming on rice photosynthesis rate, though warmingimultaneously stimulated nighttime respiration rate (Oh-e et al.,
time warming, and nighttime warming, respectively. Values are means ± 1 SE andter. ‘–’ means data are not available because the indicators were not investigated
2007; Mohammed and Tarpley, 2009a). The promotion of leaf areacan partially compensate for the stimulation of rice nighttime res-piration.
Since climate changes greatly between years, the climatepattern in each experimental year can represent a specific envi-ronment for rice growth. The difference in the warming impactbetween years can partially display the effects of environmentalchanges. In the present study, although there was significant differ-ence in the warming impact on rice growth between the years, nosignificant interaction was found between the year and the warm-ing regime (Table 3). This means that the warming impact on ricegrowth is consistent under different environmental conditions. Rel-ative higher impacts of warming on rice productivity were found inthe environment of 2006 than in other years. The main reason wasthe 8 days delaying of transplanting date and the relative highertemperature background in 2006 than in other years. In fact, thenet impacts of warming on rice biomass production and grain yielddepend on the balance between the negative and positive effects(Sakai et al., 2001). In East China, warming less than 2.0 ◦C (theexpected warming level) will not cause an excess to the hot stresslevel on rice growth because of the advancement of rice headingstage cause by the warming. The main negative impacts of warmingon rice growth may mainly be attributed to the stimulation of respi-ration rate which will be partially compensated by the enlargementof green leaf areas. Therefore, the expected warming may not causeserious decrease in rice productivity in East China.
Generally, warming with an increased DTR may benefit cropproductivity because of the promotion of plant photosynthesis(Wilkens and Singh, 2001; Lobell et al., 2006). Warming with adecreased DTR may detriment crop productivity due to the stim-ulation of nighttime respiration (Peng et al., 2004; Sheehy et al.,2006). In the present study, similar negative impacts on rice pro-ductivity were found in the warmed plots, no matter warming withan increased DTR (i.e. daytime warming), or a decreased DTR (i.e.nighttime warming) or an unchanged DTR (i.e. all-day warming).This means that the impacts of DTR changes on rice growth are notsignificant in the tested area. Recent studies have also projected
that the impacts of DTR changes on crop productivity may be gen-erally small relative to the impact of projected warming of meantemperature (Lobell, 2007). In fact, warming with an increased DTR(e.g. warming at daytime) can also negatively affect crop growth
Journal Identification = FIELD Article Identification = 5501 Date: July 1, 2011 Time: 11:18 am
s Rese
dWptgstwwpiaietbuD
5
rtlsirrcirpeuo
A
SSEfo
R
A
A
B
C
D
E
F
I
You, L., Rosegrant, M.W., Wood, S., Sun, D., 2009. Impact of growing season temper-
W. Dong et al. / Field Crop
ue to the heat stress (Frantz et al., 2004; Morita et al., 2005).arming with a decreased DTR (e.g. warming at nighttime) may
romote crop growth through decreasing the minimum tempera-ure limitation and shifting the post-anthesis phase to a relativeood temperature condition due to the advancement of anthe-is stage (Nicholls, 1997; Porter and Gawith, 1999). Meanwhile,he daily mean temperature and the accumulated temperatureill simultaneously change with the DTR. In this study, althougharming at daytime or at nighttime all tended to decrease riceroductivity, all-day warming did not cause significant decreases
n rice biomass production and grain yield. This means therere no additive effects or interactions between daytime warm-ng and nighttime warming (Table 3), indicating a compensatingffect between the impacts of warming at daytime and at night-ime. Obviously, the impacts of DTR changes on rice growth cane complicated, further study is needed to better understand thenderlying mechanisms of the impacts of warming with differentTR on crop growth (Lobell, 2007).
. Conclusion
The projected warming (less than 2.0 ◦C) will negatively affectice productivity in East China, but the impacts will be less thanhe previous projections. Warming caused significant shortness inength of rice pre-heading phase while the post-heading phasetaying almost unchanged. Although there was large differencen the diurnal temperature range (DTR) between the warmingegimes, no significant difference in the impact of warming onice growth was found between the warming regimes. This indi-ates that the change of DTR caused by warming may have littlempacts on rice growth in the tested area. Warming stimulatedice nighttime respiration and enlarged the green leaf area duringost-heading phase. The above evidences demonstrate that furtherfforts should be paid on the field experiments to decrease thencertainties of the quantitative evaluation of warming impactsn future rice production in East China.
cknowledgements
This work was supported by the National Key Technologyupport Program of China (2011BAD16B14), the Chinese Naturecience Foundation (30771278) and the Program for New Centuryxcellent Talents in University (NCET-05-0492). We are very grate-ul to the two anonymous reviewers for their great comments onur manuscript revision.
eferences
rnon, D.I., 1949. Copper enzymes in isolated chloroplasts. Polyphenoloxidase inBata vulgaris. Plant Physiol. 24, 1–15.
ronson, E.L., McNulty, S.G., 2009. Appropriate experimental ecosystem warmingmethods by ecosystem, objective, and practicality. Agric. For. Meteorol. 149,1791–1799.
onnett, G.D., Incoll, L.D., 1992. The potential pre-anthesis and post-anthesis con-tributions of stem internodes to grain yield in crops of winter barley. Ann. Bot.69, 219–225.
heng, W., Sakai, H., Yagi, K., Hasegawa, T., 2009. Interactions of elevated [CO2] andnight temperature on rice growth and yield. Agric. For. Meteorol. 149, 51–58.
ong, W., Deng, A., Zhang, B., Tian, Y., Chen, J., Yang, F., Zhang, W., 2011. An exper-imental study on the effects of different diurnal warming regimes on singlecropping rice with free air temperature increased (FATI) facility. Acta Ecol. Sin.31, 2169–2177 (in Chinese with English abstract).
asterling, D.R., Horton, B., Jones, P.D., Peterson, T.C., Karl, T.R., Parker, D.E., Salinger,M.J., Razuvayev, V., Plummer, N., Jamason, P., 1997. Maximum and minimumtemperature trends for the globe. Science 277, 364–367.
rantz, J.M., Cometti, N.N., Bugbee, B., 2004. Night temperature has a minimal effecton respiration and growth in rapidly growing plants. Ann. Bot. 94, 155–166.
PCC, 2001. Climate change 2001: the scientific basis. In: Contribution of Work-ing Group I to the Third Assessment Report of the Intergovernmental Panel onClimate Change. Cambridge University Press, Cambridge, United Kingdom.
arch 123 (2011) 259–265 265
IPCC, 2007. Climate change 2007: the physical science basis. In: Contribution ofWorking Group I to the Fourth Assessment Report of the IntergovernmentalPanel on Climate Change. Cambridge University Press, Cambridge, United King-dom.
Jagadish, S.V.K., Craufurd, P.Q., Wheeler, T.R., 2007. High temperature stress andspikelet fertility in rice (Oryza sativa L.). J. Exp. Bot. 58, 1627–1635.
Kanno, K., Mae, T., Makino, A., 2009. High night temperature stimulates photosyn-thesis, biomass production and growth during the vegetative stage of rice plants.Soil Sci. Plant Nutr. 55, 124–131.
Karl, T.R., Jones, P.D., Knight, R.W., Kukla, G., Plummer, N., Razuvayev, V., Gallo, K.P.,Lindseay, J., Charlson, R.J., Peterson, T.C., 1993. A new perspective on recentglobal warming: asymmetric trends of daily maximum and minimum temper-ature. Bull. Am. Meteorol. Soc. 74, 1007–1023.
Khush, G.S., 2005. What it will take to feed 5.0 billion rice consumers in 2030. PlantMol. Biol. 59, 1–6.
Kimball, B.A., Conley, M.M., 2009. Infrared heater arrays for warming field plotsscaled up to 5-m diameter. Agric. For. Meteorol. 149, 721–724.
Kimball, B.A., Conley, M.M., Wang, S., Liu, X., Luo, C., Morgan, J., Smith, D., 2008.Infrared heater arrays for warming ecosystem field plots. Global Change Biol.14, 309–320.
Lele, U., 2010. Food security for a billion poor. Science 326, 1554.Lin, E., Xiong, W., Ju, H., Xu, Y., Li, Y., Bai, L., Xie, L., 2005. Climate change impacts
on crop yield and quality with CO2 fertilization in China. Philos. Trans. R. Soc. B.360, 2149–2154.
Lobell, D.B., 2007. Changes in diurnal temperature range and national cereal yields.Agric. For. Meteorol. 145, 229–238.
Lobell, D.B., Field, C.B., Cahill, K.N., Bonfils, C., 2006. Impacts of future climate changeon California perennial crop yields: model projections with climate and cropuncertainties. Agric. For. Meteorol. 141, 208–218.
Lobell, D.B., Schlenker, W., Costa-Roberts, J. Climate trends and global crop produc-tion since 1980. Science, in press.
Mohammed, A.R., Tarpley, L., 2009a. High nighttime temperatures affect rice pro-ductivity through altered pollen germination and spikelet fertility. Agric. For.Meteorol. 149, 999–1008.
Mohammed, A.R., Tarpley, L., 2009b. Instrumentation enabling study of plant phys-iological response to elevated night temperature. Plant Methods 5, 7.
Morita, S., Yonemaru, J., Takanashi, J., 2005. Grain growth and endosperm cell sizeunder high night temperatures in rice (Oryza sativa L.). Ann. Bot. 95, 695–701.
Nicholls, N., 1997. Increased Australian wheat yield due to recent climate trends.Nature 387, 484–485.
Nijs, I., Kockelbergh, F., Teughels, H., Blum, H., Hendrey, G., Impens, I., 1996. Freeair temperature increase (FATI): a new tool to study global warming effects onplants in the field. Plant Cell Environ. 19, 495–502.
Ntanos, D.A., Koutroubas, S.D., 2002. Dry matter and N accumulation and translo-cation for Indica and Japonica rice under Mediterranean conditions. Field CropsRes. 74, 93–101.
Oh-e, I., Saitoh, K., Kuroda, T., 2007. Effects of high temperature on growth, yieldand dry-matter production of rice grown in the paddy field. Plant Prod. Sci. 10,412–422.
Peng, S.P., Huang, J.L., Sheehy, J.E., Laza, R.C., Visperas, R.M., Zhong, X.H., Centeno,G.S., Khush, G.S., Cassman, K.G., 2004. Rice yields decline with higher nighttemperature from global warming. Proc. Natl. Acad. Sci. U.S.A. 101, 9971–9975.
Porter, J.R., Gawith, M., 1999. Temperatures and the growth and development ofwheat: a review. Eur. J. Agron. 10, 23–36.
Price, C., Michaelides, S., Pashiardis, S., Alpert, P., 1999. Long term changes in diurnaltemperature range in Cyprus. Atmos. Res. 51, 85–98.
Sakai, H., Yagi, K., Kobayashi, K., Kawashima, S., 2001. Rice carbon balance underelevated CO2. New Phytol. 150, 241–249.
Sass, R.L., Cicerone, R.J., 2002. Photosynthate allocations in rice plants: food produc-tion or atmospheric methane? Proc. Natl. Acad. Sci. U.S.A. 99, 11993–11995.
Schlenker, W., Roberts, M.J., 2009. Nonlinear temperature effects indicate severedamages to U.S. crop yields under climate change. Proc. Natl. Acad. Sci. U.S.A.106, 15594–15598.
Sheehy, J.E., Mitchell, P.L., Ferrer, A.B., 2006. Decline in rice grain yields with tem-perature: models and correlations can give different estimates. Field Crops Res.98, 151–156.
Tan, G., Shibasaki, R., 2003. Global estimation of crop productivity and the impactsof global warming by GIS and EPIC integration. Ecol. Model. 168, 357–370.
Tester, M., Langridge, P., 2010. Breeding technologies to increase crop production ina changing world. Science 327, 818–822.
Tubiello, F.N., Soussana, J.F., Howden, S.M., 2007. Crop and pasture response toclimate change. Proc. Natl. Acad. Sci. U.S.A. 104, 19686–19690.
Turnbull, M.H., Murthy, R., Griffin, K.L., 2002. The relative impacts of daytime andnighttime warming on photosynthetic capacity in Populus deltoids. Plant CellEnviron. 25, 1729–1737.
Wan, S., Luo, Y., Wallace, L.L., 2002. Changes in microclimate induced by experimen-tal warming and clipping in tallgrass prairie. Global Change Biol. 8, 754–768.
Wilkens, P., Singh, U., 2001. A code-level analysis for temperature effects in theCERES models. In: White, J.W. (Ed.), Modeling temperature response in wheatand maize. CIMMYT Press, EI Batán, Mexico, pp. 1–7.
ature on wheat productivity in China. Agric. For. Meteorol. 149, 1009–1014.Ziska, L.H., Namuco, O., Moya, T., Quilang, J., 1997. Growth and yield response of field-
grown tropical rice to increasing carbon dioxide and air temperature. Agron. J.89, 45–53.