response rates in organizational science, 1995–2008: a...
TRANSCRIPT
Response Rates in Organizational Science, 1995–2008:A Meta-analytic Review and Guidelines for Survey Researchers
Frederik Anseel • Filip Lievens • Eveline Schollaert •
Beata Choragwicka
Published online: 9 February 2010
� Springer Science+Business Media, LLC 2010
Abstract
Purpose This study expands upon existing knowledge of
response rates by conducting a large-scale quantitative
review of published response rates. This allowed a fine-
grained comparison of response rates across respondent
groups. Other unique features of this study are the analysis
of response enhancing techniques across respondent groups
and response rate trends over time. In order to aid
researchers in designing surveys, we provide expected
response rate percentiles for different survey modalities.
Design We analyzed 2,037 surveys, covering 1,251,651
individual respondents, published in 12 journals in I/O
Psychology, Management, and Marketing during the period
1995–2008. Expected response rate levels were summa-
rized for different types of respondents and use of response
enhancing techniques was coded for each study.
Findings First, differences in mean response rate were
found across respondent types with the lowest response
rates reported for executive respondents and the highest for
non-working respondents and non-managerial employees.
Second, moderator analyses suggested that the effective-
ness of response enhancing techniques was dependent on
type of respondents. Evidence for differential prediction
across respondent type was found for incentives, salience,
identification numbers, sponsorship, and administration
mode. When controlling for increased use of response
enhancing techniques, a small decline in response rates
over time was found.
Implications Our findings suggest that existing guidelines
for designing effective survey research may not always
offer the most accurate information available. Survey
researchers should be aware that they may obtain lower/
higher response rates depending on the respondent type
surveyed and that some response enhancing techniques
may be less/more effective in specific samples.
Originality/value This study, analyzing the largest set of
published response rates to date, offers the first evidence
for different response rates and differential functioning of
response enhancing techniques across respondent types.
Keywords Response rate � Response enhancing
technique � Survey � Respondent type � Sample �Meta-analysis
Organizational researchers relying on survey methodology
are often confronted with the potential threat of a sub-
stantial amount of non-response to a survey. Two important
concerns arise when considering non-response. A first issue
is which precautions researchers can take to increase
response rates in their studies and which response rates
they may expect in a particular research situation (Dillman
2000; Roth and BeVier 1998). A second issue refers to the
observed non-response to the survey threatens the external
validity of the conclusions drawn (Rogelberg and Stanton
2007; Spitzmuller et al. 2006). If systematic differences
between respondents and non-respondents are present, the
findings of the study may not generalize to the entire
sample, and hence, may undermine conclusions drawn
about the population under consideration. The current
study addresses the first issue. More than a decade ago,
F. Anseel (&) � F. Lievens � E. Schollaert
Department of Personnel Management and Work
and Organizational Psychology, Ghent University,
Henri Dunantlaan 2, 9000 Ghent, Belgium
e-mail: [email protected]
B. Choragwicka
Department of Social Psychology, University of Santiago de
Compostela, Santiago de Compostela, Galicia, Spain
123
J Bus Psychol (2010) 25:335–349
DOI 10.1007/s10869-010-9157-6

Roth and BeVier (1998) calculated response rates obtained
in organizational surveys on the basis of an analysis of
studies published in organizational journals for the years
1990–1994. Their study offered empirically based guide-
lines to aid organizational researchers and practitioners in
predicting and evaluating response rates. In addition, their
findings provided organizational researchers with infor-
mation on techniques that might help enhance response
rates.
Although this study has proved to be an important help
to researchers, these initial findings are currently in need of
extension. First, to date, mostly general guidelines that
summarize response rates over different types of respon-
dents are available. Recent research, however, suggests that
the response rate of specific respondents might be much
lower or higher than these average estimates. For instance,
an analysis of response rates in top-management samples
found a mean response rate of 32% (Cycyota and Harrison
2006) in contrast to previous average estimates of 57%
(Roth and BeVier 1998). Similarly, Baruch and Holtom
(2008) found that response rates from organizational rep-
resentatives (mostly top executives) were considerably
lower than for other respondents (35.7% vs. 52.7%).
Although both studies focused on top executives only,
these findings suggest that general response rates may be
uninformative for researchers interested in predicting the
response rate for specific respondent groups. Therefore, a
first objective of this article is to provide estimates of
response rates for different types of respondents.
Second, several researchers have suggested that
response rates are declining over time as a result of the
increasing popularity of surveys (e.g., Baruch 1999;
Cycyota and Harrison 2006; Rogelberg and Stanton 2007).
Thus, it might be that the response rate estimates calculated
by Roth and BeVier (1998) on the basis of studies pub-
lished during the years 1990–1994 are too optimistic.
Although a recent study sampling response rates from the
year 2000 and the year 2005 found no decrease in response
rates over time (Baruch and Holtom 2008), Cycyota and
Harrison (2006) suggested that response rate trends may
reflect a linear trend and studying published response rates
over a longer time period may be a more appropriate
approach than selecting only two separate years. Therefore,
a second objective of this article is to provide more recent
response rate guidelines on the basis of 14 years of pub-
lished studies in organizational science.
Third, researchers may use previous findings regarding
response enhancing techniques as a guideline for designing
their survey to obtain a high response rate. Past research
has extensively documented and compared the effective-
ness of these different techniques. However, research
suggests that the response enhancing techniques may not
be equally effective for different types of respondents. For
instance, none of the techniques initially suggested by Roth
and BeVier (1998) increased top-management responses
(Cycyota and Harrison 2002, 2006). Similarly, Baruch and
Holtom (2008) found that follow-up was associated with
low response rates for top executive respondents, but not
for the remainder of the population. Although these studies
were the first to suggest that some techniques might be
more or less effective depending on the focal respondent
type, they did not systematically examine the moderating
role of respondent type in the relation between response
techniques and response rates. Thus, the global findings
and guidelines regarding the effectiveness of various
techniques could be misleading to some extent as the
effectiveness of the various techniques also likely varies
across different types of respondents. A third objective of
the current study, therefore, is to examine hypotheses about
the differential prediction of specific response enhancing
techniques across respondent type.
In sum, the current study expands upon existing
knowledge of response rates by conducting a large-scale
review of published response rates. We analyzed response
rates and response enhancing techniques for different
respondent groups on the basis of published survey articles
of 12 journals in I/O Psychology, Management, and
Marketing from 1995 to 2008.
The results of this study should provide academic survey
researchers and, to a lesser extent, practitioners with a
range of empirically based guidelines to assist them in
designing and optimizing survey studies for specific types
of respondents. It is important for researchers to have an
idea of the response rate to expect when planning a study,
as low response rates cause smaller than expected sample
sizes. In turn, smaller samples decrease statistical power,
increasing the size of confidence intervals around the sta-
tistical parameters estimated on the basis of the sample,
and they may limit the types of statistical techniques that
can be applied to the data collected. Instead of only reac-
tively evaluating response rates (i.e., after the study was
conducted), as is typically done (Rogelberg and Stanton
2007), researchers might proactively use response rate
guidelines when designing their survey study by deciding
upfront which techniques they will use for attaining a
desirable response rate for a specific population of
respondents.
Response Enhancing Techniques
The literature is rife with studies that investigate techniques
for influencing response to surveys. These techniques have
been integrated in what has become known as the ‘‘tailored
design method’’ (TDM; Dillman 2000; previously referred
to by Dillman as the ‘‘total design method’’). The TDM
336 J Bus Psychol (2010) 25:335–349
123

encompasses a number of rigorous techniques and steps
that, when accurately followed, are proposed to increase
survey response rates considerably. Roth and BeVier
(1998) also identified additional techniques that are effec-
tive in organizational research. Together, nine techniques
are assumed to be effective for increasing response rates.
A first technique that has been found to be effective in
enhancing response rates is advance notice (Edwards et al.
2002; Fox et al. 1988; Roth and BeVier 1998; Yammarino
et al. 1991). When using advance notice, researchers notify
their participants in advance that they will receive a survey
to complete. Prenotification is assumed to be effective
because it has the same effect as foot-in-the-door tech-
niques derived from self-perception procedures. Partici-
pants implicitly comply with an initial, reasonable request
to ‘‘help the researcher.’’ When the actual questionnaire
arrives, some individuals will feel obligated to follow-up
on their apparent commitment, even when this commit-
ment is to an unfamiliar external source (Allen et al. 1980).
Second, follow-up consists of contacting participants
that have not yet responded to the survey to remind and
encourage them to participate. Follow-up should not only
be effective in reminding participants but also underscores
the importance of the questionnaire and instills some form
of regret or guilt in the participant (Paxson 1995). In line
with this reasoning, follow-up procedures have generally
been found to be effective in enhancing response rates
(Edwards et al. 2002; Fox et al. 1988; Yammarino et al.
1991; Yu and Cooper 1983).
Third, monetary incentives or gifts have also been found
to enhance response rates (Edwards et al. 2002; Church
1993; Hopkins and Gullickson 1993; Yammarino et al.
1991). Including an incentive to complete the questionnaire
may help in attracting the attention of participants, but may
also instill some from of guilt. Participants may feel
obliged to reciprocate and compensate the freely given gift
by putting in effort and participate in the survey (Gendall
et al. 1998).
Fourth, several researchers have found that when the
survey topic is highly relevant to the population surveyed,
higher response rates can be obtained than when partici-
pants are not interested in the topic (Edwards et al. 2002;
Heberlein and Baumgartner 1978; Roth and BeVier 1998).
Topic salience is a type of interaction between target
population and researcher interest, and is assumed to result
in high motivation and involvement of the participants.
The fifth technique, i.e., frequently used, is personali-
zation. By personally addressing participants in a cover
letter or by including a personal signature at the end of the
cover letter, researchers may convey the importance of
their participation to the participants and they may start
building a personal relationship with the participants.
Personalization has also been found to be effective in
increasing response rates (Yammarino et al. 1991; Yu and
Cooper 1983).
Sixth, some studies have found that preserving the
anonymity of participants using identification numbers
may increase response rates (McKee 1992; Roth and
BeVier 1998). This technique may lead participants to feel
safe because their identity is not compromised, while at the
same time they remain accountable for responding as they
may be contacted for follow-up through the identification
code (Dillman 1978).
Seventh, Dillman (2000) suggested that university
sponsorship of the survey would increase response rates
due to potential past benefits and experiences that respon-
dents might have received from the university. Potential
collaboration between the surveying organization and the
university may lead to a more neutral, confidential, and
credible image of the survey initiative. Several studies
found that mentioning university involvement or collabo-
ration with a university was beneficial for response rates
(Bruvold et al. 1990; Edwards et al. 2002; Fox et al. 1988).
Eighth, a key variable determining response rates is
whether the survey was mailed or not to the respondents.
Mailed surveys yield a considerably lower response rate
than surveys that are distributed personally (Roth and
BeVier 1998). Social exchange theory suggests that building
a relationship between the researcher and the potential par-
ticipant in survey research can decrease psychological costs
and increase rewards for respondents (Dillman 2000). In
addition, personally handing-out surveys may lead to more
accountability or perceived accountability.
Nineth, in the last decade, organizational researchers
have increasingly relied on Internet technology as a means
for administering surveys. Advantages of using the Internet
include cost savings associated with eliminating the print-
ing and mailing of survey instruments and having returned
survey data already in an electronic format. One line of
thought, however, has suggested that using electronic
administration modes may result in lower response rates
due to concerns of Internet security, the receipt of elec-
tronic ‘‘junk mail’’ or ‘‘spam’’, and lack of personal rela-
tionship between researcher and respondents (Sills and
Song 2002). Although few studies in organizational con-
texts have directly addressed this issue, initial evidence
attests to lower response rates for online administration
modes in comparison with more traditional paper-and-
pencil administration (Converse et al. 2008; Shih and Fan
2008).
Differential Prediction Across Respondent Groups
The third objective of the current study was to examine
hypotheses about the differential prediction of specific
J Bus Psychol (2010) 25:335–349 337
123

response enhancing techniques across respondent types.
The idea that response enhancing techniques may have a
different effect depending on the respondent group sur-
veyed is based on leverage-salience theory (Groves et al.
2000). This theory suggests that a single survey design
attribute will have different ‘‘leverages’’ on the cooperation
decision for different persons. The theory further stipulates
that the activation of the potential leverage depends on
whether the attribute is made salient to the sample person
during the survey request. Thus, different design alterna-
tives may be attractive to different subgroups. For example,
for some individuals, the topic may be important; for
others, whether a reputable organization is conducting the
survey may be significant; and for still others, a chance to
receive a cash reward may be of consequence.
In line with this framework, we distinguished five dif-
ferent respondent groups (non-working respondents, con-
sumers, non-managerial employees, managers, and top
executives) that are typically involved in survey research in
organizational science on the basis of a taxonomy of work
categories (Applebaum 1986). We identified relevant char-
acteristics for each of these respondent groups and developed
hypotheses regarding the response enhancing techniques that
would be more and less effective for each respondent type in
comparison to the total group of respondents.
A first group of respondents are individuals that are not
employed at the time of survey (e.g., students, retired indi-
viduals, and job seekers). Given their non-working status,
we expect these individuals to be generally more concerned
about financial issues (Creed and Klisch 2005). As a result,
any (monetary) incentives that are provided during survey
process may attract more attention than in the other groups
leading to a stronger effect of incentives on response for this
group. In contrast, we expect that topic salience will be less
effective for this group. Other respondent groups (e.g.,
employees) may be highly involved to represent their
organization on salient issues toward external parties.
However, for non-working respondents, highly salient
issues are, for instance, surveys focusing on their position on
the labor market. As noted by Van den Berg et al. (2006,
p. 586): ‘‘Discouraged job seekers may have difficulties
finding a job and may be less inclined to participate in a
survey, especially when this survey is about job search
behavior and labor market prospects’’. Thus, it is assumed
that it is more difficult to attract respondents’ attention by
presenting a highly relevant survey topic.
H1: Incentives will have a more enhancing effect on
response rates for non-working respondent types than in the
total group of respondents.
H2: Topic salience will have a less enhancing effect on
response rates for non-working respondents than in the
total group of respondents.
A second group of respondents are individuals who are
surveyed as users/consumers of specific products/services
(‘‘consumers’’). In contrast to employees in an organiza-
tion, consumers may not be as closely involved with the
organization, and may have had fewer chances to develop a
personal relationship with organizations. Therefore, we
expect that personalization of the questionnaire will lead to
better relationship-building and may yield more positive
effects on response rates than in other respondent groups.
In contrast, we expect that explicitly mentioning sponsor-
ship will have less strong effects for this respondent group.
The effect of sponsorship is believed to result from pre-
vious experiences and benefits respondents may have
experienced from working with university researchers
(Dillman 2000). In organizations, collaboration with uni-
versity partners may be more institutionalized and may be
more visible and promoted yielding more favorable
responses. In contrast, the contacts and experiences con-
sumers had with researchers may be more transient in
comparison with the employees of an organization.
H3: Personalization will have a more enhancing effect on
response rates for consumers than in the total group of
respondents.
H4: Sponsorship will have a less enhancing effect on
response rates for consumers than in the total group of
respondents.
A third group of respondents are working employees
that have no supervisory or managerial responsibilities in
the organization (e.g., blue collar workers and profession-
als). For this group, we expect that using a web-based
administration mode such as e-mail or online question-
naires may results in higher response rates than in the
overall group. First, in comparison with managerial groups,
these employees may receive less emails, requests for
surveys, and may have more time to respond to their emails
or complete questionnaires during company time (Cycyota
and Harrison 2006). Second, employees may be easier to
reach via email than consumers or non-working respon-
dents. For the non-managerial group, we expect that
incentives will be less beneficial than the overall group of
respondents. While incentives are generally argued to lead
to higher response rates, we expect that these effects will
be less strong for paid employees in an organization. Given
that employees are already compensated for their work in
the organization, organizational respondents are likely to
require higher incentives to affect the same change in
response due to the competing demands placed on
respondents’ working day, the value they place on their
time, and, possibly, their perception of the value of the
information to the survey sponsor. In addition, as suggested
by intrinsic motivation research (Deci et al. 1999), there
338 J Bus Psychol (2010) 25:335–349
123
might be a trade-off between providing incentives and the
intrinsic interest in completing a questionnaire. The interest
in the topics surveyed is likely higher in an organizational
sample as the questions often directly relate to their work
situation. Offering an additional incentive to complete the
questionnaire may decrease this intrinsic motivation.
Indeed, Groves et al. (2004) found that the tendency for the
‘‘interested’’ to cooperate more readily with a research
survey was diminished when monetary incentives were
provided. This would also explain why Roth and BeVier
found no relationship between incentives and response
rates (r = -.04, ns.) in their meta-analysis of organiza-
tional research.
H5: Web-based administration will have a more enhanc-
ing effect on response rates for non-managerial employees
than in the total group of respondents.
H6: Incentives will have a less enhancing effect on
response rates for non-managerial employees than in the
total group of respondents.
A fourth group are employees with supervisory (e.g.,
when they supervised the actual work carried on within the
organization) or managerial responsibilities (e.g., respon-
dents directing subdivisions or subgroups within a com-
pany). For this group, we expect that emphasis on
university sponsorship may result in higher response rates
in comparison to the overall group. Managers and super-
visors may be more sensitive to the involvement of a
university partner as they may be aware that such collab-
orations may have beneficial effects for the company and
their group (Bonaccorsi and Piccaluga 1994). In addition,
managers often take part in MBA classes or are involved in
alumni associations from universities. As they have more
responsibilities and a higher position in the organization,
they may feel more accountable and responsible toward the
university for the collaboration. As argued before for the
employee group, we also expect that incentives will be less
effective in the managerial respondent group.
H7: Sponsorship will have a more enhancing effect on
response rates for managerial employees than in the total
group of respondents.
H8: Incentives will have a less enhancing effect on
response rates for managerial employees than in the total
group of respondents.
The final group consisted of top executives defined as
organizational representatives predominantly concerned
with the position and relationships of the organization in
the total economic and social-institutional setting. Top
executives have proven to be a difficult group to reach
through survey efforts. In a meta-analysis of published
studies, Cycyota and Harrison (2006) found that topic
salience was the only traditional technique that was
effective in enhancing response rates. Given the tight
schedule of top executives, they may put in effort in par-
ticipating only in surveys that have direct consequences for
their business and responsibilities (e.g., current trends or
environmental threats). Similar to the two previous orga-
nizational groups, we expect that incentives will be less
beneficial in top executive groups. Any incentive would
seem negligible in comparison to the normal earnings of
this group.
H9: Salience will have a more enhancing effect on
response rates for top executives than in the total group of
respondents.
H10: Incentives will have a less enhancing effect on
response rates for top executives than in the total group of
respondents.
Method
Selection and Identification of Journals
We tried to include response rates published in a variety of
journals from different organizational research traditions.
An exclusive focus on top-tier journals may restrict the
range of the observed response rates and may lead to
upwardly biased estimates of response rates. Therefore, we
included both top-tier and lower-tier journals. In addition,
we also broadened the scope of research traditions included
in response rate summaries by including journals reporting
survey research in Marketing. Combining response rates
from three different research traditions (i.e., I/O Psychol-
ogy, Management, and Marketing) should be especially
worthwhile, as all three disciplines rely heavily on survey
methodology research in organizational settings, but
sometimes have a different focus. For instance, survey
research in Marketing may involve more consumers as
respondent types than Management and I/O psychology
traditionally do.
The top-tier journals included in this study were selected
on the basis of the highest citation counts as reported by the
Journal Citations Report of the Institute for Scientific
Information (ISI). Citation counts form an important and
stable indicator of journal prestige (Anseel et al. 2004).
Top-tier journals were considered to be part of the 20%
most-cited journals in their respective disciplines, as
reported by ISI Journal Citation Reports. On the basis of
this criterion, we selected two journals from the ISI cate-
gory Psychology, Applied: Journal of Applied Psychology
and Personnel Psychology, two journals from the ISI cat-
egory Management: Academy of Management Journal and
Administrative Science Quarterly, and two marketing
J Bus Psychol (2010) 25:335–349 339
123
journals from the ISI category Business: Journal of
Marketing and Journal of Marketing Research. Note that
these journals have constantly been ranked into the 20%
most-cited journals in their respective categories from the
moment Journal Citation Reports data have become
available.
For the lower-tier journals, we selected journals that
have not been continuously included in the Journal
Citation Report of ISI in the period under study (1995–
2008).1 Thus, citation counts were not available for these
journals. Among the journals that complied with this
criterion, we identified journals that publish research
within the same content areas as the top-tier journals to
keep the domain constant and randomly selected four
journals: European Journal of Work and Organizational
Psychology and Journal of Managerial Psychology in the
category I/O Psychology, Journal of Management
Development and Journal of Managerial Issues in the
category Management, and European Journal of
Marketing and International Review of Retail, Distribu-
tion and Consumer Research in the category Marketing.
Together, we believe this set of journals provides an
appropriate mix of survey research conducted and pub-
lished in organizational science. After identification of the
journal set, all back issues from 1995 to 2008 of these
journals were retrieved. Editors, publishers, and interna-
tional libraries were contacted and back issues were
ordered when they were not readily available in paper or
electronic version. All issues originally identified were
eventually collected for coding. A list of all studies
retrieved is available from the authors.
Inclusion Criteria
The following criteria for inclusion were used. First,
studies had to be published in the period 1995–2008, and
had to use a survey methodology. Second, information to
calculate a response rate had to be available. Third, only
written and web-based surveys (as opposed to face-to-face
or telephone surveys) were included. Surveys reporting a
response rate of 100% were checked if they were lab or
scenario studies (e.g., in training) with obligatory
response. When survey participation was obligatory, sur-
veys were also excluded from the analyses. A total of
2,037 studies from 1,761 articles met our criteria. The
coded studies reflected a total of 1,251,651 individual
respondents.
Coding
Given the large amount of studies to be coded, the entire
set of studies was split in three subsets with a team con-
sisting of one co-author and a research assistant coding two
subsets. A third rigorously trained research assistant coded
the third subset of studies published during the period
2004–2008. The coders made judgments about the pres-
ence, absence, or indeterminate nature of each of the
response enhancing techniques in a study. Thus, a design
matrix was constructed in which nine response enhancing
techniques were indicated by a dichotomous variable
(used = 1; not used = 0) or ordinal variable (1 = low
salience, 2 = moderate salience, 3 = high salience) for
each of the 2,037 survey studies. Based on a taxonomy of
work categories (Applebaum 1986), we also coded five
different respondent types: non-working respondents
(N = 107), consumers (N = 149), non-managerial
employees (N = 621), managers (N = 357), and top
executives (N = 240). Studies that relied on samples con-
sisting of various types of respondents were coded as
mixed (N = 563).
We closely followed coding and analytical procedures
outlined by Cycyota and Harrison (2002), and Roth and
BeVier (1998) to facilitate comparability of results. Similar
to their analyses, each study served as one data point in our
analyses. Inability to determine the presence of an inde-
pendent variable was coded as a missing value (e.g.,
in situations where conflicting or vague cues were given
such as ‘‘efforts were undertaken to increase the response
rate’’). In all other cases, presence of the technique was
coded 1, and absence was coded 0. When no mention was
made of a technique, our coding defaulted to 0 (Cycyota
and Harrison 2002; Roth and BeVier 1998). When authors
stated that they followed Dillman’s (1978) TDM pre-
scriptions, incentive, advanced notice, follow-up, and per-
sonalization were coded as 1. When there was more than
one round of data collection (longitudinal studies), only the
first round response rate was used (see also Baruch 1999).
Detailed description of the coding rules is available from
the authors.
After independent coding, the coders of the first two sets
met to resolve discrepancies by reaching consensus on the
correct coding. Inter-rater agreement was satisfactory.
Cohen’s kappas for the response enhancing techniques
ranged between .76 and .91. An exception was salience
(Cohen’s kappa = .38), indicating that the coders agreed
less on whether a topic was salient or not. Roth and BeVier
(1998) found a similarly low inter-rater agreement (.45) in
coding salience. In cases when no agreement on the correct
coding could be obtained, a third coder was consulted to
resolve disagreement. The low inter-rater agreement is not
only due to the subjective nature of salience but also to the
1 European Journal of Work and Organizational Psychology, and
Journal of Managerial Psychology have been included in ISI Web of
Science in 2005 and 2008, respectively.
340 J Bus Psychol (2010) 25:335–349
123

lack of information available as studies rarely included
information on the salience of the variables.
Results
Descriptive Statistics and Expected Response Rates
Means, standard deviations, correlations of response rates,
and coded response enhancing techniques are reported in
Table 1. Our first objective was to compare expected
response rates for different respondent types. A one-way
ANOVA showed that type of respondent affected response
rates, F(5, 2013) = 47.23, p \ .01, g2 = .11. Pairwise
comparisons showed that non-working (61.5%) and non-
managerial respondents (59.6%) had a significantly higher
response rate than the other categories (p \ .01). Next, the
consumer respondents (44.1%) and managerial respondents
(47.1%) had a significantly higher response (p \ .01) rate
than the top executive respondents (37.0%). We followed
the same approach as Roth and BeVier (1998) and sum-
marized response rates by reporting percentiles from the
90th through the 10th percentile level on the basis of pre-
vious response rates. These percentiles for response rates
can be found in Table 2. General estimates are separately
reported for mailed paper-and-pencil and web-based sur-
veys, and personally distributed surveys, and broken down
for the five identified respondent categories. We did not
include the sixth ‘‘mixed’’ category in Table 2 because this
group is relatively uninformative for researchers. Reporting
response rates for mailed versus personally distributed
surveys was warranted given the large effect size of
mailing surveys (M = 44.1%, SD = 21.8%) versus not
mailing surveys (M = 62.9%, SD = 23.2%), p \ .01,
d = .84.
Response Rate Trends
Our second objective was to examine response rate trends
over time. As can be seen in Table 1, the zero-order cor-
relation between response rate and survey year showed that
no direct decline in response rates over the years analyzed
(r = -.01, ns). However, caution is needed as the
increased use of response enhancing techniques over the
years might have compensated for a potential decline in
response rates. Inspection of the correlations in Table 1
shows that, over the years, researchers have relied less on
postal questionnaires, more on advance notice, incentives,
identification numbers, web-based administration, and
sponsorship. As shown before, all of these response
enhancing techniques are associated with higher response
rates. Thus, a more appropriate analytical strategy might be
to control for the increased use of response enhancing
techniques when examining response rate trends over time.
When controlling for these techniques, we found a signif-
icant negative effect of survey year on response rate,
b = -.10, p \ .01 (DR2 = .01, p \ .01). We also exam-
ined possible curvilinear trends over time, but found no
significant curvilinear relationship between survey year
and response rates.
Given that trends in response enhancing techniques
seem to affect response rates trends, we also explored
whether the efficacy of specific techniques for increasing
response rates changed over the years. In order to this end,
we conducted a hierarchical regression with the main
effects of the response enhancing techniques and survey
Table 1 Descriptive statistics and correlation coefficients
M SD 1. 2. 3. 4. 5. 6. 7. 8. 9. 10.
1. Advance notice .23 .42
2. Follow-up .31 .46 .12**
3. Incentives .18 .38 .09** .11**
4. Personalization .39 .49 .33** .17** .09**
5. Salience 1.81 .70 .08** -.01 .00 .02
6. Identification number .25 .33 .05* -.08** .07** -.01 .05*
7. Sponsorship .35 .48 .01 -.06* .04 .02 .01 .10**
8. Survey mailed .61 .49 -.01 .32** -.05* -.11** -.03 -.22** -.19**
9. Administration mode .05 .22 .06** -.01 .10** -.05 .03 .16** .08** -.20**
10. Year of survey 8.17 3.94 .07** -.04 .09** .03 .04 .28** .15** -.22** .26**
11. Response Rate 52.34 23.96 .08** -.25** -.04 .14** .07** .18** .11** -.38** -.02 -.01
Note: Pairwise sample sizes ranged from 1551 to 2037. Nominal variables were coded 0 (not present) or 1 (present). Salience was coded 1 (low),
2 (moderate), or 3 (high). Administration mode was coded 0 (paper-and-pencil) or 1 (web-based). Year of survey was coded as an ordinal
variable ranging from 1 (1995) to 14 (2008). * p \ .05, ** p \ .01
J Bus Psychol (2010) 25:335–349 341
123

year in a first step and the interaction terms between each
of the response enhancing techniques and survey year in a
second step. The set of interaction terms between survey
year and each of the response enhancing techniques
explained a significant amount of variance beyond the main
effects of the response enhancing techniques and survey
year (DR2 = .01, p \ .01). Close inspection of the
regression coefficients for each of the interaction terms,
showed that the efficacy of advance notice (p \ .01), fol-
low-up (p \ .01), and mailing surveys (p \ .01) signifi-
cantly declined whereas the efficacy of personalization
significantly increased (p \ .01).
Response Enhancing Techniques
Our third objective was to examine the hypothesized
effects of various response enhancing techniques on
response rates across respondent types. Table 1 shows that
advance notice (r = .08, p \ .01), personalization (r =
.14, p \ .01), topic salience (r = .07, p \ .01), identifica-
tion numbers (r = .18, p \ .01), sponsorship (r = .11,
p \ .01), and personally distributing surveys (r = .38,
p \ .01) were positively associated with response rates.
The use of follow-ups was negatively related to the
reported response rate (r = -.25, p \ .01). Incentives and
web-based administration were unrelated to response rates.
In order to control for intercorrelations between the inde-
pendent variables, we further examined the effect of the
response enhancing techniques on response rates using
multiple regression analysis. As can be seen in the test
of the first model in Table 3, advance notice (b = .06,
p \ .05), follow-up (b = -.16, p \ .01), incentives
(b = -.05, p \ .05), personalization (b = .11, p \ .01),
salience (b = .05, p \ .05), identification numbers
(b = .09, p \ .01), sponsorship (b = .05, p \ .05), mail-
ing surveys (b = -.31, p \ .01), and web-based adminis-
tration (b = -.06, p \ .05) were all significant predictors
of response rates and explained 20% of variance in total.
In order to examine whether respondent type explained
additional variance in response rates beyond the response
enhancing techniques, we tested a second model where
four effect coded variables reflecting the five identified
respondent types (non-working, consumers, non-manage-
rial, managerial, and top executives) were included in a
second step of a hierarchical regression analysis. Given that
we used four unweighted effects coded variables to rep-
resent the five respondent types, group comparisons are
made in reference to the mean. When coding the variables,
we used the non-working group as the ‘‘focal’’ or ‘‘base’’
group. As can be seen in Table 3 (Model 2), respondent
type explained a significant amount of variance beyond the
response enhancing techniques (R2 = .06, p \ .01).
Table 2 Expected response rates for mailed, personally distributed surveys and different respondent types
Percentile All respondents
(%)
Non-working
respondents (%)
Consumer
respondents (%)
Non-managerial
respondents (%)
Managerial
respondents (%)
Top-management
(%)
Mailed surveys (paper-and-pencil and web-based)
90 78 84 67 86 75 60
80 66 71 51 79 63 48
70 56 65 42 71 54 42
60 48 56 37 60 44 37
50 41 47 32 51 37 31
40 35 40 29 46 30 25
30 29 35 23 40 24 23
20 23 26 21 32 20 20
10 19 18 18 22 17 14
Personally distributed surveys
90 91 93 89 92 87 93
80 86 89 81 88 83 79
70 80 81 75 83 72 75
60 75 77 66 76 67 37
50 68 74 58 69 58 36
40 60 67 52 63 56 33
30 52 55 47 57 51 30
20 44 45 31 47 45 28
10 33 30 15 38 39 18
Note: Percentages are unit weighted
342 J Bus Psychol (2010) 25:335–349
123

In order to test our hypotheses, we examined the sig-
nificance of the specific hypothesized two-way interactions
between the respondent types and the response enhancing
techniques. We tested interactions between respondent
groups for each response enhancing technique separately to
facilitate interpretation, as an overall test of all two-way
interaction effects would include 32 interaction terms in
total. As recommended by Aguinis (2004), the specific
regression coefficients corresponding to hypothesized
interactions were interpreted only when the omnibus test of
the family of interactions (e.g., all interactions between
respondent groups and a specific technique) explained a
significant amount of variance (p \ .01) beyond the pre-
viously identified main effects. In Table 3, we reported the
results for the five models (out of nine models tested) that
explained 1% (p \ .01) additional variance beyond the
main effects of the response enhancing techniques and the
effects coded variables representing respondent groups.
Given that we chose the non-working respondents as the
focal group in the effects coding, this group is not com-
pared to the overall mean in Table 3. This test can be
accomplished most simply using another unweighted
Table 3 Results of regression analyses for effect of response enhancing techniques and respondent type on response rates
Variable Main
effects
response
techniques
(Model 1)
Main effects
of respondent
type
(Model 2)
Interaction
respondent
type
by incentives
(Model 3)
Interaction
respondent
type
by salience
(Model 4)
Interaction
respondent
type by
identification
(Model 5)
Interaction
respondent
type by
sponsorship
(Model 6)
Interaction
respondent
type by
administration
mode (Model 7)
Main effects
Advance notice .06*
Follow-up -.16**
Incentives -.05*
Personalization .11**
Salience .05*
Identification
number
.09**
Sponsorship .05*
Mail survey -.31**
Administration
mode
-.06*
Additive main effects
Z1 -.06
Z2 .21**
Z3 -.04
Z4 -.17**
Interaction effects
Z1 9 Model
technique
.06 -.19* -.07 -.12** -.06
Z2 9 Model
technique
-.08* .06 .05 .02 .21**
Z3 9 Model
technique
-.04 .17* .14** .07* -.04
Z4 9 Model
technique
-.07* .19* -.03 .01 -.18**
F 41.12 21.19 3.44 3.37 4.20 3.60 3.27
df 1474 1069 1065 1065 1065 1065 1065
DR2 .20** .06** .01** .01** .01** .01** .01**
Note: Summary of the results of two-way interactions between respondent types and response techniques. Model 2 includes the main effects of
Model 1. Model 3–7 include the main effects of Model 1 and Model 2. Interactions between the respondent groups and techniques are reported
for each technique separately to facilitate interpretation. Only the results for the five interaction models (out of nine tested) that explained a
significant amount of variance beyond the main effects are reported. The five respondent types (non-working, consumers, non-managerial,
managerial and top management) are unweighted effects coded in Z1, Z2, Z3, Z4 with the non-working respondents as focal group. All regression
coefficients are standardized coefficients. * p \ .05. ** p \ .01
J Bus Psychol (2010) 25:335–349 343
123

effects coding with a different reference group (Cohen
et al. 2004). In the alternative coding scheme, we coded the
managerial respondents as focal coding group (detailed
results for the alternative coding scheme are available from
the authors).
For the non-working respondents, Hypothesis 1 pre-
dicted that incentives would have a more enhancing
effect, whereas Hypothesis 2 predicted that salience
would have a less enhancing effect on response rates in
comparison to the total group of respondents. In line with
our hypotheses, results showed that a significant positive
coefficient on the interaction coefficient for incentives by
non-working respondents (b = .13, p \ .01) and a sig-
nificant negative coefficient for salience by non-working
respondents (b = -.07, p \ .05). As can be seen in
Fig. 1, this means that the slope for incentives on
response rates was more positive and, as indicated in
Fig. 2, the slope for salience was more negative than the
mean slope over all groups.
For the consumer respondents, Hypothesis 3 predicted
that personalization would have a more enhancing effect,
whereas Hypothesis 4 predicted that sponsorship would
have a less enhancing effect on response rates in com-
parison to the total group of respondents. Interactions
between respondent groups by personalization did not
explain a significant amount of additional variance
beyond the main effects, thus hypothesis 3 was not sup-
ported. As can be seen in Table 3, interactions between
respondent groups and sponsorship explained additional
variance beyond the main effects (DR2 = .01, p \ .01)
including a significant Z1 by sponsorship interaction term
(b = -.12, p \ .01). As shown in Fig. 3, this indicated
that the slope for sponsorship on response rates for con-
sumers was less positive than for the overall group,
supporting Hypothesis 4.
For the non-managerial employees, Hypothesis 5 pre-
dicted that web-based administration would have a more
enhancing effect, whereas Hypothesis 6 predicted that
incentives would have a less enhancing effect on response
rates in comparison to the total group of employees. In line
with these hypotheses, results showed that a significant
positive coefficient on the interaction coefficient Z2 by
administration mode (b = .21, p \ .01) and a significant
negative coefficient Z2 by incentives (b = -.08, p \ .05).
As can be seen in Fig. 4, this indicates that the slope for
web-based administration on response rates was more
positive and, as can be seen in Fig. 5, the slope for
incentives was more negative than the mean slope over all
groups.
For the managerial group, Hypothesis 7 predicted that
sponsorship would have a more enhancing effect, whereas
Hypothesis 8 predicted that incentives would have a less
enhancing effect on response rates in comparison to the
total group of employees. Results showed that a significant
positive coefficient on the Z3 by sponsorship term
20
25
30
35
40
45
50
55
60
65
No incentive IncentiveResponse-enhancing technique
Total group of respondents
Non-working respondents
Fig. 1 Effect of incentives on response rate for non-working
respondents in comparison to the total group of respondents
(Hypothesis 1)
20
25
30
35
40
45
50
55
60
65
No salience Salience
Response-enhancing technique
Total group of respondents
Non-working respondents
Fig. 2 Effect of salience on response rate for non-working respon-
dents in comparison to the total group of respondents (Hypothesis 2)
20
25
30
35
40
45
50
55
60
65
No sponsorship Sponsorship
Response-enhancing technique
Total group of respondents
Consumers
Fig. 3 Effect of sponsorship on response rate for consumers in
comparison to total group of respondents (Hypothesis 4)
344 J Bus Psychol (2010) 25:335–349
123
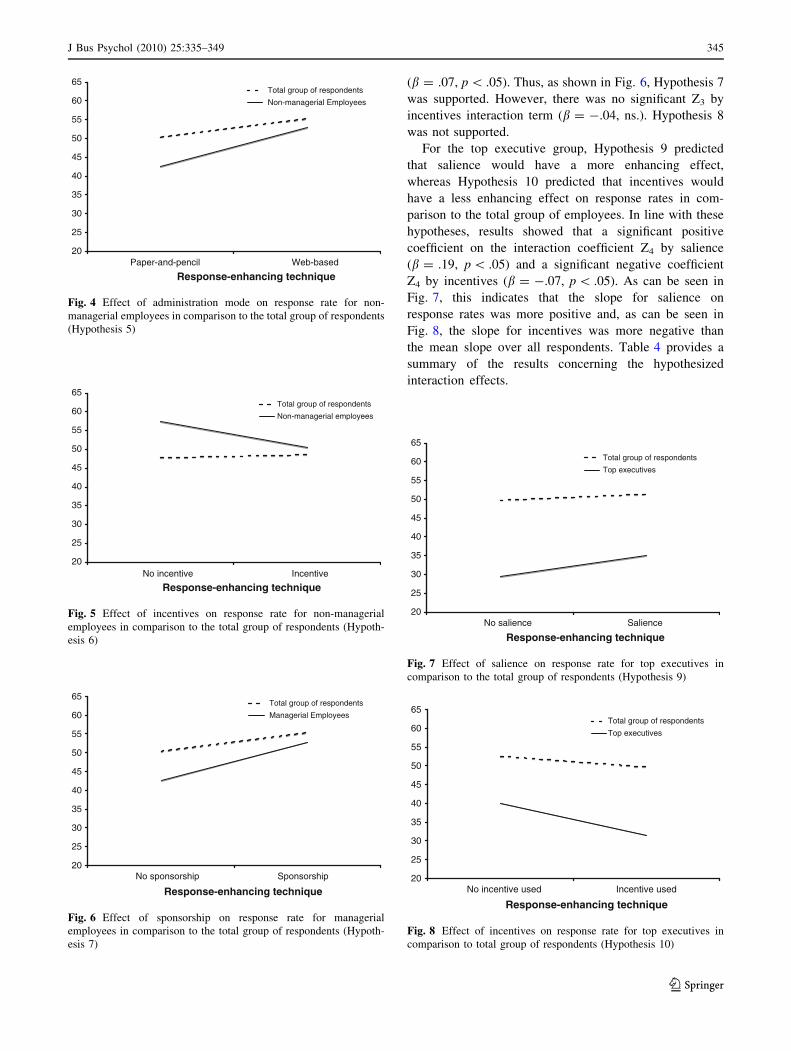
(b = .07, p \ .05). Thus, as shown in Fig. 6, Hypothesis 7
was supported. However, there was no significant Z3 by
incentives interaction term (b = -.04, ns.). Hypothesis 8
was not supported.
For the top executive group, Hypothesis 9 predicted
that salience would have a more enhancing effect,
whereas Hypothesis 10 predicted that incentives would
have a less enhancing effect on response rates in com-
parison to the total group of employees. In line with these
hypotheses, results showed that a significant positive
coefficient on the interaction coefficient Z4 by salience
(b = .19, p \ .05) and a significant negative coefficient
Z4 by incentives (b = -.07, p \ .05). As can be seen in
Fig. 7, this indicates that the slope for salience on
response rates was more positive and, as can be seen in
Fig. 8, the slope for incentives was more negative than
the mean slope over all respondents. Table 4 provides a
summary of the results concerning the hypothesized
interaction effects.
20
25
30
35
40
45
50
55
60
65
Web-basedPaper-and-pencil
Response-enhancing technique
Total group of respondents
Non-managerial Employees
Fig. 4 Effect of administration mode on response rate for non-
managerial employees in comparison to the total group of respondents
(Hypothesis 5)
20
25
30
35
40
45
50
55
60
65
No incentive Incentive
Response-enhancing technique
Total group of respondents
Non-managerial employees
Fig. 5 Effect of incentives on response rate for non-managerial
employees in comparison to the total group of respondents (Hypoth-
esis 6)
20
25
30
35
40
45
50
55
60
65
No sponsorship Sponsorship
Response-enhancing technique
Total group of respondents
Managerial Employees
Fig. 6 Effect of sponsorship on response rate for managerial
employees in comparison to the total group of respondents (Hypoth-
esis 7)
20
25
30
35
40
45
50
55
60
65
No salience Salience
Response-enhancing technique
Total group of respondents
Top executives
Fig. 7 Effect of salience on response rate for top executives in
comparison to the total group of respondents (Hypothesis 9)
20
25
30
35
40
45
50
55
60
65
No incentive used Incentive used
Response-enhancing technique
Total group of respondents
Top executives
Fig. 8 Effect of incentives on response rate for top executives in
comparison to total group of respondents (Hypothesis 10)
J Bus Psychol (2010) 25:335–349 345
123

Discussion
Main Conclusions
Our first objective was to examine expected response rates
across respondent groups. Our conclusion is that the
average response rates indeed vary depending on the
respondent type. Response rates that can be expected when
surveying top executives are lower than when surveying
consumers or managers. In turn, these response rates can be
expected to be lower than non-working respondents or non-
managerial employees. This extends previous findings
reporting a mean response rate of 34% to mailed surveys
for top executives (Cycyota and Harrison 2006) and 35.7%
for organizational respondents (Baruch and Holtom 2008).
Our findings indicate that expected response rates do differ
not only for top executives but also for other respondent
types. On the one hand, it seems that the higher respon-
dents are situated in the organizational hierarchy, the
harder it may be to persuade them to respond to surveys.
On the other hand, it seems that consumers are equally hard
to involve in survey research as managerial respondents.
Our findings can also be compared to the results of Cycyota
and Harrison. Similar to their findings, we found a mean
response rate of 35.0% (SD = 17.5%) for mailed surveys
to top executives.
Our second objective was to examine response rate
trends over time. The average response rate we obtained
(52.3%) was lower than the average response rate of 57%
reported by Roth and BeVier (1998). This finding suggests
that a slight decline in response rates in the years following
the analyses of Roth and BeVier (1998). These percentages
should be compared with caution, of course, as different
journals were analyzed in the study of Roth and BeVier
(1998), making direct comparison difficult. Our own
analyses show a complicated picture of response rate
trends. At first sight, there seems to be no decline in
response rates over the years, as we found no significant
direct association between response rate and publication
year. However, our results show that, when controlling for
the use of response enhancing techniques, response rates
were indeed declining. Thus, it might be that, over the
years, researchers experienced slowly declining survey
response rates and tried to anticipate these lower response
rates using response enhancing techniques more exten-
sively. As a result, the increased use of response enhancing
techniques seems to have compensated for a potential
decline in response rates. Previously, researchers have
expressed concerns that ‘‘the current survey mania tends to
cheapen and threaten the entire enterprise of surveying’’
(Dillman 2002, p. 479). Although our findings suggest that,
to date, the current decline is relatively minor, future
research should cautiously monitor these figures as survey
studies have become more sophisticated with more and
better response enhancing techniques. This might be a
threat when overuse of response enhancing techniques also
affects the efficacy of these techniques. This seems to be
implied by our findings that advance notice, follow-up, and
mailing have become less effective over the years.
Although respondents may have come less sensitive to
some response enhancing initiatives, these results also
point to a potential way out of this dilemma. In future
Table 4 Summary of tests of hypotheses
Non-working
respondents
Consumer
respondents
Non-managerial
respondents
Managerial
respondents
Top-management
Advanced notice ns. ns. ns. ns. ns.
Follow-up ns. ns. ns. ns. ns.
Incentives ? ns. - ns. -
(H1 supported) (H6 supported) (H8 not supported) (H10 supported)
Personalization ns. ns. ns. ns. ns.
(H3 not supported)
Salience - - ns. ? ?
(H2 supported) (H9 supported)
Identification ns. ns. ns. ? ns.
Sponsorship ns. - ns. ? ns.
(H4 supported) (H7 supported)
Mail survey ns. ns. ns. ns. ns.
Administration mode ns. ns. ? ns. ns.
(H5 supported)
Note: Entries indicate whether techniques had a stronger (?), weaker (-), or non-significant effect (ns.) on response rates in the specific
respondent group in comparison to their average effect across groups
346 J Bus Psychol (2010) 25:335–349
123

research, personal contact may be the most appropriate
strategy to contact respondents as personalization was
found to become more effective over the years.
Our third objective was to examine specific hypotheses
regarding the effectiveness of response enhancing tech-
niques for surveying specific respondent groups. First,
analyses across groups corroborated that advanced notice,
salience, personalization, identification numbers, sponsor-
ship, and not mailing surveys are the most beneficial
strategies for increasing response rates (see Roth and
BeVier 1998). One surprising finding was that follow-up
yielded a decrease in response rates as indicated by the
correlation and regression coefficients. Some previous
studies (Yammarino et al. 1991; Yu and Cooper 1983)
reported a significant positive relationship between follow-
up and response rates, whereas others found non-significant
(Roth and BeVier 1998) or negative relationships (Baruch
and Holtom 2008). A possible explanation is that there may
exist an inverse causal relationship between response rate
and use of follow-up. When researchers are confronted
with a low response rate, they may decide to send a final
reminder in hope of increasing the response rate. Thus, a
low response rate might lead to increased use of follow-up.
Although the zero-order relationship between incentives
and response rate was non-significant (similar to Baruch
and Holtom 2008), incentives appeared to have a negative
effect on response rates in a regression analysis. A similar
reversed causality mechanism might be responsible for this
unexpected finding. It might be that researchers double
their efforts and use more incentives in samples or surveys
where they expect low response rate. Future studies should
test this hypothesis by taking into consideration the
response rates obtained before and after follow-up and
incentives. The current study was also one of the first in the
organizational domain to evaluate the effects of web-based
survey administration. When controlling for other response
enhancing techniques, we found a negative effect of web-
based survey administration. Similar to previous studies
outside organizations (Converse et al. 2008; Shih and Fan
2008), researchers should anticipate somewhat lower
average response rates using Internet technologies in
comparison to more traditional paper-and-pencil surveys.
Next, in line with our hypotheses, results suggest that
response enhancing techniques have a differential impact
depending on the respondent group. Our results suggest
that (a) incentives are more effective for non-working
respondents, but less effective for non-managerial
employees and top executives, (b) salience is less effective
for non-working employees and more effective for top
executives, (c) sponsorship is more effective for managers
but less effective for consumers, and (d) web-based
administration is more effective in non-managerial samples
in comparison to the overall effects of these response
enhancing techniques in our sample. The finding that topic
salience was more effective for managerial respondents
than for the other groups is in line with the findings of
Cycyota and Harrison (2006). They reported that topic
salience was one of the only response enhancing tech-
niques that was effective for top executives.
Theoretical and Practical Implications
From a theoretical perspective, these findings are important
as they provide empirical evidence for the moderating role
of respondent type in the relationship between response
enhancing techniques and response rates. Our findings are
in line with the central tenets of leverage-salience theory
(Groves et al. 2000), which posits that people vary in the
importance they assign to different aspects of a survey
request. This theory has received emerging support in
public opinion research (e.g., Trussel and Lavrakas 2004),
but has received little attention in organizational research.
One of the key implications of this theory is that
researchers should try to understand how specific respon-
dent characteristics related to the underlying mechanisms
of each of the response enhancing techniques. We believe
the present study provides a first step supporting the use-
fulness of leverage-salience theory for better understanding
response mechanisms in organizations. However, the cod-
ing of respondent groups in published studies allows for
only general research hypotheses. Future research may
want to extend these findings by setting up experimental
studies to test more fine-grained hypotheses. A more
refined and elaborate taxonomy of respondent types might
yield a better understanding and more specific recom-
mendations to researchers. Future research may also
examine other response enhancing techniques that were not
included in this quantitative review (e.g., survey length,
social network).
From a practical perspective, the current findings should
be most relevant to aid academic survey researchers in
designing survey studies. After all, the results are based on
a large-scale summary of survey studies published in the
academic literature. Although the obtained results will also
be informative to practitioners such as survey consultants,
some caution is needed when generalizing these findings as
the specific role of practitioners might affect some of the
dynamics in the survey process. For instance, mentioning
sponsorship or providing incentives may lead to different
effects when a consulting firm rather than an academic
researcher is involved. A first important recommendation
for academic researchers designing a survey is to pay close
attention to the type of respondents targeted. For instance,
when considering the use of mail surveys for a consumer
sample they should be aware they might have to distribute
considerably more surveys than they would need to do for
J Bus Psychol (2010) 25:335–349 347
123
non-working or non-managerial employee samples to
obtain a similar sample size. A second recommendation is
that researchers should take customized measures to
enhance the response rate for their sample. For instance,
researchers might consider emphasizing the relevance of
the survey when surveying top executives, mentioning
sponsorship in surveys among managers, provide incen-
tives among unemployed respondents, and use web-based
procedures when targeting non-managerial employees.
Although most researchers would agree that certain
response enhancement techniques may be particularly
useful for certain groups, some might question the practical
help of these guidelines as it is generally recommended to
use all of the techniques in every circumstance anyway to
maximize response rates (Dillman 2000). Our results go
beyond this recommendation by showing that some tech-
niques are less effective in some respondent groups. If
researchers have to make decisions in which measure to
invest resources (e.g., incentives), the current findings may
be helpful. We summarized these guidelines for survey
researchers in Table 5.
Finally, an important point on how response rates
guidelines may be (mis)used in practice should be men-
tioned. Rogelberg and Stanton (2007, p. 197) cogently
argued against elusive ‘‘acceptable’’ response rates:
‘‘Although such descriptions put a response rate into con-
text, the fact that everyone else achieves 30, 40, or 50%
does not help to demonstrate that the reported research is
free from non-response bias.’’ We concur: A low response
rate does not necessarily entail non-response bias. Simi-
larly, a high response rate in comparison to the guidelines
reported in this study, does not mean that the sample
characteristics are unbiased.
The current response rate estimates are meant to serve as
a broad guideline giving researchers a general idea of the
average response rates that have been obtained in previous
research and the differential effectiveness of response
enhancing techniques. We emphasize that, rather than
using the current findings as a post-hoc evaluation of an
obtained response rate, these findings should primarily help
researchers in planning their studies. We believe that the
present study provides useful information to help them
a priori estimate the response rate they may expect to
obtain and thus, the number of surveys they will need to
send out to achieve a satisfactory statistical power. In any
case, the guidelines reported do not replace a rigorous non-
response analysis. Therefore, we encourage researchers to
conduct a formal analysis of potential non-response bias
(e.g., Rogelberg et al. 2003).
In sum, this study provides scholars with empirically
based guidelines regarding which response rates are typi-
cally obtained across different types of respondents and
which response enhancing techniques may be most effec-
tive. These findings should be helpful for researchers to
better plan survey studies and to attain the sample size
envisioned.
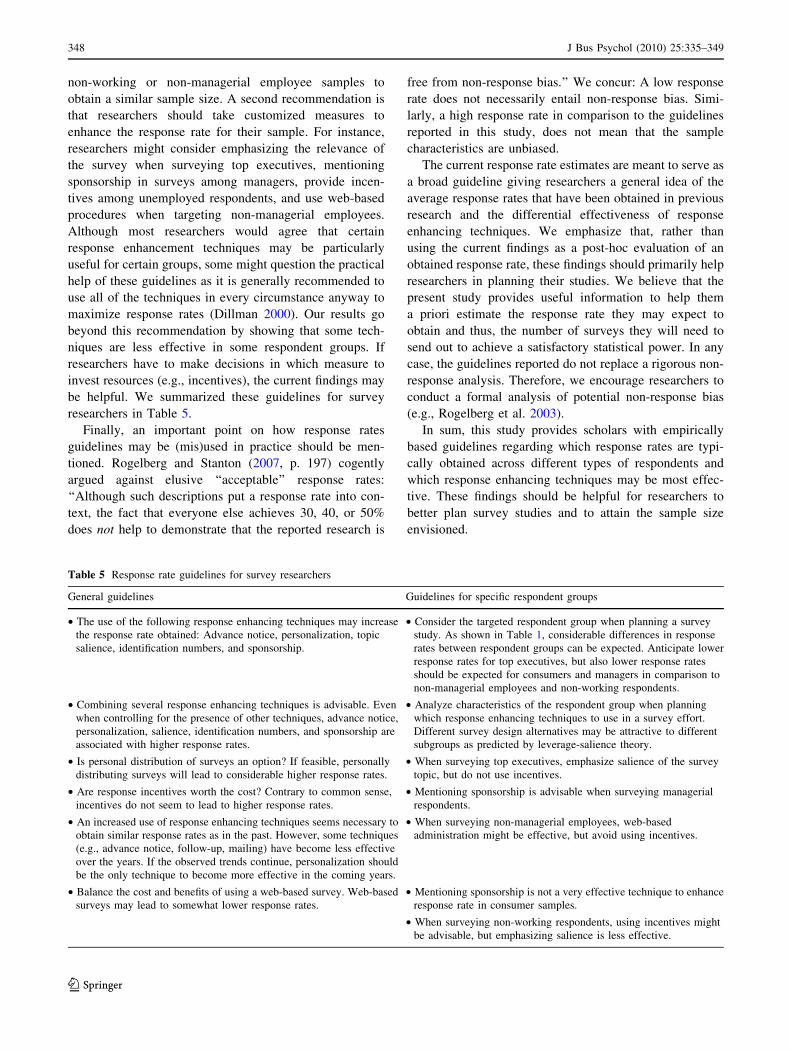
Table 5 Response rate guidelines for survey researchers
General guidelines Guidelines for specific respondent groups
• The use of the following response enhancing techniques may increase
the response rate obtained: Advance notice, personalization, topic
salience, identification numbers, and sponsorship.
• Consider the targeted respondent group when planning a survey
study. As shown in Table 1, considerable differences in response
rates between respondent groups can be expected. Anticipate lower
response rates for top executives, but also lower response rates
should be expected for consumers and managers in comparison to
non-managerial employees and non-working respondents.
• Combining several response enhancing techniques is advisable. Even
when controlling for the presence of other techniques, advance notice,
personalization, salience, identification numbers, and sponsorship are
associated with higher response rates.
• Analyze characteristics of the respondent group when planning
which response enhancing techniques to use in a survey effort.
Different survey design alternatives may be attractive to different
subgroups as predicted by leverage-salience theory.
• Is personal distribution of surveys an option? If feasible, personally
distributing surveys will lead to considerable higher response rates.
• When surveying top executives, emphasize salience of the survey
topic, but do not use incentives.
• Are response incentives worth the cost? Contrary to common sense,
incentives do not seem to lead to higher response rates.
• Mentioning sponsorship is advisable when surveying managerial
respondents.
• An increased use of response enhancing techniques seems necessary to
obtain similar response rates as in the past. However, some techniques
(e.g., advance notice, follow-up, mailing) have become less effective
over the years. If the observed trends continue, personalization should
be the only technique to become more effective in the coming years.
• When surveying non-managerial employees, web-based
administration might be effective, but avoid using incentives.
• Balance the cost and benefits of using a web-based survey. Web-based
surveys may lead to somewhat lower response rates.
• Mentioning sponsorship is not a very effective technique to enhance
response rate in consumer samples.
• When surveying non-working respondents, using incentives might
be advisable, but emphasizing salience is less effective.
348 J Bus Psychol (2010) 25:335–349
123
Acknowledgments We would like to thank Katrien Vermeulen,
Liesbet De Koster, Valerie Boulangier, Claire Hemelaer, Sophie
Pczycki, Myrjam Van de Vijver, and Bernd Carette for their help in
coding the studies.
References
Aguinis, H. (2004). Regression analysis for categorical moderators.
New York: Guilford Press.
Allen, C., Schewe, C. D., & Wijk, G. (1980). More on self-perception
theory’s foot technique in the pre call/mail survey setting.
Journal of Marketing Research, 17, 498–502.
Anseel, F., Duyck, W., De Baene, W., & Brysbaert, M. (2004).
Journal impact factors and self-citations: Implications for
psychology journals. American Psychologist, 59, 49–51.
Applebaum, H. (1986). The anthropology of work in industrial
society. Anthropology of Work Review, 7, 25–32.
Baruch, Y. (1999). Response rate in academic studies: A comparative
analysis. Human Relations, 52, 421–438.
Baruch, Y., & Holtom, B. C. (2008). Survey response rate levels and
trends in organizational research. Human Relations, 61, 1139–
1160.
Bonaccorsi, A., & Piccaluga, A. (1994). A theoretical framework for
the evaluation of university–industry relationships. R & DManagement, 24, 229–247.
Bruvold, N. T., Comer, J. M., & Rospert, A. M. (1990). Interactive
effects of major response facilitators. Decision Sciences, 21,
551–562.
Church, A. H. (1993). Estimating the effect of incentives on mail
survey response rates: A meta-analysis. Public Opinion Quar-terly, 57, 62–79.
Cohen, J., Cohen, P., West, S. G., & Aiken, L. S. (2004). Appliedmultiple regression/correlation analysis for the behavioralsciences (3rd ed.). Hillsdale, NJ: Erlbaum.
Converse, P. R., Wolfe, E. W., Huang, X. T., & Oswald, F. L. (2008).
Response rates for mixed-mode surveys using mail and e-mail/
Web. American Journal of Evaluation, 29, 99–107.
Creed, P. A., & Klisch, J. (2005). Future outlook and financial strain:
Testing the personal agency and latent deprivation models of
unemployment and well-being. Journal of Occupational HealthPsychology, 10, 251–260.
Cycyota, C. S., & Harrison, D. A. (2002). Enhancing survey response
rates at the executive level: Are employee- or consumer-level
techniques effective? Journal of Management, 28, 151–176.
Cycyota, C. S., & Harrison, D. A. (2006). What (not) to expect when
surveying executives: A meta-analysis of top manager response
rates and techniques over time. Organizational Research Meth-ods, 9, 133–160.
Deci, E. L., Koestner, R., & Ryan, R. M. (1999). A meta-analytic
review of experiments examining the effects of extrinsic rewards
on intrinsic motivation. Psychological Bulletin, 125, 627–668.
Dillman, D. A. (1978). Mail and telephone surveys. New York:
Wiley.
Dillman, D. A. (2000). Mail and Internet surveys: The tailored designmethod. New York: Wiley.
Dillman, D. A. (2002). Navigating the rapids of change: Some
observations on survey methodology in the early twenty-first
century. Public Opinion Quarterly, 66, 473–494.
Edwards, P., Roberts, I., Clarke, M., DiGuiseppi, C., Pratap, C.,
Wentz, R., et al. (2002). Increasing response rates to postal
questionnaires: Systematic review. British Medical Journal, 324,
1–9.
Fox, R. J., Crask, M. R., & Kim, J. (1988). Mail survey response rate:
A meta-analysis of selected techniques for inducing response.
Public Opinion Quarterly, 52, 467–491.
Gendall, P., Hoek, J., & Brennan, M. (1998). The tea bag experiment:
More evidence on incentives in mail surveys. Journal of theMarket Research Society, 40, 347–351.
Groves, R. M., Presser, S., & Dipko, S. (2004). The role of topic
interest in survey participation decisions. Public OpinionQuarterly, 68, 2–31.
Groves, R. M., Singer, E., & Corning, A. (2000). Leverage-saliencetheory of survey participation: Description and an illustration.
Public Opinion Quarterly, 64, 299–308.
Heberlein, T. A., & Baumgartner, R. (1978). Factors affecting
response rates to mailed questionnaires: A quantitative analysis
of the published literature. American Sociological Review, 43,
447–462.
Hopkins, K. D., & Gullickson, A. R. (1993). Response rates in survey
research: A meta-analysis of the effects of monetary gratuities.
Journal of Experimental Education, 61, 52–62.
McKee, D. O. (1992). The effect of using a questionnaire identifi-
cation code and message about non-response follow-up plans on
mail survey response characteristics. Journal of the MarkerResearch Society, 34, 179–191.
Paxson, M. C. (1995). Increasing survey response rates: Practical
instructions from the total design method. Cornell Hotel andRestaurant Administration Quarterly, 36, 66–73.
Rogelberg, S. G., Conway, J. M., Sederburg, M. E., Spitzmuller, C.,
Aziz, S., & Knight, W. E. (2003). Profiling active and passive
nonrespondents to an organizational survey. Journal of AppliedPsychology, 88, 1104–1114.
Rogelberg, S. G., & Stanton, J. M. (2007). Understanding and dealing
with organizational survey nonresponse: Introduction. Organi-zational Research Methods, 10, 195–209.
Roth, P. L., & BeVier, C. A. (1998). Response rates in HRM/OB
survey research: Norms and correlates, 1990–1994. Journal ofManagement, 24, 97–117.
Shih, T. H., & Fan, X. T. (2008). Comparing response rates from Web
and mail surveys: A meta-analysis. Field Methods, 20, 249–271.
Sills, S. J., & Song, C. Y. (2002). Innovations in survey research: An
application of Web-based surveys. Social Science ComputerReview, 20, 22–30.
Spitzmuller, C., Glenn, D. M., Barr, C. D., Rogelberg, S. G., &
Daniel, P. (2006). ‘‘If you treat me right, I reciprocate’’:
Examining the role of exchange in organizational survey–
response. Journal of Organizational Behavior, 27, 19–35.
Trussel, N., & Lavrakas, P. J. (2004). The influence of incremental
increases in token cash incentives on mail survey response—Is
there an optimal amount? Public Opinion Public OpinionQuarterly, 68, 349–367.
Van den Berg, G. J., Lindeboom, M., & Dolton, P. J. (2006). Survey
non-response and the duration of unemployment. Journal of theRoyal Statistical Society Series A, 169, 585–604.
Yammarino, F. J., Skinner, S. J., & Childers, T. L. (1991).
Understanding mail survey response behavior. Public OpinionQuarterly, 55, 613–629.
Yu, J., & Cooper, H. (1983). A quantitative review of research design
effects on response rates to questionnaires. Journal of MarketingResearch, 20, 36–44.
J Bus Psychol (2010) 25:335–349 349
123