response rates in european business tendency surveys g.schwarz...furthermore, concerning 2-staged...
TRANSCRIPT

Response Rates in European Business Tendency Surveys
Report of the task force on survey quality’s work group on response rates Gerhard Schwarz Austrian Institute of Economic Research (WIFO)
Final report - 4 November 2013

– 2 –
The author is obliged to Christian Gayer, Andreas Reuter (ECFIN) and Werner Hölzl (WIFO) for their valuable input and worthwhile discussions.

– 3 –
Introduction
Scope of the report
“Analysis of response rates across institutes: driving factors, impact of cut-offs (firm size), impact of survey mode, compulsory versus voluntary participation, impact of sampling method (...), ways to raise/stabilise response rates, empirical evidence on links with data bias (and possibly volatility)” (ECFIN, 2013a, emphasis in original)
The report at hand focuses solely on the business tendency surveys among firms of the manufacturing sector (industry), the construction sector (building), the service sector and the retail sector. Business tendency surveys among households and consumers are the object of a separate report prepared by Statistics Finland.
Definitions
A standard measure of how successfully (potential) interviewees were motivated to participate in a given survey is the response rate (RR). The response rate is usually defined as the number of units in the net sample (NS) divided by the number of units in the gross sample (GS) expressed in the form of a percentage1
RR = NS ÷ GS * 100.
:
In this report, however, a number of different concepts of “Response Rates” (RR) are used, as the different survey methodologies in the Joint Harmonised EU Programme of Business and Consumer Surveys calls for slightly different concepts. This report is in large parts based on the metadata collected by DG ECFIN from the institutes participation in the Joint Harmonised EU Programme of Business and Consumer Surveys. The differences in survey methodology2
The classic definition of a response rate cited above, for example, is applicable to random sampling, indicating whether an actually achieved net sample still qualifies as random sample. In exhaustive sampling the response rate might be interpreted in a similar way, indicating whether a given net sample still qualifies as census or not.
imply that the conceptual meaning of the response rates reported by the individual institutes differs.
In quota sampling, however, a response rate cannot be calculated meaningfully for the lack of a definite gross sample: in quota sampling all units fulfilling the criteria of a given quota are interchangeable, rendering the concept of a randomly drawn gross
1 See http://en.wikipedia.org/wiki/Response_rate 2 E.g. sampling, replacement of non co-operative firms.

– 4 –
sample meaningless and, inevitably, the concept of a response rate pointless. Similarly, in purposive sampling the criterion is whether the realized net sample fulfills the researcher’s objectives, irrespective of how many potential respondents had to be contacted.
Furthermore, concerning 2-staged panel designs, i.e. panels with a recruitment stage and an execution stage, the response rate might refer to each of the stages or to a combination of these.
Structure of the report
Chapter 2 analyses the effect of response rates on the quality of the business tendency surveys conducted within the “Joint Harmonised EU Programme of Business and Consumer Surveys” (JHP). Chapter 3 discusses the use of response rates as a measure of efficiency rather than of data quality. Chapter 4 seeks to identify the drivers of response rates in business tendency surveys. Chapter 5 addresses some methodological restrictions of the BS metadata at hand. Chapter 6 describes the results of an experiment conducted by WIFO in order to find viable strategies in raising response rates. Chapter 7 finally sums up the findings.
2. BTS-Quality and Response Rates Subject of this chapter is to examine the relation between response rates and survey quality in BTS3
The metadata on BS contain information on:
. This is done by visual, correlation and regression analyses of metadata on BS as collected by ECFIN (2013b) and three indicators of survey quality provided by ECFIN (2013d).
• the response rate (RR) • type of survey (industry, building, services, retail trade) • country of survey • institute conducting the survey • sampling method • (effective) sample size • coverage rate (turnover, employment) • fieldwork methods • measures to increase RR
3 The metadata collected by ECFIN (2013b) concerns unit nonresponse. Kowalczyk (2010, p. 268) presents item-non response rates ranging from 0% to up to 8% for Polish data, suggesting that item nonresponse also might be a relevant topic concerning response rates.

– 5 –
For the purpose of this analysis the metadata had to be modified. Sampling and fieldwork methods as well as measures to increase RR were coded by the author, because the original metadata only contained open, verbal answers by the institutes. As the original data – especially on sampling methods - are highly idiosyncratic the process of coding has an arbitrary component. To keep the process comprehensible the coding plan is documented in Annex 3.
ECFIN provided three indicators of survey quality that served as a benchmark, all of them on a sectoral and national level. Firstly, correlation coefficients of the reference series and BS series as a measure of fit. According to ECFIN (2013a) the following reference series were used by ECFIN in calculating the correlation coefficients:
“[I]ndustrial production index for INDU [industry], value added in services for SERV [service sector], private consumption for CONS [consumers] and RETA [retail trade], construction production index for BUIL [construction sector]. All reference series were transformed into y-o-y growth rates. Reference series that are only available quarterly were transformed into monthly frequency by linear interpolation. All survey series are seasonally adjusted by the Commission.”
Secondly, ECFIN provided “Months for Cyclical Dominance” (MCD) as measure of “volatility”. MCD denominate the “months before an improvement/deterioration in the time series can be interpreted with reasonable certainty as an improvement/deterioration in economic sentiment” and are derived from a seasonal decomposition of the time series of interest (for details see ECFIN, 2013c).
However, we did not build our analysis on the MCD as such, but directly on the measure used to derive MCDs, i.e. the ratio of the average change in the irregular component and in the cycle component for one and two months, which were also provided by ECFIN. The lower this ratio is, the smaller the “volatility” of the time series. We will henceforth refer to the one month ratio as MCD1 and to the two month ratio as MCD2.4
The variable to test is the RR as reported by the institutes conducting BS within the framework of the JHP and as provided by ECFIN. A first visual analysis does not indicate any strong systematic relationship between response rates and our indicators of survey quality (see Graph 1 below). The correlation analysis (Table A1.1
4 It should be noted that these quality indicators, i.e. correlation with a reference series, MCD, a fraught with a pivotal problem. They are calculated on the basis of long time series which contain data from decades ago. This gives only little weight to recent developments, underestimating their impact (see also chapter 5).

– 6 –
in Annex 1) confirms this picture: all unconditional correlation coefficients are statistically insignificant.
Graph 1: Correlation Analysis of Response Rates and Quality Measures
However, the insignificance of the unconditional correlations could be the result of confounding factors. Therefore we used regression analysis (OLS) that accounts for a number of influences. We control for the effective sample size (in thousands), the type of institution conducting the survey, the sector of the survey, the EU membership status of the country of the survey5
5 Becoming EU member in 2004 or later. However, quality indicators for the actual candidate countries and for countries which became EU member after 2004 were not provided by ECFIN.
, the sample type and fieldwork methods. We estimate the influence of the RR on each of our three quality indicators, namely (i) the correlation coefficients of the BS series and their respective reference series as well as (ii) MCD1 and (iii) MCD2 serve as out left hand side variables. The results

– 7 –
confirm our earlier findings. For none of the three quality indicators the coefficient of the RR is significant or even close to the commonly used significance level of 0.05 (see Tables 1a, 1b and 1c).
Table 1a: Determinants of BS correlation with its reference series
Coefficientsa
Model
Unstandardized Coefficients
Standardized
Coefficients
t Sig. B Std. Error Beta
1 (Constant) 90.177 12.733 7.082 .000
Response Rate -.140 .147 -.135 -.954 .343
EffectiveSampleSize .000 .002 .018 .159 .874
NMS_CandCountry 9.835 4.437 .231 2.216 .030
StatOffice_NationalBank -.011 5.933 .000 -.002 .999
Sector_Services 6.053 5.796 .124 1.044 .300
Sector_Construction 1.165 6.098 .023 .191 .849
Sector_RetailTrade -7.819 5.777 -.162 -1.354 .180
Panel -10.588 4.770 -.234 -2.220 .029
Quota -1.434 11.316 -.018 -.127 .899
Postal -5.113 6.470 -.098 -.790 .432
Fax -19.037 6.592 -.303 -2.888 .005
Online_Email -9.610 5.976 -.194 -1.608 .112
Telephone -8.018 7.735 -.136 -1.037 .303
a. Dependent Variable: BS Correlation with its Reference Series Reference Sector: industry.

– 8 –
Table 1b: Determinants of MCD1
Coefficientsa
Model
Unstandardized Coefficients
Standardized
Coefficients
t Sig. B Std. Error Beta
1 (Constant) 2.380 .509 4.680 .000
Response Rate -.002 .006 -.048 -.376 .708
EffectiveSampleSize .000 .000 -.311 -3.151 .002
NMS_CandCountry -.009 .173 -.005 -.050 .960
StatOffice_NationalBank .054 .231 .028 .232 .817
Sector_Services .338 .230 .155 1.469 .146
Sector_Construction .219 .230 .102 .952 .344
Sector_RetailTrade .819 .233 .370 3.513 .001
Panel -.326 .180 -.163 -1.804 .075
Quota 1.002 .445 .287 2.254 .027
Postal .364 .254 .157 1.430 .156
Fax .259 .267 .089 .970 .335
Online_Email -.376 .231 -.167 -1.624 .108
Telephone .162 .269 .066 .602 .549
a. Dependent Variable: MCD1 Reference Sector: industry.

– 9 –
Table 1c: Determinants of MCD2
Coefficientsa
Model
Unstandardized Coefficients
Standardized
Coefficients
t Sig. B Std. Error Beta
1 (Constant) 1.262 .254 4.961 .000
Response Rate -.002 .003 -.074 -.558 .578
EffectiveSampleSize .000 .000 -.324 -3.058 .003
NMS_CandCountry .081 .094 .089 .866 .389
StatOffice_NationalBank -.001 .132 -.001 -.006 .995
Sector_Services .173 .119 .163 1.447 .152
Sector_Construction .121 .118 .116 1.026 .308
Sector_RetailTrade .437 .121 .407 3.615 .001
Panel -.205 .100 -.210 -2.050 .044
Postal .213 .126 .162 1.682 .096
Fax .114 .136 .084 .836 .406
Online_Email -.126 .118 -.105 -1.071 .287
Telephone -.013 .144 -.009 -.091 .928
a. Dependent Variable: MCD2 Reference Sector: industry.
To control for the different concepts of response rates according to different sampling methods6, we replicated our analyses after removing institutes employing quota designs from the data and splitting the data into two groups, one consisting of surveys which (seem to) employ non-quota sampling and one containing metadata of surveys based on panels7
In sum, we do not find any indication for a (statistical) relation between BS response rates and quality measures provided by ECFIN (correlation coefficients, MCD1, MCD2). In our regression analysis we found significance levels of the respective
(see Tables A1.3a, A1.3b, A1.3c and A1.4a, A1.4b, A1.4c in Annex 1). These replications confirm the earlier result of no traceable relation between survey quality and response rates.
6 In quota sampling by definition response rates do not exist, in sample designs with respondents’ self-selection the response rates usually refer to the number of entities in the panel and not to the number of firms initially asked to participate (as would be the case in - strict - random sampling). 7 However, given the distribution of firm sizes usually observed (few very large firms, many very small firms) it seems safe to assume that even “random sampling” in the given context leads de facto to a panel approach as – by stratification – the few large firms will probably be sampled for each of the survey waves.

– 10 –
coefficients ranging from .190 to .906 which are not even close to the commonly used significance level of .05. 8
3. Response rates as a measure of efficiency
Conducting surveys is all about motivating (potential) interviewees to spend time and effort on answering a questionnaire, typically without getting compensated. The response rate of a survey equals the probability that an element of a gross sample answers a survey. Even though response rates in the case of BS under the JHP are not related to survey quality (see chapter 2), response rates are a measure of the efficiency of the survey process: the higher the response rate the lower the costs of fieldwork and address management.
During the recent decades survey researchers face declining response rates in household telephone surveys9, i.e. struggle with convincing people to take their surveys. While we do not have comparable data concerning surveys among enterprises in general or BS specifically, it seems safe to say that response rates have come under pressure for enterprise surveys as well, given that the (entry) barriers to conducting surveys collapsed throughout the last three decades. Desktop publishing, cheap photocopiers and printers for office use, falling telecommunications costs and, last but not least, the internet have driven down the costs of doing surveys. This development naturally increases the pressure on potential respondents who will become more selective in which surveys they answer or maybe stop answering surveys at all.10
The response rate of a survey might be influenced by a multitude of factors, not all of them perceptible at first glance. Stoud and Kenski (2007), for example, cite research that suggests a general relationship between a topic’s salience and survey response, “namely that individuals responding to a survey are likely to find the survey topic more salient than nonrespondents do”
11
8 However, we find a highly significant negative impact of the effective sample size on MCD1 and MCD2, therefore reducing “volatility”, i.e. increasing the effective sample size by 1000 participants will reduce MCD1 and MCD2 by approximately 0.2 to 0.4.
. Furthermore, the nexus between a potential
9 Pew Research (2012) reports that the response rates of their telephone household surveys have fallen dramatically from 36% in 1997 to 9% in 2012. Curtin et al. (2005) analyse data of the University of Michigan’s Survey of Consumer Attitudes (SCA) and find response rates falling at 0.75 percent points per year on average for the period from 1979 to 1996. The deterioration from 1997 to 2003 (the end of the observation period) has been twice as steep, averaging 1.5 percentage points a year. Furthermore, “[c]onsistent with the perception of an increasingly difficult survey environment, however, Curtin, Presser, and Singer (2000) found that interviews became much harder to obtain over the course of the later period” Curtin et al. (2005, p. 88). Remarkably, in the earlier period nonresponse mainly grew due to rising number of noncontacts, while the rise of nonresponse after 1996 was mainly driven by refusals. 10 Ironically, the author personally knows the owner of an Austrian market research firm who cancelled her landline phone, because “the only ones calling were market researchers”. 11 In the context of BS this means that an extensive media coverage of BS results could correspond to higher response rates.

– 11 –
driver of response rates and respondents’ actual behavior is sometimes more complex than originally thought and might be context dependent12 and/or ambiguous. The bellow excursus on mandatory requirements shall illustrate the problem. The same is unfortunately true for other potential driving factors of response rates like reminders, sampling frames13
4. Driving factors of response rates
, cut-offs, survey-modes, resources available at an institute for conducting the surveys, public acknowledgement of the conducting institute etc.
To identify driving factors of BS response rates within the framework of the JHP we regressed the RR provided by ECFIN (2013b) on potential determinants which we derived from the same source. The metadata used for this analysis had to be coded by the author, the coding plan can be found in Appendix 3. In our analysis we use the following predictors:
• Type of institute: national bank or statistical institute (yes/no)
• Panel (yes/no)
• Quota sampling (yes/no)14
• Sector (industry, construction, services, retail trade)
• Fieldwork method (postal, fax, email/online, telephone)
• Type of member state (New member state or candidate country, yes/no)
• Country size (inhabitants in millions)
• Effective sample size (in thousands)
• Means to increase response rates (yes/no)
12 “... we believe that the hypothesized role of topic interest needs to be refined. Participation in the survey is apparently not triggered by topic interest or relevance to the self-image alone, but by the likelihood that thinking about the topic will be rewarding to the respondent. These rewards may be pleasant memories, psychic benefits of demonstrating knowledge in an area one considers important, or the gratification of knowing that the survey may increase society’s attention to an issue related to key self-interests. When the topic of the survey is relevant to the sample person but generates negative thoughts, unpleasant memories, or reminders of embarrassing personal failings, then the topic may suppress participation despite its personal relevance.” (Groves et al., 2006, p. 734) 13 The sampling method as such should in general not influence response rates as the mode of selection per se (randomly, purposively) should typically not influence the decision to answer a questionnaire or not. I.e., who is selected might be important (firm size, branch etc.), but not how this specific unit is sampled. 14 According to the metadata (ECFIN, 2013b) only one institute is deliberately employing quota sampling. However, others acknowledge that they replace non-responding firms with “similar” ones. However, the interchangeability of “similar” surveyed units is the defining moment of quota sampling and therefore the sampling methods of these institutes were coded as such.

– 12 –
Our regression analysis reveals two significant determinants of response rates (see Table A2.1 in Annex 2). Firstly, reported response rates depend on the type of institution conducting the survey. Statistical offices and national banks report response rates that surpass the response rates of other, i.e. private, institutes by 23 percentage points on average.
Secondly, the response rates of institutes employing quota samples outnumber the response rates of other institutes by 35 percentage points on average. This is no surprise as these institutes replace non-responding firms with similar firms to fulfill their quota plan. In other words: The response rate is always 100% if the quota plan is fulfilled regardless of how many firms hat to be contacted, rendering the concept of a response rate meaningless.15
Furthermore, the fieldwork method “postal” is associated with significantly lowered response rates. None of the other predictors is significant. This is especially remarkable in the case of means to improve the response rates, i.e. foremost reminders. Conventional wisdom, textbooks on empirical research and experience teaches that reminders are very important in improving response rates. In Austria, for example, email reminders sent to non-responders increase the response rates of the online-BS by approximately 15 percentage points every month. This result calls for further refinement and quality control in the compilation of the metadata in order to replicate this surprising finding.
5. Measurement problems
Within the framework of the JHP many different forms and variants of sampling are used. Unfortunately, the meaning of a response rate varies according to the employed sampling method. The classic definition (net sample divided by gross sample), for example, is applicable only to random sampling and indicates whether an actually achieved net sample still qualifies as random sample.16
In exhaustive sampling the response rate might be interpreted in a similar way as in random sampling, indicating whether a given net sample still qualifies as census or not. In quota sampling, on the other hand, a response rate as described above cannot be calculated for the lack of a definite gross sample: in quota sampling all units fulfilling the criteria of a given quota are interchangeable, rendering the concept of a randomly drawn gross sample meaningless. Furthermore, without a
15 Removing surveys based on quota sampling from the regression did not alter the other results; see Appendix 2, Table 2. 16 Some biomedical journals, for example, (arbitrarily) require a minimum response rate for survey data of 60% to prevent nonresponse biases (Livingston-Wislar, 2012). Hager et al. (2003) quote several textbooks which urge minimum acceptable response rates in the range from 50% to 75%.

– 13 –
random sampling an indicator pinpointing to whether a given dataset qualifies as a random sample seems somewhat unconventional. With reference to quota sampling the term “response rate” therefore might refer to the completion of a given quota plan being some kind of quality indicator, or it might - as an indicator of efficiency - refer to the relation between the number units tried to contact and the number of realized interviews.
Among the institutes conducting BS within the scope of the JHP only one institute mention the use of quotas. Two more institutes state or imply that they are operating with random samples, while replacing non-responding or refusing firms with “similar” firms (see ECFIN, 2013b), therefore not fulfilling the requirements of random sampling: Replacing non-responsive or refusing units with “similar” units is the defining element of quota sampling and - as a consequence - these institutes de facto operate with quota samples rather than with random samples. Another four institutes use purposive sampling methods, a term which may or may not refer to quota sampling17
The term “response rate” has still another meaning for two-staged panel sampling which is used by - as far as we know - at least two
.
18
Furthermore, the metadata reported by the institutes participating in the JHP and provided by ECFIN (2013b) are sometimes idiosyncratic, ambiguous and inconsistent. This is due to a rather open way used to gather e metadata. The institutes are largely free in describing their methods. This reduces the comparability of the data across countries and might lead to errors in analytical studies of the data.
institutes of the JHP. The first stage consists of an invitation of firms to join the BS panel. The panel then is the second stage of the sampling process. This leads to two very different concepts of response rates. Firstly, there is a response rate for the first stage (recruitment into the panel), i.e. expressing the proportion of firms following the invitation to join the panel. Secondly, a panel response rate, that captures the proportion of responsive firms within the panel. The latter, therefore, might also reflect the institution's policy on what defines a non-responsive firm and how fast non-responsive firms are removed from the panel (decreasing the denominator in the calculation of the response rate).
A major drawback in the use of the given metadata in analyzing survey quality lies in the cross sectional nature of the metadata as opposed to the inherently longitudinal nature of the quality indicators. Survey quality is measured by correlating BS series with reference series and by calculating MCDs (ECFIN, 2013c & 2013d). Both
17 Purposive sampling methods cover modal instance sampling, expert sampling, quota sampling, heterogeneity sampling, and snowball sampling. See Trochin (Nonprobability Sampling). 18 Ifo, WIFO.

– 14 –
methods condense data referring to long time spans of up to almost three decades (see, for example, ECFIN, 2013c) into single figures, while the metadata are snapshots of the recently employed methodologies and key figures and only concern a single point in time. In other words, the applied quality measures might be related to survey methodologies that are no longer used. This may affect the results.
Adding to this already multifaceted picture is the fact that several types of response rates are requested by ECFIN. Besides the “normal” response rates described above each analysis of BS data within the scope of the JHP delivered to the ECFIN is accompanied by “weighted” response rates shifting the focus more towards “large” firms. Furthermore, the ECFIN also collects data on the sample coverage both in terms of turnover and in term of employment. It is not entirely clear whether the sample coverage is related to the gross or the net sample. In the latter case sample coverage would be a concept closely related to (weighted) response rates.
Chapter 2 concluded that there is no indication that response rates are related to the quality of BS results under the JHP. Still Chapter 3 argues that they could serve as an indicator of efficiency between and within the institutes participating in the JHP. While response rates and their evolvement over time should be easy to track within institutes, comparisons between institutes could be fostered if more standardized information on sampling and fieldwork would be available, allowing the identification and formation of groups of institutes using similar methodologies. The work of the American Association for Public Opinion Research (AAPOR) on a unified response rate calculator for marketing research might serve as an inspiration (see AAPOR 2011a, 2011b, 2011c). However, it took AAPOR one and a half decades to come up with their “response rate calculator”.
6. An experiment in increasing response rates
The prototypical framework for the optimization of response rates in self-administered surveys is probably provided by Dillman (2000). His Tailored Design Method (TDM) is based on social exchange theory and relies on three core elements to increase the odds of survey participation:
“[R]ewards, costs, and trust. ... The theory of social exchange implies three questions about the design of a questionnaire and the implementation process: How can we increase rewards for responding? How can perceived costs be reduced? How can trust be established so that the ultimate rewards will outweigh the costs of responding?” (Dillman, 2000, p. 14)

– 15 –
Also findings in behavioral economics are able to provide clear advice on how surveys might be designed in order to optimize response rates19
In order to assess the importance of differences in the survey materials may influence response rates of BTS, WIFO decided to run an survey experiment that allowed to study more than a dozen potential influence factors that are related to the design and layout of the survey materials. The influence factors tested were inspired by and derived from Don Dillman’s “Total Design Method” (TDM) and from findings in behavioral economics.
. However, TDM and behavioral economics both lead to the conclusion that each survey should be customized to fit to the specific situation in which it is intended to be conducted.
The (potential) respondents of the experiment were assigned to the different variants on a random basis. The sample consisted of 3.72820 Austrian firms from manufacturing, construction, services and tourism with 6 or more employees. The firms were not yet part of WIFO’s BTS-panel. The fieldwork of this survey took place during September 201321
The experimental survey was conducted as a part of WIFO’s efforts to recruit new participants to its BTS-panel. In this context two different types of response rates were relevant. First the share of firms answering the questionnaire and second the share of firms which are ready to join the panel, i.e. to receive questionnaires on a regular basis. The experiment was designed in such a way that the latter group is a subgroup of the first group.
and ran well into October 2013. We present here the most important results using descriptive statistics. The findings have also been confirmed by using more ambitious methods (logistic regression analysis).
Cover letters
Behavioral economics suggests several concepts which can be used in order to influence people’s behavior. Using such insights we drafted three different cover letters, each of the cover letters representing one of these concepts. We tested the three cover letters against a “neutral” cover letter which was designed to provide as little incentives to answer the survey as possible (null cover letter). The three concepts we used were: 19 Some concepts of behavioral economics like “arbitrary coherence”, the “IKEA effect”, the “decoy effect”, the “peak-end-rule” as well as findings related to system justification theory and consumer behavior, the neglect of opportunity costs, self-deception, social proof even point towards beyond TDM for increasing response rates. Actually, survey research seems to be the perfect application for the findings of behavioral economics, which is often criticised for deriving results from experiments with low stakes, as participating in a survey clearly is a low stake decision and therefore closely resembles the typical experiment in behavioral economics. 20 The questionnaire was sent to 3.796 firms. 68 of these firms were reported as closed down or had moved and were removed from the sample. 21 The initial survey material was posted on Friday 30 August 2013.

– 16 –
• Self-interest: The cover letter proclaimed that it was in the firms’ best interest to participate in the BS as this survey gives a “voice” to the companies that depicts the firms’ actual situation and is well heard in politics allowing economic policy to act accordingly
• Social proof: The potential participants were informed by the cover letter that every month over 1.400 other Austrian firms participated in WIFO’s BS and that more than 100.000 participated throughout Europe in the Joint Harmonised EU Programme. The idea is to suggest the participation in the BS through the leading example of so many other firms that already participate.
• Authority: The addressees of this cover letter were informed that WIFO is entrusted by the Republic of Austria to provide quarterly business cycle forecasts and that WIFO’s BS was undertaken to support this mission and was therefore undertaken to fulfill a public commission. Furthermore the potential respondents were informed that WIFO is Austria’s largest institute of economic research and that it has been conducting its BS for 60 years.
In all four cover letters (three experimental ones and the null cover letter) we pointed out that the participation in WIFO’s BS is voluntary and that the gathered data is only used for scientific analyses.
We expected that all three experimental cover letters would lead to higher response rates (“answered questionnaire”) and a higher rate of conversion, i.e. responding firms being willing to receive our questionnaire on a regular basis (“joined panel”), compared to the null cover letter ( control group).
However, only the authoritarian experimental cover letter could fulfill our expectations (see Table 2). While only 9-10% of the firms receiving the neutral letter or one of the letters addressing self-interest and social proof answered the survey, 14% of the firms receiving the authoritarian cover letter did so. The same holds true for the conversion rate, i.e. joining the panel. 9% of the firms receiving the authoritarian letter decided to join the panel while only 4-5% of the receivers of the other cover letters were ready to do so22
22 For the effect of different types of cover letters when reminding potential respondents see below.
.

– 17 –
Table 2: Cover letter and response/conversion (initial contact - without reminding)
Type of cover letter
Null Self interest Social Proof Authority
% n % n % n % n
Response (answered
questionnaire), initial contact
No 90% 837 91% 852 91% 845 86% 805
Yes 10% 94 9% 82 9% 81 14% 132
Conversion (joined panel), initial
contact
No 95% 887 95% 884 96% 886 91% 855
Yes 5% 44 5% 50 4% 40 9% 82
Chi-square df Sig.
Response (answered questionnaire), without reminding 19.051 3 .000
Conversion (joined panel), without reminding 20.979 3 .000
It should be noted that other potential triggers of the respondents’ attempts to follow authorities failed. Annotating EU’s cooperation/support on top of the questionnaires had no effect on the response or conversion rate. Mentioning the sender’s academic title to underscore his qualification had – if at all – a negative impact of -2 percentage points on the overall response rate (including reminders)23
Token of appreciation
and no effect on the conversion rate.
Dillman (2000) recommends the addition of tokens of appreciation to the survey materials to raise response rates. We decided to enclose pens to the survey materials of a subsample of 929 firms. Pens were chosen, because they are widely accepted uncontroversial24 give-aways and are reasonably priced. The pens were furnished with the logo of WIFO’s BS and its www-address.25
23 Interestingly, this negative effect seems to be particularly strong if the addressed person holds an (academic) title him-/herself.
24 Compared to cigarette lighters or alcoholic beverages, for example. 25 An intended side-effect of adding this kind of token of appreciation is that it might serve as a “Trojan Horse”: even if the person addressed does not respond positively or respond at all the pen might be on his desk for many months exposing him or her to the brand of WIFO’s BS (“WIFO-Konjunkturtest”) and therefore hopefully increasing brand recognition and improving the odds that the next time this person is approached he/she will be ready to answer positively.
– 18 –
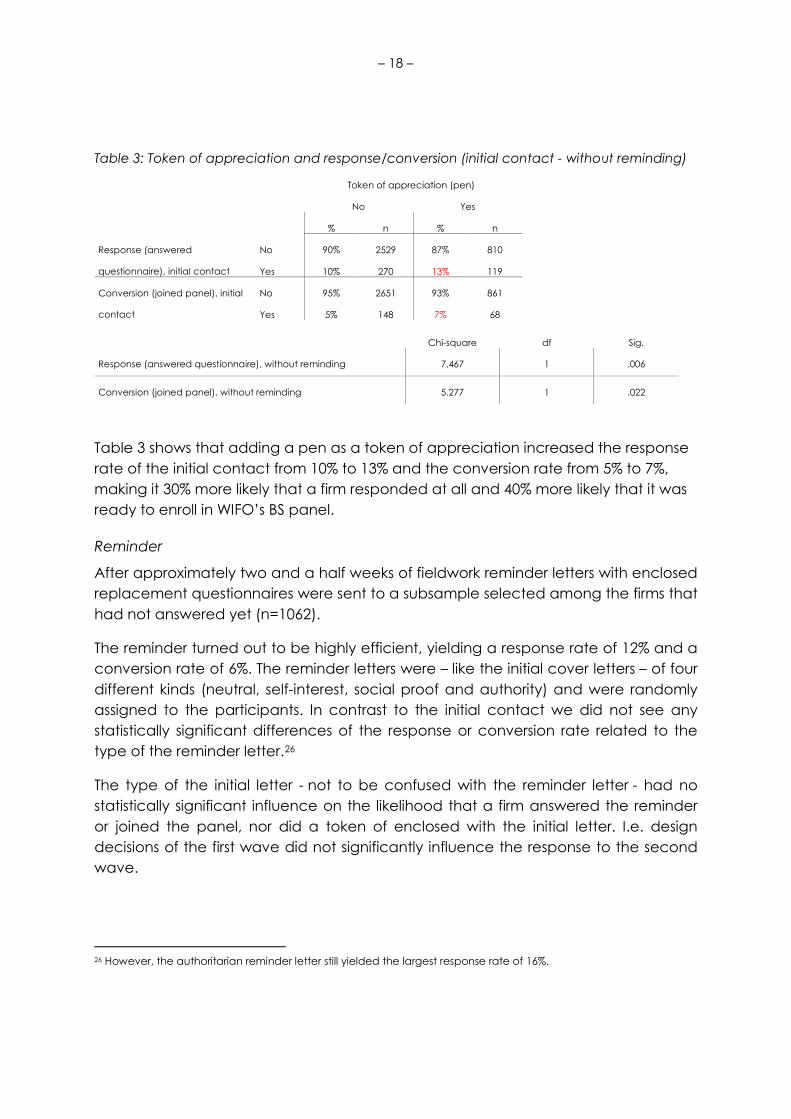
Table 3: Token of appreciation and response/conversion (initial contact - without reminding)
Token of appreciation (pen)
No Yes
% n % n
Response (answered
questionnaire), initial contact
No 90% 2529 87% 810
Yes 10% 270 13% 119
Conversion (joined panel), initial
contact
No 95% 2651 93% 861
Yes 5% 148 7% 68
Chi-square df Sig.
Response (answered questionnaire), without reminding 7.467 1 .006
Conversion (joined panel), without reminding 5.277 1 .022
Table 3 shows that adding a pen as a token of appreciation increased the response rate of the initial contact from 10% to 13% and the conversion rate from 5% to 7%, making it 30% more likely that a firm responded at all and 40% more likely that it was ready to enroll in WIFO’s BS panel.
Reminder
After approximately two and a half weeks of fieldwork reminder letters with enclosed replacement questionnaires were sent to a subsample selected among the firms that had not answered yet (n=1062).
The reminder turned out to be highly efficient, yielding a response rate of 12% and a conversion rate of 6%. The reminder letters were – like the initial cover letters – of four different kinds (neutral, self-interest, social proof and authority) and were randomly assigned to the participants. In contrast to the initial contact we did not see any statistically significant differences of the response or conversion rate related to the type of the reminder letter.26
The type of the initial letter - not to be confused with the reminder letter - had no statistically significant influence on the likelihood that a firm answered the reminder or joined the panel, nor did a token of enclosed with the initial letter. I.e. design decisions of the first wave did not significantly influence the response to the second wave.
26 However, the authoritarian reminder letter still yielded the largest response rate of 16%.

– 19 –
Frequency of participation
The participants of our survey were asked whether they were willing to receive our BS questionnaire on a regular basis. The sample was divided into two parts27
While the possibility to choose between different frequencies had no effect on the response rate it vastly influenced the conversion rate, i.e. the willingness to join WIFO’s BS panel. Offering the option of quarterly receivership of the questionnaire increased the conversion rate from 5% to 7% in the initial contact and from 3% to 7% in the reminder wave. Both effects are highly statistically significant.
: one half could choose between a monthly or a quarterly frequency or no regular sending. The other half could only opt for a monthly sending or no regular sending at all.
Among those firms who chose between the monthly and the quarterly frequency 94% opted for the quarterly frequency. Several firms which rejected to become part of the panel even noted that they would join given they would be surveyed biannually only. This results are in line with experiences from earlier surveys and anecdotal evidence indicating that many firms perceive a monthly survey as cumbersome and pointless, because they do not think that their own business situation is changing that fast.
However, many questions regarding the frequency of participation remain unanswered. We do not know yet enough about this important issue. On the one hand having less but monthly participants might lead to higher number of regularly filled out questionnaires, as one monthly participant answers during a year three times more surveys than a quarterly participant. On the other hand the dropout rate of monthly participants could be higher, because answering the questionnaire on a monthly basis is more burdensome. However, another problem might arise from the long intervals associated with a quarterly frequency: respondents might be less likely to remember they agreed to participate after three months (quarterly frequency) than after one month (monthly frequency), especially if the respondent opted for a different survey mode (online instead of postal) like two thirds of the respondents do.
Ineffective means
Beside the effective means of increasing response and conversion rates we tested several other means that turned out to be ineffective at least in the given setting. The following measured did not yield improvements:
27 This applies only to manufacturing, construction and services, but not to tourism, because due to a lot of seasonal work in this segment the firms are asked when exactly they want to receive the next questionnaire.

– 20 –
• Layout of the cover/reminder letter (alternative, S-shaped layout for enhanced readability)
• Adding WIFO’s red logo to the questionnaire and marking the questions red (in contrast to WIFO’s traditional black and white questionnaire)
• Avoid printing a firm identifier on the cover letter • Call to action in the post scriptum • Format of the envelope (B4 or C5) • Sealing the envelope • Changing the researcher who signed the cover/reminder letter28
Additivity of effective means
When combined the effects of an authoritarian cover letter, a token of appreciation and the opportunity of a quarterly participation add up (see Table 4). The response rate of the initial contact turn out to be 7% when none of these measures were applied, climb to 12% with 1 applied measure and rise further to 27% with 2 or 3 applied measures.
The conversion rate rises even steeper from 3% (0 measures) over 6% (1 measure) to 23% (2 or three measures). However, while response and conversion rate climb with the number of measures applied the latter rises steeper. While only 43% of the firms responding to an initial contact with 0 effective measures are willing to join the panel, 85% of those answering an initial contact with 2 or 3 effective measures are ready to do so.
Table 4: Additivity of effective means of response/conversion improvement
Number of effective measures (authoritarian letter, pen, quarterly participation)
0 1 2 or 3
% n % N % n Response (answered questionnaire), initial contact No 93% 1929 88% 1197 73% 213
Yes 7% 147 12% 163 27% 79 Conversion (joined panel), initial contact No 97% 2013 94% 1274 77% 225
Yes 3% 63 6% 86 23% 67
Chi-square df Sig.
Response (answered questionnaire), without reminding 114.789 2 .000
Conversion (joined panel), without reminding 187.025 2 .000
28 We did not expect any differences here as both researchers are male and have typical German names (Werner Hölzl, Gerhard Schwarz). However, we could not test if and how the sex of the researcher might influence response and conversion rates (see, for example, the anecdotal “Anita Effekt”).

– 21 –
The effect of a reminder is not included in these numbers. However, a more successful initial contact reduces the basis a reminder might address as more firms have already answered. The remaining firms might also be the harder to convince to participate in the surveys as the ones which are more easily convinced have already responded to the initial contact. The available experimental data does not allow for answering these questions. However, combining the methods effective in increasing the response/conversion rates of the initial contact with a reminder should further increase response rates.
Other factors influencing response and conversion: demographics
As far as the characteristics of the firms addressed in our experimental survey were available29
It’s not clear why contact persons who hold a title are more likely to answer the questionnaire and enroll in the panel.
we found no statistically significant relation between firm characteristics and likeliness of response/conversion. With regard to the characteristics of the contact persons (managers) we found that the sex of the contact persons (managers) we approached had no influence on the response and the conversion rate. However, the persons who hold a title (academic or not) have a significantly higher response rate (9% vs 12%) and conversion rate (5% vs. 7%) on the initial contact and a significantly higher response rate to the reminder (10% to 16%).
7. Summary
Scope of this report is to analyze the “response rates across institutes: driving factors, impact of cut-offs (firm size), impact of survey mode, compulsory versus voluntary participation, impact of sampling method (...), ways to raise/stabilize response rates, empirical evidence on links with data bias (and possibly volatility)” (ECFIN, 2013a).
Our findings based on metadata reported by the institutes for BS within the framework are:
• Response rates and survey quality show no statistically significant association.
• Response rates could be used as measures of efficiency within and between institutes
• Reported response rates are significantly higher for public institutions (statistical offices, national banks) than for private institutes. This could be
29 Number of employees, sector (manufacturing, construction, services, tourism), province/region.

– 22 –
explained by a higher prestige of public institutions, their ability to integrate BS with mandatory surveys or to impose the obligation to answer BTS.
• Institutes which use quota sampling report significantly higher response rates than other institutes. However, for quota samples no meaningful “response rates” can be calculated.
• The survey mode “postal” significantly lowers response rates.
• Other factors do not seem to have a significant influence on the response rates. This is also the case for the variable “means to increase response rates“ (i.e. reminders). This result casts a shadow of doubt on the underlying metadata, as it contradicts conventional wisdom, text books and own documented experience with remainders.
• The metadata provided by the institutes of the JHP (ECFIN, 2013b) are not completely without problems as they do not account for different sampling strategies/techniques which influence the conceptual meanings of the reported “response rates”, rendering them hard to compare. Furthermore, the metadata are sometimes idiosyncratic, ambiguous and in cases they seem even to be inconsistent.
• An experiment conducted by WIFO shows that measures to improve response rates as suggested by Dillman (2000) and findings from behavioral economics, respectively, are capable of increasing (short-run) survey response.
• In these experiments WIFO found that reminders, tokens of appreciation, the wording of the cover letter and the option to choose the frequency of being surveyed are effective means of increasing response rates.

– 23 –
Literature
AAPOR, 2011a, The American Association for Public Opinion Research, Response Rates - An Overview, published 1 July 2011, downloaded 17 May 2013.
AAPOR, 2011b, The American Association for Public Opinion Research, Standard Definitions: Final Dispositions of Case Codes and Outcome Rates for Surveys. 7th edition, published 2011, downloaded 17 May 2013.
AAPOR, 2011c, The American Association for Public Opinion Research, Response Rate Calculator, Version 3.1, published November 2011, downloaded 16 May 2013.
Bardaji, J., Biau, O., Bonnefoy, V., Pinault, J.-B., 2009, Effect of the changeover to the mandatory reply on the response rate for the French surveys, presented on 12 October 2009 at the Fourth Joint EU-OECD Workshop on Business and Consumer Opinion Surveys, Brussels, downloaded 29 May 2013.
Becker, G. S., 1968, Crime and Punishment: An Economic Approach, Journal of Political Economy, vol. 76, issue 2, pp. 169-217.
Curtin, R., Presser, S., Singer, E., 2005, Changes In Telephone Survey Nonresponse Over The Past Quarter Century, Public Opinion Quarterly, Vol. 69 (1), pp. 87-98, downloaded 17 May 2013.
Dillman, D. A., 2000, Mail and Internet Surveys, The Tailored Design Method, Second Edition, John Wiley & Sons.
ECFIN, 2013a, European Commission, Directorate General for Economic and Financial Affairs, Task force on 'quality of BS data' – Terms of Reference, 23 April 2013.
ECFIN, 2013b, European Commission, Directorate General for Economic and Financial Affairs, Metadata checked by partners, 23 April 2013.
ECFIN, 2013c, European Commission, Directorate General for Economic and Financial Affairs, Task force on 'quality of BS data' – Months for Cyclical Dominance (MCD), 29 July 2013.
ECFIN, 2013d, European Commission, Directorate General for Economic and Financial Affairs, Quality indicators and Metadata.xls, 29 July 2013.
Groves, R. M., Couper, M. P., Presser, S., Singer, E., Tourangeau, R., Acosta, G. P., Nelson, L., 2006, Experiments In Producing Nonresponse Bias, Public Opinion Quarterly, Vol. 70, No. 5, Special Issue 2006, pp. 720–736.
Hager, M. A., Wilson, S., Pollak, T. H., Rooney, P. M., Nonprofit and Voluntary Sector Quarterly, vol. 32, no. 2, June 2003, pp. 252-267.
Kowalczyk, B., 2010, On Selected Issues Of Non-Response In The Case Of Business Tendency Surveys, Folia Economica 235, pp. 263-271.

– 24 –
Livingston, E. H., Wislar, J. S., 2012, Minimum Response Rates for Survey Research, JAMA Surgery (formerly Arch Surg.), vol. 147(2), p. 110.
Pew Research, 2012, The Pew Research Center For The People & The Press, Assessing the Representativeness of Public Opinion Surveys, published 15 May 2012, downloaded 21 January 2013.
Stroud, N. J., Kenski, K., 2007, From Agenda Setting to Refusal Setting: Survey Nonresponse as a Function of Media Coverage Across the 2004 Election Cycle, Public Opinion Quarterly, 2007, Vol 71., Issue 4, pp. 539-559.
Trochim, W. M. K., Research Methods Knowledge Base. Tulp, D. R. Jun., C. Easley Hoy, C., Kusch, G. L., Cole, S. J., 1991, Nonresponse Under
Mandatory Vs. Voluntary Reporting In The 1989 Survey Of Pollution Abatement Costs And Expenditures (PACE), Proceedings of the Survey Research Methods Section, American Statistical Association.

– 25 –
Annex 1 – Regression Results: BTS-quality and response rates

– 26 –
Table A1.1: Correlation Analysis of Response Rates and Quality Measures

– 27 –
Table A1.2a: Regression Analysis of the Correlation Coefficients of BCS-Data and Their Respective Reference Series – All Sampling Methods
Variables Entered/Removedb
Model
Variables Entered
Variables
Removed Method
dimension0
1 Telephone, StatOffice_NationalBank, Sector_Services, Panel, Fax,
NMS_CandCountry, Sector_Construction, EffectiveSampleSize, Postal,
Online_Email, Sector_RetailTrade, Quota, Response Ratea
. Enter
a. All requested variables entered.
b. Dependent Variable: BS Correlation with its Reference Series
Model Summary
Model
R R Square Adjusted R Square
Std. Error of the
Estimate
dimension0
1 .510a .261 .137 19.76788
a. Predictors: (Constant), Telephone, StatOffice_NationalBank, Sector_Services, Panel,
Fax, NMS_CandCountry, Sector_Construction, EffectiveSampleSize, Postal,
Online_Email, Sector_RetailTrade, Quota, Response Rate
ANOVAb
Model Sum of Squares df Mean Square F Sig.
1 Regression 10742.325 13 826.333 2.115 .022a
Residual 30479.979 78 390.769
Total 41222.304 91
a. Predictors: (Constant), Telephone, StatOffice_NationalBank, Sector_Services, Panel, Fax,
NMS_CandCountry, Sector_Construction, EffectiveSampleSize, Postal, Online_Email,
Sector_RetailTrade, Quota, Response Rate
b. Dependent Variable: BS Correlation with its Reference Series

– 28 –
Coefficientsa
Model
Unstandardized Coefficients
Standardized
Coefficients
t Sig. B Std. Error Beta
1 (Constant) 90.177 12.733 7.082 .000
Response Rate -.140 .147 -.135 -.954 .343
EffectiveSampleSize .000 .002 .018 .159 .874
NMS_CandCountry 9.835 4.437 .231 2.216 .030
StatOffice_NationalBank -.011 5.933 .000 -.002 .999
Sector_Services 6.053 5.796 .124 1.044 .300
Sector_Construction 1.165 6.098 .023 .191 .849
Sector_RetailTrade -7.819 5.777 -.162 -1.354 .180
Panel -10.588 4.770 -.234 -2.220 .029
Quota -1.434 11.316 -.018 -.127 .899
Postal -5.113 6.470 -.098 -.790 .432
Fax -19.037 6.592 -.303 -2.888 .005
Online_Email -9.610 5.976 -.194 -1.608 .112
Telephone -8.018 7.735 -.136 -1.037 .303
a. Dependent Variable: BS Correlation with its Reference Series
Reference Sector: industry.

– 29 –
Table A1.2b: Regression Analysis of MCD1 – All Sampling Methods
Model
Variables Entered
Variables
Removed Method
dimension0
1 Telephone, Sector_Services, Panel, Response Rate, Fax, NMS_CandCountry,
Sector_RetailTrade, EffectiveSampleSize, Online_Email, Postal,
Sector_Construction, StatOffice_NationalBank, Quotaa
. Enter
a. All requested variables entered.
b. Dependent Variable: MCD1
Model Summary
Model
R R Square Adjusted R Square
Std. Error of the
Estimate
dimension0
1 .605a .366 .272 .80864
a. Predictors: (Constant), Telephone, Sector_Services, Panel, Response Rate, Fax,
NMS_CandCountry, Sector_RetailTrade, EffectiveSampleSize, Online_Email, Postal,
Sector_Construction, StatOffice_NationalBank, Quota
ANOVAb
Model
Sum of Squares df
Mean
Square F Sig.
1 Regression 32.872 13 2.529 3.867 .000a
Residual 56.889 87 .654
Total 89.762 100
a. Predictors: (Constant), Telephone, Sector_Services, Panel, Response Rate, Fax,
NMS_CandCountry, Sector_RetailTrade, EffectiveSampleSize, Online_Email, Postal,
Sector_Construction, StatOffice_NationalBank, Quota
b. Dependent Variable: MCD1

– 30 –
Coefficientsa
Model
Unstandardized Coefficients
Standardized
Coefficients
t Sig. B Std. Error Beta
1 (Constant) 2.380 .509 4.680 .000
Response Rate -.002 .006 -.048 -.376 .708
EffectiveSampleSize .000 .000 -.311 -3.151 .002
NMS_CandCountry -.009 .173 -.005 -.050 .960
StatOffice_NationalBank .054 .231 .028 .232 .817
Sector_Services .338 .230 .155 1.469 .146
Sector_Construction .219 .230 .102 .952 .344
Sector_RetailTrade .819 .233 .370 3.513 .001
Panel -.326 .180 -.163 -1.804 .075
Quota 1.002 .445 .287 2.254 .027
Postal .364 .254 .157 1.430 .156
Fax .259 .267 .089 .970 .335
Online_Email -.376 .231 -.167 -1.624 .108
Telephone .162 .269 .066 .602 .549
a. Dependent Variable: MCD1
Reference Sector: industry.

– 31 –
Table A1.2c: Regression Analysis of MCD2 – All Sampling Methods
Model
Variables Entered
Variables
Removed Method
dimension0
1 Telephone, Sector_Services, Panel, Response Rate, Fax, NMS_CandCountry,
Sector_RetailTrade, EffectiveSampleSize, Online_Email, Postal,
Sector_Construction, StatOffice_NationalBank, Quotaa
. Enter
a. All requested variables entered.
b. Dependent Variable: MCD2
Model Summary
Model
R R Square Adjusted R Square
Std. Error of the
Estimate
dimension0
1 .618a .382 .290 .39853
a. Predictors: (Constant), Telephone, Sector_Services, Panel, Response Rate, Fax,
NMS_CandCountry, Sector_RetailTrade, EffectiveSampleSize, Online_Email, Postal,
Sector_Construction, StatOffice_NationalBank, Quota
ANOVAb
Model
Sum of Squares df
Mean
Square F Sig.
1 Regression 8.542 13 .657 4.137 .000a
Residual 13.818 87 .159
Total 22.360 100
a. Predictors: (Constant), Telephone, Sector_Services, Panel, Response Rate, Fax,
NMS_CandCountry, Sector_RetailTrade, EffectiveSampleSize, Online_Email, Postal,
Sector_Construction, StatOffice_NationalBank, Quota
b. Dependent Variable: MCD2

– 32 –
Coefficientsa
Model
Unstandardized Coefficients
Standardized
Coefficients
t Sig. B Std. Error Beta
1 (Constant) 1.282 .251 5.116 .000
Response Rate -.002 .003 -.090 -.720 .473
EffectiveSampleSize .000 .000 -.333 -3.412 .001
NMS_CandCountry .049 .085 .052 .574 .567
StatOffice_NationalBank .052 .114 .055 .454 .651
Sector_Services .152 .113 .139 1.342 .183
Sector_Construction .167 .114 .155 1.470 .145
Sector_RetailTrade .426 .115 .386 3.712 .000
Panel -.178 .089 -.179 -2.004 .048
Quota .559 .219 .321 2.550 .013
Postal .204 .125 .176 1.624 .108
Fax .132 .132 .091 1.006 .317
Online_Email -.147 .114 -.131 -1.288 .201
Telephone .031 .133 .026 .236 .814
a. Dependent Variable: MCD2
Reference Sector: industry.

– 33 –
Table A1.3a: Regression Analysis of the Correlation Coefficients of BCS-Data and Their Respective Reference Series – Non quota samples
Variables Entered/Removedb
Model
Variables Entered
Variables
Removed Method
dimension0
1 Telephone, Sector_Services, Response Rate, Fax, Postal, Panel,
NMS_CandCountry, Sector_Construction, Online_Email, EffectiveSampleSize,
Sector_RetailTrade, StatOffice_NationalBanka
. Enter
a. All requested variables entered.
b. Dependent Variable: BS Correlation with its Reference Series
Model Summary
Model
R R Square Adjusted R Square
Std. Error of the
Estimate
dimension0
1 .497a .247 .121 19.72896
a. Predictors: (Constant), Telephone, Sector_Services, Response Rate, Fax, Postal,
Panel, NMS_CandCountry, Sector_Construction, Online_Email, EffectiveSampleSize,
Sector_RetailTrade, StatOffice_NationalBank
ANOVAb
Model Sum of Squares df Mean Square F Sig.
1 Regression 9175.007 12 764.584 1.964 .040a
Residual 28024.687 72 389.232
Total 37199.694 84
a. Predictors: (Constant), Telephone, Sector_Services, Response Rate, Fax, Postal, Panel,
NMS_CandCountry, Sector_Construction, Online_Email, EffectiveSampleSize, Sector_RetailTrade,
StatOffice_NationalBank
b. Dependent Variable: BS Correlation with its Reference Series

– 34 –
Coefficientsa
Model
Unstandardized Coefficients
Standardized
Coefficients
t Sig. B Std. Error Beta
1 (Constant) 89.063 12.787 6.965 .000
Response Rate -.130 .154 -.125 -.844 .402
EffectiveSampleSize .000 .003 -.016 -.137 .892
NMS_CandCountry 8.992 4.788 .214 1.878 .064
StatOffice_NationalBank 1.060 6.792 .025 .156 .876
Sector_Services 6.695 6.082 .138 1.101 .275
Sector_Construction 1.618 6.241 .032 .259 .796
Sector_RetailTrade -5.988 6.042 -.125 -.991 .325
Panel -10.197 5.276 -.225 -1.933 .057
Postal -4.786 6.470 -.080 -.740 .462
Fax -18.868 6.807 -.314 -2.772 .007
Online_Email -10.169 6.067 -.190 -1.676 .098
Telephone -6.630 8.455 -.093 -.784 .436
a. Dependent Variable: BS Correlation with its Reference Series
Reference sector: industry.

– 35 –
Table A1.3b: Regression Analysis of MCD1 – Non quota sampling
Variables Entered/Removedb
Model
Variables Entered
Variables
Removed Method
dimension0
1 Telephone, Sector_Services, Panel, Response Rate, Postal, Fax,
Online_Email, NMS_CandCountry, Sector_RetailTrade, EffectiveSampleSize,
Sector_Construction, StatOffice_NationalBanka
. Enter
a. All requested variables entered.
b. Dependent Variable: MCD1
Model Summary
Model
R R Square Adjusted R Square
Std. Error of the
Estimate
dimension0
1 .557a .310 .207 .80594
a. Predictors: (Constant), Telephone, Sector_Services, Panel, Response Rate, Postal,
Fax, Online_Email, NMS_CandCountry, Sector_RetailTrade, EffectiveSampleSize,
Sector_Construction, StatOffice_NationalBank
ANOVAb
Model Sum of Squares df Mean Square F Sig.
1 Regression 23.376 12 1.948 2.999 .002a
Residual 51.964 80 .650
Total 75.339 92
a. Predictors: (Constant), Telephone, Sector_Services, Panel, Response Rate, Postal, Fax,
Online_Email, NMS_CandCountry, Sector_RetailTrade, EffectiveSampleSize, Sector_Construction,
StatOffice_NationalBank
b. Dependent Variable: MCD1

– 36 –
Coefficientsa
Model
Unstandardized Coefficients
Standardized
Coefficients
t Sig. B Std. Error Beta
1 (Constant) 2.372 .511 4.639 .000
Response Rate -.003 .006 -.070 -.516 .607
EffectiveSampleSize .000 .000 -.287 -2.667 .009
NMS_CandCountry -.012 .189 -.007 -.065 .948
StatOffice_NationalBank .069 .265 .038 .260 .795
Sector_Services .397 .240 .191 1.658 .101
Sector_Construction .136 .238 .066 .574 .568
Sector_RetailTrade .849 .243 .401 3.494 .001
Panel -.298 .201 -.155 -1.485 .141
Postal .370 .254 .142 1.455 .150
Fax .277 .274 .103 1.010 .315
Online_Email -.341 .237 -.143 -1.439 .154
Telephone .123 .289 .044 .428 .670
a. Dependent Variable: MCD1
Reference sector: industry.

– 37 –
Table A1.3c: Regression Analysis of MCD2 – Non quota sampling
Variables Entered/Removedb
Model
Variables Entered
Variables
Removed Method
dimension0
1 Telephone, Sector_Services, Panel, Response Rate, Postal, Fax,
Online_Email, NMS_CandCountry, Sector_RetailTrade, EffectiveSampleSize,
Sector_Construction, StatOffice_NationalBanka
. Enter
a. All requested variables entered.
b. Dependent Variable: MCD2
Model Summary
Model
R R Square Adjusted R Square
Std. Error of the
Estimate
dimension0
1 .578a .334 .234 .40088
a. Predictors: (Constant), Telephone, Sector_Services, Panel, Response Rate, Postal,
Fax, Online_Email, NMS_CandCountry, Sector_RetailTrade, EffectiveSampleSize,
Sector_Construction, StatOffice_NationalBank
ANOVAb
Model Sum of Squares df Mean Square F Sig.
1 Regression 6.452 12 .538 3.346 .001a
Residual 12.857 80 .161
Total 19.309 92
a. Predictors: (Constant), Telephone, Sector_Services, Panel, Response Rate, Postal, Fax,
Online_Email, NMS_CandCountry, Sector_RetailTrade, EffectiveSampleSize, Sector_Construction,
StatOffice_NationalBank
b. Dependent Variable: MCD2

– 38 –
Coefficientsa
Model
Unstandardized Coefficients
Standardized
Coefficients
t Sig. B Std. Error Beta
1 (Constant) 1.262 .254 4.961 .000
Response Rate -.002 .003 -.074 -.558 .578
EffectiveSampleSize .000 .000 -.324 -3.058 .003
NMS_CandCountry .081 .094 .089 .866 .389
StatOffice_NationalBank -.001 .132 -.001 -.006 .995
Sector_Services .173 .119 .163 1.447 .152
Sector_Construction .121 .118 .116 1.026 .308
Sector_RetailTrade .437 .121 .407 3.615 .001
Panel -.205 .100 -.210 -2.050 .044
Postal .213 .126 .162 1.682 .096
Fax .114 .136 .084 .836 .406
Online_Email -.126 .118 -.105 -1.071 .287
Telephone -.013 .144 -.009 -.091 .928
a. Dependent Variable: MCD2
Reference sector: industry.

– 39 –
Table A1.4a: Regression Analysis of the Correlation Coefficients of BCS-Data and Their Respective Reference Series – Panels
Variables Entered/Removedb
Model
Variables Entered
Variables
Removed Method
dimension0
1 Telephone, Sector_Construction, Fax, NMS_CandCountry, Response Rate,
Sector_RetailTrade, Online_Email, Sector_Services, Postal,
EffectiveSampleSize, StatOffice_NationalBank, Quotaa
. Enter
a. All requested variables entered.
b. Dependent Variable: BS Correlation with its Reference Series
Model Summary
Model
R R Square Adjusted R Square
Std. Error of the
Estimate
dimension0
1 .766a .587 .296 23.45258
a. Predictors: (Constant), Telephone, Sector_Construction, Fax, NMS_CandCountry,
Response Rate, Sector_RetailTrade, Online_Email, Sector_Services, Postal,
EffectiveSampleSize, StatOffice_NationalBank, Quota
ANOVAb
Model Sum of Squares df Mean Square F Sig.
1 Regression 13299.466 12 1108.289 2.015 .091a
Residual 9350.401 17 550.024
Total 22649.867 29
a. Predictors: (Constant), Telephone, Sector_Construction, Fax, NMS_CandCountry, Response Rate,
Sector_RetailTrade, Online_Email, Sector_Services, Postal, EffectiveSampleSize,
StatOffice_NationalBank, Quota
b. Dependent Variable: BS Correlation with its Reference Series

– 40 –
Coefficientsa
Model
Unstandardized Coefficients
Standardized
Coefficients
t Sig. B Std. Error Beta
1 (Constant) 91.761 26.756 3.430 .003
Response Rate -.393 .288 -.340 -1.364 .190
EffectiveSampleSize .008 .009 .261 .970 .346
NMS_CandCountry 34.979 15.027 .600 2.328 .033
StatOffice_NationalBank .371 13.785 .007 .027 .979
Sector_Services 3.231 15.005 .052 .215 .832
Sector_Construction -8.490 16.444 -.131 -.516 .612
Sector_RetailTrade -29.923 15.279 -.482 -1.958 .067
Quota 44.588 57.139 .552 .780 .446
Postal -5.473 18.457 -.091 -.297 .770
Fax -51.755 37.544 -.338 -1.379 .186
Online_Email -6.711 12.693 -.118 -.529 .604
Telephone -50.202 32.632 -.681 -1.538 .142
a. Dependent Variable: BS Correlation with its Reference Series
Reference sector: industry.

– 41 –
Table A1.4b: Regression Analysis of MCD1 – Panels
Variables Entered/Removedb
Model
Variables Entered
Variables
Removed Method
dimension0
1 Telephone, NMS_CandCountry, Sector_Construction, Response Rate, Fax,
Sector_RetailTrade, Online_Email, Postal, Sector_Services,
StatOffice_NationalBank, EffectiveSampleSize, Quotaa
. Enter
a. All requested variables entered.
b. Dependent Variable: MCD1
Model Summary
Model
R R Square Adjusted R Square
Std. Error of the
Estimate
dimension0
1 .726a .527 .256 .85010
a. Predictors: (Constant), Telephone, NMS_CandCountry, Sector_Construction,
Response Rate, Fax, Sector_RetailTrade, Online_Email, Postal, Sector_Services,
StatOffice_NationalBank, EffectiveSampleSize, Quota
ANOVAb
Model Sum of Squares df Mean Square F Sig.
1 Regression 16.898 12 1.408 1.949 .087a
Residual 15.176 21 .723
Total 32.074 33
a. Predictors: (Constant), Telephone, NMS_CandCountry, Sector_Construction, Response Rate, Fax,
Sector_RetailTrade, Online_Email, Postal, Sector_Services, StatOffice_NationalBank,
EffectiveSampleSize, Quota
b. Dependent Variable: MCD1

– 42 –
Coefficientsa
Model
Unstandardized Coefficients
Standardized
Coefficients
t Sig. B Std. Error Beta
1 (Constant) 2.181 .961 2.269 .034
Response Rate -.003 .010 -.077 -.325 .749
EffectiveSampleSize -.001 .000 -.506 -2.023 .056
NMS_CandCountry -.280 .500 -.142 -.560 .581
StatOffice_NationalBank .017 .454 .009 .037 .971
Sector_Services .036 .449 .016 .080 .937
Sector_Construction .329 .481 .150 .685 .501
Sector_RetailTrade .819 .478 .358 1.713 .101
Quota 1.361 1.649 .451 .825 .418
Postal .638 .591 .299 1.079 .293
Fax 1.167 1.229 .203 .949 .353
Online_Email -.303 .433 -.146 -.699 .492
Telephone .353 .776 .147 .455 .654
a. Dependent Variable: MCD1
Reference sector: industry.

– 43 –
Table A1.4c: Regression Analysis of MCD2 – Panels
Variables Entered/Removedb
Model
Variables Entered
Variables
Removed Method
dimension0
1 Telephone, NMS_CandCountry, Sector_Construction, Response Rate, Fax,
Sector_RetailTrade, Online_Email, Postal, Sector_Services,
StatOffice_NationalBank, EffectiveSampleSize, Quotaa
. Enter
a. All requested variables entered.
b. Dependent Variable: MCD2
Model Summary
Model
R R Square Adjusted R Square
Std. Error of the
Estimate
dimension0
1 .725a .525 .253 .44443
a. Predictors: (Constant), Telephone, NMS_CandCountry, Sector_Construction,
Response Rate, Fax, Sector_RetailTrade, Online_Email, Postal, Sector_Services,
StatOffice_NationalBank, EffectiveSampleSize, Quota
ANOVAb
Model Sum of Squares df Mean Square F Sig.
1 Regression 4.583 12 .382 1.934 .090a
Residual 4.148 21 .198
Total 8.731 33
a. Predictors: (Constant), Telephone, NMS_CandCountry, Sector_Construction, Response Rate, Fax,
Sector_RetailTrade, Online_Email, Postal, Sector_Services, StatOffice_NationalBank,
EffectiveSampleSize, Quota
b. Dependent Variable: MCD2

– 44 –
Coefficientsa
Model
Unstandardized Coefficients
Standardized
Coefficients
t Sig. B Std. Error Beta
1 (Constant) 1.146 .503 2.279 .033
Response Rate -.002 .005 -.097 -.407 .688
EffectiveSampleSize .000 .000 -.573 -2.284 .033
NMS_CandCountry 5.769E-5 .261 .000 .000 1.000
StatOffice_NationalBank -.045 .237 -.044 -.190 .851
Sector_Services -.052 .235 -.045 -.222 .827
Sector_Construction .176 .251 .153 .699 .492
Sector_RetailTrade .358 .250 .300 1.433 .167
Quota 1.197 .862 .761 1.389 .180
Postal .391 .309 .351 1.263 .220
Fax .806 .643 .269 1.254 .223
Online_Email -.102 .226 -.095 -.453 .655
Telephone -.052 .406 -.042 -.129 .898
a. Dependent Variable: MCD2
Reference sector: industry.

– 45 –
Annex 2 – Regression Results: Driving factors of response rates

– 46 –
Table A2.1 – Determinants of response rates
Variables Entered/Removedb
Model
Variables Entered
Variables
Removed Method
dimension0
1 IncreaseRR, Sector_RetailTrade, InhabitantsInMillions,
StatOffice_NationalBank, Fax, Postal, Sector_Services, Telephone, Panel,
NMS_CandCountry, Online_Email, Sector_Construction, Quota,
EffectiveSampleSizea
. Enter
a. All requested variables entered.
b. Dependent Variable: Response Rate
Model Summary
Model
R R Square Adjusted R Square
Std. Error of the
Estimate
dimension0
1 .755a .570 .501 15.13257
a. Predictors: (Constant), IncreaseRR, Sector_RetailTrade, InhabitantsInMillions,
StatOffice_NationalBank, Fax, Postal, Sector_Services, Telephone, Panel,
NMS_CandCountry, Online_Email, Sector_Construction, Quota, EffectiveSampleSize
ANOVAb
Model Sum of Squares df Mean Square F Sig.
1 Regression 26382.446 14 1884.460 8.229 .000a
Residual 19922.544 87 228.995
Total 4630.990 101
a. Predictors: (Constant), IncreaseRR, Sector_RetailTrade, InhabitantsInMillions,
StatOffice_NationalBank, Fax, Postal, Sector_Services, Telephone, Panel, NMS_CandCountry,
Online_Email, Sector_Construction, Quota, EffectiveSampleSize
b. Dependent Variable: Response Rate

– 47 –
Coefficientsa
Model
Unstandardized Coefficients
Standardized
Coefficients
t Sig. B Std. Error Beta
1 (Constant) 66.861 7.437 8.991 .000
StatOffice_NationalBank 23.068 3.569 .538 6.464 .000
Panel -.287 3.709 -.006 -.077 .939
Quota 25.804 7.885 .326 3.272 .002
Sector_Services -5.811 4.271 -.117 -1.361 .177
Sector_Construction -1.215 4.369 -.025 -.278 .782
Sector_RetailTrade -4.145 4.320 -.084 -.959 .340
Postal -11.276 4.643 -.214 -2.429 .017
Fax 7.454 4.965 .113 1.501 .137
Online_Email .986 4.660 .019 .212 .833
Telephone -5.598 4.928 -.102 -1.136 .259
NMS_CandCountry .659 3.540 .015 .186 .853
InhabitantsInMillions -.155 .100 -.168 -1.540 .127
EffectiveSampleSize .003 .002 .130 1.231 .221
IncreaseRR 3.436 3.718 .072 .924 .358
a. Dependent Variable: Response Rate
Reference sector: industry

– 48 –
Annex 3 – Coding plan

– 49 –
All the codings are based on the BS metadata collected by ECFIN (2013b), except for InhabitantsInMillions.
ResponseRate … Response rate according to ECFIN (2013b)30
StatOffice_NationalBank … Conducting Institute is a statistical office or a national bank
0 .... No: CBI (UK), Chamber of Commerce (MT), EIB (NL), EK (FI), EXPERIAN (UK), GKI (HU), IFO (DE), IOBE (EL), IPSOS (HR), IPSOS (ME), IPSOS (MK), KI (EE), KMFA (AT), KONJ (SE), MINETUR (ES), SIMPLE LOGICA (ES), UCY (CY), WIFO (AT)
1 .... Yes: CBS (NL), Central Bank (ME), CZSO (CZ), DST (DK), INE (PT), INSEE (FR), INSSE (RO), ISTAT (IT), LS (LV), NBB (BE), NSI (BG), STAT (LT), STAT (PL), STAT (SI), STATEC (LU), STATISTICS (SK), TCMB (TR), TURKSTAT (TR)
NMS_CandCountry … Survey is conducted in a New EU Member State or a candidate country
0 .... No: AT, BE, DE, DK, EL, ES, FI, FR, IE, IT, LU, NL, PT, SE, UK 1 .... Yes: BG, CY, CZ, EE, HR, HU, LT, LV, ME, MK, MT, PL, RO, SI, SK, TR
Panel … Survey could be identified to be based on a panel according to ECFIN (2013b)
0 .... No: BG (Industry, Services, Construction, Retail Trade), CY (Industry, Services, Construction, Retail Trade), CZ (Industry, Services, Construction, Retail Trade), DK (Industry, Services, Construction, Retail Trade), EL (Industry, Services, Construction, Retail Trade), ES (Industry, Services, Construction, Retail Trade), FI (Industry, Services, Construction, Retail Trade), FR (Industry, Services, Construction, Retail Trade), HU (Industry, Services, Construction, Retail Trade), LT (Industry, Services, Construction, Retail Trade), LU (Industry, Services, Construction, Retail Trade), ME (Industry, Services, Construction, Retail Trade), MK (Industry, Services, Construction, Retail Trade), NL (Industry, Services, Construction, Retail Trade), PL (Industry, Services, Construction, Retail Trade), PT (Industry, Services, Construction, Retail Trade), RO (Industry, Services, Construction, Retail Trade), SE (Industry, Services, Construction, Retail Trade), SI (Industry), SK (Industry, Services, Construction, Retail Trade)
1 .... Yes: AT (Industry, Services, Construction, Retail Trade), BE (Industry, Services, Construction, Retail Trade), DE (Industry, Services, Construction, Retail Trade), EE (Industry, Services, Construction, Retail Trade), HR (Industry, Services, Construction, Retail Trade), IT (Industry, Services, Construction, Retail Trade), LV (Industry, Services, Construction, Retail Trade), MT (Industry, Services, Construction, Retail Trade), SI
30 Except for the Austrian surveys of industry, services and construction (conducted by WIFO), where the response rate was set (raised) to 70% which corresponds to the theoretical response rate achievable through more strict policies of panel clearing up and is equivalent to the response rates achieved in Germany where a similar survey methodology is employed..

– 50 –
(Services, Construction, Retail Trade), TR (Industry, Services, Construction, Retail Trade), UK (Industry, Services, Construction, Retail Trade)
Quota … Survey could be identified to be based on a panel according to ECFIN (2013b), e.g. replacement of non responding firms with “similar” ones
0 ...... No: AT (Industry, Services, Construction, Retail Trade), BE (Industry, Services, Construction, Retail Trade), BG (Industry, Services, Construction, Retail Trade), CZ (Industry, Services, Construction, Retail Trade), DE (Industry, Services, Construction, Retail Trade), DK (Industry, Services, Construction, Retail Trade), EE (Industry, Services, Construction, Retail Trade), EL (Industry, Services, Construction, Retail Trade), ES (Industry, Services, Construction, Retail Trade), FI (Industry, Services, Construction, Retail Trade), FR (Industry, Services, Construction, Retail Trade), HR (Industry, Services, Construction, Retail Trade), HU (Industry, Services, Construction, Retail Trade), LT (Industry, Services, Construction, Retail Trade), LU (Industry, Services, Construction, Retail Trade), LV (Industry, Services, Construction, Retail Trade), ME (Industry, Services, Construction, Retail Trade), MK (Industry, Services, Construction, Retail Trade), MT (Industry, Services, Construction, Retail Trade), NL (Industry, Services, Construction, Retail Trade), PL (Industry, Services, Construction, Retail Trade), PT (Industry, Services, Construction, Retail Trade), RO (Industry, Services, Construction, Retail Trade), SE (Industry, Services, Construction, Retail Trade), SI (Industry, Services, Construction, Retail Trade), SK (Industry, Services, Construction, Retail Trade), TR (Industry, Services, Construction, Retail Trade), UK (Industry, Services, Construction, Retail Trade)
1 .... Yes: CY (Industry, Services, Construction, Retail Trade), IT (Industry, Services, Construction, Retail Trade)
MethodsNo … Number of different fieldwork methods applied (postal, online/email, fax, telephone, face to face)
IncreaseRR … Measures to increase response rates are taken
0 .... No: AT (Retail Trade), BG (Industry, Services, Construction, Retail Trade), DE (Industry, Construction, Retail Trade), EL (Industry, Services, Construction, Retail Trade), ES (Industry, Construction), HR (Industry, Services, Construction, Retail Trade), HU (Industry, Services, Construction, Retail Trade), LU (Industry, Services, Construction, Retail Trade), ME (Industry, Services, Construction, Retail Trade), MK (Industry, Services, Construction, Retail Trade), NL (Industry, Services, Construction, Retail Trade), RO (Industry, Services, Construction, Retail Trade),
1 .... Yes: AT (Industry, Services, Construction), BE (Industry, Services, Construction, Retail Trade), CY (Industry, Services, Construction, Retail Trade), CZ (Industry, Services,

– 51 –
Construction, Retail Trade), DE (Services), DK (Industry, Services, Construction, Retail Trade), EE (Industry, Services, Construction, Retail Trade), ES (Services, Retail Trade), FI (Industry, Services, Construction, Retail Trade), FR (Industry, Services, Construction, Retail Trade), IT (Industry, Services, Construction, Retail Trade), LT (Industry, Services, Construction, Retail Trade), LV (Industry, Services, Construction, Retail Trade), MT (Industry, Services, Construction, Retail Trade), PL (Industry, Services, Construction, Retail Trade), PT (Industry, Services, Construction, Retail Trade), SE (Industry, Services, Construction, Retail Trade), SI (Industry, Services, Construction, Retail Trade), SK (Industry, Services, Construction, Retail Trade), TR (Industry, Services, Construction, Retail Trade), UK (Industry, Services, Construction, Retail Trade)
InhabitantsInMillions … Country size measured in millions of inhabitants
EffectiveSampleSizeInThousands … Effective Sample Size (net sample) in thousands
Postal … Respondents are addressed and responses are collected by post
0 .... No 1 .... Yes
Fax … Respondents are addressed and responses are collected by fax
0 .... No 1 .... Yes
Telephone … Respondents are addressed and responses are collected by telephone
0 .... No 1 .... Yes
Online/Email … Respondents are addressed and responses are collected by internet and email
0 .... No 1 .... Yes
Sector_Industry … Industry survey (reference category)
0 .... No 1 .... Yes
Sector_Services … Service sector survey
0 .... No

– 52 –
1 .... Yes
Sector_Construction … Building/construction sector survey
0 .... No 1 .... Yes
Sector_RetailTrade … Retail trade survey
0 .... No 1 .... Yes

– 53 –
Annex 4 – Abbreviations

– 54 –
Abbreviations
AAPOR American Association for Public Opinion Research BS Business Surveys ECFIN European Commission, Directorate General for Economic and Financial
Affairs GS Gross sample (number of units chosen to take part in a given survey) JHP Joint Harmonised EU Programme of Business and Consumer Surveys NS Net sample (number of units actually answering a given survey) RR Response rate (also known as completion rate or return rate) WIFO Austrian Institute of Economic Research