response of southern ocean circulation to global...
TRANSCRIPT

Response of Southern Ocean circulation to global warmingmay enhance basal ice shelf melting around Antarctica
Tore Hattermann Æ Anders Levermann
Received: 28 January 2009 / Accepted: 25 July 2009 / Published online: 26 August 2009
� Springer-Verlag 2009
Abstract We investigate the large-scale oceanic features
determining the future ice shelf–ocean interaction by ana-
lyzing global warming experiments in a coarse resolution
climate model with a comprehensive ocean component.
Heat and freshwater fluxes from basal ice shelf melting
(ISM) are parameterized following Beckmann and Goosse
[Ocean Model 5(2):157–170, 2003]. Melting sensitivities
to the oceanic temperature outside of the ice shelf cavities
are varied from linear to quadratic (Holland et al. in J Clim
21, 2008). In 1% per year CO2-increase experiments the
total freshwater flux from ISM triples to 0.09 Sv in the
linear case and more than quadruples to 0.15 Sv in the
quadratic case after 140 years at which 4 9 280 ppm =
1,120 ppm was reached. Due to the long response time of
subsurface temperature anomalies, ISM thereafter increa-
ses drastically, if CO2 concentrations are kept constant at
1,120 ppm. Varying strength of the Antarctic circumpolar
current (ACC) is crucial for ISM increase, because south-
ward advection of heat dominates the warming along the
Antarctic coast. On centennial timescales the ACC acce-
lerates due to deep ocean warming north of the current,
caused by mixing of heat along isopycnals in the Southern
Ocean (SO) outcropping regions. In contrast to previous
studies we find an initial weakening of the ACC during the
first 150 years of warming. This purely baroclinic effect is
due to a freshening in the SO which is consistent with
present observations. Comparison with simulations with
diagnosed ISM but without its influence on the ocean
circulation reveal a number of ISM-related feedbacks, of
which a negative ISM-feedback, due to the ISM-related
local oceanic cooling, is the dominant one.
1 Introduction
The unique zonally unblocked topography in the Southern
Ocean (SO) gives rise to the Antarctic circumpolar current
(ACC), the strongest oceanic circulation on Earth. Con-
necting the Atlantic, Pacific and Indian basin, it is on the
one hand a major contributor to worldwide ocean ventila-
tion. On the other hand, the strong and deep reaching zonal
current is limiting the meridional oceanic transport.
Therefore, it partly isolates the ocean south of the current
from the northern circulation (England 1993; Rintoul et al.
2001).
The zonal momentum of the ACC is balanced by several
forces. According to Borowski et al. (2002), the largest
contribution is geostrophic, due to a meridional pressure
gradient across the current. The pressure gradient arises
from surface displacement (barotropic), as well as from the
internal density distribution (baroclinic). Although wind
stress induces strong zonal momentum at the surface, it
cannot accelerate the water further down in the ocean
because of blocked geopotential contours. Instead, it con-
tributes indirectly to the geostrophic component via
meridional Ekman transport as discussed extensively by,
e.g. Olbers et al. (2004, 2006) and Gent et al. (2001).
Model studies indicate that global warming will enhance
the meridional density gradient and strengthen the current
(Bi et al. 2002). According to recent observations, rising
atmospheric temperatures may have already caused a
warming of the deep ocean within the ACC (Boning et al.
2008; Gille 2002).
T. Hattermann (&) � A. Levermann
Earth System Analysis,
Potsdam Institute for Climate Impact Research,
Potsdam University, Telegrafenberg A62,
14473 Potsdam, Germany
e-mail: [email protected]; [email protected]
123
Clim Dyn (2010) 35:741–756
DOI 10.1007/s00382-009-0643-3

The processes responsible for a meridional transport
across the ACC are still poorly understood but seem to be
caused by eddy diffusive processes and the meridional
component of the predominantly zonal flow (Olbers et al.
2004). A main energy source for mixing is the density
gradient across the ACC which is hence correlated to the
strength of the geostrophic current itself. Thus, the ACC
strength plays an important role in determining the heat
budget of the SO.
South of the ACC, Circumpolar Deep Water is mixed
with the coastal water masses in the currents of the large
Southern Hemisphere Subpolar Gyres in the Ross and
Weddell Sea (SPGs hereafter) (Bergamasco et al. 2002;
Schroder and Fahrbach 1999; Gill 1972). In these regimes,
deep and bottom water is formed (Orsi et al. 1999), and
heat is transported towards the Antarctic continent.
With an area of 1.5 9 106 km2, approximately 40% of
the Antarctic continental shelf is covered by massive
floating ice shelves, acting as a lid on the ocean. This
causes a complex circulation system within submarine
cavities (Williams et al. 1998). The presence of Antarctic
ice shelves is considered to influence the flow speed of the
adjacent continental ice (Scambos et al. 2004; Rignot et al.
2004). Observations, as well as numerical models, show
that the amount of ice shelf melting (ISM) is crucial for the
mass balance of ice shelves and might be strongly sensitive
to climate change (Walker and Holland 2007; Rignot and
Jacobs 2002; Williams et al. 2001). Moreover, the
hydrology around the Antarctic continent is strongly
affected by the interaction with the floating ice (Saenko and
Weaver 2004) and varying saltwater fluxes in the SO may
have caused significant changes in the global ocean cir-
culation (Jacobs et al. 2002) in the past. Within the last
decades, regional atmospheric and oceanographic changes
in the SO have been observed (Jacobs et al. 2002). In the
future, the interaction of different processes, e.g. ocean
warming (Boning et al. 2008), increasing precipitation
(Thomas et al. 2008), varying sea ice cover (Curran et al.
2003; Cavalieri et al. 2003) and melting of the Antarctic
ice sheet and shelves (Alley et al. 2005), might reveal
internal feedback mechanisms that influence the global
climate system as a whole (Swingedouw et al. 2008a, b).
Various attempts have been made to understand the ice
shelf–ocean interaction by using regional high resolution
models (Holland et al. 2008; Smedsrud et al. 2006; Gros-
feld and Sandhager 2004; Lange et al. 2005). In combi-
nation with observations, these studies have provided a fair
understanding of the different processes that govern basal
ISM on a local scale. In addition, ISM seems to have
considerable influence on large scale ocean circulation
(Losch 2008) and several studies have proposed that oce-
anic warming is the reason for increasing mass loss from
the grounded Antarctic ice sheet (Payne et al. 2004).
However, very little is known about the link between rising
atmospheric temperatures and increasing ISM, because the
sub-shelf cavity circulation is connected to the ocean at
great depth. Moreover, the inclusion of ISM in global
circulation models (GCMs) is hampered by incompatibility
of grid sizes and complex boundary conditions. To our
knowledge, there are no studies that focus on the effects of
varying ISM in coupled global warming simulations.
Here we combine the coupled global climate model
CLIMBER-3a with a coarse resolution ISM parameteri-
zation as introduced by Beckmann and Goosse (2003) and
generalized by Holland et al. (2008). An implementation of
this parameterization into a sea–ice–ocean circulation
model has shown significant regional and global impacts,
as well as a more realistic representation of present-day sea
ice cover (Wang and Beckmann 2007). However, due to
the simplicity of the ISM parameterization and the
coarseness of our model, we do not attempt to predict the
ice shelf–ocean interaction quantitatively. Instead, we want
to understand the SO processes that would lead global
warming to affect the ice shelves. Within this scope, we
apply the parameterization to investigate the role of sub-
surface freshwater and heat fluxes from ISM itself.
2 Model description and experiments
2.1 The global coupled climate model CLIMBER-3a
The global coupled climate model CLIMBER-3a (Montoya
et al. 2005) combines a three-dimensional ocean general
circulation model based on the GFDL MOM-3 code with a
statistical–dynamical atmosphere model (Petoukhov et al.
2000) and a dynamic and thermodynamic sea–ice model
(Fichefet and Maqueda 1997). The oceanic horizontal
resolution is 3.75� 9 3.75� with 24 variably spaced verti-
cal levels. In addition to a constant isopycnal diffusivity of
1,000 m2 s-1, mixing of tracers along surfaces of constant
density due to subgrid-scale eddies is parameterized fol-
lowing Gent and McWilliams (1990) with a constant
thickness diffusivity of 250 m2 s-1. We use an improved
version of the model, comprising a deeper Indonesian
throughflow and apply a background value of vertical
diffusivity of 0.3 9 10-4 m2 s-1 (Schewe and Levermann
2009). Thus the mixing induced upwelling in both the
Atlantic and Pacific ocean in this model is very small
(Mignot et al. 2006). In order to focus on baroclinic effects
due to the meltwater inflow, wind stress onto the ocean is
prescribed using a present-day climatology (Trenberth
et al. 1989).
The model has been compared to data for preindustrial
(Montoya et al. 2005) and glacial (Montoya and Levermann
2008) boundary conditions. Sensitivity experiments have
742 T. Hattermann, A. Levermann: Response of Southern Ocean circulation to global warming
123

been carried out with respect to North Atlantic surface
freshwater forcing (Levermann and Griesel 2004; Lever-
mann et al. 2005), global warming (Levermann et al.
2007a) and the reduction in SO winds (Levermann et al.
2007b; Schewe and Levermann 2009).
2.2 Basal melting parameterization
Fluxes directly at the ice shelf–ocean interface are dis-
cussed by Holland and Jenkins (1999). They are essentially
dependent on the local oceanic mixed layer temperature
along the base of the ice shelf.
Following Beckmann and Goosse (2003), heat loss and
corresponding fresh water flux due to ISM are introduced
along the six major Antarctic shelf ice regions in CLIM-
BER-3a (Fig. 1). The main assumption in this approach is,
that for each ice shelf the average oceanic mixed layer
temperature along the ice–ocean boundary is reduced by a
constant factor compared to the mean temperature outside
the ice shelf cavity. The approach is motivated by partial
recirculation and the associated cooling of the ice shelf
water within the cavity. The net heat flux H is assumed to
be proportional to the temperature difference between the
ocean outside the ice shelf cavity (To) and the pressure
melting point at the ice shelf edge (Tf). An effective melt
area is introduced as tuning parameter to obtain realistic
heat fluxes. It is given by the along-shelf width Dl in the
model geometry and an effective cross-shelf length L
(penetration length). Hence,
H ¼ qwcpcL
ZDl
0
dl To � Tf
� �; ð1Þ
where c = 10-4 m s-1 is the constant thermal exchange
velocity, qw = 1,000 kg m-3 is the reference density of
water and cp = 4,000 J(kg �C)-1 is the specific heat of
water.
For To, we choose the temperature at the southern
boundary of the model at a constant depth interval between
200 and 600 m along the inferred ice shelf area. This
corresponds to the approach of Beckmann and Goosse
(2003) and is a fair representation of the entrance of an ice
shelf cavity in a coarse resolution model. The salinity
dependent pressure melting point is determined in the same
area at 200 m depth.
Comparisons with high resolution models that resolve
the sub-shelf cavity circulation reveal a relatively uniform
penetration length on the order of a few kilometers under
various conditions (two and three equation melting for-
mulations) and different cavity geometries (Beckmann and
Goosse 2003). This implies, that for a first order approxi-
mation, the net melting can be parameterized by shelf ice
edge processes, even though a significant portion of the
melting occurs near or at the grounding line. Following
Wang and Beckmann (2007), we choose L = 10 km to
obtain realistic heat fluxes.
Note that the penetration length is not intended to
describe the spatial distribution of melt along the ice–ocean
interface. It rather determines an effective melt area by
reducing the across shelf length to a universal constant. In
combination with the temperature difference at the
entrance of the cavity, this area represents the size of an
ice–ocean interface, which yields heat fluxes corresponding
to the integrated melting obtained by a spatially varying
heat exchange at the real ice–ocean boundary.
Through latent heat Li = 3.34 9 105 J kg-1 and the
density of ice qi = 920 kg m-3, the heat flux is directly
converted into fresh water flux into the ocean F = H/(qiLi).
For each shelf, the fresh water flux is converted into annual
mean melt rates, using values for the shelf surface area as
calculated by Giovinetto and Bentley (1985).
Extending the linear approach by Beckmann and Goosse
(2003) and Holland et al. (2008) find a non-linear response
of ISM to warmer waters offshore from the ice front. By
using a high resolution model and scale analysis, they
propose the general applicability of a simplified quadratic
relationship between ocean temperature and ISM.
Here we introduce a varying exponent a in order to
investigate the effect of different parameterizations. The
constants in Eq. 1 are chosen to produce realistic melt rates
in preindustrial equilibrium. From this, we derive a proper
formulation for the non-linear approach, which matches the
Fig. 1 Representation of individual ice shelves (blue) in CLIMBER-
3a geometry, framing the ocean model boundary (gray). Length of
coastline in the model covered by ice shelves (white space due to
staggered grid). Ocean mean temperatures are diagnosed between 200
and 600 m depth and compared with the freezing point of sea water at
200 m depth. Sub-surface heat and fresh water fluxes are injected at
the same place
T. Hattermann, A. Levermann: Response of Southern Ocean circulation to global warming 743
123

linear case in equilibrium. The heat flux is thus computed
as
H ¼ qwcpcL
ZDl
0
dlDTequ
To � Tf
DTequ
� �a
; ð2Þ
where DTequ = (To - Tf)equ is the temperature difference
for the preindustrial equilibrium simulation and a [ [1,2].
Originally, the results of Holland et al. (2008) are based
on a temperature dependent exchange velocity within the
mixed layer, which however is set constant in Eq. 2.
Considering the above mentioned interpretation of L, c also
becomes a universal scaling parameter rather than a
physical quantity of an individual ice shelf.
2.3 Global warming experiments
Simulations presented here start from a multi millennia
integration (approx. 15,000 years) with preindustrial
boundary conditions of 280 ppm CO2 equivalent GHG
concentration. In addition to a preindustrial state without
ISM, we generate an equilibrium with the ISM para-
meterization applied according to Eq. 1 during the last
2000 years of the simulation. This simulation is used to
determine the equilibrium temperature difference, DTequ in
Eq. 2, for the approach with a non-linear response of ISM
to varying ocean temperature in the warming scenario.
Based on these equilibria, we run a scenario with a 1%
per year increase of CO2 until quadrupling after approx.
140 years, after which it is kept constant at 4 9 280 ppm =
1,120 ppm. This increase represents the upper end of the
IPCC scenarios and should be compared with the A2
simulations. With this forcing, the model is integrated over
a total period of 1,000 model years. In addition to one
experiment with no melt fluxes applied (noISM), we couple
both the heat and fresh water fluxes with different expo-
nentiation a = 1 and 2.0. In this coupled case, the applied
basal melt fluxes are calculated according to Eq. 2 for each
time step. In order to investigate the respective influence of
the fluxes separately, two supplementary experiments were
realized, where either the heat (fixH) or the freshwater flux
(fixF) is prescribed according to the equilibrium state. For
comparison of the different experiments, annual mean melt
fluxes are always diagnosed from the in situ temperature
and salinity field. Experiments are summarized in Table 1.
2.4 Representation of the Southern Ocean circulation
There are several limitations in the applied climate model,
which should be kept in mind while considering our results.
In this study we focus on large-scale circulations in the
SO. The performance of a realistic representation of these
features varies widely among present coarse resolution
models. The strength of the ACC is strongly dependent on
realistic topography and the proper representation of
baroclinicity due to forcing and internal mixing (Olbers
et al. 2006). With preindustrial equilibrium conditions,
CLIMBER-3a simulates the ACC with a volume transport
of approximately 71 Sv (71 9 106 m3) through the Drake
Passage, whereas observations indicate a total annual mean
transport of 134 ± 11.2 Sv (Cunningham et al. 2003).
Topography is only poorly represented due to the model’s
coarse resolution. Also eddy diffusive mixing processes,
which are probably important in the ACC, are only
parameterized. Moreover, coarse resolution models gene-
rally tend to blur density gradients, which may cause a
weaker current.
Nevertheless, our simulations show an Ekman pumping
induced geostrophic balance of baroclinic and barotropic
pressure gradients to be the main contributor to the ACC.
Hence, we claim to capture the main dynamics of the
current, which will show a qualitatively similar behavior
within a stronger and more realistic ACC.
Furthermore, we discuss the varying SPG strength and
its implications for southward advection of heat. Obser-
vations of SPG transport are generally sparse. However,
the simulated gyre strength of approximately 28 Sv for
the Ross and 46 Sv for the Weddell Gyre are close to the
values referred to in the model intercomparison of Wang
and Meredith (2008), assuming the barotropic component
of the Ross Gyre (which has not been measured yet) to
contribute to the overall transport with a similar fraction as
it is found for the Weddell Gyre. The simulated SPG
strength is also comparable to the values given by the 20
IPCC AR4 Coupled Climate Models gfdl_cm2_0 and the
ukmo_hadgem1 referred to in the same study. Similar to
the Northern Hemisphere Gyre (Born and Levermann
2009), Wang and Meredith (2008) emphasize the impor-
tance of the baroclinic structure of the SPGs, whereas they
find only a weak link between gyre strength and wind curl.
We analyze the varying SPG strength due to density
changes. With the same limitations as for the ACC, our
results will also be valid for a more realistic representation
of the SPGs, mainly depending on the quality of the
parameterized mixing processes.
Table 1 Experiments with different basal melt fluxes to the ocean
Exp. name a in Eq. 2 H to ocean F to ocean
noISM 1 None None
a = x x Coupled Coupled
fixH 1 Equ. rate Coupled
fixF 1 Coupled Equ. rate
In all experiments, hypothetical melt fluxes are diagnosed according
to Eq. 2 from the in situ temperature and salinity field
744 T. Hattermann, A. Levermann: Response of Southern Ocean circulation to global warming
123

Another strong limitation of our model is the fixed wind
stress on the ocean, which is prescribed by a present day
climatology throughout the entire simulation. Despite the
direct acceleration of large scale currents, wind stress is an
important energy source for upwelling in the SO. It sets up
the meridional density structure of the ACC and the SPGs
and causes warm deep water to enter the ice shelf cavities.
Thus varying wind stress needs to be considered for a
proper projection of SO circulation under global warming.
Nevertheless, our simulations allow clear identification of
the main mechanisms based on density changes, which
may be superimposed onto the effects of varying winds.
2.5 Validity of the ISM parameterization
In this study, we scale ISM in comparison to cavity-
resolving models to produce realistic melt rates for the
equilibrium simulation. To capture the sensitivity of ISM to
oceanic changes, we apply a generalized dependency on
bulk ocean properties. This is consistent within the frame
of the coarse resolution model, which is designed to
qualitatively analyze the interaction of a broad range of
different processes within the climate system. Neverthe-
less, this parameterization is a poor representation of the
net effect of the sub-shelf circulation, which depends
strongly on cavity shape, the effects of on-shelf sea–ice
growth (Nicholls 1997), shelf-break upwelling and tides.
These effects are not captured by our model and may
significantly alter the response of ISM to global warming.
Our model only parameterizes melt along the six largest
ice shelves around the Antarctic continent. Especially the
ice shelves in the Amundsen Sea and Bellinghausen Sea,
which are currently suspected to produce high melt rates in
response to climate change, are neglected (Rignot et al.
2008). Considering the resolution of the oceanic compo-
nent in CLIMBER-3a, these ice shelves are clearly on a
subgrid-scale and their cavity entrance would not be
properly represented in the model. Also the suggested
scaling by use of a general penetration length was only
done for larger ice shelves with different proportions in
previous studies. When trying to include them we obtained
very small melt rates due to their relatively small width.
Finally ice shelf cavities are evolving due to melt and
freezing, as well as internal ice dynamics. All associated
effects on ISM are neglected. This is partly justified
because regional high resolution model studies reproduce
realistic conditions and simulate the evolution of an ice
shelf–ocean system with dominant melt rates at the shelf
edge and at the grounding line (Grosfeld and Sandhager
2004; Williams et al. 2001). From those studies, we expect
low sensitivity of the penetration length to changes in the
shelf geometry, especially the decreasing distance from the
grounding line to the shelf edge.
However, the assumption of a static ice shelf in a
warming climate is unlikely to produce realistic melt
rates.If the warming signal is strong enough, shrinkage of
the ice–ocean interface is likely to occur in all areas of non-
marine ice sheets. Our approximation thus probably
increasingly overestimates the response of ISM during the
simulation.
Nevertheless, Walker and Holland (2007) show that the
adjustment of ice shelves to perturbations in ocean tem-
perature are on the order of several decades up to a few
centuries, which is much slower than the adjustment of the
circulation. Therefore, we may capture a realistic sensi-
tivity of melt rates associated with increasing oceanic
temperatures, given by our model at the beginning of the
simulation.
To account for the deficiencies of the ISM parameteri-
zation, the analysis in this study will be done on two
timescales: (1) in order to investigate the evolution of the
SO circulation under global warming and subsequent
implications for ISM, we regard the whole simulation
length; and (2) while analyzing the parameterized response
of ISM and its effect on ocean dynamics, we focus on the
first 200 years of the simulation, because we cannot trust
the assumption of static ice shelves on longer timescales.
3 Response of SO circulation to global warming
Rising atmospheric and oceanic temperatures due to global
warming affect the horizontal SO circulation in CLIMBER-
3a (Fig. 2). First, we analyze the geostrophic component of
the ACC and the SPGs without considering the influence of
ISM. In Sect. 5, we additionally consider the effect of ISM
on the circulation.
3.1 Geostrophic contribution to ACC
In the SO, the meridional density gradient between cold
dense water in the south (shallow pycnocline) and lighter
warm water in the north of the SO balances the ACC in
preindustrial equilibrium. The interjacent current com-
prises an area of outcropping isopycnals (Fig. 3a).
Integrating the geostrophic balance for a two-dimen-
sional cross-section from south (y = S) to north (y = N)
and from depth (z = H) to sea surface (z = g), the zonal
volume transport is given by
M ¼ZN
S
dy
Zg
H
dz � u ¼ZN
S
dy
Zg
H
dz�1
f q0
op
oy; ð3Þ
where u is the zonal velocity, p is the pressure, f the
Coriolis parameter and q0 = 1,035 kg m-3 the reference
density of seawater.
T. Hattermann, A. Levermann: Response of Southern Ocean circulation to global warming 745
123

Assuming the Boussinesque approximation and a con-
stant Coriolis parameter (f0 = -1.1 9 10-4 s-1), the
pressure term can be split into a sea surface elevation and a
baroclinic component. The zonal volume transport then
becomes
M ¼ �g
q0f0
ZN
S
dy
Z0
H
dz gq0 þZ0
z
dz0qðz0Þ
0@
1A
24
35: ð4Þ
Assuming a level of no motion, z = -L, at which the
barotropic pressure force in y-direction is balanced by its
baroclinic counterpart, we can replace the sea surface
elevation term to obtain
Fig. 2 a Timeseries of atmospheric CO2 and anomalies of global
mean surface air temperature, global mean sea surface temperature
and global mean deep ocean temperature from 500 to 2,000 m depth
for the noISM run. b Timeseries of maximum transport of Antarctic
circumpolar current (ACC) for different experiments. c Correlation
between ACC transport and potential energy difference across the
ACC averaged to 2,000 m depth for different experiments, as well as
linear fit (black line) with the slope, given in Eq. 6
Fig. 3 Horizontal velocity streamlines (black lines) averaged down
to 2,000 m depth. The meridional derivative of potential density
(colors) at 800 m depth south of 30�S shows the regions of strongest
outcropping. The slope of isopycnals in the ACC increases under
global warming in noISM. a Beginning of the simulation, b after
1,000 years
746 T. Hattermann, A. Levermann: Response of Southern Ocean circulation to global warming
123

M ¼ g
q0fL
Z0
�L
dzqðzÞ �Z0
�L
dz
Z0
z
dz0qðz0Þ
24
35
N
S
: ð5Þ
The term in square brackets equals (baroclinic) potential
energy (partial integration). Thus we expect the ACC
strength to correlate linearly with the meridional difference
of potential energy (Dv) across the ACC:
M ¼ 1
q0fDv ¼ g
q0f
Z0
�L
dzqðzÞz
24
35
N
S
ð6Þ
Figure 2c shows that volume transport through the
Drake Passage correlates well (r = 0.99) with the potential
energy difference down to 2,000 m depth between two
zonal rings north and south of the current. The diagnostic
areas for Dv are indicated in Fig. 6a. The slope (a =
8.8 m3 s(kg)-1) of the line is given by the constants in Eq.
6. For a solely geostrophic and zonally homogeneous
current, the line would meet the origin. The analyzed
density distribution here is heterogeneous across the SO
and very sensitive to the diagnostic area. The zonal ring in
the north does not entirely cover the extent of the current.
Therefore, the approximation of a bulk density that
accounts for the energy budget of the ACC is difficult to
fulfill. Note that according to Eq. 6, the significance of
density differences increases with depth.
In addition to the geostrophic component, direct
acceleration due to wind stress is an important energy
source. Atmospheric winds are prescribed during the
simulation and the effect of varying oceanic surface stress
due to decreasing sea ice cover is found to be small.
Hence the wind stress component is relatively constant
and does not cause the observed changes in ACC
strength.
3.2 Temporal evolution of the density field
To investigate the changes of the ACC under global
warming, we decompose the changes in potential energy
into respective contributions caused by salinity and tem-
perature. We analyze the noISM experiment and compute
the timeseries of the density field by only taking changes
either in temperature or salinity into account. The respec-
tive other field is kept in the equilibrium state for the whole
timeseries (Fig. 4a).
Under global warming, two competing effects determine
the density gradient across the current. Initially, the
warming leads to decreasing sea ice cover around Ant-
arctica, which reduces northward sea ice export (contours
Fig. 4b). This causes a strong freshening in the south that
weakens the meridional density gradient and decelerates
the ACC. The effect saturates after about 150 years, when
most of the sea ice has vanished. Furthermore, precipitation
increases at high latitudes and decreases the density gra-
dient (not shown).
The dominating long term effect is a strong warming
along the northern boundary of the current (Fig. 4c), which
yields to steepening isopycnals in the outcropping regions
Fig. 4 a Timeseries (noISM) of zonal mean potential energy
difference across the ACC averaged over upper 2,000 m depth for
no ISM. Dashed lines indicate the contribution from salinity changes
and temperature changes, respectively. A strong freshening in the
south initially slightly weakens the ACC. After 100 years, the
northerly warming enhances the difference in potential energy.
b Hofmueller diagram of zonal mean ocean heat flux. The black lineindicates the zonally averaged latitude of maximum ACC strength.
Contours indicate annual and zonal mean northward sea ice export
(mSv). Ocean heat uptake is strongest north of the ACC and expands
southward as the sea ice is melting. c Atlantic temperature anomaly
after 200 years over Atlantic overturning circulation (Sv, blackcontours) and SO isopycnals between 40�W and 20�W (bluecontours)
T. Hattermann, A. Levermann: Response of Southern Ocean circulation to global warming 747
123
(Fig. 3). Consequently, the volume transport through the
Drake Passage increases from 71 Sv initially to 102 Sv
after 1,000 model years.
3.3 Warming response of the Ross and Weddell Gyre
Similar to the North Atlantic Subpolar Gyre (Myers et al.
1996; Levermann and Born 2007), geostrophic currents
around centers of dense water contribute to the large
cyclonic eddies in the Ross and Weddell sea. The northern
boundaries of the SPGs merge with the ACC. In the south,
the approximately 2,000 m deep currents are limited by the
continental shelf break.
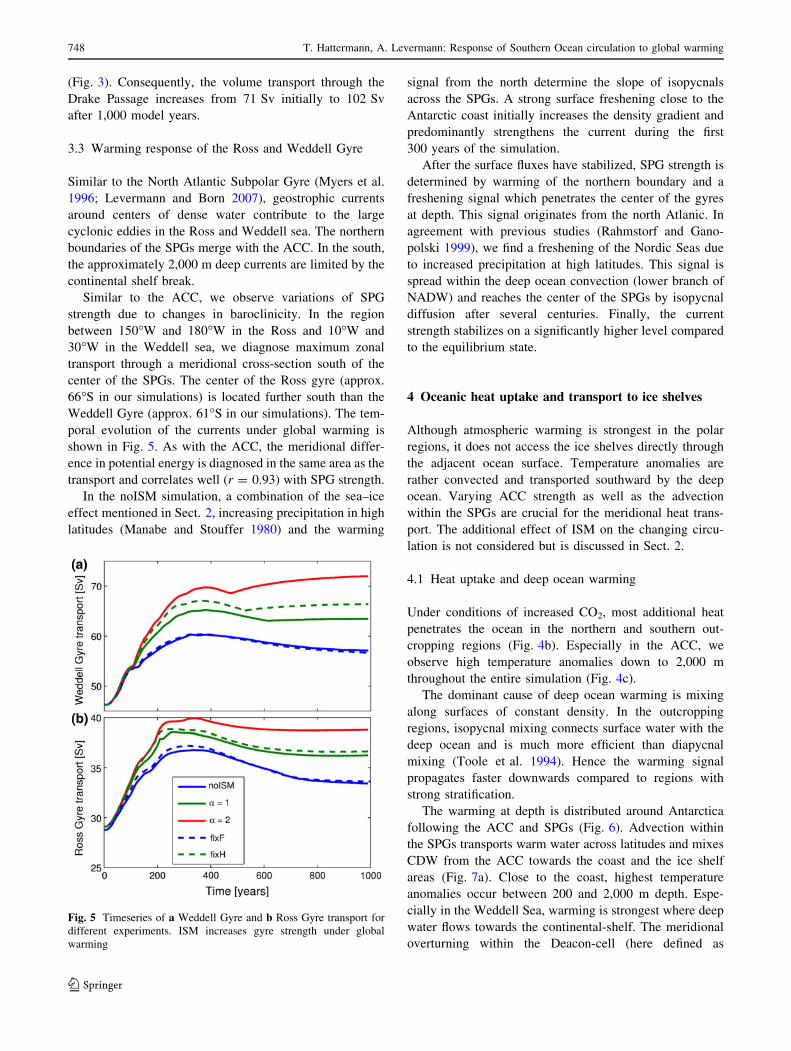
Similar to the ACC, we observe variations of SPG
strength due to changes in baroclinicity. In the region
between 150�W and 180�W in the Ross and 10�W and
30�W in the Weddell sea, we diagnose maximum zonal
transport through a meridional cross-section south of the
center of the SPGs. The center of the Ross gyre (approx.
66�S in our simulations) is located further south than the
Weddell Gyre (approx. 61�S in our simulations). The tem-
poral evolution of the currents under global warming is
shown in Fig. 5. As with the ACC, the meridional differ-
ence in potential energy is diagnosed in the same area as the
transport and correlates well (r = 0.93) with SPG strength.
In the noISM simulation, a combination of the sea–ice
effect mentioned in Sect. 2, increasing precipitation in high
latitudes (Manabe and Stouffer 1980) and the warming
signal from the north determine the slope of isopycnals
across the SPGs. A strong surface freshening close to the
Antarctic coast initially increases the density gradient and
predominantly strengthens the current during the first
300 years of the simulation.
After the surface fluxes have stabilized, SPG strength is
determined by warming of the northern boundary and a
freshening signal which penetrates the center of the gyres
at depth. This signal originates from the north Atlanic. In
agreement with previous studies (Rahmstorf and Gano-
polski 1999), we find a freshening of the Nordic Seas due
to increased precipitation at high latitudes. This signal is
spread within the deep ocean convection (lower branch of
NADW) and reaches the center of the SPGs by isopycnal
diffusion after several centuries. Finally, the current
strength stabilizes on a significantly higher level compared
to the equilibrium state.
4 Oceanic heat uptake and transport to ice shelves
Although atmospheric warming is strongest in the polar
regions, it does not access the ice shelves directly through
the adjacent ocean surface. Temperature anomalies are
rather convected and transported southward by the deep
ocean. Varying ACC strength as well as the advection
within the SPGs are crucial for the meridional heat trans-
port. The additional effect of ISM on the changing circu-
lation is not considered but is discussed in Sect. 2.
4.1 Heat uptake and deep ocean warming
Under conditions of increased CO2, most additional heat
penetrates the ocean in the northern and southern out-
cropping regions (Fig. 4b). Especially in the ACC, we
observe high temperature anomalies down to 2,000 m
throughout the entire simulation (Fig. 4c).
The dominant cause of deep ocean warming is mixing
along surfaces of constant density. In the outcropping
regions, isopycnal mixing connects surface water with the
deep ocean and is much more efficient than diapycnal
mixing (Toole et al. 1994). Hence the warming signal
propagates faster downwards compared to regions with
strong stratification.
The warming at depth is distributed around Antarctica
following the ACC and SPGs (Fig. 6). Advection within
the SPGs transports warm water across latitudes and mixes
CDW from the ACC towards the coast and the ice shelf
areas (Fig. 7a). Close to the coast, highest temperature
anomalies occur between 200 and 2,000 m depth. Espe-
cially in the Weddell Sea, warming is strongest where deep
water flows towards the continental-shelf. The meridional
overturning within the Deacon-cell (here defined as
Fig. 5 Timeseries of a Weddell Gyre and b Ross Gyre transport for
different experiments. ISM increases gyre strength under global
warming
748 T. Hattermann, A. Levermann: Response of Southern Ocean circulation to global warming
123

vertical–meridional streamfunction W in the SO) does not
increase significantly in strength but at 1,000 m depth it is
shifted towards a greater meridional extent. The slowest
warming occurs at the center of the SPGs. Here, advection
is weak and horizontal diffusion is limited by outcropping
isopycnals (Fig. 4c).
4.2 Southward advection of heat
Next we identify the dominant mechanism that distributes
the warming signal in the SO. We decompose the meridi-
onal heat transport into three different components. (1)
Zonal integration of the product of temperature and
meridional velocity from the surface to the sea bed gives
the advective component. (2) Analogous, the contribution
of eddy diffusion is obtained by replacing the meridional
velocity with the parameterized effective eddy transport
velocity (Gent and McWilliams 1990). (3) Isopycnal dif-
fusion is also parameterized but difficult to reproduce from
the model output. Instead we infer it from the ocean net
heat budget for preindustrial equilibrium, which should be
zero, taking the surface flux into account. Note that in our
model only resolved advection (1) causes volume transport,
whereas parameterized mixing (2) and (3) only propagates
ocean tracers.
With 0.24 PW (0.24 9 1015 W), advection provides the
largest southward heat transport between 50�S and 60�S,
while eddy diffusion contributes with 0.14 PW, in equi-
librium. The annual mean surface heat loss accounts for
0.45 PW, thus isopycnal diffusion should contribute with
0.07 PW. Hence, the net heat transport is relatively equally
distributed between resolved advection and parameterized
mixing.
By analyzing the temporal evolution of the different
components, we determine the main contributor to SO
Fig. 6 a Mean temperature anomaly in the SO averaged to 2,000 m
depth after 200 years in the noISM run. b Cross-section of meridional
mean temperature anomaly after 200 years in the gray shaded area in
a framing the Antarctic continent. SO warming is strongest below the
surface and coincides with large-scale advection pattern. Gray shadedareas in a also indicate areas where potential energy is determined in
Sect. 3
Fig. 7 a Zonal mean southward heat transport anomaly from
advection and eddy diffusion after 1,000 years (noISM). Contoursindicate the Deacon cell (Sv). Advection warms the SO below the
surface. b Hofmueller diagram of southward advective heat transport
in the noISM run (colors) and additional anomaly due to ISM with a= 1 (TW, contours). The total southward advection of heat is well
correlated with ACC strength. ISM causes additional heat transport in
the enhanced SPGs
T. Hattermann, A. Levermann: Response of Southern Ocean circulation to global warming 749
123
warming. The southward heat transport by eddy diffusion
rises with global warming due to an increased meridional
temperature gradient, but it does not exceed 0.5 PW.
Southward isopycnal diffusion cannot be computed, but
generally plays a minor role in the ACC, where it rather
transports heat to depth or northwards, following the out-
cropping isopycnals.
However, the meridional advection of heat increases
drastically up to 1.3 PW by the end of noISM (Fig. 7b).
Even if isopycnal diffusion would increase at a similar high
rate, the advective component would greatly exceed the
overall contribution from mixing. Moreover, the advective
heat transport is well correlated (r = 0.98) with zonal
volume transport through Drake passage, i.e. ACC
strength. Hence we conclude that the acceleration of the
ACC is crucial for ocean warming south of 60�S.
Although the distinction between advection and diffu-
sion is entirely a function of the coarse grid resolution, it
allows us to link the meridional heat transport directly to
the resolved large-scale flow. The meridional component of
the ACC continuously advects across latitudes. Thereby,
mixing reduces temperature gradients as warm water from
the northern regions with high oceanic heat uptake reaches
colder areas in the south and vice versa. Note that the role
of mixing in this process is different, compared to a purely
diffusive meridional transport of heat. It does not act in a
certain direction but rather mixes water masses with dif-
ferent properties which were advectively brought together.
Two effects strengthen this process under global
warming: (1) the increasing meridional temperature gra-
dient across the current enhances local mixing; and (2) the
accelerated current itself transports more heat across lati-
tudes and towards the mixing areas. The good correlation
between the (even partly decreasing) ACC strength and the
diagnosed meridional heat transport indicates that
increasing volume transport is more important than the
rising temperature gradient.
In Sect. 2, we have shown that the strengthening of the
ACC and the SPGs is caused by the deep ocean warming
north of the currents. Therefore, the increased SO heat
uptake enhances warming close to the Antarctic coast (and
associated ISM) in two ways. On the one hand, meridional
mixing of heat is directly enhanced by larger temperature
gradients. On the other hand, advection of heat is enhanced
within the accelerated large-scale circulation.
5 Meltrates in equilibrium and under global warming
Parameterized ISM in equilibrium reproduces results from
earlier studies. Under global warming, melt rates increase
drastically. Local cooling due to ISM limits the increase.
The applied freshwater flux affects the response of SO
circulation to global warming.
5.1 Evolution of ISM and coupling effects
Heat and freshwater fluxes, as well as melt rates, for the
coupled preindustrial equilibrium are shown in Table 2.
The values are comparable to those found by Beckmann
and Goosse (2003), which applied ECMWF and NCEP
climatologies to force a cavity resolving regional ocean
circulation model. Comparison with another study of
Hellmer (2004), which also simulates ice shelf cavities
within a regional high resolution ocean circulation model
shows similar melt rates, as given in Table 2. The dis-
crepancy between freshwater fluxes and melt rates for the
Amery and the Eastern-Weddell ice shelves is due to dif-
ferent ice shelf areas used for computation in the study of
Hellmer (2004). The total applied fresh water fluxes of all
different studies are between 28 and 30 mSv. Without
coupling, the values are generally higher due to the absence
of local ISM cooling.
Only at the Amery ice shelf (AIS) is our ISM one order
of magnitude higher than predicted by Hellmer (2004).
This is most likely an overestimate due to the poorly
resolved topography, since the ice shelf is not protected by
any continental shelf in our model geometry. However,
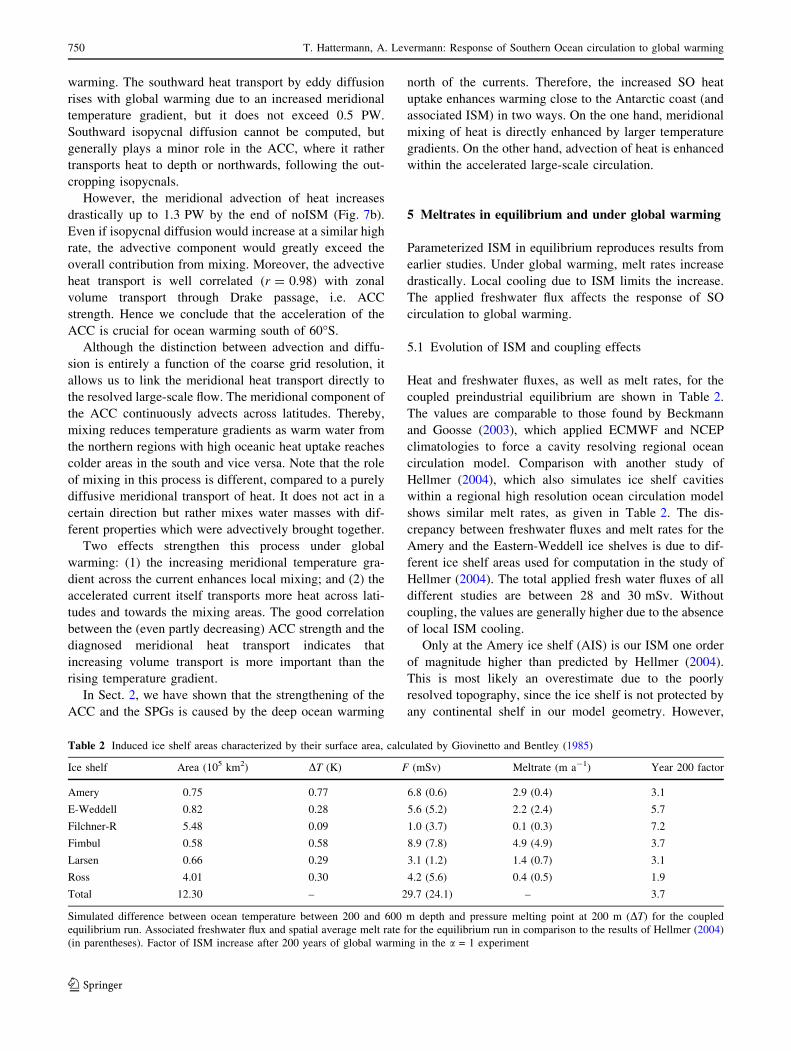
Table 2 Induced ice shelf areas characterized by their surface area, calculated by Giovinetto and Bentley (1985)
Ice shelf Area (105 km2) DT (K) F (mSv) Meltrate (m a-1) Year 200 factor
Amery 0.75 0.77 6.8 (0.6) 2.9 (0.4) 3.1
E-Weddell 0.82 0.28 5.6 (5.2) 2.2 (2.4) 5.7
Filchner-R 5.48 0.09 1.0 (3.7) 0.1 (0.3) 7.2
Fimbul 0.58 0.58 8.9 (7.8) 4.9 (4.9) 3.7
Larsen 0.66 0.29 3.1 (1.2) 1.4 (0.7) 3.1
Ross 4.01 0.30 4.2 (5.6) 0.4 (0.5) 1.9
Total 12.30 – 29.7 (24.1) – 3.7
Simulated difference between ocean temperature between 200 and 600 m depth and pressure melting point at 200 m (DT) for the coupled
equilibrium run. Associated freshwater flux and spatial average melt rate for the equilibrium run in comparison to the results of Hellmer (2004)
(in parentheses). Factor of ISM increase after 200 years of global warming in the a = 1 experiment
750 T. Hattermann, A. Levermann: Response of Southern Ocean circulation to global warming
123

changes in the SO circulation presented in this study are
mainly caused by varying ISM in the Ross and Weddell
Sea. Therefore, the mismatch at the remote AIS will
probably not influence our results qualitatively.
Changes in hydrology due to ISM compare well with
previous studies (Wang and Beckmann 2007; Hellmer
2004; Beckmann and Goosse 2003). Cooling and freshen-
ing occurs close to the ice shelf areas. Moreover, the
freshening enhances stratification, which reduces vertical
mixing. Consequently, large parts of the SO below 500 m
are warmer and more saline compared to the control
experiment. Colder surface waters between 65�S and 60�S
lead to increased sea ice concentration and less heat loss
during winter.
The large-scale circulations which undergo significant
changes under global warming remain nearly unchanged in
the equilibrium when ISM is included. These include the
ACC, SPGs, AABW, AMOC and the North Atlantic Sub-
polar Gyre.
Under global warming, ISM is determined by rising
temperatures in the deep SO (Fig. 8). Section 4 illustrates
how additional heat is transported towards the ice shelves.
The warming signal at depth continues several centuries
after CO2 and global mean temperature have stabilized
(Fig. 2a). After the first 200 years, the ocean south of 62�S
has warmed about 0.74 K for the noISM and 0.85 K for the
a = 2 experiment (Fig. 8a). After 1,000 years, we find
temperature anomalies between 1.95 K for the noISM and
2.98 K for the a = 2 experiment. At the end of the sim-
ulation, no equilibrium state was reached.
After 200 years, the initial temperature differences at
each shelf (a = 1) have increased by the factors given in the
last column in Table 2. Thus increased F, and melt rates
may be computed by multiplying the factor with the
equilibrium values. The obtained total basal meltwater rate
of 0.03 Sv initially, increases rapidly and reaches between
0.11 Sv (a = 1) and 0.25 Sv (a = 2) after 200 years. After
four centuries the increase saturates to reach between
0.21 Sv (a = 1) and 0.77 Sv (a = 2) at the end of the
simulation. However, it should be noted that values given
here are based on the assumption of a constant ice shelf
geometry, which is highly disputable for the entire simu-
lation time (Sect. 5).
5.2 Basal melting feedbacks on SO response
to warming
In the coupled case, a local negative feedback reduces ISM
in comparison to noISM, where melt fluxes are calculated
without applying them to the ocean. Cooling of the coastal
water is not fully compensated by additional southward
mixing of heat. Therefore, the fixF experiment reproduces
similar melt rates as noISM, whereas melt rates in the fixH
experiment compare well to the a = 1 experiment
(Fig. 8b). In addition, the heat flux from ISM has no sig-
nificant influence onto the large-scale ocean dynamics.
The local influence of released freshwater from ISM is
relatively weak. Nevertheless, at injection depth it has a
measurable impact on the ocean dynamics and hence
indirectly alters the heat transport towards the coast
(Fig. 9a).
Additional SO warming is caused by stronger gyre cir-
culations due to ISM. ISM-related freshening of the SPG’s
southern boundaries increases the meridional density gra-
dient and significantly enhances the volume transport of the
currents (Fig. 5). The accelerated SPGs enhance southward
advection of heat (Fig. 7b). Therefore, the warming south
of 65�S and between 500 and 2,000 m is stronger with
increasing ISM (Fig. 9b).
A self-amplifying gyre-melting feedback loop may be
closed, because enhanced ocean warming causes higher
Fig. 8 Timeseries of a SO mean temperature anomaly between 500
and 2,000 m depth south of 62�S for different experiments. bTimeseries of total ISM fresh water flux in different experiments.
Basal melting increases as the deep ocean temperature increases and
enhances heat transport towards the SO
T. Hattermann, A. Levermann: Response of Southern Ocean circulation to global warming 751
123

freshwater flux from ISM, which again accelerates the gyre
circulation. However, in our model, this feedback is very
weak and does not cause higher melt rates in the coupled
simulation compared to noISM. Already in fixH, ISM is for
the most part determined by local cooling close to the
Antarctic coast. Comparison of the the fixH and fixF
experiment with an additional simulation, where ISM is
entirely fixed to equilibrium rates, shows that this negative
feedback on ISM is about five times larger compared to the
above mentioned positive gyre-melting feedback.
Moreover, ISM influences the response of the ACC to
global warming. In the coupled case, the current is
generally weaker compared to noISM (Fig. 2b). The
potential energy difference across the current is reduced by
both the salinity and the temperature field (not shown).
On the one hand, ISM causes a direct freshening south of
the ACC, which dampens the increase of the current. On
the other hand, the increased advection of heat due to the
accelerated SPGs reduces the temperature gradient across
the current.
Although the weaker ACC reduces the meridional heat
transport north of 55�S, deep ocean mean temperature
south of the ACC rises with increasing ISM (Fig. 8a). This
implies a minor role of the ACC response to ISM compared
to the SPG acceleration.
While the NADW is only marginally affected by ISM,
the formation of AABW initially diminishes due to the
warming and can only recover to a drastically reduced state
because of the freshwater flux in the coupled case.
6 Conclusion and discussion
6.1 Aim of the study
We analyze global warming experiments from the Earth
system model of intermediate complexity CLIMBER-3a in
order to tackle the question of how decadal- to centennial-
time-scale atmospheric warming may reach the Antarctic
ice shelves. To incorporate possible feedback mechanisms,
fluxes from ISM are inferred from an assumption on their
dependency on bulk ocean properties. Two major findings
are presented in this paper: (1) the strengthening ACC is
the largest contributor to additional warming of the SO,
leading to enhanced ISM under global warming; and (2)
three ISM related feedback loops influencing SO circula-
tion are identified (Fig. 10). Among these, local oceanic
cooling dominates and reduces ISM in the coupled case.
6.2 Southward advection of heat within the ACC
In agreement with observations (Boning et al. 2008),
atmospheric warming penetrates the deep ocean in the
southern outcropping regions in our model. The warming
causes a steepening of isopycnals and enhances ACC
volume transport on centennial timescales. This behavior
confirms previous coarse resolution modeling studies (Bi
et al. 2002), which found a correlation between ACC
strength and density difference across the current.
Warming of the SO and associated ISM is subsequently
dominated by varying ACC strength. Advection within the
current provides most of the southward oceanic heat
transport in our model. The processes causing meridional
overturning within the observed ACC are complex (Olbers
et al. 2004) and mixing of watermass properties across the
(a)
(b)
Fig. 9 a Mean density difference between a = 1 and noISM
experiment in the SO down to 1,000 m depth after 200 years.
Contours indicate the difference in salinity (psu) of the same
experiments in the same area. Density anomalies are directly caused
by freshening due to ISM. b Mean SO temperature difference at 500–
1,000 m depth between a = 2 and noISM experiment. Increasing ISM
causes additional warming of the SO
752 T. Hattermann, A. Levermann: Response of Southern Ocean circulation to global warming
123

current is not yet fully understood. We find that heat is
transported due to the meandering of the ACC across lati-
tudes and the associated meridional flow from warmer
latitudes to the colder south. This effect is enhanced within
a stronger ACC.
The validity of these results is restricted by the coarse-
ness of the oceanic resolution within CLIMBER-3a. For
example, meso-scale eddies, which are expected to be
important for the ACC (Garabato et al. 2007; Saenko and
Weaver 2003) are only parameterized. A more realistic
representation of mixing processes will probably change
the distribution of heat transport (Hallberg and Gnanade-
sikan 2006). However, Olbers et al. (2004) hypothesize
that both, the zonal current, as well as diffusive mixing due
to meso-scale eddies are caused by the meridional density
gradient across the current. Therefore, we propose that a
stronger ACC will be correlated with more meridional heat
transport for eddy resolving models, as well.
Moreover, in Sect. 4 we mentioned the weaker volume
transport of 71 Sv through the Drake Passage compared to
observations (Rintoul and Sokolv 2001). This discrepancy
needs to be addressed to obtain a realistic meridional heat
transport. However, we believe that the mechanisms
described here are qualitatively robust with respect to
model improvements, since they depend predominantly on
the geostrophic balance. We furthermore hypothesize that
the effects of advective mixing will be stronger for a
stronger ACC compared to the modelled one.
The decreasing ACC strength during the first century of
our simulation has not been observed in previous modeling
studies (Fyfe et al. 2007; Fyfe and Saenko 2006; Bi et al.
2002). During this period, a freshening of the southern
boundary of the ACC determines the slope of the isopyc-
nals. The combined effect of decreasing northward sea ice
export and increasing precipitation in southern high lati-
tudes weakens the ACC strength. This hypothesis is sup-
ported by an observed freshening trend at the southern
boundary of the current (Boning et al. 2008). Likewise,
enhanced precipitation is presently observed (Thomas et al.
2008).
However, the initial increase in ACC strength in other
models was probably due to increasing SO winds, which
are kept constant in our simulation, in order to see the
baroclinic adjustments more clearly. On the other hand, the
actual influence of varying wind stress on volume transport
within the ACC, as well as on ocean heat uptake, has
recently been questioned (Boning et al. 2008), again
emphasizing a greater importance of meso-scale eddies.
Anyway, the purely barotropic contribution of the winds to
the ACC is very weak (about 2 Sv) and any significant
wind-induced changes need to comprise a baroclinic
response. Further studies are needed to determine which
effects are dominant.
6.3 Ice shelf melting feedbacks and accuracy
of melt rates
Previous modeling studies have suggested large-scale and
global influences of ISM sub-surface fluxes on the ocean
circulation (Losch 2008; Wang and Beckmann 2007;
Hellmer 2004; Beckmann and Goosse 2003). These studies
were restricted to (partially regional) diagnostic simula-
tions of the present day climate conditions of rather short
integration time. In this study, the effect of ISM was
included in a coupled global climate model, which was
used to simulate the evolution of the SO circulation under
global warming for several centuries. However, this study
Fig. 10 Rising atmospheric temperatures (CO2) enhance SO warm-
ing and associated ISM in two ways. Isopycnal diffusion transports
heat to depth and increases the meridional temperature gradient across
the ACC (ocean heat uptake). In addition to increased southward
mixing of heat, the accelerated ACC enhances southward advection of
heat (ACC strength). Initially, steepening of isopycnals is dampened
by less northward export of sea–ice, until its decline saturates (not
shown). If basal melt fluxes are coupled to the ocean, ISM will be
weaker. Mixing limited local cooling at the shelves forms a
dominating negative feedback. Secondarily, the gyres reveal a self-
amplifying feedback with ISM. Melted freshwater increases the
across gyre density gradient (SPG strength), causing an additional
warming of the SO. As a minor negative feedback, ISM also dampens
the increase of ACC strength
T. Hattermann, A. Levermann: Response of Southern Ocean circulation to global warming 753
123

is not meant to present a realistic projection under global
warming, but rather a sensitivity study emphasizing (and
potentially exaggerating) possible baroclinic mechanisms
which should be investigated in higher resolution models.
We find that freshwater fluxes from ISM increase drasti-
cally under global warming. However, the applied ISM
parameterization suffers from many deficiencies, as dis-
cussed in Sect. 5. It should be regarded as a zero order
approximation of the ocean’s sensitivity to ISM, as to be
consistent with the resolution of the entire oceanic com-
ponent. Within this framework, we find that ISM signifi-
cantly influences the large-scale circulation and may alter
the heat budget of the SO in several ways.
South of the ACC, heat is transported towards the
shelves by large cyclonic gyre circulations in the Ross and
Weddell sea, which strengthen under global warming. The
freshening from ISM additionally accelerates the SPGs and
enhances warming of the deep SO. This forms a positive
feedback with ISM, as indicated in Fig. 10.
Moreover, the enhanced meridional heat transport south
of the ACC weakens the meridional density gradient across
the current and dampens the ACC strengthening. But this
negative feedback seems to be of minor importance for the
heat budget.
Ice shelf melting is limited by local oceanic transport
(mainly mixing) of warm water towards the ice shelf. Melt
rates in the coupled experiment are reduced, because local
cooling of the adjacent ocean is not fully compensated for
by additional heat transport towards the coast.
Note that we cannot claim to properly capture even the
large-scale oceanic circulation on the continental shelves.
Even if our simplified response of ISM to oceanic warming
(Sect. 5) would produce realistic melt rates, the parame-
terization should be forced with a realistic representation of
the coastal waters, e.g. the heat exchange across the Ant-
arctic slope front. Generally, coarse resolution models tend
to blur tracer gradients. This could lead to both, over- and
underestimation of ISM, because neither varying temper-
ature gradients, nor circulation changes will be resolved
satisfactorily.
Another question is how quickly the fresh meltwater is
rising to the upper ocean layers, where it is less efficient in
altering the SPG circulation. Simulations with higher reso-
lution models (Losch 2008; Hellmer 2004) suggest that
the freshening signal rises rather quickly within the outer
rim of the gyres, which would weaken the mechanism
proposed here. In fact, we conducted another simulation
with a = 1, where ISM fluxes were stopped after
200 years. In this case, the circulation returned within less
than five decades to the noISM state.
Similar to the case of the ACC, it is necessary to addi-
tionally consider changes in wind stress due to climate
change for the SPGs, as well. They may also exceed the
buoyancy effects presented within this study.
Nevertheless, our results present a set of ISM effects
that will need to be considered, in order to fully understand
the future shelf ice–ocean interaction. Hence, they
emphasize the importance of a proper representation of
ISM effects for a realistic simulation of the SO circulation
in climate models.
Acknowledgments We are grateful to Alex Robinson for critical
reading of the manuscript.
References
Alley RB, Clark PU, Huybrechts P, Joughin I (2005) Ice-sheet and
sea-level changes. Science 310:456–460. doi:10.1126/science.
1114613
Beckmann A, Goosse H (2003) A parametrization of ice shelf-ocean
interaction for climate models. Ocean Model 5(2):157–170
Bergamasco A, Defendi V, Zambianchi E, Spezie G (2002) Evidence
of dense water overflow ot the ross sea shelf-break. Antarct Sc
14. doi:10.1017/S0954102002000,068
Bi D, Budd WF, Hirst AC, Wu X (2002) Response of the Antarctic
circumpolar current transport to global warming in a coupled
model. Geophys Res Lett 29(24):3927–3930
Boning C, Dispert A, Visbeck M, Rintoul SR, Schwarzkopf FU
(2008) The response of the Antarctic circumpolar current to
recent climate change. Nat Geosci 1. doi:10.1038/ngeo362
Born A, Levermann A (2009) The 8k event: abrupt transition of the
subpolar gyre towards a modern north atlantic circulation.
Nature (in revision)
Borowski D, Gerdes R, Olbers D (2002) Thermohaline and wind
forcing of a circumpolar channel with blocked geostrophic
contours. J Phys Oceanogr 32:2520–2539
Cavalieri DJ, Parkinson CL, Vinnikov KY (2003) 30-Year satellite
record reveals contrasting Arctic and Antarctic sea ice variabil-
ity. Geophys Res Lett 38. doi:10.1029/2003GL018,031
Cunningham SA, Alderson SD, King BA, Brandon MA (2003)
Transport and variability of the Antarctic circumpolar current in
drake passage. J Geophys Res 108. doi:10.1029/2001JC001,147
Curran MAJ, Ommen TD, Morgan VI, Palmer KLPAS (2003) Ice
core evidence for Antarctic sea ice decline since the 1950s.
Science 302. doi:10.1126/science.1087,888
England M (1993) Representing the global-scale water masses in
ocean general circulation models. J Phys Oceanogr 23:1523–
1552
Fichefet T, Maqueda MAM (1997) Sensitivity of a global sea ice
model to the treatment of ice thermodynamics and dynamics.
J Geophys Res 102:12609–12646
Fyfe JC, Saenko OA (2006) Simulated changes in the extratropical
Southern Hemisphere winds and currents. Geophys Res Lett
33:L06701. doi:10.1029/2005GL025332
Fyfe JC, Saenko OA, Zickfeld K, Eby M, Weaver AJ (2007) The role
of poleward intensifying winds on Southern Ocean warming.
J Clim (submitted)
Garabato ACN, , Stevens DP, Watson AJ, Roether W (2007) Short-
circuiting of the overturning circulation in the Antarctic
circumpolar current. Nature 447:194–197. doi:10.1038/
nature05832
Gent PR, McWilliams JC (1990) Isopycnal mixing in ocean
circulation models. J Phys Oceanogr 20:150–155
754 T. Hattermann, A. Levermann: Response of Southern Ocean circulation to global warming
123

Gent PR, Large WG, Bryan FO (2001) What sets the mean transport
through drake passage? J Geophys Res 1006:2693–2712
Gill AE (1972) Circulation and bottom water production in the
Weddell sea. Deep Sea Res 20:111–140
Gille ST (2002) Warming of the southern ocean since the 1950s.
Science 295. doi:10.1126/science.1065,863
Giovinetto MB, Bentley CR (1985) Surface balance in ice drainage
system of Antarctica. Antarct JUS 20:6–13
Grosfeld K, Sandhager H (2004) The evolution of a coupled ice shelf-
ocean system under different climate states. Glob Planet Change
42:107–132
Hallberg R, Gnanadesikan A (2006) The role of eddies in determining
the structure and response of the wind-driven southern hemi-
sphere overturning: results from the modeling eddies in the
southern ocean (meso) project. J Phys Oceanogr 36:2232–2252
Hellmer HH (2004) Impact of Antarctic ice shelf basal melting on sea
ice and deep ocean properties. Geophys Res Lett 31. doi:
10.1029/2004GL019,506
Holland DM, Jenkins A (1999) Modeling thermodynamic ice–ocean
interactions at the base of an ice shelf. J Phys Oceanogr
29:1787–1800
Holland PR, Jenkins A, Holland DM (2008) The response of ice shelf
basal melting to variations in ocean temperature. J Clim 21. doi:
10.1175/2007JCLI1909.1
Jacobs SS, Giulivi CF, Mele PA (2002) Freshening of the ross sea
during the late 20th century. Science 297. doi:10.1126/science.
1069,574
Lange MM, Blindow N, Breuer B, Grosfeld K, Kleiner T, Mohrholz
CO, Nicolaus M, Oelke C, Sandhager H, Thoma M (2005)
Numerical model studies of Antarctic ice-sheet ice-shelf ocean
systems and ice caps. Ann Glaciol 41:111–120
Levermann A, Born A (2007) Bistability of the subpolar gyre in a
coarse resolution climate model. Geophys Res Lett 34:L24605.
doi:10.1029/2007GL031732
Levermann A, Griesel A (2004) Solution of a model for the oceanic
pycnocline depth: scaling of overturning strength and meridional
pressure difference. Geophys Res Lett 31:L17302. doi:10.1029/
2004GL020678
Levermann A, Griesel A, Hofmann M, Montoya M, Rahmstorf S
(2005) Dynamic sea level changes following changes in the
thermohaline circulation. Clim Dyn 24:347–354. doi:10.1007/
s00382-004-0505-y
Levermann A, Mignot J, Nawrath S, Rahmstorf S (2007a) The role of
northern sea ice cover for the weakening of the thermohaline
circulation under global warming. J Clim 20:4160–4171
Levermann A, Schewe J, Montoya M (2007b) Lack of bipolar see-
saw in response to Southern Ocean wind reduction. Geophys Res
Lett 34(12):L12711. doi:10.1029/2007GL030255
Losch M (2008) Modeling ice shelf cavities in a z coordinate ocean
general circulation model. J Geophys Res 113. doi:10.1029/
2007JC004,368
Manabe S, Stouffer RJ (1980) Sensitivity of a global climate model to
an increase of CO2 concentration in the atmosphere. J Geophys
Res 85:5529–5554
Mignot J, Levermann A, Griesel A (2006) A decomposition of the
Atlantic meridional overturning circulation into physical com-
ponents using its sensitivity to vertical diffusivity. J Phys
Oceanogr 36:636–650
Montoya M, Levermann A (2008) Surface wind-stress threshold for
glacial atlantic overturning. Geophys Res Lett 35. doi:
10.1029/2007GL032,560
Montoya M, Griesel A, Levermann A, Mignot J, Hofmann M,
Ganopolski A, Rahmstorf S (2005) The earth system model of
intermediate complexity CLIMBER-3a. Part I: description and
performance for present day conditions. Clim Dyn 25:237–263.
doi:10.1007/s00382-005-0061-0
Myers P, Fanning A, Weaver A (1996) Jebar, bottom pressure torque,
and Gulf Stream separation. J Phys Oceanogr 26:671–683
Nicholls K (1997) Predicted reduction in basal melt rates of an
Antarctic ice shelf in a warmer climate. Nature 388:460–462
Olbers D, Borowski D, Vlker C, Wlff J (2004) The dynamical
balance, transport and circulation of the Antarctic circumpolar
current. Antarct Sci 16. doi:10.1017/S0954102004002,251
Olbers D, Lettmann K, Timmermann R (2006) Six circumpolar
currents—on the forcing of the Antarctic circumpolar current by
wind an mixing. Ocean Dyn 57. doi:10.1007/s10,236-
006-0087-9
Orsi AH, Johnson GC, Bullister JL (1999) Circulation, mixing, and
production of Antarctic bottom water. Prog Oceanogr 43:55–109
Payne A, Vieli A, Shepherd AP, Wingham DJ, Rignot E (2004)
Recent dramatic thinning of larges west Antarctic ice stream
triggered by oceans. Geophys Res Lett 31. doi:10.1029/
2004GL021,284
Petoukhov V, Ganopolski A, Brovkin V, Claussen M, Eliseev A,
Kubatzki C, Rahmstorf S (2000) CLIMBER-2: a climate system
model of intermediate complexity. Part I: model description and
performance for present climate. Clim Dyn 16:1
Rahmstorf S, Ganopolski A (1999) Long-term global warming
scenarios computed with an efficient coupled climate model.
Clim Change 43:353
Rignot E, Jacobs SS (2002) Rapid bottom melting widespread near
Antarctic ice sheet grounding lines. Science 296. doi:
10.1126/science.1070,942
Rignot E, Casassa G, Gogieneni P, Rivera A, Thomas R (2004)
Accelerated ice discharge from the Antarctic peninsular follow-
ing the collapse of Larsen B ice shelf. Geophys Res Lett 31. doi:
10.1129/2004GL020,697
Rignot E, Bamber JL, Broeke MRVD, Davis C, Li Y, Berg WJVD,
Meijgaard EV (2008) Recent Antarctic ice mass loss from radar
interferometry and regional climate modelling. Nat Geosci
1:106–110. doi:10.1038/ngeo102
Rintoul SR, Sokolv S (2001) Channelized bottom melting and
stability of floating ice shelfs. J Geophys Res 106:2815–2832
Rintoul SR, Hughes C, Olbers D (2001) The Antarctic circumpolar
current system. In: Siedler G, Church J, Gould J (eds) Ocean
circulation and climate: observing and modelling the global
ocean, vol 77. Academic Press, New York, pp 271–303
Saenko OA, Weaver AJ (2003) Southern Ocean upwelling and eddies:
sensitivity of the global overturning to the surface density range.
Tellus 55A:106–111
Saenko OA, Weaver AJ (2004) What drives heat transport in the
Atlantic: sensitivity to mechanical energy supply and buoyancy
forcing in the Southern Ocean. Geophys Res Lett 31:L20305.
doi:10.1029/2004GL020671
Scambos T, Bohlander J, Shuman JA, Skvarca P (2004) Glacier
acceleration and thinning after ice shelf collapse in the Larsen B
embayment, Antarctica. Geophys Res Lett 31. doi:
10.1029/2004GL020,670
Schewe J, Levermann A (2009) The role of meridional density
differences for a wind-driven overturning circulation. Clim Dyn
(in press). doi:10.1007/s00382-009-0572-1
Schroder M, Fahrbach E (1999) On the structure and the transport of
the eastern Weddell gyre. Deep Sea Res II 46:501–527
Smedsrud LH, Jenkins A, Holland DM, Nøst OA (2006) Modeling
ocean processes below fimbulisen, Antarctica. Geophys Res Lett
111. doi:10.1029/2005JC002,915
Swingedouw D, Fichefet T, Goosse H, Driesschaert E, Loutre MF
(2008a) Antarctic ice-sheet melting provides negative feedbacks
on future climate warming. Clim Dyn. doi:10.1007/s00,382-
008-0496-1
Swingedouw D, Fichefet T, Hybrechts P, Goosse H, Driesschaert E,
Loutre MF (2008b) Antarctic ice-sheet melting provides
T. Hattermann, A. Levermann: Response of Southern Ocean circulation to global warming 755
123

negative feedbacks on future climate warming. Geophys Res
Lett 35. doi:10.1029/2008GL034,410
Thomas ER, Marshall GR, McConnell JR (2008) A doubling in snow
accumulation in the western Antarctic peninsula since 1850.
Geophys Res Lett 35. doi:10.1029/2007GL032,529
Toole JM, Polzin KL, Schmitt RW (1994) Estimates of diapycnal
mixing in the abyssal ocean. Science 264:1120–1123
Trenberth K, Olson J, Large W (1989) A global ocean wind stress
climatology based on ECMWF analyses. Tech. Rep. NCAR/TN-
338?STR, National Center for Atmospheric Research, Boulder,
Colorado, USA
Walker RT, Holland DM (2007) A two-dimensional coupled model
for ice shelf-ocean interaction. Ocean Model 17:123–139
Wang C, Beckmann A (2007) Investigation of the impact of Antarctic
ice-shelf melting in a global ice-ocean model (orca2-lim). Ann
Glaciol 46:78–82
Wang Z, Meredith MP (2008) Density-driven southern hemisphere
subpolar gyres in coupled climate models. Geophys Res Lett 35.
doi:10.1029/2008GL034,344
Williams MJM, Jenkins A, Determann J (1998) Physical controls on
ocean circulation beneath ice shelves revealed by numerical
models. In: Jacobs SJ, Weiss RF (eds) Ocean, ice, and
atmosphere: interactions at the Antarctic continental margin,
vol 75. American Geophysical Union, Washington D.C., pp 285–
299
Williams MJM, Warner RC, Budd WF (2001) Sensitivity of the
Amery ice shelf, Antarctica, to changes in the climate of the
southern ocean. J Clim 15:2740–2757
756 T. Hattermann, A. Levermann: Response of Southern Ocean circulation to global warming
123