response of laminated glass panels to …eprints.qut.edu.au/85263/1/hasitha damruwan_hidallana...
TRANSCRIPT

RESPONSE OF LAMINATED GLASS PANELS
TO NEAR FIELD BLAST EVENTS
H D Hidallana-Gamage
BSc Eng (Hons)
Submitted in partial fulfilment of the requirements for the degree of
Doctor of Philosophy
School of Civil Engineering and Built Environment
Faculty of Science and Engineering
Queensland University of Technology
2015

I would like to dedicate this thesis to my loving parents and family

Response of laminated glass panels to near field blast events i
Keywords
Blast loads, Laminated glass, Glass panes, Interlayer material, Structural silicone
sealant, Design standards, Strain rate effects, Finite element analysis, Material
models, Failure analysis, Geometrical properties, Material properties, Energy
absorption, Support reactions, Flexible facade systems

ii Response of laminated glass panels to near field blast events

Response of laminated glass panels to near field blast events iii
Abstract
Designing building facades to a credible blast load has become an important
consideration with an ever increasing number of terrorist attacks throughout the
world. Glazed facades with monolithic annealed glass are often used in buildings,
especially at the lower levels for visual exposure, aesthetics, opacity and
environmental compatibility. These facades are subjected to extensive damage
causing various injuries to the occupants under near field explosions. It is evident
from past explosions that more than 80-90% of blast-related injuries are due to flying
glazed fragments and facade pieces. On the other hand, if the building facade
disintegrates, blast pressure enters the building, causing injuries to the occupants and
even damage to the building. Building facades fabricated with laminated glass (LG)
provide significant blast resistance compared to monolithic annealed glass used in
most buildings. However, current design standards for blast resistant glazing are
limited to the design of relatively smaller glazed panels. Standard test methods are
expensive, create environmental pollution and can only classify hazard ratings for
smaller glazed panels. Unless specifically required by a building owner, monolithic
annealed glass is preferred to LG without blast assessment when required.
This research develops and applies a rigorous finite element (FE) based procedure
with LS-DYNA FE code to study the response of LG panels to near field blast loads.
LG panels are modelled three dimensionally, incorporating glass, interlayer and
structural sealant joints and also accounting for the post-crack behaviour of LG. A
comprehensive study is carried out with the developed FE models to investigate the
influence of controlling parameters for all component materials, geometric
properties, support conditions and energy absorption to improve the blast
performance of LG panels. Blast response of the flexible façade systems is studied
by accounting for the negative phase of the blast load and support flexibility. This
research provides a framework for the design of blast resistant glazing with LG by
optimizing façade components and using better materials to improve their blast
response. The comprehensive modelling techniques developed in this research could
be used to complement and supplement existing design methodology for LG panels,
thus reducing costs, risks and environmental pollution involved with blast testing.
The research findings in this thesis will therefore enhance the capabilities of

iv Response of laminated glass panels to near field blast events
engineers to efficiently design blast resistant glazing with LG panels and provide
socio-economic benefits to the community by minimizing injuries, loss of lives and
damage to property from blast effects.

Response of laminated glass panels to near field blast events v
Table of Contents
Keywords .......................................................................................................................................... i
Abstract ........................................................................................................................................... iii
Table of Contents.............................................................................................................................. v
List of Figures ............................................................................................................................... viii
List of Tables ................................................................................................................................. xiii
List of Abbreviations ...................................................................................................................... xv
Statement of Original Authorship .................................................................................................. xvii
Publication List.............................................................................................................................. xix
Acknowledgements........................................................................................................................ xxi
CHAPTER 1: INTRODUCTION .................................................................................................. 1
1.1 Background ........................................................................................................................... 1
1.2 Research Problem .................................................................................................................. 4
1.3 Aims and Objectives .............................................................................................................. 5
1.4 Research Scope ...................................................................................................................... 6
1.5 Significance and Inovation of the Research ............................................................................. 6
1.6 Thesis Outline ........................................................................................................................ 7
CHAPTER 2: LITERATURE REVIEW ....................................................................................... 9
2.1 Introduction ........................................................................................................................... 9
2.2 Explosion and Blast Phenomenon ........................................................................................... 9 2.2.1 Categorization of Blast Loads .................................................................................... 10 2.2.2 Blast Pressure and Wave Propagation ........................................................................ 11 2.2.3 Reflected Blast Pressure ............................................................................................ 12 2.2.4 Dynamic Pressure...................................................................................................... 14 2.2.5 Scaled Distance ......................................................................................................... 14 2.2.6 Estimating Blast Related Parameters .......................................................................... 14
2.3 Vulerability of Building Facades to Blast Loads ................................................................... 17 2.3.1 Glazed Facades in Existing Buildings ........................................................................ 17 2.3.2 Blast Effects on Building Facades .............................................................................. 19
2.4 Blast Resistant Glazing and Mitigation Techniques ............................................................... 21 2.4.1 Window Film ............................................................................................................ 21 2.4.2 Catcher Systems ........................................................................................................ 21 2.4.3 Window Replacement ............................................................................................... 21 2.4.4 Laminated Glass (LG) ............................................................................................... 22
2.5 Material Behaviour under Blast Loads .................................................................................. 25 2.5.1 Glass ......................................................................................................................... 25 2.5.2 Polyvinyl Butyral (PVB) ........................................................................................... 29 2.5.3 Structural Silicone Sealant ......................................................................................... 32 2.5.4 Aluminium and Steel ................................................................................................. 34
2.6 Design Standards for Blast Resistant Glazing ....................................................................... 36 2.6.1 ASTM F 2248-09, 2010............................................................................................. 36 2.6.2 Unified Facilities Criteria (UFC) Standards................................................................ 38 2.6.3 UK Glazing Hazard Guide, 1997 ............................................................................... 41 2.6.4 Protective Design Centre - Technical Report (PDC-TR) 10-02 ................................... 42

vi Response of laminated glass panels to near field blast events
2.7 Standard Test Methods for Blast Resistant Glazing ............................................................... 43 2.7.1 ASTM F 1642-04, 2010 ............................................................................................. 43 2.7.2 International Organization for Standardization (ISO) Standards .................................. 44 2.7.3 BS EN 13541, 2001 ................................................................................................... 45 2.7.4 US General Services Administration (GSA) Standard, 2003 ....................................... 45 2.7.5 Limitations in the Test Methods ................................................................................. 46
2.8 Previous Impact and Blast Tests on LG ................................................................................ 46
2.9 Numerical Analysis of LG .................................................................................................... 49 2.9.1 Using EUROPLEXUX FE code................................................................................. 49 2.9.2 Using ABAQUS FE code .......................................................................................... 49 2.9.3 Using ANSYS FE code ............................................................................................. 50 2.9.4 Using LS-DYNA FE code ......................................................................................... 50 2.9.5 Limitations ................................................................................................................ 52
2.10 Effects of the Negative Phase of the Blast Load .................................................................... 52
2.11 Flexible Façade Systems ...................................................................................................... 53
2.12 Chapter Summary ................................................................................................................ 55 2.12.1 Literature Review Findings ........................................................................................ 55 2.12.2 Knowledge Gaps ....................................................................................................... 55
CHAPTER 3: METHODOLOGY AND RESEARCH DESIGN................................................. 57
3.1 Introduction ......................................................................................................................... 57
3.2 Research Process .................................................................................................................. 57
3.3 Finite Element Modelling ..................................................................................................... 59 3.3.1 Material Model for Glass ........................................................................................... 60 3.3.2 Material Model for Interlayer, Sealant and Framing Materials .................................... 62 3.3.3 Element Formulations................................................................................................ 63
3.4 Failure Analysis of Different Materials ................................................................................. 64 3.4.1 Failure of Glass ......................................................................................................... 64 3.4.2 Failure of Ductile Materials ....................................................................................... 66
3.5 Chapter Summary ................................................................................................................ 66
CHAPTER 4: VALIDATION OF MODELLING TECHNIQUES............................................. 69
4.1 Introduction ......................................................................................................................... 69
4.2 Material Properties ............................................................................................................... 69
4.3 FE Modelling ....................................................................................................................... 70
4.4 Comparison of Results ......................................................................................................... 71 4.4.1 Free Vibration Analysis ............................................................................................. 72 4.4.2 Shock Tube Test (G688) ............................................................................................ 73 4.4.3 Shock Tube Test (G684) ............................................................................................ 78
4.5 Chapter Summary ................................................................................................................ 83
CHAPTER 5: EFFECTS OF GLASS PROPERTIES ON THE BLAST PERFORMANCE OF
LG……………. ............................................................................................................................. 85
5.1 Introduction ......................................................................................................................... 85
5.2 Parametric Study .................................................................................................................. 85 5.2.1 Blast Loads ............................................................................................................... 86 5.2.2 FE Modelling ............................................................................................................ 87 5.2.3 Material Properties .................................................................................................... 87
5.3 Response of the LG Panel under the Blast Loads .................................................................. 88
5.4 Results from the Parametric Study ........................................................................................ 94 5.4.1 Effects of the Tensile Strength (T) of Glass ................................................................ 94 5.4.2 Effects of the Thickness Designation of Glass Panes (GTD) ..................................... 104

Response of laminated glass panels to near field blast events vii
5.5 Discussion ..........................................................................................................................110
5.6 Chapter Summary ...............................................................................................................112
CHAPTER 6: EFFECTS OF INTERLAYER PROPERTIES ON THE BLAST
PERFORMANCE OF LG ...........................................................................................................113
6.1 Introduction ........................................................................................................................113
6.2 Parametric Study .................................................................................................................113 6.2.1 FE Modelling ...........................................................................................................114 6.2.2 Material Properties ...................................................................................................114
6.3 Results from the Parametric Study .......................................................................................115 6.3.1 Effects of the Thickness (t) of the Interlayer ..............................................................115 6.3.2 Effects of the Young’s Modulus (E) of the Interlayer ................................................123
6.4 Discussion ..........................................................................................................................130
6.5 Chapter Summary ...............................................................................................................132
CHAPTER 7: EFFECTS OF SEALANT PROPERTIES ON THE BLAST PERFORMANCE
OF LG……….. .............................................................................................................................133
7.1 Introduction ........................................................................................................................133
7.2 Parametric Study .................................................................................................................133 7.2.1 FE Modelling ...........................................................................................................134 7.2.2 Material Properties ...................................................................................................134
7.3 Results from the Parametric Study .......................................................................................135 7.3.1 Effects of the Width (w) of the Sealant Joints ............................................................135 7.3.2 Effects of the Thickness (t) of the Sealant Joints .......................................................139 7.3.3 Effects of the Young’s Modulus (E) of the Sealant Joints ..........................................143
7.4 Discussion ..........................................................................................................................146
7.5 Chapter Summary ...............................................................................................................148
CHAPTER 8: BLAST PERFORMANCE OF FLEXIBLE FACADE SYSTEMS.....................149
8.1 Introduction ........................................................................................................................149
8.2 Parametric Study .................................................................................................................149 8.2.1 Blast Loads ..............................................................................................................150 8.2.2 FE Modelling ...........................................................................................................151 8.2.3 Material Properties ...................................................................................................152
8.3 Influence of the Negative Phase of the Blast Load ...............................................................152 8.3.1 LG Panel Fixed to Rigid Supports.............................................................................152 8.3.2 LG panel Fixed to Flexible Supports .........................................................................157
8.4 Effects of Support Flexibility on the Blast Performance of LG Panels ..................................161
8.5 Chapter Summary ...............................................................................................................171
CHAPTER 9: CONCLUSION ....................................................................................................173
9.1 Summary ............................................................................................................................173
9.2 Main Findings .....................................................................................................................174
9.3 Contribution and Application of the Research ......................................................................177
9.4 Future Research ..................................................................................................................178
REFERENCES ............................................................................................................................181

viii Response of laminated glass panels to near field blast events
List of Figures
Figure 1-1: Buildings using large glazed facades at the lower level in Brisbane, Australia .................. 1
Figure 1-2: Damage to the glazed facades from major bomb attacks .................................................. 2
Figure 1-3: Descriptive classes of internal damage from façade failure (Cormie et al., 2009) .............. 4
Figure 2-1: Unconfined explosions (UFC 3-340-02, 2008) ............................................................... 11
Figure 2-2: Blast wave propagation with the distance (Ngo et al., 2007) ........................................... 12
Figure 2-3: Free field blast pressure variation with the time (UFC 3-340-02, 2008) .......................... 12
Figure 2-4: Determination of reflected blast pressure (UFC 3-340-02, 2008) .................................... 13
Figure 2-5: Estimation of blast wave parameters for a hemispherical TNT explosion on the
surface at sea level (UFC 3-340-02, 2008) ....................................................................... 16
Figure 2-6: Glazed facades used in buildings ................................................................................... 18
Figure 2-7: Distribution of blast pressure on building façade (Ngo et al., 2007) ................................ 19
Figure 2-8: Risk contours for glazing damage to building façade under a blast load with W=50
kg TNT and R=50 m (Netherton & Stewart, 2006) .......................................................... 20
Figure 2-9: Blast mitigation techniques ........................................................................................... 22
Figure 2-10: Membrane action of the edge bonded LG under blast loading (David & Andy,
2005) .............................................................................................................................. 23
Figure 2-11: Failure of LG in five phases (Larcher et. al, 2012) ....................................................... 24
Figure 2-12: Shear relaxation modulus of PVB as a function of time (Wei & Dharani, 2006) ........... 30
Figure 2-13: Stress-strain variation of PVB under different strain rates ............................................ 32
Figure 2-14: Stress-strain variation of the PVB interlayer (Hidallana-Gamage et al., 2013b) ............. 32
Figure 2-15: Stress-strain variation in tension for a typical sealant at different strain rates
(Yarosh et al. 2008) ........................................................................................................ 33
Figure 2-16: Stress-strain variation of silicone sealant (Yarosh et al. 2008; Hidallana-Gamage
et al., 2013b) ................................................................................................................... 34
Figure 2-17: Stress-strain variations of aluminium and steel (Bambach, 2008; Urgessa &
Arciszewski, 2011; Veldman et al., 2006)........................................................................ 35
Figure 2-18: Graphical relationship between standoff distance, TNT charge mass, and 3-second
equivalent design load (ASTM F 2248-09, 2010b)........................................................... 36
Figure 2-19: Non-factored load chart for 6.0 mm (0.25”) glass with four sides simply supported
(ASTM E 1300-09a, 2009) .............................................................................................. 37
Figure 2-20: Peak blast pressure capacity for tempered glass panes with an aspect ratio (a/b) of
1 and thickness of 6 mm (0.25”) (UFC 3-340-02, 2008) ................................................... 40
Figure 2-21: Iso-damage curves for 1.25 m × 1.55 m LG panel with a thickness of 6.76 mm
(3+0.76+3) (Smith, 2001) ............................................................................................... 42
Figure 2-22: Patented cable connectors used for energy absorption (Gartner, 2011) .......................... 54
Figure 3-1: Research process ........................................................................................................... 58
Figure 3-2: Defining the stress-strain curve in material model 24 ..................................................... 63
Figure 3-3: View of the ELFORM 1 ................................................................................................ 64
Figure 4-1: Variation of the deflection at the centre with time for different FE meshes with
glass, T=60 MPa/ PVB, E=530 MPa and sealant, E=2.3 MPa .......................................... 71

Response of laminated glass panels to near field blast events ix
Figure 4-2: FE model of the test panel ............................................................................................. 71
Figure 4-3: Variation of the deflection at the centre with time for free vibration analysis .................. 73
Figure 4-4: Blast overpressure variation with time for the shock tube test G688 (Kranzer et al.,
2005) .............................................................................................................................. 73
Figure 4-5: Variation of the deflection at the centre with time for different tensile strengths (T)
of glass (test G688) ......................................................................................................... 74
Figure 4-6: Comparison of the fracture of glass panes for test G688 ................................................. 75
Figure 4-7: 1st principal stress (σ11) variation on the glass panes for test G688 .................................. 76
Figure 4-8: Von Mises stress (σv) variation on the back surface of the interlayer .............................. 76
Figure 4-9: Section at the middle of the long edge of the FE model showing critical sealant
elements ......................................................................................................................... 77
Figure 4-10: Von Mises stress (σv) variation of critical sealant elements .......................................... 77
Figure 4-11: Energy absorption of different components in the FE model ........................................ 78
Figure 4-12: Blast overpressure variation with time for the shock tube test G684 ............................. 78
Figure 4-13: Variation of the deflection at the centre with time for different tensile strengths
(T) of glass when PVB, E=530 MPa and sealant, E=2.3 MPa (test G684) ........................ 79
Figure 4-14: Comparison of the fracture of glass panes for test G684 ............................................... 80
Figure 4-15: 1st principal stress (σ11) variation on the glass panes for test G684 ................................ 81
Figure 4-16: Von Mises stress (σv) variation on the back surface of the interlayer for test G684 ....... 81
Figure 4-17: Von Mises stress (σv) variation of critical sealant elements for test G684 ..................... 82
Figure 4-18: Energy absorption of different components in the FE model for test G684.................... 83
Figure 5-1: Reflected overpressure variation of the blast loads ......................................................... 87
Figure 5-2: FE model of the LG panel ............................................................................................. 87
Figure 5-3: Variation of the deflection at the centre under blast loads ............................................... 89
Figure 5-4: Variation of the energy absorption of the FE model under blast loads............................. 89
Figure 5-5: Fracture and crack propagation of glass panes ............................................................... 90
Figure 5-6: Plastic strain variation at the bottom surface of the interlayer ......................................... 90
Figure 5-7: Von Mises stress (σv) variation in critical sealant elements at the middle of the long
edge ............................................................................................................................... 91
Figure 5-8: Comparison of the support reactions at the middle of the long and short edges ............... 93
Figure 5-9: Variation of the energy absorption of different components in the FE model .................. 93
Figure 5-10: Variation of the deflection at the centre with time for different T of glass under
the weaker blast load (GTD = 6 mm) .............................................................................. 96
Figure 5-11: Variation of the deflection at the centre with time for different T of glass under the stronger blast load (GTD = 6 mm) ............................................................................. 96
Figure 5-12: Variation of the maximum deflection at the centre with the T of glass .......................... 96
Figure 5-13: Variation of the total energy absorption of the FE models with time for different T
of glass (GTD = 6 mm) ................................................................................................... 97
Figure 5-14: Variation of the maximum energy absorption of the FE models with the T of glass ...... 98
Figure 5-15: Variation of the support reaction, RL of the LG panel with time for different T of
glass (GTD = 6 mm) ....................................................................................................... 98
Figure 5-16: Variation of the maximum support reaction, RL of the LG panel with the T of
glass ............................................................................................................................... 99

x Response of laminated glass panels to near field blast events
Figure 5-17: Fracture of the back glass panes for different T of glass under the weaker blast
load .............................................................................................................................. 100
Figure 5-18: Fracture of the back glass panes for different T of glass under the stronger blast
load .............................................................................................................................. 100
Figure 5-19: Plastic strain variation at the bottom surface of the interlayer for different T of
glass under the weaker blast load .................................................................................. 101
Figure 5-20: Plastic strain variation at the bottom surface of the interlayer for different T of
glass under the stronger blast load ................................................................................. 102
Figure 5-21: Energy absorption of the different components in the FE model for different T of
glass under the stronger blast load ................................................................................. 103
Figure 5-22: Variation of the deflection at the centre with time for different GTD (T = 60 MPa) .... 105
Figure 5-23: Variation of the maximum deflection at the centre with the GTD ............................... 105
Figure 5-24: Variation of the total energy absorption of the FE models with time for different
GTD (T = 60 MPa) .............................................................................................. 106
Figure 5-25: Variation of the maximum energy absorption of the FE models with the GTD............ 106
Figure 5-26: Variation of the support reaction, RL with time for different GTD (T = 60 MPa) ........ 107
Figure 5-27: Variation of the maximum support reaction, RL with the GTD ................................... 107
Figure 5-28: Fracture of the back glass panes for different GTDs under the weaker blast load ........ 108
Figure 5-29: Fracture of the back glass panes for different GTDs under the stronger blast load ....... 108
Figure 5-30: Plastic strain variation at the bottom surface of the interlayer for different GTDs
under the weaker blast load ........................................................................................... 109
Figure 5-31: Plastic strain variation at the bottom surface of the interlayer for different GTDs under the stronger blast load.......................................................................................... 109
Figure 5-32: Variation of the energy absorption of the different components of the FE model
under the stronger blast load.......................................................................................... 110
Figure 6-1: Variation of the deflection at the centre with time for different thicknesses (t) of the
interlayer (E = 530 MPa)............................................................................................... 117
Figure 6-2: Variation of the maximum deflection at the centre with the interlayer thickness ........... 117
Figure 6-3: Variation of the total energy absorption of the FE models with time for different
thicknesses (t) of the interlayer (E = 530 MPa) .............................................................. 118
Figure 6-4: Variation of the maximum energy absorption of the FE models with the interlayer
thickness....................................................................................................................... 118
Figure 6-5: Variation of the support reaction, RL with time for different thicknesses (t) of the
interlayer (E = 530 MPa)............................................................................................... 119
Figure 6-6: Variation of the maximum support reaction, RL with the interlayer thickness ............... 119
Figure 6-7: Fracture of the front glass pane for different thicknesses (t) of the interlayer under
the stronger blast load (E = 530 MPa) ........................................................................... 120
Figure 6-8: Fracture of the back glass pane for different thicknesses (t) of the interlayer under
the stronger blast load (E = 530 MPa) ........................................................................... 121
Figure 6-9: Plastic strain variation at the bottom surface of the interlayer for different
thicknesses (t) of the interlayer under the stronger blast load (E = 530 MPa) .................. 122
Figure 6-10: Energy absorption of the different components of the FE model for different
interlayer thicknesses under the stronger blast load ........................................................ 123
Figure 6-11: Variation of the deflection at the centre with time for different Young’s moduli
(E) of the interlayer (t = 1.52 mm) ................................................................................. 124
Figure 6-12: Variation of the maximum deflection at the centre with the E of the interlayer............ 125

Response of laminated glass panels to near field blast events xi
Figure 6-13: Variation of the total energy absorption of the FE model with time for different
Young’s moduli (E) of the interlayer (t = 1.52 mm) ........................................................125
Figure 6-14: Variation of the maximum energy absorption of the FE model with the E of the
interlayer .......................................................................................................................126
Figure 6-15: Variation of the support reaction, RL with time for different Young’s moduli (E)
of the interlayer (t = 1.52 mm) .......................................................................................126
Figure 6-16: Variation of the maximum support reaction, RL with the E of the interlayer.................127
Figure 6-17: Fracture of the front glass panes for different Young’s moduli (E) of the interlayer
under the stronger blast load (t = 1.52 mm) ....................................................................128
Figure 6-18: Fracture of the back glass panes for different Young’s moduli (E) of the interlayer
under the stronger blast load (t = 1.52 mm) ....................................................................128
Figure 6-19: Plastic strain variation at the bottom surface of the interlayer for different Young’s
moduli (E) of the interlayer under the stronger blast load (t = 1.52 mm) ..........................129
Figure 6-20: Energy absorption of the components in the FE model for different interlayer
Young’s moduli (E) under the stronger blast load ...........................................................130
Figure 7-1: Variation of the deflection at the centre with time for different widths (w) of sealant
joints (t = 5 mm and E = 2.3 MPa) .................................................................................136
Figure 7-2: Variation of the maximum deflection at the centre with the sealant width ......................136
Figure 7-3: Variation of the total energy absorption of the FE models with time for different
widths (w) of sealant joints (t = 5 mm and E = 2.3 MPa) ................................................137
Figure 7-4: Variation of the maximum energy absorption of the FE models with the sealant
width .............................................................................................................................137
Figure 7-5: Variation of the support reaction, RL of the LG panel with time for different widths
(w) of sealant joints (t = 5 mm and E = 2.3 MPa)............................................................138
Figure 7-6: Variation of the maximum support reaction, RL with the sealant width ..........................139
Figure 7-7: Variation of the deflection at the centre of the LG panel with time for different
thicknesses (t) of sealant joints (w = 10 mm and E = 2.3 MPa) .......................................140
Figure 7-8: Variation of the maximum deflection at the centre with the sealant thickness ................140
Figure 7-9: Variation of the total energy absorption of the FE models with time for different
thicknesses (t) of sealant joints (w = 10 mm and E = 2.3 MPa) .......................................141
Figure 7-10: Variation of the maximum energy absorption of the FE models with the sealant
thickness .......................................................................................................................141
Figure 7-11: Variation of the support reaction, RL of the LG panel with time for different
thicknesses (t) of sealant joints (w = 10 mm and E = 2.3 MPa) .......................................142
Figure 7-12: Variation of the maximum support reaction, RL with the sealant thickness ..................142
Figure 7-13: Variation of the deflection at the centre of the LG panel with time for different
Young’s moduli (E) of sealant joints (w = 10 and t = 5 mm) ...........................................144
Figure 7-14: Variation of the maximum deflection at the centre with the sealant Young’s
modulus ........................................................................................................................144
Figure 7-15: Variation of the total energy absorption of the FE models with time for different
Young’s moduli (E) of sealant joints (w = 10 and t = 5 mm) ...........................................145
Figure 7-16: Variation of the maximum energy absorption of the FE models with the sealant
Young’s modulus...........................................................................................................145
Figure 7-17: Variation of the support reaction, RL of the LG panel with time for different
Young’s moduli (E) of sealant joints (w = 10 and t = 5 mm) ...........................................146
Figure 7-18: Variation of the maximum support reaction, RL with the sealant Young’s modulus......146
Figure 8-1: Reflected overpressure variations of the blast loads ......................................................151

xii Response of laminated glass panels to near field blast events
Figure 8-2: Different views of the FE model .................................................................................. 152
Figure 8-3: Variation of the deflection at the centre of LG panel fixed to rigid supports with
time .............................................................................................................................. 154
Figure 8-4: Variation of the total energy absorption of the FE model with time for the LG panel
fixed to rigid supports ................................................................................................... 155
Figure 8-5: Variation of the support reaction in the fastener at the middle of the long edge of
the LG panel fixed to rigid supports with time ............................................................... 156
Figure 8-6: Variation of the deflection at the centre of the LG panel fixed to flexible supports
with time ...................................................................................................................... 158
Figure 8-7: Variation of the total energy absorption of the FE model with time for the LG panel
fixed to flexible supports ............................................................................................... 159
Figure 8-8: Variation of the reaction force at the edge of the horizontal cable of the LG panel
fixed to flexible supports with time ............................................................................... 161
Figure 8-9: Variation of the total deflection at the centre of the LG panel with time for different
support conditions......................................................................................................... 163
Figure 8-10: Variation of the deflection at the supports (at point A on the window frame) with
time for different support conditions.............................................................................. 163
Figure 8-11: Variation of the effective centre deflection of the LG panel with time for different
support conditions......................................................................................................... 164
Figure 8-12: Variation of the total energy absorption of the FE model with time for different
support conditions......................................................................................................... 165
Figure 8-13: Variation of the reaction force at the edge of the horizontal cable with time for steel cables with different cross-sections ....................................................................... 166
Figure 8-14: Fracture of glass panes of the LG panel fixed to rigid supports under the stronger
blast load ...................................................................................................................... 167
Figure 8-15: Fracture of glass panes of the LG panel fixed to steel cables with 20 mm width
square cross-sections under the stronger blast load ........................................................ 168
Figure 8-16: Fracture of glass panes of the LG panel fixed to steel cables with 15 mm width
square cross-sections under the stronger blast load ........................................................ 168
Figure 8-17: Plastic strain variation at the bottom surface of the interlayer of the LG panel
fixed to rigid supports under the stronger blast load ....................................................... 169
Figure 8-18: Plastic strain variation at the bottom surface of the interlayer of the LG panel
fixed to steel cables with 20 mm width square cross-sections under the stronger blast
load .............................................................................................................................. 169
Figure 8-19: Plastic strain variation at the bottom surface of the interlayer of the LG panel
fixed to steel cables with 15 mm width square cross-sections under the stronger blast
load .............................................................................................................................. 170
Figure 8-20: Variation of the component energy absorptions for the LG panel fixed to rigid
supports with time under the stronger blast load ............................................................ 171
Figure 8-21: Variation of the component energy absorptions for the LG panel fixed to steel
cables with 15 mm width square cross-sections under the stronger blast load ................. 171
Figure 9-1: Energy absorption comparison of glass and interlayer .................................................. 174
Figure 9-2: Determination of the critical interlayer thickness ........................................................ 175

Response of laminated glass panels to near field blast events xiii
List of Tables
Table 1-1: Major bomb attacks on buildings (Jayasinghe, 2014; Jayasooriya, 2010) ........................... 2
Table 2-1: Blast load categories (UFC 3-340-02, 2008) ................................................................... 10
Table 2-2 : Chemical composition of annealed glass (Holmquist et al., 1995; Zhang et al.,
2012) .............................................................................................................................. 25
Table 2-3 : Material properties of annealed glass (Holmquist et al.,1995; Cormie et al., 2009;
Hooper et al., 2012a) ...................................................................................................... 28
Table 2-4 : Tensile strength of different glass types (AS 1288, 2006; Hooper et al., 2012a;
Cormie et al. 2009) ......................................................................................................... 29
Table 2-5: Material properties of PVB (Hidallana-Gamage et al., 2013b) ......................................... 32
Table 2-6: Material properties of silicone sealant (Yarosh et al. 2008; Hidallana-Gamage et al.,
2013b) ............................................................................................................................ 34
Table 2-7: Material properties of aluminium and steel (Bambach, 2008; Urgessa &
Arciszewski, 2011; Veldman et al., 2006) ....................................................................... 35
Table 3-1: Material models for different components ....................................................................... 59
Table 3-2: JH-2 material constants used in the analysis (Holmquist et al., 1995)............................... 62
Table 5-1: Comparison of results for different tensile strengths (T) of glass ..................................... 95
Table 5-2: Comparison of results for different glass thickness designations (GTD)..........................104
Table 6-1: Material properties of PVB interlayer used in the parametric study.................................115
Table 6-2: Comparison of results for different thicknesses (t) of the interlayer. ...............................116
Table 6-3: Comparison of results for different Young’s moduli (E) of the interlayer. .......................123
Table 7-1: Material properties of silicone sealant used in the parametric study (Hidallana-
Gamage et al., 2014b) ....................................................................................................134
Table 7-2: Comparison of results for different widths (w) of the structural silicone sealant
joints .............................................................................................................................135
Table 7-3: Comparison of results for different thicknesses (t) of the structural silicone sealant
joints .............................................................................................................................139
Table 7-4: Comparison of results for different Young’s moduli (E) of the structural silicone
sealant joints ..................................................................................................................143
Table 8-1: Comparison of results of the LG panel fixed to rigid supports ........................................153
Table 8-2: Comparison of results of the LG panel fixed to flexible supports ....................................157
Table 8-3: Comparison of results for different support flexibility under the weaker blast load .........162
Table 8-4: Comparison of results for different support flexibility under the stronger blast load ........162

xiv Response of laminated glass panels to near field blast events

Response of laminated glass panels to near field blast events xv
List of Abbreviations
ASTM American Society for Testing and Materials
AS Australian Standards
BRC Blast Reliability Curves
BS British Standards
CFD Computational Fluid Dynamics
CNF Cable Net Facade
DOD Department of Defence
ELFORM Element Formulation
FE Finite Element
FEA Finite Element Analysis
FSI Fluid Structure Interaction
GTD Glass Thickness Designation
GTF Glass Type Factor
HEL Hugoniot Elastic Limit
IRHD International Rubber Hardness Degrees
ISO International Organization of Standardization
JH Johnson-Holmquist
LEED Leadership in Energy and Environment Design
LG Laminated Glass
LR Load Resistance
PBIED Person Borne Improvised Explosive Devices
PDC Protective Design Centre
SDOF Single Degree of Freedom
TNT Trinitrotoluene
UFC Unified Facilities Criteria
VBIED Vehicle Borne Improvised Explosive Devices
WBDG Whole Building Design Guide

xvi Response of laminated glass panels to near field blast events

Response of laminated glass panels to near field blast events xvii
Statement of Original Authorship
QUT Verified Signature

xviii Response of laminated glass panels to near field blast events

Response of laminated glass panels to near field blast events xix
Publication List
International Journal Papers
Hidallana-Gamage, H. D., Thambiratnam, D. P., & Perera, N. J. (2013a).
Computational analysis of laminated glass panels under blast loads: A
comparison of two dimensional and three dimensional modelling approaches.
The International Journal of Engineering and Science, 2(8), 69-79. (published)
Hidallana-Gamage, H. D., Thambiratnam, D. P., & Perera, N. J. (2013b). Failure
analysis of laminated glass panels subjected to blast loads. Engineering Failure
Analysis, 36, 14-29. (published).
Hidallana-Gamage, H. D., Thambiratnam, D. P., & Perera, N. J. (2014a).
Numerical modelling and analysis of the blast performance of laminated glass
panels and the influence of material parameters. Engineering Failure Analysis,
45, 65-84. (published).
Hidallana-Gamage, H. D., Thambiratnam, D. P., & Perera, N. J. (2014b).
Influence of structural sealant joints on the blast performance of laminated glass
panels. Journal of Performance of Constructed Facilities, (published).
Hidallana-Gamage, H. D., Thambiratnam, D. P., & Perera, N. J. (2014c). Design
guidance for blast resistant glazing. Journal of Aechitectural Engineering,
(published).
Hidallana-Gamage, H. D., Thambiratnam, D. P., & Perera, N. J. Blast response
of flexible façade systems and the influence of the negative phase. Engineering
Structures, (under review)
Hidallana-Gamage, H. D., Thambiratnam, D. P., & Perera, N. J. Influence of
interlayer properties on the blast performance of laminated glass. Construction
and Building Materials, (under review)
Hidallana-Gamage, H. D., Thambiratnam, D. P., & Perera, N. J. Influence of
glass properties on the blast performance of laminated glass. Computers &
Structures, (in preparation)

xx Response of laminated glass panels to near field blast events
International Conference Papers
Hidallana-Gamage, H. D., Thambiratnam, D. P., & Perera, N. J. (2013c).
Response of a building envelope system to near field blast events. Paper
presented at the 5th international conference on structural engineering, mechanics
and computation, Cape Town, South Africa. (published).

Response of laminated glass panels to near field blast events xxi
Acknowledgements
First of all, I would like to express my sincere gratitude to my principal supervisor,
Professor David Thambiratnam for the great support, guidance and motivation he
extended to me to enable me to carry out my research work successfully. Secondly, I
would also like to thank my associate supervisor, Professor Nimal Perera for the
valuable advice, useful suggestions and professional guidance given to me during the
entire period of time of my candidature.
I am also thankful to Professor Yuan Tan Gu and Professor Tommy Chan for their
useful comments and suggestions, being the examiners for my PhD final seminar.
I greatly acknowledge the financial support granted by the Science and Engineering
Faculty, Queensland University of Technology, to support my research work during
my candidature. I must thank all academic and non-academic staff members at QUT
for their support, given in many ways, especially QUT library services, IT services
and HPC unit for their assistance and cooperation during the research. Professional
Editor, Ms Diane Kolomeitz (Editorial Services), provided copyediting and
proofreading services, according to the guidelines laid out in the University-endorsed
national policy guidelines.
I would like to acknowledge all my teachers, right through from preschool to higher
school level (at Sri Sumangala Boys College Panadura, Sri Lanka and Taxila Central
College, Horana, Sri Lanka) and the lecturers at the University of Moratuwa, Sri
Lanka, for laying the foundation of my earlier career.
I would like to express my sincere gratitude to my parents and family members for
the understanding, encouragement and support given to me throughout my career in
so many ways. Finally, I would like to thank my friends and all those who have
helped me in individual ways along the path to my completion.
Hasitha Damruwan Hidallana-Gamage
Science and Engineering Faculty
Queensland University of Technology
Brisbane, Australia
July 2015.


Chapter 1: Introduction 1
Chapter 1: Introduction
1.1 BACKGROUND
Terrorist attacks have increased globally, highlighting the need for more secure and
less vulnerable buildings. External facade systems form the skin of a building and are
the most vulnerable to blast events. Glazed facades are frequently used in most
public and office buildings for visual exposure, aesthetics, opacity and environmental
compatibility. Figures 1-1(a) and 1-1(b) illustrate two such buildings located in
Brisbane, Australia. Most high rise buildings have 4-10 m high glazed facades
fabricated with monolithic annealed glass at ground floor lobby areas, which are the
most affected by explosions occurring at the ground level. Glazed panels in these
facades are usually supported by glass fins without any steel or aluminium
framework. They are more vulnerable to blast loads, compared to unitised or stick
glazed facades used in upper floor levels.
(a) Waterfront place (b) Commonwealth bank building
Figure 1-1: Buildings using large glazed facades at the lower level in Brisbane, Australia
Bomb explosions on buildings have occurred more frequently in the world during the
last three decades, by mostly using vehicle-borne improvised explosive devices
(VBIED) or person-borne improvised explosive devices (PBIED). The major bomb
attacks that have happened in the world, and the subsequent damage suffered by
building occupants are summarised in Table 1-1 (Jayasinghe, 2014; Jayasooriya,
2010). Most of these attacks have targeted high occupancy iconic and public
buildings causing significant loss of lives and extensive damage to property. Figures
1-2(a) and 1-2(b) illustrate two major bomb attacks which caused significant damage
to building facades.

2 Chapter 1: Introduction
Table 1-1: Major bomb attacks on buildings (Jayasinghe, 2014; Jayasooriya, 2010)
Date Building/Location Description
Bomb type No of deaths No of injured
1995
(Apr)
Alfred P.Murrah Federal Building,
Oklahoma, USA truck bomb 168 >680
1996
(Jan) Central Bank, Colombo, Sri Lanka truck bomb 91 800
1998
(Aug) US Embassy, Nairobi, Kenya car bomb 224 >4000
2002 (Oct)
2 night clubs, Bali, Indonesia car bomb 240 209
2004
(Sep)
Australian Embassy, Jakarta,
Indonesia car bomb 9 >150
2007
(Dec)
UN office and Algerian government
building, Algiers, Algeria 2 car bombs 41 170
2009
(Oct)
Ministry of Justice and the Provincial
Council building, Baghdad, Iraq 2 car bombs 155 >721
2010
(Jul)
Ethiopian village restaurant,
Kampala, Uganda
2 suicide
bombers 74 70
2011
(May)
Frontier Constabulary Training
Centre, Charsadda, Pakistan car bomb 98 140
2011
(July)
Government and media buildings,
Oslo, Norway car bomb 8 209
2012
(May)
Military Intelligence Complex,
Damascus, Syria 2 car bombs 55 400
(a) Bomb attack on Murrah Federal Building in
Oklahoma, USA, 1995 (Jayasooriya, 2010)
(b) Bomb attack on Government and media
buildings in Oslo, Norway, 2011 (Ghosh, 2011)
Figure 1-2: Damage to the glazed facades from major bomb attacks
Blast-related injuries can be classified into three types as primary, secondary and
tertiary (Lin et al. 2004). Injuries such as eardrum rupture and lung collapse are the
primary injuries that could occur, due to air blast pressure entering the building
through the broken glass windows. Lacerations, abrasion, contusion and blunt trauma
are the secondary injuries that could occur from broken glass fragments hitting

Chapter 1: Introduction 3
people. Additionally, building occupants could be thrown against objects by the force
of the explosion, causing tertiary injuries. It is evident from past blast explosions that
more than 80-90% of injuries are secondary injuries caused by flying and falling
glass fragments and facade pieces (Müller & Wanger, 2006). For example, 362 of the
426 people, hospitalized from the Alfred P. Murrah building bomb attack in
Oklahoma City, had secondary injuries (Oklahoma Department of Civil Engineering
Management, 1995). People who were more than 460 m from the building were
injured in this bomb attack, by flying glass fragments (Swofford, 1996), emphasizing
the need for blast resistant glazing instead of the conventional glazed facades used in
existing buildings.
Building façades are subjected to extensive damage causing various injuries to the
occupants under near field explosions. Figures 1-3(a)–1.3(d) illustrate the internal
damage to buildings corresponding to different levels of façade performance (Cormie
et al., 2009). Figure 1-3(a) shows complete and catastrophic internal devastation to
the interior of a building without having any measures for blast mitigation. Figure 1-
3(b) shows the effects of violent inward projection of glass fragments and
penetration of blast pressures to the interior of a building. Here the damage
necessitated a full refit of the building interior, but is less extensive than that
observed in Figure 1-3(a). Figure 1-3(c) shows the protection of building interior by
using blast resistant glazing fabricated with laminated glass (LG) panels. The LG
panels have been pulled out from the frame, but have still caused a minimal inward
projection and less damage to the interior of the building. According to Figure 1-3(d)
the interior of the building is completely protected from the blast pressures without
collapse in the LG panels. It is therefore evident that the design of building facades
for a credible blast event, will minimise if not eliminate the hazard from the effects
of uncontrolled explosions.
(a) Complete and catastrophic devastation (b) Violent inward projection

4 Chapter 1: Introduction
(c) Minimal projection and internal disruption (d) Complete protection from blast pressures
Figure 1-3: Descriptive classes of internal damage from façade failure (Cormie et al., 2009)
Building owners, engineers and architects focus on aesthetics, architectural aspects,
cost and the thermal comfort of a building when designing building facades. The
building facade contributes to 20-25% of the total cost of a building (Ogden, 1992).
Additionally, it accounts for about 14% of available Leadership in Energy and
Environment Design (LEED) credits (Steve, 2009), which is a tool used to measure
the sustainability of buildings. The building façade is an important part of a building
and hence all these factors should be considered when designing a façade for blast
loads. Different blast mitigation and window retrofit techniques are used in practice
to mitigate blast hazards. Laminated glass (LG) windows are the most preferred in
blast resistant glazing, as they are energy absorptive and provide adequate blast
resistance without affecting the appearance of a building. This research will study the
blast response of LG facades and will provide a framework for their design for a
credible blast event.
1.2 RESEARCH PROBLEM
High occupancy public and iconic buildings have become the primary targets of
recent bomb attacks. It has become a major concern to save lives, and minimise
injuries to the building occupants and damage to the property from potential bomb
attacks. Previous research has investigated action effects to a structural frame under
blast loads by assuming that the building facade will disintegrate in a blast event
(Jayasooriya, 2010). However, as was evidenced from Figures 1-3(a)–1.3(d),
building facades using blast resistant glazing will minimise if not eliminate hazards
from near field explosions.
Building facades fabricated with LG provide significant blast resistance compared to
the monolithic annealed glass used in most buildings. However, current design

Chapter 1: Introduction 5
standards for blast resistant glazing are limited to the design of relatively smaller
glazed panels. Standard test methods are expensive, create environmental pollution
and could only classify hazard ratings for smaller glazed panels. Unless specifically
required by a building owner, monolithic annealed glass is used as a preference to
LG without blast assessment when required, as the current knowledge is limited to
the design of small panels subjected to blast loading. An analytical procedure is
therefore required to design blast resistant glazing by overcoming the limitations in
the current design standards and test methods.
Numerical analysis with FE codes is a feasible method that has been widely used to
study the blast response of LG panels. However, only limited research has accounted
for the post-crack load carrying capacity of LG glass and the influence of the
structural sealant joints. Up to date, there is a limited understanding on the influence
of the controlling parameters, such as the geometric and material properties of glass,
interlayer and structural sealant joints on the blast performance of LG panels. This
research, based on FE analysis, is intended to develop a framework for the design of
blast resistant glazing fabricated with LG.
1.3 AIMS AND OBJECTIVES
The main aim of this thesis is to develop and apply an analytical method to treat the
blast response of facades using LG, and study the influence of controlling parameters
such as all component materials and geometric properties, support conditions and
energy absorption, and hence establish a framework for their design for a credible
blast event. This aim will be achieved by undertaking the following research
objectives.
Develop a rigorous analytical procedure using FE methods, validate the
modelling techniques with the results from past experiments and study the
blast response of LG.
Investigate the effects of geometric properties such as glass pane
thickness, interlayer thickness, and bed width and thickness of structural
sealant joints using parametric studies to enhance blast resistance, system
performance and safety of LG

6 Chapter 1: Introduction
Investigate the effects of the material properties of glass, interlayer and
structural sealant materials to enhance the performance of LG under blast
loading
Investigate the blast response of flexible façade systems and study the
influence of the negative phase and support flexibility
1.4 RESEARCH SCOPE
The scope of this research was limited to study the behaviour of blast resistant
glazing fabricated with LG under unconfined near field explosions for buildings.
This research has been carried out using finite element (FE) modelling with LS-
DYNA explicit FE code; the LG panels were modelled with three-dimensional (3D)
constant stress solid elements incorporating glass, interlayer and structural sealant
joints. During initial studies carried out in Chapters 4-7, the window frame was
modelled as a rigid base by neglecting its deformation for simplicity. Later in
Chapter 8, improved FE models incorporating window frame and supporting
structure were used in the analysis.
Blast loads were calculated according to the empirical method given in UFC 3-340-
02 (2008) and were applied as a pressure load on the front glass pane in the analysis.
Only the positive phase of the blast load was treated in Chapters 5-7 and the negative
phase was treated in Chapter 8 when analysing the blast response of the flexible
façade systems. This research was limited to numerical analysis and hence the
modelling techniques were validated using the results from past experiments. The
developed numerical models were then used for the parametric studies, which
investigate the influence of controlling parameters such as material and geometric
properties, support conditions and energy absorption.
1.5 SIGNIFICANCE AND INOVATION OF THE RESEARCH
This research develops and applies a rigorous FE based procedure to study the blast
response of LG panels. LG panels are modelled three dimensionally incorporating
glass, interlayer and structural sealant joints and also accounting for the post-crack
behaviour of LG. The comprehensive modelling techniques developed in this
research could be used to complement and supplement existing design methodology

Chapter 1: Introduction 7
for LG panels, where applicable, and also as a solution when they are not applicable,
reducing costs, risks and environmental pollution involved with blast testing.
The controlling parameters such as geometric and material properties of glass,
interlayer and structural sealant joints, play important roles on the blast performance
of LG panels, but most of them are not accounted for in the current design methods,
available design standards and in the research to date. Parametric studies have been
conducted to investigate the influence of these controlling parameters on the blast
performance of LG panels. Flexible protective systems, such as cable net facades,
could maximise the energy absorption while enhancing the blast performance of LG
panels. However, to date there is a limited understanding on their behaviour under
blast loads, which will be investigated in this research. The new information
generated in this thesis will therefore enhance the capabilities of engineers to
competency design blast resistant glazing with LG panels by optimizing façade
components and using better materials to improve their blast response.
This research is significant in that it will provide a framework to design blast
resistant glazing, which will be an economical, secure and aesthetically pleasing
solution for conventional facade systems vulnerable to blast loads. This research will
therefore encourage building owners, investors and government authorities to use
blast resistant glazing in future buildings, providing socio-economic benefits by
minimizing injuries, loss of lives and damage to property from potential blast attacks.
1.6 THESIS OUTLINE
This thesis presents the analysis and results obtained from an FE modelling based
numerical investigation on the LG panels subjected to near field blast loads.
The outline of this thesis is as follows.
Chapter 1: Introduction of the research, explaining background, research
problem, aims and objectives, scope and significance
Chapter 2: A comprehensive literature review on blast phenomenon,
vulnerability of building facades, blast mitigation techniques, material
behaviour under blast loads, design standards and test methods, recent
research, flexible façade systems and finally pointing out the main findings
and knowledge gaps

8 Chapter 1: Introduction
Chapter 3: Research methodology explaining the research process, FE
modelling approach and failure analysis of materials
Chapter 4: Validation of the modelling techniques with experimental
results
Chapter 5: Effects of glass properties on the blast performance of LG
Chapter 6: Effects of interlayer properties on the blast performance of LG
Chapter 7: Effects of sealant properties on the blast performance of LG
Chapter 8: Investigation of the blast performance of flexible façade
systems by accounting for the negative phase of the blast load
Chapter 9: Overall conclusion with summary, research findings, industrial
application and suggestions for future research

Chapter 2: Literature Review 9
Chapter 2: Literature Review
2.1 INTRODUCTION
This chapter begins with an introduction (section 2.1), which explains the content of
each section briefly. Section 2.2 describes the blast load and related characteristics
explaining the present method used to estimate blast related parameters. Section 2.3
studies the vulnerability of existing building facades, highlighting the importance of
using blast resistant glazing at least at the lower level of a building. Section 2.4
analyses the available blast resistant glazing and mitigation techniques, and presents
why LG windows will be investigated in this research. Section 2.5 studies the
material behaviour under blast loads, highlighting the strength enhancement by
accounting for the high strain rate effects. Current design standards and standard test
methods for blast resistant glazing are briefly described in section 2.6 and section 2.7
respectively. Section 2.8 reviews the limitations in the past research, using numerical
methods to analyse LG, and Section 2.9 describes the blast response of flexible
facade systems. The literature review findings and the identified knowledge gaps are
discussed in section 2.10 at the end of the chapter.
2.2 EXPLOSION AND BLAST PHENOMENON
A blast or an explosion is a sudden release of potential energy and its conversion into
kinetic energy with the production of gas under high pressure and temperature. This
potential energy can be mechanical, chemical, electrical or nuclear, based on the
origin of the explosive device. Explosive devices are different in terms of their
detonation rate, amount of energy released and effectiveness. The effect of a blast
load on a structure is a function of many parameters such as type of explosive
material, weight of explosive, the location of the explosion relative to the structure,
and the interaction of the shock front with the ground or the structure itself (TM 5-
855-1, 1986). Generally, Trinitrotoluene (TNT) is used as the datum explosive to
represent various explosive materials in terms of standard TNT equivalent when
predicting blast loads.

10 Chapter 2: Literature Review
2.2.1 Categorization of Blast Loads
Explosions could be categorised into two types as unconfined and confined
explosions, depending on the location of the explosive relative to the structure.
External explosions are known as unconfined explosions while those that occur
internally are known as confined explosions. These different types of explosions and
their characteristics are summarised in Table 2-1 (UFC 3-340-02, 2008). Blast
resistant glazed facades could minimise the hazards from unconfined explosions, but
do not have any control on the confined explosions. This research will therefore
investigate the response of glazed facades under unconfined explosions occurring at
the near field of a building.
Unconfined explosions can be further classified into free air burst, air burst and
surface burst as shown in Figure 2.1 (UFC 3-340-02, 2008). In a free air burst, the
initial shock wave propagating away from the explosive directly interacts with the
structure without hitting the ground or any other object. Air burst occurs when an
explosion occurs some distance from the structure, such that the initial shock wave
always hits the ground prior to hitting the structure. During a surface burst, the shock
wave directly hits the ground and the ground reflected wave moves towards the
structure. Ground reflection increases the blast pressure significantly and hence
surface explosions produce a considerably high blast pressure compared to free air
burst and air burst occurring from identical charge weights and standoff distances.
Table 2-1: Blast load categories (UFC 3-340-02, 2008)
Charge confinement Category Pressure loads
Unconfined explosions
Free air burst Un-reflected
Air burst Reflected
Surface burst Reflected
Confined explosions
Fully vented Internal shock, leakage
Partially confined Internal shock, internal gas, leakage
Fully confined Internal shock, internal gas

Chapter 2: Literature Review 11
(a) Free air burst
Figure 2-1: Unconfined explosions (UFC 3-340-02, 2008)
2.2.2 Blast Pressure and Wave Propagation
An explosion releases energy suddenly by generating hot gases under a pressure up
to 30 MPa and a temperature of about 3000-4000 oC (Ngo et al., 2007). High
pressure gas travels away from the explosion source at a high velocity of about 7000
m/s by creating shock waves (UFC 3-340-02, 2008). Figure 2-2 illustrates the blast
wave propagation with the distance from the origin of the explosion (Ngo et al.,
2007). After a short time, pressure behind the shock front drops below the ambient
pressure by creating a partial vacuum. It creates high suction winds capable of
carrying debris for long distances away from the explosion source.
A typical free field blast pressure-time history curve at a point away from the blast
source is illustrated in Figure 2.3 (UFC 3-340-02, 2008). The air pressure at a
particular point increases suddenly to a peak value then decreases gradually and goes
through a negative phase. This blast pressure-time profile can be mathematically
represented by the Friedlander equation, as given by Eq. 2.1, where P(t) is the blast
overpressure at time t, Pso is the peak incident overpressure, t0 is the duration of the
positive phase of the blast, b is the waveform parameter (non-dimensional parameter)
and t is the time measured from the instant that the blast wave arrives. Blast
(b) Air burst
(c) Surface burst
(b) Air burst

12 Chapter 2: Literature Review
overpressure is the excess blast pressure over the ambient pressure. Here, Pso = P1
so –
Po, where P1
so is the peak incident blast pressure while P0 is the ambient atmospheric
pressure.
2.2.3 Reflected Blast Pressure
Incident blast pressure is the pressure acting on a surface parallel to the direction of
blast wave propagation. When the surface of interest is at an angle to the direction of
shock waves, reflected blast pressure has to be determined. Both incident pressure
and the reflected pressure variations at a given point with time for a free air burst are
shown in Figure 2-4(a). Peak reflected blast overpressure (Pr) is a function of the
peak incident overpressure (Pso) and the angle of incidence (α). The α is the angle
P(t) = Pso(1 - t/t0) exp(-bt/t0) Eq. 2.1
Figure 2-2: Blast wave propagation with the distance (Ngo et al., 2007)
Figure 2-3: Free field blast pressure variation with the time (UFC 3-340-02, 2008)

Chapter 2: Literature Review 13
between the outward normal to the surface and the direct vector from the point of
explosion to the point on the surface (refer Fig. 2-1(a)). The Pr at a given point is
determined using the reflected pressure coefficient, Cr as given in Eq. 2.2. The Cr
could be obtained for a given Pso and α from the Fig. 2.4(b). The Cr is maximum
when α = 00, which means that highest Pr could be seen when the surface considered
is perpendicular to the direction of the blast wave.
(a) Reflected and incident pressure variations for a free air burst
(b) Reflected pressure coefficient variation with the angle of incident
Figure 2-4: Determination of reflected blast pressure (UFC 3-340-02, 2008)
Pr = CrPso Eq. 2.2

14 Chapter 2: Literature Review
2.2.4 Dynamic Pressure
During a blast, the shock front propagates outward from the charge centre at a high
velocity. At the same time, the air behind the shock front also moves outward at a
lower velocity, creating a wind. The wind force associated with the air mass moving
at a lower velocity creates an additional pressure known as dynamic pressure, which
depends on the wind velocity and air density. The peak dynamic pressure, qo is
determined using the empirical formula given by Eq. 2.3.
2.2.5 Scaled Distance
Blast wave properties such as peak reflected overpressure, positive load duration and
positive reflected impulse, depend on charge weight (W) and standoff distance (R).
The Hopkinson-Cranz or cube root method is widely used in scaling blast loads and
is presented by Eq. 2.4 (Ngo et al., 2007). The scaled distance (Z) is widely used to
estimate blast related parameters in empirical methods. Different methods require Z
to be calculated in either m/kg1/3
or ft/lb1/3
and hence appropriate units should be used
for W (kg or lb) and R (m or ft) whenever applicable.
2.2.6 Estimating Blast Related Parameters
The most challenging part of designing blast resistant structures is to estimate a
credible blast load, as the type, magnitude and location of the explosions caused by
terrorist attacks will be unknown. Hence, the blast load used in the design should be
realistic and also, the blast resistant design achievable. Different methods such as
empirical methods, mathematical equations and numerical methods are available to
estimate blast related parameters. Empirical methods were developed by considering
a vast number of test results coupled with analytical methods and are available to
estimate the blast related parameters for a range of charge weights and standoff
distances. Numerical methods use Computational Fluid Dynamics (CFD) and can
accurately simulate blast wave propagation accounting for the Fluid Structure
Interaction (FSI) effects. However, numerical methods require considerably high
computational time and cost to generate accurate results.
qo = 2.5Pso2/( 7Po + Pso) Eq. 2.3
Z = R/W1/3
Eq. 2.4

Chapter 2: Literature Review 15
In the present study, blast related parameters are evaluated using the empirical
method given in UFC 3-340-02 (2008). For a given charge weight and a standoff
distance, the scaled distance, Z is calculated in ft/lb1/3
. Then the charts developed for
blasts occurring from hemispherical TNT explosions on the surface at sea level are
used to determine the blast wave parameters. Chapters 4-7 treat LG panels fixed to
rigid supports and hence only the positive phase of the blast load is considered in
these chapters, whereas the negative phase will have some influence on flexible
structures (Teich et al., 2011). The positive blast wave parameters such as peak
reflected overpressure, positive load duration and positive reflected impulse are
calculated using the chart shown in Figure 2-5(a). The blast pressure-time history
curve is obtained using the Friedlander equation given in Eq. (1). The integration of
the blast pressure during the positive load duration (t0) gives the blast impulse and
using that, the decay factor (b) of the Friedlander equation is calculated for a required
blast load.
The negative phase of the blast load is treated in Chapter 8, which investigates the
blast response of flexible façade systems. The negative blast wave parameters are
calculated using the chart given in Figure 2-5(b). The negative phase of the blast load
is assumed as a triangular load for simplicity.

16 Chapter 2: Literature Review
(a) Positive blast wave parameters
(b) Negative blast wave parameters
Figure 2-5: Estimation of blast wave parameters for a hemispherical TNT explosion on the surface at
sea level (UFC 3-340-02, 2008)

Chapter 2: Literature Review 17
2.3 VULERABILITY OF BUILDING FACADES TO BLAST LOADS
2.3.1 Glazed Facades in Existing Buildings
Different types of glazed facades are used in buildings, but usually they have four
basic components such as glazed panel, window frame, fasteners and the supporting
structure. Monolithic annealed glass is mostly used as the glazing material in
building facades, but other glass types such as heat strengthened, tempered and LG
are also used in practice. Glazed panels are fixed to the window frames using
structural sealant joints. The glazing unit, consisting of glazing panel, sealant joints
and window frames, is then attached to the supporting structure of the façade using
fasteners. The fasteners could be in the form of steel brackets fixed with nuts and
bolts or spider type connections usually used in point supported glazed facades. Steel
frameworks with mullion and transom members, cable nets, glass fins and steel
trusses are the commonly used supporting structures in glazed facades.
Figures 2-6(a)-2-6(f) illustrate some of these glazed facades used in buildings. Figure
2-6(a) shows a glass facade supported with a structural framework having vertical
and horizontal members. The vertical members spanning between the floors are
known as mullions and those spanning horizontally between the mullions are known
as transoms. Figure 2-6(b) shows a glazed facade at the ground floor of a high rise
building supported with only mullions. The mullions and transoms are usually made
of either steel or aluminium depending on the application. Figure 2-6(c) shows a
glazed facade supported with glass fins. Glass fin is a glass plate that supports the
glazed panels laterally, by facing their plane perpendicular to the face of the facade.
Figure 2-6(d) shows a glazed facade supported with spider arms fixed to a vertical
steel bar. The glazed panels in both Figures 2-6(c) and 2-6(d) do not have a window
frame and they are attached to the supporting structure using point supported
connections at the corners. Figure 2-6(e) shows a glazed facade supported with steel
truss, and facade supported with a steel cable net is shown in Figure 2-6(f)
(Patterson, 2008). Steel truss provides a rigid support, where on the other hand, cable
net is more flexible and hence could absorb some of the energy applied on the
facade.

18 Chapter 2: Literature Review
(a) Mullion and transom support (b) Mullion support
(c) Glass fin support (d) Steel bar support with spider arms
Figure 2-6: Glazed facades used in buildings
The use of LG will enhance the blast performance of building facades. To achieve
the best performance of LG, it should be properly fixed to a window frame along the
four edges. LG supported with mullion and transom systems, cable nets and steel
trusses is able to withstand considerably high lateral loads and hence could provide
adequate blast resistance. However, glazed panels supported with glass fins or using
point supported connections cannot withstand higher lateral loads and therefore they
are not recommend for use with blast resistant glazing.
(e) Steel truss support (Patterson, 2008) (f) Cable net support (Patterson, 2008)

Chapter 2: Literature Review 19
2.3.2 Blast Effects on Building Facades
Research has been carried out with advanced computer codes using CFD to simulate
the blast effects on building facades (Mendis & Ngo, 2003; Ngo et al., 2007). Figure
2-7 (Ngo et al., 2007) illustrates blast pressure distribution on a typical building
facade subjected to 1800 kg of TNT bomb detonated at a 20 m standoff distance. The
peak overpressure is about 4.1 MPa at ground level but it reduces rapidly along the
building height to about 8 kPa at the upper floor level.
Netherton and Stewart (2006; 2009) conducted a structural reliability analysis to
assess the security risk of glazed facades subjected to blast loading. Blast Reliability
Curves (BRC) and risk contours were developed for annealed and toughened glazing
subjected to different charge weights and standoff distances. Figure 2-8 illustrates the
risk contours developed to assess damage to glazed facades in a building under a
blast load with a 50 kg of TNT charge weight at a 50 m standoff distance (Netherton
& Stewart, 2006). The probability of failure considerably reduces along the building
height for both glass types. The probability of failure for annealed glass at the lower
level is 0.95, considerably higher than 0.5, which is the estimated value for
toughened glass. It is evident that glazed facades at the lower level of a building are
more vulnerable to blast events compared to those at upper floors. Moreover, the use
of a strong glass type with an improved blast resistance will reduce their damage
under blast loading.
Figure 2-7: Distribution of blast pressure on building façade (Ngo et al., 2007)

20 Chapter 2: Literature Review
Figure 2-8: Risk contours for glazing damage to building façade under a blast load with W=50 kg
TNT and R=50 m (Netherton & Stewart, 2006)
10mm annealed glass 8mm toughened glass
Chapter 2: Literature Review 21
2.4 BLAST RESISTANT GLAZING AND MITIGATION TECHNIQUES
Different blast mitigation and window retrofit techniques such as window films,
catch systems, window replacement systems, and or a combination of these systems
are used in practice to mitigate blast hazards (Lin et al., 2004). These techniques are
briefly described in this section.
2.4.1 Window Film
Window film is typically a layer of polyester between 0.2-0.4 mm thick, applied on
the interior surface of the glazing. The application of a window film on a glazed
panel is shown in Figure 2-9(a). It holds the broken glass fragments which avoid
them being thrown into the building. Window film is mostly used as a window
retrofit technique, but could not be recommended as a solution when a higher blast
protection is required (Ward, 2006). It degrades when exposed to ultraviolet (UV)
light and hence usually has a shorter life span of about 10 years. Window film is a
good choice when the budget is limited, blast loads are low, and building occupation
is unlikely to exceed a decade (Ward, 2006).
2.4.2 Catcher Systems
Window catcher systems are fixed behind the façade to catch the flying glass
fragments after an explosion. Catcher systems use different methods or combination
of those, such as cables, louvres and fabrics to catch the debris. Figure 2-9(b)
illustrates how a cable catcher system works, by catching a glazed panel that has
been thrown into the building after an explosion. Window catcher systems provide
adequate blast resistance, and are mostly used as a window retrofit technique.
However, they could disturb building occupants and even affect the appearance of a
building, making them of less interest among engineers and architects.
2.4.3 Window Replacement
Replacing windows with blast resistant glazing such as LG and polycarbonate is
expensive, but provides the greatest level of protection. LG absorbs the blast energy,
unlike monolithic glass, and avoids free flying shards as the interlayer holds the glass
fragments upon fracture. LG is more flexible than polycarbonate and hence transfers
comparatively fewer forces to the window frame and supporting structure.
Polycarbonate is a harder material, which is much more expensive than LG and is
mostly used in bullet resistant windows. Figure 2-9(c) shows LG panels while Figure

22 Chapter 2: Literature Review
2-9(d) shows a polycarbonate panel tested for its bullet resistance. The use of LG in
blast resistant glazing could be a safer, more economical and an aesthetically
pleasing solution for potential terrorist attacks than the other techniques as described
above. This research is therefore limited to study the behaviour of blast resistant
glazing with LG and develop a framework for its design for a credible blast event.
(a) Application of a window film (Thomson,
2012)
(b) Cable catcher system (Karagozian &
Case, n. d.)
(c) Laminated glass panels (AJJ Glass
Products Co. Ltd., n. d.)
(d) Polycarbonate panel
Figure 2-9: Blast mitigation techniques
2.4.4 Laminated Glass (LG)
Laminated glass (LG) consists of two or more glass plies, permanently bonded with
one or more polymer interlayers. Upon fracture, annealed and heat strengthened glass
produce large shards, which adhere well to the interlayer, and thus reduce the amount
of flying and falling glass shards. Use of annealed or heat strengthened glass types in
LG, instead of fully tempered glass, has hence been recommended (Norville &
Conrath, 2001). Polyvinyl butyral (PVB) is commonly used as the interlayer material
in LG, but some stiffer interlayer materials such as ionoplast is also used in practice.
LG panels are fixed to the window frames using structural sealant joints, where
silicone and rubber are the common sealant materials, but the former is mostly used
in blast resistant glazing. LG has several advantages over monolithic annealed glass

Chapter 2: Literature Review 23
used in most buildings. One of the major advantages of LG is that even if the glass
cracks, the interlayer holds the glass fragments instead of forming free flying shards.
LG is energy absorptive and has a higher load carrying capacity than the annealed
glass due to its post-crack behaviour, described later in this section. Furthermore, it
has some other advantages such as better sound insulation and ultraviolet (UV)
protection than the monolithic annealed glass.
Response of a LG under a blast load is more complex, compared to that of a
monolithic glass. Failure of a monolithic glass occurs suddenly, unlike LG, where the
interlayer holds the glass fragments even after the glass cracks. A well designed LG
panel should fail by tearing of the interlayer rather than pulling out of the glass panes
from the rebates. The structural sealant joints transfer the shear stress between glass
panes and the frame, allowing the LG to develop its full membrane capacity. Figure
2-10 illustrates the membrane action of an edge bonded LG under blast loading
(David & Andy, 2005). However, if the failure occurs at the sealant joints or frame,
the entire unit will be flung into the building, causing a significant hazard.
Figure 2-10: Membrane action of the edge bonded LG under blast loading (David & Andy, 2005)
Figure 2-11 illustrates the failure of a typical LG panel under different phases by
using its force vs. deflection variation under blast loading (Larcher et al., 2012). The
resistance function used in Fig. 2-11 was developed by assuming the LG panel as a
single degree of freedom (SDOF) model. The SDOF analysis of LG panels under
blast loads is described in the literature (Wedding, 2011). The failure of a LG panel
could be described in five different phases as follows:
1. Elastic behaviour of the glass panes
2. The inner glass pane broken; the outer glass pane is still intact, and the
interlayer is not damaged
3. The outer glass pane fails and the interlayer reacts elastically

24 Chapter 2: Literature Review
4. The interlayer reacts plastically, but the splinters are glued onto the
interlayer
5. The interlayer fails by reaching failure strain or by being cut by the
splinters
Figure 2-11: Failure of LG in five phases (Larcher et. al, 2012)
Phase 1 represents the pre-crack phase, where both glass panes deform elastically
without any fracture or a plastic strain. When the glass panel bends inward, the inner
glass pane develops tension while the outer glass pane develops compression. Glass
is weak in tension and hence the inner glass pane breaks initially, as shown in phase
2. When the LG panel deflects further, even the outer glass pane attracts tension and
its failure is presented in phase 3, where the interlayer deforms elastically during that
phase. After the failure of both glass panes, the interlayer deforms plastically and
absorbs the blast energy, as shown in phase 4. Finally, the interlayer fails by reaching
the failure strain or by being cut by the splinters, as shown in phase 5. Phases 2-5
represent the post-crack phase where the LG panel deforms further until the
interlayer tears after the glass cracks.
Cormie et al. (2009) illustrated a realistic approach to design LG using pre-crack and
post-crack resistance functions by extending the approach presented in the UK
Glazing Hazard Guide (1997). They developed force vs. displacement curves for a
1.55 m × 1.25 m × 7.52 mm annealed LG panel and pointed out that the available
strain energy at the pre-crack phase is only about 3% of the total strain energy
capacity. This emphasised that the post-crack load carrying capacity of a LG is
significantly higher than that at the pre-crack phase. An analytical procedure is
therefore required for the design of LG by capturing both its pre-crack and post-crack
phases.

Chapter 2: Literature Review 25
2.5 MATERIAL BEHAVIOUR UNDER BLAST LOADS
Blast loads occur for a very short duration, such that materials show an increment in
the strength parameters. This section reviews the existing knowledge on the
behaviour of materials such as glass, polymer interlayer and structural silicone
sealant under blast loads.
2.5.1 Glass
Glass is a hard, amorphous substance which is brittle in nature and optically
transparent. It contains microscopic, randomly distributed surface flaws and
scratches across its surface, leading to its brittle fracture. Glass can be categorised
into three types; it can be annealed, heat strengthened or fully tempered glass,
depending on its manufacturing process. The basic glass type, which is known as
annealed (float) glass is composed of about 50-75% of silica (SiO2), Soda (Na2O),
Lime (CaO) and several minor additives. Researchers have studied the chemical
composition of annealed glass and results from two such studies are compared in
Table 2.2. According to Holmquist et al. (1995) SiO2 content of annealed glass is
about 74%. However, it has been reduced to about 51% according to a recent study
conducted by Zhang et al. (2012) emphasizing that less amount of sand (SiO2) is
used to manufacture glass in modern days.
Table 2-2 : Chemical composition of annealed glass (Holmquist et al., 1995; Zhang et al., 2012)
Percent chemical composition (%)
Holmquist et al.
(1995)
SiO2 Na2O CaO MgO Al2O3 K2O Fe2O3
73.7 10.6 9.4 3.1 1.8 1.1 0.2
Zhang et al.
(2012)
SiO2 Na2CO3 Cullet CaMg(CO3)2 CaCO3 Other
51 15 16 13 4 1
Dynamic Material Properties of Glass
Research has been carried out to investigate the dynamic material properties of glass
under different strain rates (Holmquist et al., 1995; Peroni et al., 2011; Zhang et al.,
2012). Holmquist et al. (1995) conducted quasi-static compression and tension tests,
split Hopkinson pressure bar (SHPB) compression tests, explosively driven flyer
plate impact tests, and depth of penetration ballistic tests to investigate the dynamic
material properties of glass. The SHPB compression tests were conducted at two
strain rates of 10-3
/s and 250/s and it was found that the compressive strength of

26 Chapter 2: Literature Review
annealed glass could go beyond 1000 MPa even at the lowest strain rate, where the
compressive strength increment due to strain rate was negligible. Test results from
the split tensile tests indicated that the normalised maximum hydrostatic tensile
pressure (T*) of glass could be about 50 MPa. They used the test results to develop
an integrated glass dynamic material model: Johnson Holmquist Ceramic constitutive
model (JH2 model), which is used to model glass in this thesis. The JH-2 model
accounts for the effects of strain rate and material damage. However, it was derived
from laboratory tests on annealed glass at only two strain rates (10-3
/s and 250/s) for
compression and single flyer plate tests for tension.
Peroni et al. (2011) conducted standard compressive tests on annealed glass to
determine the strain rate effects on glass strength. Static compressive strength tests
were conducted at a strain rate of about 5x10⁻⁴
/s, where the average ultimate
compressive strength and Young’s modulus were found to be about 1087 MPa and
67 GPa respectively. The dynamic SHPB tests were conducted at strain rates in the
range of 1000/s and the corresponding values were about 1180 MPa and 58 GPa
respectively. Compression test results showed that ultimate strength and Young’s
modulus of glass are less influenced by the strain rate. Split tensile tests were
performed to investigate the glass tensile strength at different test speeds. When the
average test speed increased from 9x10⁻³
m/s to about 7.7 m/s, the ultimate tensile
strength of glass increased from about 60 MPa to 90 MPa, highlighting the increase
in the tensile strength, in contrast to that seen with the compressive strength.
However, they did not attach strain gauges to the cylinder specimen, and hence they
could not measure the glass strain or strain rate. Therefore, no dynamic tensile
strength increment with respect to strain rate was given in the study. They conducted
tests only at two strain rates. More dynamic tests are therefore required to get a better
understanding on the dynamic material properties of glass.
Zhang et al. (2012) conducted static compression tests on annealed glass using the
Baldwin static test machine. The average compression strength and Young’s
modulus (E) of annealed glass were found to be about 256 MPa and 66 GPa
respectively at a strain rate of about 1.33x10⁻⁴
/s. They conducted dynamic
compression tests on annealed glass using a modified SHPB at different strain rates.
Test results showed that the compressive strength considerably increases with the
strain rate where the corresponding values at strain rates of 100/s and 375/s are about

Chapter 2: Literature Review 27
475 and 700 MPa respectively. However, there is a negligible change in the E of
glass with the increase of the strain rate. The failure processes of glass under static
and dynamic compression loads are also different. Under quasi-static compression,
glass specimen cracks into a few large pieces, where the ultimate strength is reached
when the damaged glass specimen loses its stability. Under dynamic loading, glass
fails when cracked specimen is crushed. As the strain rate increases, glass shatters
into fine fragments with more failure surfaces, indicating that glass absorbs more
energy from loading source at higher strain rates.
Zhang et al. (2012) conducted split tensile tests (Brazilian test) to investigate the
tensile strength of annealed glass. According to static split tensile test results, the
ultimate tensile strength of annealed glass was found to be about 19.3 MPa. They
conducted dynamic split tensile tests on a series of annealed glass specimens using
the modified SHPB device in a wide range of strain rates (58-696/s). The stress-
strain variation was approximately linear, where E of glass remained around 60-62
GPa for the range of strain rates used in their study. The ultimate tensile strengths of
annealed glass were found to be about 24 and 34 MPa at the strain rates of about 58
and 696/s respectively. As observed from the dynamic split tensile tests, the strain
rate had a negligible effect on the fracture behaviour of the glass specimens. By
analysing the experimental results, Zhang et al. (2012) developed empirical formulae
of Dynamic Increment Factors (DIFs) for compressive and tensile strengths of glass
with respect to strain rate. However, they used glass with less SiO2 content, which
showed considerably less tensile and compressive strengths compared to those given
in the literature.
Testing data from over 700 ring-on-ring tests on annealed glass reported in the
European glazing standard prEN 12374-3 (2009) reveals that tensile strength of
annealed glass varies from 30 MPa to 120 MPa at a loading rate of 2 MPa/s. These
test results can be characterised statistically using a Weibull distribution. For normal
design purposes the breaking strength of annealed glass is given as 45 MPa based on
95% confidence interval. Cormie et al. (2009) extrapolated this strength data to
higher strain rates, and predicted that the dynamic breaking strength of annealed
glass can be in the region of 80 MPa under blast loads, which is within the range of
values (60-90 MPa) observed by Peroni et al. (2011) from his experiments. Material
properties of glass vary due to many reasons such as chemical composition, age and
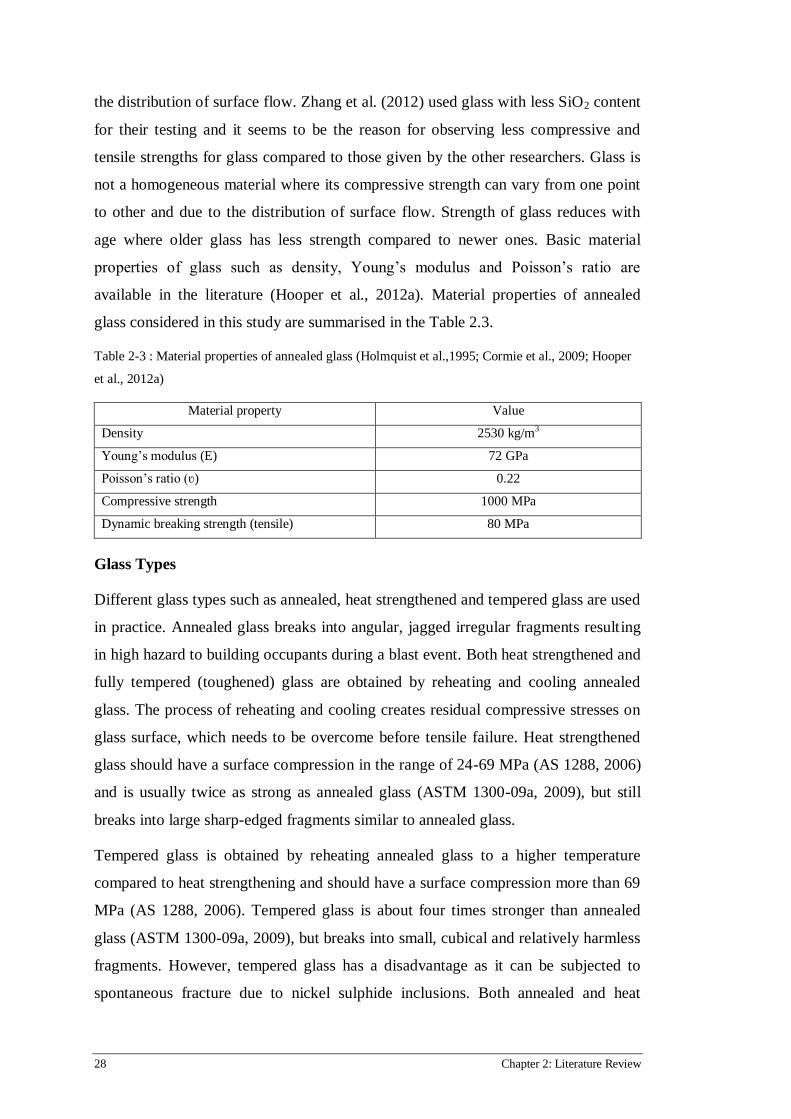
28 Chapter 2: Literature Review
the distribution of surface flow. Zhang et al. (2012) used glass with less SiO2 content
for their testing and it seems to be the reason for observing less compressive and
tensile strengths for glass compared to those given by the other researchers. Glass is
not a homogeneous material where its compressive strength can vary from one point
to other and due to the distribution of surface flow. Strength of glass reduces with
age where older glass has less strength compared to newer ones. Basic material
properties of glass such as density, Young’s modulus and Poisson’s ratio are
available in the literature (Hooper et al., 2012a). Material properties of annealed
glass considered in this study are summarised in the Table 2.3.
Table 2-3 : Material properties of annealed glass (Holmquist et al.,1995; Cormie et al., 2009; Hooper
et al., 2012a)
Material property Value
Density 2530 kg/m3
Young’s modulus (E) 72 GPa
Poisson’s ratio (ʋ) 0.22
Compressive strength 1000 MPa
Dynamic breaking strength (tensile) 80 MPa
Glass Types
Different glass types such as annealed, heat strengthened and tempered glass are used
in practice. Annealed glass breaks into angular, jagged irregular fragments resulting
in high hazard to building occupants during a blast event. Both heat strengthened and
fully tempered (toughened) glass are obtained by reheating and cooling annealed
glass. The process of reheating and cooling creates residual compressive stresses on
glass surface, which needs to be overcome before tensile failure. Heat strengthened
glass should have a surface compression in the range of 24-69 MPa (AS 1288, 2006)
and is usually twice as strong as annealed glass (ASTM 1300-09a, 2009), but still
breaks into large sharp-edged fragments similar to annealed glass.
Tempered glass is obtained by reheating annealed glass to a higher temperature
compared to heat strengthening and should have a surface compression more than 69
MPa (AS 1288, 2006). Tempered glass is about four times stronger than annealed
glass (ASTM 1300-09a, 2009), but breaks into small, cubical and relatively harmless
fragments. However, tempered glass has a disadvantage as it can be subjected to
spontaneous fracture due to nickel sulphide inclusions. Both annealed and heat

Chapter 2: Literature Review 29
strengthened glass are recommended in LG as they break into larger fragments that
adhere well to the interlayer, rather than fully tempered glass which breaks into
smaller fragments. Heat strengthened and tempered glass types have higher tensile
strengths than annealed glass and they are summarised in Table 2-4.
Table 2-4 : Tensile strength of different glass types (AS 1288, 2006; Hooper et al., 2012a; Cormie et
al. 2009)
2.5.2 Polyvinyl Butyral (PVB)
This section reviews the material properties of polyvinyl butyral (PVB) under blast
loads, which is the most common interlayer material used in LG. Pure PVB is stiff
and brittle, but the addition of plasticisers imparts ductility and toughness. The glass-
liquid transition temperature of PVB is around room temperature (18-25 oC) and
hence small changes in temperature give large shifts in the shear modulus. PVB is
said to be viscoelastic as its stiffness and Poisson’s ratio vary as a function of
temperature and load duration. Figure 2-12 shows the variation of shear relaxation
modulus of PVB with time and this behaviour can be represented by Eq. 2.5 (Wei &
Dharani, 2006) as given below.
Where, G(t) is the shear relaxation modulus
G0 is the short-time shear modulus (glassy modulus ≈ 1 GPa)
G∞ is the long-time shear modulus (rubbery modulus ≈ 1 MPa)
β is the decay factor
The shear modulus of the PVB reduces with the time, showing the effects of
viscoelasticity, and this should be considered when analysing the behaviour of PVB
under long duration loads. However, this research is limited to analysing the
behaviour of LG panels under blast loads where the load duration could be in the
range of 0-100 ms. Wei & Dharani (2006) conducted a numerical analysis on LG
panels under blast loads, by considering both viscoelastic and elastic-plastic
Glass type Surface compression
(MPa)
Tensile strength (MPa)
Short Duration (Blast) Long Term
Annealed 0 80 45
Heat strengthened 24-69 168 120-200
Fully tempered 69< 200 120-200
G(t) = G∞ + (G0 - G∞)e-βt
Eq. 2-5

30 Chapter 2: Literature Review
properties of PVB and obtained similar results. They confirmed that the change in
the shear modulus of PVB is negligible under short duration loads (about 100 ms)
and hence the viscoelasticity of PVB could be neglected when analysing the
behaviour of LG under blast loads.
Figure 2-12: Shear relaxation modulus of PVB as a function of time (Wei & Dharani, 2006)
Bennison et al. (2005) investigated the stress-strain variation of PVB (Butacite)
under different strain rates and the results from their study are presented in Figure 2-
13(a). At low strain rates such as 0.07 /s, PVB behaves as a hyper-elastic material,
showing large recoverable elastic strains as in rubber. However, under high strain
rates, it behaves as an elastic-plastic material. When the strain rate increases from
0.07 /s to 89 /s, Young’s modulus of PVB increases from about 10 MPa to 278 MPa,
as shown in Figure 2-13(a). The stress-strain behaviour of PVB at a strain rate of 89
/s was used by Larcher et al. (2012) when analysing the behaviour of LG under blast
loads.
Iwasaki et al. (2007) conducted experiments to investigate the mechanical behaviour
of PVB and PVB laminated glass under various strain rates. Low speed tensile tests
were carried out on PVB specimens using a tensile test apparatus at different strain
rates in a range of 0.0067-0.2 /s. Test results showed that the inclination of the stress-
strain curves becomes steep with respect to the increase of the tensile speed (or strain
rate). They developed a theoretical mass-spring model to represent the behaviour of
PVB, by assuming it behaves as a non-linear viscoelastic material. Theoretical model
agreed well with the experimental results confirming that the behaviour of PVB
could be viscoelastic at lower strain rates. Iwasaki et al. (2007) designed a high-
speed tensile test machine to investigate the behaviour of PVB under higher strain

Chapter 2: Literature Review 31
rates. At a strain rate of about 118 /s PVB showed an elastic-plastic behaviour and
the stress-strain curve that they observed is similar to that obtained by Bennison et al.
(2005) at a strain rate of about 89/s.
Morison (2010) investigated the dynamic behaviour of PVB at strain rates from 33.5
/s to 278 /s at different temperatures. Test results showed that PVB behaves as an
elastic-plastic material especially at higher strain rates. They observed that there is a
considerable increase in the Young’s modulus and the initial yield stress of PVB with
the increase in the strain rate. However, they noticed that there is a reduction in the
failure strain with the increase in the strain rate. PVB behaved as a much stiffer
material at lower temperatures, showing strength enhancement compared to those
tested at higher temperatures. Strain rate under blast loads can go beyond even 400 /s
and hence the Young’s modulus and yield stress of PVB will increase further under
such loading conditions (Menzin, 2006).
Hooper et al. (2012b) experimentally investigated the mechanical behaviour of PVB
at small (<0.1%) and large strains (>200%) over a range of strain rates. The small-
strain response was investigated using dynamic mechanical analysis (DMA) at
frequencies from 1 to 100 Hz and temperatures from -80 to 70 oC. They showed that
a generalised Maxwell model could be used to describe the behaviour of PVB at the
smaller strain regime. The large strain response of PVB was investigated using a
high-speed servo hydraulic test machine at strain rates from 0.2 to 400 /s. The stress-
strain variation of PVB at different strain rates are illustrated in Figure 2-13(b). It is
evident that PVB can be idealised as an elastic-plastic material, especially at higher
strain rates, as seen by the previous researchers. PVB shows a considerable increase
in the Young’s modulus, yield stress and the failure stress at higher strain rates.
Hooper et al. (2012a) used a Generalized Maxwell model to fix the experimental
results and derived a linear elastic model with a Young’s modulus (E) of 530 MPa,
which is the E corresponds to the instantaneous shear modulus obtained during the
experiments.
In this study, material properties of PVB were obtained based on the experimental
results and the analytical model developed by the Hooper et al. (2012a; b). The E of
PVB was used as 530 MPa as used by Hooper et al. (2012a) in his analysis. The yield
stress, failure stress and failure strain of PVB were obtained based on the stress-
strain curves shown in Figure 2-13. Material properties of PVB used in this research

32 Chapter 2: Literature Review
0
5
10
15
20
25
30
0 0.5 1 1.5 2 2.5
Str
ess
(M
Pa)
Strain
are presented in Table 2-5 and the corresponding stress-strain behaviour is shown in
Figure 2-14 (Hidallana-Gamage et al., 2013b). This elastic-plastic behaviour of PVB
was treated throughout the analysis including tension, compression and rebound of
the material.
(a) Bennison et al. (2005) (b) Hooper et al. (2012b)
Figure 2-13: Stress-strain variation of PVB under different strain rates
Table 2-5: Material properties of PVB (Hidallana-Gamage et al., 2013b)
Figure 2-14: Stress-strain variation of the PVB interlayer (Hidallana-Gamage et al., 2013b)
2.5.3 Structural Silicone Sealant
Silicone sealants consist of polydimethylsiloxane (PDMS) polymer which has a
different structure compared to other inorganic polymers used in the sealants. The
Material property Value
Density (ρ) 1100 kg/m3
Young’s modulus (E) 530 MPa
Poisson’s ratio (υ) 0.485
Yield stress 11 MPa
Failure stress 28 MPa
Failure strain 2

Chapter 2: Literature Review 33
siloxane (Si-O-Si) is the backbone of the PDMS polymer, which gives outstanding
properties to the silicone sealant such as inherent durability and elastomeric
properties. The glass transition temperature of silicone sealant is approximately -120
oC so that it exhibits insignificant viscoelastic properties under blast loads (Menzin,
2006). Unlike PVB, silicone sealant is therefore less sensitive to temperature changes
near room temperature, being in the rubbery region. Structural silicone sealants have
higher ultimate shear strength compared to tensile strength, allowing them to resist
in-plane deformations caused under blast loads.
Material properties of silicone sealants depend on the strain rate similar to PVB.
Dow Corning Corporation has conducted experiments to investigate the behaviour of
silicone sealants at high movement rates (strain rates). Figure 2-15 compares the
stress-strain characteristics in tension of a typical silicone sealant at two different
movement rates (Yarosh et al., 2009). When the movement rate increases from
0.0008 m/s to 5 m/s (equals to strain rate increasing from 0.067 /s to 417 /s),
maximum tensile strength and failure strain increase by about 200% and 250%
respectively. It is evident from Figure 2-15 that silicone sealants show elastic-plastic
behaviour under high stain rates where there is a significant increase in their strength
parameters.
Figure 2-15: Stress-strain variation in tension for a typical sealant at different strain rates (Yarosh et
al. 2008)
In this research, the behaviour of silicone sealant was treated as elastic-plastic under
blast loads. The Young’s modulus of silicone sealant was taken as 2.3 MPa by
assuming that it has hardness of about 50 IRHD in accordance with ISO 48 (1994).
The material properties of silicone sealant used in the present study are summarised
in Table 2-6 and the corresponding stress-strain behaviour is shown in Figure 2-16

34 Chapter 2: Literature Review
0
0.5
1
1.5
2
2.5
3
3.5
4
0 0.5 1 1.5 2 2.5 3
Str
ess
(M
Pa)
Strain
(Hidallana-Gamage et al., 2013b). It is assumed that the silicone sealant has identical
Young’s modulus during both loading and unloading conditions. The strain is
recoverable up to the yield point, but there is a permanent deformation beyond the
yield point. The failure strain of sealant is treated as 2.5 where the corresponding
failure stress is about 3.5 MPa. Sealant elements fail after reaching the failure stress
(or strain), where they remain at an approximately zero stress thereafter without
deleting from the FE model.
Table 2-6: Material properties of silicone sealant (Yarosh et al. 2008; Hidallana-Gamage et al., 2013b)
Figure 2-16: Stress-strain variation of silicone sealant (Yarosh et al. 2008; Hidallana-Gamage et al.,
2013b)
2.5.4 Aluminium and Steel
Both aluminium and steel show considerable strength enhancement under high strain
rates occurring under blast loads, compared to their material properties under quasi-
static loads. Material properties of aluminium under higher strain rates occurring
under blast loads are reported in the literature (Kumar et al., 2012; Veldman et al.,
2006). Aluminium does not show a noticeable increase in its Young’s modulus, but
shows a significant increase in its yield strength and the ultimate strength under blast
loads. As an example, under quasi-static loads, the yield strength of aluminium can
be about 150-170 MPa, where its ultimate strength can be about 190-210 MPa
(Bambach, 2008). They can be increased up to about 350 MPa and 430 MPa
Material property Value
Density (ρ) 1100 kg/m3
Young’s modulus (E) 2.3 MPa
Poisson’s ratio (υ) 0.495
Yield stress 2.3 MPa
Failure stress 3.5 MPa
Failure strain 2.5

Chapter 2: Literature Review 35
respectively under blast loads (Veldman et al., 2006). However, aluminium is an
alloy where its material properties can vary from one product to the other. Material
properties of aluminium under static and blast loads are summarised in Table 2-7 and
the corresponding stress-strain variations are shown in Figure 2-17(a).
Material properties of steel under blast loads are available in the literature (Jama et
al., 2012; Liew, 2008; Urgessa & Arciszewski, 2011). Similarly, the Young’s
modulus of steel does not change noticeably with the strain rate, but it shows a
considerable increase in its yield strength and the ultimate strength under blast loads
(Liew, 2008). As an example, the yield strength and ultimate strength of steel under
quasi-static loads are about 400 MPa and 675 MPa respectively, but they can be
increased up to about 675 MPa and 850 MPa respectively under blast loads (Urgessa
& Arciszewski, 2011). Material properties of steel under static and blast loads are
summarised in Table 2-7 and the corresponding stress-strain variations are shown in
Figure 2-17(b).
Table 2-7: Material properties of aluminium and steel (Bambach, 2008; Urgessa & Arciszewski, 2011;
Veldman et al., 2006)
(a) Aluminium (b) Steel
Figure 2-17: Stress-strain variations of aluminium and steel (Bambach, 2008; Urgessa & Arciszewski,
2011; Veldman et al., 2006)
0
100
200
300
400
500
0 0.05 0.1 0.15 0.2 0.25
Str
ess
(M
Pa)
Strain
Blast loads Static loads
0
100
200
300
400
500
600
700
800
900
0 0.05 0.1 0.15 0.2 0.25
Str
ess
(M
Pa)
Strain
Blast loads
Static loads
Material property Aluminium Steel
Static loads Blast loads Static loads Blast loads
Density (ρ) 2720 kg/m3 2720 kg/m3 7850 kg/m3 7850 kg/m3
Young’s modulus (E) 70 GPa 70 GPa 206 GPa 206 GPa
Poisson’s ratio (υ) 0.33 0.33 0.3 0.3
Yield stress 160 MPa 350 MPa 400 MPa 675 MPa
Ultimate strength 200 MPa 430 MPa 675 MPa 850 MPa
Failure stress 200 MPa 430 MPa 525 MPa 700 MPa
Failure strain 0.2 0.2 0.2 0.2
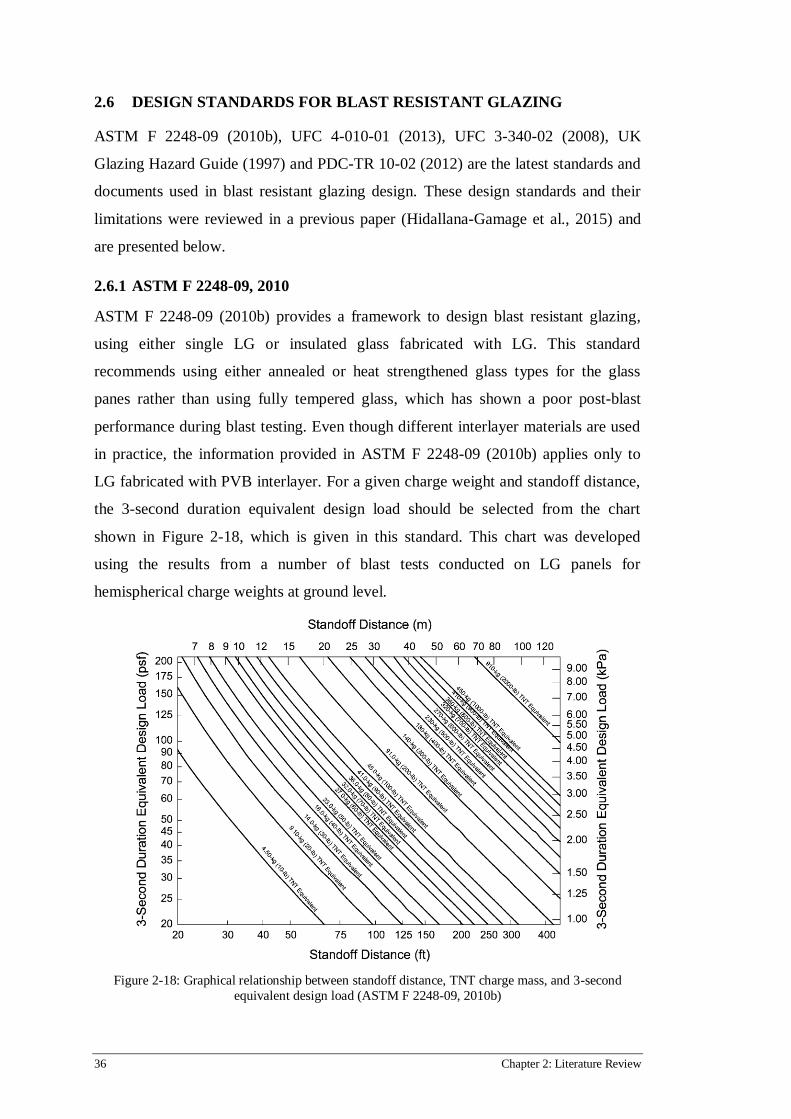
36 Chapter 2: Literature Review
2.6 DESIGN STANDARDS FOR BLAST RESISTANT GLAZING
ASTM F 2248-09 (2010b), UFC 4-010-01 (2013), UFC 3-340-02 (2008), UK
Glazing Hazard Guide (1997) and PDC-TR 10-02 (2012) are the latest standards and
documents used in blast resistant glazing design. These design standards and their
limitations were reviewed in a previous paper (Hidallana-Gamage et al., 2015) and
are presented below.
2.6.1 ASTM F 2248-09, 2010
ASTM F 2248-09 (2010b) provides a framework to design blast resistant glazing,
using either single LG or insulated glass fabricated with LG. This standard
recommends using either annealed or heat strengthened glass types for the glass
panes rather than using fully tempered glass, which has shown a poor post-blast
performance during blast testing. Even though different interlayer materials are used
in practice, the information provided in ASTM F 2248-09 (2010b) applies only to
LG fabricated with PVB interlayer. For a given charge weight and standoff distance,
the 3-second duration equivalent design load should be selected from the chart
shown in Figure 2-18, which is given in this standard. This chart was developed
using the results from a number of blast tests conducted on LG panels for
hemispherical charge weights at ground level.
Figure 2-18: Graphical relationship between standoff distance, TNT charge mass, and 3-second
equivalent design load (ASTM F 2248-09, 2010b)

Chapter 2: Literature Review 37
After determining the 3-second duration equivalent design load, a relevant chart as
shown in Figure 2-19 should be selected from ASTM E 1300-09a (2009) to obtain
the thickness of the LG. ASTM F 2248-09 (2010b) recommends using either
structural silicone sealant or adhesive glazing tape to fix glazing to the supporting
frame. The width (bite) of the structural silicone sealant bed should be at least equal
to or greater than 10 mm or the nominal thickness of the glass panes, while less than
twice the nominal thickness of glass panes to which it adheres. The minimum
thickness of the structural silicone sealant bed should be 5 mm. The glazing tape
should be within two to four times the thickness of the glass pane.
Figure 2-19: Non-factored load chart for 6.0 mm (0.25”) glass with four sides simply supported
(ASTM E 1300-09a, 2009)
Framing members are designed to withstand a load, twice the load resistance of the
attached glazing, and edge deflection of the glazing should be less than L/60 (L
denotes the length of the supported edge). The framing system supporting the glazing
should be attached mechanically to the structural framing system using fasteners that
should be designed to resist uniform load acting on the glazing. The design load of
the fasteners should be two times the magnitude of the load resistance of the glazing,
if the maximum air blast pressure is greater than one half the magnitude of the load
resistance of glazing. On the other hand, the fasteners should be designed to a load
equal to the load resistance of the glazing if the maximum air blast pressure is less
than one half the magnitude of the load resistance of glazing. The guidelines given in
ASTM F 2248-09 (2010b) ensure that blast resistant glazing fails by tearing of the
interlayer rather than a failure at the supports. Blast resistant glazing designed with

38 Chapter 2: Literature Review
this standard performs to the minimal hazard as defined in ASTM F 1642-04
(2010a). When a LG panel fails under a minimal hazard, it is expected to fracture but
it should remain in the frame without any failure at the sealant joints and the
supporting frame. Design guidelines in ASTM F 2248-09 (2010b) have been
explained in detail by Norville and Conrath (2006).
However, ASTM F 2248-09 (2010b) has some limitations when designing blast
resistant glazing and these are explained in this thesis. The chart shown in Figure 2-
18 can be used to calculate the 3-second duration design loads only for charge
weights in the range of 4.5-910 kg TNT, and for standoff distances in the range of 6-
120 m. The design charts available in ASTM E 1300-09a (2009) were developed
only for LG panels having PVB as the interlayer material without accounting for the
thickness of the interlayer. This standard therefore does not account for the effects
due to the variations of the thickness of the interlayer and also the effects of different
interlayer materials with varied material properties for the blast response of LG
panels. The charts available in ASTM E 1300-09a (2009) could only be used to
design LG panels having a maximum length of about 5 m and width of about 4 m. A
conservative design approach based on static analysis is used to design window
frames, fasteners and other supporting elements.
2.6.2 Unified Facilities Criteria (UFC) Standards
The Department of Defence (DOD) in United States has developed Unified Facilities
Criteria (UFC) standards, which are applicable for designing blast resistant windows.
The latest versions of two of the UFC standards: UFC 4-010-01 (2013) and UFC 3-
340-02 (2008), are reviewed below. The former describes an approach of designing
blast resistant windows basically with LG, while the later provides a design approach
with monolithic fully tempered glass.
UFC 4-010-01, 2013
The latest version of UFC 4-010-01 published in October 2013, supersedes its
previous versions published in 2003, 2007 and 2012. UFC 4-010-01 (2013) defines
different levels of protections known as: below at standard, very low, low, medium
and high. These correspond to high hazard, low hazard, very low hazard, minimal
hazard and no hazard respectively, according to glazing hazard ratings defined in
ASTM F 1642-04 (2010a). Two baseline explosives (explosive weights I and II) are

Chapter 2: Literature Review 39
defined in the standard and their magnitudes are not mentioned publically, due to
security reasons.
Department of Defence (DOD) buildings are divided into different categories, where
minimum and conventional construction standoff distances are given for each
building category (refer Table B-1 in UFC 4-010-01). Conventional construction
standoff distance implies the minimum standoff distance required by a DOD building
to achieve either very low or low level of protections without any measures for blast
resistance. Buildings must at least satisfy the minimum standoff distance requirement
and those that do not meet conventional construction standoff distances, or that
require a higher level of protection, should be designed for potential blast threat at
the available standoff distance.
According to UFC 4-010-01 (2013), windows and skylights in the buildings that
required blast resistance must be fabricated with LG, and they could be designed for
the credible blast load by dynamic analysis, testing or the approach given in ASTM F
2248-09 (2010b). Dynamic analysis could be conducted using computer programs as
described in PDC-TR 10-02 (2012). Blast testing should be conducted according to
ASTM F 1642-04 (2010a), and they are described in the thesis later. The design
approach given in ASTM F 2248-09 (2010b) ensures a medium level of protection
according to UFC 4-010-01 (2013) (minimal hazard according to ASTM F 1642-04)
and was described earlier in the thesis. Minimum interlayer thickness should be 0.76
mm and the designs of glass pane thickness, structural sealant joints, frames and
fasteners are carried out according to ASTM F 2248-09 (2010b).
Addition to LG, polycarbonate windows could also be used in blast resistant
windows where the frame bite (width of structural sealant joints) should be no less
than 1.5 times the polycarbonate thickness. Design should be carried out using a
value of 1 for both load and strength reduction factors for all methods of analysis
referenced in UFC 4-010-01 (2013).
UFC 3-340-02, 2008
UFC 3-340-02 (2008) provides a framework to design glazed facades, with
monolithic fully tempered glass, for blast loads. The blast load is treated as a
triangular load and a simplified single degree of freedom (SDOF) model is used to
simulate the dynamic response of the glass panels. The glass panels are analysed

40 Chapter 2: Literature Review
based on large deflection plate theory, since the panel deflections are large compared
to the thickness of the panel. The maximum allowable principal tensile stress of
glazing is used as 16000 psi (110 MPa) in the standard. Design deflection is the
centre deflection, which corresponds to maximum principal tensile stress at any point
in the glass panel.
UFC 3-340-02 (2008) provides several charts, as in Figure 2-20, to determine the
required glass pane thickness for a given blast overpressure and positive load
duration. The charts were developed for fully tempered glass panels having different
aspect ratios between 1 and 4 and glass thicknesses of 1/4” (6.35 mm), 5/16” (7.94
mm), 3/8” (9.53 mm), 1/2” (12.7 mm), 5/8” (15.88 mm) and 3/4” (19.05 mm). In
addition to charts, set of formulae is given in the standard to design blast resistant
glazing. Framing members should be designed for the load transferred from the glass
panel and static design blast load applied to all exposed members. Relative
displacement of the framing members is limited to the smaller of 1/264th
of its span
and 1/8” (3.18 mm). Maximum stresses in the framing members and fasteners are
limited to fm/1.65 and fm/2 respectively where, fm is the yield strength of the frame
material.
Figure 2-20: Peak blast pressure capacity for tempered glass panes with an aspect ratio (a/b) of 1 and
thickness of 6 mm (0.25”) (UFC 3-340-02, 2008)
The limitations in the UFC 3-340-02 (2008) standard are briefly described below.
This standard uses a simplified SDOF analysis method to study the blast response of
glazed panels by accounting for the positive phase of the blast load only. The design
charts developed in this standard are applicable for monolithic fully tempered glass
only. The maximum length and width of the glass panels that could be designed with

Chapter 2: Literature Review 41
UFC 3-340-02 (2008) are limited to about 3 and 1.5 m respectively. However, it
could be noted that the generalized analyse and design method given in this standard
can be applied for the design of LG or any glazing type with different sizes, if the
corresponding load-resistance curve is determined from an analytical or experimental
study.
2.6.3 UK Glazing Hazard Guide, 1997
The UK Glazing Hazard Guide (1997) provides a more realistic approach for
designing glazed facades with LG panels, by accounting for their both pre-crack and
post-crack behaviour under blast loads. This guide idealises a LG panel as a SDOF
system and undertakes a time-history analysis for a given blast threat. Pre-crack
resistance function is derived based on large deflection plate theory, by considering
the dynamic breaking strength of glass. The dynamic breaking strengths used in the
design are 80 MPa for annealed glass and 200 MPa for fully tempered glass. The
post-crack resistance function is derived considering the membrane action of the
PVB interlayer, but neglecting the stiffness of cracked glass panes. Based on the
extensive blast tests conducted for common window sizes used in the UK (about 1.25
m × 1.55 m), it has been shown that about 200 mm centre deflection will cause the
limit of tearing in the PVB interlayer.
The UK Glazing Hazard Guide (1997) provides a set of diagrams called Pressure-
Impulse diagrams (P-I diagrams) for common window sizes used in the UK, which
could be used to evaluate their performance under a given blast loading. Figure 2-21
shows the P-I Diagram for a 1.25 m × 1.55 m LG, as having 6.76 mm (3 mm glass +
0.76 mm PVB + 3 mm glass) thickness (Smith, 2001). Each contour line in the
diagram connects P-I pairs giving the same deflection and stress, and those are called
iso-damage lines. The lower contour line represents the P-I pairs causing the initial
crack of the glass pane, while the upper contour line represents P-I pairs causing
tearing of the PVB interlayer. Known blast threats can be marked on the P-I diagram
of a selected LG panel to estimate its performance under the blast threat. The panel
edges should be securely held in robust frames by using structural silicone sealant
with a width (bite) of about 35 mm. Support reactions can be obtained based on
equivalent SDOF factors for two-way spanning, simply supported panes with a
uniform load.

42 Chapter 2: Literature Review
This guide has some limitations, as briefly described below. It is restricted to military
use giving limited access to the external users. The authors could not find a copy of
this document and hence limited information is given in this thesis. The UK Glazing
Hazard Guide (1997) is limited to a few window sizes used in the UK and therefore
has a limited application in designing blast resistant glazing in real buildings.
Figure 2-21: Iso-damage curves for 1.25 m × 1.55 m LG panel with a thickness of 6.76 mm
(3+0.76+3) (Smith, 2001)
2.6.4 Protective Design Centre - Technical Report (PDC-TR) 10-02
The Protective Design Centre - Technical Report (PDC-TR) 10-02 (2012) presents
engineering guidelines and cost effective solutions for the design of window systems
to reduce their fragment hazards from blast loads. This report describes two design
approaches, known as the static and dynamic approaches, which could be used to
design single glazing units or insulated glazing units fabricated with LG to blast
loads. The static design approach is the same approach presented in ASTM F 2248-
09 (2010b), which is used in conjunction with ASTM E 1300-09a (2009) to select an
appropriate glass type and a thickness. This approach was described earlier in this
thesis and is also described in detail in PDC-TR 10-02 (2012) with some worked
examples.
Dynamic analysis and design of blast resistant glazing could be carried out by using
the available FE codes or the computer programs recognised by the blast community.
This research prefers the use of FE codes when analysing and designing glazing
under blast loads and this approach will be described later. However, PDC-TR 10-02
(2012) provides some useful information on computer programs and their

Chapter 2: Literature Review 43
applications to design window systems under blast loads. SBEDS-W and WinGARD
are two such computer programs where SBEDS-W is available from the Protective
Design Centre (PDC) and WinGARD is available from the Whole Building Design
Guide (WBDG). These programs are based on SDOF analysis, where their approach
is an iterative process of selecting initial glazing or member size and then repeating
the analysis until the window system is found to have an acceptable response. The
dynamic design procedure based on the SBEDS-W computer program is described in
detail in PDC-TR 10-02 (2012).
Computer programs used in blast resistant glazing design have some limitations, as
described below. One of the major limitations is that the design outcome will be
much conservative as it is based on simplified SDOF analysis. On the other hand, a
comprehensive knowledge and an understanding about the computer program is
required to achieve feasible and safe design. However, these programs generate the
output results in numbers, unlike in the FE codes, where it is possible to observe the
predicted response and the failure pattern.
2.7 STANDARD TEST METHODS FOR BLAST RESISTANT GLAZING
Standard test methods provide a guideline for classifying the hazard rating of glazed
panels depending on their performance under blast loads. These test methods can be
classified into two types, arena air blast test and shock tube test. An arena air blast
test is carried out in an open environment and is expensive as compared to the shock
tube test, but it tests several test panels simultaneously. A shock tube test is carried
out in a closed tube and is not a realistic test, but is capable of reproducing the same
shock repeatedly. Standard test methods are available for both test types and they are
explained below.
2.7.1 ASTM F 1642-04, 2010
The ASTM F 1642-04 (2010a) test method provides a structured procedure to test
and rate all glazing, glazing systems, and glazing retrofit systems including, but not
limited to, those fabricated from glass, plastic, glass-clad plastics, LG, glass/plastic
glazing materials, and film-backed glass. The hazard rating of a glazing system is
determined based on the severity of fragments generated during the blast testing. The
severity of fragments is determined by considering the number, size and location of
fragments observed after the test. A fragment is defined as any particle having a

44 Chapter 2: Literature Review
united dimension of 2.5 cm or greater, which is calculated by adding its width, length
and thickness.
The ASTM F 1642-04 (2010a) provides six rating criteria known as: no break, no
hazard, minimal hazard, very low hazard, low hazard and high hazard. These are
explained in the standard. Testing can be conducted using either arena air blast or
shock tube test types, from which the blast load is obtained. This standard requires at
least three test specimens representative of a glazing or glazing system to be tested at
a given blast load, and an additional specimen should be used for pre-test
measurements. Pressure transducers are used to record the blast pressure on the test
panel during the testing.
2.7.2 International Organization for Standardization (ISO) Standards
The International Organization for standardization (ISO) provides two standard test
methods that could be used to test and classify the performance of glazing systems
under blast loads. They are ISO 16933 (2007a) and ISO 16934 (2007b), where the
former is based on the arena air blast test and the latter is based on the shock tube
test. ISO 16933 (2007a) covers a broad range of blast parameters incorporating seven
standard blasts, simulating vehicle bombs, and seven standard blasts, simulating
smaller, hand-carried satchel bombs. On the other hand, ISO 16934 (2007b) applies
for blast waves generated in the shock tube facility, simulating the reflected pressures
and impulses generated from high-explosive detonations of approximately 30-2500
kg TNT at standoff distances of about 35-50 m. Both standards provide a structured
procedure to test security glazing, including those fabricated from glass, plastic
glazing sheet materials, glass-clad plastics, LG, insulated glass, glass/plastic glazing
materials, and film-backed glass.
A minimum of three test specimens, each (1100 ± 5 mm) x (900 ± 5 mm) should be
tested at a given level of air blast for the purpose of classification according to these
standards. Test specimens should be clamped to the test frame, using rubber strips of
4 ± 0.5 mm thick, 50 ± 5 mm wide and of hardness 50 ± 10 IRHD in accordance with
ISO 48 (1994). However, non-standard test specimens could only be tested, but not
classified according to these standards. They provide six hazard ratings: A-F (no
break, no hazard, minimum hazard, very low hazard, low hazard and high hazard).
These are based upon the severity of fragments and hazard effects, evidenced by
distribution of fragments and damage to the witness panel occurred during the blast

Chapter 2: Literature Review 45
test. These hazard ratings are described in detail in both standards and are similar to
those given in ASTM F 1642-04 (2010a).
2.7.3 BS EN 13541, 2001
The BS EN 13541 (2001) specifies a test method, performance requirements and
classification for explosion resistant glazing in buildings. The classification given in
this standard is only valid for tested glass sizes of about 1 m2 having a length of
(1100 ± 5) mm and a width of (900 ± 5) mm. The glazed panels are clamped to the
window frame along the four edges, using rubber strips having (50 ± 2) mm width, (4
± 1) mm thickness and (50 ± 10) hardness in accordance with ISO 48 (1994). This
standard accounts for the blast waves, generated from both arena and shock tube test
types. Test panels can be classified under four different classes, depending on the
severity of the maximum positive overpressure and the positive impulse of the
reflected blast wave, as given in the Table 1 of the BS EN 13541 (2001). This
standard requires at least three test specimens to be tested under a blast load at a
specified class, where an additional test specimen is required in the case of invalid
test performance.
2.7.4 US General Services Administration (GSA) Standard, 2003
US General Services Administration (GSA) Standard (2003) is intended to ensure an
adequate measure of standardization and quality assurance in the testing of window
systems including but not limited to glazing, sealants, seats and seals, frames,
anchorages and all attachments and/or secondary catcher or restraint mechanisms
designed to mitigate the hazards from flying glass and debris. This standard is the
sole test protocol by which blast resistant windows and related hazard mitigation
techniques and products shall be evaluated for facilities under the control and
responsibility of the GSA. The GSA standard (2003) is applicable for both arena air
blast and shock tube test types. The standard size of the test specimens used with this
standard is 48” (1.2 m) in width and 66” (1.65 m) in height, where the window sill
height should be approximately about 24” (0.6 m) off the floor level. However, test
panels with different sizes can also be tested according to this standard.
The blast performance of the test panels are evaluated based upon the post-test
location of fragments and debris relative to the original (pre-test) location of the test
panel. This standard provides six performance conditions: 1, 2, 3a, 3b, 4 and 5,

46 Chapter 2: Literature Review
where the corresponding hazard levels are none, none, very low, low, medium and
high hazard. The witness panel of this test method is designed to record fragments
and debris impacts located within the enclosed reaction structure, at a distance not
exceeding 10’ (3 m) from the interior face of the test panel. It is recommended to use
at least one high-speed camera to record the response of the test specimens from an
interior view. There should be at least two air blast pressure transducers on each test
reaction structure to measure the pressure-time waveform acting on the exterior
surface of tested specimens. Additionally, a minimum of one interior pressure
transducer is required in each test structure.
2.7.5 Limitations in the Test Methods
The major limitation in these test methods is the high cost involved with blast testing.
Most of the universities and government organisations do not have sufficient funds
and space to conduct blast testing. As described above, all these standards require
additional test specimens to be tested under a given blast load, as repetitive testing is
required to accurately predict the behaviour and the failure of a glazed panel under a
blast load. On the other hand, these test methods are valid for small test specimens
with standard dimensions and large glazed panels used in most buildings could not
be classified according to the above standards. Health and safety issues and
environmental pollution are some other negative effects of blast testing.
Most of the design standards provide useful information to design blast resistant
glazing using LG windows. However, these design standards and test methods also
have some limitations and they were briefly discussed above. Experimental studies
have been carried out to investigate the behaviour of LG under blast and impact
loads and some of these studies are briefly described below.
2.8 PREVIOUS IMPACT AND BLAST TESTS ON LG
This section reviews the previous impact and blast tests on LG. Zhang et al. (2011,
2013a) carried out laboratory impact tests to investigate the vulnerability of LG
windows subjected to windborne wooden block impact. Typical LG panels with a 2
m height, 1.1 m width and a 7.52 mm thickness (3 mm glass + 1.52 mm PVB + 3
mm glass) were treated in their study where wooden blocks weighting 2 kg with a 15
m/s velocity were used to generate the impact loads. Different tests were carried out
by varying the glass and interlayer thicknesses. They found that the interlayer

Chapter 2: Literature Review 47
thickness plays a dominating role in the penetration resistance capacity of LG
subjected to windborne debris impact. Kaiser et al. (2000) conducted a laboratory
test program to investigate the impact response of LG. LG panels of size 1.52 m ×
1.83 m were used for the test, where a small steel ball (2 g in weight) was used to
apply the impact load. Experimental results showed that increasing the thickness of
both inner glass pane and interlayer significantly increase the steel ball impact
velocity required to cause inner glass pane breakage.
Zhang et al. (2014) conducted laboratory tests using a pendulum impact system to
investigate the behaviour of LG under impact loads. LG panels of size 0.67 m × 0.67
m with a 35 mm embedment along the four sides were used for the test. Different test
specimens with glass panes of 3 and 6 mm thicknesses and PVB interlayers of 0.38
and 0.76 mm thicknesses were used in their study to investigate the influences of
glass and interlayer thicknesses on the response of LG. A uniform dynamic pressure
was applied by placing an air bag in front of the LG panel. Pressure transducers were
used to monitor the applied pressure, and mechanical Linear Variable Displacement
Transducers (LVDT) were used to measure the centre deflections of the LG panels.
The failure process of the LG panels was monitored by high-speed cameras. Results
showed that the increase in the glass pane thickness has a significant impact on the
centre deflection of the LG panel while the interlayer thickness has a less significant
impact on the centre deflection.
Zhang et al. (2014) carried out full-scale free field blast tests on LG panels of size
1.5 m × 1.2 m. LG panels were fully clamped along the four sides with steel frames.
Explosive charge weights of 10 kg TNT equivalent were used at different standoff
distances to generate blast loads. Different test specimens with glass panes of 3 and 6
mm thicknesses and PVB interlayers of 1.52 and 2.28 mm thickness were used in
their study to investigate the influences of glass and interlayer thicknesses on the
blast response of LG. Results showed that the LG panels with thicker glass panes
have a higher load carrying capacity, while those with thinner glass panes have
significantly high centre deflections, which led to the failure at their supports. The
increase in the interlayer thickness had a less influence on the centre deflection, but it
had improved the anti-tearing capacity of the LG panels.
Kranzer et al. (2005) conducted both free-field and shock tube blast tests to
investigate the behaviour of LG panels under blast loads. The experiments were

48 Chapter 2: Literature Review
conducted according to the standard BS EN 13541 (2001), on LG panels with 1.1 m
width, 0.9 m height and 7.52 mm thickness (3 mm annealed glass + 1.52 mm PVB +
3 mm annealed glass). The LG panels were clamped to a rigid frame along the edges
using rubber sealant joints with 50 mm width and 4 mm thickness. Pressure
transducers were used to measure the applied blast pressure, while laser optical
displacement transducers were used to measure the centre deflection of the LG panel.
The experiments were conducted under different levels of blast loads causing less
and high damage to the LG panels. Experimental results from two of their tests
conducted under a weaker and stronger blast load are used to validate the FE
modelling techniques presented in this thesis.
Hooper et al. (2012a) conducted free field blast tests on 7.52 mm thick (3 mm
annealed glass + 1.52 mm PVB + 3 mm annealed glass) LG panels of size 1.5 m ×
1.2 m. LG panels were fixed to the window frame along the inner perimeter using
structural sealant joints. Blast loads were produced using charge weights of 15 and
30 kg TNT equivalent at 10-16 m standoff distances. Deflection and shape
measurements of the LG panel were obtained using high-speed digital image
correlation. The LG panels were tested under considerably high blast loads where
three out of four tested samples failed at the silicone joints. This could also be
attributed to the fact that the silicone sealant joints were used only at the inner
perimeter of the LG panel. These experimental results therefore highlight the need
for proper specification for the design of structural sealant joints and framing
members for a credible blast load.
In addition to the experimental studies as described above, blast and impact tests on
LG have been carried out and reported in the literature (Nawar et al., 2013; Larcher
et al., 2012; Wedding, 2011; Lusk et al., 2011; Remennikov et al., 2008). The
available experimental results provide valuable resources to study the response of LG
under blast and impact loads. However, blast testing has some limitations as was
described in section 2.7.5. Those reasons led the researchers to focus on numerical
studies to investigate the blast response of LG windows. Some of these numerical
studies using FE codes are reviewed in the section below.

Chapter 2: Literature Review 49
2.9 NUMERICAL ANALYSIS OF LG
Numerical analysis with FE codes is a feasible method that has been used to
investigate the behaviour of LG panels under blast loads. FE codes having explicit
capabilities such as EUROPLEXUX, ABAQUS, ANSYS and LS-DYNA have been
widely used to study the blast response LG panels. This section reviews the most
recent and important literature on this context.
2.9.1 Using EUROPLEXUX FE code
Larcher et al. (2012) conducted nonlinear dynamic analysis of LG panels using
EUROPLEXUX FE code. Three different approaches were presented to model LG
including a layered model, smeared model and a 3D solid element model. They
pointed out that both the smeared model and the layered model had some limitations,
as they present a linear in-plane strain distribution through the thickness. The layered
model could not represent the case where one glass ply fails and the other resists.
The 3D solid element model could not predict large deflections or the post-crack
behaviour of LG, due to element distortions.
2.9.2 Using ABAQUS FE code
Hooper et al. (2012a) conducted nonlinear dynamic analysis of LG panels under blast
loads, using ABAQUS FE code. The FE analysis was conducted in two different
phases to represent both pre-crack and post-crack phases. The pre-crack phase was
modelled separately, using 2D shell element and 3D solid element models to
investigate the effects of viscoelasticity of the PVB interlayer, as the shell element
model could not account for viscoelasticity. Since both shell and solid element
models had given similar results showing no effects from viscoelasticity, only the 2D
shell element model was used to model the post-crack phase. In the post-crack
model, stiffness of the glass layers was reduced to zero and a rate dependent
plasticity law was used to account for the membrane response of cracked laminate.
This model therefore could not account for the damaged strength of glass, where the
stiffness of glass elements was neglected in the analysis. This model assumed a
linear variation for in-plane strain across the thickness, which might not be true, due
to differences in the Young’s modulus of glass and PVB.

50 Chapter 2: Literature Review
2.9.3 Using ANSYS FE code
Wedding (2011), and Weggel and Zapata (2008) investigated the behaviour of LG
windows under blast loads using ANSYS FE code. Wedding (2011) presented a
more precise approach by modelling the structural silicone sealant joints. The results
from the FE analysis were found to be in good agreement with the experimental
results. Weggel et al. (2008) did not consider the PVB interlayer, but the silicone
sealant was modelled as three linear springs representing in-plane, normal and
rotational stiffness at each node. However, that model has some limitations, since the
spring constants are available only for the 6.35 mm thick and 12.7 mm wide sealant
support.
2.9.4 Using LS-DYNA FE code
Hidallana-Gamage et al. (2013a), Chung et al. (2010), and Lusk et al. (2011)
analysed LG under blast loads using LS-DYNA FE code incorporating material
model 32 (MAT_LAMINATED_GLASS), which is implemented for 2D shell
elements only. The material model 32 allows the definition of several integration
points through the thickness of the shell element, such that each integration point
represents either glass or PVB. Both glass and PVB require material properties such
as Young’s modulus, Poisson’s ratio, yield stress and plastic hardening modulus to
be defined. Failure strain should be defined for glass where the PVB is allowed to
deform infinitely without any failure strain. However, material model 32 has some
limitations, such as the inability to capture the damage strength of glass or to model
realistic support conditions (Hidallana-Gamage et al., 2013a).
Timmel et al. (2007) presented two modelling approaches to model LG with LS-
DYNA FE code. In a first approach, a shell element for the glass and a membrane
element for the interlayer were used. The FE model accounted for the failure of
glass, where the glass fails if the principal strain reaches a critical value. The
interlayer was modelled as a hyper-elastic material. The FE model could simulate the
realistic fracture behaviour of laminated glass qualitatively, where the results from
FE analysis agreed well with the experimental results from a roof crush simulation.
However, that model was not able to simulate the bending stiffness of LG
appropriately. Therefore, they presented a modified approach using a smeared
formulation of glass and interlayer, which could simulate the acceleration of an
impactor shot on a windscreen satisfactory. However, they pointed out that this

Chapter 2: Literature Review 51
modelling technique requires further investigations to avoid the coincident element
formulation.
Wei et al. (2006), Lumantarna et al. (2007), Wu et al. (2010) and Zhang et al. (2011,
2013a and 2013b) modelled LG with 3D constant stress solid elements using LS-
DYNA FE code. Wei et al. (2006) modelled glass as an elastic material, while
treating the PVB interlayer as a viscoelastic material. They used a cumulative
damage theory, where a two-parameter Weibull distribution was adopted to describe
the cumulative probability of failure of monolithic glazing and inner glass of LG
subjected to blast loading. However, they simplified the FE model by assuming
simply supported boundary conditions. Lumantarna et al. (2007) analysed LG under
blast loads using material model 110 (MAT_HOLMQUIST_CERAMICS) for glass
and material model 12 (MAT_ISOTROPIC_ELASTIC_PLASTIC) for PVB.
However, they did not provide detailed information on their FE model, such as
modelling the structural sealant joints and the relevant material parameters used in
the analysis.
Wu et al. (2010) and Zhang et al. (2011, 2013a) analysed LG under impact loads,
using material model 110 for glass and material model 24
(MAT_PIECEWISE_LINEAR_PLASTICITY) for PVB. Zhang et al. (2011, 2013a)
carried out laboratory tests to investigate the response of window panels to
windbrone debries impact and their experimental results agreed well with those from
the numerical analysis. These studies provide a more realistic approach to model the
behaviour of LG by accounting for the damage strength of glass and the dynamic
material properties of interlayer at higher strain rates. Zhang et al. (2013a and 2013b)
extended their study to investigate the behaviour of LG under blast loads and their
modelling techniques were validated with the blast test data available in the literature
(Kranzer et al. 2005). Zhang et al. (2013b) performed numerical sumulations to
construct P-I diagrams for LG panels to provide correlation between their dynamic
response and blast loading. Empherical fomulae were developed based on numerical
results to predic the impluse and pressure asymptote on the P-I diagrams. However,
they too used FE models with simplified boundry conditions (fully fixed or pined)
without accounting for the structural sealant joints.

52 Chapter 2: Literature Review
2.9.5 Limitations
Overall, most of the research using FE techniques to study the behaviour of LG
panels under blast loads has some limitations, as given below.
1. Inability to capture the damaged strength of glass and hence the post-crack phase
of a LG where the interlayer deforms even after the glass cracks
2. Inability to capture the effects of structural sealant joints at the supports as most
research used simplified support conditions
This emphasises the need for a rigorous analytical procedure to address the
limitations in the research to date. This research will develop a new FE based
procedure to study the blast response of LG panels by addressing the above
limitations.
2.10 EFFECTS OF THE NEGATIVE PHASE OF THE BLAST LOAD
Most research investigated the blast response of LG panels by accounting for the
positive phase of the blast load only. However, limited research has studied the blast
response of LG panels by accounting for the negative phase. Krauthammer et al.
(2000) used a simplified numerical model incorporating the Mathematica computer
code to study the blast response of LG panels. A linear spring-mass SDOF system
without damping was used for the numerical model by assuming simply supported
boundary conditions. Two LG panels of size (length × width × thickness) 1.397 m ×
1.448 m × 0.00963 m and 1.524 m × 2.438 m × 0.0064 m were used in the analysis.
Parametric study was carried out using two charge weights of 10 and 100 kg TNT
equivalent while varying the scaled distance from 0 to 100 ft/lbs1/3
(0 to 39.64
m/kg1/3
). Results showed that the negative phase of the blast load has a noticeable
influence on the blast response of the LG panels under smaller blast loads, where the
maximum deflection occurs in the rebound. However, negative phase of the blast
load has a negligible influence on the blast response of LG panels under higher blast
loads, as the LG panels would fail in the first peak of inward deflection, which could
usually occurs at the positive phase.
Wei et al. (2006) studied the blast response of LG panels of size 1.325 m × 1.325 m
using small deflection and large deflection plate theories. The results from theoretical
analyses were also compared with those from numerical analysis conducted using a
3D FE model developed with LS-DYNA FE code. Results from both theoretical and

Chapter 2: Literature Review 53
numerical models indicated that the negative phase of the blast load has a
considerable influence on the centre deflection and maximum tensile stresses of the
glass panes, where the corresponding values in the negative phase are about twice
compared to those in the positive phase. They pointed out that if the glazing does not
fail in the positive phase, it may do so in the negative phase. However, it could be
noted that Wei et al. (2006) studied the blast response of LG panels under smaller
blast loads assuming simply supported boundary conditions in both theoretical and
numerical models. It is evident from these studies that the negative phase of the blast
load could be important for the LG panels with rigid supports when they subjected to
smaller blast loads. However, LG panels are designed to fail under a credible blast
load, where the failure is usually occurred with the first peak of inward deflection
which is less influenced by the negative phase. From this aspect, it is acceptable to
design of LG panels with rigid supports by accounting for the positive phase only.
Research (Teich et al., 2011) has shown that the negative phase of the blast load has
a noticeable influence on the blast performance of flexible façade systems. Teich et
al. (2011) investigated the blast response of LG panels supported with Cable Net
Facades (CNFs) using the ANSYS FE code. They used a simplified FE model by
accounting for the glazing panel and steel cables. Glass was modelled as a linear
elastic material using shell elements without accounting for the interlayer and
structural sealant joints. Average thickness of the LG panel was taken as 20 mm,
while varying the overall facade height as 11, 22 and 33 m in the analysis. Results
from their study showed that the negative phase determines the absolute peak
deflection of the CNFs which is generally occurred during the rebound of the glazed
panel in the direction opposite to the overpressure loading. They pointed out that
maximum strains of the glass panes and the glass attachment occur contrary to the
main design load direction, and failure might occur towards the building’s exterior. It
is therefore important to account for the negative phase when investigating the blast
response of flexible facade systems.
2.11 FLEXIBLE FAÇADE SYSTEMS
Flexible facade systems such as Cable Net Facades (CNFs) are often used at the
podium or entry levels of buildings, as they are light weight and transparent. CNFs
consist of pre-stressed cables, spanning in both vertical and horizontal directions
(two-way spanning), while acting as a framework for the glass panels. The cable net

54 Chapter 2: Literature Review
can be used to support both clamped and point-fixed glazed systems. CNFs are
capable of spanning even more than 50 m (Patterson, 2008), making them more
popular among engineers and architects. A glazed façade supported by a cable net
was shown in Figure 2-6(f) of this chapter. Pre-stressed cables give flexibility to
CNFs, allowing them to undergo high deflections by absorbing the blast energy,
while minimising the damage to the glazed panels. The flexibility of CNFs allows
dissipating much of the blast energy because of the phenomena known as aero-elastic
damping. Aero-elastic damping occurs due to inertial, elastic and aerodynamic forces
acting on structures when moving in an air stream. Gartner (2011) pointed out that
CNFs allowing high deformations can withstand certain amounts of blast load
without any special features. The stresses in glass and the forces in cables can be
further reduced by introducing energy absorbing devices. Researchers have
developed and patented several energy absorbing connectors and some of these
connectors are shown in Figure 2-22 (Gartner, 2011).
(a) Fitting-cable-connector/ before and after
elastic-plastic deformation
(b) Cable-end-connector/before and after fuse
breakage
Figure 2-22: Patented cable connectors used for energy absorption (Gartner, 2011)
Amadio and Bedon (2012a) presented a detailed FE model, as well as a
geometrically simplified lumped-mass FE model using ABAQUS FE code to
investigate the behaviour of CNFs under blast loads. They showed that maximum
axial forces in pre-tensioned cables can be minimised by using an elastic-plastic
device at the top of the cables. In a later study (Amadio & Bedon, 2012b), they
showed that viscoelastic spider connectors could reduce the stresses in glass panes
and the axial force in cables, as compared to rigid spider connections. However, they
simplified the analysis by neglecting the lateral stiffness of the facade system by
assuming that the width of the facade is considerably larger than the height.
Additionally, all their studies were limited to facades with point supported spider

Chapter 2: Literature Review 55
connections, which have a poor blast performance compared to those fixed with
window frames along the edges. Overall, there is a limited research investigating the
behaviour of CNFs under blast loads, emphasising the need for extensive research in
this area.
2.12 CHAPTER SUMMARY
2.12.1 Literature Review Findings
The key findings of the literature review are illustrated below.
Most buildings use high glazed facades at their lower levels, without
proper framework. However they are more vulnerable to blast loads than
the upper floors of a building.
The post-crack load carrying capacity of LG should be accounted for in the
design, as it is considerably higher than that at the pre-crack phase.
Current design standards for blast resistant glazing are conservative and
are limited to the design of relatively smaller glazed panels. Standard test
methods are expensive, create environmental pollution and could only
classify hazard ratings of smaller glazed panels.
Materials show a strength enhancement under high strain rates occurring
under blast loads, and hence this should be accounted for when
investigating the behaviour of glazing systems under blast loads.
2.12.2 Knowledge Gaps
The knowledge gaps identified by the comprehensive literature review are given
below.
1. Research has been conducted using FE codes to study the blast performance of
LG. However, limited research could model the post-crack behaviour of LG by
accounting for the damaged strength of glass. Additionally, limited research
accounted for the structural sealant joints, as most used simplified support
conditions. A more comprehensive and rigorous analytical procedure is therefore
required, to address these issues.
2. There is a limited knowledge on the effects of geometric properties such as glass
pane thickness, interlayer thickness, bed width and thickness of structural sealant

56 Chapter 2: Literature Review
joints, and the support conditions for the blast performance of glazing systems. A
parametric study on geometric properties will therefore optimise the constituent
components in a façade system.
3. There is a limited knowledge on the effects of material properties of different
components such as glass, interlayer and structural sealant for the blast
performance of glazing systems. A parametric study on material properties is
required, for the improvement or manufacture of new materials providing
superior performance under blast loads.
4. Flexible facade systems, such as cable net facades, will maximise the energy
absorption, while minimising the damage to the glazing. However, there is a
limited understanding on the behaviour of such facade systems under blast loads.

Chapter 3: Methodology and Research Design 57
Chapter 3: Methodology and Research
Design
3.1 INTRODUCTION
This chapter presents the research methodology through a detailed description on the
FE based procedure used in the research. The chapter starts with a flowchart
indicating the overall research process. Then the procedure used in the research to
model LG using the LS-DYNA FE code (Hallquist, 2006) is explained. This is
followed by a theoretical background on the material models used for glass,
interlayer, structural sealant, aluminium and steel framing members. The failure
criteria adopted in this research to examine the failure of different components are
also discussed.
3.2 RESEARCH PROCESS
Figure 3-1 illustrates the overall research process using a flowchart. The research
area was identified and a comprehensive literature review was carried out. The
literature review provided the research findings and emphasised the knowledge gaps,
which were used to define the research problem. Then, the research methodology
was established to address the research problem by filling the knowledge gaps. The
research methodology allowed the achievement of four research objectives, as
mentioned in the flow chart. The first objective was to develop a rigorous analytical
procedure to investigate the behaviour of LG windows. The developed analytical
procedure using FE technique was validated with the past experiments and then it
was used to achieve the other three research objectives. Parametric studies were
carried out with the developed FE models to investigate the effects of geometric and
material properties of constituent components (glass, interlayer and structural sealant
joints) for the blast performance of LG panels, which were the second and third
objectives respectively. Finally, the blast response of cable net facades was studied,
which was the fourth objective. This research therefore provides a framework for the
design of blast resistant glazing with LG windows, which is its main aim.

58 Chapter 3: Methodology and Research Design
Aim Investigate the blast response of facades using LG windows, and study the
influence of controlling parameters such as material and geometric
properties, support conditions and energy absorption, to establish a
framework for their design for a credible blast event
Outcome
Design guidance for blast resistant glazing with LG windows
Research
Findings
Knowledge
Gaps
Literature
Review
Research Methodology
Objective 1
Develop a rigorous analytical procedure for reliable
design of building facade systems and their components
Research
Problem
Research Area
Objective 2
Parametric study on
geometric properties (glass
pane thickness, interlayer
thickness, and bed width and
thickness of structural
sealant joints)
Objective 3
Parametric study on material
properties of glass,
interlayer and structural
sealant materials
Objective 4
Investigate the blast
performance of flexible
facade systems
Figure 3-1: Research process

Chapter 3: Methodology and Research Design 59
3.3 FINITE ELEMENT MODELLING
LG panels are thin structures whose thickness is small, compared to their in-plane
dimensions. They can be modelled with two-dimensional (2D) shell elements or
three-dimensional (3D) solid elements. Nonlinear dynamic analyses have been
conducted using FE codes having explicit capabilities, such as LS-DYNA,
ABAQUS, ANSYS and EUROPLEXUX, to investigate their behaviour under blast
loads. However, most of the existing research has not captured the fracture strength
of glass and the effects of structural sealant joints in its analysis. On the other hand,
most research also does not present detailed information about FE modelling,
including material models, element formulations, material properties and the failure
criteria adopted for different materials. This thesis presents a rigorous and a reliable
analytical procedure, which was carried out with LS-DYNA FE code (Hallquist,
2006) to study the blast response of LG panels, addressing the above limitations. LG
panels were modelled with 3D constant stress solid elements and the material models
used for different materials are shown in Table 3-1.
Table 3-1: Material models for different components
Component Material LS DYNA material model
Glass panes Glass Material model 110
(MAT_HOLMQUIST_CERAMICS)
Interlayer PVB
Material model 24
(MAT_PIECEWISE_LINEAR_PLASTICITY)
Structural sealant Rubber, Silicone
Window frame Aluminium
Fasteners/ Supporting
structure Steel
Zhang et al. (2013; 2015) used the AUTOMATIC _ SURFACE _ TO _ SURFACE _
TIEBREAK model available in LS-DYNA to simulate adhesion contact between
glass ply and PVB interlayer. They used adhesive properties of 10 MPa for shear
strength and 5-10 MPa for tensile strength to define the bonding strength between
glass and PVB interlayer in their analysis. However, Zhang et al. (2013) mentioned
that these strength parameters were obtained based on experiments conducted under
quasi-static loading and hence there is a limited understanding on these strength
parameters under high strain rate dynamic loading. Therefore, in the present study,
the contact between the glass and PVB was treated as fully bonded, and hence there

60 Chapter 3: Methodology and Research Design
cannot be any delamination between glass panes and the PVB interlayer. Similarly,
contact between the glass and sealant joints was also treated as fully bonded in the
FE model. The background information of the material models, element formulations
and the failure criteria adopted for different materials, are explained below.
3.3.1 Material Model for Glass
The material model 110 (MAT_HOLMQUIST_CERAMICS) available in the LS-
DYNA FE code has been widely used to simulate ceramic composite armour
subjected to ballistic impacts (Krishnan et al., 2010; Tasdemirci & Hall, 2007). It has
been used to model glass for investigating the behaviour of LG panels under impact
loads (Wu et al., 2010) and blast loads (Hidallana-Gamage et al., 2013a, b, 2014a;
Lumantarna et al., 2007). The material model 110 was implemented based on the
Johnson-Holmquist (JH-2) material model, which has been widely used to model
brittle materials such as ceramic, glass, concrete and rock subjected to high
pressures, large strains and high strain rates.
The JH-2 material model was implemented using a set of mathematical equations
and is explained in detail in the literature (Holmquist et al., 1995; Johnson &
Holmquist, 1993). Holmquist et al. (1995) investigated the JH-2 material constants of
glass for high strain rates by conducting uniaxial compression tests, uniaxial tension
tests, flyer plate tests and ballistic tests. The mathematical equations involved with
the JH-2 material model are briefly explained and the material constants used in the
analysis are given in Table 3-2. The normalized equivalent stress (σ*) of the material
depends on the normalized intact equivalent stress (σ*i), normalized fracture stress
(σ*f) and material damage (D) as given by Eq. 3.1, where all the stresses are
normalized by dividing them by σHEL, which is the stress at Hugoniot Elastic Limit
(HEL).
The normalized intact strength and normalized fracture strength are determined by
Eq. 3.2 and Eq. 3.3 respectively, where A, B, C, M and N are the material constants.
The normalized pressure is P*=P/PHEL, where P is the actual pressure and PHEL is the
pressure at HEL. The normalized maximum tensile hydrostatic pressure is T* =
T/PHEL, where T is the maximum tensile hydrostatic pressure or the tensile strength
σ* = σ
*i - D (σ
*i - σ
*f) Eq. 3.1

Chapter 3: Methodology and Research Design 61
of the material. The normalized strain rate is έ* = έ/έ 0, where έ is the actual strain
rate and έ0 is the reference strain rate (έ0 = 1.0 /s).
The damage level (D) depends on the plastic strain during the cycle of integration
(Δε p) and the plastic strain to fracture (ε pf) under a constant pressure P, and is given
by Eq. 3.4. The ε pf is accumulated using Eq. 3.5, where D1 and D2 are material
constants.
Eq. 3.6 gives the hydrostatic compression pressure variation of the material while Eq.
3.7 gives the variation of tensile pressure, where K1, K2 and K3 are material constants
(K1 is the bulk modulus). Both are functions of µ, which varies depending on
material deformation as given by Eq. 3.8, where ρ is the current density and ρ0 is the
initial density of the material. The ΔP is the bulking pressure, which appears only if
the material damage (0 < D ≤ 1), while it is zero for undamaged materials (D = 0).
When the deviator stress exceeds a critical value under compressive loading, damage
begins to accumulate within the material by adding the bulking pressure, ΔP, which
is calculated using Eq. 3.9. An increment in material damage causes decrease in the
incremental internal elastic energy, which is converted into potential internal energy.
The amount of internal elastic energy converted into internal potential energy
depends on the parameter β, and is usually set to 1. The internal elastic energy loss
(ΔU) is calculated using Eq. 3.10, where σ is the effective stress and G is the shear
modulus of the material.
σ*i = A(P
* + T
*)
N (1 + C ln έ
*) Eq. 3.2
σ*f = B(P
*)
M (1 + C ln έ
*) Eq. 3.3
D = ΣΔ ε p / ε pf Eq. 3.4
ε pf = D1 (P
* + T
*)
D2 Eq. 3.5
P = K1µ + K2µ2 + K3µ
3 + ΔP Eq. 3.6
P = K1µ Eq. 3.7
µ = ρ/ ρ0 – 1 Eq. 3.8
ΔPn+1 = -K1µ + ((K1µ + ΔP) 2 + 2βK1ΔU)
0.5 Eq. 3.9

62 Chapter 3: Methodology and Research Design
ΔU = U(D) – U(Dn+1), U(D) = σ/6G Eq. 3.10
Table 3-2: JH-2 material constants used in the analysis (Holmquist et al., 1995)
JH-2 constant Value
Strength constants
A 0.93
B 0.2
C 0.003
M 1.0
N 0.77
Ref strain rate (EPSI) 1.0
Maximum tensile hydrostatic
pressure or tensile strength (T)
60-65 MPa for annealed glass
Failure strain 0.0024
Normalized fractured strength 0.5
HEL 5.95 GPa
HEL pressure 2.92 GPa
HEL strength 4.5 GPa
Damage constants D1 0.043
D2 0.85
Equation of state
K1 (bulk modulus) 45.4 GPa
K2 -138 GPa
K3 290 GPa
β 1.0
3.3.2 Material Model for Interlayer, Sealant and Framing Materials
The material model 24 (MAT_PIECEWISE_LINEAR_PLASTICITY) available in
the LS-DYNA FE code was used to model the PVB interlayer, silicone (or rubber)
sealants, aluminium frame and steel supports in the FE models. The behaviour of all
these materials can be assumed as elastic-plastic under high strain rates that occur
under blast loads, as was explained in Section 2.5. Materials with elastic-plastic
properties can be modelled with material model 24 and it has already been used to
model interlayer and sealant materials for analysing the behaviour of LG under blast
loads (Hidallana-Gamage et al., 2013a, b, 2014a).
Density, Poisson’s ratio and the Young’s modulus of the materials should be defined
in the material model. The material model 24 accounts for similar stress-strain
behaviour, both in tension and compression. The stress vs. strain curve of the
material can be given by defining the important points in the curve such as yield
stress, failure stress and the failure strain as shown in Figure 3-2. Material model 24
allows taking the effect of strain rate by using the Cowper and Symonds model

Chapter 3: Methodology and Research Design 63
which scales the yield stress with a factor affected by the strain rate. Additionally,
stress vs. strain curves could be defined for different strain rates if the required data
can be obtained from experiments. However, due to lack of the experimental results
on the material behaviour under different strain rates, and also to simply the FE
model, none of the above options were used in this study to account for the strain rate
effect. The strength enhancement in the materials under higher strain rates were
therefore accounted for in the FE models by increasing their Young’s modulus, yield
stress and failure stress by considering the information available in the literature.
Figure 3-2: Defining the stress-strain curve in material model 24
3.3.3 Element Formulations
The LS-DYNA FE code has several inbuilt Element Formulations (ELFORMs)
which can be used under different circumstances. The ELFORM 1 has only one
integration point, and is the default element type defined for solid elements. The
ELFORM 1 is recommended for efficient and accurate simulation that works well
even for severe deformations with hourglass stabilization. The ELFORM 2 is a fully
integrated, solid element (having eight integration points per element) that works
well even without hourglass stabilization. However, the ELFORM 2 causes shear
locking for solid elements with poor aspect ratios, and is also unstable when
subjected to large deformations. It consumes more computational cost and time than
the ELFORM 1.
The LS-DYNA FE code has two element formulations, namely the ELFORM -1 and
the ELFORM -2, which are specially implemented for solid elements having poor
aspect ratios. Both were developed based on the ELFORM 2, by modifying its
Jacobian matrix without affecting true physical behaviour of the element. The
ELFORM -1 is recommended for efficient simulation while the ELFORM -2
Str
ess
(M
Pa)
Strain
yield stress
failure stress
failure strain

64 Chapter 3: Methodology and Research Design
provides more accurate results. Both consume more computation cost compared to
the ELFORM 2, whereas it can be about 1.2 times for the ELFORM -1 and 4 times
for the ELFORM -2. However, these two element formulations are unstable under
large deformations similar to ELFORM 2 and hence they were not used in the
present study. This research therefore used the ELFORM 1 with hourglass
stabilisation in the entire FE model. A fine mesh was used to obtain accurate results.
The ELFORM 1 used in the analysis is shown in Figure 3-3.
3.4 FAILURE ANALYSIS OF DIFFERENT MATERIALS
Engineering materials can be divided into two types as brittle and ductile, depending
on their failure modes. Brittle materials show little or no plastic deformation before
failure while ductile materials show large amount of plastic deformation. The failure
theories adopted in practice depend on the ductility of the material. Those used to
analyse the failure of different materials such as glass, interlayer materials, structural
sealant materials, aluminium and steel, are explained below.
3.4.1 Failure of Glass
For brittle materials such as glass, the principal stresses are usually used as the
failure criteria. There are three principal stress components in orthogonal directions:
1st principal stress (σ11), 2
nd principal stress (σ22) and the 3
rd principal stress (σ33). The
σ11 is the largest stress component and is usually the tensile stress while the σ33 is the
smallest stress component where σ11 > σ22 > σ33. The principal stress in a particular
direction is the summation of the hydrostatic stress (σHyd) and the deviatoric stress
(σ') component in the same direction. The σHyd accounts for the volumetric strain and
is simply the average of three principal stress components, as given by Eq. 3.11. The
σ' accounts for the shape change and is obtained by subtracting the hydrostatic stress
from the principal stress as given by Eq. 3.12 where i = 1, 2 or 3.
Figure 3-3: View of the ELFORM 1

Chapter 3: Methodology and Research Design 65
The JH-2 material model used for glass requires the tensile strength or the maximum
hydrostatic tensile pressure of glass (T) to be defined. However, it could be noted
that the principal stresses of a glass element can go beyond T, which is the
hydrostatic stress component. Holmquist et al. (1995) mentioned that the T of glass
for the JH-2 model should be determined using quasi-static tension tests applying
radial loading, similar to the test used to determine the tensile strength of concrete.
According to their test results, the average tensile strength of glass (T) was found to
be about 150 MPa. They recommended this value to be used as the T of annealed
glass in the JH-2 model. However, this value seems to be unrealistic as it is
considerably higher than 80 MPa, which is the predicted dynamic breaking strength
of annealed glass in the literature (Cormie et al. 2009). In a later study, Zhang et al.
(2015) pointed out that modern glass used for architectural purposes has low tensile
and compressive strengths than those used in past. This is attributed with the use of
less SiO2 content in modern glass compared to older ones. Zhang et al. (2015) used a
T value of about 27 MPa in his analysis, which is considerably lower than that used
by Holmquist et al. (1995).
In previous studies, it was identified that blast response of LG panels highly depends
on the T of glass. A good agreement with the experimental results was obtained
when T = 60-65 Mpa for annealed glass (Hidallana-Gamage et al., 2013a). However,
T of glass was varied during the analysis to calibrate the FE model. Cormie et al.
(2009) mentioned that the dynamic breaking strength of annealed glass (Tb) can be in
the region of 80 MPa by extrapolating their ring-on-ring test data for higher strain
rates. However, glass is not a perfectly smooth, homogeneous material (Netherton et
al., 2009), so its Tb can vary considerably from one point to the other. The presence
of surface flaws and micro cracks (Netherton et al., 2009) leads to further reduction
of the Tb which also reduces when the glass becomes older. Glass was considered to
have failed in the present study if σ11 > Tb where the Tb could be in the range of 60-
80 MPa for annealed glass (Hidallana-Gamage et al., 2013b).
The material model used for glass account for the damage strength of glass where the
damaged glass elements have a less strength than the undamaged elements. The
σHyd = (σ11 + σ22 + σ33)/3 Eq. 3.11
σii' = σii - σHyd Eq. 3.12

66 Chapter 3: Methodology and Research Design
damage level of an element (D) depends on the plastic strain during the cycle of
integration (Δε p) and the plastic strain to fracture (ε pf) under a constant pressure, P
and was given by Eq. 3.4. The ε pf depends on P as given by Eq. 3.5, where P
depends on the material deformation as shown in Eq. 3.6. The failure strain of glass
under blast loads is given as 0.0012 in the literature (Larcher et al., 2012). However,
severely damaged glass elements were allowed to delete from the FE model, by
selecting the failure strain to be 0.0024 in the analysis. The failure strain was
artificially increased as mass of the deleted elements are not accounted for in the FE
model. In this study, about 3-4 glass elements were used along the thickness of each
glass layer. Glass elements in the outer surface of the tension side attract higher
tensile strains and reach the failure strain prior to the internal glass elements.
3.4.2 Failure of Ductile Materials
The interlayer materials such as PVB, materials used for structural sealants such as
rubber and silicone, and the framing materials such as aluminium and steel are
ductile in nature and show elastic-plastic behaviour under blast loads. The distortion
energy theory which is based on the von Mises stress (σv) is usually used to examine
the failure of ductile materials. This theory proposes that the total energy in a system
is the summation of the volumetric (hydrostatic) strain energy and the shape
(distortion) strain energy, where the failure occurs when the distortion energy
component exceeds that at the yield point for a simple tensile test. This introduces
the von Mises stress (σv), which is expressed in terms of principal stresses as given
by Eq. 3.13. This research investigated the failure of different structural components,
where σv > failure stress was taken as the failure criterion for the interlayer, structural
sealants, aluminium and steel framing members.
3.5 CHAPTER SUMMARY
This chapter presented the methodology used in this research and detailed
information about the FE modelling. LG panels were modelled with 3D constant
stress solid elements using LS-DYNA FE code incorporating material model 110
(MAT_HOLMQUIST_CERAMICS) for glass and, material model 24
(MAT_PIECEWISE_LINEAR_PLASTICITY) for the PVB interlayer, structural
sealant joints, aluminium frame and steel supports. The modelling techniques used in
σv = {[(σ11 – σ22)2 + (σ22 – σ33)
2 + (σ33 – σ11)
2]/2}
1/2 Eq. 3.13

Chapter 3: Methodology and Research Design 67
this research account for the post-cracking behaviour of LG and also treat realistic
support conditions with the effects of structural sealant joints, and hence overcome
the limitations in previous research.
The failure criteria adopted in this research to examine the failure of different
components were also explained. Glass was considered to have failed if σ11 exceeded
the dynamic breaking strength of glass (Tb). The ductile materials such as PVB,
sealant materials, aluminium and steel were considered to have failed if σv exceeded
the failure stress of the material. The modelling techniques presented in this research
were validated with the results from past experiments conducted on LG panels under
blast loads, and this is presented in Chapter 4.


Chapter 4: Validation of Modelling Techniques 69
Chapter 4: Validation of Modelling
Techniques
4.1 INTRODUCTION
Kranzer et al. (2005) conducted experiments on LG panels under blast loads and
their results were used to validate the FE models and study the post-crack behaviour
of LG panels. Firstly, the results from a free vibration test (Kranzer et al., 2005) were
used to validate the FE model. Then, the results from two shock tube tests: G688
(Kranzer et al., 2005) and G684 (Fischer & Haring, 2009), were used for further
validation and to study the blast response. These shock tube tests were purposefully
selected, as the former caused less damage to the LG panel, while the later caused
significant damage reflecting the post-crack behaviour of LG. The experiments were
conducted according to BS EN 13541 (2001) on LG panels with 1.1 m width, 0.9 m
height and 7.5 mm thickness (3 mm annealed glass + 1.52 mm PVB + 3 mm
annealed glass). The LG panels were clamped to a rigid frame along the edges using
rubber sealant joints with 50 mm width and 4 mm thickness.
4.2 MATERIAL PROPERTIES
Material properties used in the analysis were explained in Section 2.5. Material
properties of glass were given in Table 2-3 and the JH-2 material constants required
for the material model 110 were given in Table 3-2. The tensile strength (T) of
annealed glass for use in the material model was determined from previous studies to
vary between 60-65 MPa (Hidallana-Gamage et al., 2013b). The two values of 60
and 65 MPa are hence used in the FE analysis, as glass is normally not homogeneous
and its properties can vary from specimen to specimen.
Material properties of PVB used in the experiment are not known; those used in the
analysis were given in Table 2-5 and the corresponding stress-strain behaviour was
illustrated in Figure 2-14. Testing was conducted according to BS EN 13541 (2001),
which states that the test piece should be clamped using rubber strips having about
50 mm width and 4 mm thickness. Hardness of the rubber strips should be about 50
IRHD, in accordance with ISO 48 (1994), and the corresponding Young’s modulus
should be about 2.3 MPa. The behaviour of rubber was treated as elastic-plastic

70 Chapter 4: Validation of Modelling Techniques
under blast loads and its stress-strain behaviour was treated as identical to that of
silicone given in Figure 2-16. Material properties of rubber sealant used in the
analysis were therefore identical to those given in Table 2-6.
4.3 FE MODELLING
FE modelling was carried out using the LS-DYNA FE code (Hallquist, 2006),
incorporating 3D constant stress solid elements as in the procedure outlined in
Chapter 3. One-quarter of the panel was analysed using symmetry, assuming that the
blast load was uniformly distributed over the entire front glass pane. Material
properties, as described in section 4.2, were used in the FE model. Details of the
supporting steel frame, including dimensions and material parameters, were not
mentioned in the experimental studies. Hence it was not possible to account for the
supporting frame and its flexibility in the FE model. Instead, the sealant supports
were fixed to a rigid frame for simplicity, which neglects the deformations in the
frame.
A convergence study was conducted to identify a suitable mesh for the FE analysis in
order to obtain accurate results. Four different FE models with 110 × 90 × 7, 110 ×
90 × 10, 220 × 180 × 7 and 220 × 180 × 10 elements (along length × width ×
thickness) were used in the analysis to identify the effect of a number of elements
through the thickness and in the plane of the panel. The PVB interlayer was modelled
with one element and each glass layer was modelled with three elements when seven
elements were used through the thickness. When ten elements were used through the
thickness, PVB was modelled with two elements and each glass layer was modelled
with four elements.
Figure 4-1 compares the deflection-time history curves obtained from the four FE
models for the shock tube test G688. The curves corresponding to FE models with
220 × 180 × 7 and 220 × 180 × 10 elements, display the closest agreement with the
experimental curve, with reasonably matching peak values of the deflection and
rebound stages. The FE models with 110 × 90 × 7 and 110 × 90 × 10 elements
become stiff during the rebound and this is more significant in the FE model with
110 × 90 × 10 elements. This might be due to the shear locking that can occur in thin
elements with poor aspect ratios as seen in those FE models. It is evident that the
increase in the number of elements in the plane of the panel, improves the results

Chapter 4: Validation of Modelling Techniques 71
from FE analysis, compared to the increase in the number of elements through the
thickness. The FE model with 220 × 180 × 10 elements, is therefore used to study the
blast response of the LG panel hereafter. The 3D view and a sectional view of the FE
model with rubber sealant joints are shown in Figure 4-2(a) and 4-2(b) respectively.
Figure 4-1: Variation of the deflection at the centre with time for different FE meshes with glass,
T=60 MPa/ PVB, E=530 MPa and sealant, E=2.3 MPa
Figure 4-2: FE model of the test panel
4.4 COMPARISON OF RESULTS
Displacement transducers were used in the experiment to monitor the displacement at
the centre of the panel. Deflection at the centre obtained from the free vibration
analysis was compared with that from the FE analysis. Then the results from the FE
analyses for centre deflection and the failure of different components were compared
with those from the two shock tube tests. Energy absorption of glass, interlayer and
sealant joints were compared under the blast loads and the results are presented and
discussed below.
0
2
4
6
8
10
12
14
16
0 2 4 6 8 10 12 14 16
Defl
ecti
on
(m
m)
Time (ms)
Experiment (G688)
LS-DYNA (110x90x7 elements)
LS-DYNA (110x90x10 elements)
LS-DYNA (220x180x7 elements)
LS-DYNA (220x180x10 elements)
Glass (3 mm)
Glass (3 mm)
Sealant (4 mm)
Sealant (4 mm)
PVB (1.52 mm)
(a) 3D view (b) Sectional view at the support

72 Chapter 4: Validation of Modelling Techniques
4.4.1 Free Vibration Analysis
Kranzer et al. (2005) conducted a free vibration analysis to determine the natural
period of vibration of the test panel used for their experiments. Small elastic
amplitude of about 0.1 mm was given to the centre of the test panel and it was
allowed to vibrate freely without any external force. The deflection-time history
curve obtained from the experiment is shown in Figure 4-3, according to which the
natural period of vibration of the test panel was found to be about 15.6 ms. The test
panel shows a reduction in the peak deflection with the time, probably due to the
effects of damping.
Similarly, a free vibration analysis was conducted with the FE model, using the
material properties and mesh mentioned in section 4.2 and 4.3 respectively, by giving
0.1 mm initial amplitude to its centre. The deflection-time history curve obtained
from the FE model compared well with that from the experiment, as seen in Figure
4-3. The average natural period of vibration of the FE model is about 14.9 ms, which
is only about 4.5% smaller than that in the experiment. It is evident that the FE
model is slightly stiffer than the test panel. This might be due to the flexibility at the
supporting frame of the test panel, whereas a rigid frame was assumed in the FE
model. Damping has little impact on the blast response of structures as the first or the
second peaks of deflections are the most important.
The T of glass used in the material model was varied during the free vibration
analysis. It was identified that T of glass did not have any influence on the free
vibration analysis of the FE model, which occurred in the elastic range. The
behaviour of the FE model during free vibration analysis is therefore mainly
governed by the E of each material and the support conditions used in the analysis.
The E of glass is well presented in the literature, and is less influenced by the strain
rate or the load duration. As the results from free vibration analysis agreed
reasonably well with that from experiment, it gave confidence of the values of the
material properties used for the interlayer and sealant joints, as well as the support
conditions used in the FE model. This model is further validated using the results
from experiments conducted under two blast loads as discussed below.

Chapter 4: Validation of Modelling Techniques 73
-0.12
-0.1
-0.08
-0.06
-0.04
-0.02
0
0.02
0.04
0.06
0.08
0.1
0.12
0 5 10 15 20 25 30
Defl
ecti
on
(m
m)
Time (ms)
Experiment
LS-DYNA
Figure 4-3: Variation of the deflection at the centre with time for free vibration analysis
4.4.2 Shock Tube Test (G688)
The measured pressure-time history curve of the shock tube test (G688) is shown in
Figure 4-4, where the blast overpressure is about 25 kPa, while positive load duration
is about 16 ms (Kranzer et al., 2005). The blast load has a positive impulse of about
200 kPa-ms. Results from FE analysis for centre deflection, fracture of glass panes,
stresses and energy absorption of different components, were compared with those
available from the experiment, as presented below.
Figure 4-4: Blast overpressure variation with time for the shock tube test G688 (Kranzer et al., 2005)
Centre deflection
Figure 4-5 compares the deflection-time histories at the centre of the panel.
Maximum deflection obtained from the experiment is about 14 mm at 5.7 ms. The
deflection-time history curve obtained from the FE model is very close to the
experimental curve when T of glass is taken as 65 MPa, giving a maximum
deflection of about 14.45 mm with a 3.2% difference. A maximum deflection of
about 15.1 mm with a 7.9% difference is obtained when the T of glass is taken as 60
MPa. The numerical model rebounds after mounting the first peak of deflection, but
0
5
10
15
20
25
0 5 10 15 20
Bla
st p
ress
ure(k
Pa)
Time(ms)

74 Chapter 4: Validation of Modelling Techniques
quickly rebounds again slightly, making the second peak. The occurrence of second
peak could be due to the failure or damage to the glass elements caused during the
first peak of deflection.
Overall, results from the FE analysis agree reasonably well with that from the
experiment, though the FE results are a little out of phase with the experimental
result. This could be due to the fact that the window frame was modelled as a rigid
base in the FE model, in contrast to the flexible window frames and supports used in
the experiments. In the FE models total energy produced by the blast load is
suddenly absorbed by the LG panel, which causes an increase in the deflection
initially. On the other hand, in the test panel, part of the blast energy is absorbed by
the window frame and the supporting structure, soon after applying the load, and this
might reduce the deflection initially. Also, during the rebound, FE models return to
zero deflection prior to the test panel, again due to the stiff rigid frame used in the FE
models, as opposed to the flexibility of the supports in the test panel.
Figure 4-5: Variation of the deflection at the centre with time for different tensile strengths (T) of
glass (test G688)
Both sets of results from the FE analysis with T= 60 MPa and T = 65 MPa agree
reasonably well with the experimental results. Since the FE model with T = 65 MPa
shows results that are closer to the experimental result, it is used in further studies to
analyse the stresses and energy absorption of the different components in the LG
panel under this blast load, as described below.
Fracture and stress analysis of glass panes
A fractured test specimen from the shock tube test G688 is shown in Figure 4-6(a)
(Kranzer et al., 2005). The cracks could be seen along the edges of the test panel, but
hardly any cracks were observed in the middle. However, as was evidenced from
0
2
4
6
8
10
12
14
16
0 2 4 6 8 10 12 14
Defl
ecti
on
(m
m)
Time (ms)
Experiment (G688)
LS-DYNA (glass, T=65 MPa)
LS-DYNA (glass, T=60 MPa)

Chapter 4: Validation of Modelling Techniques 75
Figure 4-6(a), no major damage had occurred to the glass panes. Kranzer et al.
(2005) mentioned that there was no damage to the interlayer or to the structural
sealant joints after the experiment. Figures 4-6(b) and 4-6(c) show the view of the
front and back glass panes of the FE model at about 15 ms. When the LG panel
bends inwards, the front glass pane attracts tension along the edges and hence
fracture lines could be seen along the perimeter of the front glass pane close to inner
edge of the sealant joints, as seen in Figures 4-6(b). However, no fracture or element
deletion has occurred to the back glass pane in the FE model as seen in Figure 4-6(c),
agreeing with that from the experiment.
(a) Tested LG panel (b) Front glass pane of the FE
model at 15 ms (c) Back glass pane of the FE
model at 15 ms
Figure 4-6: Comparison of the fracture of glass panes for test G688
The failure of glass panes was further studied by analysing their stresses. Figures 4-
7(a) and 4-7(b) illustrate the variation of 1st principal stress (σ11) on the front glass
pane at 4.5 and 5.5 ms respectively. It is evident that σ11 exceeds 90 MPa along both
long and short edges of the front glass pane, indicating the failure of glass at those
locations as observed in the test panel. Figures 4-7(c) and 4-7(d) illustrate the
variation of σ11 on the back glass pane at 3.5 and 5.5 ms respectively. Initially, σ11
exceeds 80 MPa at the middle of the back glass pane as seen in Figure 4-7(c). Then,
the region with high stress extends towards the supports, but has a stress below 80
MPa at most locations. The results from the FE analysis indicate that there cannot be
a major failure in the back glass pane and similarly no major cracks were seen at the
middle of the back glass pane in the test panel.

76 Chapter 4: Validation of Modelling Techniques
(a) Front glass pane at 4.5 ms (b) Front glass pane at 5.5 ms
(c) Back glass pane at 3.5 ms (d) Back glass pane at 5.5 ms
Figure 4-7: 1st principal stress (σ11) variation on the glass panes for test G688
Stress analysis of interlayer
Figure 4-8 illustrates the von Mises stress (σv) variation on the back surface of the
interlayer at different times. Initially, there is an increase in σv at the middle of the
interlayer, as seen in Figure 4-8(a). When the LG panel deflects, the region with high
stress extends towards the supports, as seen in Figure 4-8(b). However, the interlayer
has less stress, and σv does not exceed the yield stress which is about 11 MPa at most
locations in the interlayer. The results from the FE analysis indicate that there cannot
be any failure in the interlayer, as was also seen in the test panel.
(a) At 3.5 ms (b) At 5.5 ms
Figure 4-8: Von Mises stress (σv) variation on the back surface of the interlayer
Stress analysis of sealant joints
Sealant joints at the middle of the long edge of a LG panel have high stresses
compared to the other parts under blast loads (Hidallana-Gamage et al., 2013b).

Chapter 4: Validation of Modelling Techniques 77
0
2
4
6
8
10
12
14
16
0
0.1
0.2
0.3
0.4
0.5
0.6
0.7
0.8
0 2 4 6 8 10 12 14D
efl
ecti
on
(m
m)
Vo
n M
ises
stress
(M
Pa)
Time (ms)
Von Mises Stress - Element 1
Von Mises Stress - Element 2
Centre Deflection
Figure 4-9 shows a section at the middle of the long edge of the FE model, indicating
the two critical sealant elements used for the detailed analysis. Figure 4-10 illustrates
the variation of σv at those elements for 15 ms. Both elements show their peak
stresses when the LG panel is subjected to maximum deflection and these stresses are
about 0.74 and 0.69 MPa in elements 1 and 2 respectively. These stresses are well
below the yield stress of the sealant material, which is about 2.3 MPa. None of the
sealant elements in the FE model has a stress greater than the yield stress and hence
no failure is expected in the sealant joints, as also observed in the test panel.
Figure 4-9: Section at the middle of the long edge of the FE model showing critical sealant elements
Figure 4-10: Von Mises stress (σv) variation of critical sealant elements
Component energy absorption
Figure 4-11 compares the energy absorption of different components in the FE model
(which is quarter of the LG panel), such as glass, interlayer and sealant joints for 20
ms. The energy absorptions were calculated by accounting for the internal and
kinetic energies of a component. Each component absorbs its maximum energy
during the first peak of deflection and then remains constant after about 12 ms. Glass
panes absorb a considerable amount of energy compared to other parts under the
blast load. They absorb a maximum energy of about 16.8 J and then remain around 4
J after about 12 ms. The maximum energy absorbed by PVB and sealant joints is
Sealant element 1
Sealant element 2

78 Chapter 4: Validation of Modelling Techniques
about 3.4 and 3.2 J, and later the energy absorption of both components remains
round 1.8 and 0.4 J respectively. The blast load causes little damage to the glass
panes and hence transfers a small amount of stress to the interlayer, which has a
small contribution towards the energy absorption.
Figure 4-11: Energy absorption of different components in the FE model
4.4.3 Shock Tube Test (G684)
Figure 4-12 shows the measured pressure-time history curve of the shock tube test
(G684), where the blast overpressure is about 90 kPa, while positive load duration is
about 24 ms (Fischer et al., 2009). The blast load has a positive impulse of about 500
kPa-ms, which is about 2.5 times higher than that in the previous experiment. Results
from FE analysis for centre deflection, fracture of glass panes, stresses and energy
absorption of different components, were compared with those available from the
experiment, as presented below.
Figure 4-12: Blast overpressure variation with time for the shock tube test G684
Centre deflection
Figure 4-13 compares the deflection-time histories at the centre of the panel.
Maximum deflection observed in the experiment is about 113.4 mm at 15 ms. The
-20
-10
0
10
20
30
40
0
2
4
6
8
10
12
14
16
18
0 2 4 6 8 10 12 14 16 18 20
Defl
ecti
on
(m
m)
En
erg
y a
bso
rp
tio
n (
J)
Time (ms)
Glass
PVB
Sealant
Centre deflection
-20
0
20
40
60
80
100
0 5 10 15 20 25 30 35 40
Bla
st p
ress
ure(k
Pa)
Time(ms)

Chapter 4: Validation of Modelling Techniques 79
two FE models are stiffer than the test panel, showing their maximum deflections at
about 12-14ms. The maximum deflection obtained from the FE model closely agreed
with that of the experiment when the T of glass is taken as 60 MPa. This gives a
maximum deflection of about 112.2 mm at 12.75 ms, with a 1.1% variation from the
experiment. The FE model gives a maximum deflection of about 104.7 mm (with a
7.7% variation), when the T of glass is increased to 65 in the analysis. It is evident
that the peak deflections obtained from the FE models compare well with that from
the experiment. The FE models initially have higher deflections, compared to the test
panel. This is probably because some of the blast energy is absorbed by the
supporting structure in the experiment and this reduces the initial deflection of the
test panel. The FE models on the other hand were mounted to a rigid base, which
cannot absorb energy. This forces the LG panel to absorb the total blast energy,
increasing its deflection initially. The FE models reach their maximum deflections
prior to the test panel, indicating that they are stiffer than the test panel. The test
panel rebounds after reaching the maximum deflection, but this is not clearly seen
with the FE models, indicating that the glass panes in the FE models have been
slightly damaged (compared to that in the test panel).
Figure 4-13: Variation of the deflection at the centre with time for different tensile strengths (T) of
glass when PVB, E=530 MPa and sealant, E=2.3 MPa (test G684)
The FE model whose results are closer to experimental results, with a T of 60 MPa is
therefore used in further studies to analyse the stresses and energy absorption of
different components in the LG panel under this blast load, as described below.
Fracture and stress analysis of glass panes
The fractured test specimen of the shock tube test G684 is shown in Figure 4-14(a)
(Fischer et al., 2009). Fischer et al. (2009) mentioned that both glass panes were
0
20
40
60
80
100
120
0 5 10 15 20 25
Defl
ecti
on
(m
m)
Time (ms)
Experiment (G684)
LS-DYNA (glass, T=65 MPa)
LS-DYNA (glass, T=60 MPa)

80 Chapter 4: Validation of Modelling Techniques
completely damaged after the experiment, as seen in this Figure. Vertical, horizontal
and diagonal fracture lines could be seen in the back side of the test panel and a
similar failure pattern could be expected on the front glass pane. However, according
to Figure 4-14(a), no major failure had occurred in either interlayer or sealant joints.
Figures 4-14(b) and 4-14(c) show the fracture of the front and back glass panes
respectively, as seen from the FE model. Both glass panes have vertical, horizontal
and diagonal fracture lines similar to those seen in the test panel. The back glass pane
has more and wider fracture lines along the diagonal and at the middle of the panel
than the front glass pane, but the front glass pane has some additional cracks along
the edges. Failure of glass panes was further studied by analysing their stresses as
discussed below.
(a) Tested LG panel (b) Front glass pane of the FE
model at 20 ms
(c) Back glass pane of the FE
model at 20 ms
Figure 4-14: Comparison of the fracture of glass panes for test G684
Figures 4-15(a) and 4-15(b) illustrate the variation of 1st principal stress (σ11) on the
front glass pane at different times. Initially, there is an increase in σ11 along the edges
of the front glass pane as seen in Figure 4-15(a). Later, σ11 increases throughout the
front glass pane and its variation at 12.5 ms is shown in Figure 4-15(b). Figures 4-
15(c) and 4-15(d) illustrate the variation of σ11 on the back glass pane at different
times. Figure 4-15(c) shows the variation of σ11 at 2.25 ms, while Figure 4-15(d)
shows it at 12.5 ms. Initially, there is an increase in σ11 at the middle of the back
glass pane and later it increases throughout the back glass pane as seen in Figure 4-
15(d). In most areas of the front and back glass panes σ11 exceeds 80 MPa, indicating
their failure as also observed in the experiment.

Chapter 4: Validation of Modelling Techniques 81
(a) Front glass pane at 2 ms (b) Front glass pane at 12.5 ms
(c) Back glass pane at 2.25 ms (d) Back glass pane at 12.5 ms
Figure 4-15: 1st principal stress (σ11) variation on the glass panes for test G684
Stress analysis of interlayer
Figure 4-16 illustrates the von Mises stress (σv) variation on the back surface of the
interlayer at different times. Initially, there is an increase in σv at the middle of the
interlayer as seen in Figure 4-16(a). When the LG panel deflects, the interlayer
stretches further, increasing its stresses as shown in Figure 4-16(b). It could be
noticed that, in most areas, σv exceeds 11 MPa, which is the yield stress of the
interlayer material. Vertical, horizontal and diagonal failure line patterns could be
seen in the FE model supporting the failure pattern observed in the experiment. Glass
elements had failed and deleted along the fracture lines and the PVB elements in
those regions exceeded their failure stress of about 28 MPa. However, the FE model
does not indicate a complete failure or a collapse, as was also evident from the
experiment.
(a) At 2.5 ms (b) At 12.5 ms
Figure 4-16: Von Mises stress (σv) variation on the back surface of the interlayer for test G684
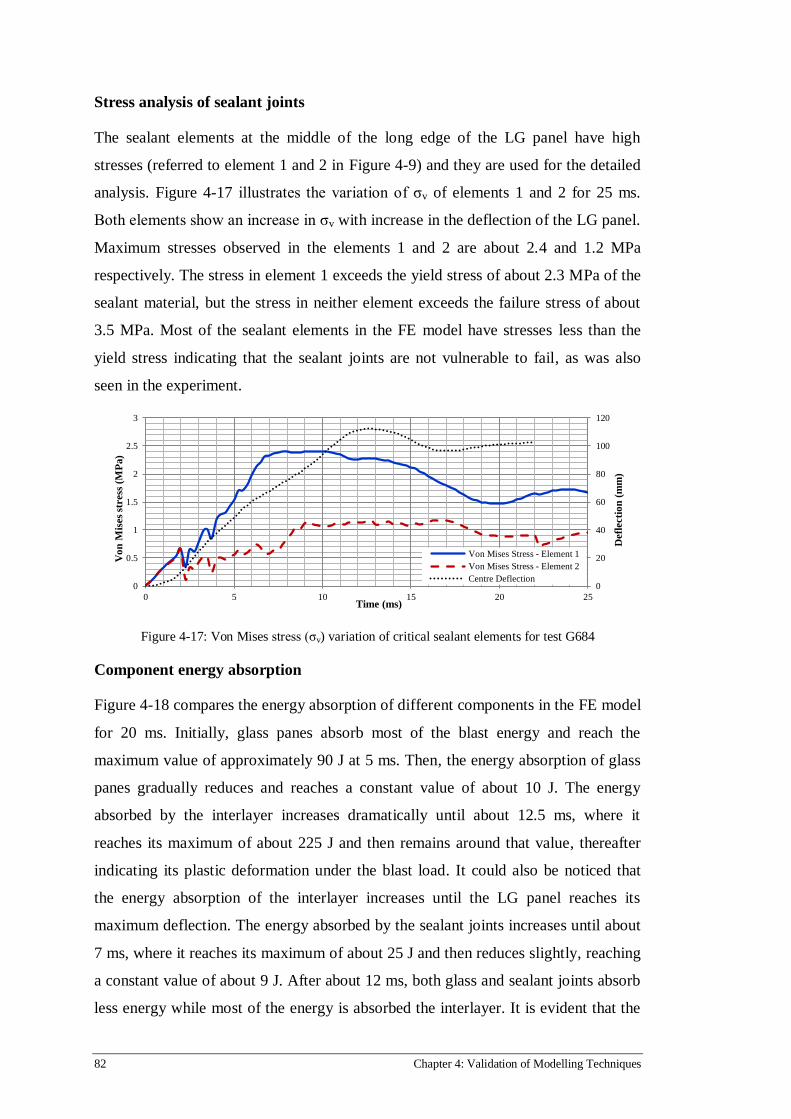
82 Chapter 4: Validation of Modelling Techniques
Stress analysis of sealant joints
The sealant elements at the middle of the long edge of the LG panel have high
stresses (referred to element 1 and 2 in Figure 4-9) and they are used for the detailed
analysis. Figure 4-17 illustrates the variation of σv of elements 1 and 2 for 25 ms.
Both elements show an increase in σv with increase in the deflection of the LG panel.
Maximum stresses observed in the elements 1 and 2 are about 2.4 and 1.2 MPa
respectively. The stress in element 1 exceeds the yield stress of about 2.3 MPa of the
sealant material, but the stress in neither element exceeds the failure stress of about
3.5 MPa. Most of the sealant elements in the FE model have stresses less than the
yield stress indicating that the sealant joints are not vulnerable to fail, as was also
seen in the experiment.
Figure 4-17: Von Mises stress (σv) variation of critical sealant elements for test G684
Component energy absorption
Figure 4-18 compares the energy absorption of different components in the FE model
for 20 ms. Initially, glass panes absorb most of the blast energy and reach the
maximum value of approximately 90 J at 5 ms. Then, the energy absorption of glass
panes gradually reduces and reaches a constant value of about 10 J. The energy
absorbed by the interlayer increases dramatically until about 12.5 ms, where it
reaches its maximum of about 225 J and then remains around that value, thereafter
indicating its plastic deformation under the blast load. It could also be noticed that
the energy absorption of the interlayer increases until the LG panel reaches its
maximum deflection. The energy absorbed by the sealant joints increases until about
7 ms, where it reaches its maximum of about 25 J and then reduces slightly, reaching
a constant value of about 9 J. After about 12 ms, both glass and sealant joints absorb
less energy while most of the energy is absorbed the interlayer. It is evident that the
0
20
40
60
80
100
120
0
0.5
1
1.5
2
2.5
3
0 5 10 15 20 25
Defl
ecti
on
(m
m)
Vo
n M
ises
stress
(M
Pa)
Time (ms)
Von Mises Stress - Element 1
Von Mises Stress - Element 2
Centre Deflection

Chapter 4: Validation of Modelling Techniques 83
0
20
40
60
80
100
120
140
160
180
200
0
50
100
150
200
250
0 2 4 6 8 10 12 14 16 18 20
Defl
ecti
on
(m
m)
En
erg
y a
bso
rp
tio
n (
J)
Time (ms)
Glass
PVB
Sealant
Centre deflection
energy absorption of the PVB interlayer is significantly higher than those of the glass
and sealant joints for this particular blast load.
Figure 4-18: Energy absorption of different components in the FE model for test G684
4.5 CHAPTER SUMMARY
The modelling techniques developed in this research were validated with the results
from past experiments and this was presented in this chapter. Initially, the FE model
was validated with a free vibration analysis test, where the results from the FE
analysis for the period of vibration (and the centre deflection) compared well with
those from the experiment. Then, the behaviour of the LG panel was studied under
two shock tube tests: G688 and G684, where the later produced a blast load with an
impulse which was about 2.5 times higher than that of the former. A mesh sensitivity
analysis was carried out to identify a suitable mesh for the analysis. It was evident
that the increase in the number of elements in the plane of the panel improves the
results from the FE analysis rather than increasing the number of elements through
the thickness. It was found that the glass panes absorb most of the blast energy under
the weaker blast load. However, the interlayer absorbs most of the energy under the
stronger blast load, reflecting the post-crack behaviour of LG.
The peak values of the central deflection and the failure patterns under both blast
loadings obtained from the FE analyses agreed reasonably well with those from the
experiments. The modelling techniques established and validated were hence used in
the parametric studies on the effects of the constituent components on the blast
response of LG panels. These parametric studies are described in the following
chapters.

84 Chapter 4: Validation of Modelling Techniques

Chapter 5: Effects of Glass Properties on the Blast Performance of LG 85
Chapter 5: Effects of Glass Properties on
the Blast Performance of LG
5.1 INTRODUCTION
LG consists of two glass panes permanently bonded with a polymer interlayer. The
design standard ASTM F 2248-09 (2010b) recommends using either annealed or heat
strengthened glass types in LG rather than tempered glass which has shown poor
post-blast performance during blast testing. Glass type and pane thickness are two
important parameters that need to be considered when designing a LG panel under a
blast load. ASTM F 2248-09 (2010b) incorporates the charts given in the ASTM E
1300-09a (2009) to determine the required glass pane thickness when designing LG
under blast loads. ASTM E 1300-09a (2009) provides charts developed for LG
panels having glass thickness designation (GTD) of 5-19 mm where GTD implies the
combined thickness of the glass panes. This standard also takes into account the glass
type factor (GTF) to increase the lateral load resistance (LR) of LG depending on the
glass type. The GTF is 1 for annealed glass and it is 2 and 4 for heat strengthened
and fully tempered glass types respectively under 3 s duration loads. These GTFs are
used to increase the LR of LG when they are designed for blast loads.
According to the standard UFC 4-010-01 (2013), LG used in blast resistant glazing
should have at least 6 mm GTD where the minimum thickness of each glass pane
should be 3 mm. The minimum thickness of the interlayer should be 0.76 mm
according to this standard. The design procedure given in ASTM F 2248-09 (2010b)
incorporating ASTM E 1300-09a (2009), accounts for both glass pane thickness and
glass type for designing LG under blast loads. However, there is a limited
understanding on the effects of these parameters on the blast response of LG panels,
including centre deflection, energy absorption, support reaction and failure pattern.
5.2 PARAMETRIC STUDY
A LG panel with a length of 1.1 m, width of 0.9 m and a thickness of 7.52 mm (3
mm annealed glass + 1.52 mm PVB + 3 mm annealed glass) was used for the study.
This LG panel has two 3 mm glass panes and hence it has a GTD of 6 mm. During
the parametric study, GTD was varied between 6-8 mm while assuming that the glass

86 Chapter 5: Effects of Glass Properties on the Blast Performance of LG
panes have identical thickness. The tensile strength of glass (T) was also changed
between 60-150 MPa during the analysis. However, the interlayer thickness was used
as 1.52 mm during the study.
According to the ASTM F 2248-09 (2010b), LG panels should be fixed to the frame
using structural silicone sealant joints having a minimum thickness of 5 mm. The
width of the sealant joints should be not less than 10 mm or the GTD of the LG panel
while not greater than twice the GTD according to this standard. The thickness and
width of the structural sealant joints were therefore taken as 5 and 10 mm
respectively, agreeing with the provisions given in the standard for the chosen GTDs.
The performance of the LG panel was examined under two different blast loads and
the detailed information on the blast loads, FE model and the material properties
used in the analysis are presented below.
5.2.1 Blast Loads
The design blast threat of the LG panel treated in this study was found to be about 18
kg TNT equivalent charge weight at about 13 m standoff distance, in accordance
with ASTM F 2248-09 (2010b) and ASTM E 1300-09a (2009) standards. The
relevant reflected blast wave parameters for the blast threat were found from UFC 3-
340-02 (2008) using the chart developed for hemispherical surface explosions. The
maximum blast overpressure, positive phase duration and the blast impulse were
found to be about 88.3 kPa, 10.2 ms and 301 kPa-ms respectively.
In the present study, the performance of the LG panel was examined under two
different blast loads which are less severe than the design blast load. The weaker
blast load treated in this study is generated from an 18 kg TNT equivalent charge
weight at 25 m standoff distance and the stronger blast load is generated from the
same charge weight at 15 m standoff distance. The weaker blast load has a reflected
overpressure of about 31 kPa, positive load duration of about 12.3 ms and a reflected
impulse of about 150 kPa-ms and the corresponding parameters for the stronger blast
load are about 70 kPa, 10.3 ms and 270 kPa-ms respectively. The blast overpressure
time-history curves were obtained from the Friedlander equation and the relevant
decay factors (b) for the blast loads were found to be 0.79 and 0.94 respectively. The
reflected blast overpressure-time history curves used in this study are shown in
Figure 5-1 and they are also used for the parametric studies in chapters 6 and 7.

Chapter 5: Effects of Glass Properties on the Blast Performance of LG 87
Glass (3 mm)
PVB (1.52 mm)
Glass (3 mm)
Thickness of the sealant (5 mm)
Thickness of the sealant (5 mm)
Width of the sealant
(10 mm)
Figure 5-1: Reflected overpressure variation of the blast loads
5.2.2 FE Modelling
FE modelling was carried out using LS-DYNA FE code incorporating 3D constant
stress solid elements, as in the procedure given in Chapter 3. One-quarter of the LG
panel was analysed using symmetry, assuming that the blast load is uniformly
distributed over the entire front glass pane. Glass, interlayer and structural sealant
joints were accounted for in the FE model and the sealant joints were fixed to a rigid
base by neglecting the deformations in the frame for simplicity. The FE model of the
LG panel with 1.1 m width, 0.9 m height and 7.52 mm thickness (3 mm annealed
glass + 1.52 mm PVB + 3 mm annealed glass), and having sealant joints with 10 mm
width and 5 thickness is illustrated in Figure 5-2. Similar FE models were used for
the parametric study by varying the glass pane thickness.
(a) 3D view
(b) Sectional view at the support
Figure 5-2: FE model of the LG panel
5.2.3 Material Properties
Material properties used in the analysis were explained in Section 2.5. Material
properties of glass were given in Table 2-3 and the JH-2 material constants required
0
10
20
30
40
50
60
70
80
0 2 4 6 8 10 12 14
Refl
ecte
d o
verp
ress
ure (
kP
a)
Time (ms)
Weaker
Stronger
Short edge
Long edge
X
Y
Z

88 Chapter 5: Effects of Glass Properties on the Blast Performance of LG
for the material model 110 were given in Table 3-2. The dynamic breaking strength
of annealed glass is about 80 MPa, and that for the heat strengthened glass is about
160 MPa. Results from previous studies showed that the tensile strength (T) of glass
used with the material model 110 should be about 60-65 MPa for annealed glass.
Heat-strengthened glass is made by heating float annealed glass to a higher
temperature, followed by rapid cooling, which introduces surface compression to
annealed glass. The surface layer of heat-strengthened glass is in compression and its
core is under tension. The stress distribution along the thickness of a heat-
strengthened glass is not uniform, but on average it has a higher tensile strength than
annealed glass. In the present study, the tensile strength of glass was varied between
60-150 MPa to investigate its effects on the blast response of the LG panel.
The E of PVB interlayer was taken as 530 MPa; the relevant material properties used
in the analysis were given in Table 2-5 and the corresponding stress-strain behaviour
was illustrated in Figure 2-14. The E of silicone sealant was taken as 2.3 MPa and
the relevant material properties used in the analysis were given in Table 2-6, with its
stress-strain behaviour illustrated in Figure 2-16.
5.3 RESPONSE OF THE LG PANEL UNDER THE BLAST LOADS
The behaviour of the LG panel is compared under the chosen blast loads while taking
its tensile strength (T) and glass thickness designation (GTD) as 60 MPa and 6 mm
respectively. Results from the FE analysis for centre deflection, total energy
absorption, component energy absorptions, fracture pattern of the glass panes,
stresses of different components, and support reactions are presented below.
Centre deflection
Figure 5.3 compares the deflection time-histories at the centre of the LG panel for the
two chosen blast loads. It is evident that the two responses are quite different, as
expected. Maximum deflection observed under the weaker blast load is about 34 mm
at 12 ms and that observed under the stronger blast load is about 110.6 mm at 15 ms.
There is approximately a 300% increase in the maximum deflection under the
stronger blast load. The LG panel shows a rebound under the weaker blast load,
confirming that little damage has occurred to the glass panes. On the other hand, the
LG panel has a small rebound under the stronger blast load, indicating that
significant damage could have occurred to the glass panes.

Chapter 5: Effects of Glass Properties on the Blast Performance of LG 89
Figure 5-3: Variation of the deflection at the centre under blast loads
Total energy absorption
It is important to maximise the energy absorption when designing LG under blast
loads. The total energy absorbed by the FE model (which is quarter of the LG panel)
is compared under the blast loads in Figure 5-4. The energy absorption responses
under both blast loads steadily increase, reaching their maximum values during 8-10
ms and then remaining constant thereafter. The maximum energy absorbed under the
stronger blast load is about 279.1 J, which is considerably higher than that observed
under the weaker blast load, of about 63.2 J. When the deflection increases, the LG
panel absorbs more energy and hence shows an increase in the energy absorption
under the stronger blast load. The energy absorption response of the FE model is
used to evaluate the performance of the LG panel during the parametric studies
carried out in Chapters 5, 6, 7 and 8. However, it could be noted that the energy
absorption of the FE model is 0.25 times that of the entire LG panel, since quarter of
the LG panel is used in the analysis.
Figure 5-4: Variation of the energy absorption of the FE model under blast loads
Fracture and crack propagation in glass panes
Figures 5-5(a) and 5-5(b) show the fracture and crack propagation in the front and
back glass panes under the weaker blast load at 12 ms. Those under the stronger blast
load at 15 ms are shown in Figures 5-5(c) and 5-5(d). The back glass panes have
-20
0
20
40
60
80
100
120
0 5 10 15 20 25 30
Defl
ecti
on
(m
m)
Time (ms)
Weaker
Stronger
0
50
100
150
200
250
300
0 5 10 15 20 25
En
erg
y a
bso
rp
tio
n (
J)
Time (ms)
WeakerStronger

90 Chapter 5: Effects of Glass Properties on the Blast Performance of LG
more cracks compared to the front glass panes under both blast loads, as they attract
larger tensile stresses when the LG panels deform under the blast loads. Glass is
weak in tension and the glass elements in the FE model fail under excessive plastic
strains. The LG panel has a larger deflection and energy absorption under the
stronger blast load and hence both glass panes have fractured and have more cracks
than those under the weaker blast load.
(a) Front glass pane
under weaker blast
load at 12 ms
(b) Back glass pane
under weaker blast
load at 12 ms
(c) Front glass pane
under stronger blast
load at 15 ms
(d) Back glass pane
under stronger blast
load at 15 ms
Figure 5-5: Fracture and crack propagation of glass panes
Stress-strain behaviour of the interlayer
Figure 5-6(a) shows the plastic strain variation at the bottom surface of the interlayer
under the weaker blast load at 12 ms. The von Mises stress (σv) is used to examine
the failure of the interlayer. The PVB elements have exceeded their yield stress,
which is about 11 MPa along the yield lines, but most of the elements have a σv less
than 21 MPa, showing no sign of damage to the interlayer under the weaker blast
load. Figure 5-6(b) shows the plastic strain variation at the bottom surface of the
interlayer under the stronger blast load at 15 ms. There is an increase in the length
and width of the yield lines under the stronger blast load. Most of the PVB elements
along the yield lines have a σv more than 20 MPa and a few PVB elements at four
locations highlighted in Figure 5-6(b) have reached their failure stress, which is
about 28 MPa. The interlayer has torn at those locations under the stronger blast
load, which could be much closer to the design capacity of the LG panel.
(a) under weaker blast load at 12 ms
(b) under stronger blast load at 15 ms
Figure 5-6: Plastic strain variation at the bottom surface of the interlayer
PVB elements reach failure

Chapter 5: Effects of Glass Properties on the Blast Performance of LG 91
Stress analysis of sealant joints
The variation of σv in the structural sealant joints was examined under the blast
loads. Sealant joints at the middle of both the long and short edges have high stresses
compared to other parts, but the stress at the middle of the long edge is slightly
higher than that at the short edge. Figure 5-7 compares the variation of σv in critical
sealant elements at the middle of the long edge under the blast loads. Maximum
stress of about 0.85 MPa could be seen at about 10 ms under the weaker blast load.
The σv is well below the yield stress of the sealant material, which is about 2.3 MPa,
anywhere in the FE model. Maximum stress observed under the stronger blast load is
about 2.5 MPa at about 7.5 ms, which is more than the yield stress, but less than the
failure stress of about 3.5 MPa. Sealant joints are hence in the elastic region under
the weaker blast load and they are in the plastic region under the stronger blast load.
Figure 5-7: Von Mises stress (σv) variation in critical sealant elements at the middle of the long edge
The stress-time history variation of the sealant elements follows the deflection-time
history variation under the weaker blast load, where the sealant joints have high
stress during the peak inward deflection of the LG panel. The deflection of the LG
panel increases further with the damage to the interlayer under the stronger blast
load. Though the tearing of the interlayer increases the deflection, it could slightly
reduce the support reactions and hence stresses of the sealant joints. This could be
the reason for showing a reduction in the stresses of the sealant joints during the
inward deflection of the LG panel under the stronger blast load. It is evident that the
stress of the sealant joints reaches the maximum value with the occurrence of the
maximum support reaction as discussed below.
Support reactions
The stresses of sealant joints along the perimeter of the LG panel were examined, as
they provide an indication of the forces transferred to the supporting frame. As was
0
0.5
1
1.5
2
2.5
3
0 5 10 15 20 25
Vo
n M
ises
stress
(M
Pa)
Time (ms)
Weaker
Stronger

92 Chapter 5: Effects of Glass Properties on the Blast Performance of LG
discussed in the previous paragraph, sealant elements at the middle of the both long
and short edges have slightly higher stresses compared to those at other areas. The
reaction force per unit length at the middle of the long edge (RL) and that at the
middle of the short edge (RS) were therefore considered in this study. Magnitudes of
the both RL and RS were determined using Eq. 5.1 and 5.2 respectively, where Rx, Ry
and Rz are the reaction forces per unit length in the directions of X, Y and Z
respectively at the supporting edges (refer Figure 5-2(a)). The reaction forces in the
plane of the panel (Rx, Ry) and that perpendicular to the panel (Rz) were therefore
treated to calculate the RL and RS. However, it has to be noted that these reaction
forces vary along the edges though only those at the middle of the edges were treated
in this study. Furthermore, window frames and their attachments to the walls were
not treated in this study, which presents a conservative approach, as these members
could absorb some energy and reduce the support reactions.
Figure 5-8(a) compares the variations of support reactions at the middle of the long
and short edges (RL and RS) under the weaker blast load. Both RL and RS show a
similar variation, where they suddenly increase to a maximum at about 6-7 ms and
gradually reduce thereafter. RL has a maximum of about 11.3 kN/m, which is slightly
higher than the maximum of RS, which is about 11 kN/m. Figure 5-8(b) compares
these variations under the stronger blast load. Both RL and RS increase to a maximum
at about 6-8 ms and then gradually reduce, similar to that observed under the weaker
blast load. RL has a maximum of about 12.3 kN/m, and is slightly higher than that of
RS which is about 12.2 kN/m. RL is higher than RS under both blast loads and
therefore, it is used as a measure of support reactions during the parametric study.
When the interlayer damages under the stronger blast load, the LG panel absorbs
energy with the tearing of the interlayer rather than transferring energy to the
supports. Therefore, there is a little increase in the maximum value of support
reactions under the stronger blast load compared to those under weaker blast load.
However, it could be noticed that the area of the support reaction-time history curve
under the stronger blast load is much higher than that under the weaker blast load.
This confirms that support reactions remain at a higher value for a longer duration
under the stronger blast load than that occurs under the weaker blast load.
RL = (Ry2 + Rz
2)
1/2 Eq. 5.1
RS = (Rx2 + Rz
2)
1/2 Eq. 5-2

Chapter 5: Effects of Glass Properties on the Blast Performance of LG 93
0
2
4
6
8
10
12
0 5 10 15 20
Su
pp
ort
reacti
on
(k
N/m
)
Time (ms)
Long edge (RL)
Short edge (RS)
0
2
4
6
8
10
12
14
0 5 10 15 20 25
Su
pp
ort
reacti
on
(k
N/m
)
Time (ms)
Long edge (RL)
Short edge (RS)
0
5
10
15
20
25
30
35
40
45
50
0 5 10 15 20 25 30
En
erg
y a
bso
rp
tio
n (
J)
Time (ms)
GlassInterlayer
Sealant
0
20
40
60
80
100
120
140
160
180
0 5 10 15 20 25 30
En
erg
y a
bso
rp
tio
n (
J)
Time (ms)
Glass
Interlayer
Sealant
(a) Under weaker blast load (b) Under stronger blast load
Figure 5-8: Comparison of the support reactions at the middle of the long and short edges
Component energy absorption
The amounts of energy absorption of the different components in the FE model,
including glass, interlayer and structural sealant joints are compared in this study.
Figure 5-9 (a) and 5-9(b) compare these variations under the weaker and stronger
blast loads respectively. Under both blast loads, the glass panes absorb most of the
energy initially. They reach maximum values of about 47 and 130 J under the weaker
and stronger blast loads respectively. Thereafter, they show sudden reduction in the
energy absorption, and reach slightly lower values, probably due the damage initiated
in the glass panes. After the glass breaks, interlayers show sudden increase in the
energy absorption and this is mostly seen under the higher blast load causing
considerable damage to the glass panes and the interlayer. Maximum energies
absorbed by the interlayers under the weaker and stronger blast loads are about 32
and 167 J respectively. Overall, the sealant joints have less contribution to the energy
absorption, though they show slightly larger value under the higher blast load. These
curves provide useful information for the design of LG, so that the energy absorption
in the interlayer could be maximised in the design to confirm that the failure of a LG
panel occurs by tearing of the interlayer under the credible blast load.
(a) Under weaker blast load (b) Under stronger blast load
Figure 5-9: Variation of the energy absorption of different components in the FE model
94 Chapter 5: Effects of Glass Properties on the Blast Performance of LG
Results from the FE analysis for centre deflection, total energy absorption, fracture
of glass panes, stress-strain behaviour of the interlayer, stresses in sealant joints,
support reactions and component energy absorptions were studied to predict the
behaviour of the LG panel under the chosen blast loads. The glass panes fractured
slightly, the interlayer yielded but has stresses well below the failure stress, and the
sealant joints did not yield under the weaker blast load. Under the stronger blast load,
the glass panes fractured considerably, the interlayer tore in a few locations by
reaching the failure stress, and the sealant joints yielded slightly. It is therefore
evident that little damage has occurred to the LG panel under the weaker blast load,
while significant damage has occurred under the stronger blast load, which could be
close to the design capacity of the LG panel. This was also confirmed by analysing
the energy absorption of glass and interlayer, where the interlayer showed higher
contribution to the energy absorption under the stronger blast load. These two blast
loads represent two different scenarios, and hence are used in the parametric study
presented below, and also in those carried out in Chapters 6 and 7.
5.4 RESULTS FROM THE PARAMETRIC STUDY
The parametric study was carried out with the developed FE models, by varying the
tensile strength (T) of glass and its thickness designation (GTD). Results from the FE
analysis for centre deflection, total energy absorption and support reaction at the
middle of the long edge (RL) are discussed under the selected blast loads and are also
summarized in Table 5-1 and 5-2. Results obtained for LG panels with varied glass T
and GTD are compared with that having a T of 60 MPa and a GTD of 6 mm, and the
calculated percentage variations are given within brackets in Table 5-1 and 5-2. The
fracture of the glass panes, stress-strain behaviour of the interlayer and energy
absorption of the different components in the FE model are also compared during the
parametric study.
5.4.1 Effects of the Tensile Strength (T) of Glass
Six different FE models with glass panes, having tensile strengths (T) of 60, 65, 70,
100, 120 and 150 MPa, were used in the analysis while taking their GTD as 6 mm.
Results from the FE analysis for centre deflection, total energy absorption, support
reaction at the middle of the long edge (RL), fracture of the glass panes, stress-strain
behaviour of the interlayer and the energy absorption of different components in the

Chapter 5: Effects of Glass Properties on the Blast Performance of LG 95
FE model are compared under the chosen blast loads. The results are discussed
below and are also summarised in Table 5-1.
Table 5-1: Comparison of results for different tensile strengths (T) of glass
Centre deflection
Figure 5-10 compares the deflection-time histories at the centre of the LG panel for
different T of glass under the weaker blast load. Maximum deflections obtained from
the LG panels with T of 60, 65, 70, 100, 120, 150 MPa are about 34, 26.6, 26.5, 26.4,
26.4 and 26.4 mm respectively. The centre deflection of the LG panel is considerably
influenced by the T of glass when it varies between 60-70 MPa. However, LG panels
with glass panes having a T of more than 70 MPa, have identical deflection-time
histories showing no influence of that thereafter. They seem to oscillate at a larger T
value showing considerably stiffer behaviour compared to those with a smaller T of
glass. Figure 5-11 compares these variations under the stronger blast load and the
corresponding maximum deflections of the LG panels are about 110.6, 105.9, 93.8,
69.1, 54.9 and 38.9 mm respectively. It is clear that the T of glass has a significant
impact on the deflection-time histories under the stronger blast load. The LG panel
with glass panes having a T of 150 MPa seems to oscillate at a higher frequency
where it is considerably stiffer than those with a smaller T of glass.
Figure 5-12 compares the variation of the maximum deflection at the centre with the
T of glass under both blast loads. As was explained, the T of glass does not have any
influence on the maximum deflection when it increases beyond 70 MPa under the
Tensile
strength
(MPa)
Maximum deflection
(mm)
Maximum energy
absorption (J)
Maximum support
reaction (RL) (kN/m)
Weaker
blast load
Stronger
blast load
Weaker
blast load
Stronger
blast load
Weaker
blast load
Stronger
blast load
60 34 110.6 63.2 279.1 11.3 12.3
65 26.6
(-21.8%)
105.9
(-4.2%)
56.9
(-10%)
269.4
(-3.5%)
12
(6.2%)
12.9
(4.9%)
70 26.5
(-22%)
93.8
(-15.2%)
56.9
(-10%)
265.9
(-4.7%)
12.5
(10.6%)
13.2
(7.3%)
100 26.4
(-22.4%)
69.1
(-37.5%)
56.8
(-10.1%)
234.7
(-15.9%)
12.9
(14.2%)
16.9
(37.4%)
120 26.4
(-22.4%)
54.9
(-50.4%)
56.8
(-10.1%)
222.9
(-20.1%)
12.9
(14.2%)
18.2
(48%)
150 26.4
(-22.4%)
38.9
(-64.9%)
56.8
(-10.1%)
197.9
(-29.1%)
12.9
(14.2%)
25.1
(104.1%)

96 Chapter 5: Effects of Glass Properties on the Blast Performance of LG
-30
-20
-10
0
10
20
30
40
0 5 10 15 20 25 30
Defl
ecti
on
(m
m)
Time (ms)
T = 60 MPa
T = 65 MPa
T = 70 MPa
T = 100 MPa
T = 120 MPa
-40
-20
0
20
40
60
80
100
120
0 5 10 15 20 25 30
Defl
ecti
on
(m
m)
Time (ms)
T = 60 MPa
T = 70 MPa
T = 100 MPa
T = 120 MPa
T = 150 MPa
0
20
40
60
80
100
120
50 75 100 125 150
Maxim
um
defl
ecti
on
(m
m)
Tensile strength (T) of glass
Weaker
Stronger
weaker blast load. On the other hand, maximum deflection dramatically reduces with
the increase in the T of glass under the stronger blast load.
Figure 5-10: Variation of the deflection at the centre with time for different T of glass under the
weaker blast load (GTD = 6 mm)
Figure 5-11: Variation of the deflection at the centre with time for different T of glass under the
stronger blast load (GTD = 6 mm)
Figure 5-12: Variation of the maximum deflection at the centre with the T of glass

Chapter 5: Effects of Glass Properties on the Blast Performance of LG 97
0
10
20
30
40
50
60
70
0 5 10 15 20
En
erg
y a
bso
rp
tio
n (
J)
Time (ms)
T = 60 MPa
T = 65 MPa
T = 70 MPa
T = 100 MPa
T = 120 MPa0
50
100
150
200
250
300
0 5 10 15 20
En
erg
y a
bso
rp
tio
n (
J)
Time (ms)
T = 60 MPa
T = 70 MPa
T = 100 MPa
T = 120 MPa
T = 150 MPa
Total energy absorption
Figure 5-13(a) compares the variation of the total energy absorption of the FE model
with time for different T of glass under the weaker blast load. Maximum energy
absorptions obtained from the FE models with T of 60, 65, 70, 100, 120, 150 MPa
are about 63.2, 56.9, 56.9, 56.8, 56.8 and 56.8 J respectively. The LG panel with
glass panes having a T of 60 MPa shows a gradual increase in the energy absorption,
reaches a maximum and then retains that thereafter. However, LG panels with a
higher T of glass show a reduction in the energy absorption after reaching their
maximum values. This might be due to the fact that LG panels with a smaller T have
high plastic deformations where the energy absorptions are not recoverable, while
those with higher T have elastic deformations at most locations.
Figure 5-13(b) compares these variations under the stronger blast load, and the
corresponding maximum energy absorptions of the FE models are about 279.1,
269.4, 265.9, 234.7, 22.9 and 197.9 J respectively. The energy absorption is
considerably influenced by the T of glass for the range of T used in the analysis. This
blast load causes a significant damage to the glass panes and hence only LG panel
with glass having a T of 150 MPa has elastic deformations showing reduction in the
energy absorption after reaching the maximum. Figure 5-14 compares the variation
of the maximum energy absorption of the FE model with the T of glass under the
blast loads. Maximum energy absorption reduces slightly with the increase of the T
of glass initially and it remains constant thereafter, showing no influence of the T of
glass under the weaker blast load. On the other hand, maximum energy absorption
noticeably reduces with increase of the T of glass under the stronger blast load.
(a) Under weaker blast load (b) Under stronger blast load
Figure 5-13: Variation of the total energy absorption of the FE models with time for different T of glass (GTD = 6 mm)

98 Chapter 5: Effects of Glass Properties on the Blast Performance of LG
0
50
100
150
200
250
300
50 75 100 125 150
Maxim
um
en
erg
y a
bso
rp
tio
n (
J)
Tensile strength (T) of glass
Weaker
Stronger
0
2
4
6
8
10
12
14
0 5 10 15 20
Su
pp
ort
reacti
on
(k
N/m
)
Time (ms)
T = 60 MPa
T = 65 MPa
T = 70 MPa
T = 120 MPa
0
5
10
15
20
25
30
0 5 10 15 20
Su
pp
ort
reacti
on
(k
N/m
)
Time (ms)
T = 60 MPaT = 70 MPaT = 100 MPaT = 120 MPaT = 150 MPa
Figure 5-14: Variation of the maximum energy absorption of the FE models with the T of glass
Support reactions
Figure 5-15(a) compares the variation of the support reaction at the middle of the
long edge (RL) of the LG panel with time for different T of glass under the weaker
blast load. Maximum RL obtained from the LG panels with glass panes having T of
60, 65, 70, 100, 120, 150 MPa are about 11.3, 12, 12.5, 12.9, 12.9 and 12.9 kN/m
respectively. When the T of glass increases beyond 70 MPa, RL-time history curves
become identical, as seen with the centre deflection and energy absorption. Figure 5-
15(b) compares these variations under the stronger blast load and the corresponding
maximum RL of the LG panels are about 12.3, 12.9, 13.2, 16.9, 18.2 and 25.1 kN/m
respectively. Maximum RL can be seen during 5-8 ms under both blast loads
irrespective of the T of glass. The LG panels with glass panes having a smaller T
show reduction in the RL with time, with some fluctuations after reaching their
maximum. However, those with glass panes having higher a T show little reduction
in the RL with time where they have many fluctuations with high peak values.
(a) Under weaker blast load (b) Under stronger blast load
Figure 5-15: Variation of the support reaction, RL of the LG panel with time for different T of glass
(GTD = 6 mm)

Chapter 5: Effects of Glass Properties on the Blast Performance of LG 99
10
15
20
25
30
50 75 100 125 150
Maxim
um
su
pp
ort
reacti
on
(kN
/m)
Tensile strength (T) of glass
Weaker
Stronger
Figure 5-16 compares the variation of the maximum RL of the LG panel with the T of
glass under the blast loads. Overall, the T of glass has a little impact on the RL under
the weaker blast load. However, there is a significant increase in the RL with the
increase of the T of glass under the stronger blast load. The LG panel with glass
panes having a T of 150 MPa shows about 104% increase in the RL compared to that
with glass panes having a T of 60 MPa under the stronger blast load. It is also
evident that glass panes with a smaller T have similar support reactions, irrespective
of the blast load.
Figure 5-16: Variation of the maximum support reaction, RL of the LG panel with the T of glass
Fracture of glass panes
The fracture and crack propagation of the back glass panes are compared in this
study, as they have more fracture lines compared to the front glass panes. This could
be expected as the back glass panes attract more tensile stresses, compared to the
front glass panes when the LG panels deflect under the blast loads. Figure 5-17
compares the fracture of the back glass panes under the weaker blast load for the LG
panels with glass panes having T of 60, 65 and 70 MPa at the time of their maximum
deflections. The LG panels with glass panes having T of 60 and 65 MPa, have
fractured under this blast load, where the former has slightly wider fracture lines than
the later, as it is subjected to a larger deflection. The LG panels with glass panes
having T of 70-150 MPa, have not fractured noticeably under the weaker blast load.
These LG panels showed identical deflection-time histories and hence it is clear that
the T of glass has an influence on the behaviour of the LG panel only if the glass
panes damage and fracture under a blast load.
Figure 5-18 compares the fracture of the back glass panes under the stronger blast
load for the LG panels with glass panes having T of 60-150 MPa at the time of their
maximum deflections. The LG panel with glass panes having the lowest T is

100 Chapter 5: Effects of Glass Properties on the Blast Performance of LG
subjected to the largest deflection and hence has wider fracture lines than the other
LG panels. The width of the fracture lines reduces with the increase of the T of glass.
The LG panels with glass panes having T of 65 and 70 MPa have fracture lines with
slightly smaller width, but they are distributed everywhere in the glass panes, as
opposed to those of 60 MPa. When the T of glass goes beyond 100 MPa, there is a
noticeable decrease in the fracture lines. The LG panel with glass panes having a T
of 150 MPa does not have any visible fracture lines even under the stronger blast
load and possibly this could be the reason for its stiffer deflection-time history
variation compared to the other LG panels.
T = 60 MPa at 13 ms T = 65 MPa at 10 ms T = 70 MPa at 8 ms
Figure 5-17: Fracture of the back glass panes for different T of glass under the weaker blast load
T = 60 MPa at 15 ms T = 65 MPa at 14 ms T = 70 MPa at 13 ms
T = 100 MPa at 12 ms T = 120 MPa at 11 ms T = 150 MPa at 7 ms
Figure 5-18: Fracture of the back glass panes for different T of glass under the stronger blast load
Failure analysis of the interlayer
Figure 5-19 compares the plastic strain variation at the bottom surface of the
interlayer under the weaker blast load for the LG panels with glass panes having T of
60, 65 and 70 MPa. When the glass fractures, the interlayer attracts high stresses

Chapter 5: Effects of Glass Properties on the Blast Performance of LG 101
along the fracture lines where it has high plastic strains. The LG panels with a
smaller T of glass have more damage to the glass panes where they have high
stresses and strain in the interlayer than the other LG panels. Von Mises stress (σv) is
examined at the locations of the interlayers where there are high plastic strains. The
LG panels with glass panes having T of 70-150 MPa showed least damage to the
glass panes and hence the interlayers of those LG panels have small stresses, which
are less than the yield stress of the material at most locations. Maximum stresses
observed in interlayers of the LG panels with glass panes having T of 60 and 65 MPa
are about 21 and 16 MPa respectively and those are well below the failure stress of
the material which is about 28 MPa.
T = 60 MPa at 13 ms T = 65 MPa at 10 ms T = 70 MPa at 8 ms
Figure 5-19: Plastic strain variation at the bottom surface of the interlayer for different T of glass
under the weaker blast load
Figure 5-20 compares the plastic strain variation at the bottom surface of the
interlayer under the stronger blast load for the LG panels with glass panes having T
of 60-150 MPa. The LG panel with glass panes having a T of 60 MPa has the most
damage to the interlayer, where it reaches its failure stress of 28 MPa at few
locations. LG panels with glass panes having T of 65 and 70 MPa showed more
fracture lines on the glass panes and similarly, interlayers of those have yielded at
many more locations than that of 60 MPa, where the σv reaches failure stress only at
a few locations. The plastic strain distribution of the LG panels with glass panes
having T of 100 and 120 MPa is similar, but less severe than those with a smaller T
of glass, where they have high stresses of about 25-28 MPa at a few locations. The
LG panel with glass panes having a T of 150 MPa showed no visible fracture lines
on the glass panes and similarly, the interlayer of that has no plastic strains in the
middle. However, it has some high stresses along the edges, which are still quite
small, being in the range of 10-12 MPa. Overall, it is clear that LG panels with a
higher T of glass have less damage to the glass panes and the interlayer than those
with a smaller T of glass.

102 Chapter 5: Effects of Glass Properties on the Blast Performance of LG
T = 60 MPa at 15 ms T = 65 MPa at 14 ms T = 70 MPa at 13 ms
T = 100 MPa at 12 ms T = 120 MPa at 11 ms T = 150 MPa at 7 ms
Figure 5-20: Plastic strain variation at the bottom surface of the interlayer for different T of glass
under the stronger blast load
Component energy absorptions
The energy absorption of different components in the FE model including glass,
interlayer and structural sealant joints are compared only under the stronger blast
load, which caused considerable damage to the interlayer. Figure 5-21 compares
these variations for different T of glass. Glass panes in the FE models absorb most of
the energy initially, irrespective of the T of glass. Maximum energy absorptions of
the glass panes with T of 60, 100 and 150 MPa are about 130, 163, 167 J
respectively, and those for the interlayer for the corresponding T values are about
167, 138, 21 J respectively. It is evident that glass panes with larger T, have higher
energy absorptions, while the interlayers in those LG panels make little contribution
to the energy absorption. After the glass breaks, interlayer shows sudden increase in
the energy absorption, and this can be seen for the LG panels with glass panes having
T of 60 and 100 MPa. Glass panes with T of 150 MPa did not have noticeable
damage (refer Figure 5-18), and hence they have a smaller reduction in the energy
absorption after reaching the peak value. The interlayer of this LG panel had
negligible plastic deformations (refer Figure 5-20), and hence makes little
contribution to the energy absorption.

Chapter 5: Effects of Glass Properties on the Blast Performance of LG 103
0
20
40
60
80
100
120
140
160
180
0 5 10 15 20 25 30
En
erg
y a
bso
rp
tio
n (
J)
Time (ms)
Glass
Interlayer
Sealant
0
20
40
60
80
100
120
140
160
180
0 5 10 15 20 25 30
En
erg
y a
bso
rp
tio
n (
J)
Time (ms)
Glass
Interlayer
Sealant
0
20
40
60
80
100
120
140
160
180
0 5 10 15 20 25 30
En
erg
y a
bso
rp
tio
n (
J)
Time (ms)
Glass
Interlayer
Sealant
(a) T = 60 MPa (b) T = 100 MPa
(c) T = 150 MPa
Figure 5-21: Energy absorption of the different components in the FE model for different T of glass
under the stronger blast load
In the chapter 4 of this thesis, a free vibration analysis has been carried out on a LG
panel with an identical size. Results from the FE analysis showed that the maximum
first peak of inward deflection of the LG panel occurs at about 4-5 ms. The LG panel
behaved in the elastic region during the free-vibration analysis as it was generated by
applying a very small initial deflection to the LG panel. The T of glass does not have
an influence on the E of the glass or the elastic properties of the LG panel. Glass
panes are therefore likely to fracture at about 5 ms and hence they show maximum
energy absorption at that time irrespective of the T of glass. However, it could be
noted that the deflection of the LG panel could further increase even after 5 ms when
the glass panes fracture at that time. Sealant joints have slightly higher energy
absorptions when the LG panels subjected to high deflections, but overall they make
little contribution to the energy absorption. The LG panel with glass panes having T
of 150 MPa showed oscillation under the higher blast load. The sealant joints stretch
with the deflection of the LG panel and hence they show higher energy absorptions
during the peak deflections of the LG panel.
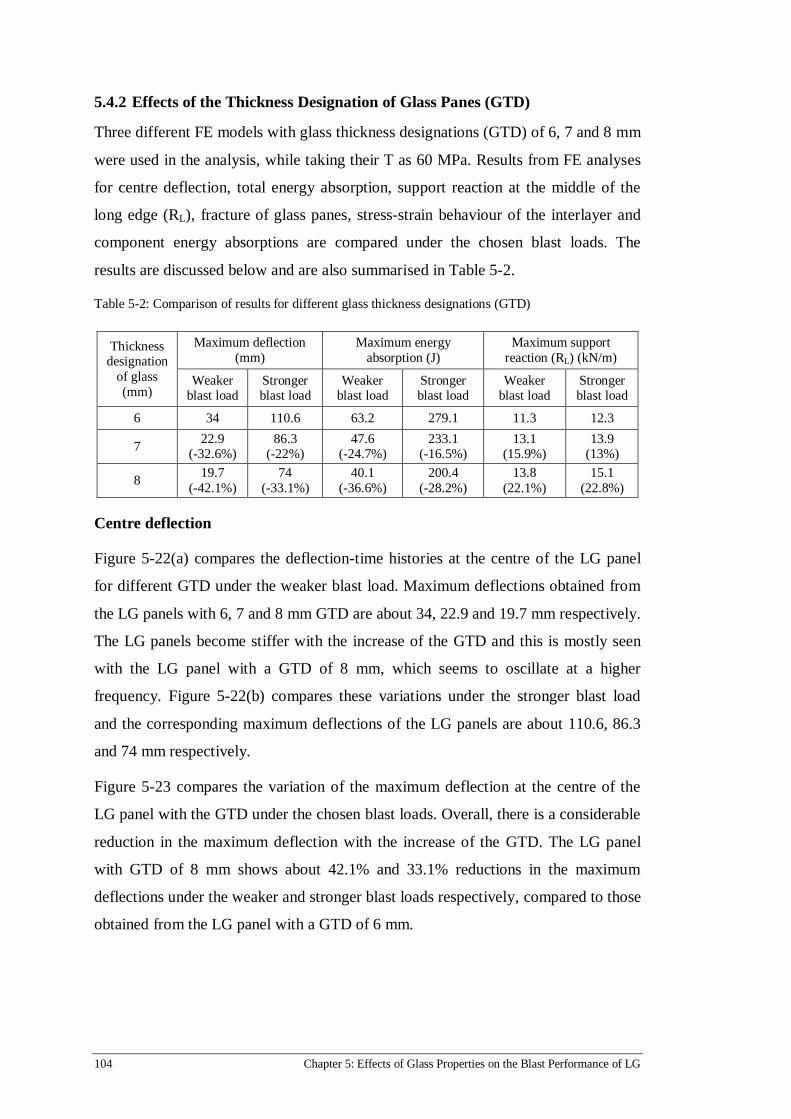
104 Chapter 5: Effects of Glass Properties on the Blast Performance of LG
5.4.2 Effects of the Thickness Designation of Glass Panes (GTD)
Three different FE models with glass thickness designations (GTD) of 6, 7 and 8 mm
were used in the analysis, while taking their T as 60 MPa. Results from FE analyses
for centre deflection, total energy absorption, support reaction at the middle of the
long edge (RL), fracture of glass panes, stress-strain behaviour of the interlayer and
component energy absorptions are compared under the chosen blast loads. The
results are discussed below and are also summarised in Table 5-2.
Table 5-2: Comparison of results for different glass thickness designations (GTD)
Thickness designation
of glass
(mm)
Maximum deflection
(mm)
Maximum energy
absorption (J)
Maximum support
reaction (RL) (kN/m)
Weaker blast load
Stronger blast load
Weaker blast load
Stronger blast load
Weaker blast load
Stronger blast load
6 34 110.6 63.2 279.1 11.3 12.3
7 22.9
(-32.6%) 86.3
(-22%) 47.6
(-24.7%) 233.1
(-16.5%) 13.1
(15.9%) 13.9
(13%)
8 19.7
(-42.1%)
74
(-33.1%)
40.1
(-36.6%)
200.4
(-28.2%)
13.8
(22.1%)
15.1
(22.8%)
Centre deflection
Figure 5-22(a) compares the deflection-time histories at the centre of the LG panel
for different GTD under the weaker blast load. Maximum deflections obtained from
the LG panels with 6, 7 and 8 mm GTD are about 34, 22.9 and 19.7 mm respectively.
The LG panels become stiffer with the increase of the GTD and this is mostly seen
with the LG panel with a GTD of 8 mm, which seems to oscillate at a higher
frequency. Figure 5-22(b) compares these variations under the stronger blast load
and the corresponding maximum deflections of the LG panels are about 110.6, 86.3
and 74 mm respectively.
Figure 5-23 compares the variation of the maximum deflection at the centre of the
LG panel with the GTD under the chosen blast loads. Overall, there is a considerable
reduction in the maximum deflection with the increase of the GTD. The LG panel
with GTD of 8 mm shows about 42.1% and 33.1% reductions in the maximum
deflections under the weaker and stronger blast loads respectively, compared to those
obtained from the LG panel with a GTD of 6 mm.
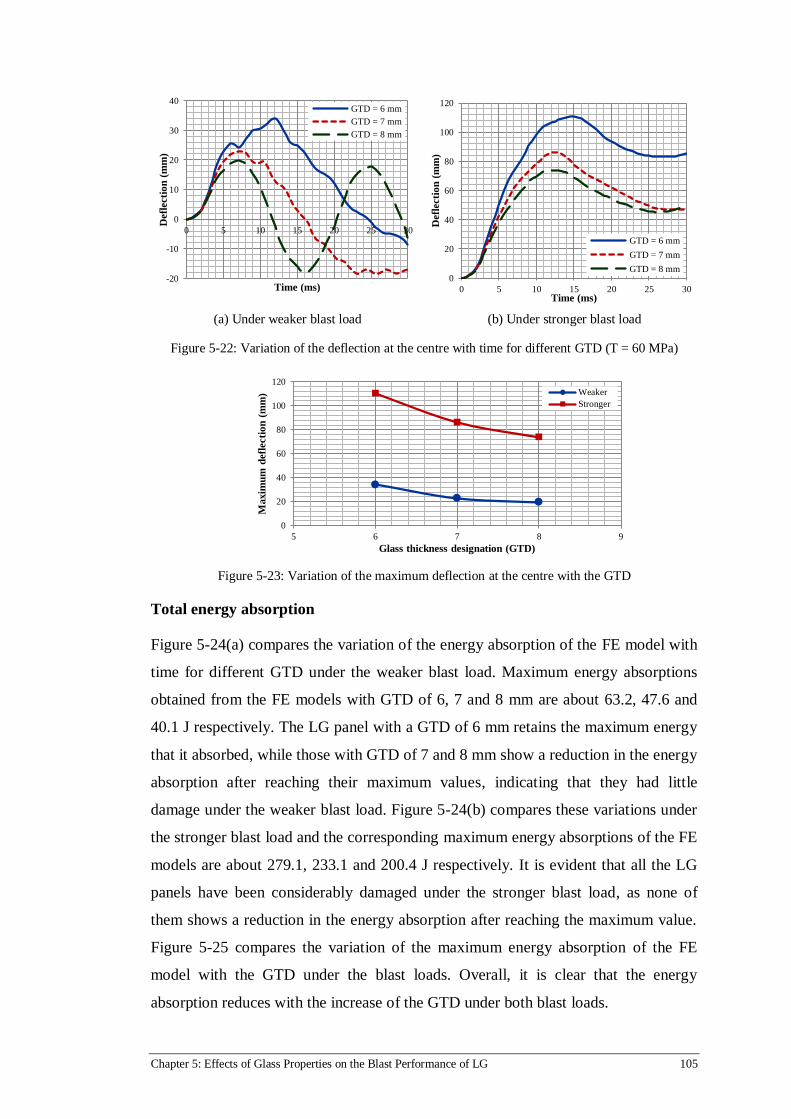
Chapter 5: Effects of Glass Properties on the Blast Performance of LG 105
0
20
40
60
80
100
120
5 6 7 8 9
Maxim
um
defl
ecti
on
(m
m)
Glass thickness designation (GTD)
Weaker
Stronger
-20
-10
0
10
20
30
40
0 5 10 15 20 25 30
Defl
ecti
on
(m
m)
Time (ms)
GTD = 6 mm
GTD = 7 mm
GTD = 8 mm
0
20
40
60
80
100
120
0 5 10 15 20 25 30
Defl
ecti
on
(m
m)
Time (ms)
GTD = 6 mm
GTD = 7 mm
GTD = 8 mm
(a) Under weaker blast load (b) Under stronger blast load
Figure 5-22: Variation of the deflection at the centre with time for different GTD (T = 60 MPa)
Figure 5-23: Variation of the maximum deflection at the centre with the GTD
Total energy absorption
Figure 5-24(a) compares the variation of the energy absorption of the FE model with
time for different GTD under the weaker blast load. Maximum energy absorptions
obtained from the FE models with GTD of 6, 7 and 8 mm are about 63.2, 47.6 and
40.1 J respectively. The LG panel with a GTD of 6 mm retains the maximum energy
that it absorbed, while those with GTD of 7 and 8 mm show a reduction in the energy
absorption after reaching their maximum values, indicating that they had little
damage under the weaker blast load. Figure 5-24(b) compares these variations under
the stronger blast load and the corresponding maximum energy absorptions of the FE
models are about 279.1, 233.1 and 200.4 J respectively. It is evident that all the LG
panels have been considerably damaged under the stronger blast load, as none of
them shows a reduction in the energy absorption after reaching the maximum value.
Figure 5-25 compares the variation of the maximum energy absorption of the FE
model with the GTD under the blast loads. Overall, it is clear that the energy
absorption reduces with the increase of the GTD under both blast loads.

106 Chapter 5: Effects of Glass Properties on the Blast Performance of LG
0
50
100
150
200
250
300
5 6 7 8 9
Maxim
um
en
erg
y
ab
sorp
tio
n (
J)
Glass thickness designation (GTD)
Weaker
Stronger
0
10
20
30
40
50
60
70
0 5 10 15 20 25
En
erg
y a
bso
rp
tio
n (
J)
Time (ms)
GTD = 6 mm
GTD = 7 mm
GTD = 8 mm0
50
100
150
200
250
300
0 5 10 15 20 25
En
erg
y a
bso
rp
tio
n (
J)
Time (ms)
GTD = 6 mm
GTD = 7 mm
GTD = 8 mm
(a) Under weaker blast load (b) Under stronger blast load
Figure 5-24: Variation of the total energy absorption of the FE models with time for different GTD
(T = 60 MPa)
Figure 5-25: Variation of the maximum energy absorption of the FE models with the GTD
Support reaction (RL)
Figure 5-26(a) compares the variation of the support reaction at the middle of the
long edge (RL) of the LG panel with time for different GTD under the weaker blast
load. Maximum RL obtained from the LG panels with GTD of 6, 7 and 8 mm are
about 11.3, 13.1 and 13.8 kN/m respectively. The LG panels show a sudden increase
in the RL initially and obtain the maximum values during 5-8 ms. The LG panels
with GTD of 6 and 7 mm show gradual reduction in the RL thereafter with many
fluctuations, while that with a GTD of 7 mm has more high peaks than the other. The
LG panel with a GTD of 8 mm showed oscillation and hence it has high support
reactions at each peak of the deflection.
Figure 5-26(b) compares these variations under the stronger blast load and the
corresponding maximum RL of the LG panels are about 12.3, 13.9 and 15.1 kN/m
respectively. The LG panels have maximum RL during 4-8 ms and then reaction
forces gradually reduce with time with some fluctuations. Figure 5-27 compares the

Chapter 5: Effects of Glass Properties on the Blast Performance of LG 107
0
2
4
6
8
10
12
14
16
0 5 10 15 20 25
Su
pp
ort
reacti
on
(k
N/m
)
Time (ms)
GTD = 6 mm
GTD = 7 mm
GTD = 8 mm
0
2
4
6
8
10
12
14
16
0 5 10 15 20S
up
po
rt
reacti
on
(k
N/m
) Time (ms)
GTD = 6 mm
GTD = 7 mm
GTD = 8 mm
10
11
12
13
14
15
16
5 6 7 8 9
Maxim
um
su
pp
ort
reacti
on
(kN
/m)
Glass thickness designation (GTD)
Weaker
Stronger
variation of the RL with the GTD under the blast loads. Overall, it is clear that LG
panels with high GTD have high support reactions where the LG panel with a GTD
of 8 mm shows about 22.1% and 22.8% increases in the maximum RL under the
weaker and stronger blast loads respectively, compared to those with the LG panel
having a GTD of 6 mm.
(a) Under weaker blast load (b) Under stronger blast load
Figure 5-26: Variation of the support reaction, RL with time for different GTD (T = 60 MPa)
Figure 5-27: Variation of the maximum support reaction, RL with the GTD
Fracture of glass panes
As was explained earlier, back glass panes have more fracture lines compared to the
front glass panes and hence they are examined in this study. Figure 5-28 compares
the fracture of the back glass panes under the weaker blast load for LG panels with
different GTDs. The LG panel with a GTD of 6 mm has the largest deflection and
hence has wider fracture lines than that with a GTD of 7 mm. The LG panel with a
GTD of 8 mm has no visible fracture lines supporting the stiffer behaviour shown in
the deflection-time history variation.

108 Chapter 5: Effects of Glass Properties on the Blast Performance of LG
(a) GTD = 6 mm at 13 ms (b) GTD = 7 mm at 8 ms (c) GTD = 8 mm at 7.5 ms
Figure 5-28: Fracture of the back glass panes for different GTDs under the weaker blast load
Figure 5-29 compares this fracture of the back glass panes for different GTDs under
the stronger blast load. The LG panel with a GTD of 6 mm showed the highest
deflection and hence has slightly more fracture lines compared to that with a GTD of
7 mm. There is a reduction in the fracture lines with the increase of the GTD and this
is clearly seen in the LG panel with a GTD of 8 mm. Overall, it is evident that LG
panels with a higher GTD have smaller deflections, causing less damage to the glass
panes under both blast loads.
(a) GTD = 6 mm at 15 ms (b) GTD = 7 mm at 13 ms (c) GTD = 8 mm at 13 ms
Figure 5-29: Fracture of the back glass panes for different GTDs under the stronger blast load
Failure analysis of the interlayer
Figure 5.30 compares the plastic strain variation at the bottom surface of the
interlayer for different GTDs under the weaker blast load at the time of their
maximum deflections. When the glass fractures, the interlayer attracts high stresses
along the fracture lines where it has high plastic strains. The LG panel with a GTD of
6 mm showed most damage to the glass panes, and hence its interlayer has higher
plastic strains than those with higher GTDs. Von Mises stress (σv) was examined in
the interlayer at the locations with high plastic strain. Maximum σv observed in the
LG panel with a GTD of 6 mm is about 21 MPa and that for the LG panel with a
GTD of 7 mm is about 14 MPa. The LG panel with a GTD of 8 mm has no plastic
strains anywhere in the interlayer, which has considerably small stresses in the range
of 2.5-3 MPa.

Chapter 5: Effects of Glass Properties on the Blast Performance of LG 109
GTD = 6 mm at 13 ms GTD = 7 mm at 8 ms GTD = 8 mm at 7.5 ms
Figure 5-30: Plastic strain variation at the bottom surface of the interlayer for different GTDs under
the weaker blast load
Figure 5.31 compares the plastic strain variation at the bottom surface of the
interlayer for different GTDs under the stronger blast load at the time of their
maximum deflections. As was seen with the smaller blast load, there is a clear
reduction in the stresses and plastic strains in the interlayer with the increase of the
GTD. The interlayer of the LG panel with a GTD of 6 mm has reached its failure
stress of about 28 MPa at a few locations, while those with 7 and 8 mm GTD also
have high σv of about 25-27 MPa, but none of the interlayer elements in those LG
panels have reached the failure stress. It is therefore evident that the increase in the
GTD reduces the stresses attracted by the interlayer.
GTD = 6 mm at 15 ms GTD = 7 mm at 13 ms GTD = 8 mm at 13 ms
Figure 5-31: Plastic strain variation at the bottom surface of the interlayer for different GTDs under
the stronger blast load
Component energy absorptions
The energy absorption variation of the different components of the FE model,
including glass, interlayer and structural sealant joints were studied under the
stronger blast load. Figures 5-32(a) and 5-32(b) show these variations for the FE
models with a GTD of 6 and 8 mm respectively. Maximum energies absorbed by the
glass panes and the interlayer for the FE model with a GTD of 6 mm are about 130
and 167 J respectively, while those values for the FE model with a GTD of 8 mm are
about 88 and 131 J. The components in the LG panel with a higher GTD have less
energy absorptions compared to those in the LG panel with a lower GTD. However,

110 Chapter 5: Effects of Glass Properties on the Blast Performance of LG
0
20
40
60
80
100
120
140
160
180
0 5 10 15 20 25 30
En
erg
y a
bso
rp
tio
n (
J)
Time (ms)
Glass
Interlayer
Sealant
0
20
40
60
80
100
120
140
0 5 10 15 20 25 30
En
erg
y a
bso
rp
tio
n (
J)
Time (ms)
Glass
Interlayer
Sealant
both LG panels achieve the expected failure pattern, where the interlayers actively
participate to the energy absorption with the fracture of glass panes.
(a) t = 6 mm (b) t = 8 mm
Figure 5-32: Variation of the energy absorption of the different components of the FE model under the stronger blast load
5.5 DISCUSSION
From the previous studies, it was confirmed that the tensile strength (T) used with the
JH-2 material model should be about 60-65 MPa for annealed glass. Because of the
available surface compression in the heat-strengthened glass, on average it has a
higher tensile strength than annealed glass. The tensile strength (T) of the glass was
varied between 60-150 MPa in the analysis, while taking the glass thickness
designation (GTD) as 6 mm. The behaviour of the LG panel is influenced by the T of
glass when it varies between 60-70 MPa under the weaker blast load. However, when
it goes beyond 70 MPa, LG panels give identical results, showing no influence of the
T of glass under the weaker blast load. By analysing the fracture of the glass panes it
was confirmed that there cannot be noticeable failure in the glass panes when the T
of glass is beyond 70 MPa under the weaker blast load. It is therefore evident that the
T of glass has an effect on the behaviour of the LG panel only if the glass panes
damage and fracture under the given loading.
The T of glass has a significant influence on the behaviour of the LG panel under the
stronger blast load. When the T increases, both centre deflection and the energy
absorption show a considerable reduction, while increasing the support reaction. As
an example, LG panel with a T of 120 MPa showed about 50.4% reduction in the
deflection, 20.1% reduction in the energy absorption, while increasing the support
reaction by about 48%, compared to that with T of 60 MPa under the stronger blast
load. When T is increased to 150 MPa, the corresponding percentage variations are

Chapter 5: Effects of Glass Properties on the Blast Performance of LG 111
about -64.9%, -29.1% and 104.1% respectively. The use of heat strengthened glass
with a higher T could considerably reduce the energy absorption, while increasing
the support reactions compared to those with annealed glass under the stronger blast
load. Additionally, LG panels with a higher T of glass caused little damage to the
glass panes, reducing the stresses in the interlayer. This leads to a poor design if the
stronger blast load is treated as the credible blast load for the design, as LG should be
designed to fail by tearing of the interlayer to maximise the energy absorption. The
LG with a smaller T should be an adequate and economical solution for the type of
blast loads used in this study. This was also confirmed by analysing the energy
absorption of the different components in the FE models, where the LG panels with
higher T values considerably deviate from the expected failure mode under the
stronger blast load. However, it should be noted that LG panels with higher T of
glass have a higher load carrying capacity where they could fail with the expected
failure mode under a higher blast load than those treated in this study.
The GTD was varied between 6-8 mm in the analysis, while taking the T of glass as
60 MPa. The GTD has a considerable impact on the behaviour of the LG panel under
both blast loads, where both deflection and energy absorption considerably reduce
with the increase of the GTD, while support reactions show a noticeable increase. As
an example, the LG panel with a GTD of 8 mm showed about 42.1% reduction in the
deflection, 36.6% reduction in the energy absorption, while increasing the support
reaction by about 22.1% compared to that with a GTD of 6 mm under the weaker
blast load. The corresponding percentage variations under the stronger blast load are
about -33.1%, -28.2% and 22.8% respectively.
It was also noted that the LG panels with higher GTD caused little damage to the
glass panes, reducing the stresses in the interlayer. The LG with a higher GTD could
withstand higher blast loads compared to those with a smaller GTD. However, LG
should be designed to fail by tearing of the interlayer to maximise the energy
absorption under the credible blast load. The use of thicker LG panels having a
higher GTD requires more glass material and also larger framing members to
withhold the LG panels. Results from this study showed that LG panels with a higher
T of glass have similar performances to those with higher GTD in terms of centre
deflection, energy absorption and support reaction. As an example, LG panels with
glass panes having T of 100 MPa and GTD of 6 mm have similar results to those

112 Chapter 5: Effects of Glass Properties on the Blast Performance of LG
with the LG panel having T of 60 MPa and a GTD of 8 mm. However, feasibility
study should be carried out by comparing the cost of additional glass material needed
and that of treating glass to achieve higher strength. It should be noted that by using
thicker glass ply will increase the inertia resistance, which is not achievable by using
higher strength glass.
5.6 CHAPTER SUMMARY
This chapter presented the results from a parametric study, which was carried out to
investigate the influence of the geometric and material properties of the glass panes
on the blast performance of a LG panel. In this study, the tensile strength (T) of glass
and the glass thickness designation (GTD) were varied and their effects on the centre
deflection, total energy absorption, support reactions, fracture of glass panes, stress-
strain variation of the interlayer and the component energy absorptions of the LG
panel were studied with the developed FE models. Results showed that both the T of
glass and the GTD have a considerable influence on the blast response of LG panels,
and therefore they should be analysed carefully when designing LG panels under
blast loads. The best possible combination of T and GTD needs to be selected in the
design, giving the highest energy absorption, but minimum support reactions.
The use of LG panels with glass panes having a higher T, such as heat strengthened
glass and the use of thicker panels with higher GTD, considerably reduce the
deflections and energy absorptions, while increasing their support reactions. These
LG panels showed little damage to the glass panes minimising the stresses and
failure of the interlayer, confirming that they have a higher load carrying capacity
than those with a smaller T and GTD. However, LG should be designed to fail by
tearing of the interlayer to maximise the energy absorption while minimising support
reactions. From this aspect, it is not recommended to use glass types with a higher T
or use LG panels with a higher GTD if those with smaller values can withstand a
design blast load. The use of thicker LG panels with a higher GTD increases the size
of the required framing members. This can be avoided by using glass panes having a
higher T, as they have similar performances to those with a higher GTD under a
given blast load.

Chapter 6: Effects of Interlayer Properties on the Blast Performance of LG 113
Chapter 6: Effects of Interlayer Properties
on the Blast Performance of LG
6.1 INTRODUCTION
The post-crack load carrying capacity of LG is considerably higher than that at the
pre-crack phase. After the glass breaks, the interlayer deforms further by absorbing
energy and hence the post-crack behaviour of a LG is considerably influenced by the
interlayer properties. This could be seen in Chapter 4, where the glass panes
absorbed most of the blast energy under a weaker blast load, which caused less
damage to the glass panes. On the other hand, the interlayer absorbed most of the
blast energy after the glass panes damaged under a stronger blast load. In usual
practice, LG is designed to fail by tearing of the interlayer, and the interlayer
properties should therefore be analysed carefully, when designing LG under blast
loads.
The design standard ASTM F 2248-09 (2010b) incorporates the charts given in the
ASTM E 1300-09a (2009) to determine the required glass pane thickness for
designing LG under blast loads. However, the charts available in ASTM E 1300-09a
(2009) were developed only for LG panels having PVB as the interlayer material,
without accounting for the thickness of the interlayer. This standard therefore does
not account for the effects due to the variations of the thickness of the interlayer and
also the effects of different interlayer materials with varied material properties for the
blast response of LG panels. According to the UFC 4-010-01 (2013), LG used in
blast resistant glazing should have an interlayer with at least 0.76 mm thickness.
However, there is a limited understanding on the effects of geometric and material
properties of the interlayer on the blast performance of LG panels. A parametric
study was therefore carried out, by varying the thickness and Young’s modulus (E)
of the interlayer, to investigate their influence on the performance of a LG panel
under different blast loads.
6.2 PARAMETRIC STUDY
A LG panel with a length of 1.1 m and a width of 0.9 m was used for the study; it has
two annealed glass panes, each of 3 mm thickness connected with a PVB interlayer.

114 Chapter 6: Effects of Interlayer Properties on the Blast Performance of LG
The PVB interlayers are usually manufactured in 0.38 mm thick sheets, and hence
different FE models were developed by using interlayers having 0.76, 1.14, 1.52, 1.9
and 2.28 mm thickness. The Young’s modulus (E) of the interlayer was used as 530
MPa in the previous analysis, but it was varied by -50%, -25%, 25% and 50% in this
study, where the corresponding E values are 265, 398, 662 and 795 MPa
respectively. The LG panel was considered to have structural silicone sealant joints
with 10 mm width and 5 mm thickness in accordance with ASTM F 2248-09
(2010b). The effects of the parametric variations of the interlayer on the performance
of the LG panel were studied under the two different blast loads, treated in Chapter 5.
The weaker blast load has a reflected overpressure of about 31 kPa, positive load
duration of about 12.3 ms, and a reflected impulse of about 150 kPa-ms; the
corresponding parameters for the stronger blast load are 70 kPa, 10.3 ms and 270
kPa-ms respectively. The reflected blast overpressure time-history curves of the blast
loads were shown in Figure 5-1.
6.2.1 FE Modelling
FE modelling was carried out as in the procedure presented in Chapter 3. The LG
panel used in this study was identical with that used in Chapter 5, and hence a FE
model similar to that shown in Figure 5-2 was used. However, different FE models
were created, by varying the thickness of the interlayer for the parametric study.
Glass, interlayer and sealant joints were incorporated into the FE model, where the
sealant joints were fixed to a rigid base by neglecting the deformations in the frame
for simplicity. The blast loads were applied as pressure loads on the front glass pane
and only one-quarter of the LG panel was modelled, accounting for symmetry.
6.2.2 Material Properties
Material properties used in the analysis were explained in Section 2.5. Material
properties of glass were given in Table 2-3, and the JH-2 material constants required
for the material model 110 were given in Table 3-2. Results from previous studies
showed that the tensile strength (T) of glass should be about 60-65 MPa for annealed
glass. However, it was taken as 60 MPa in the analysis as a conservative approach.
The Young’s modulus of the interlayer was changed between 265-795 MPa in the
analysis for the parametric study. The intention of changing E of the interlayer was to
investigate the influence of the interlayer stiffness on the blast response of the LG

Chapter 6: Effects of Interlayer Properties on the Blast Performance of LG 115
panel. The yield stress and the failure stress of the interlayer were also changed
proportionally with the change of Young’s modulus. However, yield strain and
failure strain of the interlayer were kept constant at 0.02 and 2 respectively in the
analysis. Bennison et al. (2005) studied the stress-strain variation of PVB under high
strain rates. It was evident from their study that the failure strain of PVB is
approximately about 2 irrespective of change in the E. The yield strain of PVB with a
E of 530 MPa is about 0.02 as mentioned in the literature (Hidallana-Gamage et al.,
2013b; 2014a). It was assumed that the yield strain of interlayer does not change with
its E, similar to that of failure strain. Material properties used in the analysis for the
interlayer are given in Table 6-1. Material properties used in the analysis for the
structural silicone sealant joints were given in Table 2-6, and the corresponding
stress-strain behaviour was illustrated in Figure 2-16.
Table 6-1: Material properties of PVB interlayer used in the parametric study
6.3 RESULTS FROM THE PARAMETRIC STUDY
The parametric study was carried out with the developed FE models, by varying the
thickness and the stiffness of the interlayer. Results from the FE analysis for centre
deflection, energy absorption and support reaction at the middle of the long edge
(RL), are discussed under the selected blast loads and are also summarised in Table
6-2 and 6-3. Results obtained for LG panels with varied interlayer properties are
compared with that having a PVB interlayer with 1.52 mm thickness and an E of 530
MPa, and the calculated percentage variations are given within brackets in Table 6-2
and 6-3. The failure of the glass panes and the interlayer is discussed only under the
stronger blast load, as the LG panels have less damage under the weaker blast load.
6.3.1 Effects of the Thickness (t) of the Interlayer
Five different LG panels with 0.76, 1.14, 1.52, 1.9 and 2.28 mm thick interlayers
were used in the analysis, while taking their Young’s modulus (E) as 530 MPa.
Material property Interlayer Young’s modulus (E)
265 MPa 398 MPa 530 MPa 662 MPa 796 MPa
Density (ρ) 1100 kg/m3 1100 kg/m3 1100 kg/m3 1100 kg/m3 1100 kg/m3
Poisson’s ratio (υ) 0.485 0.485 0.485 0.485 0.485
Yield stress 5.5 MPa 8.25 MPa 11 MPa 13.75 MPa 16.5 MPa
Failure stress 14 MPa 21 MPa 28 MPa 35 MPa 42 MPa
Failure strain 2 2 2 2 2

116 Chapter 6: Effects of Interlayer Properties on the Blast Performance of LG
Results from the FE analysis for centre deflection, total energy absorption, support
reaction at the middle of the long edge (RL), fracture of glass panes, stress-strain
behaviour of the interlayer and the component energy absorptions are compared
under the chosen blast loads. The results are discussed below and are also
summarised in Table 6-2.
Table 6-2: Comparison of results for different thicknesses (t) of the interlayer.
Thickness
(mm)
Maximum deflection
(mm)
Maximum energy
absorption (J)
Maximum support reaction
(RL) (kN/m)
Weaker blast load
Stronger blast load
Weaker blast load
Stronger blast load
Weaker blast load
Stronger blast load
0.76 42.3
(24.4%)
207.8
(87.9%)
72.4
(14.6%)
311.5
(11.6%)
10.2
(-9.7%)
11.8
(-4.2%)
1.14 37.8
(11.2%)
164.2
(48.5%)
67.8
(7.3%)
297.6
(6.6%)
10.6
(-6.2%)
12.2
(-0.8)
1.52 34 110.6 63.2 279.1 11.3 12.3
1.9 32.2
(-5.3%) 95.7
(-13.5%) 58.7
(-7.1%) 262.2
(-6.1%) 12.2 (8%)
13.7 (11.4%)
2.28 29
(-14.7%)
79.8
(-27.8%)
56.3
(-10.9%)
256
(-8.3%)
12.4
(9.7%)
14.6
(18.7%)
Centre deflection
Figure 6-1(a) compares the deflection-time histories at the centre of the LG panel, for
different interlayer thicknesses under the weaker blast load. Deflection-time history
curves are identical up to about 8 ms, and then deviate from each other thereafter.
Maximum deflections obtained from the LG panels with 0.76, 1.14, 1.52 1.9 and
2.28 mm thick interlayers are about 42.3, 37.8, 34, 32.2 and 29 mm respectively.
Figure 6-1(b) compares these variations under the stronger blast load and the
corresponding maximum deflections of the LG panels are about 207.8, 164.2, 110.6,
95.7 and 79.8 mm respectively. The LG panels with 0.76 and 1.14 mm thick
interlayers show significant increase in the centre deflection under the stronger blast
load.
Figure 6-2 compares the variation of the maximum deflection at the centre of the LG
panel, with the interlayer thickness under the blast loads. Maximum deflection shows
an approximately linear variation with the interlayer thickness under the weaker blast
load, where it slightly increases with the reduction of the interlayer thickness.
However, it increases significantly with the reduction of the interlayer thickness
under the stronger blast load. There is a sudden increase in the maximum deflection

Chapter 6: Effects of Interlayer Properties on the Blast Performance of LG 117
-10
0
10
20
30
40
50
0 5 10 15 20 25 30
Defl
ecti
on
(m
m)
Time (ms)
t = 0.76 mm
t = 1.14 mm
t = 1.52 mmt = 1.9 mmt = 2.28 mm
0
50
100
150
200
250
0 5 10 15 20 25 30
Defl
ecti
on
(m
m)
Time (ms)
t = 0.76 mmt = 1.14 mmt = 1.52 mmt = 1.9 mmt = 2.28 mm
0
50
100
150
200
250
0 0.5 1 1.5 2 2.5
Maxim
um
defl
ecti
on
(m
m)
Interlayer thickness (mm)
Weaker
Stronger
when the thickness of the interlayer reduces below 1.52 mm under the stronger blast
load. This value of thickness (about 1.52 mm) can be identified as the critical
interlayer thickness for the chosen interlayer E, where the interlayer could fail when
its thickness reduces below the critical value. Overall, it is evident that the interlayer
thickness has a more significant impact on the centre deflection of the LG panel
under the stronger blast load, than under the weaker blast load.
(a) Under weaker blast load
(b) Under stronger blast load
Figure 6-1: Variation of the deflection at the centre with time for different thicknesses (t) of the
interlayer (E = 530 MPa)
Figure 6-2: Variation of the maximum deflection at the centre with the interlayer thickness
Total energy absorption
Figure 6-3(a) compares variation of the total energy absorption of the FE model with
time for different thicknesses of the interlayer under the weaker blast load. Maximum
energy absorptions of the FE models with 0.76, 1.14, 1.52, 1.9 and 2.28 mm thick
interlayers are about 72.4, 67.8, 63.2, 58.7 and 56.3 J respectively. Figure 6-3(b)
compares these variations under the stronger blast load and the corresponding values
of energy absorption of the FE models are about 311.5, 297.6, 279.1, 262.2 and 256 J
respectively.

118 Chapter 6: Effects of Interlayer Properties on the Blast Performance of LG
0
10
20
30
40
50
60
70
80
0 5 10 15 20
En
erg
y a
bso
rp
tio
n (
J)
Time (ms)
t = 0.76 mmt = 1.14 mmt = 1.52 mmt = 1.9 mmt = 2.28 mm
0
50
100
150
200
250
300
350
0 5 10 15 20
En
erg
y a
bso
rp
tio
n (
J)
Time (ms)
t = 0.76 mmt = 1.14 mmt = 1.52 mmt = 1.9 mmt = 2.28 mm
0
50
100
150
200
250
300
350
0 0.5 1 1.5 2 2.5
Maxim
um
en
erg
y a
bso
rp
tio
n
(J)
Interlayer thickness (mm)
Weaker
Stronger
Figure 6-4 compares the variation of the maximum energy absorption of the FE
model with the thickness of the interlayer under the blast loads. LG panels with
thinner interlayers have high deflections and hence, show an increase in the energy
absorption under both blast loads. The variation of the energy absorption is
approximately linear under both blast loads, where it slightly reduces with the
increase of the interlayer thickness.
(a) Under weaker blast load
(b) Under stronger blast load
Figure 6-3: Variation of the total energy absorption of the FE models with time for different
thicknesses (t) of the interlayer (E = 530 MPa)
Figure 6-4: Variation of the maximum energy absorption of the FE models with the interlayer
thickness
Support reaction (RL)
Figure 6-5(a) compares the variation of the support reaction at the middle of the long
edge (RL) of the LG panel with time for different thicknesses of the interlayer under
the weaker blast load. Maximum RL obtained from the LG panels with 0.76, 1.14,
1.52, 1.9 and 2.28 mm thick interlayers are about 10.2, 10.6, 11.3, 12.2 and 12.4
kN/m respectively. Figure 6-5(b) compares these variations under the stronger blast
load and the corresponding values of RL of the LG panels are about 11.8, 12.2, 12.3,
13.7 and 14.6 kN/m respectively. Initially, RL increases suddenly and reaches its

Chapter 6: Effects of Interlayer Properties on the Blast Performance of LG 119
-2
0
2
4
6
8
10
12
14
0 5 10 15 20
Su
pp
ort
reacti
on
(k
N/m
)
Time (ms)
w = 0.76 mm
w = 1.14 mm
w = 1.52 mm
w = 1.9 mm
w = 2.28 mm
0
2
4
6
8
10
12
14
16
0 5 10 15 20
Su
pp
ort
reacti
on
(k
N/m
)
Time (ms)
t = 0.76 mm
t = 1.14 mm
t = 1.52 mm
t = 1.9 mm
t = 2.28 mm
0
2
4
6
8
10
12
14
16
0 0.5 1 1.5 2 2.5
Maxim
um
su
pp
ort
reacti
on
(kN
/m)
Interlayer thickness (mm)
Weaker
Stronger
maximum during 5-8 ms, and then it reduces gradually with time, with many
fluctuations under both blast loads.
Figure 6-6 compares the variation of the maximum RL of the LG panel with the
thickness of the interlayer under the blast loads. The maximum RL increases
gradually, with the increase of the interlayer thickness under the weaker blast load. It
shows a slight increase when the thickness of the interlayer increases from 0.76 mm
to 1.52 mm under the stronger blast load, but then it shows a sudden increase (about
18.7%) when the interlayer thickness increases from 1.52mm to 2.28 mm. Overall,
the increase in the thickness of the interlayer increases the support reactions under
both blast loads.
(a) Under weaker blast load
(b) Under stronger blast load
Figure 6-5: Variation of the support reaction, RL with time for different thicknesses (t) of the
interlayer (E = 530 MPa)
Figure 6-6: Variation of the maximum support reaction, RL with the interlayer thickness

120 Chapter 6: Effects of Interlayer Properties on the Blast Performance of LG
Fracture of glass panes
The thickness of the interlayer has a considerable impact on the behaviour of the LG
panel under the stronger blast load, under which the failure of glass and interlayer
were studied here. Figure 6-7 compares the fracture of the front glass pane under the
stronger blast load for the FE models with different interlayer thicknesses at the time
of their maximum deflections, while that of the back glass pane is shown in Figure 6-
8. It is evident that both front and back glass panes have similar fracture patterns for
a given interlayer thickness, but the back glass panes have slightly more fracture
lines compared to the front glass panes. This could be expected, as the back glass
panes attract more tensile stresses, compared to the front glass panes when the LG
panels deflect backward under blast loads. The LG panel with 0.76 mm thick
interlayer, is subjected to a larger deflection and hence has wider fracture lines than
the other LG panels. The width of the fracture lines reduces with the increase of the
interlayer thickness. The LG panels with thicker interlayers have fracture lines
everywhere in the glass panes, while those with thinner interlayers have fractured
only at the critical locations. The increase in the E of the interlayer seems to increase
the load carrying capacity of the interlayer as well as the LG panel avoiding its
failure at the critical locations.
(a) t = 0.76 mm at 25 ms (b) t = 1.14 mm at 23 ms (c) t = 1.52 mm at 15 ms
(d) t = 1.9 mm at 13 ms (e) t = 2.28 mm at 12 ms
Figure 6-7: Fracture of the front glass pane for different thicknesses (t) of the interlayer under the
stronger blast load (E = 530 MPa)

Chapter 6: Effects of Interlayer Properties on the Blast Performance of LG 121
(a) t = 0.76 mm at 25 ms (b) t = 1.14 mm at 23 ms (c) t = 1.52 mm at 15 ms
(d) t = 1.9 mm at 13 ms (e) t = 2.28 mm at 12 ms
Figure 6-8: Fracture of the back glass pane for different thicknesses (t) of the interlayer under the
stronger blast load (E = 530 MPa)
Failure analysis of the interlayer
Figure 6-9 compares the plastic strain variation at the bottom surface of the interlayer
for the FE models with different interlayer thicknesses under the stronger blast load
at the time of their maximum deflections. When the glass fractures, the interlayer
attracts high stresses along the fracture lines where it has high plastic strains, as seen
for all the LG panels. The interlayer with 0.76 mm thickness has torn along the two
failure lines as seen in Figure 6-9(a). The results from the stress analysis indicated
that the von Mises stress (σv) of most interlayer elements along the failure lines of
that LG panel have reached their failure stress, which is about 28 MPa. The
interlayers with 1.14 and 1.52 mm thickness have reached their failure stress at only
a few locations along the failure lines, while those with 1.9 and 2.28 mm thickness
have yielded along the failure lines, but none of the elements have reached their
failure stress. It is evident that the increase in the thickness of the interlayer improves
the stress distribution in the interlayer as well as the glass panes, rather than creating
failure at a few locations.
(a) t = 0.76 mm at 25 ms (b) t = 1.14 mm at 23 ms (c) t = 1.52 mm at 15 ms

122 Chapter 6: Effects of Interlayer Properties on the Blast Performance of LG
0
20
40
60
80
100
120
140
160
180
0 5 10 15 20 25 30
En
erg
y a
bso
rp
tio
n (
J)
Time (ms)
Glass
Interlayer
Sealant
0
20
40
60
80
100
120
140
160
180
0 5 10 15 20 25 30
En
erg
y a
bso
rp
tio
n (
J)
Time (ms)
Glass
Interlayer
Sealant
(d) t = 1.9 mm at 13 ms (e) t = 2.28 mm at 12 ms
Figure 6-9: Plastic strain variation at the bottom surface of the interlayer for different thicknesses (t)
of the interlayer under the stronger blast load (E = 530 MPa)
Component energy absorptions
The energy absorption of different components in the FE model including glass,
interlayer and structural sealant joints are compared only under the stronger blast
load, which caused considerable damage to the interlayer. Figure 6-10 compares
these variations for different thicknesses of the interlayer. Glass panes in the LG
panels absorb most of the energy initially, but they show reduction in the energy
absorption after they fracture under the blast load. This causes a sudden increase in
the energy absorption of the interlayer, which is the preferred failure mode. It is
evident that the LG panels have achieved the preferred failure mode irrespective of
the change in the interlayer thickness. When the interlayer thickness increases, there
is a reduction in the energy absorption in the glass panes and the sealant joints. The
interlayer with a 0.76 mm thickness has slightly less energy absorption compared to
those with 1.14 and 1.52 mm thickness. This could be probably due to the failure of
the interlayer without absorbing much energy. The interlayer with a 2.28 mm
thickness also shows reduction in the energy absorption, which might be due to the
reduction in the deflection of the LG panel. The interlayers with 1.14 and 1.52 mm
thickness are therefore preferred for the LG panel for the stronger blast load
considered in this study.
(a) t = 0.76 mm (b) t = 1.14 mm

Chapter 6: Effects of Interlayer Properties on the Blast Performance of LG 123
0
20
40
60
80
100
120
140
160
180
0 5 10 15 20 25 30
En
erg
y a
bso
rp
tio
n (
J)
Time (ms)
Glass
Interlayer
Sealant
0
20
40
60
80
100
120
140
160
0 5 10 15 20 25 30
En
erg
y a
bso
rp
tio
n (
J)
Time (ms)
Glass
Interlayer
Sealant
(c) t = 1.52 mm (d) t = 2.28 mm
Figure 6-10: Energy absorption of the different components of the FE model for different interlayer
thicknesses under the stronger blast load
6.3.2 Effects of the Young’s Modulus (E) of the Interlayer
Five different FE models with interlayers having Young’s moduli (E) of 265, 398,
530, 662, and 795 MPa were used in the analysis, while taking the thickness of the
interlayer as 1.52 mm. Results from the FE analysis for centre deflection, total
energy absorption, support reaction at the middle of the long edge (RL), fracture of
glass panes, stress-strain behaviour of the interlayer and component energy
absorptions were compared under the chosen blast loads. The results are discussed
below and are also summarised in Table 6-3. The percentage variations given in
Table 6-3 were calculated by comparing the results from LG panels with interlayers
having different E with that of 530 MPa.
Table 6-3: Comparison of results for different Young’s moduli (E) of the interlayer.
Young’s
modulus (E)
Maximum deflection (mm)
Maximum energy absorption (J)
Maximum support reaction (RL) (kN/m)
Weaker
blast load
Stronger
blast load
Weaker
blast load
Stronger
blast load
Weaker
blast load
Stronger
blast load
265
(50%)
40.7
(19.7%)
176.2
(59.3%)
66.1
(4.6%)
297.5
(6.6%)
10.1
(-10.6%)
12
(-2.4%)
398
(25%)
35.6
(4.7%)
150.6
(36.2%)
65.2
(3.2%)
284.4
(1.9%)
10.8
(-4.4%)
12.1
(-1.6%)
530 34 110.6 63.2 279.1 11.3 12.3
662
(25%)
28.6
(-15.9%)
98.3
(-11.1%)
60.9
(-3.6%)
272.8
(-2.3%)
11.6
(2.7%)
13.6
(10.6%)
795
(50%)
28.2
(-17.1%)
84.8
(-23.3%)
60.7
(-4%)
268.5
(-3.8%)
11.8
(4.4%)
14.8
(20.3%)

124 Chapter 6: Effects of Interlayer Properties on the Blast Performance of LG
-10
0
10
20
30
40
50
0 5 10 15 20 25 30
Defl
ecti
on
(m
m)
Time (ms)
E = 265 MPaE = 398 MPaE = 530 MPaE = 662 MPaE = 795 MPa
0
20
40
60
80
100
120
140
160
180
200
0 5 10 15 20 25 30
Defl
ecti
on
(m
m)
Time (ms)
E = 265 MPaE = 398 MPaE = 530 MPaE = 662 MPaE = 795 MPa
Centre deflection
Figure 6-11(a) compares the deflection-time histories at the centre of the LG panel
for different Young’s moduli (E) of the interlayer under the weaker blast load.
Deflection time-history curves are identical up to about 9 ms and then deviate from
each other thereafter. Maximum deflections obtained from the LG panels with
interlayers having E of 265, 398, 530, 662 and 795 MPa are about 40.7, 35.6, 34,
28.6 and 28.2 mm respectively. Figure 6-11(b) compares these variations under the
stronger blast load and the corresponding maximum deflections of the LG panels are
about 176.2, 150.6, 110.6, 98.3 and 84.8 mm respectively.
Figure 6-12 compares the variation of maximum deflection at the centre of the LG
panel with the E of the interlayer under the chosen blast loads. Maximum deflection
shows an approximately linear variation with the E of the interlayer under the weaker
blast load, where it slightly increases with the reduction of the E of the interlayer.
However, it increases significantly with the reduction of the E of the interlayer under
the stronger blast load. The LG panel with a interlayer having E of 265 MPa shows
about 59.3% increase in the maximum deflection under the stronger blast load, while
it is about 19.7% under the weaker blast load, compared to those obtained from the
LG panels with a interlayer having E of 530 MPa. There is a sudden increase in the
maximum deflection when the E of the interlayer reduces below 530 MPa under the
stronger blast load. This value of E (about 530 MPa) can be identified as the critical
interlayer Young’s modulus for the chosen interlayer thickness, where the interlayer
could fail when E of that reduces below the critical value.
(a) Under weaker blast load
(b) Under stronger blast load
Figure 6-11: Variation of the deflection at the centre with time for different Young’s moduli (E) of the
interlayer (t = 1.52 mm)

Chapter 6: Effects of Interlayer Properties on the Blast Performance of LG 125
0
10
20
30
40
50
60
70
0 5 10 15 20
En
erg
y a
bso
rp
tio
n (
J)
Time (ms)
E = 265 MPa
E = 398 MPa
E = 530 MPa
E = 662 MPa
E = 795 MPa0
50
100
150
200
250
300
0 5 10 15 20
En
erg
y a
bso
rp
tio
n (
J)
Time (ms)
E = 265 MPa
E = 398 MPa
E = 530 MPa
E = 662 MPa
E = 795 MPa
0
40
80
120
160
200
200 300 400 500 600 700 800
Maxim
um
defl
ecti
on
(m
m)
Interlayer Young's modulus (MPa)
Weaker
Stronger
Figure 6-12: Variation of the maximum deflection at the centre with the E of the interlayer
Total energy absorption
Figure 6-13(a) compares variation of the total energy absorption of the FE model
with time for different Young’s moduli (E) of the interlayer under the weaker blast
load. Maximum energy absorptions obtained from the FE models with an interlayer
having E of 265, 398, 530, 662 and 795 MPa are about 66.1, 65.2, 63.2, 60.9 and
60.7 J respectively. Figure 6-13(b) compares these variations under the stronger blast
load and the corresponding maximum energy absorptions obtained from the FE
models are about 297.5, 284.4, 279.1, 272.8 and 268.5 J respectively. Energy
absorption dramatically increases until about 8-10 ms, reaches a maximum value and
then remains reasonably constant thereafter under both blast loads.
(a) Under weaker blast load
(b) Under stronger blast load
Figure 6-13: Variation of the total energy absorption of the FE model with time for different Young’s
moduli (E) of the interlayer (t = 1.52 mm)
Figure 6-14 shows the variation of the maximum energy absorption of the FE model
with the E of the interlayer under the chosen blast loads. Maximum energy
absorption shows an approximately linear variation with the E of the interlayer under
both blast loads, where it slightly increases with the reduction of the E of the

126 Chapter 6: Effects of Interlayer Properties on the Blast Performance of LG
0
50
100
150
200
250
300
350
200 300 400 500 600 700 800
Maxim
um
en
erg
y a
bso
rp
tio
n
(J)
Interlayer Young's modulus (MPa)
Weaker
Stronger
0
2
4
6
8
10
12
14
0 5 10 15 20
Su
pp
ort
reacti
on
(k
N/m
)
Time (ms)
E = 265 MPa
E = 398 MPa
E = 530 MPa
E = 662 MPa
E = 795 MPa
0
2
4
6
8
10
12
14
16
0 5 10 15 20
Su
pp
ort
reacti
on
(k
N/m
)
Time (ms)
E = 265 MPaE = 398 MPaE = 530 MPaE = 662 MPaE = 795 MPa
interlayer. Overall, it is evident that the energy absorption of the LG panel is less
sensitive to the change in the E of interlayer under both blast loads.
Figure 6-14: Variation of the maximum energy absorption of the FE model with the E of the interlayer
Support reaction (RL)
Figure 6-15(a) compares the variation of the support reaction at the middle of the
long edge (RL) of the LG panel with time for different Young’s moduli (E) of the
interlayer under the weaker blast load. Maximum RL obtained from the FE models
with an interlayer having E of 265, 398, 530, 662 and 795 MPa are about 10.1, 10.8,
11.3, 11.6 and 11.8 kN/m respectively. Figure 6-15(b) compares these variations
under the stronger blast load and the corresponding maximum RL of the LG panels
are about 12, 12.1, 12.3, 13.6 and 14.8 kN/m respectively. Initially, RL increases
suddenly and reaches its maximum during 5-8 ms and then it reduces gradually with
time, with many fluctuations under both blast loads.
(a) Under weaker blast load
(b) Under stronger blast load
Figure 6-15: Variation of the support reaction, RL with time for different Young’s moduli (E) of the
interlayer (t = 1.52 mm)

Chapter 6: Effects of Interlayer Properties on the Blast Performance of LG 127
0
2
4
6
8
10
12
14
16
200 300 400 500 600 700 800
Maxim
um
su
pp
ort
reacti
on
(kN
/m)
Interlayer Young's modulus (MPa)
Weaker
Stronger
Figure 6-16 shows the variation of the maximum RL of the LG panel with the E of
the interlayer under the chosen blast loads. Maximum RL is less influenced by the E
of the interlayer under the weaker blast load, where it increases gradually with the
increase in the E of the interlayer. Maximum RL shows a smaller increase when the E
of the interlayer increases from 265 MPa to 530 MPa under the stronger blast load,
but it shows a higher increase (about 20.3%) when the E of the interlayer increases
from 530 MPa to 795 MPa. It is evident that the increase in the E of the interlayer
increases the support reactions under both blast loads.
Figure 6-16: Variation of the maximum support reaction, RL with the E of the interlayer
Fracture of glass panes
The failure of the glass panes and the interlayer were studied only under the stronger
blast load, as they have less impact under the weaker blast load. Figure 6-17
compares the fracture of the front glass pane under the stronger blast load for the LG
panels with different interlayer Young’s moduli (E) at the time of their maximum
deflections, while that of the back glass pane is shown in Figure 6-18. Both front and
back glass panes have similar fracture patterns for a given E of the interlayer, but the
back glass panes have slightly more fracture lines, compared to the front glass panes.
This could be expected, as the back glass panes attract more tensile stresses
compared to the front glass panes, when the LG panels deflect inward under blast
loads. The LG panel with an interlayer having the lowest E is subjected to the largest
deflection, and hence has wider fracture lines than the other LG panels. The width of
the fracture lines reduces with the increase of the E of the interlayer. The LG panels
with high E have fracture lines everywhere in the glass panes, while those with low E
have fractured only at the critical locations. The use of interlayers having high E
seems to improve the stress distribution in the glass panes.

128 Chapter 6: Effects of Interlayer Properties on the Blast Performance of LG
(a) E = 265 MPa at 22 ms (b) E = 398 MPa at 22 ms (c) E = 530 MPa at 15 ms
(d) E = 662 MPa at 12.5 ms (e) E = 795 MPa at 12 ms
Figure 6-17: Fracture of the front glass panes for different Young’s moduli (E) of the interlayer under
the stronger blast load (t = 1.52 mm)
(a) E = 265 MPa at 22 ms (b) E = 398 MPa at 22 ms (c) E = 530 MPa at 15 ms
(d) E = 662 MPa at 12.5 ms (e) E = 795 MPa at 12 ms
Figure 6-18: Fracture of the back glass panes for different Young’s moduli (E) of the interlayer under
the stronger blast load (t = 1.52 mm)
Failure analysis of the interlayer
Figure 6-19 compares the plastic strain variation at the bottom surface of the
interlayer for the LG panels, with different E of interlayer under the stronger blast
load at the time of their maximum deflections. When the glass fractures, the
interlayer attracts high stresses along the fracture lines where it has high plastic
strains as seen for all the LG panels. The interlayers having E of 265 and 398 MPa
have torn along the two major failure lines where they have high plastic strains, as
shown in Figures 6-19(a) and 6-19(b). Results from the stress analysis indicated that

Chapter 6: Effects of Interlayer Properties on the Blast Performance of LG 129
the von Mises stress (σv) of most of the interlayer elements along the major failure
lines in those LG panels have reached their failure stresses, which are about 14 and
21 MPa respectively. The interlayer having E of 530 MPa, has reached its failure
stress of about 28 MPa at a few locations only, along the failure lines. The interlayers
having E of 662 and 795 MPa have failure stresses of about 35 and 42 MPa
respectively. They have yielded along the failure lines, but none of the elements have
reached their failure stresses. It is evident that the increase in the E of the interlayer
improves the stress distribution on the interlayer as well as the glass panes, rather
than creating failure at a few locations.
(a) E = 265 MPa at 22 ms (b) E = 398 MPa at 22 ms (c) E = 530 MPa at 15 ms
(d) E = 662 MPa at 12.5 ms (e) E = 795 MPa at 12 ms
Figure 6-19: Plastic strain variation at the bottom surface of the interlayer for different Young’s
moduli (E) of the interlayer under the stronger blast load (t = 1.52 mm)
Component energy absorptions
The energy absorption of different components in the FE model, including glass,
interlayer and structural sealant joints are compared under the stronger blast load,
and these variations for different Young’s moduli (E) of the interlayer are shown in
Figure 6-20. Glass panes in the FE models absorb most of the energy initially, but
they show reduction in the energy absorption after they fracture under the blast load.
This causes a sudden increase in the energy absorption of the interlayer, which is the
preferred failure mode. It is evident that the LG panels have achieved the preferred
failure mode irrespective of the change in the E of the interlayer. When the E of the
interlayer increases, there is a slight reduction in the energy absorption in the glass
panes and the sealant joints, which might be due to the reduction in the deflection

130 Chapter 6: Effects of Interlayer Properties on the Blast Performance of LG
0
20
40
60
80
100
120
140
160
180
0 5 10 15 20 25 30
En
erg
y a
bso
rp
tio
n (
J)
Time (ms)
Glass
Interlayer
Sealant
0
20
40
60
80
100
120
140
160
180
0 5 10 15 20 25 30
En
erg
y a
bso
rp
tio
n (
J)
Time (ms)
Glass
Interlayer
Sealant
0
20
40
60
80
100
120
140
160
180
0 5 10 15 20 25 30
En
erg
y a
bso
rp
tio
n (
J)
Time (ms)
Glass
Interlayer
Sealant
(a) E = 265 MPa (b) E = 530 MPa
(c) E = 795 MPa
Figure 6-20: Energy absorption of the components in the FE model for different interlayer Young’s
moduli (E) under the stronger blast load
6.4 DISCUSSION
The thickness of the interlayer was varied between 0.76-2.28 mm in the analysis,
while taking its Young’s modulus as 530 MPa. The interlayer thickness has a
considerable influence on the centre deflection of the LG panel under the stronger
blast load. The LG panels with 0.76 and 1.14 mm thick interlayers have considerably
high deflections under the stronger blast load where the percentage increases in the
maximum deflections are about 87.9% and 48.5% respectively, compared to that
with a 1.52 mm thick interlayer. The increase in the deflections was due to the failure
of the interlayer and this was confirmed by analysing the stresses at the failure
locations. It is therefore evident that the LG panels with 0.76 and 1.14 mm thick
interlayers have reached their capacity under the stronger blast load, which is below
the design blast load of the LG panel according to the design standards.
LG panels with 1.9 and 2.28 mm thick interlayers have improved the stress
distribution on both glass and interlayer, while minimising the damage to the
interlayer. The use of thicker interlayers increases the load carrying capacity of LG,

Chapter 6: Effects of Interlayer Properties on the Blast Performance of LG 131
and hence, at least a 1.52 mm thick interlayer could be recommended for the chosen
LG panel. Results showed that the increase in the interlayer thickness reduces the
deflection, and hence, the energy absorption of a LG panel. This increases the energy
transferred to the supports by increasing the support reactions. LG panel with a 2.28
mm thick interlayer reduces the energy absorption by 9.7% and increases the support
reaction by 18.7%, compared to that with a 1.52 mm thick interlayer under the
stronger blast load. On the other hand, use of thicker interlayers increases the total
thickness of the LG panel, and hence, the size of the required framing members. It is
therefore not recommended to increase the interlayer thickness unnecessarily, where
the interlayers with 1.14 and 1.52 mm thicknesses are the best preferred for the LG
panel when subjected to the stronger blast load.
The Young’s modulus (E) of the interlayer was varied between 265-795 MPa in the
analysis, while taking its thickness as 1.52 mm. The E of the interlayer has a
considerable influence on the centre deflection of the LG panel under the stronger
blast load. The LG panels with interlayers having E of 265 and 398 MPa have very
high deflections, where their percentage increases are about 59.3% and 36.2%
respectively, compared to that with a interlayer having E of 530 MPa. Similarly, the
increase in the deflections was due to the failure of the interlayer and this was
confirmed by analysing the stresses at the failure locations. The LG panels with an
interlayer having higher E have improved the stress distribution on both glass and
interlayer, while minimising the damage to the interlayer. The LG panels with stiffer
interlayers having higher E, therefore have higher load carrying capacity than those
with smaller E. The increase in the E of the interlayer reduces the deflection and
hence the energy absorption, while increasing the support reactions. The LG panel
with an interlayer having E of 795 MPa reduces the energy absorption by 3.8%,
while increasing the support reaction by 20.3%, compared to that with an E of 530
MPa under the stronger blast load. Overall, the change in the E of the interlayer has a
small influence on the energy absorption, but has a slightly high influence on the
support reaction.
Results from the FE analysis indicated that the LG panels with thicker interlayers
perform similarly to those with thinner interlayers having a high E. As an example,
LG panel, with an interlayer having a thickness of 2.28 mm and a E of 530 MPa,
performed similarly to that with interlayer having a thickness of 1.52 mm and a E of

132 Chapter 6: Effects of Interlayer Properties on the Blast Performance of LG
795 MPa. The use of thinner interlayers with higher E could, therefore, be a feasible
option when selecting an appropriate interlayer thickness for a LG. Design charts,
such as maximum deflection vs. interlayer thickness (as given in Figure 6-2), and
maximum deflection vs. interlayer Young’s modulus (as given in Figure 6-12), can
be developed to identify the critical interlayer thickness and E that cause failure of a
LG panel under a given blast load.
6.5 CHAPTER SUMMARY
This chapter presented the results from a parametric study, which was carried out to
investigate the influence of geometric and material properties of the interlayer on the
blast performance of a LG panel. In this study, the thickness and the Young’s
modulus (E) of the interlayer were varied and their effects on the centre deflection,
total energy absorption, support reactions, fracture of glass panes, stress-strain
behaviour of the interlayer, and the energy absorption of different components of the
LG panel were studied with the developed FE models. Results showed that the
thickness and Young’s modulus (E) of the interlayer have a considerable influence
on the failure behaviour and the load carrying capacity of LG panels, and therefore
they should be analysed carefully when designing LG panels under blast loads.
This chapter concludes that the LG panels with interlayers having high thickness and
Young’s modulus (E) improve the stress distribution in the entire LG panel, while
increasing their load carrying capacity. However, they have slightly less energy
absorptions and slightly high support reactions compared to those with opposite
properties. The use of thicker interlayers increases the total thickness of the LG panel
and hence, increases the size of the required framing members. This could be
avoided by using thinner interlayers with higher E, as both have similar
performances under a given blast load. The design charts, such as maximum
deflection vs. interlayer thickness and maximum deflection vs. interlayer Young’s
modulus could be used to identify the critical interlayer thickness and E causing the
failure of a LG under a given blast load. Research findings indicate that the
properties of the interlayer should be carefully analysed when designing LG under
blast loads, even though they are not properly addressed in the current design
standards.

Chapter 7: Effects of Sealant Properties on the Blast Performance of LG 133
Chapter 7: Effects of Sealant Properties on
the Blast Performance of LG
7.1 INTRODUCTION
Structural sealant joints play an important role in the blast response of a LG panel, as
they should be able to withstand the designed blast load, while transferring less force
to the supporting frame. Sealant joints should be able to hold a LG panel to the frame
until the panel fails by tearing of the interlayer. If the sealant joints fail before the
failure of the panel, the entire unit will be thrown into the building, causing a
significant hazard. Design standards such as ASTM F 2248-09 (2010b) provides
some useful information to design the required width and thickness of the structural
sealant joints. However, there is a limited understanding on the effects of geometric
and material properties of structural sealant joints on the blast performance of LG
panels. A parametric study was therefore carried out, by varying the width, thickness
and the Young’s modulus (E) of the structural silicone sealant joints to investigate
their influence on the performance of a LG panel under different blast loads.
7.2 PARAMETRIC STUDY
A LG panel with a length of 1.1 m, width of 0.9 m and a thickness of 7.52 mm (3
mm annealed glass + 1.52 mm PVB + 3 mm annealed glass) was used for the study.
According to ASTM F 2248-09 (2010b), the LG panel treated in this study should be
fixed to the frame using structural silicone sealant joints having a minimum thickness
of 5 mm and a width (bite) of 10-12 mm. However, during the present study, the
width of the silicone sealant joints was varied between 7.5-20 mm and their thickness
was varied between 4-7 mm. The Young’s modulus (E) of the silicone sealant was
varied between 1.0-3.4 MPa. The effects of these parametric variations on the
performance of the LG panel were studied under two different blast loads, as treated
in Chapters 5 and 6. The weaker blast load has a reflected overpressure of about 31
kPa, positive load duration of about 12.3 ms and a reflected impulse of about 150
kPa-ms and the corresponding parameters for the stronger blast load are 70 kPa, 10.3
ms and 270 kPa-ms respectively. The reflected blast overpressure time-history curves
of the blast loads were shown in Figure 5-1.

134 Chapter 7: Effects of Sealant Properties on the Blast Performance of LG
7.2.1 FE Modelling
FE modelling was carried out, as in the procedure outlined in Chapter 3. The LG
panel used in this study was identical with those used in Chapters 5 and 6, and hence
a FE model similar to that shown in Figure 5-2 was used in this study. However,
different FE models were created by varying the width and the thickness of the
structural sealant joints for the parametric study. Glass, interlayer and sealant joints
were incorporated into the FE model, where the sealant joints were fixed to a rigid
base by neglecting the deformations in the frame for simplicity. The blast loads were
applied as pressure loads on the front glass pane and only one-quarter of the LG
panel was modelled, accounting for symmetry.
7.2.2 Material Properties
Material properties used in the analysis were explained in Section 2.5. Material
properties of glass were given in Table 2-3 and the JH-2 material constants required
for the material model 110 were given in Table 3-2. The tensile strength (T) of glass
was taken as 60 MPa in the analysis as a conservative approach. Material properties
used in the analysis for the PVB interlayer were given in Table 2-5, and the
corresponding stress-strain behaviour was illustrated in Figure 2-14.
The sealant material used in blast resistant glazing should have a hardness of 40-60
IRHD, according to the BS EN 13541 (2001), where the corresponding Young’s
modulus (E) should be between 1.5-3.4 MPa. However, in the present study, the E of
the silicone sealant was varied between 1.0-3.4 MPa and its yield stress and failure
stress were also changed proportionally with the change of E. Material properties of
silicone sealant used in the analysis are given in Table 7-1 (Hidallana-Gamage et al.,
2014b).
Table 7-1: Material properties of silicone sealant used in the parametric study (Hidallana-Gamage et
al., 2014b)
Material property Sealant hardness
40 IRHD 50 IRHD 60 IRHD
Young’s modulus (E) 1.0 MPa 1.5 MPa 2.3 MPa 3.4 MPa
Density (ρ) 1100 kg/m3 1100 kg/m3 1100 kg/m3 1100 kg/m3
Poisson’s ratio (υ) 0.495 0.495 0.495 0.495
Yield stress 1 MPa 1.5 MPa 2.3 MPa 3.4 MPa
Failure stress 1.5 MPa 2.3 MPa 3.5 MPa 5.1 MPa
Failure strain 2.5 2.5 2.5 2.5

Chapter 7: Effects of Sealant Properties on the Blast Performance of LG 135
7.3 RESULTS FROM THE PARAMETRIC STUDY
The parametric study was carried out with the developed FE models by varying the
width, thickness and the stiffness of the structural sealant joints. Results from FE
analysis for centre deflection, total energy absorption and support reactions are
discussed under the selected blast loads and those are summarised in Table 7-2-7-4.
Results obtained for LG panels with varied sealant properties were compared with
that having sealant joints with 10 mm width, 5 mm thickness and a E of 2.3 MPa,
and the calculated percentage variations are given within brackets in Table 7-2-7-4.
7.3.1 Effects of the Width (w) of the Sealant Joints
Five different FE models with 7.5, 10, 12.5, 15 and 20 mm wide sealant joints were
used in the analysis, while taking their thickness and Young’s modulus (E) as 5 mm
and 2.3 MPa, respectively. It could be noted that, as the size of the entire LG panel
was kept at 1.1 m x 0.9 m in this study, the increase in the width of the sealant joints
slightly reduces the clear size of the LG panel. Results from the FE analysis for
centre deflection, total energy absorption and support reaction at the middle of the
long edge (RL), were compared under the chosen blast loads. The results are
discussed below and are also summarised in Table 7-2.
Table 7-2: Comparison of results for different widths (w) of the structural silicone sealant joints
Width
(mm)
Maximum deflection (mm) Maximum energy
absorption (J)
Maximum support reaction
(RL) (kN/m)
Weaker
blast load
Stronger
blast load
Weaker
blast load
Stronger
blast load
Weaker
blast load
Stronger
blast load
7.5 33.2
(-2.4%)
131.0
(18.4%)
65.1
(3.0%)
290.4
(4.0%)
10.6
(-6.2%)
11.3
(-8.1%)
10.0 34 110.6 63.2 279.1 11.3 12.3
12.5 32.8
(-3.5%)
100.6
(-9%)
62.4
(-1.3%)
270.6
(-3.0%)
12.6
(11.5%)
17.5
(42.3%)
15.0 32.4
(-4.7%)
98.1
(-11.3%)
62.0
(-1.9%)
268.4
(-3.8%)
12.7
(12.4%)
19.2
(56.1%)
20.0 24.5
(-27.9%)
95.4
(-13.7%)
45.6
(-27.8%)
243.3
(-12.8%)
12.9
(14.2%)
26
(111.4%)
Centre deflection
Figure 7-1(a) compares the deflection-time histories at the centre of the LG panel for
different widths of the structural sealant joints under the weaker blast load.
Maximum deflections obtained from the LG panels with 7.5, 10, 12.5, 15 and 20 mm
wide sealant joints are about 33.2, 34, 32.8, 32.4 and 24.5 mm respectively. Figure 7-

136 Chapter 7: Effects of Sealant Properties on the Blast Performance of LG
0
25
50
75
100
125
150
0 5 10 15 20 25 30
Defl
ecti
on
(m
m)
Time (ms)
w = 7.5 mmw = 10 mmw = 12.5 mmw = 15 mmw = 20 mm
0
20
40
60
80
100
120
140
5 7.5 10 12.5 15 17.5 20
Maxim
um
defl
ecti
on
(m
m)
Sealant width (mm)
Weaker
Stronger
1(b) compares these variations under the stronger blast load, and the corresponding
maximum deflections of the LG panels are about 131, 110.6, 100.6, 98.1 and 95.4
mm respectively. They are identical up to about 8 ms under the stronger blast load
and then deviate from each other considerably thereafter.
Figure 7-2 shows the variation of the maximum deflection at the centre of the LG
panel with the width of the sealant joints under the chosen blast loads. The deflection
at the centre reduces with the increase of width of the sealant joints under both blast
loads. However, when the width of the sealant joints reduces from 10 mm to 7.5 mm,
there is a slight reduction in the maximum deflection. The reduction in the width of
the sealant joints could increase the support flexibility, reducing the damage to the
glass panes, and hence this could slightly reduce the maximum deflection at the
centre. Overall, the variation of the centre deflection is quite sensitive to the width of
the sealant joints under the stronger blast load, compared to that under the weaker
blast load. There is a noticeable increase in the centre deflection when the width of
the sealant joints reduces below 12.5 mm under the stronger blast load.
(a) Under weaker blast load
(b) Under stronger blast load
Figure 7-1: Variation of the deflection at the centre with time for different widths (w) of sealant joints (t = 5 mm and E = 2.3 MPa)
Figure 7-2: Variation of the maximum deflection at the centre with the sealant width
0
5
10
15
20
25
30
35
0 5 10 15 20 25
Defl
ecti
on
(m
m)
Time (ms)
w = 7.5 mmw = 10 mmw = 12.5 mmw = 15 mmw = 20 mm

Chapter 7: Effects of Sealant Properties on the Blast Performance of LG 137
0
50
100
150
200
250
300
350
5 7.5 10 12.5 15 17.5 20
Maxim
um
en
erg
y a
bso
rp
tio
n
(J)
Sealant width (mm)
Weaker
Stronger
Total energy absorption
Figure 7-3(a) compares variation of the total energy absorption of the FE models
with time for different widths of the structural sealant joints under the weaker blast
load, and that under the stronger blast load is shown in Figure 7-3(b). Maximum
energy absorbed by the FE models with 7.5, 10, 12.5, 15 and 20 mm wide sealant
joints under the weaker blast load are about 65.1, 63.2, 62.4, 62 and 45.6 J
respectively, and those under the stronger blast load are about 290.4, 279.1, 270.6,
268.4 and 243.3 J respectively. The LG panels with 7.5-15 mm wide sealant joints
absorb similar amounts of energy, while that with a 20 mm sealant joints shows a
considerable reduction in the energy absorption; this is mostly seen under the weaker
blast load. Figure 7-4 compares the variation of the maximum energy absorption of
the FE models with the width of the sealant joints under the chosen blast loads.
Overall, it is clear that the increase in the width of the sealant joints reduces the
energy absorption of the LG panel.
(a) Under weaker blast load
(b) Under stronger blast load
Figure 7-3: Variation of the total energy absorption of the FE models with time for different widths
(w) of sealant joints (t = 5 mm and E = 2.3 MPa)
Figure 7-4: Variation of the maximum energy absorption of the FE models with the sealant width
0
50
100
150
200
250
300
350
0 5 10 15 20
En
erg
y a
bso
rp
tio
n (
J)
Time (ms)
w = 7.5 mmw = 10 mmw = 12.5 mmw = 15 mmw = 20 mm
0
10
20
30
40
50
60
70
0 5 10 15 20
En
erg
y a
bso
rp
tio
n (
J)
Time (ms)
w = 7.5 mmw= 10 mmw = 12.5 mmw = 15 mmw = 20 mm

138 Chapter 7: Effects of Sealant Properties on the Blast Performance of LG
0
2
4
6
8
10
12
14
0 5 10 15 20
Su
pp
ort
reacti
on
(k
N/m
)
Time (ms)
w = 7.5 mm
w = 10 mm
w = 12.5 mm
w = 15 mm
w = 20 mm
0
5
10
15
20
25
30
0 5 10 15 20
Su
pp
ort
reacti
on
(k
N/m
)
Time (ms)
w = 7.5 mm
w = 10 mm
w = 12.5 mm
w = 15 mm
w = 20 mm
Support reaction (RL)
Figure 7-5(a) compares the variation of the support reaction at the middle of the long
edge (RL) of the LG panel with time for different widths of the sealant joints under
the weaker blast load and that under the stronger blast load is shown in Figure 7-5(b).
Maximum RL obtained from the LG panels with 7.5, 10, 12.5, 15 and 20 mm wide
sealant joints under the weaker blast load are about 10.6, 11.3, 12.6, 12.7 and 12.9
kN/m respectively, and those under the stronger blast load are about 11.3, 12.3, 17.5,
19.2 and 26 kN/m respectively. Initially, RL increases suddenly and reaches its
maximum during 4-8 ms and then it reduces gradually with time, with many
fluctuations.
Figure 7-6 compares the variation of the maximum RL of the LG panel with the
width of the sealant joints under the chosen blast loads. Maximum RL increases
slightly with the increase of the sealant width under the weaker blast load, where
there is only about 14.2% increase in the RL when the width increases from 10 mm to
20 mm. However, it dramatically increases with the width of the sealant joints under
the stronger blast load, where the percentage increases in the RL for the LG panels
with 12.5, 15 and 20 mm wide sealant joints are about 42.3%, 56.1% and 111.4%
respectively, compared to that with 10 mm wide sealant joints. The LG panels with
7.5 and 10 mm wide sealant joints have similar support reactions under both blast
loads.
(a) Under weaker blast load
(b) Under stronger blast load
Figure 7-5: Variation of the support reaction, RL of the LG panel with time for different widths (w) of
sealant joints (t = 5 mm and E = 2.3 MPa)

Chapter 7: Effects of Sealant Properties on the Blast Performance of LG 139
0
5
10
15
20
25
30
5 7.5 10 12.5 15 17.5 20
Maxim
um
su
pp
ort
reacti
on
(kN
/m)
Sealant width (mm)
Weaker
Stronger
Figure 7-6: Variation of the maximum support reaction, RL with the sealant width
7.3.2 Effects of the Thickness (t) of the Sealant Joints
Four different FE models with 4, 5, 6 and 7 mm thick sealant joints were used in the
analysis, while taking their width and Young’s modulus as 10 mm and 2.3 MPa
respectively. Results from the FE analysis for centre deflection, total energy
absorption and support reactions (RL) were compared under the chosen blast loads.
The results are discussed below and are also summarised in Table 7-3.
Table 7-3: Comparison of results for different thicknesses (t) of the structural silicone sealant joints
Thickness
(mm)
Maximum deflection
(mm)
Maximum energy
absorption (J)
Maximum support reaction
(RL) (kN/m)
Weaker blast load
Stronger blast load
Weaker blast load
Stronger blast load
Weaker blast load
Stronger blast load
4 32.8
(-3.5%)
103.7
(-6.2%)
62.6
(-0.9%)
273.8
(-1.9%)
12.8
(13.3%)
14.9
(21.1%)
5 34 110.6 63.2 279.1 11.3 12.3
6 35.7
(5%)
117.1
(5.9%)
64.5
(2.1%)
288.1
(3.2%)
10.8
(-4.4%)
12.1
(-1.6%)
7 33.4
(-1.8%) 111.4 (0.7%)
64.7 (2.4%)
284 (1.8%)
10.9 (-3.5%)
11.8 (-4.1%)
Centre deflection
Figure 7-7(a) compares the deflection-time histories at the centre of the LG panel for
different thicknesses of the structural sealant joints under the weaker blast load.
Maximum deflections obtained from the LG panels with 4, 5, 6 and 7 mm thick
sealant joints are about 32.8, 34, 35.7 and 35.4 mm respectively. Figure 7-7(b)
compares these variations under the stronger blast load and the corresponding
maximum deflections of the LG panels are about 103.7, 110.6, 117.1 and 111.4 mm
respectively. Deflection-time history curves are similar under the weaker blast load
and they deviate from each other slightly under the stronger blast load.

140 Chapter 7: Effects of Sealant Properties on the Blast Performance of LG
0
20
40
60
80
100
120
140
3 3.5 4 4.5 5 5.5 6 6.5 7 7.5
Maxim
um
defl
ecti
on
(m
m)
Sealant thickness (mm)
Weaker
Stronger
-10
0
10
20
30
40
0 5 10 15 20 25 30
Defl
ecti
on
(m
m)
Time (ms)
t = 4 mm
t = 5 mm
t = 6 mm
t = 7 mm
0
20
40
60
80
100
120
0 5 10 15 20 25 30
Defl
ecti
on
(m
m)
Time (ms)
t = 4 mm
t = 5 mm
t = 6 mm
t = 7 mm
Figure 7-8 compares the variation of the maximum deflection at the centre of the LG
panel with the thickness of the sealant joints under the chosen blast loads. Deflection
at the centre increases gradually when the sealant thickness increases from 4-6 mm,
but then it reduces slightly when the sealant thickness increases further to 7 mm. This
behaviour is clearly seen under the stronger blast load, where the increase in the
sealant thickness could increase the flexibility at the supports, while reducing the
damage to the glass panes and hence, the deflection at the centre. Overall, the
thickness of the sealant joints has little effect on the centre deflection.
(a) Under weaker blast load
(b) Under stronger blast load
Figure 7-7: Variation of the deflection at the centre of the LG panel with time for different thicknesses
(t) of sealant joints (w = 10 mm and E = 2.3 MPa)
Figure 7-8: Variation of the maximum deflection at the centre with the sealant thickness
Total energy absorption
Figure 7-9(a) compares the variation of the total energy absorption of the FE models
with time for different thicknesses of the structural sealant joints under the weaker
blast load; that under the stronger blast load is shown in Figure 7-9(b). Maximum
energy absorptions obtained from the FE models with 4, 5, 6 and 7 mm thick sealant
joints under the weaker blast load are about 62.6, 63.2, 64.5 and 64.7 J respectively,

Chapter 7: Effects of Sealant Properties on the Blast Performance of LG 141
0
10
20
30
40
50
60
70
0 5 10 15 20
En
erg
y a
bso
rp
tio
n (
J)
Time (ms)
t = 4 mm
t = 5 mm
t = 6 mm
t = 7 mm
0
50
100
150
200
250
300
0 5 10 15 20
En
erg
y a
bso
rp
tio
n (
J)
Time (ms)
t = 4 mm
t = 5 mm
t = 6 mm
t = 7 mm
0
50
100
150
200
250
300
350
3 3.5 4 4.5 5 5.5 6 6.5 7 7.5
Maxim
um
en
erg
y a
bso
rp
tio
n
(J)
Sealant thickness (mm)
Weaker
Stronger
while those under the stronger blast load are about 273.8, 279.1, 288.1 and 284 J
respectively. It is clear that the energy absorption-time history curves are similar
under both blast loads, irrespective of the sealant thickness. Figure 7-10 compares
the variation of the maximum energy absorption of the FE models with the thickness
of the sealant joints under the chosen blast loads. Maximum energy absorption shows
an approximately linear variation with the sealant thickness, where it slightly
increases with the increase of that under the blast loads. However, thickness of the
sealant joints has very little impact on the energy absorption of the LG panel.
(a) Under weaker blast load
(b) Under stronger blast load
Figure 7-9: Variation of the total energy absorption of the FE models with time for different
thicknesses (t) of sealant joints (w = 10 mm and E = 2.3 MPa)
Figure 7-10: Variation of the maximum energy absorption of the FE models with the sealant thickness
Support reaction (R)
Figure 7-11(a) compares the variation of the support reaction, RL of the LG panel
with time for different thicknesses of the sealant joints under the weaker blast load.
Maximum RL obtained from the LG panels with 4, 5, 6 and 7 mm thick sealant joints
under the weaker blast load are about 12.8, 11.3, 10.8 and 10.9 kN/m respectively.
Figure 7-11(b) compares these variations under the stronger blast load and the

142 Chapter 7: Effects of Sealant Properties on the Blast Performance of LG
0
2
4
6
8
10
12
14
0 5 10 15 20
Su
pp
ort
reacti
on
(k
N/m
)
Time (ms)
t = 4 mm
t = 5 mm
t = 6 mm
t = 7 mm
0
2
4
6
8
10
12
14
16
0 5 10 15 20
Su
pp
ort
reacti
on
(k
N/m
)
Time (ms)
t = 4 mm
t = 5 mm
t = 6 mm
t = 7 mm
8
9
10
11
12
13
14
15
16
3 3.5 4 4.5 5 5.5 6 6.5 7 7.5
Maxim
um
su
pp
ort
reacti
on
(kN
/m)
Sealant thickness (mm)
Weaker
Stronger
corresponding maximum RL of the LG panels are about 14.9, 12.3, 12.1 and 11.8
kN/m respectively. RL increases suddenly, reaches its maximum during 4-8 ms and
then reduces gradually with time, with many fluctuations under the blast loads.
The sealant joints with high thickness provide more flexibility at the support, and
hence reduce the support reactions. This is illustrated in Figure 7-12, which
compares the variation of the maximum RL of the LG panel with the thickness of the
sealant joints. The LG panels with 4 mm thick sealant joints have considerably
higher support reactions, where the percentage increases in the maximum RL are
about 13.3% under the weaker blast load and 21.1% under the stronger blast load,
compared to that with 5 mm thick sealant joints. Increase of sealant thickness from 5
mm to 7 mm has very little impact on the maximum RL under both blast loads.
(a) Under weaker blast load
(b) Under stronger blast load
Figure 7-11: Variation of the support reaction, RL of the LG panel with time for different thicknesses
(t) of sealant joints (w = 10 mm and E = 2.3 MPa)
Figure 7-12: Variation of the maximum support reaction, RL with the sealant thickness

Chapter 7: Effects of Sealant Properties on the Blast Performance of LG 143
7.3.3 Effects of the Young’s Modulus (E) of the Sealant Joints
Four different FE models with sealant joints having Young’s moduli (E) of 1.0, 1.5,
2.3 and 3.4 MPa were used in the analysis, while taking their width and thickness as
10 and 5 mm respectively. Results from the FE analysis for centre deflection, total
energy absorption and support reactions (RL) were compared under the chosen blast
loads. The results are discussed below and are also summarised in Table 7-4
Table 7-4: Comparison of results for different Young’s moduli (E) of the structural silicone sealant
joints
Young’s
modules
(MPa)
Maximum deflection (mm) Maximum energy
absorption (J)
Maximum support reaction
(RL) (kN/m)
Weaker
blast load
Stronger
blast load
Weaker
blast load
Stronger
blast load
Weaker
blast load
Stronger
blast load
1.0 33.4
(-1.8%)
122.1
(10.4%)
65.5
(3.6%)
290.1
(3.9%)
9.8
(-13.3%)
10.4
(-15.4%)
1.5 35
(2.9%)
113.8
(2.9%)
65.3
(3.3%)
284.6
(2.0%)
10.2
(-9.7%)
10.8
(-12.2%)
2.3 34 110.6 63.2 279.1 11.3 12.3
3.4 33.4
(-1.8%)
103.7
(-6.2%)
62.5
(-1.1%)
273.6
(-2.0%)
11.4
(0.9%)
17.7
(43.9%)
Centre deflection
Figure 7-13(a) compares the deflection-time histories at the centre of the LG panel
for different E of the structural sealant joints under the weaker blast load. Maximum
deflections obtained from the LG panels with sealant joints having E of 1.0, 1.5, 2.3
and 3.4 MPa are about 33.4, 35, 34 and 33.4 mm respectively. Figure 7-13(b)
compares these variations under the stronger blast load and the corresponding
maximum deflections of the LG panels are about 122.1, 113.8, 110.6 and 103.7 mm
respectively. Deflection-time histories are similar under the weaker blast load, but
they deviate from each other noticeably after about 8 ms, under the stronger blast
load.
Figure 7-14 compares the variation of the maximum deflection at the centre of the
LG panel with the E of the sealant joints under the chosen blast loads. Maximum
deflection slightly reduces with the increase of the E of the sealant joints and this is
mostly seen under the stronger blast load. However, E of the sealant joints has less
influence on the centre deflection, under the weaker blast load. Overall, sealant joints

144 Chapter 7: Effects of Sealant Properties on the Blast Performance of LG
-10
0
10
20
30
40
0 5 10 15 20 25 30
Defl
ecti
on
(m
m)
Time (ms)
E = 1.0 MPa
E = 1.5 MPa
E = 2.3 MPa
E = 3.4 MPa
0
25
50
75
100
125
0 5 10 15 20 25 30
Defl
ecti
on
(m
m)
Time (ms)
E = 1.0 MPa
E = 1.5 MPa
E = 2.3 MPa
E = 3.4 MPa
0
20
40
60
80
100
120
140
0 0.5 1 1.5 2 2.5 3 3.5 4
Maxim
um
defl
ecti
on
(m
m)
Sealant Young's modulus (mm)
Weaker
Stronger
with smaller Young’s modulus provide more flexibility at the support and hence,
increase the centre deflection, especially under higher blast loads.
(a) Under weaker blast load
(b) Under stronger blast load
Figure 7-13: Variation of the deflection at the centre of the LG panel with time for different Young’s
moduli (E) of sealant joints (w = 10 and t = 5 mm)
Figure 7-14: Variation of the maximum deflection at the centre with the sealant Young’s modulus
Total energy absorption
Figure 7-15(a) compares the variation of the total energy absorption of the FE
models with time for different E of the structural sealant joints under the weaker
blast load. Maximum energy absorptions obtained from the FE models with sealant
joints having E of 1.0, 1.5, 2.3 and 3.4 MPa under the weaker blast load are about
65.5, 65.3, 63.2 and 62.5 J respectively. Figure 7-15(b) compares these variations
under the stronger blast load and the corresponding maximum energy absorptions of
the FE models are about 290.1, 284.6, 279.1 and 273.6 J respectively. Energy
absorption-time histories are similar under a given blast load, confirming that the E
of the sealant joints has little impact on the energy absorption of the LG panel. This
is further illustrated in Figure 7-16, which compares the maximum energy absorption
of the FE models with the E of the sealant joints. Maximum energy absorption shows

Chapter 7: Effects of Sealant Properties on the Blast Performance of LG 145
0
10
20
30
40
50
60
70
0 5 10 15 20
En
erg
y a
bso
rp
tio
n (
J)
Time (ms)
E = 1.0 MPa
E = 1.5 MPa
E = 2.3 MPa
E = 3.4 MPa
0
50
100
150
200
250
300
350
0 0.5 1 1.5 2 2.5 3 3.5 4
Maxim
um
en
erg
y a
bso
rp
tio
n
(J)
Sealant Young's modulus (mm)
Weaker
Stronger
0
50
100
150
200
250
300
0 5 10 15 20 25 30
En
erg
y a
bso
rp
tio
n (
J)
Time (ms)
E = 1.0 MPa
E = 1.5 MPa
E = 2.3 MPa
E = 3.4 MPa
an approximately linear variation with the E of the sealant joints, where there is a
slight reduction in that with increase of the E of the sealant joints.
(a) Under weaker blast load
(b) Under stronger blast load
Figure 7-15: Variation of the total energy absorption of the FE models with time for different Young’s
moduli (E) of sealant joints (w = 10 and t = 5 mm)
Figure 7-16: Variation of the maximum energy absorption of the FE models with the sealant Young’s
modulus
Support reactions (RL)
Figure 7-17(a) compares the variation of the support reaction RL of the LG panel
with time for different E of the structural sealant joints under the weaker blast load.
Maximum RL obtained from the LG panels with sealant joints having E of 1.0, 1.5,
2.3 and 3.4 MPa under the weaker blast load are about 9.8, 10.2, 11,3 and 11.4 kN/m
respectively. Figure 7-17(b) compares these variations under the stronger blast load
and the corresponding maximum RL of the LG panels are about 10.4, 10.8, 12.3 and
17.7 kN/m respectively. The variation of the RL is quite sensitive to E of the sealant
joints under the stronger blast load, compared to that under the weaker blast load.
Figure 7-18 compares the variation of the maximum RL of the LG panel with the E of
the sealant joints under the chosen blast loads. When E of the sealant joints increases

146 Chapter 7: Effects of Sealant Properties on the Blast Performance of LG
0
2
4
6
8
10
12
0 5 10 15 20
Su
pp
ort
reacti
on
(k
N/m
)
Time (ms)
E = 1.0 MPa
E = 1.5 MPa
E = 2.3 MPa
E = 3.4 MPa
0
2
4
6
8
10
12
14
16
18
20
0 5 10 15 20
Su
pp
ort
reacti
on
(k
N/m
)
Time (ms)
E = 1.0 MPa
E = 1.5 MPa
E = 2.3 MPa
E = 3.4 MPa
8
10
12
14
16
18
20
0 0.5 1 1.5 2 2.5 3 3.5 4
Maxim
um
su
pp
ort
reacti
on
(kN
/m)
Sealant Young's modulus (mm)
Weaker
Stronger
from 1.0 MPa to 2.3 MPa, maximum RL increases gradually under both blast loads.
When it further increases to 3.4 MPa, there is a significant increase in the maximum
RL under the stronger blast load, which is about 43.9% compared to that with sealant
joints having E of 2.3 MPa. The LG panels with sealant joints having smaller E show
smaller increase in the support reactions under the stronger blast load, compared to
those under the weaker blast load and hence, could be recommended.
(a) Under weaker blast load
(b) Under stronger blast load
Figure 7-17: Variation of the support reaction, RL of the LG panel with time for different Young’s
moduli (E) of sealant joints (w = 10 and t = 5 mm)
Figure 7-18: Variation of the maximum support reaction, RL with the sealant Young’s modulus
7.4 DISCUSSION
According to ASTM F 2248-09 (2010b), LG panels used in this study should be
fixed to the frame using structural silicone sealant joints having a minimum thickness
of 5 mm and a width of 10-12 mm. Results from the parametric study were compared
with those guidelines given in the standard, and are discussed below.
The width of the structural sealant joints was varied between 7.5-20 mm in the
analysis. Results showed that, the use of wider sealant joints reduces the centre

Chapter 7: Effects of Sealant Properties on the Blast Performance of LG 147
deflection and energy absorption of the LG panel, while increasing its support
reactions. The LG panel with 7.5 mm wide sealant joints increases the energy
absorption by less than 5% and reduces the support reaction force by less than 10%,
showing little improvement compared to that with 10 mm wide sealant joints. The
LG panels with 12.5, 15 and 20 mm wide sealant joints show an increase in the
reaction force by 42.3%, 56.1% and 111.4% respectively, compared to that with 10
mm wide sealant joints. The use of 10-12 mm wide sealant joints could be a safe and
economical solution for the selected LG panel, agreeing with the guidelines given in
ASTM F 2248-09 (2010b). Overall, the use of sealant joints with a smaller width can
be recommended if they can withstand the design blast load.
The thickness of the structural sealant joints was varied between 4-7 mm. LG panels
with thinner sealant joints have less flexibility at the supports and hence, reduce the
centre deflection and energy absorption while increasing the support reaction. ASTM
F 2248-09 (2010b) recommends using at least 5 mm thick sealant joints for LG
panels designed to be blast resistant. The LG panel with 4 mm thick sealant joints
shows about 21.1% increase in the support reaction, compared to that with 5 mm
thick sealant joints under the stronger blast load. The LG panels with 6 and 7 mm
thick sealant joints increase the energy absorption by less than 4% and reduce the
support reaction less than 5%, showing little improvement compared to that with 5
mm thick sealant joints under the chosen blast loads. LG panels with thicker sealant
joints require window frames with larger dimensions. The use of at least 5 mm thick
sealant joints can be recommended, supporting the guidelines given in the standard.
The Young’s modulus (E) of the structural sealant joints was varied between 1.0-3.4
MPa. Sealant joints with smaller E show increases in the centre deflection and hence
the energy absorption of the LG panel, while reducing the support reaction. The E of
sealant joints has less impact on the energy absorption, but has a noticeable impact
on the support reaction. The LG panel with sealant joints having E of 3.4 MPa has a
reaction force, which is about 43.9% higher than that with sealant joints having E of
2.3 MPa. Sealant joints with smaller E can be recommended for LG panels, provided
that they are able to withstand the design blast load without failure at the supports.
The guidelines given in the design standard ASTM F 2248-09 (2010b), to determine
the width and the thickness of the sealant joints, agreed well with the results
predicted from the FE analysis. LG panels should be designed to maximise the

148 Chapter 7: Effects of Sealant Properties on the Blast Performance of LG
energy absorption, while minimising the reaction forces transferred to the supporting
frames. Results from the present study showed that the use of sealant joints with
smaller width, larger thickness and smaller E improve the blast performance of LG
panels, by increasing their deflection and hence energy absorption, while minimising
the support reactions. It could be noted that the increase in the deflection and the
energy absorption creates more fracture to the glass panes and hence damage to the
interlayer as seen in the previous chapters, though they are not repeatedly compared
in this chapter.
7.5 CHAPTER SUMMARY
This chapter presented the results from a parametric study, which was carried out to
investigate the influence of the structural sealant joints on the blast performance of a
LG panel. In this study, the width, thickness and the Young’s modulus (E) of the
structural sealant joints were varied and their effects on the centre deflection, total
energy absorption and support reactions of the LG panel were studied with the
developed FE models. Results showed that the width, thickness and the Young’s
modulus (E) of the sealant joints have a considerable influence on the energy
absorption and the support reactions of the LG panels, and therefore, they should be
analysed carefully when designing LG panels under blast loads.
This chapter concludes that the use of sealant joints with smaller width, larger
thickness and smaller Young’s modulus increase the flexibility at the supports and
hence, enhances the energy absorption of LG panels, while reducing their support
reactions. However, it is not recommended to increase the sealant thickness
unnecessarily, as it makes little improvement, while requiring framing members with
larger dimensions. The sealant joints should not be overdesigned using stiffer
material or wider joints, as they reduce the energy absorption, while increasing
support reactions. On the other hand, they should not be under-designed, as their
failure will cause the entire unit to be flung into the building, causing high hazard.

Chapter 8: Blast Performance of Flexible Facade Systems 149
Chapter 8: Blast Performance of Flexible
Facade Systems
8.1 INTRODUCTION
Flexible facade systems, such as cable net facades, are often used at the lower levels
of buildings. Building facades generally have four basic components: glazed panels,
window frame, fasteners and supporting structures, which could be steel cables or
bars in the flexible facades. Point supported glazed facades are also used in practice,
where spider connections are commonly used to fix the glazing directly to the
supporting structure without using window frames. However, the author believes
that, they have poor blast performance compared to those fixed with window frames
along the perimeter. This is especially so when LG is used. It has to be securely held
to the frame until it fails by tearing of the interlayer, which is difficult to achieve
with point supported glazing. This chapter, therefore, focuses on the blast response of
flexible facade systems using fully framed LG windows.
The window frame was modelled as a rigid base by neglecting its deformation, as
done in the work of previous chapters. FE models are developed incorporating a
window frame, and the supporting structure consists of steel cables spanning both
vertically and horizontally. Only the positive phase of the blast load was considered
in the previous chapters. The negative phase of the blast load is also considered in
this study, as it will have influence on the blast response of flexible facades. To date,
there is limited understanding on the blast response of flexible façade systems,
including the effects of negative phase and support flexibility. These important
parameters were studied in the parametric study, which is discussed below.
8.2 PARAMETRIC STUDY
A LG panel similar to that used in Chapters 5-7 was used in this study. It has a length
of 1.1 m, width of 0.9 m and a thickness of 7.52 mm (3 mm annealed glass + 1.52
mm PVB + 3 mm annealed glass). The thickness and width of the structural silicone
sealant joints were taken as 5 and 10 mm respectively, agreeing with the provisions
given in the standard ASTM F 2248-09 (2010b). The LG panel has a 5 mm thickness
and 20 mm width aluminium frame along the perimeter. The window frame was

150 Chapter 8: Blast Performance of Flexible Facade Systems
fixed to the supporting structure at the corners and at the middle (two fasteners at the
middle), using 20 mm x 20 mm steel fasteners with a 10 mm thickness.
For the comparison purposes, two different supporting structures were treated in this
study. One was a rigid supporting structure, which was modelled by fixing the
fasteners to a rigid base, and the other was the flexible supporting structure, which
was modelled with steel cables. The flexible supporting structure has four steel
cables each of 5 m in length, where two of them span vertically along the vertical
edges of the LG panel and the other two span horizontally along the horizontal edges.
It was assumed that steel cables have a 20 mm x 20 mm square cross-section for
simplicity. The influence of the negative phase of the blast load on the blast
responses of these LG panels was examined initially. Then, a parametric study was
carried out by varying the cross-section of the steel cables to investigate the effects
of support flexibility on the blast response of the LG panel under the complete blast
loads with the negative phase.
8.2.1 Blast Loads
LG panels with flexible supports have higher load carrying capacity compared to
those with rigid supports. As the author expects high damage to the glass panes and
interlayer under the stronger blast load, the stronger blast load used in this chapter is
higher than that used in previous chapters. The stronger blast load used in this
chapter occurs from a 18 kg TNT equivalent charge weight, at about 13 m standoff
distance. Both positive and negative phases of the blast load were treated in this
study and the relevant reflected blast wave parameters for the blast threat were found
from UFC 3-340-02 (2008), using the charts developed for hemispherical surface
explosions. The maximum positive blast overpressure, positive phase duration and
the positive blast impulse were found to be about 88.3 kPa, 10.2 ms and 301 kPa-ms
respectively. The positive phase of the blast overpressure time-history curve was
obtained from the Friedlander equation, and the relevant decay factor (b) for the blast
load was found to be 1.35. The maximum negative overpressure, negative phase
duration and the negative impulse were found to be about 13.1 kPa, 37.8 ms and 247
kPa-ms respectively. The variation of the negative blast overpressure was simplified
as a triangular load.
For comparison purposes, blast response of the LG panels was compared under the
weaker blast load as was used in Chapters 5-7. The maximum positive blast

Chapter 8: Blast Performance of Flexible Facade Systems 151
-20
0
20
40
60
80
100
0 10 20 30 40 50 60
Refl
ecte
d o
verp
ress
ure (
kP
a)
Time (ms)
Weaker
Stronger
overpressure, positive phase duration and the positive blast impulse of this blast load
are about 31 kPa, 12.3 ms and 150 kPa-ms respectively, where the corresponding
negative phase parameters are about 7.7 kPa, 39 ms and 150 kPa-ms respectively.
The blast overpressure-time histories of the blast loads are shown in Figure 8-1.
Figure 8-1: Reflected overpressure variations of the blast loads
8.2.2 FE Modelling
The FE modelling was carried out using LS-DYNA FE code incorporating 3D
constant stress solid elements, as in the procedure given in Chapter 3. One-quarter of
the entire structure was analysed using symmetry, assuming that the blast load is
uniformly distributed over the entire front glass pane. Complete FE models including
glass, interlayer, silicone sealant joints, window frame, fasteners and supporting
structure were incorporated into the FE model. As was described earlier, a rigid
supporting structure was modelled by fixing the fasteners to a rigid base, while the
flexible supporting structure was modelled with steel cables having a square cross-
section. Different views of the FE model are shown in Figure 8-2. Though a quarter
of the structure was used in the analysis, the front view of the entire structure is
shown in Figure 8-2(c), using the reflection option in the LS-DYNA FE code.
(a) Quarter of the LG panel with the frame (b) Closer view at the support
steel frame
fastener
sealant
LG
panel
centre
fastener
fastener
fastener

152 Chapter 8: Blast Performance of Flexible Facade Systems
(c) Flexible façade with steel cables
Figure 8-2: Different views of the FE model
8.2.3 Material Properties
Material properties used in the analysis were explained in Section 2.5. Material
properties of glass were given in Table 2-3 and the JH-2 material constants required
for the material model 110 were given in Table 3-2. The tensile strength (T) of glass
was taken as 60 MPa in the analysis, as a conservative approach. Material properties
used in the analysis for the PVB interlayer were given in Table 2-5 and the
corresponding stress-strain behaviour was illustrated in Figure 2-14. Material
properties used in the analysis for the structural silicone sealant were given in Table
2-6 and the corresponding stress-strain behaviour was illustrated in Figure 2-16. An
aluminium window frame and steel supports were treated in this study. Material
properties of aluminium and steel were given in Table 2-7 and their stress-strain
variations were illustrated in Figure 2-17.
8.3 INFLUENCE OF THE NEGATIVE PHASE OF THE BLAST LOAD
8.3.1 LG Panel Fixed to Rigid Supports
Blast response of a LG panel fixed to rigid supports was studied under the chosen
blast loads. The influence of the negative phase was examined, by comparing the
results from the positive phase of the blast load only, with those from the complete
blast load accounting for the negative phase. Results from the FE analysis for centre
deflection, total energy absorption and support reactions were compared under the
A
C
B
2.5 m
2.5 m
vertical steel cables
horizontal steel cables

Chapter 8: Blast Performance of Flexible Facade Systems 153
blast loads. The results are discussed below and are also summarised in Table 8-1.
The values given in the brackets are the percentage variations under the blast load
with negative phase, compared to those from the blast load with positive phase only.
Table 8-1: Comparison of results of the LG panel fixed to rigid supports
Blast
load
Maximum deflection (mm) Maximum energy
absorption (J)
Maximum support
reaction (kN)
Positive phase only With negative phase Positive
phase
only
With
negative
phase
Positive
phase
only
With
negative
phase Inward Outward Inward Outward
Weaker 28.1 -30.5 28.1
(0%)
-35.2
(15.4%) 61.9
68.5
(10.7%) 7.5
7.5
(0%)
stronger 130.5 - 126
(-3.4%) - 379
470
(24%) 8.2
8.2
(0%)
Centre deflection
Figure 8-3(a) compares the deflection-time histories at the centre of the LG panel
fixed to rigid supports under the weaker blast load, with and without accounting for
the negative phase. Deflection-time histories are identical up to about 16 ms. The
first peak of inward deflection occurs at about 8 ms, which has an identical value of
about 28.1 mm for both cases. Maximum outward deflection of the LG panel loaded
with the positive phase of the blast load only is about -30.5 mm. This is slightly
higher than that seen during the first peak of inward deflection. The damage to the
glass panes occurred at the first peak of inward deflection would have increased the
outward deflection of the LG panel. The negative phase has some effects on the
centre deflection after about 16 ms, where it slightly increases the outward
deflections, while decreasing the inward deflections. The maximum outward
deflection increases up to about -35.2 mm under the blast load with negative phase.
Figure 8-3(b) compares these variations under the stronger blast load. The LG panel
seems to have been considerably damaged during the first peak of the inward
deflection, as it does not show a rebound after reaching the maximum deflection.
This behaviour is seen under the load with only the positive phase. When the
negative phase is included, there is a noticeable reduction in the deflection after the
peak. The LG panel loaded with the positive phase of the blast load only, has a
maximum inward deflection of about 130.5 mm. When the negative phase is
accounted for in the analysis, it slightly reduces to about 126 mm. Overall, the
negative phase of the blast load has a small impact on the centre deflection of a LG

154 Chapter 8: Blast Performance of Flexible Facade Systems
0
20
40
60
80
100
120
140
0 20 40 60 80 100
Defl
ecti
on
(m
m)
Time (ms)
pos only
with neg
-40
-30
-20
-10
0
10
20
30
0 20 40 60 80 100
Defl
ecti
on
(m
m)
Time (ms)
pos only
with neg
panel with rigid supports, especially under higher blast loads, causing considerable
damage to the LG panel during the positive phase.
(a) Under weaker blast load (a) Under stronger blast load
Figure 8-3: Variation of the deflection at the centre of LG panel fixed to rigid supports with time
Total energy absorption
Figures 8-4(a) compares the variation of the energy absorption of the FE model fixed
to rigid supports with time under the weaker blast load, with and without accounting
for the negative phase. Energy absorption-time histories are identical up to about 16
ms, similar to those seen with the deflection-time histories. The energy absorption
suddenly increases to the maximum value of about 61.9 J and then slightly reduces to
a lower value at which it remains thereafter under the load with positive phase only.
However, when the negative phase is accounted for in the analysis, the energy
absorption increases further to a higher value of about 68.5 J after a certain time.
Figure 8-4(b) compares these variations under the stronger blast load. The energy
absorption-time histories are identical up to about 10 ms, where they suddenly
increase to a higher value of about 379 J. The LG panel loaded with the positive
phase of the blast load only remains at this maximum value thereafter, but that
loaded with the negative phase shows a further increase in the energy absorption
reaching a maximum value of about 470 J. Overall, the negative phase seems to
increase the energy absorption of the LG panel where the percentage increases under
the weaker and stronger blast loads are about 10.7% and 24% respectively, compared
to those with positive phase only.

Chapter 8: Blast Performance of Flexible Facade Systems 155
0
50
100
150
200
250
300
350
400
450
500
0 10 20 30 40 50 60
En
erg
y a
bso
rp
tio
n (
J)
Time (ms)
pos only
with neg
(a) Under weaker blast load (b) Under stronger blast load
Figure 8-4: Variation of the total energy absorption of the FE model with time for the LG panel fixed
to rigid supports
Support reactions
The window frame of the LG panel was fixed to rigid supports, using fasteners. The
FE model is a quarter of the LG panel which has three fasteners located at the middle
of the long edge, short edge and at the corner of the window frame (refer Figure 8-
2(a)). The total reaction forces of the fasteners were examined and it was found that
the fastener at the middle of the long edge has higher support reactions, compared to
the others. The reaction force variation at this fastener was therefore compared under
the chosen blast loads, to study the influence of the negative phase on the support
reactions.
Figure 8-5(a) compares the variation of the support reaction in the fastener at the
middle of the long edge with time under the weaker blast load. The support reaction-
time histories are identical up to about 14 ms. The maximum support reaction of
about 7.6 kN occurs at about 7 ms for both cases, and hence, it does not have any
influence from the negative phase of the blast load. After about 10 ms, support
reaction of the LG panel loaded with the positive phase of the blast load only,
considerably reduces and varies with many fluctuations, where the maximum
reaction force can go up to about 2.5 kN. The support reaction of the LG panel
loaded with both the positive and negative phases of the blast load also varies with
time with many fluctuations after about 10 ms, but it has higher peak values which
can go up to about 4.5 kN.
Figure 8-5(b) compares these variations under the stronger blast load. As before,
support reaction-time histories are identical up to about 10 ms and they deviate from
0
10
20
30
40
50
60
70
0 10 20 30 40 50 60
En
erg
y a
bso
rp
tio
n (
J)
Time (ms)
pos only
with neg

156 Chapter 8: Blast Performance of Flexible Facade Systems
0
1
2
3
4
5
6
7
8
9
0 20 40 60 80
Su
pp
ort
reacti
on
(k
N)
Time (ms)
pos only
with neg
0
1
2
3
4
5
6
7
8
0 10 20 30 40 50 60
Su
pp
ort
reacti
on
(k
N)
Time (ms)
pos only
with neg
each other thereafter. The maximum support reactions are identical for both cases,
which is about 8.2 kN occurring at about 6 ms. The support reactions suddenly
reduce to a smaller value of about 1 kN at about 20 ms and the LG panel loaded with
the positive phase of the blast load only remains around that thereafter. However, the
LG panel loaded with the negative phase shows some increase in the support reaction
during the negative phase, where the maximum value can go up to about 4.5 kN. The
negative phase of the blast load does not have any influence on the maximum
support reaction as it occurs during the positive phase of the blast load. It is also
evident that the increase in the blast load does not make a significant impact on the
maximum support reaction, though the LG panel loaded with the stronger blast load
has high support reactions for a longer duration.
(a) Under weaker blast load (b) Under stronger blast load
Figure 8-5: Variation of the support reaction in the fastener at the middle of the long edge of the LG panel fixed to rigid supports with time
Overall, it is evident that the negative phase of a blast load has less impact on the
peak deflections, energy absorption and the support reactions of LG panels with rigid
supports. They could mostly fail during the first peak of inward deflection under
higher blast loads, which is less influenced by the negative phase. Approximating the
blast load with the positive phase only, is therefore accurate enough for the design of
LG panels with rigid supports. The blast response of LG panels fixed to flexible
supports is studied in the following section.

Chapter 8: Blast Performance of Flexible Facade Systems 157
8.3.2 LG panel Fixed to Flexible Supports
Blast response of a LG panel fixed to flexible cables having a 20 mm x 20 mm
square cross-section was studied under the chosen blast loads. The influence of the
negative phase was examined, by comparing the results from the positive phase of
the blast load only with those from the complete blast load accounting for the
negative phase, similar to the work carried out in the previous section. Results from
the FE analysis for effective centre deflection, total energy absorption and support
reactions at the edge of the steel cables were compared under the blast loads. The
results are discussed below and are also summarised in Table 8-2. The values given
in the brackets are the percentage variations under the blast load with negative phase,
compared to those obtained from the blast load with positive phase only.
Table 8-2: Comparison of results of the LG panel fixed to flexible supports
Blast
load
Maximum effective centre deflection (mm) Maximum energy
absorption (J)
Maximum support
reaction (kN)
Positive phase only With negative phase Positive
phase
only
With
negative
phase
Positive
phase
only
With
negative
phase Inward Outward Inward Outward
Weaker 27.7 -24.9 23.4
(-15.5%)
-23
(-7.6%) 86.3
107
(24%) 38.2
51.4
(34.6%)
stronger 85.4 -68.1 95.4
(11.7%)
-89.1
30.8%) 413
621
(50.4%) 75.7
93.5
(23.5%)
Effective centre deflection
The effective centre deflection of the LG panel is its centre deflection relative to the
window frame, which is calculated by taking the difference between the total centre
deflection of the LG panel and the deflection at a point on the frame. It was found
that there is a negligible change in the lateral deflection along the window frame and
hence, effective deflections were calculated relative to the point A on the frame, as
shown in Figure 8-2(c). Effective centre deflections were calculated only for the LG
panels with flexible supports where there is a lateral deflection in the supports, while
on the other hand, they are identical with the total centre deflection for the LG panels
with rigid supports, as there is a negligible deformation in the window frame.
Figure 8-6(a) compares the variation of the effective centre deflection of the LG
panel with time under the weaker blast load with and without accounting for the
negative phase. Deflection-time histories are identical up to about 16 ms, but they
slightly deviate from each other thereafter. The LG panel loaded with the blast load

158 Chapter 8: Blast Performance of Flexible Facade Systems
-30
-20
-10
0
10
20
30
0 20 40 60 80 100
Defl
ecti
on
(m
m)
Time (ms)
pos only
with neg-100
-75
-50
-25
0
25
50
75
100
0 25 50 75 100 125 150
Defl
ecti
on
(m
m)
Time (ms)
pos only
with neg
with negative phase shows a slight reduction in the inward peak deflections,
compared to that loaded with the positive phase only. Outward peak deflections are
similar, except at the second peak of the outward deflection, where there is an
increase in the peak deflection under blast load with negative phase. The LG panel
with flexible supports seems to oscillate under the weaker blast load, and it has
higher deflections later, compared to the initial peaks. This could occur when the
glass panes damage during the initial peaks of deflections. Maximum inward and
outward deflections obtained from the LG panel loaded with the positive phase of the
blast load only, are about 27.7 and -24.9 mm respectively. When the negative phase
is accounted for in the analysis, corresponding values are about 23.4 and -23 mm
respectively.
Figure 8-6(b) compares these variations under the stronger blast load. Deflection-
time histories are identical up to about 15 ms, but later they deviate considerably
from each other, as the LG panel loaded with the negative phase rebounds earlier
than that loaded with the positive phase only. The first peak of inward deflection,
first peak of outward deflection and the second peak of the inward deflection
obtained from the LG panel loaded with the positive phase only, are about 85.4, -68
and 68 mm respectively. The corresponding values obtained from the LG panel
loaded with the blast load with negative phase are about 77.1, -89.1 and 95.4 mm
respectively. Overall, it is evident that the negative phase could slightly decrease the
first peak of inward deflection, but it could considerably increase the peak
deflections thereafter, compared to those obtained from the LG panel loaded with the
positive phase of the blast load only.
(a) Under weaker blast load (b) Under stronger blast load
Figure 8-6: Variation of the deflection at the centre of the LG panel fixed to flexible supports with
time

Chapter 8: Blast Performance of Flexible Facade Systems 159
0
20
40
60
80
100
120
0 10 20 30 40 50 60
En
erg
y a
bso
rp
tio
n (
J)
Time (ms)
pos only
with neg
0
100
200
300
400
500
600
700
0 20 40 60
En
erg
y a
bso
rp
tio
n (
J)
Time (ms)
pos only
with neg
Total energy absorption
Figures 8-7(a) compares the variation of the total energy absorption of the FE model
fixed to flexible supports with time under the weaker blast load, with and without
accounting for the negative phase. The energy absorption shows a sudden increase
initially, where its variations are identical up to about 16 ms irrespective of the
negative phase. The FE model loaded with the positive phase of the blast load only
has maximum energy absorption of about 86.3 J. However, when the negative phase
is accounted for in the analysis, energy absorption shows a reduction during 16-40
ms, but it increases to a higher value of about 107 J thereafter, which is about a 24%
increase compared to that loaded with the positive phase of the blast load only.
Figure 8-7(b) compares these variations under the stronger blast load. The energy
absorption time-histories are identical up to about 14 ms, but the FE model loaded
with the negative phase shows a considerable increase in the energy absorption after
about 30 ms. The FE model loaded with the positive phase of the blast load only, has
maximum energy absorption of about 413 J. It increases up to about 621 J under the
blast load with negative phase, which is about a 50.4% increase compared to that
seen with blast load with positive phase only. Overall, it is evident that the negative
phase of a blast load could considerably increase the energy absorption of a LG
panel, especially under higher blast loads.
(a) Under weaker blast load (b) Under stronger blast load
Figure 8-7: Variation of the total energy absorption of the FE model with time for the LG panel fixed
to flexible supports
Support reactions
In this study flexible supports were modelled with steel cables spanning both
vertically and horizontally. Reaction forces at the edges of both the vertical and

160 Chapter 8: Blast Performance of Flexible Facade Systems
-100
-50
0
50
100
150
200
250
300
-20
-10
0
10
20
30
40
50
60
0 10 20 30 40 50 60 70 80 90 100
Defl
ecti
on
(m
m)
Reacti
on
fo
rce (
kN
)
Time (ms)
force - pos only
force - with neg
sup def - pos only
sup def - with neg
horizontal cables (referred to points C and B respectively according to Figure 8-2(c))
were examined, and it was found that force at the edge of the horizontal cables is
slightly higher than that of the vertical cables and hence, it was compared under the
chosen blast loads.
Figure 8-8(a) compares the variation of the support reaction at the edge of the
horizontal cable with time under the weaker blast load. The deflections at the point A
on the window frame (support deflections) were also plotted on the same graph,
which indicates that the peak reaction forces occur during the peak deflections of the
steel cables. The reaction force-time histories are identical up to about 28 ms and
they deviate with each other considerably thereafter. The LG panel loaded with the
positive phase of the blast load only, has a maximum reaction force of about 38.2
kN, occurring at the first peak. The maximum reaction force of the LG panel loaded
with the negative phase is about 51.4 kN, occurring at the second peak.
Figure 8-8(b) compares these variations under the stronger blast load. As seen under
the weaker blast load, reaction force-time histories are identical up to about 24 ms
and they deviate from each other considerably thereafter. Similarly, peak reaction
forces occur with the peak deflections of the steel cable. The LG panel loaded with
the positive phase of the blast load only, has a maximum reaction force during the
first peak, which is about 75.7 kN, while that of the LG panel loaded with the
negative phase occurs during the second peak, which is about 93.5 kN. It is evident
that the negative phase of the blast load considerably increases the reaction forces at
the steel cables where the percentage increases are about 34.6% and 23.5% under the
weaker and stronger blast loads respectively, compared to those obtained from the
LG panel loaded with the positive phase of the blast load only.
(a) Under weaker blast load

Chapter 8: Blast Performance of Flexible Facade Systems 161
-100
0
100
200
300
400
500
-20
0
20
40
60
80
100
0 20 40 60 80 100 120
Defl
ecti
on
(m
m)
Reacti
on
fo
rce (
kN
)
Time (ms)
force - pos only
force - with neg
sup def - pos only
sup def - with neg
(b) Under stronger blast load
Figure 8-8: Variation of the reaction force at the edge of the horizontal cable of the LG panel fixed to
flexible supports with time
Results from this study show that LG panels with flexible supports are quite sensitive
to the negative phase, especially under higher blast loads. The negative phase could
considerably increase the peak deflections, energy absorption and the reaction forces
at the edge of the steel cables. It is therefore recommended to account for the
negative phase for the design of LG panels with flexible supports under blast loads.
The following section studies the effects of support flexibility on the blast
performance of LG panels, by accounting for the negative phase.
8.4 EFFECTS OF SUPPORT FLEXIBILITY ON THE BLAST
PERFORMANCE OF LG PANELS
In this study, the support flexibility was varied by changing the cross-section of the
steel cables. Steel cables with 15 mm x 15 mm, 20 mm x 20 mm and 25 mm x 25
mm square cross-sections were used in the study. Blast response of the LG panel
fixed to these flexible cables was studied, under the chosen blast loads with negative
phase. Results from the FE analysis for total centre deflection of the LG panel,
support deflection, effective centre deflection of the LG panel, total energy
absorption, support reactions at the edge of the steel cables, fracture of glass panes,
stress-strain behaviour of the interlayer and the component energy absorptions were
compared under the blast loads. The results are discussed below and are also
summarised in Table 8-3 and 8-4 for the weaker and stronger blast loads
respectively. The values given in the brackets are the percentage variations for LG
panels with flexible supports, compared to those with rigid supports.
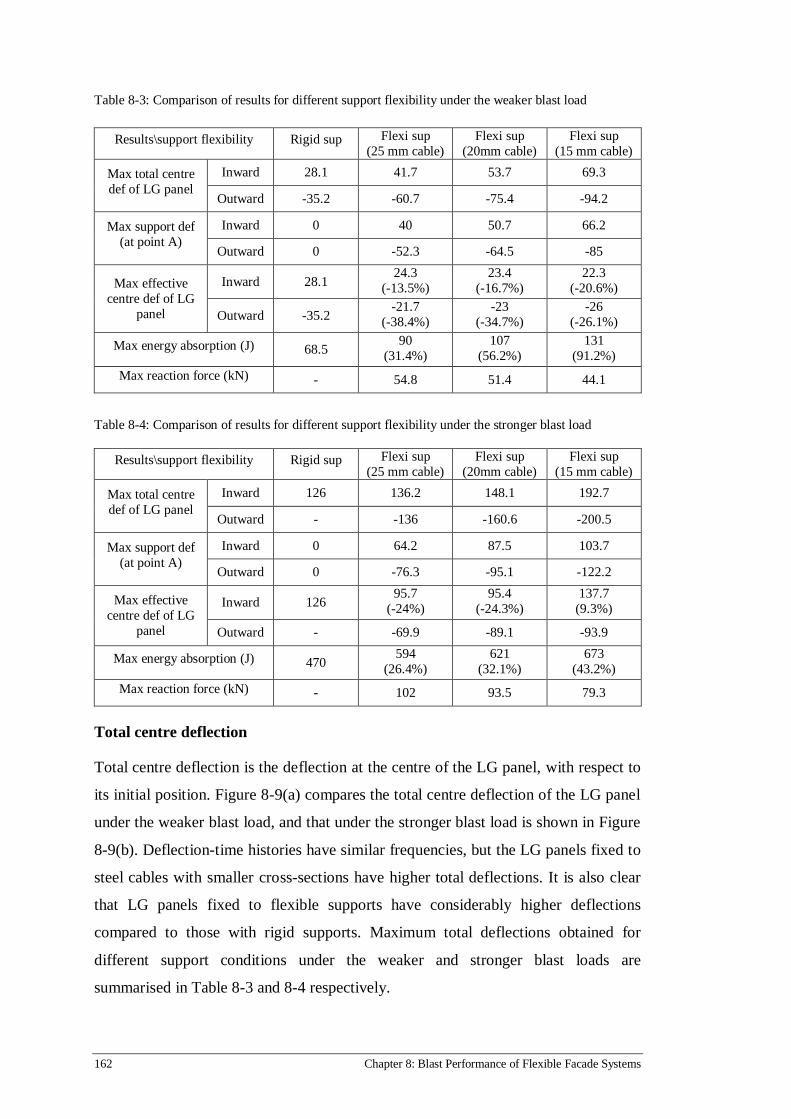
162 Chapter 8: Blast Performance of Flexible Facade Systems
Table 8-3: Comparison of results for different support flexibility under the weaker blast load
Results\support flexibility Rigid sup Flexi sup
(25 mm cable)
Flexi sup
(20mm cable)
Flexi sup
(15 mm cable)
Max total centre
def of LG panel
Inward 28.1 41.7 53.7 69.3
Outward -35.2 -60.7 -75.4 -94.2
Max support def
(at point A)
Inward 0 40 50.7 66.2
Outward 0 -52.3 -64.5 -85
Max effective
centre def of LG
panel
Inward 28.1 24.3
(-13.5%)
23.4
(-16.7%)
22.3
(-20.6%)
Outward -35.2 -21.7
(-38.4%)
-23
(-34.7%)
-26
(-26.1%)
Max energy absorption (J) 68.5 90
(31.4%)
107
(56.2%)
131
(91.2%)
Max reaction force (kN) - 54.8 51.4 44.1
Table 8-4: Comparison of results for different support flexibility under the stronger blast load
Results\support flexibility Rigid sup Flexi sup
(25 mm cable)
Flexi sup
(20mm cable)
Flexi sup
(15 mm cable)
Max total centre
def of LG panel
Inward 126 136.2 148.1 192.7
Outward - -136 -160.6 -200.5
Max support def
(at point A)
Inward 0 64.2 87.5 103.7
Outward 0 -76.3 -95.1 -122.2
Max effective
centre def of LG
panel
Inward 126 95.7
(-24%)
95.4
(-24.3%)
137.7
(9.3%)
Outward - -69.9 -89.1 -93.9
Max energy absorption (J) 470 594
(26.4%)
621
(32.1%)
673
(43.2%)
Max reaction force (kN) - 102 93.5 79.3
Total centre deflection
Total centre deflection is the deflection at the centre of the LG panel, with respect to
its initial position. Figure 8-9(a) compares the total centre deflection of the LG panel
under the weaker blast load, and that under the stronger blast load is shown in Figure
8-9(b). Deflection-time histories have similar frequencies, but the LG panels fixed to
steel cables with smaller cross-sections have higher total deflections. It is also clear
that LG panels fixed to flexible supports have considerably higher deflections
compared to those with rigid supports. Maximum total deflections obtained for
different support conditions under the weaker and stronger blast loads are
summarised in Table 8-3 and 8-4 respectively.

Chapter 8: Blast Performance of Flexible Facade Systems 163
-100
-80
-60
-40
-20
0
20
40
60
80
0 20 40 60 80 100
Defl
ecti
on
(m
m)
Time (ms)
rigid
flexi - 25 mm
flexi - 20 mm
flexi - 15 mm
-250
-200
-150
-100
-50
0
50
100
150
200
0 20 40 60 80 100 120 140
Defl
ecti
on
(m
m)
Time (ms)
rigid
flexi - 25 mm
flexi - 20 mm
flexi - 15 mm
-100
-80
-60
-40
-20
0
20
40
60
80
0 20 40 60 80 100
Defl
ecti
on
(m
m)
Time (ms)
rigid
flexi - 25 mm
flexi - 20 mm
flexi - 15 mm
-150
-100
-50
0
50
100
150
0 20 40 60 80 100 120 140
Defl
ecti
on
(m
m)
Time (ms)
rigid
flexi - 25 mm
flexi - 20 mm
flexi - 15 mm
(a) Under weaker blast load (b) Under stronger blast load
Figure 8-9: Variation of the total deflection at the centre of the LG panel with time for different
support conditions
Support deflection
Support deflection is the lateral deflection at the point A on the window frame with
the deflection of the steel cables. It was found that there is a negligible change in the
lateral deflection along the window frame and hence lateral deflection at a point at
the corner of the window frame (point A) was used as an indicator for the support
flexibility. Figure 8-10(a) compares the support deflection-time histories under the
weaker blast load and that under the stronger blast load is shown in Figure 8-10(b).
As seen with the total deflection, support deflection-time histories have similar
frequencies and the maximum deflection increases with the decrease of the cross-
section of the steel cables as expected. The LG panel fixed to rigid supports has
approximately zero deflection on the window frame, under both blast loads.
(a) Under weaker blast load (b) Under stronger blast load
Figure 8-10: Variation of the deflection at the supports (at point A on the window frame) with time for
different support conditions

164 Chapter 8: Blast Performance of Flexible Facade Systems
-40
-30
-20
-10
0
10
20
30
0 20 40 60 80 100
Defl
ecti
on
(m
m)
Time (ms)
rigidflexi - 25 mmflexi - 20 mmflexi - 15 mm -100
-75
-50
-25
0
25
50
75
100
125
150
0 20 40 60 80 100 120 140Defl
ecti
on
(m
m)
Time (ms)
rigidflexi - 25 mmflexi - 20 mmflexi - 15 mm
Effective centre deflection
The effective centre deflection is the deference between the total deflection and the
deflection at the supports. It is the relative deflection of the LG panel with respect to
its supports that is important when predicting the blast response of the LG panel.
Figure 8-11(a) compares the effective centre deflections of the LG panel for different
support conditions under the weaker blast load. The LG panels with flexible supports
seem to oscillate with a higher frequency, compared those with rigid supports.
Maximum inward and outward deflections obtained from the LG panel with rigid
supports are about 28.1 and -35.1 mm respectively. The maximum inward
deflections of the LG panels with flexible supports vary between 22-25 mm, while
their maximum outward deflections vary between -(21-26) mm. It is clear that the
maximum outward deflections obtained from the LG panels with flexible supports
are smaller, compared to those from the LG panel with rigid supports.
(a) Under weaker blast load (b) Under stronger blast load
Figure 8-11: Variation of the effective centre deflection of the LG panel with time for different
support conditions
Figure 8-11(b) compares these variations under the stronger blast load. The LG panel
with rigid supports has a maximum inward deflection of about 126 mm. It seems to
have been considerably damaged under the blast load, as it does not show a complete
rebound after reaching the maximum deflection. LG panels with flexible supports
have smaller values during the first peak of inward deflection, where the peak value
reduces with the increase of the support flexibility using steel cables with smaller
cross-sections. However, maximum deflections increase with the support flexibility
during the first peak of outward deflection and the second peak of inward deflection.
Maximum inward deflections of the LG panels fixed to steel cables with square

Chapter 8: Blast Performance of Flexible Facade Systems 165
0
20
40
60
80
100
120
140
0 10 20 30 40 50 60
En
erg
y a
bso
rp
tio
n (
J)
Time (ms)
rigid
flexi - 25 mm
flexi - 20 mm
flexi - 15 mm
0
100
200
300
400
500
600
700
0 20 40 60
En
erg
y a
bso
rp
tio
n (
J)
Time (ms)
rigid
flexi - 25 mm
flexi - 20 mm
flexi - 15 mm
cross-sections, having widths of 25, 20 and 15 mm are about 95.7, 95.4 and 137.7
mm respectively, and the corresponding maximum outward deflections are about -
69.9, -89.1 and -93.9 mm respectively. The LG panels with flexible supports seem to
have effective deflections with higher peaks later, compared with their initial peaks.
Total energy absorption
Total energy absorption is the energy absorbed by the all components in the FE
model including LG panel, window frame, fasteners and steel cables. Figure 8-12 (a)
compares the total energy absorption of the FE models for different support
flexibility under the weaker blast load. Maximum energy absorbed by the LG panel
with rigid supports is about 68.5 J and it increases to about 90, 107 and 131 J for the
LG panels fixed to steel cables with 25, 20 and 15 mm width square cross-sections
respectively.
Figure 8-12 (b) compares these variations under the stronger blast load. Maximum
energy absorbed by the LG panel with rigid supports is about 470 J and those
obtained from the LG panels fixed to steel cables having 25, 20 and 15 mm width
square cross-sections are about 594, 621 and 673 J respectively. Overall, it is evident
that there is a considerable increase in the energy absorptions with the increase of the
support flexibility under both blast loads. As an example, the LG panel fixed to steel
cables with a 15 mm square cross-section shows about 91.2% and 43.2% increases in
the total energy absorption under weaker and stronger blast loads respectively,
compared to those obtained from the LG panel with rigid supports.
(a) Under weaker blast load (b) Under stronger blast load
Figure 8-12: Variation of the total energy absorption of the FE model with time for different support
conditions

166 Chapter 8: Blast Performance of Flexible Facade Systems
-10
0
10
20
30
40
50
60
0 20 40 60 80 100
Su
pp
ort
reacti
on
(k
N)
Time (ms)
flexi - 25 mm
flexi - 20 mm
flexi - 15 mm
-20
0
20
40
60
80
100
120
0 20 40 60 80 100 120
Su
pp
ort
reacti
on
(k
N)
Time (ms)
flexi - 25 mm
flexi - 20 mm
flexi - 15 mm
Support reactions
Figure 8-13(a) compares the variation of the support reaction at the edge of the
horizontal cable with time under the weaker blast load for different support
flexibility. Reaction forces are high during the second peak and the maximum
reaction forces obtained from the LG panels fixed to steel cables with 25, 20 and 15
mm width square cross-sections are about 54.8, 51.4 and 44.1 kN respectively.
Figure 8-13(b) compares these variations under the stronger blast load and the
corresponding maximum reaction forces are about 102, 93.5 and 79.3 kN
respectively. Overall, it is evident that the steel cables with smaller cross-sections
have considerably less reaction forces, compared to those with larger cross-sections.
As an example, the steel cable with a 15 mm square cross-section has about 19.5%
and 22.3% less reaction forces under the weaker and stronger blast loads
respectively, compared with the steel cable with a 25 mm square cross-section.
(a) Under weaker blast load (b) Under stronger blast load
Figure 8-13: Variation of the reaction force at the edge of the horizontal cable with time for steel
cables with different cross-sections
Fracture of glass panes
Fracture and crack propagations of the glass panes are compared under the stronger
blast load, as it caused considerably more damage to the LG panel than the weaker
blast load. Figure 8-14 compares the fracture of the front and back glass panes of the
LG panel fixed to rigid supports at different times. The LG panel had a maximum
deflection at about 15 ms and then it remained around that thereafter, indicating that
it might have been considerably damaged during the first peak of inward deflection.
Both front and back glass panes have fractured at 15 ms and the back glass pane has
slightly more fracture lines than the front glass pane, as it attracts more tensile

Chapter 8: Blast Performance of Flexible Facade Systems 167
stresses when the LG panel deflects inward. However, both glass panes do not show
further increase in fracture lines thereafter, confirming that they have been
considerably damaged during the first peak of inward deflection.
(a) Front glass pane at 15 ms (b) Front glass pane at 75 ms (c) Front glass pane at 120 ms
(d) Back glass pane at 15 ms (e) Back glass pane at 75 ms (f) Back glass pane at 120 ms
Figure 8-14: Fracture of glass panes of the LG panel fixed to rigid supports under the stronger blast
load
Figure 8-15 compares the fracture of the glass panes of the LG panel fixed to steel
cables with 20 mm width square cross-sections, while those of the LG panel fixed to
steel cables with 15 mm width square cross-sections are shown in Figure 8-16. These
LG panels had smaller peaks during the first peak of inward deflection (at about 12
ms), compared to that of the LG panel with rigid supports, and hence glass panes of
these LG panels have fewer fracture lines, with smaller width at about 12 ms,
compared to those seen with the LG panel with rigid supports. Both LG panels had
their maximum outward deflections at about 75 ms, where they show an increase in
the fracture lines, especially on the front glass panes, which attract more tensile
stresses. They had their maximum inward deflections at about 120 ms, where there is
further increase in the fracture lines, especially on the back glass pane of the LG
panels. Overall, it is evident that LG panels with flexible supports have less damage
to the glass panes initially, but they could fracture further when they oscillate with
time.

168 Chapter 8: Blast Performance of Flexible Facade Systems
(a) Front glass pane at 12 ms (b) Front glass pane at 75 ms (c) Front glass pane at 120 ms
(d) Back glass pane at 12 ms (e) Back glass pane at 75 ms (f) Back glass pane at 120 ms
Figure 8-15: Fracture of glass panes of the LG panel fixed to steel cables with 20 mm width square
cross-sections under the stronger blast load
(a) Front glass pane at 12 ms (b) Front glass pane at 75 ms (c) Front glass pane at 120 ms
(d) Back glass pane at 12 ms (e) Back glass pane at 75 ms (f) Back glass pane at 120 ms
Figure 8-16: Fracture of glass panes of the LG panel fixed to steel cables with 15 mm width square
cross-sections under the stronger blast load
Failure analysis of the interlayer
The plastic strain variation and the stresses at the critical locations of the interlayer
were analysed to investigate its behaviour under the stronger blast load. When the
glass fractures, the interlayer attracts high stresses along the fracture lines, where it
has high plastic strains. Figure 8-17 shows the plastic strain variation at the bottom
surface of the interlayer of the LG panel with rigid supports. The interlayer has high
plastic strains at about 15 ms, but it does not show an increase in the plastic strains
thereafter, as observed with the fracture of glass panes. This confirms that the first

Chapter 8: Blast Performance of Flexible Facade Systems 169
peak of inward deflection is critical for the LG panel with rigid supports under higher
blast loads. By analysing the von Mises stress (σv) at the locations with high plastic
strain, it was found that some of the interlayer elements have reached their failure
stress of about 28 MPa.
(a) At 15 ms (b) At 75 ms (c) At 120 ms
Figure 8-17: Plastic strain variation at the bottom surface of the interlayer of the LG panel fixed to
rigid supports under the stronger blast load
Figure 8-18 shows the plastic strain variation at the bottom surface of the interlayer
of the LG panel fixed to steel cables with 20 mm width square cross-sections, while
that of the LG panel fixed to steel cables with 15 mm width square cross-sections is
shown in Figure 8-19. The LG panels with flexible supports had less damage to the
glass panes initially, and similarly, their interlayers have smaller plastic strains at
about 12 ms. However, interlayers of these LG panels have high plastic strains
during the first peak of outward deflection (at about 75 ms) and the second peak of
inward deflection (at about 125 ms) of the LG panel. The highest deflection of these
LG panels occurred at about 120 ms and hence, the interlayers have considerably
high plastic strains at that time. None of the interlayer elements have reached thieir
failure stress during the initial peaks of deflections, but some of them reach the
failure stress at about 120 ms. This is mostly seen for the LG panel with flexible
supports, having steel cables with 15 mm width square cross-sections. It is therefore
evident that the LG panels with flexible supports are more likely to fail during the
later peaks of deflections, rather than at the intial peak.
(a) At 12 ms (b) At 75 ms (c) At 120 ms
Figure 8-18: Plastic strain variation at the bottom surface of the interlayer of the LG panel fixed to steel cables with 20 mm width square cross-sections under the stronger blast load

170 Chapter 8: Blast Performance of Flexible Facade Systems
(a) At 12 ms (b) At 75 ms (c) At 120 ms
Figure 8-19: Plastic strain variation at the bottom surface of the interlayer of the LG panel fixed to
steel cables with 15 mm width square cross-sections under the stronger blast load
Component energy absorptions
The energy absorption (summation of internal and kinetic energies) variations of the
different components of the FE model, such as glass panes, interlayer, sealant, frame
and supports are compared under the stronger blast load. Figure 8-20 illustrates these
variations for the LG panel fixed to rigid supports. Glass panes absorb most of the
blast energy initially, but they make a small contribution to the energy absorption
after they damage during the first peak of inward deflection. The interlayer shows a
sudden increase in the energy absorption with the damage to the glass panes. It
makes a significant contribution to the energy absorption, by absorbing about 66% of
the total energy after about 50 ms. The sealant joints make a noticeable contribution
(about 16%) to the total energy absorption, while the window frame makes a
negligible contribution. By analysing the energy absorption of the components, it can
be also confirmed that the LG panel with rigid supports has considerably damaged
during the first peak of deflection.
Figure 8-21 compares these variations for the LG panel fixed to flexible supports,
having steel cables with 15 mm square cross-section. Glass panes absorb most of the
energy initially. However, in contrast to that seen with the LG panel with rigid
supports, here the glass panes have higher peaks of energy absorptions even during
the latter peaks of deflections, confirming that they have a little damage during the
first peak of inward deflection. The steel cables show a sudden increase in the energy
absorption, and make the most contribution to the energy absorption (more than
45%) during 50-100 ms. The energy absorption of the interlayer shows a gradual
increase and reaches a maximum value at about 130 ms (during the second peak of
the inward deflection), by contributing about 38% of the total energy. Sealant joints
make the least contribution to the energy absorption (less than 3%), showing a

Chapter 8: Blast Performance of Flexible Facade Systems 171
0
50
100
150
200
250
300
350
400
450
500
0 20 40 60 80 100 120 140
En
erg
y a
bso
rp
tio
n (
J)
Time (ms)
Glass
Interlayer
Sealant
Frame
Cables
0
50
100
150
200
250
300
350
0 10 20 30 40 50 60 70 80 90 100
En
erg
y a
bso
rp
tio
n (
J)
Time (ms)
Glass
Interlayer
Sealant
Frame
significant reduction compared to that seen for LG panel with rigid supports. This
also confirms that the flexible supports can minimise the energy absorption of the
sealant joints, which allows optimising them under a credible blast load.
Figure 8-20: Variation of the component energy absorptions for the LG panel fixed to rigid supports
with time under the stronger blast load
Figure 8-21: Variation of the component energy absorptions for the LG panel fixed to steel cables
with 15 mm width square cross-sections under the stronger blast load
8.5 CHAPTER SUMMARY
This chapter presented the results from a comprehensive study, which was carried
out to investigate the blast performance of flexible façade systems by accounting for
the negative phase of the blast loads. Initially, the influence of the negative phase on
the blast response of a LG panel with different support conditions was investigated.
Results showed that the negative phase of a blast load has less impact on the centre
deflection, energy absorption and the support reactions of LG panels with rigid
supports. They can mostly fail during the first peak of inward deflection under higher
blast loads, which is less influenced by the negative phase. Approximating the blast
load with the positive phase only, is therefore accurate enough for the design of LG

172 Chapter 8: Blast Performance of Flexible Facade Systems
panels with rigid supports. However, LG panels with flexible supports are quite
sensitive to the negative phase, especially under higher blast loads. The negative
phase could considerably increase the peak deflections, energy absorption and the
reaction forces at the edge of the steel cables. It is therefore recommended that the
negative phase be accounted for in the design of flexible facades under blast loads.
The blast response of a LG panel fixed to rigid supports was compared with that
fixed to flexible supports with steel cables. Steel cables undergo larger deflections,
enhancing the energy absorption, while minimising the net deflection and damage to
the LG panels. The LG panels with flexible supports are vulnerable to failure at their
later peaks of deflections, unlike those with rigid supports, which could mostly fail
during the first peak of inward deflection. Flexible supports could delay the failure of
LG panels, which are more likely to fail after dissipation of the blast pressure,
minimising the injuries occurring from direct blast pressure and the broken glass
fragments. Flexible supports reduce the energy absorbed by the sealant joints, and
hence sealant joints in these supports can be optimised, compared to those used with
rigid supports. The blast performance of flexible facades can be further improved by
using steel cables with smaller cross-sections, as they could increase the energy
absorption while reducing reaction forces at the steel cables.

Chapter 9: Conclusion 173
Chapter 9: Conclusion
This chapter starts with a brief summary of the research and then it presents the main
findings of the research, followed by their applications. Finally, recommendations for
future research are presented by discussing the limitations in this research.
9.1 SUMMARY
The research presented in this thesis investigated the behaviour of facades fabricated
with laminated glass (LG), subjected to unconfined, near field explosions. This
research was carried out using finite element (FE) modelling with LS-DYNA explicit
FE code, and the LG panels were modelled with three-dimensional (3D) constant
stress solid elements incorporating glass, interlayer and structural sealant joints. The
study was extended to evaluate the influence of support flexibility (rigid and flexible
supports) on the blast performance of the LG panels. Present modelling techniques
were validated using the results from past experiments. The period of free vibration
and the peak values of deflections and the failure patterns under two different blast
loadings were compared. The results from the FE analysis agreed reasonably well
with those from the experiments, confirming that the modelling techniques presented
in this thesis could be used to study the behaviour of LG under blast loads, by
accounting for its post-crack behaviour and also to study the failure of constituent
components.
The developed numerical models were used for the parametric study, which
investigated the influence of geometric and material properties, support conditions
and energy absorption. The effects of important parameters, including glass pane
thickness, tensile strength (T) of glass, interlayer thickness, interlayer Young’s
modulus (E), sealant width, sealant thickness and sealant Young’s modulus on the
blast performance of LG were studied in this research. Finally, the blast response of
cable net facades with LG windows to simulate flexible supports was studied by
using comprehensive FE models, incorporating LG panels, window frames, fasteners
and steel cables. The main findings of this research are presented below.

174 Chapter 9: Conclusion
En
erg
y (
J)
Time (ms)
Glass
Interlayer
En
erg
y (
J)
Time (ms)
Glass
Interlayer
9.2 MAIN FINDINGS
1. The FE models developed in this research account for the damaged strength of
glass and the structural sealant joints. They have the ability to model the post-
crack behaviour of LG with reasonable accuracy. Results from FE analysis for
centre deflection, energy absorption, fracture of glass panes and stress-strain
variations and energy absorptions of the constituent components can be used to
evaluate the resistance and failure of these components and hence evaluate the
overall performance of the LG panels.
2. The tearing of the interlayer is the safest mode of failure for a LG panel as it
enhances the energy absorption and reduces the support reactions. This failure
mode of a LG panel can be identified with energy absorption comparisons as
illustrated in chapters 4, 5 and 6 for specific cases and as shown in Figure 9.1(a)
for a general case, where the interlayer dominates the energy absorption after the
glass breaks. However, LG panels that are overdesigned with thicker glass layers
or using glass types with higher tensile strength will have energy absorption
curves as shown in Figure 9.2(b) for a general case, where the glass panes absorb
most of the blast energy, while the undamaged interlayer makes little
contribution to the energy absorption. Such energy absorption curves can be
developed using the analytical technique presented in this thesis and will serve as
design tools to enable the design of glass and interlayer to initiate the safer failure
mode along with enhanced energy absorption.
(a) Recommended (b) Not recommended
Figure 9-1: Energy absorption comparison of glass and interlayer
3. The glass and interlayer properties (thickness and strength parameters) are
important in the design a LG panel under a credible blast load where the failure is
initiated by tearing of the interlayer, giving an energy absorption curve as shown

Chapter 9: Conclusion 175
Maxim
um
defl
ecti
on
(m
m)
Interlayer thickness (mm)
in Figure 9-1(a). The thickness designation of glass panes can be obtained
according to current design standards (if they are applicable) in the preliminary
design. For a given glass thickness, analyses can be performed for different
values of interlayer thickness to develop design information relating maximum
deflection to interlayer thickness (as in Figure 9-2 for a general case) in order to
identify the critical interlayer thickness in the design. For a given value of glass
thickness and Young’s modulus of the interlayer, the critical interlayer thickness
may be defined as that which causes the onset of interlayer failure. When the
interlayer thickness reduces below the critical value, there is a sudden increase in
the maximum deflection due to the failure of the interlayer which is the preferred
failure pattern of a LG panel. Interlayer thickness can be selected based on this
information and will contribute towards the development of a safe and acceptable
design of LG based on performance.
Figure 9-2: Determination of the critical interlayer thickness
4. The deflection, energy absorption and support reaction-time histories provide
useful information on the blast performance of LG panels. It is important to
maximise the deflections and energy absorptions of LG panels, while minimising
the support reactions. Parametric studies have been carried out to investigate the
contribution of these important properties comprising glass thickness designation
(GTD), tensile strength (T) of glass, interlayer thickness, interlayer Young’s
modulus, sealant width, sealant thickness and sealant Young’s modulus on the
blast performance of LG. Results showed that these parameters should be
carefully considered in the design of LG. The recommendations shown below
will enable a safe and efficient energy absorbing system for a credible blast load.
Thinner glass panes (with a lower thickness designation) and low tensile
strength glass such as annealed glass initiate the failure in the interlayer.
Critical interlayer thickness

176 Chapter 9: Conclusion
Choice of the interlayer thickness and E, as described in 3 above can be used
to initiate a safe failure mode with maximum deformation and energy
absorption.
Sealant joints with appropriate combinations of width, thickness and Young’s
modulus can be determined to minimise support reactions, increase energy
absorption and thereby mitigate catastrophic failure modes, as demonstrated
in chapter 7 of this thesis.
5. The blast response of LG panels with rigid and flexible support conditions were
investigated for positive and negative phases of the blast load. Results showed
that the negative phase of a blast load has less impact than the positive phase on
centre deflection, energy absorption and the support reactions of LG panels with
rigid supports. They will in general fail during the first peak of inward deflection
when blast loads exceed strength capacity. Approximating the blast load with the
positive phase can be considered adequate for the design of LG panels with rigid
supports.
6. The blast response of LG panels with flexible supports was investigated to
supplement the above studies by using a cable supported system where the
elongation of the cables provided support flexibility. The findings of this study
are as follows:
LG panels with flexible supports were found to be sensitive to the negative
phase, as well as the positive phase, especially under high blast loads. The
negative phase can considerably increase the peak deflection, energy
absorption and the cable reaction forces. It is therefore recommended that the
negative phase be accounted for, in the design of LG panels with flexible
supports subjected to blast loads.
Steel cables used in flexible facades undergo larger deflections, enhancing the
energy absorption, while minimising the effective deflection and damage to
the LG panels. LG panels with flexible supports are vulnerable to fail during
their later peaks of deflections, unlike those with rigid supports which mostly
fail during the initial peak of inward deflection. Flexible supports reduce the
energy absorbed by the sealant joints, and hence the dimensions of the sealant
joints in these supports can be reduced compared to those used with rigid
supports.
Chapter 9: Conclusion 177
Flexible supports can delay the failure of LG panels, which are more likely to
fail after dissipation of the blast pressure, minimising the injuries occurring
from direct blast pressure and the broken glass fragments. Blast performance
of flexible facades can be further improved by using close spaced steel cables
with smaller cross-sections, as they could increase the energy absorption,
while reducing the cable reaction forces.
9.3 CONTRIBUTION AND APPLICATION OF THE RESEARCH
This research provides an analytical technique for the design of glazed facades with
LG subjected to near field blast loads. A rigorous analytical procedure, based on FE
method has been developed with 3D solid elements, incorporating all components
participating in the blast resistant glazing, including interlayer, structural sealant
joints, and support stiffness to study the blast response of LG, and accounting for its
post-cracking behaviour. Modelling techniques developed in this study can be used
to compliment and supplement the current design methods, and also can be extended
for future research in this area.
LG panels are expected to fracture under blast loads, and the entire unit will be
replaced after such an event. The most important design criterion for blast resistant
glazing is energy dissipation without hazardous and catastrophic failure. If the panels
are designed with low energy dissipation, the failure mode will extend to the
supports and supporting secondary structure, resulting in catastrophic damage. The
tearing of the interlayer is considered to be a safer failure mode than failure at the
supports when subjected to blast loads. As a result, the design needs to maximise the
energy absorption of the LG panel and reduce the forces transferred to supports with
failure initiated by tearing of the interlayer. Design aids similar to those shown in
Figures 9-1 and 9-2 can be developed using the modelling techniques presented in
this study and these will enable efficient designs of LG when subject to blast loads of
different magnitudes.
It is important to identify the combination of geometric and material properties of all
the key constituent components of the glazing system, in order to optimise a safe and
efficient design. Findings from the comprehensive parametric studies carried out in
this research, provide useful information to optimise the components in a LG panel,
minimising the material cost, while enhancing appearance of the facade system. All

178 Chapter 9: Conclusion
these component materials, including glass, polymer interlayer and sealant materials
are manufactured materials, and hence, the knowledge generated in this study will
encourage manufactures to innovate new materials, which can absorb more energy to
improve the blast performance of a LG panel.
Results from this study confirmed that the negative phase of a blast load has less
impact for the LG panels with rigid supports. They can therefore be analysed by
using the positive phase only, saving the high computational cost and time involved
with numerical analysis. However, the negative phase of the blast load must be
considered in the analysis of LG panels with flexible supports, such as cable net
facade systems. Such facade systems using steel cables that simulated flexible
supports, showed improved blast performance, compared to those with rigid
supports. This research work will make a significant contribution to the analytical
and design techniques that are currently used by engineers in the design of LG panels
subjected to blast loading. It will also assist in the enhancement of safety, using
repetitive simulation studies. The findings of this research will facilitate the efficient
and economically feasible design of blast resistant glazing with LG, to provide
safety, and minimise injuries and loss of lives from the potential blast attacks.
9.4 FUTURE RESEARCH
Although the numerical studies described in this thesis addressed a wide range of
topics, additional study is required to provide comprehensive design guidance of
building facades, using LG subjected to near field blast loads. The following topics
for future research are recommended.
Extensive experimental studies for calibration of FE models that have been
developed in this research using different strength grades and mechanical
properties of constituent materials.
This research modelled the window frame as rigid, by neglecting its deformations
for simplicity. This study can be extended to develop complete FE models,
accounting for the window frame and supporting structures similar to the work
that has been carried out in Chapter 8.
This research investigated the blast performance of relatively smaller LG panels
in order to reduce the computational cost and time involved with repetitive
analysis. However, the modelling techniques and the design framework

Chapter 9: Conclusion 179
developed in this study can be extended for the investigation of larger LG panels
with different shapes.
Glass panels were modelled with 3D solid elements in this study. Though the
damaged strength of glass was accounted for in the FE models, severely damaged
glass elements were deleted from the FE model to simplify the analysis. The
Smooth Particle Hydrodynamic (SPH) method, which simulates the glass with
mesh-free particles, could be a topic for future research.
Blast loads were applied as a pressure load on the front glass pane during the
present study. Future analysis can be carried out by modelling the blast wave
propagation in the air domain, which will simulate the fluid structure interaction
(FSI) effects.
The performance of the flexible facades was investigated in this study, by using
simplified FE models incorporating a single LG panel supported with steel cables
having square cross sections. This study can be extended to a complete facade
system having several LG panels. More accurate FE models can be developed in
future by using steel cables with circular cross-sections instead of using square
cross sections, and also accounting for the pre-stress force in steel cables which
were not treated in this study.
Present study was limited to investigate the blast response of LG panels based on
FE analysis. The development of analytical formulae to predict the blast response
of LG panels will be very useful to practicing engineers. So, the present study
can be extended to develop some empirical formulae to predict the blast response
of LG panels with different support conditions.
Point supported LG panels are frequently used in buildings. This research can be
extended to study their behaviour under blast loads.

180

References 181
References
AJJ Glass Products Co. Ltd. (n. d.). Laminated safety glass [image]. Retrieved April
20, 2014, from http://www.tradeget.com/listing/ajj-glass-products-
coltd/productsservices/ 83993/1.
Amadio, C., & Bedon, C. (2012a). Elastoplastic dissipative devices for the mitigation
of blast resisting cable-supported glazing façades. Engineering Structures, 39,
103-115.
Amadio, C., & Bedon, C. (2012b). Viscoelastic spider connections for the mitigation
of cable-supported facades subjected to air blast loading. Engineering
Structures, 42, 190-200.
American Society for Testing and Materials (ASTM) E 1300-09a. (2009). Standard
practice for determining load resistance of glass in buildings. West
Conshohocken, PA: ASTM International.
American Society for Testing and Materials (ASTM) F 1642-04. (2010a). Standard
test method for glazing and window systems subject to air blast loadings. West
Conshohocken, PA: ASTM International.
American Society for Testing and Materials (ASTM) F 2248-09. (2010b). Standard
practice for specifying an equivalent 3-second duration design loading for blast
resistant glazing fabricated with laminated glass. West Conshohocken, PA: ASTM International.
Australian standard (AS) 1288-2006. (2006). Glass in buildings-selection and
installation. Retrieved from http://www.saiglobal.com.
Bambach, M. R. (2008). Behaviour and design of aluminium hollow sections subjected to transverse blast loads. Thin-Walled Structures, 46(12), 1370-1381.
Bennison, S., Sloan, J., Kistunas, D., Buehler, P., Amos, T., & Smith, C. (2005,
August). Laminated glass for blast mitigation: Role of interlayer properties.
Paper presented at the 9th international conference proceedings of the Glass
Processing Days, Tampere, Finland.
British standard (BS) EN 13541. (2001). Glass in buildings - Security glazing -
Testing and classification of resistance against explosion pressure.
London, United Kingdom: British Standards Institution.
Chung, J. H., Consolazio, G. R., Dinan, R. J., & Rinehart, S. A. (2010). Finite-
element analysis of fluid-structure interaction in a blast-resistant window
system. Journal of Structural Engineering, 136(3), 297-306.
Cormie, D., Mays, G., & Smith, P. (2009). Blast effects on buildings (2nd
ed.). 40 Marsh Wall, London: Thomas Telford Services Ltd.
David, H., & Andy, L. (2005, May). The role of external facade in protecting
building occupants against terrorism and impacts. Paper presented at the Materials Science and Technology in Engineering Conference, Hong Kong.

182 References
European Standard (prEN) 13474-3. (2008). Glass in buildings - Determination of
the strength of glass panes. part 3: General method of calculation and
determination of strength of glass by testing. London, United Kingdom: British
Standards Institution.
Fischer, K., & Häring, I. (2009). SDOF response model parameters from dynamic blast loading experiments. Engineering Structures, 31(8), 1677-1686.
Gartner, F. W. (2011, June). Blast enhanced cable facades. Paper presented at the
11th international conference proceedings of the Glass Performance Days 2011,
Tampere, Finland.
General Services Administration (GSA) Standard. (2003). Standard test method for
glazing and window systems subject to dynamic overpressure loadings, US.
Ghosh, P. (2011, July 23). Smoke billows from a building at the site of a powerful
explosion that rocked central Oslo July 22, 2011 [image]. International Business
Times. Retrieved from http://www.ibtimes.com.
Hallquist, J. O. (2006). LS-DYNA version 970 theory manual. Livermore, Calif: Livermore Software Technology Corporation.
Hidallana-Gamage, H. D., Thambiratnam, D. P., & Perera, N. J. (2013a).
Computational analysis of laminated glass panels under blast loads: A
comparison of two dimensional and three dimensional modelling approaches.
The International Journal of Engineering and Science, 2(8), 69-79.
Hidallana-Gamage, H. D., Thambiratnam, D. P., & Perera, N. J. (2013b). Failure
analysis of laminated glass panels subjected to blast loads. Engineering Failure
Analysis, 36, 14-29.
Hidallana-Gamage, H. D., Thambiratnam, D. P., & Perera, N. J. (2014a). Numerical
modelling and analysis of the blast performance of laminated glass panels and
the influence of material parameters. Engineering Failure Analysis, 45, 65-84.
Hidallana-Gamage, H. D., Thambiratnam, D. P., & Perera, N. J. (2014b). Influence
of structural sealant joints on the blast performance of laminated glass panels.
Journal of Performance of Constructed Facilities, Accepted for publication. doi: 10.1061/(ASCE)CF.1943-5509.0000646.
Hidallana-Gamage, H., Thambiratnam, D., & Perera, N. (2015). Design Guidance for
Blast-Resistant Glazing. Journal of architectural engineering, 04015003. doi: 10.1061/(ASCE)AE.1943-5568.0000161
Holmquist, T. J., Johnson, G. R., Lopatin, C., Grady, D., & Hertel Jr, E. S. (1995).
High strain rate properties and constitutive modelling of glass. United States: Sandia National Labs, Albuquerque, NM.
Hooper, P. A., Sukhram, R. A. M., Blackman, B. R. K., & Dear, J. P. (2012a). On the
blast resistance of laminated glass. International Journal of Solids and Structures, 49(6), 899-918.
Hooper, P. A., Blackman, B. R. K., Dear, J. P. (2012b). The mechanical behaviour of
poly (vinyl butyral) at different strain magnitudes and strain rates. Journal of Materials Science, 47, 3564- 3576.

References 183
International Organization for Standardization (ISO) 48. (1994). Rubber, vulcanized
or thermoplastic: Determination of hardness (hardness between 10 IRHD and 100 IRHD). Geneva, Switzerland: ISO.
International Organization for Standardization (ISO) 16933. (2007a). Glass in
building-Explosion-resistant security glazing - Test and classification for arena air-blast loading. Geneva, Switzerland: ISO.
International Organization for Standardization (ISO) 16934. (2007b). Glass in
building - Explosion resistant security glazing - Test and classification by shock tube loading. Geneva, Switzerland: ISO.
Iwasaki, R., Sato, C., Latailladeand, J. L., & Viot, P. (2007). Experimental study on
the interface fracture toughness of PVB (polyvinyl butyral)/glass at high strain rates. International Journal of Crashworthiness, 12(3), 293-298.
Jama, H. H., Nurick, G. N., Bambach, M. R., Grzebieta, R. H., & Zhao, X. L. (2012).
Steel square hollow sections subjected to transverse blast loads. Thin-Walled Structures, 53(0), 109-122.
Jayasinghe, L. B. (2014). Blast response and vulnerability assessment on piled
foundations (doctoral dissertation). Queensland University of Technology, Brisbane, Australia.
Jayasooriya, R. (2010). Vulnerability and damage analysis of reinforced concrete
framed buildings subjected to near field blast events (doctoral dissertation). Queensland University of Technology, Brisbane, Australia.
Johnson, G. R., & Holmquist, T. J. (1993, June-July). An improved computational
constitutive model for brittle materials. Paper presented at the AIP Conference Proceedings, Colorado Springs, Colorado, United State of America.
Kaiser, N. D., Behr, R. A., Minor, J. E., Dharani, L. R., Ji, F., & Kremer, P. A.
(2000). Impact Resistance of Laminated Glass Using ``Sacrificial Ply'' Design Concept. Journal of architectural engineering, 6(1), 24-34.
Karagozian & Case. (n. d.). Low cost blast resistant facades [image]. Retrieved April
19, 2014, from http://www.kcse.com/case-studies/design-analysis-of-blast-shock-and-impact/low-cost-blast-resistant-facades.
Kranzer, C., Gürke, G., & Mayrhofer, C. (2005, August). Testing of bomb resistant
glazing systems: Experimental investigation of the time dependent deflection of
blast loaded 7.5 mm laminated glass. Paper presented at the 9th international
conference proceedings of the Glass Processing Days, Tampere, Finland.
Krauthammer, T., & Altenberg, A. (2000). Negative phase blast effects on glass panels. International Journal of Impact Engineering, 24(1), 1-17.
Krishnan, K., Sockalingam, S., Bansal, S., & Rajan, S. D. (2010). Numerical
simulation of ceramic composite armor subjected to ballistic impact. Composites Part B: Engineering, 41(8), 583-593.
Kumar, P., LeBlanc, J., Stargel, D. S., & Shukla, A. (2012). Effect of plate curvature
on blast response of aluminum panels. International Journal of Impact Engineering, 46(0), 74-85.
184 References
Larcher, M., Solomos, G., Casadei, F., & Gebbeken, N. (2012). Experimental and
numerical investigations of laminated glass subjected to blast loading. International Journal of Impact Engineering, 39(1), 42-50.
Liew, J. Y. R. (2008). Survivability of steel frame structures subject to blast and fire.
Journal of Constructional Steel Research, 64(7–8), 854-866.
Lin, L., Hinman, E., Stone, H., & Roberts, A. (2004). Survey of window retrofit
solutions for blast mitigation. Journal of Performance of Constructed Facilities,
18(2), 86-94.
Lumantarna, R., Ngo, T., Mendis, P., & Lam, N. (2007, September). Behaviour and
modelling of glazing components subjected to full-scale blast tests in Woomera.
Paper presented at the proceedings of the RNSA Security Technology Conference, Melbourne, Australia.
Lusk, B., Salim, H., Perry, K., Nawar, M., Wedding, W. C., Kiger, S., & Ibrahim, A.
(2011, April). Modelling and testing of laminated window systems under blast
loading. Paper presented at the Structures Congress, Las Vegas, Nevada, United
States.
Mendis, P., & Ngo, T. (2003, May). Vulnerability assessment of concrete tall
buildings subjected to extreme loading conditions. Paper presented at the CIB-
CTBUH International Conference on Tall Buildings, Malaysia.
Menzin, A. (2006). The Influence of boundary conditions and higher mode shapes on
first crack prediction for blast resistant glazing systems (Master’s Thesis).
Massachusetts Institute of Technology, Cambridge, Massachusetts, United States.
Morison, C. (2010). The resistance of laminated glass to blast pressure loading and
the coefficients for single degree of freedom analysis of laminated glass. (doctoral dissertation), Cranfield University, United Kingdom.
Müller, I. R., & Wanger, M. (2006). Computation of blast resistant window and
facade constructions.
Nawar, M., Salim, H., Lusk, B., Perry, K., Kiger, S., & Miller, G. (2013). Modeling
and testing of laminated curtain wall systems under blast loading. Paper
presented at the Structures Congress 2013, Pittsburgh, Pennsylvania, United States.
Netherton, M., & Stewart, M. (2006). Security risks and structural reliablity of
window glazing subjected to explosive blast loading. Paper presented at the 3rd
international ASRANet Colloquim, Glasgow, United Kindom
Netherton, M. D., & Stewart, M. G. (2009). Probabilistic modelling of safety and
damage blast risks for window glazing. Canadian Journal of Civil Engineering, 36(8), 1321-1331.
Ngo, T., Mendis, P., Gupta, A., & Ramsay, J. (2007). Blast loading and blast effects
on structures - An overview. Electronic Journal of Structural Engineering, 7, 76-91.

References 185
Norville, H., & Conrath, E. (2001). Considerations for blast-resistant glazing design.
Journal of architectural engineering, 7(3), 80-86.
Norville, H. S., & Conrath, E. J. (2006). Blast-resistant glazing design. Journal of architectural engineering, 12(3), 129-136.
Ogden, R. G. (1992). Curtain wall connections to steel frames (P101). Ascot,
Berkshire, United Kindom: The Steel Construction Institute.
Oklahoma Department of Civil Engineering Management. (1995). After action report
Alfred P. Murrah Federal Building Bombing, 19 April 1995 in Oklahoma City,
Oklahoma. Oklahoma: Department of Central Services, Central Printing Division.
Patterson, M. R. (2008). Structural glass facades: A unique building technology
(Master’s Thesis), University of Southern California, Los Angeles, CA, United States.
Peroni, M., Solomos, G., Pizzinato, V., & Larcher, M. (2011). Experimental
investigation of high strain-rate behaviour of glass. Paper presented at the Applied Mechanics and Materials, 82, 63-68.
Protective Design Centre Technical Report (PDC-TR) 10-02. (2012). Blast resistant
design methodology for window systems designed statically and dynamically. United States: US Army Corps of Engineers.
Remennikov, A., Chipperfield, L., & McInerney, N. (2008). Experimental
investigation of load-deformation response for blast-resistant facade glazing
solutions. Paper presented at the Australian Structural Engineering Conference,
Melbourne, Australia.
Smith, D. (2001, June). Glazing for injury alleviation under blast loading–United
Kingdom practice. Paper presented at the 7th international conference
proceedings of the Glass Processing Days, Tampere, Finland.
Steve, M. (2009, March). Worldwide environmental rating schemes and their impact
on designers' perception. Paper presented at the conference of the Facade
Design & Engineering, Dubai.
Swofford, J. L. (1996). Damage resulting from the Oklahoma City bomb (Master’s Thesis). Texas Tech University, Lubbock, United States.
Timmel, M., Kolling, S., Osterrieder, P., & Du Bois, P. A. (2007). A finite element
model for impact simulation with laminated glass. International Journal of Impact Engineering, 34(8), 1465-1478.
Unified Facilities Criteria (UFC) 3-340-02. (2008). Structures to resist the effect of
accidental explosions. Washington DC: US Department of Defence.
Unified Facilities Criteria (UFC) 4-010-01. (2013). DOD Minimum antiterrorism standards for buildings. Washington DC: US Department of Defence.
United Kindom Glazing Hazard Guide. (1997). Glazing hazard guide, cubicle
standoffs, tables and charts. Security Facilities Executive Special Service Group - Explosive protection, Cabinet Office, London.

186 References
Urgessa, G. S., & Arciszewski, T. (2011). Blast response comparison of multiple
steel frame connections. Finite Elements in Analysis and Design, 47(7), 668-675.
Veldman, R. L., Ari-Gur, J., Clum, C., DeYoung, A., & Folkert, J. (2006). Effects of
pre-pressurization on blast response of clamped aluminum plates. International Journal of Impact Engineering, 32(10), 1678-1695.
Tasdemirci, A., & Hall, I. W. (2007). Numerical and experimental studies of damage
generation in multi-layer composite materials at high strain rates. International Journal of Impact Engineering, 34(2), 189-204.
Teich, M., Warnstedt, P., & Gebbeken, N. (2011). The influence of negative phase
loading on cable net facade response. Journal of architectural engineering, 18(4), 276-284.
Thomson, P. (2012, November 11). Vince Wood applies blast proof film to a
window [image]. The Canberra Times. Retrieved from http://www.canberratimes.com.au.
TM 5-855-1. (1986). Fundamentals of Protective Design for Convential Weapons.
Washington DC: U.S. Department of Army.
Ward, S. P. (2006). Anchoring Blast-Resistant Windows. Construction Specifier, 59(2), 40.
Wedding, W. C. (2011). Experimental study on blast resistant glazing system
response to explosive loading. (Master’s Thesis), University of Kentucky, Lexington, KY, United States.
Weggel, D. C., & Zapata, B. J. (2008). Laminated glass curtain walls and laminated
glass lites subjected to low-level blast loading. Journal of Structural Engineering, 134(3), 466-477.
Wei, J., & Dharani, L. R. (2006). Response of laminated architectural glazing
subjected to blast loading. International Journal of Impact Engineering, 32(12), 2032-2047.
Wu, C. D., Yan, X. Q., & Shen, L. M. (2010). A numerical study on dynamic failure
of nanomaterial enhanced laminated glass under impact. IOP Conference Series: Materials Science and Engineering, 10(1), 10.
Yarosh, K., Wolf, A. T., & Sitte, S. (2009). Evaluation of silicone sealants at high
movement rates relevant to bomb mitigating window and curtainwall design. Journal of ASTM International, 6(2), 17.
Zhang, X., & Hao, H. (2011). Laboratory test and numerical simulation of laminated
glass window response to impact and blast loads. The 9th international conference on shock and impact loads on structures, Fukuoka, Japan.
Zhang, X., Hao, H., & Ma, G. (2013a). Laboratory test and numerical simulation of
laminated glass window vulnerability to debris impact. International Journal of Impact Engineering, 55, 49-62.

References 187
Zhang, X., Hao, H., & Ma, G. (2013b). Parametric study of laminated glass window
response to blast loads. Engineering Structures, 56(0), 1707-1717.
Zhang, X., Hao, H., & Ma, G. (2015). Dynamic material model of annealed soda-lime glass. International Journal of Impact Engineering, 77(0), 108-119.
Zhang, X., Hao, H., & Wang, Z. (2014). Experimental study of laminated glass
window responses under impulsive and blast loading. International Journal of Impact Engineering(0).
Zhang, X., Zou, Y., Hao, H., Li, X., Ma, G., & Liu, K. (2012). Laboratory test on
dynamic material properties of annealed float glass. International Journal of Protective Structures, 3(4), 407-430.