response of framed buildings to excavation-induced movements · response of framed buildings to...
TRANSCRIPT

The Japanese Geotechnical Society
Soils and Foundations
Soils and Foundations 2014;54(3):250–268
http://d0038-0
nCorE-m
x.doi.org/1806/& 201
respondinail addrecam.ac.uk: þ44 122review un
www.sciencedirect.comjournal homepage: www.elsevier.com/locate/sandf
Response of framed buildings to excavation-induced movements
Kok Hun Goha,n, Robert James Mairb,1
aLand Transport Authority, No. 1, Hampshire Road, Singapore 219428, SingaporebEngineering Department,. University of Cambridge, Trumpington Street, Cambridge, CB2 1PZ, UK
Received 11 July 2012; received in revised form 23 May 2013; accepted 18 June 2013Available online 13 May 2014
Abstract
This paper presents a study of the influence of frame action on the response of buildings to deformations induced by deep excavations in softclay. Using the finite element method, a building was modelled as a framed structure adjacent to a multi-propped excavation, firstly as a framewith continuous footings and then as a frame with individual footings. The geometry, location, and structural elements forming the frame modelswere varied to investigate the response of various frames. Using a structural analysis, parameters representing the stiffness of the frames inreducing deflection ratios and horizontal strains were derived. The influence of the frame action on the building stiffness can be quantified usingthe results from the finite element models. This makes it possible to estimate building modification factors from the relevant design charts so thatinduced deflection ratios and horizontal strains, caused by adjacent excavation and tunnelling activities, can be calculated. The approach gives amore realistic estimate of the tensile strains for assessing the potential damage caused to buildings.& 2014 The Japanese Geotechnical Society. Production and hosting by Elsevier B.V. All rights reserved.
Keywords: Building response; Excavations; Frame action
1. Introduction
1.1. Background
Buildings vary so much in structural concept and detail thatit is difficult to lay down general guidelines for the influence ofsettlements on building serviceability and performance. Never-theless, from full scale model tests conducted by the Building
0.1016/j.sandf.2014.04.0024 The Japanese Geotechnical Society. Production and hosting by
g author. Tel.: þ65 6396 1494.sses: [email protected] (K.H. Goh),(R.J. Mair).3 332631.der responsibility of The Japanese Geotechnical Society.
Research Station, in which masonry walls and infill frameswere forced to deflect like simple beams, Burland and Wroth(1974) noted that the onset of visible cracking was related tothe induced tensile strains. They proposed using the deflectionof a centrally loaded simple beam as an idealised representa-tion of the deflection of actual buildings, and used Timoshen-ko’s beam theory to derive equations relating the deflectionratio to tensile strains using the beam’s geometric and stiffnessproperties. These were supported using observations of thedamage to a number of buildings together with the observa-tions from full-scale model tests (Burland et al., 1977). Sincethen, these equations have been re-written and are now thebasis for estimating the potential building damage caused bytunnelling- and excavation-induced deformations.The procedure for building damage assessment, outlined
by Mair et al. (1996), was based on deflection ratios andhorizontal strains in the greenfield condition. This ignores theinherent stiffness in buildings and is conservative. To include
Elsevier B.V. All rights reserved.

Fig. 1. Deformation of building above tunnelling (after Mair et al., 1996)
K.H. Goh, R.J. Mair / Soils and Foundations 54 (2014) 250–268 251
the influence of building stiffness, Potts and Addenbrooke(1997) pioneered the use of the modification factor approach toestimate the deflection ratios and horizontal strains caused bytunnelling deformations. In their finite element study, abuilding was modelled as an elastic beam with bending andaxial stiffness properties, and was in full contact with theground surface. By changing the building’s geometry andlocation or eccentricity in relation to the tunnel, design chartswere developed so that the influence of the building stiffness inmodifying the response from that of the greenfield conditioncould be estimated.
The use of an elastic beam to estimate a building’s stiffnesswould be appropriate if the building response were dominatedby the wall behaviour, such as the masonry houses at MoodkeeStreet in London, described by Mair and Taylor (2001b).However, it is unclear how the stiffness of framed buildingscan be related to the elastic properties of a simple beam. Forexample, when estimating the realistic bending stiffness ofbuildings up to 5-storeys for their numerical study, Potts andAddenbrooke (1997) employed the parallel axis theorem todefine the stiffness in bending about the neutral axis for arigidly framed structure, namely,
EIf rame ¼∑EnðIþAH2Þith f loor ð1Þ
Essentially, the stiffness of the ‘beam’ increases depending onthe distance H between the beam’s neutral axis and thestructure’s defined neutral axis, similar to that of compositematerials. Nevertheless, Potts and Addenbrooke acknowledgedthis to be an overestimate of building stiffness. On the otherhand, in Mair and Taylor (2001a)'s estimate for the bendingstiffness of Elizabeth House, a 10-storey reinforced concreteframe structure with two basement levels, the influence of theframe action was ignored as the effects of any shear walls or
moment connections were judged to be minor. The buildingstiffness was estimated for the ‘Class A’ prediction (Lambe1973) by algebraically summing the individual bending stiff-ness of all the floor slabs, so that
EIf rame ¼∑ðEIÞith f loor ð2ÞIt is not clear which method would give a better estimate of thebending stiffness of frame structures (although the approach byMair and Taylor in the case of Elizabeth House led to the ClassA prediction being in close agreement with the subsequentfield measurements). Moreover, previous studies have beenbased on buildings on continuous footings that are in fullcontact with the ground. Using a centrifuge modelling of asimple frame model on separate footings behind an excavationsupported by a cantilever wall, Elshafie (2008) observed thebeam dislodging from the column-footing due to groundmovements during the excavation. The behaviour of framedbuildings on individual footings could be quite different fromthat of a simple beam model.
1.2. Building modification factor approach
The building modification factor approach introduced byPotts and Addenbrooke (1997), which will be used in thispaper, is a valuable tool for studying the response of buildings.Essentially, building modification factors describe the max-imum deflection ratios and horizontal strains in a building inrelation to the greenfield condition. The definition of deflectionratio (Δ/L) is given in Fig. 1. To calculate the deflection ratiomodification factors, the following steps are undertaken: (i) thedeflection ratios are calculated in the sagging and hoggingzones corresponding to the building’s geometry and locationusing the greenfield settlement trough, i.e., (Δ/L)sag,GF and(Δ/L)hog,GF; (ii) for the settlement trough for the building

Fig. 2. Cross-sections of the shop houses and soil profiles (a) Near west end of
K.H. Goh, R.J. Mair / Soils and Foundations 54 (2014) 250–268252
predicted by the FE analysis (influenced by the stiffness of thebuilding), deflection ratios are calculated for the sagging andhogging zones, i.e., (Δ/L)sag,Bldg and (Δ/L)hog,Bldg; (iii) themodification factors for the deflection ratio (MDRsag; MDRhog)are then calculated by dividing the calculated deflection ratiofor the building (Δ/Lsag,Bldg; Δ/Lhog,Bldg) by the deflection ratiofor the greenfield settlement trough (Δ/Lsag,GF; Δ/Lhog,GF):
MDRsag ¼ ðΔ=LÞsag;BldgðΔ=LÞsag;GF
ð3Þ
MDRhog ¼ ðΔ=LÞhog;BldgðΔ=LÞhog;GF
ð4Þ
In terms of horizontal strains, the maximum compressiveand tensile horizontal strains in the greenfield, correspondingto the building's geometry (εhc,GF; εht,GF), are calculatedtogether with the maximum horizontal strains induced in thebuilding (εhc,Bldg; εht,Bldg). It should be noted that the use of themaximum horizontal strains is different from the use of theaverage horizontal strains in the procedure for the buildingdamage assessment outlined by Mair et al. (1996). Themodification factors for the maximum horizontal strains (Mεhc;Mεht) are defined as follows:
Mεhc ¼ εhc;Bldgεhc;GF
ð5Þ
Mεht ¼ εht;Bldgεht;GF
ð6Þ
shop house A29 and (b) Near west end of shop house A32.2. Case study of the response of framed buildingsduring tunnelling
Goh and Mair (2011a) presented a case study of two framedbuildings that were recently subjected to the effects of twinbored tunnelling drives along Pasir Panjang Road in Singapore.These buildings, or shop houses as they are referred to, are two-storey reinforced-concrete framed buildings whose columns arefounded on individual footings supported by short timber bakaupiles (estimated to be from 6 m to 9 m long). At the groundfloor, there are tie-beams connecting the main columns of theframe, but not all columns are connected in both directions. Inparticular, the columns along the ‘five-foot way’ – a five-footwide common corridor running along the front of the building –
are unconnected at the ground floor level. At the first floor, thebeams connect all the columns together (including the columnsabove the five-foot way) in a grid as they transfer the loads fromthe first floor slabs down to the foundation. The slabs are 100-mm thick and the building façade and internal walls are mostlyformed using brick in-fills. Fig. 2 shows the cross section of thetwo shop houses in relation to the twin bored tunnels. The boredtunnelling was undertaken using earth-pressure balance shieldmachines (Venkta et al., 2008), and whilst the first (inner) tunnelwas constructed away from the shop houses, the second (outer)tunnel was constructed directly below the shop houses.The depths to the tunnel axis ranged from 16 m to 19 m belowthe ground surface, and the bored tunnels were constructed in a
mixed face condition of the Kallang Formation (whose membersare soft clays and sands of fluvial and marine origin; Tan et al.,2003) and the Jurong Formation (whose members are mud-stones, siltstones, and sandstones of sedimentary origin andexhibiting evidence of metamorphism; Leong et al., 2003).A detailed instrumentation programme was implemented during
the bored tunnelling works, including settlement measurements ofthe building and tape extensometer measurements between thecolumns. Fig. 3 shows one of the monitored building settlementarrays compared with the settlement profile in the greenfieldcondition. Based on the monitored ground settlement markers atthis location, the back-analysed volume loss was 1.3% during thefirst tunnel drive. A narrow trough width for the Gaussiansettlement curve provided a good match to the building settlementbehaviour during the first tunnel drive (Fig. 3a). The trough width(i) of a Gaussian settlement curve is related to the depth to tunnelaxis (z) and trough width parameter K, where i¼Knz. Based onfield data compiled by Mair and Taylor (1997), the surface troughwidth parameter for tunnelling in sands would vary between 0.25and 0.45 with an average value of 0.35. Furthermore, Mair et al.(1993) proposed a sub-surface trough width parameter whichdecreases when the subsurface trough is nearer to the tunnel axis.The combined effects of tunnelling in fluvial sand and the buildingsettlement occurring at a depth nearer to the toe levels of the piles,resulted in the narrow settlement trough width observed in this casestudy. However, using the same trough width parameter for the

Fig. 3. Greenfield and building settlement at west end of shop house A29(a) Settlement due to inner tunnel drive, (b) Settlement due to outer tunneldrive and (c) Layout of building settlement markers.
K.H. Goh, R.J. Mair / Soils and Foundations 54 (2014) 250–268 253
second tunnel drive (as seen in Fig. 3b), the building would be inthe sagging deformation region directly above the tunnel and in thehogging deformation region further away from the tunnel. Thevolume loss also increased to 3.5% during the second tunnel drive.Moreover, it was noted that the settlement response of the buildingduring the second tunnel drive is semi-rigid compared to thegreenfield settlement trough. This is in contrast to the flexiblebehaviour when the building is in a purely hogging mode duringthe first tunnel drive. Furthermore, the maximum building settle-ments due to the first and second tunnel drives were 10 mm and67 mm, respectively. Although the shop houses had settledsubstantially due to both tunnel drives, building inspections showedthat there was no structural distress either during or after thetunnelling. Liew et al. (2008) reported that the induced crackwidths in the building ranged from 0.3 mm to 1.5 mm, except foran isolated location registering 9.8 mm at an end wall. This wouldhave placed the building in the ‘slight’ damage category using theguidance on damage classification by the Building ResearchEstablishment (BRE Digest 251). This is attributed to the buildingdamage being caused by distortion (and measured indirectly usingdeflection ratios) rather than absolute displacement. This case studyillustrates the beneficial effect of the framing action by columnsand beams in reducing the deflection ratio and building damage.
Another interesting aspect of this case study is the horizontalstrains monitored using tape extensometers between thecolumns. As reported by Goh and Mair (2011a), horizontalstrains were low during the first tunnel drive due to the innertunnel being further away from the buildings, but these becamesignificant during the second tunnel drive when the outertunnel was directly below the buildings. It was also reportedthat horizontal strains longitudinal to the tunnel were generallylow, and horizontal strains were more significant in thetransverse direction to tunnelling. Fig. 4 shows the transversehorizontal strains monitored in one of the buildings, where thebuilding strains may be compressive or tensile in naturedepending on the location with respect to the settlement curvecaused by the tunnelling. This figure also illustrates that thehorizontal strains in buildings on individual footings may bevery significant (up to a maximum value of 0.24%), which is incontrast to previous case studies of buildings on continuousfootings where monitored horizontal strains were generallynegligible (such as the case of the Moodkee Street buildingsreported by Dimmock and Mair, 2008). It is further noted thatthe highest horizontal strains occur between columns that areunconnected at the ground floor level (maximum of 0.24% inTEX1148) and mostly along the five-foot way area. Forcolumns that are connected by ground beams, the horizontalstrains are much lower (maximum of 0.08% in TEX1144).This finding suggests some influence from the framing actionon the horizontal strain behaviour of buildings.To understand the influence of the frame action on building
stiffness, Goh (2010) conducted a numerical study using thefinite element method to investigate the response of framedstructures to movements caused by multi-propped excavationsin soft clays. The buildings were modelled using a structureframe in a 2D plane analysis – first with a continuous footingperpendicular to the excavation, and then with separateindividual column footings. The response of the frame modelswas compared with another set of finite element models wherethe building was modelled using an elastic beam. From thestructural analysis, parameters describing the influence of theframe action were derived and an approach describing itsinfluence on the response to excavation-induced deformationswas presented. The subsequent sections of this paper summar-ise the findings of the study.
3. Frame structures on continuous footings
3.1. Finite element model study
An effective stress, plane strain analysis was carried outusing the finite element software Abaqus, where a bracedexcavation was simulated near a building. The excavation is insoft clay, assuming undrained conditions, and was supportedusing a multi-propped retaining wall with adequate toeembedment into stiff clay. Fig. 5 shows the key elements inthe base model of the analysis (model UD_A), where a 20-m-deepexcavation was simulated in a 20-m-thick deposit of soft clay andthe buildings were modelled first as an elastic beam (Fig. 5a) andthen using a structural frame (Fig. 5b). A 0.8-m-thick diaphragm
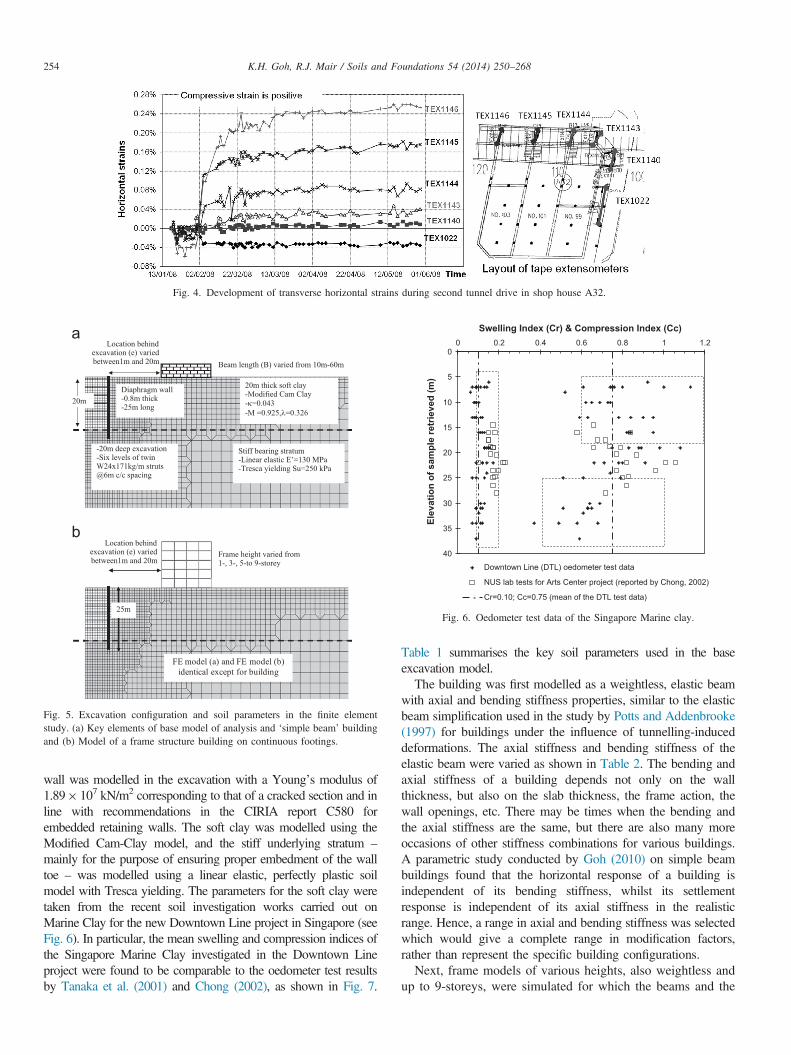
Fig. 4. Development of transverse horizontal strains during second tunnel drive in shop house A32.
Frame height varied from 1-, 3-, 5-to 9-storey
Location behind excavation (e) varied between1m and 20m
20m thick soft clay-Modified Cam Clay-κ=0.043-M =0.925,λ=0.326
Stiff bearing stratum-Linear elastic E’=130 MPa-Tresca yielding Su=250 kPa
Diaphragm wall-0.8m thick-25m long
-20m deep excavation-Six levels of twin W24x171kg/m struts @6m c/c spacing
Beam length (B) varied from 10m-60m
Location behind excavation (e) varied between1m and 20m
FE model (a) and FE model (b) identical except for building
25m
20m
Fig. 5. Excavation configuration and soil parameters in the finite elementstudy. (a) Key elements of base model of analysis and ‘simple beam’ buildingand (b) Model of a frame structure building on continuous footings.
0
5
10
15
20
25
30
35
40
0 0.2 0.4 0.6 0.8 1 1.2
Swelling Index (Cr) & Compression Index (Cc)
Elev
atio
n of
sam
ple
retr
ieve
d (m
)
Downtown Line (DTL) oedometer test data
NUS lab tests for Arts Center project (reported by Chong, 2002)
Cr=0.10; Cc=0.75 (mean of the DTL test data)
Fig. 6. Oedometer test data of the Singapore Marine clay.
K.H. Goh, R.J. Mair / Soils and Foundations 54 (2014) 250–268254
wall was modelled in the excavation with a Young’s modulus of1.89� 107 kN/m2 corresponding to that of a cracked section and inline with recommendations in the CIRIA report C580 forembedded retaining walls. The soft clay was modelled using theModified Cam-Clay model, and the stiff underlying stratum –
mainly for the purpose of ensuring proper embedment of the walltoe – was modelled using a linear elastic, perfectly plastic soilmodel with Tresca yielding. The parameters for the soft clay weretaken from the recent soil investigation works carried out onMarine Clay for the new Downtown Line project in Singapore (seeFig. 6). In particular, the mean swelling and compression indices ofthe Singapore Marine Clay investigated in the Downtown Lineproject were found to be comparable to the oedometer test resultsby Tanaka et al. (2001) and Chong (2002), as shown in Fig. 7.
Table 1 summarises the key soil parameters used in the baseexcavation model.The building was first modelled as a weightless, elastic beam
with axial and bending stiffness properties, similar to the elasticbeam simplification used in the study by Potts and Addenbrooke(1997) for buildings under the influence of tunnelling-induceddeformations. The axial stiffness and bending stiffness of theelastic beam were varied as shown in Table 2. The bending andaxial stiffness of a building depends not only on the wallthickness, but also on the slab thickness, the frame action, thewall openings, etc. There may be times when the bending andthe axial stiffness are the same, but there are also many moreoccasions of other stiffness combinations for various buildings.A parametric study conducted by Goh (2010) on simple beambuildings found that the horizontal response of a building isindependent of its bending stiffness, whilst its settlementresponse is independent of its axial stiffness in the realisticrange. Hence, a range in axial and bending stiffness was selectedwhich would give a complete range in modification factors,rather than represent the specific building configurations.Next, frame models of various heights, also weightless and
up to 9-storeys, were simulated for which the beams and the

Fig. 7. Analysis of oedometer test data by (a) Tanaka et al. (2001) and (b) Chong (2002) on Singapore marine clay.
Table 1Soil parameters used in finite element model.
Soilstratigraphy
Constitutive model Soil parameters
20 m thicksoft clay
Modified Cam-Clay (porouselastic)
νʹ¼0.2; κ¼0.10 /ln10¼0.043
Modified Cam-Clay (clayplasticity)
M¼0.925; λ¼0.75 / ln10¼0.326
Underlyingstiff soil
Linear elastic νʹ¼0.3;E’¼0.87*Eu¼130000 kPa
Perfectly plastic (MohrCoulomb)
c'¼ Su¼250 kPa; ϕ’¼01;ψʹ¼01
Table 2Combination of stiffness for simple beam models.
Elastic beam #1 #2 #3 #4 #5 #6
Bending stiffness EI (kNm2 per metre run) 103 104 105 106 107 108
Axial stiffness EA (kN per metre run) 103 104 105 106 107 108
K.H. Goh, R.J. Mair / Soils and Foundations 54 (2014) 250–268 255
columns were rigidly connected to the column elements.The lengths (B) and the distances of the frame models behindthe excavation (e) were the same as the simple beam models;

Table 3Configurations of rigidly framed models for comparison with simple beammodels.
ID Raftthickness
Beamthickness
Beam lengthper bay
Floorheight
Column type
B¼20 m, e¼1 m; B¼20 m, e¼20 mBase 500 mm 250 mm 5 m 3.5 m 150 mm RC wallFB 250 mm 100 mm 5 m 3.5 mLB 500 mm 250 mm 10 m 3.5 mTC 500 mm 250 mm 5 m 5 mFBC 250 mm 100 mm 5 mm 3.5 m 150� 150 RC
columns@5 mSF 250 mm 100 mm 10 m 5 mB¼40 m, e¼20 m
Base 500 mm 250 mm 5 m 3.5 m 150 mm RC wallFB 250 mm 100 mm 5 m 3.5 mFBC 250 mm 100 mm 5 m 3.5 m 150� 150 RC
B¼60 m, e¼20 mBase 500 mm 250 mm 5 m 3.5 m 150 mm RC wallFB 250 mm 100 mm 5 m 3.5 mTC 250 mm 100 mm 10 m 5 mFBC 250 mm 100 mm 5 m 3.5 m 150� 150 RC
B¼60 m, e¼1 mBase 500 mm 250 mm 5 m 3.5 m 150 mm RC wallFB 250 mm 100 mm 5 m 3.5 mTC 500 mm 250 mm 5 m 5 mLB 500 mm 250 mm 10 m 3.5 mFC 500 mm 250 mm 5 m 3.5 m 150� 150 RC
B¼40 m, e¼1 mBase 500 mm 250 mm 5 m 3.5 m 150 mm RC wallFB 250 mm 100 mm 5 m 3.5 mFBC 250 mm 100 mm 5 m 3.5 m 150� 150 RC
-0.050
-0.040
-0.030
-0.020
-0.010
0.00020 40 60 80
Distance from wall (m)
Surf
ace
settl
emen
t (m
)
-0.050
-0.040
-0.030
-0.020
-0.010
0.0000 20 40 60 80
Distance from wall (m)
Hor
izon
tal d
ispl
acem
ent (
m)
Fig. 8. Surface settlement and horizontal displacement profiles in greenfieldcondition.
K.H. Goh, R.J. Mair / Soils and Foundations 54 (2014) 250–268256
they were selected to yield a mix of sagging and hoggingdeformation behaviour, as shown below:
�
Buildings in sagging deformation only: {B¼20 m, e¼1 m} � Buildings in hogging deformation only:{B¼20 m, e¼20 m}, {B¼40 m, e¼20 m}, {B¼60 m,e¼20 m}
�
Buildings in both sagging and hogging deformation modes:{B¼40 m, e¼1 m}, {B¼60 m, e¼1 m}Table 3 shows the configurations of the modelled framestructures. Similar to the simple beam models, the frame modelswere weightless. A no-separation criterion was defined at theinterface between the soil and the building. Interface sliding wasallowed between the buildings and the soil, and this wassimulated using a friction model for which the contact surfaceswere allowed to carry shear stresses up to 20 kPa (which is inthe range of the undrained shear strength of Singapore MarineClay at shallow depths) before they slid relative to one another.Defining a “no separation” criterion together with the frictionmodel allows the soil–structure contact pair to slide relative toeach other, but not to separate perpendicular to the contact. Thisensures that the horizontal displacement of the building is notconstrained or underestimated.
3.2. Effect of bending and axial stiffnesson building deformation
To determine the deflection ratio in the building and in thegreenfield condition, the sagging and hogging zones of thesettlement curve were obtained by interrogating for the inflexionpoint – or the point of maximum slope – on the building and theground settlement profiles, respectively. Fig. 8 shows the surfacesettlement and horizontal displacement profiles in the greenfieldcondition for the excavation simulated in base model UD_A. Itillustrates the inflexion point that separates the surface displace-ment profile into a sagging zone and a hogging zone. Thesagging zone of the surface settlement trough extended to 21 mbehind the excavation.
3.3. Settlement behaviour of simple beam modelscompared to frame models
To compare the settlement behaviour of the simple beam modelswith the frame models, modification factors for the deflection ratiowere calculated and plotted against the bending stiffness of thebuilding. The bending stiffness of the buildings in the simple beammodel is simply the bending stiffness of the elastic beam. For theframe structure models, estimates of the bending stiffness weremade using Eq. (1) and Eq. (2) separately.Fig. 9 shows the variation in deflection ratio modification
factors with bending stiffness for the 20-m building when it is1 m behind the excavation (e¼1 m, sagging deformation only)and when it is 20 m behind the excavation (e¼20 m, hoggingdeformation only), using both methods to estimate the framestiffness. The modification factors from the frame structuremodels with various configurations are shown as points, whilstthose from the simple beam models are plotted as a curve.For both modes of deformation, when the frame stiffness is

0.00
0.20
0.40
0.60
0.80
1.00
1.20
Simple beam models*Frame models (base)Frame models (FB)Frame models (LB)Frame models (TC)Frame models (FBC)Frame models (SF)
MDRsag
EI (kNm2) EI (kNm2)
0.00
0.20
0.40
0.60
0.80
1.00
1.20
1.E+03 1.E+04 1.E+05 1.E+06 1.E+07 1.E+08 1.E+03 1.E+04 1.E+05 1.E+06 1.E+07 1.E+08
Simple beam models*Frame models (base)Frame models (FB)Frame models (LB)Frame models (TC)Frame models (FBC)Frame models (SF)
MDRhog
0.00
0.20
0.40
0.60
0.80
1.00
1.20
MDRhog
0.00
0.20
0.40
0.60
0.80
1.00
1.20
1.E+03 1.E+05 1.E+07 1.E+09 1.E+111.E+03 1.E+05 1.E+07 1.E+09 1.E+11
MDRsag
EI (kNm2) EI (kNm2)
EIframe=Σ Ε∗(I+AH2)floor EIframe=Σ Ε∗(I+AH2)floor
EIframe =Σ (EIfloor) EIframe =Σ (EIfloor)
Fig. 9. Deflection ratio modification factors for bending stiffness estimated using different methods. (a) For 20m long buildings with e¼1m and (b) For 20m longbuildings with e¼20m.
K.H. Goh, R.J. Mair / Soils and Foundations 54 (2014) 250–268 257
estimated by summing the bending stiffness of each floor slab(using Eq. (2)), the results are all below the curves from thesimple beam models. This suggests that simply summing thebending stiffness of each floor slab will result in a lowerestimate of the frame stiffness when compared to that of thesimple beam. However, when the frame stiffness is estimatedby increasing the contribution of bending stiffness of eachfloor slab, according to the parallel axis theorem (usingEq. (1)), the results are seen to plot above the curves derivedfrom the simple beam models. This approach results in ahigher estimate of the bending stiffness of a rigidly connectedframe structure in relation to the simple beam.
3.4. Stiffening influence of columns on beams
Meyerhof (1953) obtained an approximate estimate of theflexural rigidity of a rigidly framed structure. He considered anopen multi-storey building frame with approximately equalbays and deflecting into the shape of a trough with a maximumcentral deflection and with similar curvature at each floor level.By assuming points of contra-flexure in the columns at its mid-storey height and solving the structural analysis equations, heshowed that the effect of the columns in rigidly connectedframe structures is the increase in flexural rigidity of the entirebeam line by a column stiffening factor.
Following Meyerhof’s assumed structural mode of deforma-tion, a column stiffening factor C can be derived using slopedeflection equations (Goh 2010); it is defined with slightchanges to its terms as follows:
C¼ 1þ L2
l2KLCþKUC
KLCþKUCþKB
� �� �ð7Þ
where L is the length of the beam line in sagging or inhogging, l is the span length of each beam bay, KLC¼ (EI/h)LCis the average stiffness of the lower column, KUC¼ (EI/h)UC isthe average stiffness of the upper column, and KB¼ (EI/l)B isthe average stiffness of the beam line. The bending stiffness ofthe frame structure can then be written as follows
EIf rame ¼∑ðEInCÞithf loor ð8Þ
The suitability of the column stiffening factor in estimatingframe stiffness can be illustrated by plotting the modificationfactors of the frame structure models against the factors of thesimple beam models, as shown in Fig. 10. When the bendingstiffness of the same frames plotted in Fig. 9 was estimatedusing the column stiffening factor, the estimated framestiffness coincided with the bending stiffness of the simplebeam models for the same modification factor. When longerframe structures were modelled, the modification factor plotsshow a similar match in frame stiffness with the corresponding

0.00
0.20
0.40
0.60
0.80
1.00
1.20
1.E+03 1.E+04 1.E+05 1.E+06 1.E+07 1.E+08
Simple beam modelsFrame models (base)Frame models (FB)Frame models (LB)Frame models (TC)Frame models (FBC)Frame models (SF)
MDRsag
EI (kNm2) EI (kNm2)
EI frame= Σ E*(C*I) floor
0.00
0.20
0.40
0.60
0.80
1.00
1.20
1.E+03 1.E+04 1.E+05 1.E+06 1.E+07 1.E+08
MDRhog
EI frame= Σ E*(C*I) floor
Fig. 10. Deflection ratio modification factors for bending stiffness estimated using the column stiffening factor. (a) For 20m long buildings with e¼1m and (b) For20m long buildings with e¼20m.
0.00
0.20
0.40
0.60
0.80
1.00
1.20
60m simple beam model 40m simple beam model60m frame model (Base) 40m frame model (Base)60m frame model (FB) 40m frame model (FB)60m frame model (FBC) 40m frame model (FBC)60m frame model (TC)
MDRhog
EI (kNm2) EI (kNm2)
EIframe=Σ(EIfloor)
0.00
0.20
0.40
0.60
0.80
1.00
1.20
1.E+03 1.E+04 1.E+05 1.E+06 1.E+07 1.E+08 1.E+03 1.E+04 1.E+05 1.E+06 1.E+07 1.E+08
MDRhog
- B = 60m, e = 20m - B = 40m, e = 20m
EIframe=Σ E*(C*I)floor
Fig. 11. Modification factors for longer frames under hogging deformation
Table 4Variation of composite frame structure models for 20 m buildings (e¼1 m, 20 m).
Identifier Base LB TC FB FBC SF SC
Beam type H610� 305� 149 kg/m @5 m spacing (E¼205 GPa,I¼1.259� 10�3 m4)
H457� 191� 98 kg/m @ 5 m spacing (E¼205 GPa,I¼4.573� 10�4 m4)
RC raft thickness 500 mm 500 mm 500 mm 500 mm 250 mm 250 mm 250 mmBay length 5 m 10 m 5 m 5 m 5 m 10 m 5 mColumn height 3.5 m 3.5 m 5 m 3.5 m 3.5 m 5 m 3.5 mRC column type 150 mm walls 200� 200 mm @5 m spacing 300 mm walls
K.H. Goh, R.J. Mair / Soils and Foundations 54 (2014) 250–268258
simple beam model when the column stiffening factor is used(Fig. 11).
3.5. Modifications to the column stiffening factor
In the original formulation, Meyerhof had considered framestructures where the beam and the columns were of the samematerial. In the derivation presented by Goh (2010), however, theYoung’s modulus of the material was included so that the stiffness
of frame buildings with different column and beam materials maybe estimated using the column stiffening factor. To check theformulation, 1-storey and 5-storey frame structures of steel beamson RC columns were modelled for 20-m-long buildings located1 m and 20 m behind the excavation. Table 4 shows the variationin structural elements modelled, where the beams were made ofsteel and the columns were reinforced concrete. The modificationfactor curves of the frame models, matching the simple beammodels (Fig. 12), show that the column stiffening factor is adequateeven when the columns and beams are made of different materials.

0.00
0.20
0.40
0.60
0.80
1.00
1.20
Simple beam models
20m composite frames (e=1m)
20m composite frames (e=20m)
EI (kNm2)
EIframe = Σ ( EIfloor )MDRsag; MDRhog
0.00
0.20
0.40
0.60
0.80
1.00
1.20
1.E+03 1.E+04 1.E+05 1.E+06 1.E+07 1.E+08 1.E+03 1.E+04 1.E+05 1.E+06 1.E+07 1.E+08
Simple beam models
20m composite frames (e=1m)
20m composite frames (e=20m)
EI (kNm2)
EI frame = Σ E*(C*I) floorMDRsag; MDRhog
Fig. 12. Modification factors for buildings with different materials.
K.H. Goh, R.J. Mair / Soils and Foundations 54 (2014) 250–268 259
The derivation of the column stiffening factor was based onthe frame structure deflecting in a sagging deformation mode.This has to be modified for buildings showing both saggingand hogging deformation modes behind an excavation. It issuggested that length L in the column stiffening factor Eq. (7)be defined as the sagging length and the hogging length of thebuilding in the greenfield settlement trough, instead of thewhole length of the building. This can be checked by analysingthe frame models that are longer than the sagging length of thesurface settlement trough, such as the 60-m- and 40- m-longframe buildings located 1 m behind the excavation. Fig. 13shows the modification factor plots of these frame models indouble deformation modes compared to the simple beammodels. With a slight modification to the definition of beamlength, the column stiffening factor can still provide a goodestimate of the bending stiffness even for framed buildings thatare in part sagging and in part hogging deformation.
3.6. Frames with pinned structural connections
Not all frame structures are made of rigidly connectedbeams and columns. Some buildings may consist of pin-connected frames, where the beams are simply supported bycolumns and are not restrained by the columns in theirbending. Some examples are buildings constructed usingprecast elements where the precast beams are placed on thecorbels of columns, and also the simple construction techniquewhere in steel frames the I-beams are bolted only on its weband not on its flange to the columns. Lateral stability of theframe will likely be provided by bracing or shear walls in otherparts of the building. In general, two cases can be considered.They are shown in the schematic in Fig. 14.
The first case is when the beams are pinned to the columnsand are unconnected between adjacent bays, such as the simplesteel frame construction and the precast beams on columncorbels. There would be no contribution by the beams to thebending stiffness of the frame structure when they are hingedbetween columns. As such, the column stiffening factor wouldbe zero so that the bending stiffness for such buildings wouldderive only from their foundation.
The second case occurs when the columns do not restrain thebeams in bending, but the beams are continuous within thefloor level, such as in flat slab systems and also for floor slabs in
a typical building. The beam would deflect according to its ownbending stiffness without any stiffening effect from the columns. Inthis case, the continuous beam still contributes to the overall framestiffness with a column stiffening factor of unity. Fig. 15 shows themodification factors from the finite element models of a frame withbeams that are simply supported on the columns compared to thesimple beam models. The frame stiffness would be well-estimatedusing Eq. (2) (equivalent to Eq. (8) with C¼1).
3.7. Horizontal strains
Fig. 16 plots the modification factor of horizontal strainsagainst the axial stiffness of the buildings for the frame modelsin comparison to the simple beam models. For all the framebuildings on continuous footings, the horizontal strains arenegligible. This is in part due to the interface sliding allowedbetween the soil and the structure elements in the finiteelement models. The sliding of the soil underneath continuousfootings behind the excavation has been observed by Elshafie(2008) in his centrifuge model experiments. More importantly,the high axial stiffness of realistic buildings limits thedevelopment of axial strains for buildings on continuousfootings. Even with just a 100-mm-thick RC slab, the axialstiffness of a continuous footing would be 2� 106 kN. Thismay also be inferred from the design charts by Potts andAddenbrooke (1997), who used a non-slipping interfacebetween the soil and the building, and where the maximumhorizontal strain modification factors were less than 0.10.So far, the discussions have been about buildings on
continuous footings. Mair (2003) pointed out that horizontalstrains induced in most buildings are usually reduced sig-nificantly, based on field case histories, but this may not betrue for buildings on individual footings. The next sectionpresents a study on frame structures on individual footings.
4. Frame structures on individual footings
4.1. Settlement behaviour and modification factorsof deflection ratio
Finite element models were made of frame structures onindividual footings separated at the ground level. These framemodels were subjected to the same ground and excavation

0.00
0.20
0.40
0.60
0.80
1.00
1.20
60m Simple beam model 40m Simple beam model60m frame model (Base) 40m frame model (Base)60m frame model (FB) 40m frame model (FB)60m frame model (FC) 40m frame model (FBC)60m frame model (TC) 60m frame model (LB)
EI (kNm2)
M DRhog
- B = 60m, e = 1m- B = 40m, e = 1m
0.00
0.20
0.40
0.60
0.80
1.00
1.20M DRsag
EI (kNm2)
EIframe =Σ E*(C*I)floor
0.00
0.20
0.40
0.60
0.80
1.00
1.20
60m Simple beam model 40m Simple beam model60m frame model (Base) 40m frame model (Base)60m frame model (FB) 40m frame model (FB)60m frame model (FC) 40m frame model (FBC)60m frame model (TC) 60m frame model (LB)
M DRhog
EI (kNm2)- B = 60m, e = 1m- B = 40m, e = 1m
0.00
0.20
0.40
0.60
0.80
1.00
1.20
1.E+03 1.E+04 1.E+05 1.E+06 1.E+07 1.E+08
1.E+03 1.E+04 1.E+05 1.E+06 1.E+07 1.E+08
1.E+03 1.E+04 1.E+05 1.E+06 1.E+07 1.E+08
1.E+03 1.E+04 1.E+05 1.E+06 1.E+07 1.E+08
EI (kNm2)
M DRsag
EIframe =Σ (EIfloor)
Fig. 13. Deflection ratio modification factors for buildings in both sagging and hogging deformations.
K.H. Goh, R.J. Mair / Soils and Foundations 54 (2014) 250–268260
conditions corresponding to base model UD_A. Fig. 17 givesan overview of the frame structures modelled in this study.20-m- and 60-m-long frame structures were modelled ate ¼1 m and e¼20 m behind the excavation. The frames were2-storeys and 10-storeys high for the 60-m-long buildings, and10-storeys high for the 20-m-long buildings. The variation incolumn and beam types for the frame structures is summarisedin Table 5. As with the frames on continuous footings,horizontal sliding was allowed between the soil and footingelements at the interface, but no separation was specified toensure that the soil and the footing elements would remain incontact throughout the analysis.
Fig. 18 shows the surface settlement and the horizontaldisplacement profiles in the greenfield condition and the footingdisplacement of the frame on individual footings for the case ofe¼1 m. The response of the footings is more rigid than theground displacement behaviour in the greenfield condition.As before, the settlement behaviour of frames on individualfootings is studied by comparing the modification factors of thedeflection ratio for the frame models against those of the elasticbeam models. For each frame, the modification factors areplotted against the bending stiffness estimated using Eqs. (2) and(8). Fig. 19 and 20 show modification factor plots for the 20-m-and 60-m-long frames on individual footings. Compared tosimply summing the bending stiffness of each individual beam
line, the column stiffening factor improves the estimate of thebending stiffness of the frame on individual footings so that itsmodification factor response is nearer to that of the elastic beamsimplification. However, the estimated stiffness of the frames onindividual footings is still slightly lower. This could have beencaused by the reduced soil–footing contact for the frames onindividual footings. Nevertheless, the differences between themodification factor relationships are small. It would be reason-able to use the column stiffening factor to estimate the bendingstiffness of the frames on individual footings, and to use thedesign charts developed using simple beam models to estimatethe modification factor and the deflection ratios of the building.
4.2. Horizontal strains
As illustrated in Fig. 18, the greenfield horizontal strains arecalculated between the locations of the individual footings,whilst the building horizontal strains are calculated between theindividual footings of the frame model at the ground floor.Depending on the particular nature of the soil–structure inter-action, it was observed that the location of the maximumhorizontal strains between the separated footings may notcoincide with the location in the greenfield. Moreover, thislocation of maximum horizontal strains would be differentbetween the various frames modelled in the study. Thus, the

Fig. 14. Types of simply connected frames and their examples
0.00
0.20
0.40
0.60
0.80
1.00
1.20
60m simple beam models
60m frame models (Pinned)
MDRsag
EI (kNm2) EI (kNm2)
500mm footing & 250mm beam
250mm footing & 100mm beam
1000mm footing & 500mm beam
EIframe =Σ (EIfloor)
0.00
0.20
0.40
0.60
0.80
1.00
1.20
1.E+03 1.E+04 1.E+05 1.E+06 1.E+07 1.E+08 1.E+03 1.E+04 1.E+05 1.E+06 1.E+07 1.E+08
MDRhog
500mm footing & 250mm beam
250mm footing & 100mm beam
1000mm footing & 500mm beam
Fig. 15. Deflection ratio modification factors for frames with simply supported and continuous beams.
K.H. Goh, R.J. Mair / Soils and Foundations 54 (2014) 250–268 261
horizontal strain modification factor was defined based on themaximum of the building horizontal strains divided by themaximum of the greenfield horizontal strains. With this defini-tion, the modification factors of maximum compressive strainsand maximum tensile strains may be calculated and plotted ontothe modification curves for the simple beam model.
As observed in Fig. 21, the horizontal strain modificationfactors can be substantially higher than those of the simple beammodel, and ranged from 0 to 1 irrespective of the axial stiffness.Although the axial stiffness for a framed building may besufficiently high so that horizontal strains in the building aresmall, the individual footings could cause significant horizontal
strains between columns at the ground floor level. This could theninduce significant strains on the slabs at the ground level and is incontrast to the frames on continuous footings for which themodification factors are near to zero. Furthermore, two observa-tions can be made from the frame parameters varied in the study.Firstly, the horizontal strain modification factor (Mεh) decreasedas the distance between the footing on the ground level and thefirst floor tie beam (h) was reduced, from Mεh�1 at h¼3 m toMεh�0 when h¼0.2 m. Secondly, the horizontal straindecreased when the column stiffness increased. When the tie-beams were fixed 3 m away from the footing and the groundlevel, the increase in the column size from 150� 150 mm RC

0.00
0.20
0.40
0.60
0.80
1.00
EA (kN)0.00
0.20
0.40
0.60
0.80
1.00
1.E+03 1.E+05 1.E+07 1.E+09 1.E+11 1.E+03 1.E+05 1.E+07 1.E+09 1.E+11
EA (kN)
Fig. 16. Horizontal strain modification factors for frames on continuous footings compared to those for simple beam models. (a) Compressive horizontal strainmodification factors and (b) Tensile horizontal strain modification factors.
Fig. 17. Excavation model and soil parameters for frames on individual footings.
K.H. Goh, R.J. Mair / Soils and Foundations 54 (2014) 250–268262
columns to 150 mm RC walls reduced the Mεh from unity toaround 0.2. The axial stiffness is less adequate than the framestiffness in describing the horizontal response of framed buildingson separate footings.
4.3. Frame stiffness factor
A measure of horizontal stiffness for the frame action in theground floor can be obtained, by determining the force needed tomove the support of a structure frame horizontally by a unitdisplacement. As an approximation, a simple portal frame with asingle bay was analysed. As the individual footing is unable to
offer much moment restraint to the column in the building frame,the simple portal frame was assumed to be pin-supported.A schematic of this portal frame is shown in Fig. 22. Thederivation of the stiffness relationship was done using a structuralanalysis by the slope deflection method (Goh 2010). A framestiffness factor (αf) may thus be defined as
αf ¼H
Δ¼ 3KBKC
h2ð2KBþ3KCÞð9Þ
The frame stiffness factor has a dimension of kN/m per metrerun; it is dependent on the column height at the ground floor (h)as well as on the bending stiffness of the column (KC) and the

Table 5Variation of frame structure models for the 20 m and 60 m long buildings on individual footings.
Beam type 1st floor tie-beam type Column type Distance between 1st floor beam and footing
100 mm RC slab, with 5 m bay length 100 mm RC slab 150� 150 mm RC column @5 m h¼0.2 m, 1 m, 2 m, 3 m150 mm RC wall h¼0.2 m, 1 m, 2 m, 3 m
300� 300 mm RC beam @5 m 150� 150 mm RC column @5 m h¼3 m100 mm RC wall h¼3 m
250 mm RC slab 150� 150 mm RC column @5 m h¼0.2 m, 1 m, 2 m, 3 m150 mm RC wall h¼0.2 m, 1 m, 2 m, 3 m
100 mm RC slab, with 10 m bay length 100 mm RC slab 150� 150 mm RC column @5 m h¼0.2 m, 1 m, 2 m, 3 m150 mm RC wall h¼0.2 m, 1 m, 2 m, 3 m
250 mm RC slab 150� 150 mm RC column @5 m h¼3 m300� 300 mm RC beam @5 m 150� 150 mm RC column @5 m h¼3 m
-0.050
-0.040
-0.030
-0.020
-0.010
0.000
Distance from excavation (m)
Gre
enfie
ld S
ettle
men
t (m
)
-0.050
-0.040
-0.030
-0.020
-0.010
0.000
Distance from excavation (m)
Bui
ldin
g Se
ttlem
ent (
m)
-0.050
-0.040
-0.030
-0.020
-0.010
0.000
Distance from excavation (m)
Gre
enfie
ld D
ispl
acem
ent (
m)
-0.050
-0.040
-0.030
-0.020
-0.010
0.000
1 11 21 31 41 51 61 11 21 31 41 51 61
1 11 21 31 41 51 61 1 11 21 31 41 51 61
Distance from excavation (m)
Bui
ldin
g D
ispl
acem
ent (
m)
Fig. 18. Surface settlement and horizontal displacement profiles for greenfield and for frame on individual footings (e¼1 m). (a) Surface settlement profiles and(b) Horizontal displacement profiles.
0.00
0.20
0.40
0.60
0.80
1.00
1.20
20m simple beam models
EI (kNm2)
MDRsag ; M DRhog
EIframe =Σ (EIfloor)
0.00
0.20
0.40
0.60
0.80
1.00
1.20
1.E+03 1.E+04 1.E+05 1.E+06 1.E+07 1.E+08 1.E+03 1.E+04 1.E+05 1.E+06 1.E+07 1.E+08
20m frame models (e=1m, sagging zone)20m frame models (e=20m, hogging zone)
EI (kNm2)
MDRsag ; M DRhog
EIframe =Σ E*(C*I)floor
Fig. 19. Deflection ratio modification factors for 20 m long frames on individual footings.
K.H. Goh, R.J. Mair / Soils and Foundations 54 (2014) 250–268 263

0.00
0.20
0.40
0.60
0.80
1.00
1.20
60m simple beam models (e=1m, sagging)
60m simple beam models (e=1m, hogging)
60m simple beam models (e=20m, hogging)
EI (kNm2) EI (kNm2)
MDRsag ; MDRhog EIframe =Σ (EIfloor)
0.00
0.20
0.40
0.60
0.80
1.00
1.20
1.E+03 1.E+04 1.E+05 1.E+06 1.E+07 1.E+08 1.E+03 1.E+04 1.E+05 1.E+06 1.E+07 1.E+08
60m frame models (e=1m, sagging)
60m frame models (e=1m, hogging)
60m frame models (e=20m, hogging)
MDRsag ; MDRhogEIframe =Σ E*(C*I)floor
Fig. 20. Deflection ratio modification factors for 60 m long frames on individual footings.
K.H. Goh, R.J. Mair / Soils and Foundations 54 (2014) 250–268264
first floor tie-beam (KB). When the modification factors inFig. 20 are re-plotted against this frame stiffness factor, theresults from the different frame-on-individual-footing modelsappear to be closely grouped, as seen in Fig. 23.
In a similar way, the horizontal strain modification factorsfor the 20-m frame models with 1-m and 20-m eccentricity andthe 60-m frame models with 20-m eccentricity can be plottedagainst their frame stiffness factors. Fig. 24 shows themodification factor plots for all the models of frames onindividual footings, from which a reasonable upper boundcurve drawn for all the points can be used as design guidance.This can be used for considering the influence of framestiffness to estimate horizontal strains in frame buildings onindividual footings, or buildings on strip footings that aretransverse to the induced deformation trough.
4.4. Design guidance to estimate horizontal strains
Using a simple portal frame to derive the frame stiffnessfactor is clearly a simplification of the actual problem. Inreality, frame structures would have bays of different lengthsas well as different numbers of upper storeys that would havean influence on the framing action at the ground floor. It is alsorecognised that the portal frame in the structural analysis waspin-supported, whereas the footing foundation in an actualbuilding would restrain the rotation of the ground floorcolumns, and the extent of this restraint – depending on thefooting stiffness – would also have an influence on the framestiffness. Infill walls within the frame structures are usually notstructurally monolithic to the frame structure, and it is reason-able to ignore their contribution to frame stiffness – unless thewalls are designed as shear walls and would therefore beadditive to building stiffness.
Nevertheless, a reasonable upper bound can be derived fromamongst all the frame models whose structural elements werevaried. For example, additional finite element models werecompleted for various frame models, shown in Table 6, where arough soil–footing interface was modelled to transfer the maximum
shear stress between the soil and the footing, and under differentexcavation configurations, as summarised in Table 7. Althoughthere are significant differences in the magnitude of the maximumhorizontal strains for the same building between the variousexcavation models, the modification factors of horizontal strainwhen plotted against the frame stiffness factor (Fig. 25) fall withinthe upper bound curve. This suggests that the ability of a framebuilding in resisting horizontal strains between the individualfootings may be more dependent on the structural stiffness of theframe than on the underlying soil profile or the foundation–soilinterface condition.Finally, design guidance defined using an upper bound
curve will estimate higher horizontal strains for framedbuildings on individual footings – this is conservative, butacceptable. Nevertheless, it is noted that there is a significantspread in the modification factors corresponding to each framestructure. It may be possible to reduce the spread by defining amore refined frame stiffness factor through a more rigorousstructural analysis, which could also make the frame stiffnessfactor dimensionless, but the refined factor may be moredifficult to estimate in practice.
5. Conclusions
The influence of frame action on building response has beeninvestigated in this paper. This was done by constructing finiteelement models of frame structures with various configurationsbehind a multi-propped excavation in soft clay, firstly forbuildings on continuous footings, and also for buildings onindividual footings.By re-formulating Meyerhof’s derivation to quantify the
stiffening effect of columns on a beam line in a frame building,a modified column stiffening factor was defined to estimate thebending stiffness of frame structures. The column stiffeningfactor was different from the original Meyerhof derivation intwo ways – firstly, the Young’s modulus of the beams and thecolumns was included to extend its application to compositeframes, and secondly, the sagging length and hogging length

0.00
0.20
0.40
0.60
0.80
1.00
1.20
Mεhc
EA(kN)
EA of a 100mm thick RC slab = 2x10⁶ kN
Various 150x150mm RC columns for h = 3m
Various 150mm thick RCwalls for h = 3m
0.00
0.20
0.40
0.60
0.80
1.00
1.20
1.E+03 1.E+04 1.E+05 1.E+06 1.E+07 1.E+08 1.E+03 1.E+04 1.E+05 1.E+06 1.E+07 1.E+08
Simple beam models
Frame models (h=3m)
Frame models (h=2m)
Frame models (h=1m)
Frame models (h=0.2m)
Mεht
EA(kN)
EA of a 100mm thick RC slab = 2x10⁶ kN
Fig. 21. Horizontal strain modification factors of 60 m long frames on individual footings with various axial stiffness values.
H
Displacement
Δ = ΔA +ΔD
ΔΑ Δ D
h
EI=K C
C
l
EI=K B
B
B
A D
C
l
EIC
EIB
h
Horizontalforce H
Fig. 22. Schematic of the simple portal frame.
0.00
0.20
0.40
0.60
0.80
1.00
1.20
Frame models (h=3m)
Frame models (h=2m)
Frame models (h=1m)
Frame models (h=0.2m)
Mεhc
α f (kN/m)0.00
0.20
0.40
0.60
0.80
1.00
1.20
1.E+00 1.E+01 1.E+02 1.E+03 1.E+04 1.E+05 1.E+00 1.E+01 1.E+02 1.E+03 1.E+04 1.E+05
Mεht
α f (kN/m)
Fig. 23. Horizontal strain modification factors for different frame stiffness factors of 60 m long frames on individual footings.
K.H. Goh, R.J. Mair / Soils and Foundations 54 (2014) 250–268 265
were used instead of the length of the entire building. Bycomparing the finite element results of the frame models withsimple beam models, the bending behaviour of frame struc-tures was found to be well approximated to a simple beammodel when the column stiffening factor was used. Afterestimating the contribution to building stiffness due to itsframing action, designers can then refer to the guidancedeveloped for the building response to tunnelling- andexcavation-induced movements using simple beams (such asthe charts by Franzius et al., 2006, Goh and Mair 2011b, and
Goh and Mair 2011c) and obtain a more realistic estimate ofbuilding behaviour. As an alternative, the simpler method ofalgebraically summing the bending stiffness of each individualfloor beam – and ignoring any frame action – is also reason-able, but less accurate. This holds true for both frames oncontinuous footings and frames on individual footings.In contrast to settlement behaviour, the horizontal displace-
ment responses are different between frames on continuousfootings and frames on individual footings. Whilst horizontalstrains are usually negligible for frames on continuous

K.H. Goh, R.J. Mair / Soils and Foundations 54 (2014) 250–268266
footings, they are significant for frames on individual footingseven when the axial stiffness of the frame building is high. Thegreatest horizontal strains occur at the ground floor betweenindividual column footings, and were observed to be related tothe frame properties at the ground floor. Using a structuralanalysis of a simple, pin-supported portal frame, a new framestiffness factor has been defined to describe the horizontalstiffness of a frame structure. By plotting the horizontal strainmodification factor against the frame stiffness factor, an upperbound curve has been developed to suggest guidance forestimating the maximum horizontal strains in rigidly connectedframe buildings that are on individual footings – includingbuildings on strip footings that are transverse to the inducedground displacement troughs.
0.00
0.20
0.40
0.60
0.80
1.00
1.20
1.E+00 1.E+01 1.E+02 1.E+03 1.E+04 1.E+05 1.E+06 1.E+07
Frame stiffness factor αf (kN/m)
Mod
ifica
tion
fact
or
B=60m, e=1 (compressive)B=60m, e=1 (tensile)B=60m, e=20 (tensile)B=20m, e=1m (compressive)B=20m, e=1m (tensile)B=20m, e=20m (tensile)Design guidance
Mεh
Fig. 24. Horizontal strain modification factors for frames on individualfootings with slipping interface.
Table 6Variation of 60 m long, 2-storey frame models with rough soil–footing interface.
Beam type First floor tie-beam type Column typ
100 mm RC slab, with 5 m bay length 100 mm RC slab 150� 150 m@5 m150 mm RC
300� 300 mm RC beam@5 m
150� 150 m@5 m
250 mm RC slab 150� 150 m@5 m150 mm RC
250 mm RC slab, with 5 m bay length 100 mm RC slab 150� 150 m@5 m250 mm RC
Table 7Variation of soil profiles for 20 m deep excavation.
Model UD_A UD_B
Excavation depth 20 m 20 mSoil profile above stiff bearing layer 20 m thick soft clay 30 m thick soft cWall depth 25 m 35 mD-wall thickness 0.8 m 1 mNo. of props 6 nos. 6 nos.Pt of inflexion 21 m 29 m
Furthermore, the influence of infill walls on the stiffness offramed buildings was ignored; this is reasonable for most caseswhere such infills are not structurally connected to the buildingframe, unless the walls are designed as shear walls. In thelatter, the stiffness of the shear walls could be estimated usingan equivalent deep beam, and would add to the buildingstiffness arising from the frame actions discussed in this paper.This paper only considers the frame action of buildings on
shallow foundations and ignores the influence of any soil–pileinteraction. The key influence of pile foundations, due tovarious construction effects, should be considered separately(e.g., Tamura et al., 2012).Finally, it has to be noted that this study using frame models
relates to the inclusion of building stiffness in estimatingdeflection ratios and horizontal strains from the greenfieldcondition. This does not mean that the response of a framedbuilding is the same as a simple beam or that the damage to aframed building can be fully described using a simple beammodel. The actual damage to a framed structure, due to groundmovements, depends on the re-distribution of loads and strainsamongst its frame elements. This is influenced by its memberproperties and loading patterns, and can only be studied in adetailed structural analysis for each framed building. Never-theless, Burland and Wroth (1974) conceptualised the limitingtensile strain method using an elastic beam representation as asimple means to identify the damage to buildings, includingthose with framed structures. The findings presented in thispaper should be viewed as an attempt to quantify the influenceof building stiffness in the context of the limiting tensile strainmethod. The influence of frame stiffness is to reduce the
e Distance between first floor tie beam and ground footing
m RC column h¼1 m, 3 m, 5 m, 10 m
wall h¼3 m, 5 m, 10 mm RC column h¼1 m, 3 m, 5 m, 10 m
m RC column h¼1 m, 3 m, 5 m, 10 m
wall h¼3 m, 5 m, 10 m
m RC column h¼3 m, 5 m, 10 m
wall h¼3 m, 5 m, 10 m
UD_H UD_L
20 m 20 mlay 12 m soft clayþ8 m firm soil 12 m soft clayþ8 m weathered soil
25 m 25 m0.8 m 0.8 m6 nos. 6 nos.18 m 14 m

Fig. 25. Horizontal strain modification factors for various frames at 1 m behind excavation with rough interface.
K.H. Goh, R.J. Mair / Soils and Foundations 54 (2014) 250–268 267
greenfield deflection ratios and horizontal strains using theproposed methods, so that a more realistic tensile strain can beestimated in Stage 2 of the building damage assessmentprocedure outlined by Mair et al. (1996). The reader shouldnot be misled into thinking that the response of framebuildings can be approximated as simple beam behaviour orvice versa.
References
Burland, J.B., Broms, B.B. and de Mello, V.F.B. 1977. Behaviour offoundations and structures: state-of-the art report. In: Proceedings of theninth International Conference on Soil Mechanics and Foundation Engi-neering, Tokyo, 2, pp. 495–546.
Burland, J.B. and Wroth, C.P. 1974. Settlement of buildings and associateddamage: Session V review paper. In: Conference on Settlement ofStructures, Cambridge, April 1974 , Pentch Press, London, pp. 611–654.
BRE Digest 251, 1995. Assessment of damage in low rise buildings withparticular reference to progressive foundation movements, revised. Build-ing Research Establishment, Watford.
Chong, P.T. 2002. Characterisation of Singapore Lower Marine Clay (Ph.D.thesis). National University of Singapore, Singapore.
Dimmock, P.S., Mair, R.J., 2008. Effect of building stiffness on tunnelling-induced ground movement. Tunn. Undergr. Space Technol. 23 (4),438–450 (2008).
Elshafie, M. Z. E. B. 2008. Effect of Building Stiffness on Excavation InducedDisplacements (Ph.D. thesis). University of Cambridge.
Franzius, J.N., Potts, D.M. and Burland, J.B. 2006. The response of surfacestructures to tunnel construction. In: Proceedings of the Institution of theCivil Engineers, Geotechnical Engineering, 159(1): 3–17.
Goh, K.H. 2010. Response of Ground and Buildings to Deep Excavations andTunnelling (Ph.D. thesis). University of Cambridge.
Goh, K.H. and Mair, R.J. 2011a. The horizontal response of framed buildingson individual footings to excavation-induced movements. In: Proceedings
of the Seventh International Symposium TC28 Geotechnical Aspects ofUnderground Construction in Soft Ground, May 2011, Rome.
Goh, K.H. and Mair, R.J. 2011b. The response of buildings to movementsinduced by deep excavations. In: Proceedings of the Seventh InternationalSymposium TC28 Geotechnical Aspects of Underground Construction inSoft Ground, May 2011, Rome.
Goh, K.H., Mair, R.J., 2011c. Building damage assessment for deep excava-tions in Singapore and the influence of building stiffness. Geotech. Eng. J.SEAGS AGSSEA 42 (3), 1–12 (September 2011).
Lambe, T.W., 1973. Prediction in soil engineering. Géotechnique 23 (2), 149–202.Leong, E.C., Rahardjo, H., Tang, S.K., 2003. Characterisation and engineering
properties of Singapore residual soils. Characterisation and EngineeringProperties of Natural Soils, 1. Swets & Zeitlinger, Lisse, 1279–1304.
Liew, Y.K., Veluvolu, H., Kho, C.M. and Sigl, O. 2008. Risk assessment forearth pressure balancing bored tunnelling under shophouses along PasirPanjang Road. In: Proceedings of the International Conference on DeepExcavations, 10–12 November 2008, Singapore.
Mair, R.J., Taylor, R.N., Bracegirdle, A., 1993. Sub-surface settlement profilesabove tunnels in clays. Geotechnique 43 (2), 315–320.
Mair, R.J. 2003. Keynote lecture: Research on tunnelling-induced groundmovements and their effects on buildings – lessons from the Jubilee LineExtension. In Jardine, F.M. (Ed.), Response of Buildings to ExcavationInduced Ground Movements, Proceedings of International Conference,London, 17–18 July 2001: 3–26. London: CIRIA.
Mair, R.J. and Taylor, R.N. 1997. Bored tunnelling in the urban environment:state-of-the-art report and theme lecture. In: Proceedings of the FourteenthInternational Conference on Soil Mechanics and Foundation Engineering,Hamburg, 6–12 September 1997, 4: 2353–2385. Balkema, Rotterdam.
Mair, R.J., Taylor, R.N., 2001a. Elizabeth house: settlement predictions. In: Burland,J.B., Standing, J.R., Jardine, F.M. (Eds.), Building Response to tunnelling –
Case studies from construction of the Jubilee Line Extension, London, Vol. 1.Thomas Telford, London, pp. 195–215 (Projects and Methods).
Mair, R.J., Taylor, R.N., 2001b. Settlement predictions for Neptune, Murdoch,and Clegg Houses and adjacent masonry walls. In: Burland, J.B., Standing,J.R., Jardine, F.M. (Eds.), Building Response to tunnelling – Case studies

K.H. Goh, R.J. Mair / Soils and Foundations 54 (2014) 250–268268
from construction of the Jubilee Line Extension, London, Vol. 1. ThomasTelford, London, pp. 217–228 (Projects and Methods).
Mair, R.J., Taylor, R.N. and Burland, J.B. 1996. Prediction of groundmovements and assessment of risk of building damage due to boredtunnelling, In: Mair, R.J., Taylor, R.N. (Eds.), Proceedings of theInternational Symposium on Geotechnical Aspects of Underground Con-struction in Soft Ground, London, 15–17 April 1996: 713–718. Rotterdam:Balkema.
Meyerhof, G.G., 1953. Some recent foundation research and its application todesign. The Structural Engineer 31, 151–167.
Potts, D.M. and Addenbrooke, T.I. 1997. A structures influence on tunnelling-induced ground movements. In: Proceedings of the Institution of the CivilEngineers, Geotech. Engineering 125(2): 109–125.
Tan, T.S., Phoon, K.K., Lee, F.H., Tanaka, H., Locat, J., Chong, P.T., 2003. Acharacterisation study of Singapore Lower Marine Clay. Characterisationand Engineering Properties of Natural Soils, 1. Swets & Zeitlinger, Lisse429–454.
Tamura, S., Adachi, K., Sakamoto, T., Hida, T., Hayashi, Y., 2012. Effects ofexisting piles on lateral resistance of new piles. Soils Found. 52 (3),381–392.
Tanaka, H., Locat, J., Shibuya, S., Tan, T.S., Shiwakoti, D.R., 2001.Characterization of Singapore, Bangkok, and Ariake clays. Can. Geotech.J. 38 (2), 378–400.
Venkta, R., Hoblyn, S., Mahatma, S. and Lim, H.C. 2008. EPB tunnelling under 2-storey shophouses in mixed face conditions. In: Proceedings of the InternationalConference on Deep Excavations, 10–12 November 2008, Singapore.