response analysis of berthing structures for wave …
TRANSCRIPT

RESPONSE ANALYSIS OF BERTHING
STRUCTURES FOR WAVE AND
EARTHQUAKE INDUCED FORCES
INCLUDING
SOIL- STRUCTURE INTERACTION
Thesis
Submitted in partial fulfillment of the requirements for the degree of
DOCTOR OF PHILOSOPHY
By
SHANTHALA B.
Register No. AM04P06
DEPARTMENT OF APPLIED MECHANICS AND HYDRAULICS
NATIONAL INSTITUTE OF TECHNOLOGY KARNATAKA
SURATHKAL, MANGALORE – 575025
SEPTEMBER- 2013

D E C L A R A T I O N
I hereby declare that the Research Thesis entitled “Response analysis of berthing
structures for wave and earthquake induced forces including soil-structure
interaction” which is being submitted to the National Institute of Technology
Karnataka, Surathkal in partial fulfillment of the requirements for the award of
the Degree of Doctor of Philosophy in Civil Engineering is a bonafide report of
the research work carried out by me. The material contained in this thesis has not
been submitted to any University or Institution for the award of any degree.
Register Number: AM04P06
Name of the Research Scholar: Shanthala B
Department of Applied Mechanics and Hydraulics
Place : NITK-Surathkal
Date : 30.08.2013

C E R T I F I C A T E
This is to certify that the Research Thesis entitled “Response analysis of berthing
structures for wave and earthquake induced forces including soil - structure
interaction” submitted by Shanthala B , Register Number: AM04P06 as the record
of the research work carried out by her is accepted as the Research Thesis
submission in partial fulfillment of the requirements for the award of degree of
Doctor of Philosophy.
Prof. Subba Rao Prof. Katta Venkataramana
(Research Guide) (Research Guide)
Prof. Subba Rao
(Chairman – DRPC)
DEPARTMENT OF APPLIED MECHANICS AND HYDRAULICS
NATIONAL INSTITUTE OF TECHNOLOGY KARNATAKA
SURATHKAL, MANGALORE – 575 025
ACKNOWLEDGEMENTS
With deep sense of gratitude, I express my heartfelt thanks to Dr. Subba Rao,
Professor and Head, Department of Applied Mechanics and Hydraulics, NITK,
Surathkal for his elucidative and comprehensive guidance and encouragement at every stage
of this work. He has been a source of inspiration to me in academics as well as in my career.
I owe a great deal of gratitude and heartfelt thanks to Dr. Katta Venkataramana, Professor and
Head, Department of Civil Engineering, NITK, Surathkal, for his benevolence, invaluable
guidance and constant inspiration during the thesis work. His moral support and critical
guidance and ever helpful attitude will always be admired, valued and cherished.
With deep sense of regards, I wish to thank the members of my doctoral committee
Dr.M.C.Narasimhan, Professor Department of Civil Engineering and Dr..Nityananda
Shetty, Professor , Department of Chemistry, NITK, Surathkal for the very best
support and useful suggestions provided for the successful completion of this work.
I thank the former Directors of NITK,Surathkal, Prof. S.S. Murthy,
Prof.G.K.Shivakumar, Prof. Sandeep Sancheti and present Director Prof. Swapan
Bhattacharya, for granting me the permission to use the institutional infrastructure
facilities, without which this research work would have been impossible.
I am greatly indebted to Prof M.K. Nagaraj, Professor and former Head, Department
of Applied Mechanics and Hydraulics, NITK, Surathkal for granting me the
permission to use the department computing facility and laboratory facilities for
necessary research work to the maximum extent.
My sincere thanks to Dr. A.U. Ravishankar, Professor and former Head, Department
of Civil Engineering for his co-operation and constant support given throughout my
stay in the campus.
I thank Mr.Balakrishna, Literary Assistant, NITK, Surathkal, for all help rendered
without which it was impossible for me to complete this work on time.
I acknowledge the good wishes and words of encouragement of my colleagues. I
would also like to thank all the teaching and non-teaching staff of the Department of
Applied Mechanics and Hydraulics for their constant support.

I wish to express my gratitude to Harish N, Research scholar, NITK Surathkal and
Likhith, P.G. Student, MIT Manipal for their help and support in successfully
completing the work needed for the research
I express heartfelt gratitude to authors of all those research publications which have
been referred in this thesis
I thank Mr. Jagadish, Foreman, and his supporting staff, Mr, Anand Devadiga, Mr
Gopala Krishna, and Mr. Padmanabha Acharya for their help and support.
Thanks to Mr. Pruthviraj U, for his help and support in successfully completing the
laboratory work needed for this research. His friendly gesture will always be
remembered.
My affectionate thanks are due to my husband, Mr. Sharath Kumar who has been a
pillar of strength and support for me throughout my life. I profusely thank him for his
support in my all academic activities.
A number of people have helped directly and indirectly in the course of this work. I
wish to convey the deepest thanks to everyone who has contributed towards this
thesis, without whom its completion would have been impossible.
Finally, I wish to express my gratitude, love and affection to my family members,
father Sri. K. Vasudeva Nayak, son Shashank, daughter Shivani for their continuous
and invaluable encouragement on the road to the completion of my research. I also
thank my late mother who taught me, “Knowledge is Wealth”, and I dedicate all my
gains to her soul.
Above all, I would like to thank Almighty God for the completion of this thesis.
Shanthala B.

i
ABSTRACT
Countries surrounded by ocean can easily achieve tremendous progress in trade and
industry provided proper planning of ports and harbours is made for transportation of
goods and materials through sea transport. Rapid growth in the water transport system
demands the construction of more port and harbour structures. Berthing structures are
constructed in ports and harbours to provide facilities such as berthing and mooring of
vessels, loading and unloading of cargo and embarking and disembarking of passengers.
Berthing structures are classified as vertical face structures such as diaphragm walls and
open piled structures such as jetties. These berthing structures are to be designed for
berthing force, mooring force, wave force, current force, seismic force, active earth
pressure and differential water pressure, in addition to self-weight of the structure and
live load. The deck of berthing structure is generally supported by vertical piles Waves
contribute to major loads on marine structures. Therefore it is important to quantify
wave-induced load effects to ensure a reasonable, safe and robust design of berthing
structures
The piled structures are the most commonly adopted structures in shallow water and
deep water. Safe operations on such structures have pressed the necessity to design them
to resist the disturbing wave environment, since wave forces are random and vary with
time. In the present work, an attempt is made to study the response of vertical member
and a simplified piled berthing structure with and without soil structure interaction.
Miniature model of such structures are tested for finding natural frequency and response
to forced vibrations. All of the experimental observations are reproduced quite
accurately by the simulation. It was found that inclusion of water and the soil tend to
increase the natural frequency of the structure.
In this research conceptual layout of jetty for berthing 200000 DWT ship is carried out
based on the available environmental data and the ship dimensions at New Mangalore
Port Trust, Mangalore. Static and dynamic wave response analysis is carried out using
StruCAD 3D software, considering various load combinations. Responses are estimated
ii
for various pile diameters and the results are compared. Responses are also found for
45º, 90º and 135º wave directions and it is seen that the structural response is maximum
for wave direction perpendicular to the structural alignment. The detailed analysis of
berthing structure, for the design significant wave height of 3. 2m and maximum wave
height of 5.5 m is carried out for a full cycle of wave and responses are found out.
In order to carryout analysis of a structure under earthquake conditions a representation
of the earthquake loading is essential. In such situation dynamic analysis of the structure
will be required in which case accelerograms will be used given that they offer detailed
representation of the ground motions during earthquakes. At the same time they provide
the nature of the earthquake ground shaking. In this thesis three types of recorded
accelerograms were used for the time history analysis of berthing structure with and
without soil structure interaction. From the time history analysis optimum width was
found for the deflection criteria. It was found that soil – structure interaction causes
increase in displacements of the structure, which can cause large increase in natural
period, leading to much larger relative displacements.
Keywords: Berthing structure, modal analysis, transient analysis, wave response,
earthquake response, soil-structure interaction.

iii
CONTENTS
PAGE NO
CERTIFICATE
ABSTRACT i
ACKNOWLEDGEMENTS ii
CONTENTS iii
LIST OF NOTATIONS vii
CHAPTER 1 INTRODUCTION 1-12
1.1 Port and Harbour Structures 1.1
1.1.1 Berthing structures 2
1.1.2 Jetty 3
1.2 WAVE STRUCTURE INTERACTION 4
1.3 SEISMIC RESPONSE ANALYSIS 5
1.4 SOIL STRUCTURE INTERACTION 7
1.4.1 Dynamic soil structure interaction 8
CHAPTER 2
1.4.2 Methods of analyzing soil structure interaction
1.5 DYNAMIC ANALYSIS PROCEDURES
1.6 OBJECTIVES AND SCOPE OF THE WORK
1.7 FORMAT OF PRESENTATION
LITERATURE REVIEW
9
10
11
12
13-35
2.1 WAVE STRUCTURE INTERACTION 13
2.2 EARTHQUAKE EFFECTS 18
2.3 SOIL PILE STRUCTURE INTERACTION 20
2.4 EXPERIMENTAL TECHNIQUES
2.5 SUMMARY OF LITERATURE REVIEW AND
PROBLEM FORMULATION
30
33

iv
CHAPTER 3
GENERAL REQUIREMENT OF BERTHING
STRUCTURES
36-52
3.1 General 36
3.1.1 Length of Berthing Structure 36
3.1.2 Width of Berthing Structure 37
3.1.3 Dredged Area 37
3.1.4 Deck Level of Berthing Structure 37
3.1.5 Fenders and Bollards 38
3.1.6 Expansion Joint 39
3.2 FORCES ON BERTHING STRUCTURE 39
3.2.1 Live Loads 39
3.2.2 Berthing Load 41
3.2.3 Mooring Load 43
3.2.4 Force Due to Wind 43
3.2.5 Wave Forces on Structural Elements 44
3.3 Computation of wave force on a vertical pile 47
3.4 Current Force 48
3.5 Seismic force 48
3.6 Summary of design loads 48
3.6.1 Design dead load 49
3.6.2 Design live load 50
3.6.3 Design Berthing force 50
3.6.4 Mooring forces 51
3.6.5 Wind load 51
3.6.6 Wave force 51
3.6.7 Current 52

v
CHAPTER 4 VALIDATION OF EXPERIMENTAL
INVESTIGATION
54-74
4.1 CANTILEVER BEAM 54
4.2 TEST ON SINGLE CYLINDER 56
4.3 EXPERIMENTAL SET UP FOR SOIL
STRUCTURE INTERACTION
58
4.4 SIMPLIFIED BERTHING STRUCTURE
MODEL
60
4.5.1 ACCELEROMETER 61
4.5.2 STRAIN GAUGE 62
4.6 RESULTS AND DISCUSSIONS 62
4.7 MODAL ANALYSIS- NATURAL
FREEQUENCIES
68
4.8 TRANSIENT ANALYSIS 70
4.9 CONCLUSIONS 73
CHAPTER 5 WAVE RESPONSE ANALYSIS 75-102
5.1 GENERAL 75
5.2 BERTHING JETTY 76
5.2.1 Approach Jetty 76
5.2.2 Structural model 77
5.3 LOAD COMBINATION 78
5.4 STATIC ANALYSIS 79
5.4.1 Deflection, for significant wave height of 3.2m. 80
5.5 WAVE RESPONSE ANALYSIS 82
5.5.1 Joint deflection 85
5.6 Static and dynamic response for wave loading 88
5.7 SOIL STRUCTURE INTERACTION USING
SAP 2000 SOFTWARE
94

vi
5.7.1 Methodology for static analysis 96
5.8 CONSIDERING SOIL MASS OF SIZE 3D 96
5.8.1 Static Analysis 96
5.9 CONSIDERING SOIL MASS OF SIZE 4D 99
5.9.1 Joint deflection from wave response analysis 100
5.10 SUMMARY AND CONCLUSIONS 100
CHAPTER 6 EARTHQUAKE RESPONSE ANALYSIS 103-112
6.1 GENERAL 103
6.2 RESPONSE OF THE STRUCTURE FOR
EARTHQUAKE WITHOUT SSI
106
6.3 RESPONSE OF THE STRUCTURE FOR
EARTHQUAKE WITH SSI FOR 3D
107
6.4 RESPONSE OF THE STRUCTURE FOR
EARTHQUAKE WITH SSI FOR 4D
109
6.5 CONCLUSIONS 112
CHAPTER 7 SUMMARY AND CONCLUSIONS 113-116
7.1 SUMMARY 113
7.2 CONCLUSIONS 114
7.3 SCOPE FOR FUTURE WORK 116
APPENDIX I REFERENCES 117-126
APPENDIX II LIST OF PUBLICATIONS BASED ON PRESENT
RESEARCH WORK
127-128

vii
LIST OF NOTATIONS
Symbol Meaning
Aw Windage area in m²
B Beam of vessel
CD Drag coefficient
Ce Eccentricity coefficient
Cm Mass coefficient
Cs Softness coefficient
Cw Shape factor
Dm Maximum base dimension of the structure
D' Draught of the vessel m
D Diameter of the pile
DL Average light draft
DM Molded depth in m
E Berthing energy
F Force due to wind in Kn
Fwx wind forces along the x direction
Fwy wind forces along the y direction
G Acceleration due to gravity
H Total height of main structure in meters
I Importance factor
K Wave number
K Stiffness matrix
L length of the vessel
Lv Length between perpendicular in m
M Mass

viii
L Wave length
P Wind pressure
Ρ Mass density
Pz Design wind pressure at height Z
R response reduction factor
R Radius of gyration
Sa/g Average acceleration coefficient spectra
T Wave period
Ts Fundamental nature period
U Instantaneous water particle velocity
u0 Maximum horizontal water particle velocity
V Berthing velocity
Ν Kinematic viscosity
Vw Wind speed
Vz Design wind velocity
w Unit weight of water
WD Displacement tonnage
Wm Moulded Weight
Wave frequency
Response analysis of berthing structures for wave and earthquake induced forces including soil-structure interaction
PhD Thesis, NITK Surathkal, INDIA,2012
1
CHAPTER 1
INTRODUCTION
1.1 PORT AND HARBOUR STRUCTURES
The basic function of a port is to provide a link between land and sea transport and to
furnish means by which transfers of freight and passengers between the two systems
can be made efficiently (Tull 1997). Indian subcontinent is gifted with a long
coastline of around 7500 km. The major and minor ports located along the coastline
play an important role in promoting commercial and industrial activities. More than
70% of the total trade of our country is through the water, hence port activities and
their development is directly linked with the overall economy. Along the coastal belt,
India is having 13 major ports and more than 187 minor ports. Due to the high growth
rate of Indian economy and the continuous expansion of the maritime trade in the last
decade, there has been an increasing need and demand for not only new mechanized
ports but also the expansion and developments of the existing ports to cater to the
needs of the present generation shipping vessels. Countries surrounded by ocean can
easily achieve tremendous progress in trade and industry provided proper planning of
ports and harbours is made for transportation of goods and materials through sea
transport. Rapid growth in the water transport system demands the construction of
more and more port and harbour structures.
Shore Protection Manual (1984) defines harbour as “any protected area affording a
place of safety for the vessels”, while Port is defined as “a place where vessels may
discharge or receive cargo, it may be the entire harbour including its approaches and
anchorage, or any of the commercial part of the harbour where quay, wharves,
facilities for transfer of cargo, docks to repair ships are provided”.

Chapter 1 Introduction
Response analysis of berthing structures for wave and earthquake induced forces including soil-structure interaction PhD Thesis, NITK Surathkal, INDIA, 2013
2
A port is constructed to provide facilities for the transshipment of ship cargo,
transported to and from the inland locations by rail, road, inland waterways and
pipeline. The basic requirement is to accommodate the ships safely along the berths or
anchor. Mechanical handling equipments have to be provided for the efficient
handling of cargo. Also, storage facilities have to be provided at the port. A port
facility essentially consists of pier, wharfs, quays, bulkheads, dolphins and platform
of structure, trestle and access bridge or catwalk and buildings. They are classified
depending upon the type of service they provide as follows;
a) Harbour protection facilities.
b) Berthing, mooring and repair facilities.
c) Storage facilities.
1.1.1 Berthing structures
The facility constructed in the ports, which actually interacts with the incoming
vessels while berthing, mooring and repairing is collectively called berthing structure.
The berthing structure consists of jetties, moorings and berthing dolphins etc. The
berthing structures and breakwaters constitute the most expensive structures
constructed in any port. A berthing structure can be classified as an open type
structure or a vertical face type structure. Open type structures consist of a rigid deck
supported over vertical piles or combination of vertical and raker piles. The slope
underneath the structure, established either by dredging or by filling should be
constructed prior to the pile driving to avoid lateral forces to be developed on the piles
due to the lateral movement of soil. Fig 1.1 shows an open type structure.

Chapter 1 Introduction
Response analysis of berthing structures for wave and earthquake induced forces including soil-structure interaction PhD Thesis, NITK Surathkal, INDIA, 2013
3
Fig 1.1 open type structure (Gaythwaite, 1981)
In vertical type structures, sheet pile walls, block wall, caissons and diaphragm walls
are used. The diaphragm walls resist the active earth pressure and the load is absorbed
by the tie rods anchored to the diaphragm walls or raker piles and by passive earth
pressure in front of toe of wall. Fig 1.2 shows the vertical face type structure.
Fig 1.2 vertical face type structure (Gaythwaite, 1981)
1.1.2 Jetty
A pier or jetty is a structure projecting into water, in a harbour basin. Jetties are also
located in open water outside actual harbours. A jetty consists of number of structures
such as berthing dolphin, mooring dolphin, loading platform, and trestle to shore, each
of which has a special type of function.

Chapter 1 Introduction
Response analysis of berthing structures for wave and earthquake induced forces including soil-structure interaction PhD Thesis, NITK Surathkal, INDIA, 2013
4
The mooring dolphins pick up the pull from hawsers. Mooring dolphins for breast line
are located at the bow and stern at a distance (about the beam of the ship) from the
berth tie, which will not make the moorings too steep. The berthing dolphins support
fenders, which absorb berthing impacts. The berthing dolphins should be placed in
such a way that the distance neither exceeds the length of straight side of the smallest
vessel nor is less than approximately one third of the maximum length of the largest
vessel. The jetty structures are further classified based on type of construction
material and position of piles. Based on the material of construction, the jetty
structures are classified as timber jetties, iron and steel jetties, reinforced concrete
jetties. Nowadays reinforced concrete jetties are largely used. The reliability and life
of the structure is dependent upon the method of analysis and material properties
used.
1.2 WAVE – STRUCTURE INTERACTION
When a structure is subjected to periodic wave forces, it experiences corresponding
periodic displacements with a frequency same as that of the wave loading. The
associated back-and-forth accelerations of the structural mass induce, in turn, dynamic
inertia forces on the structure. The effect of these dynamic inertia forces of the
structure is generally to cause an increase in the displacements over those caused by
the wave forces. If the natural frequency of the structure is considerably different than
that of the wave loading, the dynamic amplification of the deflections will be small.
This is the case for relatively short, stiff structures placed in relatively small water
depths. In the case of taller structures, or in the case of structures having considerable
flexibility because of their particular forms, the natural frequency of the structure may
be close to that of the wave loading. This results in appreciable dynamic
amplification. In such circumstances, a structure should be designed for dynamic
effects in addition to the static considerations and a detailed dynamic analysis is
essential.

Chapter 1 Introduction
Response analysis of berthing structures for wave and earthquake induced forces including soil-structure interaction PhD Thesis, NITK Surathkal, INDIA, 2013
5
The piled structures are the most commonly adopted offshore structures. Safe
operations on such structures have pressed the necessity to design them to resist the
disturbing wave environment. The wave forces are random and vary with time. In the
present study, vertical cylinder and a simplified piled structure are analyzed for its
dynamic characterization when it is exposed to wave forces. Experimental and
numerical simulation is done in order to predict the free surface flow which can be
helpful to determine the wave impact on the marine structures.
1.3 SEISMIC RESPONSE ANALYSIS
It may so happen that the marine structures are subjected to severe earthquakes
leading to large losses. In such cases knowledge of the dynamic characteristics of the
structures under earthquake loads becomes essential. Earthquakes are formed by
sudden energy release in a volume of rock lying on a fault. The source of vibration
normally located at large distance and significant depth from the site. During the
ground shaking caused by an earthquake, the stress waves affect the waves in ocean.
Historical references to the effect of local site conditions in the earthquake damage
extend back to nearly two centuries. Kramer (2003) referred to the statement made by
Mac Murdo in 1824 relating to the earthquake which occurred in Cutch, India in 1819
which stated that “buildings situated on rock were not by any means so much affected
as those whose foundations did not reach to the bottom of the soil”. Studies about the
1906 San Francisco earthquake showed that the intensity of ground shaking in the
earthquake was related to local soil and geologic conditions. Site dependent
amplification factors from recordings of microseisms at sites with different subsurface
conditions were also developed. The Michoacan earthquake of magnitude 8.1 on
September 19, 1985 caused only moderate damage in the vicinity of its epicenter near
the Pacific coast of Mexico but caused extensive damage 350Km away in Mexico
City. Structural damage was highly selective, while large parts of the city experienced
no damage, other areas suffered pronounced damage. The greatest damage occurred
in those portions of the Lake Zone underlain by 38 m to 50 m of soft soil. Studies of

Chapter 1 Introduction
Response analysis of berthing structures for wave and earthquake induced forces including soil-structure interaction PhD Thesis, NITK Surathkal, INDIA, 2013
6
ground motions recorded at different sites in Mexico City illustrated the significant
relationship between local soil conditions and damaging ground motions.
An earthquake of magnitude 7.1 occurred near Mt.Loma Preita located about 100 Km
south of San Francisco and Oakland, California on October 19, 1989. The Loma
Preita earthquake produced MMI VIII shaking in the epicentral region but resulted in
higher intensities of MMI IX in portions of San Francisco and Oakland. The response
of two seismographs located at Yerba Buena Island and Treasure Island, virtually at
the same distance from the source, recorded dramatically different ground surface
motions. The peak acceleration at Yerba Buena Island was 0.06g and the
corresponding value at Treasure Island was 0.16 g. The Treasure Island seismograph
was underlain by 45 ft of loose sandy soil of hydraulic fill and natural soils, over 55 ft
of San Francisco bay mud. The Yerba Buena Island is a rock outcrop and the
seismograph was located directly on rock. Significant amplification of the underlying
bedrock motion was caused by the presence of soft soils at the Treasure Island site.
The devastating Bhuj earthquake that struck the Kutch area in Gujarat of magnitude
7.7 on 26th
January 2001 was the most damaging one in the last 50 years in India. The
epicenter of the earthquake was located at 23.4°N, 70.28°E and at a depth of about
25 km to the north of Bacchau town. A number of residential apartments suffered
extensive damage and collapse in Ahmadabad city, which is nearly 300 km away
from the epicenter. The city stands over deep deposits of cohesionless soil. The
random distribution of such damage has been recorded from a number of localities
scattered on the left and right banks of Sabarmati River. Govindaraju et al. (2004)
carried out a site specific analysis and reported the settlement of soil deposit and soil
amplification of a site close to Sabarmati river belt in Ahmadabad City during the
earthquake in Bhuj. The high degree of damage to multistory buildings was
essentially due to the transfer of large accelerations by soil amplification. Thus soil
structure interaction also plays important roles under earthquake.
Chapter 1 Introduction
Response analysis of berthing structures for wave and earthquake induced forces including soil-structure interaction PhD Thesis, NITK Surathkal, INDIA, 2013
7
The seismic structural analyst should perform appropriate analyses to predict the
earthquake response of the structure. This includes the selection of a method of
analysis, formulation of structural mass and stiffness to obtain vibration properties,
specification of damping, definition of earthquake loading and combination with
static loads, and the computation of response quantities of interest. The analysis
should start with the simplest method available and progress to more refined types as
needed. It may begin with a pseudo-static analysis performed by hand or spreadsheet
calculations, and end with more refined, linear elastic response-spectrum and time-
history analyses carried out using appropriate computer programs. The required
material parameters are formulated initially based on preliminary values from the
available data and past experience or new test data. Damping values for the linear
analysis should be selected, consistent with the induced level of strains. Seismic loads
should be combined with the most probable static loads and may include multiple
components of the ground motion when the structure is treated as a two-dimensional
or three-dimensional model. In the modal superposition method of dynamic analysis,
considerable number of vibration modes should be selected. In simplified procedures,
the earthquake loading is represented by the equivalent lateral forces associated with
the fundamental mode of vibration, where the resultant forces are computed from the
equations of equilibrium.
1.4 SOIL - STRUCTURE INTERACTION (SSI)
The motion experienced by the base of a structure founded on rock is essentially
identical to that occurring in the same point before the structure is built. The seismic
analysis can thus be restricted to the structure excited by this specified motion. But in
the case of a structure founded in soft soil site, two important modifications arise for
the same incident seismic waves from the source. First, the ground motion recorded
on the base of the structure will be different from that which would have been
recorded had there been no building. Second, the response to earthquake motion of a
structure founded on a deformable soil will not be the same as the structure supported
on a rigid foundation.

Chapter 1 Introduction
Response analysis of berthing structures for wave and earthquake induced forces including soil-structure interaction PhD Thesis, NITK Surathkal, INDIA, 2013
8
The presence of the structure in the soil will change the dynamic system from the
fixed base condition. The structure will interact with the surrounding soil, leading to a
further change of the seismic motion at the base. These are the two aspects of the
problem of building-foundation interaction during earthquakes which are of major
significance to earthquake engineering.
The practical importance of these effects depends on the properties of the soil-
structure system. in terms of the dynamic properties of the system, this dynamic
coupling, or interaction between a building and the surrounding soil will generally
have the effect of reducing the fundamental frequency of the system from that of the
structure on a rigid base, and dissipating part of the vibrational energy of the building
by wave radiation into the foundation medium. There will also be energy losses due to
internal friction of the soil. Because of these effects, the response of a structure on a
soft soil to a given earthquake excitation will, in general, be different from that of the
same structure supported on a rigid ground. The influence of the flexibility of soil on
the response of structures subjected to earthquake motion is also studied in this thesis.
1.4.1 Dynamic soil - structure interaction
When a structure founded on rock is subjected to ground motion, the extremely high
stiffness of the rock constrains the rock motion and the structure response is
considered to be that of a fixed base structure. The same structure would respond
differently if supported on a soft soil. The motion of the base of the structure, deviate
from the free field motion, due to the inability of the foundation to conform to the
deformations of the free field. In addition, the dynamic response of the structure
would induce deformation of the supporting soil. The response of the soil influences
the motion of the structure and the response of the structure influences the motion of
the soil. This process is generally referred to as dynamic soil-structure interaction.

Chapter 1 Introduction
Response analysis of berthing structures for wave and earthquake induced forces including soil-structure interaction PhD Thesis, NITK Surathkal, INDIA, 2013
9
The dynamic characteristics of a structural system changes when the supporting
medium of soil is also considered as an integral part of the structure, when compared
to those with the conventional, completely restrained supports. This is reflected in
significant modification of stress components and deflections, in the structural system,
from the expected behaviour of the system on a rigid supporting foundation.
More recent trends in earthquake engineering include analyzing the displacement that
a structure undergoes during an earthquake, and considering the structural as well as
nonstructural damage that it causes. Even though soil-structure interaction increases
dampening, which is beneficial, it can also cause additional displacement to the
overall structure. This demand on the structure can, in some cases, have detrimental
effects. In structures founded on softer soil, the interaction can cause large increases
in the natural period of the structure, leading to much larger relative displacements.
1.4.2 Methods of analysing soil-structure interaction
There are two commonly used methods of SSI analysis, multistep methods and direct
methods. Multistep methods use the principle of superposition to combine the effects
of kinematic and inertial interaction, and are limited to the analysis of linear or
equivalent linear systems. Direct methods model the entire soil–foundation–structure
system in a single step and are more robust than multistep methods, although they are
computationally more demanding.
In the direct method, the entire soil-foundation-structure system is modeled and
analysed in a single step. The free field motions are specified along the base and sides
of the model and the resulting response of the interacting system is computed for a
finite element model from the equations of motion.

Chapter 1 Introduction
Response analysis of berthing structures for wave and earthquake induced forces including soil-structure interaction PhD Thesis, NITK Surathkal, INDIA, 2013
10
In the multistep or substructure method, the soil–structure system is divided into two
substructures, a structure, which may include a portion of non-linear soil or soil with
an irregular boundary, and the unbounded soil. These substructures are connected by
the general soil–structure interface. Usually, a dynamic soil–structure interaction
analysis by the multistep method can be performed in three steps as follows:
i) Determination of seismic free-field input motion along the general
soil–structure interface;
ii) Determination of the reaction of the unbounded soil on the general
soil–structure interface in the form of a displacement–force
relationship;
iii) Analysis of the bounded soil–structure system under the action of the
externally applied transient loading and the ground interaction force
determined by steps (i) and (ii).
1.5 DYNAMIC ANALYSIS PROCEDURES
Linear dynamic analysis procedures are presently used for earthquake resistant design
and safety evaluation of structures. The linear dynamic analysis is performed using
the response spectrum or the time-history modal superposition method. The primary
feature of the modal analysis is that the total response of a structure is obtained by
combining the response of its individual modes of vibration, calculated separately.
The response spectrum analysis is adequate for structures whose responses to
earthquakes are within the linear elastic range. But for structures in which the
cracking strength of the concrete and yield strength of the reinforcing steels may
exceed under a major earthquake, a linear time-history analysis provides additional
information that is essential to approximating the damage or expected level of
inelastic response behavior.
In the response spectrum analysis, the maximum response of the structure to
earthquake excitation is evaluated by combining the maximum responses from

Chapter 1 Introduction
Response analysis of berthing structures for wave and earthquake induced forces including soil-structure interaction PhD Thesis, NITK Surathkal, INDIA, 2013
11
individual modes and multi-component input. The accuracy of the results depends on
the number of vibration modes considered and the methods of combination used for
the modal and multi component earthquake responses. Each computed result
represents the maximum magnitude for that response quantity.
Linear time-history analysis involves computation of the complete response history
of the structure to earthquakes, and not just the maximum response values. The results
of such analysis serve to demonstrate the general behavior of the seismic response.
Combined with rational interpretation and judgment, this can provide a reasonable
estimate of the expected inelastic behavior.
1.6 OBJECTIVES AND SCOPE OF THE WORK
The design of berthing structures has been largely based on static analysis of the
structure under a variety of deck and environmental loading. The cyclic wave loading
applied quasi- statically i.e. the wave force would be considered at which there is
maximum base shear and overturning moment. These techniques are adequate when
the natural frequency of vibration of the structure is well away from that of wave
loading. Consequently as far as serviceability of structure is concerned, an estimate of
dynamic effect is necessary. To check the functionality of structure it becomes
essential to calculate the deck deflections and corresponding stresses with respect to
dynamic forces. Berthing structures when subjected to heavy lateral loads have to be
transferred from weak subsoil to firm strata. Soil behaviour is also important
parameter for design of berthing structures.
Hence the objective of the present research is to perform the static and dynamic wave
response analysis to know the static and dynamic displacements with and without
including soil-structure interaction and to perform time history analysis for different
earthquake motions.

Chapter 1 Introduction
Response analysis of berthing structures for wave and earthquake induced forces including soil-structure interaction PhD Thesis, NITK Surathkal, INDIA, 2013
12
In the present work, the study is carried out in two phases.
(i) Wave response analysis is carried out with and without considering soil
flexibility on dynamic parameters of the models. Experimental investigation
is also done on single cylinder and simple berthing structure models.
(ii) Time history analysis of berthing structure is carried out to study the static
and dynamic soil-structure interaction effects and due to earthquake effects.
1.7 FORMAT OF PRESENTATION
The thesis is presented in seven chapters. Chapter 1 introduces the basic concepts of
berthing structures, wave response analysis, seismic response analysis, dynamic soil-
structure interaction procedures with scope of the present work. Chapter 2 gives a
review of the literature of previous research and the formulation of the present
research work. Chapter 3 describes the general requirements of the berthing structure
and the various loads and its contribution on the structure. Chapter 4 discusses the
experimental investigation on single cylinder and small scale berthing structure
model. In Chapter 5 wave response analysis is described with idealization of
structure and the methodology followed. It also deals with the time history analysis of
structures with and without considering different types of soil medium as support.
Earthquake response analysis results are presented and discussed in Chapter 6. Time
history analysis results are also presented by considering soil structure interaction
effects. Chapter 7 represents the summary of present study with the main conclusions
listed and also the scope for future work.
Response analysis of berthing structures for wave and earthquake induced forces including soil-structure interaction PhD Thesis, NITK Surathkal, INDIA, 2013
13
Chapter 2
LITERATURE REVIEW
2.1 WAVE – STRUCTURE INTERACTION
The wave forces form a major contribution to the time-varying components of the
external forces acting on a coastal or marine structure. Such a structure vibrating in the
fluid interacts with the fluid surrounding it. The dynamic parameters such as mass and
damping are modified due to the fluid- structure interaction. The force exerted on a fixed
vertical cylindrical pile by surface waves was first considered by Morison et al. (1950)
under the restriction that the diameter (d) of the pile is small in the comparison with the
length (L) of the waves encountered (d ≤ 0.223), so that the distortion of the waves due to
pile is negligible. The total wave force per unit length acting on a fixed vertical pile for a
single degree of freedom system is given by Morison’s expression. It is most widely
employed in engineering calculations.
McCamy and Fuchs (1954) however undertook a different approach to the problem,
especially where cylinders having diameters comparable to the wavelengths are involved.
Following the analysis of Havelock (1955), they introduced a diffraction theory in order
to obtain a total velocity potential as a sum of incident and reflected potentials which
satisfy the proper boundary conditions. The theory developed is based on linear wave and
is applicable only to the waves of small steepness. Skjelbreia and Hendrickson (1960)
have obtained the values of the coefficients involved in Stokes’ fifth order gravity wave
and tabulated them for quick reference.
The theory of MacCamy and Fuchs (1954) assumes that the wave acts on a cylinder
which extends from the floor up to and through the free surface of the fluid (water). If the

Chapter 2 Literature review
Response analysis of berthing structures for wave and earthquake induced forces including soil-structure interaction
PhD Thesis,NITK Surathkal,INDIA,2013
14
cylinder reaches only part way in the fluid, the reflection of incident waves would be less
than that for a cylinder piercing through the free surface. The diffraction theory
developed by MacCamy and Fuchs (1954) for a vertical cylinder is applied herein to
Stokes’ fifth order wave and by Skjelbreia and Hendrickson (1960) an expression for the
total velocity potential is derived, which satisfies the proper boundary condition at the
cylinder surface. This potential function is used to obtain the dynamic pressure due to the
wave on the cylinder. The horizontal wave force is calculated by integrating this pressure
over the submerged part of the curved surface of the cylinder. The expression for the
effective inertia coefficient for each component of the water particle acceleration was
obtained.
Chakrabarti (1972) investigated nonlinear wave forces on a vertical cylinder considering
diffraction theory obtained solution in a closed form. An expression was derived which
was used to calculate the total horizontal force on a vertical cylinder when the wave
height is smaller in comparison with the water depth. The force has been written in an
equivalent expression of the inertia part of Morison’s equation where the effective inertial
coefficients were found to be different for different harmonics.
In the study by Chakrabarti et al. (1976), a 76mm diameter vertical tube was tested in a
wave tank in 3m of water. Total forces in the direction of the wave and in the transverse
direction were measured. In addition, two 0.305m sections located 0.6m apart were
instrumented to measure the in line and transverse loads on these sections. The values of
CM and CD in the Morison equation were calculated from the in- line forces on the two
0.305m sections. The values of horizontal velocities and accelerations in the Morison
formula were calculated at the center of the sections using linear wave theory. The total
forces on the tube were reproduced theoretically based on the mean curves of CM and CD
from the experimental data. These theoretical forces were compared with the measured
total forces. The frequency and magnitude of the lift forces measured on the tube were

Chapter 2 Literature review
Response analysis of berthing structures for wave and earthquake induced forces including soil-structure interaction
PhD Thesis,NITK Surathkal,INDIA,2013
15
also investigated. The lift frequencies and the lift coefficients were presented as functions
of the period parameter. The CM values showed little scatter. The scatter in the CD values
may be partly attributed to the relatively lower proportion of drag compared to the inertia
force. It has been shown that the lift force on a small tubular member can be significant.
For a period parameter of about 15, the resultant horizontal force on the pile is as much as
60% higher than the in line force. Thus from a design standpoint it is of utmost
importance to consider the lift force. Since the lift force is irregular.
Molin R (1979), proposed a method which allows to compute second – order diffraction
loads upon three dimensional bodies of any shape. Application has been made to
horizontal forces upon axisymmetric bodies but the method can be easily generalized to
wave forces in heave or pitch, and to the case of a moving body. It has been explained
that the radiation condition does not account for second order locked waves, which are
dominant in shallow water.
Graham et al. (1979) have shown that submerged cylinders with varying buoyancy can
play as large as inertial forces. The interplay between inertia and buoyancy leads in
certain situations to entirely negative heave forces which act at twice the wave frequency.
Morison’s equation has been adapted to predict the effects for regular waves by
introducing a varying volume and a buoyancy term. For small values of wave amplitude
and wave steepness the agreement with experiment is made fairly well by fitting the
inertial coefficient to each of the experimental curves. Although there is a spread in the
values of CM obtained, it is possible to retain a good deal of accuracy using the theoretical
value for a submerged value for a submerged cylinder, CM = 2, as a design coefficient in
all cases.
Dennis et al. (1984) conducted a wave tank test on fixed vertical and inclined cylinders in
which forces on the cylinder in regular waves were measured. The hydrodynamic

Chapter 2 Literature review
Response analysis of berthing structures for wave and earthquake induced forces including soil-structure interaction
PhD Thesis,NITK Surathkal,INDIA,2013
16
coefficients are computed based on the measured local forces on the cylinder, Morison’s
equation and Stream function theory. The inertia and drag forces were shown as functions
of the Keulegan- Carpenter (KC) number. The lift coefficients and lift force frequencies
were presented as functions of the Keulegan- Carpenter (KC) number.
Eatock Taylor et.al. (1987), presented analytical expressions for the second order force
on a vertical surface, piercing cylinder. Except for the aforementioned contribution from
the free surface integral, these expressions confirm those given by Molin and Marion.
Numerical results agree, for the cases where they made comparisons, thereby providing
independent confirmation of the evalution of the free surface integral (which is found to
make a very significant contribution). Additionally, results for infinite water depth are
also derived and compared. So this solution is accurate and economical of forces for
general three dimensional bodies in regular waves.
Chen (1988), analysed random wave forces consisting of drag and inertia components.
The forces were measured in a wave tank with circular cylinders at low Keulegan-
Carpenter numbers. The values of the hydrodynamic coefficients were chosen from the
corresponding tests in regular waves. The method used in choosing these values
applicable to the case of random waves was discussed. The nonlinear drag force
contribution was linearized so that the spectral approach may be applied directly. Good
correlations between the measured force spectra and the computed spectra were obtained
in several cases of random waves. The short-term distribution of the in-line and
transverse forces is given. It is found that the in-line force amplitudes follow the Rayleigh
distribution reasonably well. The relations of the transverse force to an exponential
distribution are exhibited.
In the study by Malenica et al. (1995) the problem of a vertical cylinder subjected to both
regular waves and moderate current in water of finite depth is considered. The cylinder

Chapter 2 Literature review
Response analysis of berthing structures for wave and earthquake induced forces including soil-structure interaction
PhD Thesis,NITK Surathkal,INDIA,2013
17
was free to move in surge and sway at the frequency of the incoming waves. First-order
and steady second-order forces were calculated. In the calculation of mean drift forces
and wave drift damping coefficients, both near-field and far-field methods were used and
compared with numerical results provided by Grue (1997) with those obtained by a
simple formula for wave drift damping. The method used for the calculation of the
potentials is semi-analytical and based on Eigen function expansions.
Jessica (2003) compared between the equivalent static load method prescribed by current
bridge design specifications and the dynamic analysis techniques. Impact loads and
structural deformations predicted by the static method and the dynamic analysis
techniques were compared for barge collisions of varying kinetic energies. Results from
such comparisons indicate that, for barge collision events associated with relatively low
kinetic energy levels, dynamic analysis techniques are preferable.
In the study by Kim et al. (2006), the diffraction of highly nonlinear Stokes waves on
vertical cylinders of circular cross section was numerically simulated in the time domain.
A finite-element method, based on Hamilton’s principle, was used to discretize the fluid
domain. The Stokes waves, input at the numerical wave maker, were obtained
numerically from the two-dimensional steady solution of the finite element model. A new
matching scheme was developed to match the two-dimensional wave at the far field and
the three-dimensional diffracted wave in the near field Numerical examples were
presented for the diffraction of Stokes waves with various steepnesses by single and
multiple circular cylinders.
In the study by Chakrabarti et al. (2007), the steady wave drift force on a submerged
body was considered as second-order quantity. The steady drift forces on the following
basic structures were computed; A vertical circular cylinder, a submerged horizontal
cylinder, a bottom-seated horizontal half cylinder and a bottom-seated hemisphere. The
results developed demonstrate the importance of various independent non-dimensional

Chapter 2 Literature review
Response analysis of berthing structures for wave and earthquake induced forces including soil-structure interaction
PhD Thesis,NITK Surathkal,INDIA,2013
18
parameters. A numerical program based on linear diffraction theory was used to validate
the closed form solution.
In the study by Lei Geng (2010), a time-domain numerical model on wave diffraction
from large-scale structures is developed with a higher-order boundary element method
(HOBEM). Then the velocity and acceleration of any water particle in the fluid domain
can be produced from the solved diffraction potential. Results show that the incident
wave force was even equal to diffraction wave force when the diameter of the large-scale
cylinder is 8 times as great as the small-scale one; and the total force is different with the
locations of the small-scale cylinder. The maximum total force was 1.57 times as great as
only the incident wave force. Therefore, the wave force on the stake produced by the
diffraction waves due to the existence of upper structures should be considered in the
practical engineering.
2.2 EARTHQUAKE EFFECTS
Earthquakes are an open, direct threat to marine structures, when structures are located
near the epicenter. The structure in this case will be exposed to the devastating shaking
effect of the seismic action, and the result can be catastrophic. Earthquakes may also be a
threat to marine structures in an indirect way, through the shaking of the supporting soil.
The stability and integrity of structures will be at risk if the soil fails due to liquefaction
as a result of the shaking of the soil.
Kenichiro et al (2002) studied the damage caused on piled berthing structure in port
structures due to 1995 Hyogoken-Nambu (Kobe) Earthquake.
The result of damage investigation on an open-piled marginal wharf and makes clear the
mechanism of the process of damage by comparing the results of numerical analysis and

Chapter 2 Literature review
Response analysis of berthing structures for wave and earthquake induced forces including soil-structure interaction
PhD Thesis,NITK Surathkal,INDIA,2013
19
shake table tests with the observed results. It was made clear that the wharf has highly
seismic endurance unless retaining walls move towards the wharf. Moreover, it was
confirmed that liquefaction of the ground may cause buckling of piles due to large
movement of wharf. The following conclusions were drawn regarding the damage of the
open piled marginal wharf based on the results of numerical analysis and shake table
tests:
1 Large seaward movement of the wharf was caused by inertia force applying to the
deck and the seaward movement of the retaining wall during the earthquake. The
movement of the retaining wall was derived from liquefaction of back filling
ground behind the wall and the alluvial sand layer below the rubble
2 It is possible to simulate the process of local failure/damage during earthquakes
with high intensity by the two-step nonlinear dynamic analysis. The analysis to
the ground taking into account the effective stress and the analysis to a frame
model taking into account the pile ground interactions.
3 The ratio of lateral earth pressure to effective surcharge was about 1.26 at the
ultimate state, which was rather small compared to general design condition for
steel pile foundations.
4 Shake table tests was effective to investigate the bending moment distribution of
piles and movement of the wharf. However, the horizontal displacement of the
wharf was smaller than the observed result because of the limitation of scale
modeling to mechanical properties of piles and of dissipation of the excess pore
water pressure.
Jaiswal et al. (2011), conducted study on building which was located in seismic zone IV.
Static analysis on fixed base condition and dynamic analysis on base-isolated condition
was performed. Also, response spectrum analysis and linear time history analysis were
used on both of fixed base and base isolated buildings. Base isolation helps in reducing
the design parameters i.e. base shear and bending moment in the structural members

Chapter 2 Literature review
Response analysis of berthing structures for wave and earthquake induced forces including soil-structure interaction
PhD Thesis,NITK Surathkal,INDIA,2013
20
above the isolation interface by around 4-5 times. The absolute displacements increases
but relative displacements are reduced thus reducing the damage to the structure when
subjected to an earthquake. The shear and bending moments were reduced due to the
higher time period of the base isolated structure which results in lower acceleration acting
on the structure and also, due to the increased damping in the structure due to the base
isolation devices. By the dynamic analysis it was found that the base shear reduced 55-
60 % in response spectrum analysis, whereas time history analysis base shear reduces by
70-80%. Generally, the peak displacements obtained by the time history analysis were
less than those of the response spectrum method of analysis. This is the case because
damping due to the hysteretic effect is more than the equivalent damping considered in
the response spectrum method of analysis.
2.3 SOIL- PILE STRUCTURE INTERACTION
The effect of local soil conditions on ground motions have been illustrated in earthquakes
around the world, from many observations. The response to earthquake motion of a
structure founded on a deformable soil will be different from the response of the structure
that is supported on a rigid foundation. Significant progress has been made in the last
three decades in developing methods to analyse the interaction between structure and its
foundation medium.
In the recent years, a number of studies have been conducted in the area of soil–structure
interaction, modeling the underlying soil in numerous sophisticated ways. The search for
a physically close and mathematically simple model to represent the soil media in the
soil–structure interaction problem, leads to two basic classical approaches, viz., Winkler
approach and Continuum approach. Since the philosophy of foundation design is to
spread the load of the structure on to the soil, ideal foundation modeling is that wherein

Chapter 2 Literature review
Response analysis of berthing structures for wave and earthquake induced forces including soil-structure interaction
PhD Thesis,NITK Surathkal,INDIA,2013
21
the distribution of contact pressure is simulated in a more realistic manner. From this
viewpoint, both these fundamental approaches have some characteristic limitations. The
mechanical behavior of subsoil appears to be erratic and complex and it seems to be
impossible to establish any mathematical law that would conform to actual observations.
Simplicity of models that yield reasonable results becomes a prime consideration in this
context. Many attempts have been made, to improve upon these models by some suitable
modifications, to simulate the behavior of soil more closely from physical aspects.
Winkler’s idealization represents the soil medium as a system of identical but mutually
independent, closely spaced, discrete, linearly elastic springs. Hetenyi (1946), Dutta and
Roy (2002), Brown et al. (1977) and Allam et al. (1991) conducted studies in the area of
soil–structure interaction on the basis of Winkler hypothesis for its simplicity. This model
necessitates the determination of the stiffness of elastic springs used to replace the soil
below foundation. The subgrade stiffness is the only parameter in the Winkler model to
idealize the physical behavior of the subgrade and representative values for the same
were presented in the literature by Terzaghi (1955). The stiffness of the springs for
arbitrary shaped footings resting on homogeneous elastic half-space was suggested by
Gazetas (1991). An analytical method to estimate the stiffness of the foundations
embedded into the stratum over rigid rock corresponding to different stress distribution
below the foundation was presented by Baidya and Sridharan (1994). This study
highlighted on the sensitivity of the stress distribution below the foundation in the
estimation of the dynamic stiffness of the underlying soil media.
In the continuum approach the infinite soil medium is considered as a continuum. Soil
mass basically constitutes of discrete particles compacted by some inter granular forces.
The problems commonly dealt in soil mechanics involve boundary distances and loaded
areas, which are very large compared to the size of the individual soil grains. In the
continuum idealization, generally the soil is assumed to be semi-infinite and isotropic for

Chapter 2 Literature review
Response analysis of berthing structures for wave and earthquake induced forces including soil-structure interaction
PhD Thesis,NITK Surathkal,INDIA,2013
22
the sake of simplicity. Boussineq analysed the problem of a semi-infinite, homogeneous,
isotropic, linear elastic solid subjected to a concentrated force acting normal to the plane
boundary, using the theory of elasticity effectively as a representation for the soil
continuum media. This approach provides much more information on the stresses and
deformations within the soil mass than the Winkler model.
It also has the important advantage of simplicity of the input parameters, modulus of
elasticity and Poisson’s ratio.
Since the scope of numerical methods is incomparably wider than that of analytical
methods, the extensive use of general purpose finite element method (FEM) with the
widespread availability of powerful computers is on the rise. The general principles and
use of this method is well documented in the literature of Desai and Abel (1987), and
Zienkiewicz et.al (1989). The finite element method treats a continuum as an assemblage
of discrete elements whose boundaries were defined by nodal points and assumes that the
response of the continuum can be described by the response of the nodal points. The
nature of the soil can be considered as linear or nonlinear. Since its appearance, the finite
element method has turned out to be one of the most important analytical tools in
interaction investigation. However, the use of three dimensional elements to idealize the
soil and footings of skeletal structure, or even two-dimensional finite elements in the case
of nonlinear interaction, often appears uneconomical due to the large number of degrees
of freedom necessary to describe the behavior of the soil-footing system. In order to
overcome this drawback, researchers have experimented with several approaches and
explored various techniques, using translational and rotational springs, fictitious
members, and line and surface elements to simulate the soil-footing system. In many
instances, the dynamic properties of the half space were further approximated by discrete
springs and dash pots. However, it was agreed that at certain complex sites, finite element
idealization of elastic half space denoting soil below foundation may prove useful
(Kameswara Rao 1998).

Chapter 2 Literature review
Response analysis of berthing structures for wave and earthquake induced forces including soil-structure interaction
PhD Thesis,NITK Surathkal,INDIA,2013
23
Various analytical formulations have been developed to solve complex practical
problems assuming linear soil-structure interaction. However, the effect of nonlinear
behavior of the supporting soil on the seismic response of structures has not been fully
addressed in the literature. Numerous studies were made on the effect of soil–structure
interaction under static loading by Chamecki (1956), Morris (1966), Subba et al. (1985),
and Noorzaei et al. (1993), considering the effect in a very simplified manner,
demonstrating that the force quantities were revised due to such interaction. Dutta et al.
(1999) summarised the effect of various framing action parameters like ratio of flexural
stiffness of beam and column, number of storey, and number of bays on change in
column moment due to soil-structure interaction. The researcher also formulated
approximate method to predict the change in column moments from various parameters
which may include the soil-structure interaction effects.
Poulos (1975), studied numerically the dynamic soil-reaction characteristics of axially
loaded single piles. The proposed dynamic t-z and Q-z models were shown to yield
reliable pile responses for a variety of soil-pile and loading conditions. One of the
convenient features of the models was that they can be easily incorporated into both
frequency and time-domain analysis. Therefore, the proposed models can be extended to
problems with nonlinear soil-pile interaction effects, even though the models are based
purely on linearly elastic soil-pile conditions. The proposed models may be utilized in a
variety of problems. For static applications, the models can be used to improve the
reliability of existing static t-z and Q-z relations at small pile settlements. For dynamic
problems, the models can be used to predict the axial responses of dynamically loaded
pile foundations.
In most of the studies the soil is idealized as a linear, homogeneous, isotropic, elastic half
space. But for many open plane frames and particularly for the interior frames of long

Chapter 2 Literature review
Response analysis of berthing structures for wave and earthquake induced forces including soil-structure interaction
PhD Thesis,NITK Surathkal,INDIA,2013
24
structures, which may at times rest on a raft foundation, a plane-strain approach is
commonly adopted for representing the soil support in order to achieve savings in core
memory requirement and computational effort. Srinivasa Rao (1995) compared the more
realistic half space continuum and the plane strain approach to examine the
approximation involved in the latter type of representation of soil, considering
symmetrical R.C. open plane frames and concluded that if forces in the superstructure
elements only are the focus of interest, representation of the soil support by the plane
strain condition was a fair approximation of the actual situation. Onu (1996) described a
simplified procedure for the linear and nonlinear two-dimensional analysis of the soil-
footing-structure system. The footing-soil system was replaced by a number of beams
interconnected with the discretized model of the superstructure, at the column-footing
interface nodes. Kawano (1979) and Kimura (2003) applied the finite element method for
the nonlinear dynamic analysis of soil-structure interaction systems.
Abul-Azm et.al (1988) presented a solution for the hydrodynamic loading on a stationary,
truncated circular cylinder in water of arbitrary uniform depth. Two situations were
considered here: the structure may either be completely submerged and resting on sea
bed, or partially immersed in the free surface. The method employed to calculate the
second order forces and moments due to the second-order velocity potential does not
involve the explicit calculation of this potential. Instead, the hydrodynamic loading
components due to this potential are found by applying Green’s second identity and
solving a series of linear radiation problems at the second-order wave frequency.
Numerical results are presented for several example structures that illustrate the relative
importance of the second-order effects over a range of wave periods. In general, the
components that are explicitly due to the second-order potential are found to result in the
dominant loading effects at that order.

Chapter 2 Literature review
Response analysis of berthing structures for wave and earthquake induced forces including soil-structure interaction
PhD Thesis,NITK Surathkal,INDIA,2013
25
Mamoon (1990) carried out a frequency domain dynamic analysis of piles and pile
groups. A hybrid boundary element formulation is presented to evaluate the impedance
and compliance functions of piles and inclined pile groups embedded in a homogeneous
soil media. The piles are represented by compressible beam-column elements and the soil
as a hysteretic viscoelastic half space. A new Green function for semi-infinite solids is
used in the numerical formulation. A realistic lateral load calculation procedure for piles
of circular and non circular cross sections is proposed. Particular attention is given to
incorporate accurately the inertia effects. Extensive comparisons with the most accurate
dynamic solutions available for vertical piles confirm the accuracy of the proposed
formulation, at greatly reduced effort and cost. The procedure is general and may easily
be extended to analyze any arbitrary pile group configuration that may be subjected to
combined vertical, horizontal, and moment loading in homogeneous soil deposits.
Oliveto et.al (1995) checked certain approximations that were made in the engineering
literature, in dealing with the soil-structure interaction problems. It was shown how the
complex frequencies and modes of vibrations were derived. The analysis of the results
showed that the damped frequency of the soil-structure interacting model was always
smaller than the natural frequency of the same structure on a fixed base.
Investigations by Yang et al. (1996) demonstrated the efficiency of condensation
technique, to formulate the soil-structure interaction problems in a rather straightforward
manner. Condensation technique was used for calculating the equivalent seismic forces
exerted by the far-field soil on the near-field soil, to analyze the behavior of the structure
and the near-field soil.
Surya Rao et al. (1997) measured wave forces and moment on a vertical circular cylinder
due to regular and random waves and compared the measured results with the predicted
results from theoretical models. Waves were generated by an electronically controlled

Chapter 2 Literature review
Response analysis of berthing structures for wave and earthquake induced forces including soil-structure interaction
PhD Thesis,NITK Surathkal,INDIA,2013
26
wave maker. The cylinder was mounted as a cantilever with two force transducers at the
top and free to move at the bottom. The force transducers were mounted to give in-line
forces and moments followed by transverse forces and moments. Wave forces and
moments for regular waves were predicted using the charts based on the stream function
theory presented in the Shore Protection Manual. For random waves, the force and
moment spectra were predicted from the wave spectra using Borgman’s methodology.
Kutanis et al. (2001) suggested an idealized two dimensional plane strain finite element
analysis based on a substructure method for seismic soil-structure interaction by using
original software developed by the researchers. To investigate the effects of soil-
structure-interaction, computations were achieved for different peak accelerations 0.15g,
0.30g and 0.45g and for different soils. The study considered the material non linearity
for both soil and the structure within the framework of plasticity theory. They concluded
that the fixed base analysis resulted in greater displacements.
Christopher et al. (2002) proposed a time domain formulation for the transient analysis of
three dimensional structures resting on a homogeneous elastic half space subjected to
either external loads or seismic motions. The formulation was verified by applying it to
the analysis of a railway track subjected to moving load. Dynamic soil-structure
interaction is a complex phenomenon with significant uncertainties associated with the
input motions and analytical models used for both the interaction and the dynamic
properties of the materials.
Roger et al. (2002) presented the probabilistic analysis of the seismic soil-structure
interaction problem with a procedure which accounts for uncertainty in both the free-field
input motion as well as in local site conditions, and structural parameters. The dynamic
equations of a porous medium and finite element formulations based on the variational
principles were given by Zhang (1995). The foundation soil of a structure was simulated
Chapter 2 Literature review
Response analysis of berthing structures for wave and earthquake induced forces including soil-structure interaction
PhD Thesis,NITK Surathkal,INDIA,2013
27
as a two-phase saturated porous medium and a corresponding explicit-implicit algorithm
on the substructure level for dynamic analysis of the semi-infinite body was given, to
illustrate the influence of pore water in the soil on structural responses.
Dutta et.al (2002) suggested that the effect of soil–structure interaction on dynamic
behaviour of structure may conveniently be analyzed using lumped parameter approach.
Modeling the system through discretization into a number of elements and assembling the
same using the concept of finite element method was proved to be a very useful method,
which should be employed for studying the effect of soil-structure interaction.
Jen-Cheng et.al (2003) carried out an analytical model for deflection of laterally loaded
Piles They proposed an efficient analytical model based on energy conservation of pile-
soil system. They developed method for analyzing deformation data of lateral loaded
piles, an analytical model is proposed based on energy conservation of pile-soil system.
The proposed analytical model not only provides a direct solution of the pile deflection
function, but also has less need of complicated subsurface soil properties. This derived
deflection function can provide a realistic description of relation between soil and piles.
Banerjee (2003) analysed inelastic pile soil structure interaction by using a hybrid type of
numerical method. Piles and structural elements were modeled as linear finite elements
and soil half space was modeled by using boundary elements. It was found that the
analysis described was not only capable of predicting the general trend of pile group
behavior but it also capable of predicting the general trend of pile settlement, which is of
prime importance in the design of pile foundations.
A full three-dimensional dynamic soil–foundation–structure interaction analysis of a
famous landmark in Luxor, Egypt, the South Memnon Colossus, was performed by
Casciati and Borja (2004) to investigate the response of this historical monument to

Chapter 2 Literature review
Response analysis of berthing structures for wave and earthquake induced forces including soil-structure interaction
PhD Thesis,NITK Surathkal,INDIA,2013
28
seismic excitation. The analysis was carried out using the finite element method in time
domain for artificially generated earthquakes of different return periods. Finite element
models of the foundation and the surrounding soil deposit were constructed and coupled
with the statue model to analyze the seismic response of the entire system incorporating
dynamic soil-foundation-structure interaction effects. The structure was mounted on a 6m
thick flat soil region and supported by the limestone layer, considered as the bedrock.
Vertical walls on the sides of the soil region form an elliptical boundary around the
structure. The soil region was discretized in horizontal sub layers with three dimensional
brick finite elements. This study was conducted for future conservation efforts of this
historical landmark, and more specifically for designing possible retrofit measures for the
fractured base to prevent potential collapse of the monument from overturning during an
earthquake.
Mehrdad et al. (2004) concluded that the nonlinear response of piles was the most
important source of potentially nonlinear behavior of offshore platforms due to
earthquake excitations. It is often necessary to perform dynamic analysis of offshore
platforms that accounts for soil non linearity, discontinuity condition at pile soil
interfaces, energy dissipation through soil radiation damping and structural nonlinear
behaviors of the piles. In this paper, an attempt was made to introduce a practical BNWF
(Beam on Nonlinear Winkler Foundation) model for estimating the lateral response of
flexible piles embedded in layered soil deposits subjected to seismic loading. This model
was incorporated into a Finite Element program (ANSYS) which was used to compute
the response of laterally excited piles. Equivalent linear earthquake site response
approach was used for seismic free field ground motion analysis. Quantitative and
qualitative findings and conclusions, which are needed for the design of offshore piles,
are discussed and addressed

Chapter 2 Literature review
Response analysis of berthing structures for wave and earthquake induced forces including soil-structure interaction
PhD Thesis,NITK Surathkal,INDIA,2013
29
Chandrashekar (2005) analysed statically and dynamically a three dimensional soil- raft-
super structure systems. The response of the structure differs due to consideration of
foundation and soil system together with the structure in analysis, from the fixed base
assumption. Various buildings are modeled and analysed using ANSYS with two
approaches – frame with fixed base condition and frames with raft foundation and
supporting soil system. Under static analysis, variation of shear force, bending moment in
beams, moment and axial force in columns due to soil interaction were studied. Also
effect of soil structure interaction on natural period, the primary dynamic characteristic of
the structure was studied for various building models.
Yingcai et al (2009) concluded that the seismic response of structures supported on a pile
foundation is extremely complex, since the soil behavior is non-linear and liquefaction
may occur during earthquakes. The soil-pile-structure interaction becomes extremely
important for seismic analysis and design; two commercial software packages were used
for considering the nonlinear soil-pile-structure interaction. Stiffness and damping of the
pile foundation are generated from a computer program DYNAN and then input into a
finite element model by SAP2000 program. The seismic response of a vacuum tower
structure supported on pile foundation was examined in a high seismic zone, including
response spectrum analysis and time history analysis. The vacuum tower with weight of
5,600 kN and height of 35 m set on a steel frame. To illustrate the effects of soil-pile-
structure interaction on the seismic response of structure, three different base conditions
were considered, rigid base, i.e. no deformation of the foundation; linear soil-pile system;
and nonlinear soil-pile system. The case of pile foundation with liquefaction of sand layer
was also discussed. The method and procedure introduced can be applied to the design of
tall buildings, bridges, industrial structures and offshore platforms with soil-pile-structure
interaction under seismic, blast, sea wave and other dynamic loads.

Chapter 2 Literature review
Response analysis of berthing structures for wave and earthquake induced forces including soil-structure interaction
PhD Thesis,NITK Surathkal,INDIA,2013
30
2.4 EXPERIMENTAL TECHNIQUES
The local pressures on a vertical submerged cylinder were obtained experimentally by
Lappo and Kaplun (1975). They used pressure transducers to measure the dynamic part
of the wave pressure on the vertical cylinder. Their experimental values were compared
with the theory developed by Chakrabarti and a good correlation was observed.
Harihara Raman et al. (1976) presented a nonlinear diffraction theory due to Stokes’
second-order wave for computing the wave forces on a vertical cylinder. The results
obtained from this theory are compared with the linear theory and also with experimental
results. Here, a rigid vertical cylinder is acted upon by a train of regular surface waves.
Its motion is explained by a set of equations that depends on velocity potential function.
These equations are solved by perturbation method. The first and second order problems
for the scattered potential are obtained. They are solved using the method of variation of
parameters. The experiments to measure the force were carried out in a 0.9m x 0.9m x
31m long wave flume. Waves were generated by a plunger type wave machine. The
model was of hard polyvinyl chloride pipe of 0.2m outer diameter and 0.8m length and
was equipped with strain gauges. A wave probe was located away from the model on the
upstream side to measure the incident wave height. The time relation of maximum force
to wave crest was determined by mounting a second wave probe adjacent to the model.
The water depth was 0.5m. Comparisons of the numerical method were made with
previous analytical, numerical, and experimental results and good agreement was
obtained in all cases. As examples of the program’s application, results were presented
for the forces on an isolated circular cylinder, neighboring circular cylinders, and a
square caisson at arbitrary orientation to the incident wave direction.
Milos Novak et al. (1984) carried out dynamic experiments with a large group of 102
piles with closely spaced in the field. The results of the experiments were compared with
theoretical predictions made for vertical and horizontal response on the bases of different

Chapter 2 Literature review
Response analysis of berthing structures for wave and earthquake induced forces including soil-structure interaction
PhD Thesis,NITK Surathkal,INDIA,2013
31
approaches accounting for the group effects, i.e., pile-soil-pile interaction. The theoretical
approaches employed included static interaction factors, dynamic interaction factors, and
complete dynamic analysis, as well as direct static analysis and the equivalent pier.
Dynamic analytical techniques were able to predict the main features of dynamic
behavior of pile groups for small strain. Static interaction factors provide an approximate
estimate of dynamic group stiffness for smaller groups and low frequencies but may
underestimate the stiffness of large groups and do not yield any estimate of group
geometric damping. The increase in group damping due to interaction suggested by
dynamic analysis seems to be confirmed by experiments. Dynamic analysis of pile
groups tends to overestimate damping. The inclusion a weak zone around the piles may
alleviate this overestimation. The comparison with the experiments indicates that
dynamic analytical techniques are able to predict the main features of dynamic behavior
of pile groups for small strains and that the interaction effects are very significant. The
omission of pile-soil-pile interaction can make the analysis of pile groups quite
unrealistic. Further theoretical and experimental research into dynamic behavior of pile
groups is needed.
Dynamic centrifuge model tests were performed to explore the effect of hidden localised
soft soil stratification on the transmission characteristics of the ground motion shaking by
Ghosh et.al (2003) effectively. It was noticed that the structural response is greatly
influenced by the layering of soil and a localised hidden soft patch in a dense soil could
be dangerous if not detected in routine site tests. It was seen that the shear force attracted
by the building base could be 1.5 times more than what it would have been designed for.
Gudehus et al. (2004) conducted experiments with a novel laminar shake box and real
seismic records from well-documented sites during strong earthquakes were used to
verify the adequacy of the hypoplasticity-based numerical model for the prediction of soil
response during strong earthquakes. Shintaro et al. (2004) conducted shaking table tests
by means of a large scale laminar box in order to investigate behavior of a soil-pile-

Chapter 2 Literature review
Response analysis of berthing structures for wave and earthquake induced forces including soil-structure interaction
PhD Thesis,NITK Surathkal,INDIA,2013
32
superstructure system in liquefiable ground. A model two- storey structure, supported by
a pile group, was set in a saturated sand deposit, and subjected to a sinusoidal base
motion of increasing amplitude. The transient state prior to soil liquefaction was shown to
be important in the design of a pile because dynamic earth pressure shows peak response
in this state. The reduction of the stiffness due to excess pore water generation and strain
dependent nonlinear behavior was evaluated.
Effects of inertial and kinematic forces on pile stresses were studied by Kohji et al.
(2004) based on large shaking table tests on pile-structure models with a foundation
embedded in dry and liquefiable sand deposits. Pseudo-static analysis was conducted to
estimate maximum moment distribution in pile incorporating the effects of earth
pressures on the embedded foundation and pile. It was assumed that the maximum
moment was equal to the sum of the two stresses caused by the inertial and kinematic
interaction. A detailed strong motion observation was conducted in buildings and in the
surrounding grounds at Building Research Institute, Tsukuba, Japan (Toshihide 2004).
This report discussed about the dynamic characteristics of the building and effect of the
surface geology by means of analysis of strong motion records. The amplification effects
of the surface soil layers, dynamic characteristics of an eight- storey building and soil-
structure interaction phenomena were investigated.
Hosseinzadeh et.al (2004) evaluated the soil-structure interaction effects in dynamic
response of single and adjacent building structures from experimental testing carried out
using a ground model specimen made of relatively soft soil and four steel building
models of 5, 10, 15, and 20 storey’s. The combined system of soil-foundation-structure
models were subjected to horizontal component of two real earthquake records generated
by shaking table. It was concluded that the effect of kinematic interaction was negligible
in comparison with inertial interaction and in lower buildings; the horizontal and rocking
motions of foundations were the main causes of soil-structure interaction.

Chapter 2 Literature review
Response analysis of berthing structures for wave and earthquake induced forces including soil-structure interaction
PhD Thesis,NITK Surathkal,INDIA,2013
33
A series of two-dimensional shake table tests on soil-pile-structure models were
performed in National Research Institute for Rural Engineering in Japan by Takahito et
al. (2004). A cylindrical laminar box with 1.8 m diameter and 1.5 m height was employed
and a model of saturated sand to depth of 1.35 m, a group of four steel piles and a
superstructure was subjected to two horizontal components of input acceleration. The
computed response by three dimensional nonlinear effective stress analysis methods was
in general agreement with that measured in the experiment. The acceleration responses of
soil-pile-structure system were strongly affected by the pore pressure built-up. The results
from a series of dynamic centrifuge tests were reported by Ghosh et al. (2006). These
tests were performed on different types of soil stratifications supporting a rigid
containment structure. Test results indicate that accelerations transmitted to the
structure’s base were dependent on the stiffness degradation in the supporting soil.
2.5 SUMMARY OF LITERATURE REVIEW AND PROBLEM
FORMULATION
The design of berthing structures has in the past been largely based on static analysis of
the structure under a variety of loading. The cyclic wave loading were applied quasi-
statically i.e. the waveform would be considered at which there is maximum base shear or
overturning moment (Cronin & Galgoul,1981) This type of analysis was used to design
the structure to resist the extreme storm conditions.
Deep foundations consisting of driven or drilled-in piles and piers are routinely
employed to transfer axial structural loads through soft soils to stronger bearing strata at
greater depth. These soil layers may also be subject to transient or cyclic lateral loads
arising from earthquake, wind, wave, blast, impact, or machine loading. The coincidence
of major pile-supported structures sited on soft soils in coastal areas of earthquake hazard
results in significant demands on these deep foundations. Possible resonance effects
Chapter 2 Literature review
Response analysis of berthing structures for wave and earthquake induced forces including soil-structure interaction
PhD Thesis,NITK Surathkal,INDIA,2013
34
between longer period soft soil sites, which may amplify ground motions and large
structures, can exacerbate the problem. Liquefaction and/or strain-softening potential in
these soft soils can impose additional demands on pile foundation systems. Historically, it
has been common seismic design practice to ignore or simplify the influence of pile
foundations on the ground motions applied to the structure. This is generally accepted as
a conservative design assumption for a spectral analysis approach.
However, in observations of pile performance of berthing structure during earthquakes,
two principal facts emerge: pile foundations do affect the ground motions the
superstructure experiences, and piles can suffer extreme damage and failure under wave
and earthquake loading. The purpose of this research is to examine these two facets of
this complex soil-structure interaction problem when wave loading and earthquake
loading exists.
Centrifuge and shaking table model tests have been used by many people to augment the
field case histories with laboratory data obtained under controlled conditions. The vast
majority of centrifuge and shaking table model tests have studied soil-pile seismic
response in cohesion less soils with liquefaction potential. But many pile foundations
supporting critical structures are sited on soft clays, which have the potential for cyclic
strength degradation during seismic loading, Finite element analysis of the integral
system of soil, pile and structure as a whole, are carried out to examine the soil-structure
interaction effect on the behavior of structures under static and dynamic loading.
In the present study the size of the proposed berthing jetty considered was 350m x 40m,
having 6 units of 50m x 40m each with an expansion gap of 20mm. The modeling of the
berthing structure for wave response analysis without including soil-structure interaction
and including soil-structure interaction was done using software StruCAD .Time- history
analysis is done using SAP 2000. The 3D structural models were developed using both
Chapter 2 Literature review
Response analysis of berthing structures for wave and earthquake induced forces including soil-structure interaction
PhD Thesis,NITK Surathkal,INDIA,2013
35
the software. Airy’s wave theory was adopted in the software for calculation of wave
forces. The seismic input for structure was defined in terms of an accelerogram applied at
the base of the structure. Classical El Centro earthquake recorded in Imperial valley,
California, on 15 October 1940, Kobe earthquake of 1995 and Northridge earthquake of
1994. All the accelerations were presented as a fraction of g (the gravitational
acceleration). The total duration of El Centro earthquake was 18sec and that of Kobe and
North Ridge earthquake was 25.64sec and 39.98sec respectively. The responses of the
structure were compared with soil structure and with no soil structure interaction.

Chapter 2 Literature review
Response analysis of berthing structures for wave and earthquake induced forces including soil-structure interaction
PhD Thesis,NITK Surathkal,INDIA,2013
36

Response analysis of berthing structures for wave and earthquake induced forces including soil-structure interaction PhD Thesis,NITK Surathkal,INDIA,2013
36
CHAPTER 3
GENERAL REQUIREMENT OF BERTHING STRUCTURES
3.1 GENERAL
The conceptual layout should include the length, width, dredge level, top level, location
of beams for handling equipment, spacing of bollards and fenders and configuration of
the structure. The configuration includes the arrangement of piles, deck system and
dimensions of various structural members. The size of berthing structure depends on the
principal dimension of the large vessel to be handled, area required for transit shed,
number of rail tracks, truck lines, crane rail and width of apron required to accommodate
mooring facilities and utility service.
3.1.1 Length of berthing structure
Vessel overall length is designated as LOA, which governs the length of berth. The
minimum length should be sufficient for mooring the largest ship expected to arrive. The
length of pier or wharf for single vessel is 50 to 60 m larger than the overall length of the
design ship. Where more than one vessel is to be accommodated, the length of berth
should not be less than the overall length of design vessel plus 10% more subject to a
minimum of 15 m. It may be increased to 20%, if the berth is exposed to strong wind and
tide conditions (IS 4651-Part V, 1980).

Chapter 3 General requirements of berthing structures
Response analysis of berthing structures for wave and earthquake induced forces including soil-structure interaction PhD Thesis,NITK Surathkal,INDIA,2013
37
3.1.2 Width of berthing structure
The width of a quay or a wharf depends upon the commodity that is to be handled. It is
advisable to reserve 20 m for crane equipment in the berthing quay front. About 40m
inside this area up to the limit of storage area of transit shed is reserved for traffic in
general cargo or container berth. Bulk terminals for mass transport such as coal or oil
differ greatly from each other depending upon the character of the loading and unloading
equipment. For the container berth, the apron width is governed by the distance between
the legs of the gantry crane which is typically 20 to 30 m. The minimum width of apron
is given in (IS 4651-Part V, 1980).
3.1.3 Dredged area
The length of dredged area of the berth alongside of pier or wharf should be minimum of
1.25 times LOA where tug assistance is provided and up to 1.5 times LOA where tug
assistance is not provided. The width of dredge area should be at least 1.25 times the
beam of the vessel. The dredge depth should be greater than or the sum total of actual
draft, vertical ship motions, keel clearance, dredging tolerance and depth sounding
accuracy. As a thumb rule, the keel clearance is usually 0.3 to 0.5 m, dredging tolerance
is 0.1 to 0.5 m and sounding accuracy is normally about 0.2 m. The minimum dredge
depth should not be less than loaded draft of the largest vessel plus an allowance of 0.6 to
0.75 m. When the harbour bottom is hard, the allowance should be increased to 1 m (IS
4651-Part V, 1980).
3.1.4 Deck level of berthing structure
The minimum deck level of berthing structure should correspond to a combination of
high water level and wave action.

Chapter 3 General requirements of berthing structures
Response analysis of berthing structures for wave and earthquake induced forces including soil-structure interaction PhD Thesis,NITK Surathkal,INDIA,2013
38
For operational reasons, a higher deck elevation of around 2m above the mean sea level is
preferred. The deck elevation should normally be at or above highest high water spring
plus half of an incident wave at the berth location plus a clearance of 1 m (IS 4651-Part
V, 1980).
3.1.5 Fenders and bollards
The important function of fender is to absorb the kinetic energy from the impact of
berthing vessel and also to avoid damage to the vessel and to the structure.
Functionally, fenders shall accomplish the following purpose:
1. Absorb the berthing energy or impact of vessel and transmit a desired or
calculated thrust to the structure.
2. Hold the vessel off the face of the structure and avoid rubbing of the vessel
against structure and consequent damages to the vessel and the structure.
3. Impart the thrust from berthing loads to the structure at predetermined or design
points.
The fenders with low reaction per absorbed unit of energy can be preferred. The berthing
force depends on the load deflection characteristic of the fender system. A factor of
safety of 1.4 should be applied over the ultimate energy absorption capacity of fenders
(IS 4561-Part IV, 1989). The absorption of kinetic energy depends on type of fender and
its material property. The fenders are classified as
i) Standard pile fenders
ii) Rubber fenders
iii) Pneumatic fenders
iv) Gravity type fenders

Chapter 3 General requirements of berthing structures
Response analysis of berthing structures for wave and earthquake induced forces including soil-structure interaction PhD Thesis,NITK Surathkal,INDIA,2013
39
3.1.6 Expansion joint
Expansion joint shall be provided depending upon type of the structure, sub-soil and
atmospheric conditions in order to accommodate moments arising from shrinkage,
temperature changes and yielding of foundation.
As a general rule, a length of 39 m between the expansions joint is recommended for
structures such as solid quay walls or walls resting on piles. An expansion joint gap of
20 mm is generally provided. A spacing of 60 m for expansion joint is provided for better
stiffness (IS 4651-part IV, 1989).
3.2 FORCES ON BERTHING STRUCTURE
The berthing structure is subjected to dead load, live load, berthing force, mooring force,
earthquake load and other environmental loading due to wind, waves and currents.
3.2.1 Live Loads
Vertical live loads: Surcharges due to stored and stacked material such as general
cargo, bulk cargo, containers handling equipment and construction plant, constitute
vertical live loads.
i) Crane Loads: Concentrated wheel loads from crane wheels and other specialized
mechanical handling equipment should be considered.
An impact of 25 percent shall be added to wheel loads in the normal design of deck
and stringers, 15 percent where two or more cranes act together and 15 percent in the
design of pile caps and secondary framing members.

Chapter 3 General requirements of berthing structures
Response analysis of berthing structures for wave and earthquake induced forces including soil-structure interaction PhD Thesis,NITK Surathkal,INDIA,2013
40
ii) Railway Loads: Concentrated wheel loads due to locomotive wheels and wagon
wheels in accordance with the specification of Indian Railways for the type of
gauge and service at the locality in question. For impact due to truck and
Railways one third of the impact factors specified in the relevant codes may be
adopted.
iii) Truck loading and uniform loading: The berth shall be generally designed for the
truck loading and uniform loading as given in Table 3.1 (IS 4651: Part ΙΙΙ, 1974).
Table 3.1 Truck loading and Uniform loading for different type of berths.
Type of Berth
Truck Loading
(IRC Class)
Uniform Vertical
live load (t/m²)
Passenger Berth B 1.0
Bulk unloading and loading berth A 1.0 to 1.5
Container berth A or AA or 70 R 3.0 to 5.0
Cargo berth A or AA or 70 R 2.5 to 3.5
Heavy cargo berth A or AA or 70 R 5 or more
Small boat berth B 0.5
Fishing berth B 1.0
iv) Special Loads: Special loads like pipelining loads or conveyor loads or
exceptional loads such as surcharges due to ore stacks, transferring towers, heavy
machinery or any other type of lifts should be individually considered.
3.2.2 Berthing Load
When an approaching vessel strikes a berth, horizontal forces acts on the berth. The
magnitude of this force depends on the kinetic energy that can be absorbed by the
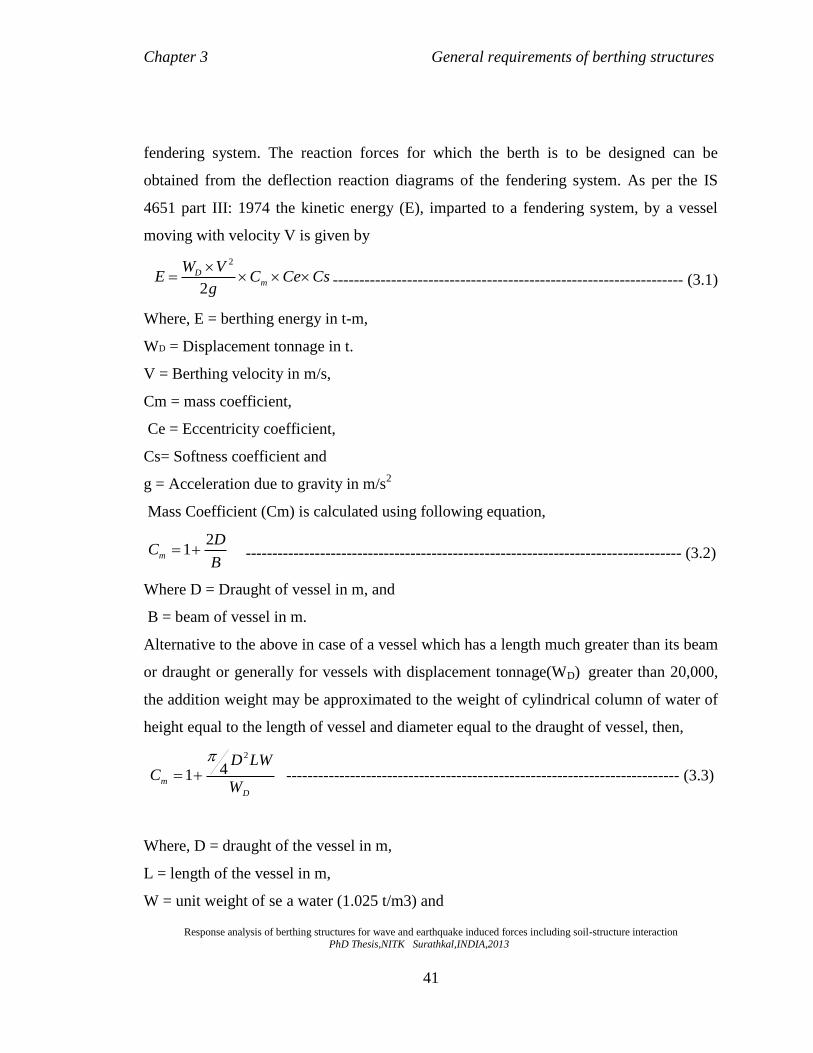
Chapter 3 General requirements of berthing structures
Response analysis of berthing structures for wave and earthquake induced forces including soil-structure interaction PhD Thesis,NITK Surathkal,INDIA,2013
41
fendering system. The reaction forces for which the berth is to be designed can be
obtained from the deflection reaction diagrams of the fendering system. As per the IS
4651 part III: 1974 the kinetic energy (E), imparted to a fendering system, by a vessel
moving with velocity V is given by
CsCeCg
VWE m
D
2
2
------------------------------------------------------------------ (3.1)
Where, E = berthing energy in t-m,
WD = Displacement tonnage in t.
V = Berthing velocity in m/s,
Cm = mass coefficient,
Ce = Eccentricity coefficient,
Cs= Softness coefficient and
g = Acceleration due to gravity in m/s2
Mass Coefficient (Cm) is calculated using following equation,
B
DCm
21 ---------------------------------------------------------------------------------- (3.2)
Where D = Draught of vessel in m, and
B = beam of vessel in m.
Alternative to the above in case of a vessel which has a length much greater than its beam
or draught or generally for vessels with displacement tonnage(WD) greater than 20,000,
the addition weight may be approximated to the weight of cylindrical column of water of
height equal to the length of vessel and diameter equal to the draught of vessel, then,
D
mW
LWDC
2
41
-------------------------------------------------------------------------- (3.3)
Where, D = draught of the vessel in m,
L = length of the vessel in m,
W = unit weight of se a water (1.025 t/m3) and

Chapter 3 General requirements of berthing structures
Response analysis of berthing structures for wave and earthquake induced forces including soil-structure interaction PhD Thesis,NITK Surathkal,INDIA,2013
42
WD = displacement tonnage of the vessel in t.
Eccentricity coefficient (Ce): A vessel generally approaches a berth at an angle, denoted
by θ and touches it at a point either near to the bow or stern of the vessel. In such
eccentric cases the vessel imparts a rotational force at the time of contact, and the kinetic
energy of the vessel is partially expanded in its rotational motion. The eccentricity
coefficient (Ce) may then derive as follows:
2
22
11
11
r
SinrCe
-------------------------------------------------------------------------- (3.4)
Where, l = Distance from the center of gravity of the vessel to the point of contact
projected along the water line of the berth in m, and
r = Radius of gyration on the plane of the vessel from its center of gravity in m.
The approach angle θ unless otherwise known with accuracy should be taken as 10°. For
smaller vessels approaching wharf structure, the approach angle should be taken as 20°.
The rotational radius of a vessel may be approximated to L/4 and in normal case the point
of contact of the berthing vessel with the structure is at a point about L/4 from the bow or
stern of the vessel, which is known as quarter point contact. If the approach angle θ is
nearly 0° and r = 0.25L, then Ce=0.5.
Softness Coefficient (Cs): This coefficient indicates the relation between the rigidity of
vessel and that of fender, and also the relation between the energy absorbed by the vessel
and the fender. Since the ship is relatively rigid compared with the fendering system, a
value of 0.9 is generally used for this factor.
Quinn (1961) has suggested a suitable formula for calculating berthing energy assuming
the 50% of the total energy of the berthing vessel to be absorbed by the fenders.
2
2
1
2
1mvE ---------------------------------------------------------------------------------- (3.5)
Where, m is added mass and mass of vessel and v is the berthing velocity.

Chapter 3 General requirements of berthing structures
Response analysis of berthing structures for wave and earthquake induced forces including soil-structure interaction PhD Thesis,NITK Surathkal,INDIA,2013
43
3.2.3 Mooring Loads
The mooring loads are the lateral loads caused by the mooring lines when they pull the
ship into or along the deck or hold it against the forces of wind or current. The maximum
mooring loads are due to wind on the exposed area on the broad side of the ship in light
condition:
PACF WW ------------------------------------------------------------------------------------- (3.6)
Where, F = force due to wind in kgf,
Cw = shape factor (1.3 to 1.6),
Aw = windage area in m²,
P = wind pressure in kg/m² to be taken in accordance with IS: 875-1964.
The windage area (Aw) can be estimated as follows,
LMVW DDLA 175.1 -------------------------------------------------------------------- (3.7)
Where, Lv = Length between perpendicular in m,
DM = Moulded depth in m,
DL = Average light draft in m.
3.2.4 Force due to wind
The maximum mooring loads are due to the wind forces on exposed area on the broad
side of the ship in light condition. Wind forces and windage area are calculated as per
equation 3.6 and 3.7. When the ships are berthed on both side of jetty, the total wind
forces acting on the jetty should be increased by 50 percent to allow for wind against the
second ship. The design wind pressure at height above mean ground level depends on
wind speed and is calculated using the following equation as per the IS 875-Part III,
1989.
26.0 ZZ VP 26.0 ZZ VP ---------------------------------------------------------------------------------------------------- (3.8)
--------------- (3.8)

Chapter 3 General requirements of berthing structures
Response analysis of berthing structures for wave and earthquake induced forces including soil-structure interaction PhD Thesis,NITK Surathkal,INDIA,2013
44
Where, Pz = design wind pressure in N/m² at height Z, Vz = design wind velocity in m/s
at height Z.
3.2.5 Wave forces on structural elements
The various wave force regimes resulting from the interaction between the structure and
the waves are given below:
• For D/L > 1 Condition approximate to pure Reflection.
• For D/L > 0.2, Diffraction is increasingly important.
• For D/L < 0.2, Diffraction is negligible.
• For D/W0 > 0.2 Inertia is dominant.
• For D/W0 < 0.2, Drag becomes more important.
Where D= diameter or characteristic dimension,
L= wave length
Wo=orbit width parameter equal to wavelength in deep Water.(Brebbia et.al 1979)
Based on the type and size of the members wave forces on structure (marine/offshore) are
calculated in three different ways,
• Morison equation
• Froude-Krylov theory
• Diffraction theory
In the Morison equation (Morison et al, 1950) the force composed of inertia and drag
forces linearly added together.
uDuCdtduDCfff DmDi 5.042 -------------------------------- (3.9)
ρ = density of the fluid. (1.025 kN/m³),
D = diameter of the pile,
u = horizontal water particle velocity at the axis of the pile (calculated as if the pile were
not there),
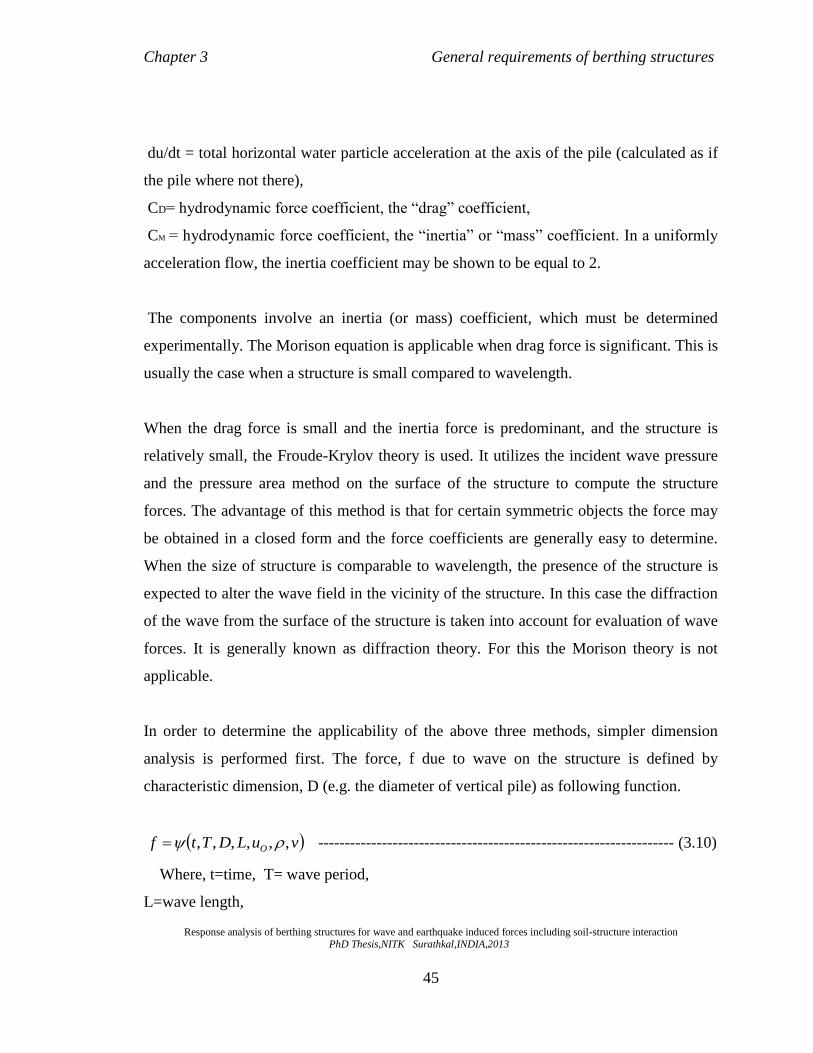
Chapter 3 General requirements of berthing structures
Response analysis of berthing structures for wave and earthquake induced forces including soil-structure interaction PhD Thesis,NITK Surathkal,INDIA,2013
45
du/dt = total horizontal water particle acceleration at the axis of the pile (calculated as if
the pile where not there),
CD= hydrodynamic force coefficient, the “drag” coefficient,
CM = hydrodynamic force coefficient, the “inertia” or “mass” coefficient. In a uniformly
acceleration flow, the inertia coefficient may be shown to be equal to 2.
The components involve an inertia (or mass) coefficient, which must be determined
experimentally. The Morison equation is applicable when drag force is significant. This is
usually the case when a structure is small compared to wavelength.
When the drag force is small and the inertia force is predominant, and the structure is
relatively small, the Froude-Krylov theory is used. It utilizes the incident wave pressure
and the pressure area method on the surface of the structure to compute the structure
forces. The advantage of this method is that for certain symmetric objects the force may
be obtained in a closed form and the force coefficients are generally easy to determine.
When the size of structure is comparable to wavelength, the presence of the structure is
expected to alter the wave field in the vicinity of the structure. In this case the diffraction
of the wave from the surface of the structure is taken into account for evaluation of wave
forces. It is generally known as diffraction theory. For this the Morison theory is not
applicable.
In order to determine the applicability of the above three methods, simpler dimension
analysis is performed first. The force, f due to wave on the structure is defined by
characteristic dimension, D (e.g. the diameter of vertical pile) as following function.
vuLDTtf O ,,,,,, ------------------------------------------------------------------- (3.10)
Where, t=time, T= wave period,
L=wave length,

Chapter 3 General requirements of berthing structures
Response analysis of berthing structures for wave and earthquake induced forces including soil-structure interaction PhD Thesis,NITK Surathkal,INDIA,2013
46
u0=maximum horizontal water particle velocity,
ρ=mass density,
υ =kinematic viscosity.
Water particle accelerations are known from velocity. The dimensionless forces can be
expressed as a function of four non-dimensional quantities.
L
D
v
Du
D
Tu
T
t
Du
f
,,, 00
2
0
---------------------------------------------------------- (3.11)
Where t/T = dimensionless time,
u0T/D = Keulegan-Carpenter parameter (KC),
UoD/υ = Reynolds number, and
πD/L = diffraction-n parameter.
The KC number is a measure of the importance of the diffraction effect. When the KC
number is large, the diffraction is small & vice versa (Chakravarti 1987). Thus large
diffraction effect necessarily means small drag effect and, inversely when drag effect is
large, the diffraction is negligible.
3.3 COMPUTATION OF WAVE FORCE ON A VERTICAL PILE
Morison, et al.(1950) proposed that the force exerted by unbroken surface waves on a
vertical pile, which extend from the bottom through the free surface is composed by two
components, inertia and drag. Definition sketch is as shown in (Fig.3.1)

Chapter 3 General requirements of berthing structures
Response analysis of berthing structures for wave and earthquake induced forces including soil-structure interaction PhD Thesis,NITK Surathkal,INDIA,2013
47
Fig.3.1 Definition sketch for wave forces on small diameter piles
According to Morison et al (1950), the horizontal force per unit length of a vertical
pile Di fff ----------------------------------------------------------------------------- (3.11)
Where, fi = inertial force per unit length of the pile,
fD = drag force per unit length of the pile,
3.4 CURRENT FORCE
Force due to current will be applied to the area of vessel below the water line when fully
loaded. It is approximately equal to wv²/2g per m2 area, where, v is velocity in m/s and w
unit weight of water in t/m³. The ship is generally berthed parallel to the current; the
likely force should be calculated by any recognized method and taken into account.
Chapter 3 General requirements of berthing structures
Response analysis of berthing structures for wave and earthquake induced forces including soil-structure interaction PhD Thesis,NITK Surathkal,INDIA,2013
48
3.5 SEISMIC FORCE
The horizontal force caused by the earthquake is called seismic force. Earthquake causes
random motion of ground causing the structure to vibrate. The characteristics of the
seismic vibrations expected at any location depend upon the magnitude of earthquake, the
depth of focus, distance from the epicenter and the strata on which the structure stands.
The random earthquake ground motions, which cause the structure to vibrate, can be
resolved in any three mutually perpendicular directions. The predominant direction of
vibration is horizontal. The response of the structure to the ground vibration is a function
of the nature of foundation soil, material, form, size and mode of construction of the
structure, and the duration and intensity of ground motion. Currently there is no uniform
seismic code for the design and construction of berthing structures. Existing building
code and seismic design criteria are commonly used. The horizontal forces caused by the
ground motion are calculated by using IS 1893 , 2000
3.6 SUMMARY OF DESIGN LOADS
So far general requirement for the berthing structure was studied and load calculation was
done, based on the data available from New Mangalore Port Trust. The port of New
Mangalore is located on the Latitude 12˚ 55’ 2” N and longitude 740˚ 46’ 17.6” E on the
west coast of India, midway between Cochin and Mormugoa. The berth is L shaped and
its main portion having a size of 350 m x 40 m and return portion of the birth is having a
size of 60 m x 40 m.Total estimated cost of project was 42 crore.
This multipurpose berth comprising of RCC bored piles of 1.0 m diameter, 284 numbers
and 1.2 m diameter, 32 numbers. The deck was made of precast beams and slabs
connected by in-situ topping.It also consist of 1100mm thick diaphragm wall of length
Chapter 3 General requirements of berthing structures
Response analysis of berthing structures for wave and earthquake induced forces including soil-structure interaction PhD Thesis,NITK Surathkal,INDIA,2013
49
390m with prestressed inclined rock anchors. The climate at Mangalore is tropical with
high humidity and a maximum temperature of 36˚C. The average annual rainfall is
3330mm.The tidal particulars at New Mangalore Port are as follows
Higher high water springs : +1.68m
Mean higher high water : +1.48m
Mean lower high water : +1.26m
Mean sea level : +0.95m
Mean lower low water : +0.26m
Chart datum : 0.00m
The deck elevation should normally be at or above highest high water spring plus half of
an incident wave at the berth location plus a clearance of 1m.The deck level of the jetty
was fixed at +5m above the datum. An expansion joint gap of 20 mm was provided. A
spacing of 60 m for expansion joint was provided for better stiffness.
3.6.1 Design Dead load
Dead loads include all the fixed items in the structures. It includes all primary structural
members, secondary structural items such as Wearing coat, Deck slab, Pile cap,
Transverse beam, Longitudinal beam, Fender beam, Pile etc.
3.6.2 Design Live load
Live loads are defined as movable loads and will be temporary in nature. Live loads will
be applied only on areas designated for the purpose of storage either temporary or long
term. Further, the areas designed for lay down during transfer of materials from boat shall

Chapter 3 General requirements of berthing structures
Response analysis of berthing structures for wave and earthquake induced forces including soil-structure interaction PhD Thesis,NITK Surathkal,INDIA,2013
50
also be considered as live loads. Other live loads include open areas such as walkways,
access platforms etc. These loads shall be applied in accordance with the requirement
from the operator of the platform. This load varies in nature from owner to owner. Live
load of 50 kN/m2
was considered for the present study
3.6.3 Design Berthing Force
Berthing Forces are determined in accordance with IS: 4651(Part-III) - 1989. Following
shows the calculation of Berthing Energy for governing vessel size and its parameters.
Type of ship =Bulk carriers.
Design Vessel Size = 200000 DWT
Overall Length, L = 350 m
Draft, D = 18.2 m
Unit Weight of Sea Water, γseawater = 1.03 kN/m3
Angle of Approach (From Cl.5.2.1.3.b of IS: 4651 (III)) = 10 degrees
Velocity of Approach (Sheltered & Difficult), (Table 2 of IS: 4651 (III))V = 0.1 m/s
Factor of Safety (Cl.9.3.e of IS: 4651 (IV)) = 1.40
DT/DWT Factor (From Fentak Manual) = 1.24
Displacement Tonnage (DT), WD = 248000 t
Mass Coefficient,( Cl.5.2.1.2 of IS: 4651 (III)) Cm = 1 + πD2Lγseawater / 4WD = 1.38
Eccentricity Coefficient, (Table 3 of IS: 4651 (III)) Ce = 0.51
Softness Coefficient, (Cl.5.2.1.4 of IS: 4651 (III)) Cs=0.90
Berthing Energy, (Cl.5.2.1 of IS: 4651 (III)) E = WDV2CmCeCs / 2g = 79.96 t-m
Design Fender Energy =1.4*79.96 = 111.94 t-m

Chapter 3 General requirements of berthing structures
Response analysis of berthing structures for wave and earthquake induced forces including soil-structure interaction PhD Thesis,NITK Surathkal,INDIA,2013
51
3.6.4 Mooring Forces
For 2, 00,000 DWT vessels, as per IS 4651 Part III (1974), the mooring force on each end
is 2000 kN. 4 Nos. of 600 kN capacity bollards are to be provided along the berthing side
(front) of the jetty.
3.6.5 Wind load
The wind in the monsoon months (June-September) are predominantly from SW to W,
with a maximum intensity of 20 to 60 m/s. The winds in the remaining months of the year
are predominantly from NW with a maximum intensity of 20 to 60 m/s. There is minor
seasonal variation of the wind speed. Around Mangalore, 92% of all winds have speeds
less than 19m/s, and the average wind speed considered was 35 m/s.
3.6.6 Wave force
The predominant direction of waves in the vicinity of New Mangalore Port during
monsoon months (June-September) is West and South West, whereas the predominant
direction during the fair months is North –West. High waves are experienced only during
the monsoon months. From observations carried out in 1974 and 1975 as mentioned
above, the following information gives the range of variation of wave heights and
periods:

Chapter 3 General requirements of berthing structures
Response analysis of berthing structures for wave and earthquake induced forces including soil-structure interaction PhD Thesis,NITK Surathkal,INDIA,2013
52
Table 3.1 Wave data collected in NMPT during the year 1974-1975 by the CWPRS
Month Range of wave
heights Hs (m)
Range of wave
periods Ts (sec)
Hmax
(m)
Corresponding
period (sec)
July 1974 1.107-3.21 6.5-13.2 5.0 12
Aug. 1974 1.04-2.74 6.3-10.8 5.2 9
July 1975 0.86-1.96 6.3-11.9 3.2 10
Aug.1975 0.92-3.33 6.3-13.4 5.5 11
Sept.1975 0.34-1.19 4.6-11.0 3.1 9
Oct.1975 0.34-1.19 4.6-11.0 2.3 8
Nov.1975 0.40-1.06 5.6-8.2 1.8 7
The analysis of 15 minutes record of 1974 indicated that the maximum significant wave
height was 3.21m and the largest single wave in that wave train was 4.70m. However, in
another wave train, the largest single wave height was 5.20m, in which the corresponding
significant wave height was 2.55m. The analysis of the 15 minutes record 1975 indicated
that the maximum significant wave height was 3.30m and the largest single wave height
in that wave train was 5.50m. For the present study ,maximum wave height of 5.5m for
period 11sec was considered.
3.6.7 Current
The current along the coast during the SW monsoon (from June to September) is
generally towards the South (from 1600 to 200
0) with strength of 0.22 to 0.80 knots.
During the NE monsoon (from November to January), the current is generally towards
the North (from 00 to 40
0 and 320
0 to 360
0 bearing ) with a velocity of 0.22 to 0.60 knots.
In the port entrance channel protected by breakwater, the current direction lags 60 to 8
0
behind the coastal current.

Chapter 3 General requirements of berthing structures
Response analysis of berthing structures for wave and earthquake induced forces including soil-structure interaction PhD Thesis,NITK Surathkal,INDIA,2013
53
The current in the lagoon area further lags behind the approach channel on an average by
100 to 15
0. The magnitude of the current outside the lagoon area during the monsoon as
experienced by pilots is about 1 to 1.5 knots. For analysis current force considered is 1.5
knots. The modeling and analysis was done using StruCAD and SAP 2000 software.

Response analysis of berthing structures for wave and earthquake induced forces including soil-structure interaction
PhD Thesis,NITK Surathkal,INDIA,2013
54
CHAPTER 4
VALIDATION OF EXPERIMENTAL INVESTIGATION
4.1 CANTILEVER BEAM
An experiment on simple cantilever was done to find the natural frequency and the
mode shapes. The experiment was conducted using a steel scale of length 250 mm,
width 25 mm and thickness of 1mm. One end of the cantilever was fixed on a shaker
and the other end was free is as shown in Plate 4.1
Plate 4.1 Cantilever fixed on shaker
Accelerometer was placed on cantilever which was connected to USB data acquiring
unit. The specification of USB data acquiring unit is shown in the table 4.1. The steel
scale was made to vibrate by hand flick and by force hammer, then the vibrations were
captured by accelerometer. Lab VIEW was used as a GUI software to read data from
data acquisition unit and to present the data in the form of graphs.Fig 4.1 shows a
typical plot of Time Vs Amplitude graph and plot of frequency Vs amplitude graph is
as shown in Fig 4.2.
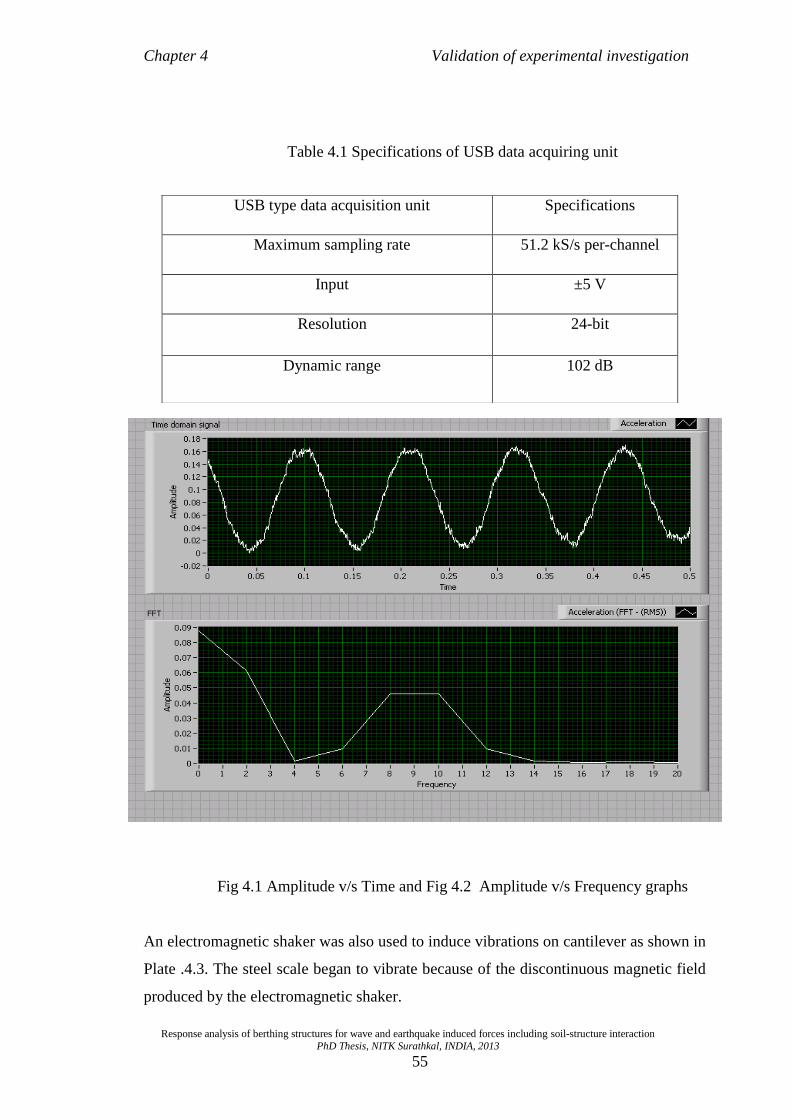
Chapter 4 Validation of experimental investigation
Response analysis of berthing structures for wave and earthquake induced forces including soil-structure interaction
PhD Thesis, NITK Surathkal, INDIA, 2013
55
Table 4.1 Specifications of USB data acquiring unit
Fig 4.1 Amplitude v/s Time and Fig 4.2 Amplitude v/s Frequency graphs
An electromagnetic shaker was also used to induce vibrations on cantilever as shown in
Plate .4.3. The steel scale began to vibrate because of the discontinuous magnetic field
produced by the electromagnetic shaker.
USB type data acquisition unit Specifications
Maximum sampling rate 51.2 kS/s per-channel
Input ±5 V
Resolution 24-bit
Dynamic range 102 dB

Chapter 4 Validation of experimental investigation
Response analysis of berthing structures for wave and earthquake induced forces including soil-structure interaction
PhD Thesis, NITK Surathkal, INDIA, 2013
56
Plate 4.2 Magnetic shaker below the cantilever
4.2 TEST ON SINGLE CYLINDER
The study was done experimentally to measure wave forces and moments on a
vertical circular cylinder due to regular waves in a wave flume and the predicted
results were compared with theoretical solution. In Marine structures laboratory of
Department of Applied Mechanics and Hydraulics of National Institute of
Technology, Karnataka, Surathkal, India, with existing facilities of two dimensional
wave flume, regular waves of heights ranging from 0.08 m to 0.24 m and period
ranging from 0.8 sec to 4.0 sec can be produced. The cylinder was mounted as a
cantilever with two force transducers at the top and free to move at the bottom. The
force transducers were mounted to give in - line forces. Wave forces and moments
were predicted using the linear wave theory. The experiments were conducted in a
glass walled wave flume 1m wide, 1m deep and 50 m long All the experiments were
conducted at a still water depth of 0.5 m. The waves were regular and nonbreaking.
The waves were generated by a electronically controlled wave maker consisting of a
wave paddle hinged at the bottom and installed at the upstream end of the flume and
controlled by electronic inverter.

Chapter 4 Validation of experimental investigation
Response analysis of berthing structures for wave and earthquake induced forces including soil-structure interaction
PhD Thesis, NITK Surathkal, INDIA, 2013
57
The diameter (D) of cylinder is 42 mm and length (l) is 71 mm. Two force
transducers (piezoelectric type, Kistler) are used and placed inline on either side of the
cylinder as shown in Plate 4.3. National Instrument’s Data acquiring unit was used.
Computer connectivity is done using Lab View software. The sample was done at a
rate of 1000 samples/sec.
Wave height was measured using wave probe. Wave probe used was of capacitance
type and it had been interfaced with a computer to find wave height and wave period.
Twelve experiments were conducted with regular waves with wave heights as shown
in Table 2. Each run was repeated for 25 sets and average value was taken. The
calibration of the test pile was done by applying the known loads horizontally in the
longitudinal direction. The known loads were applied by means of static load cells.
The cylinder was hung from the plate which acted like a cantilever bending about
vertical axis. Perfect fixity was ensured at the top of the cylinder.
Plate 4.3 Experimental setup

Chapter 4 Validation of experimental investigation
Response analysis of berthing structures for wave and earthquake induced forces including soil-structure interaction
PhD Thesis, NITK Surathkal, INDIA, 2013
58
Fig 4.3 Schematic diagram of experimental setup
Table 4.2 Experimental and predicted in-line force and moment
Expt.
No
Measured
wave height
at SWL cm
Wave
period T
sec
Max.in-line force Max. moment in–line
direction
Experiment
N
Predicted
N
Experiment
(Nm)
Predicted
(Nm)
1 6.0 4.0 0.515 0.512 0.110 0.132
2 7.0 3.5 0.702 0.698 0.122 0.141
3 8.0 3.5 0.733 0.721 0.156 0.167
4 10.0 3.0 0.742 0.745 0.180 0.199
5 10.0 3.0 0.740 0.765 0.192 0.204
6 10.0 2.5 0.774 0.798 0.210 0.213
7 10.5 2.5 0.831 0.842 0.220 0.235
8 12.0 2.5 1.176 1.156 0.289 0.295
9 14.5 2.5 1.499 1.550 0.387 0.395
10 15.0 2.4 1.631 1.624 0.413 0.426
11 15.0 2.2 1.733 1.758 0.450 0.548
12 19.5 2.2 2.680 2.702 0.679 0.699
4.3 EXPERIMENTAL SETUP FOR SOIL STRUCTURE INTERACTION
The study of vertical cylinder such as piles is very important for the design of marine
structures since the piles used for these structures are vertical and circular in shape
having greater length compared to its diameter. The piles are made up of either concrete
or steel. The experiments were done by using hollow PVC cylinders of 42mm external
diameter.
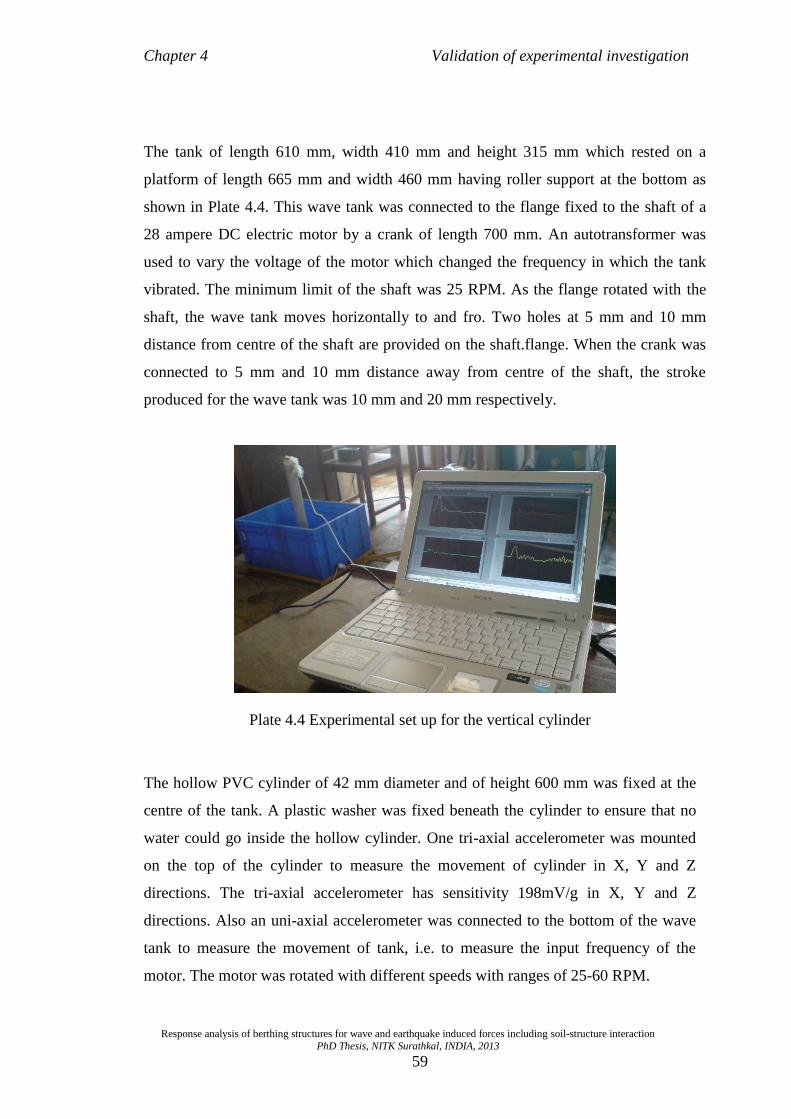
Chapter 4 Validation of experimental investigation
Response analysis of berthing structures for wave and earthquake induced forces including soil-structure interaction
PhD Thesis, NITK Surathkal, INDIA, 2013
59
The tank of length 610 mm, width 410 mm and height 315 mm which rested on a
platform of length 665 mm and width 460 mm having roller support at the bottom as
shown in Plate 4.4. This wave tank was connected to the flange fixed to the shaft of a
28 ampere DC electric motor by a crank of length 700 mm. An autotransformer was
used to vary the voltage of the motor which changed the frequency in which the tank
vibrated. The minimum limit of the shaft was 25 RPM. As the flange rotated with the
shaft, the wave tank moves horizontally to and fro. Two holes at 5 mm and 10 mm
distance from centre of the shaft are provided on the shaft.flange. When the crank was
connected to 5 mm and 10 mm distance away from centre of the shaft, the stroke
produced for the wave tank was 10 mm and 20 mm respectively.
Plate 4.4 Experimental set up for the vertical cylinder
The hollow PVC cylinder of 42 mm diameter and of height 600 mm was fixed at the
centre of the tank. A plastic washer was fixed beneath the cylinder to ensure that no
water could go inside the hollow cylinder. One tri-axial accelerometer was mounted
on the top of the cylinder to measure the movement of cylinder in X, Y and Z
directions. The tri-axial accelerometer has sensitivity 198mV/g in X, Y and Z
directions. Also an uni-axial accelerometer was connected to the bottom of the wave
tank to measure the movement of tank, i.e. to measure the input frequency of the
motor. The motor was rotated with different speeds with ranges of 25-60 RPM.

Chapter 4 Validation of experimental investigation
Response analysis of berthing structures for wave and earthquake induced forces including soil-structure interaction
PhD Thesis, NITK Surathkal, INDIA, 2013
60
Natural frequency was obtained by giving free vibration to the structure by hand flick
method. Then the tank was filled with water at different levels of 100mm, 150mm and
200mm heights. Forced vibrations were given by rotating the motor for 2,4,6,8 and 10
seconds. Both forced and free vibrations were taken for all these heights. Readings
were taken by filling the tank with marine soil of height 100mm with water up to
200mm height.
4.4 SIMPLIFIED BERTHING STRUCTURE MODEL
The experiment was also done on a simplified berthing structure model which has four
steel vertical members and an aluminum plate fixed on the top which resembles
prototype berthing structure as shown in Plate 4.5. Height of the structure was 596mm
and each column was 10mm diameter. The thickness of plate was 10mm and its size
was 226mm x 226mm. The structure was fixed to the bottom of tank by fixing another
plate of same size. Experiments were repeated as in the case of vertical cylinders.
Plate 4.5 Experimental set up for simplified berthing structure model

Chapter 4 Validation of experimental investigation
Response analysis of berthing structures for wave and earthquake induced forces including soil-structure interaction
PhD Thesis, NITK Surathkal, INDIA, 2013
61
4.5 SENSORS USED
4.5.1 Accelerometer
A piezoelectric accelerometer is an electro mechanical transducer, which at its output
terminal, gives an electrical signal proportional to the acceleration to which it is
subjected, due to the fact that the deformation of a piezoelectric sensing element used
therein by an applied force will produce an electrical signal proportional to that force.
There are many different types of transducers which can be used to measure vibration.
In practice, velocity and displacement can be easily obtained from acceleration by use
of an integrating circuit. It turns out that the piezoelectric accelerometer is nearly
always the best transducer as it is self generating,has large dynamic range, wide
frequency range, orientation to measure acceleration along one axis, very reliable with
long term stability.It has no moving parts and it is robust, compact and relatively cheap.
Uni-axial accelerometer and tri-axial accelerometer were used for the experiments. Uni-
axial accelerometer measures acceleration in only one direction and tri-axial
accelerometer measures the acceleration in X, Y and Z directions. The sensitivity of
uni-axial accelerometer used was 10mV/g. The tri-axial accelerometer which was used
for the experiments on vertical cylinder and simplified offshore structure, has
sensitivity 198mV/g in X, Y and Z directions.
Plate 4.6 Uni-axial accelerometer connected to setup
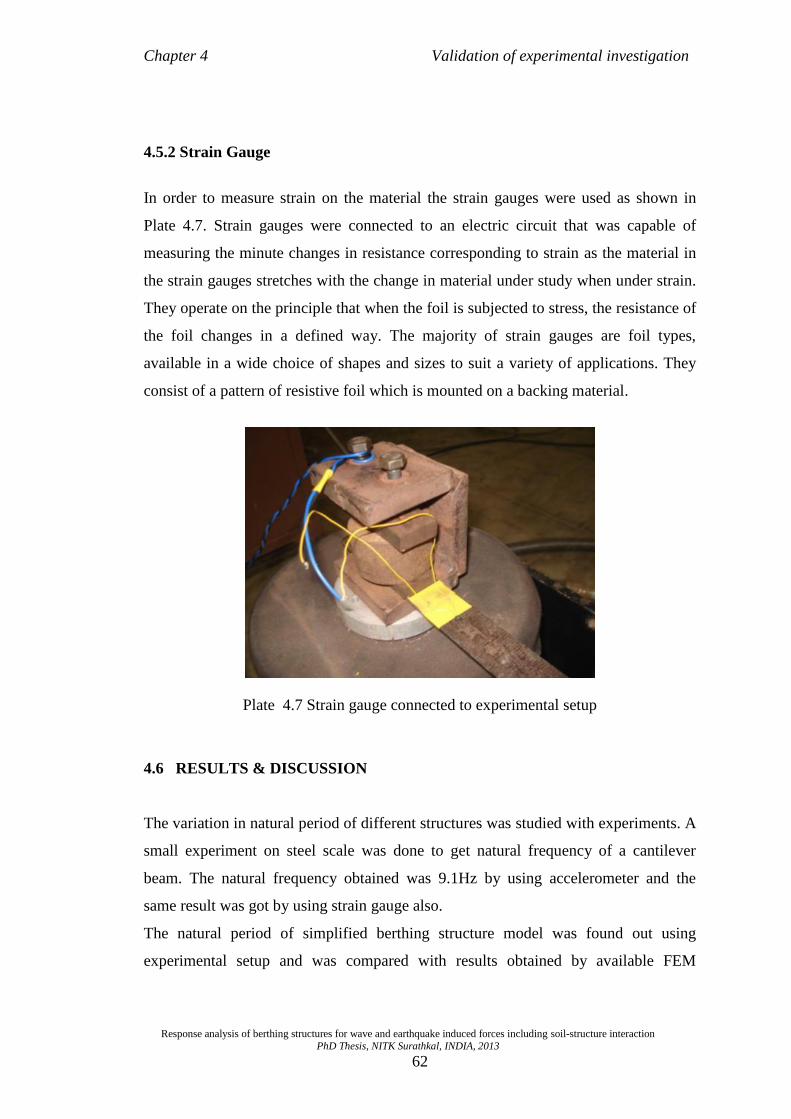
Chapter 4 Validation of experimental investigation
Response analysis of berthing structures for wave and earthquake induced forces including soil-structure interaction
PhD Thesis, NITK Surathkal, INDIA, 2013
62
4.5.2 Strain Gauge
In order to measure strain on the material the strain gauges were used as shown in
Plate 4.7. Strain gauges were connected to an electric circuit that was capable of
measuring the minute changes in resistance corresponding to strain as the material in
the strain gauges stretches with the change in material under study when under strain.
They operate on the principle that when the foil is subjected to stress, the resistance of
the foil changes in a defined way. The majority of strain gauges are foil types,
available in a wide choice of shapes and sizes to suit a variety of applications. They
consist of a pattern of resistive foil which is mounted on a backing material.
Plate 4.7 Strain gauge connected to experimental setup
4.6 RESULTS & DISCUSSION
The variation in natural period of different structures was studied with experiments. A
small experiment on steel scale was done to get natural frequency of a cantilever
beam. The natural frequency obtained was 9.1Hz by using accelerometer and the
same result was got by using strain gauge also.
The natural period of simplified berthing structure model was found out using
experimental setup and was compared with results obtained by available FEM

Chapter 4 Validation of experimental investigation
Response analysis of berthing structures for wave and earthquake induced forces including soil-structure interaction
PhD Thesis, NITK Surathkal, INDIA, 2013
63
software ANSYS. Natural frequencies of different models were presented in Table
4.3.
Table 4.3 Natural frequency of different model at different experimental conditions
Types of structures with experimental
conditions
Natural frequency
obtained from
experiment (Hz)
32mm diameter hollow cylinder 0.312
hollow cylinder + 100mm soil 0.40
hollow cylinder +100mm water 0.41
hollow cylinder + 200mm water 2.27
hollow cylinder + 100mm soil and water 6.67
soil filled cylinder 1
soil filled cylinder +100mm soil 1.25
soil filled cylinder +100mm water 1.43
soil filled cylinder +200mm water 3.6
soil filled cylinder +100mm soil and water 8.6
berthing structure without water 0.434
berthing structure + 100mm soil 1.25
berthing structure + 100mm water 0.769
berthing structure + 200mm water 0.91
berthing structure + 100mm soil and water 1.67

Chapter 4 Validation of experimental investigation
Response analysis of berthing structures for wave and earthquake induced forces including soil-structure interaction
PhD Thesis, NITK Surathkal, INDIA, 2013
64
It was observed that the presence of water and soil tends to increase the natural
frequency. With the water natural frequency of the hollow cylinder was increased by
32%. For soil filled cylinder it was increased by 25%. When compared to the natural
frequencies of hollow and solid vertical member it was observed that natural
frequency tends to increase. The results obtained were compared with ANSYS model
and results were tabulated in table 4.3. It was observed that the experimental results
are closer to the ANSYS results. The different mode shapes of the 42mm cylinder and
the simplified berthing structure in soil is as shown in Fig.4.4 and 4.5.
Mode 1 Mode 2 Mode 3
Mode 4 Mode 5
Fig 4.4 Mode shapes of 42mm diameter cylinder with soil

Chapter 4 Validation of experimental investigation
Response analysis of berthing structures for wave and earthquake induced forces including soil-structure interaction
PhD Thesis, NITK Surathkal, INDIA, 2013
65
Mode 1 Mode 2 Mode 3
Mode 4 Mode 5
Fig 4.5 Mode shapes of simplified berthing structure with soil mass
Response of various model due to forced vibrations for 2 sec were shown in Fig 4.6 to
Fig 4.9.
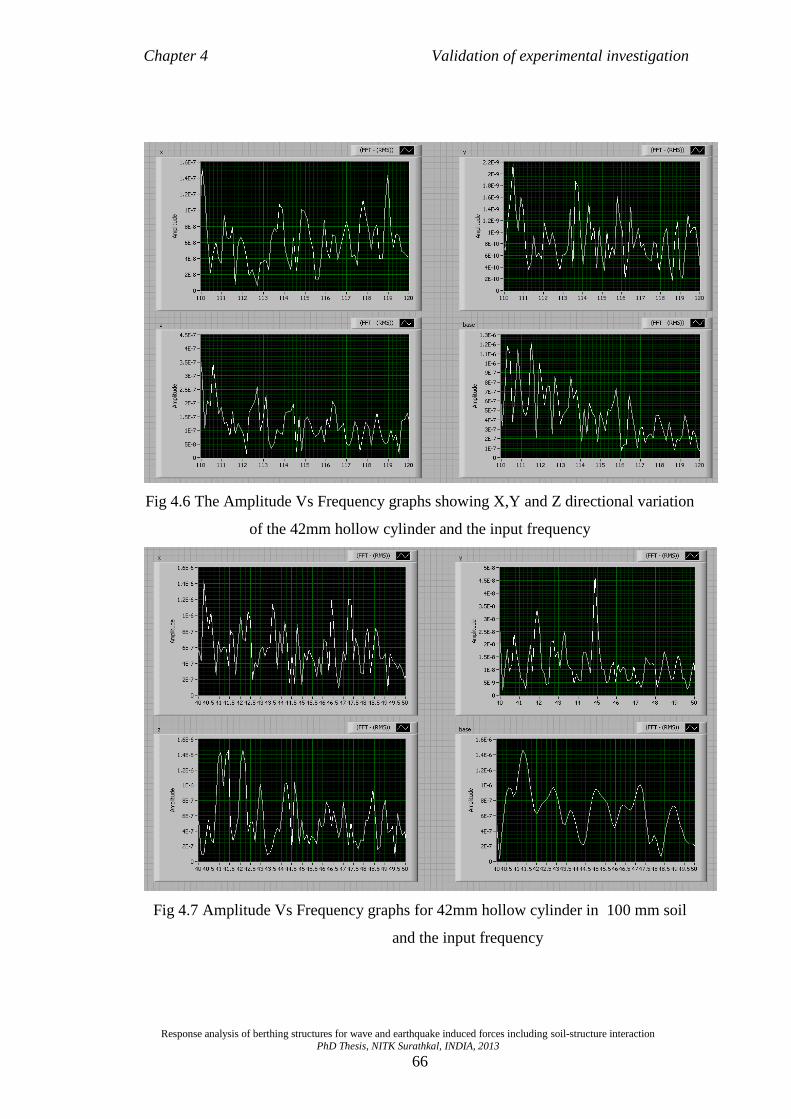
Chapter 4 Validation of experimental investigation
Response analysis of berthing structures for wave and earthquake induced forces including soil-structure interaction
PhD Thesis, NITK Surathkal, INDIA, 2013
66
Fig 4.6 The Amplitude Vs Frequency graphs showing X,Y and Z directional variation
of the 42mm hollow cylinder and the input frequency
Fig 4.7 Amplitude Vs Frequency graphs for 42mm hollow cylinder in 100 mm soil
and the input frequency

Chapter 4 Validation of experimental investigation
Response analysis of berthing structures for wave and earthquake induced forces including soil-structure interaction
PhD Thesis, NITK Surathkal, INDIA, 2013
67
Fig 4.8 Amplitude Vs Frequency graphs of 42mm hollow cylinder in 200mm water
and the input frequency
Fig 4.9 Amplitude Vs Frequency graphs of 42mm hollow cylinder in 100mm soil +
water and the input frequency
It was observed that response at the top of the vertical member was slightly lesser
than the applied frequency at the base. This may be due to damping effect of the
structure. Further inclusion of soil and water along with vertical member tends to

Chapter 4 Validation of experimental investigation
Response analysis of berthing structures for wave and earthquake induced forces including soil-structure interaction
PhD Thesis, NITK Surathkal, INDIA, 2013
68
reduce the natural period. The damping ratio calculated for 42mm hollow cylinder is
shown in table.4.4.
Table 4.4 Damping ratio of 42mm cylinder at different experimental conditions
Experimental conditions Damping ratio
42mm hollow cylinder 0.023
Hollow cylinder +100mm water 0.035
Hollow cylinder + 200mm water 0.098
Hollow cylinder + 100mm soil and water 0.135
The damping ratio increases when the structure in water and soil.
4.7 MODAL ANALYSIS – NATURAL FREQUENCIES
Different modes of vibration of the structure were obtained by performing the modal
analysis. The accuracy of the PIPE59 element used in 2D structure was checked with
the results of Veeraraja (2001) and a good correlation was found among the results.
The damping and the hydrodynamic coefficients greatly influence the natural
frequency of the structural system. In the present work the effect of the damping is
ignored. The added mass, which is related to the coefficient of inertia, Cm, has its
influence on the free vibration mode shapes and frequencies of the structure. As the
mass of the structure increases its fundamental frequency is ‘depressed’ and this
frequency may fall in line with the driving frequency. Vinod (2001) checked that
with added mass (varying Cm) and found that it has very little effect on the free
vibration modes. The natural frequency obtained in ANSYS is 0.248 Hz.
The different modes of vibration of structures were presented in the Fig 4.10. The
time period of ocean waves is usually between 8–12 seconds along the Mangalore
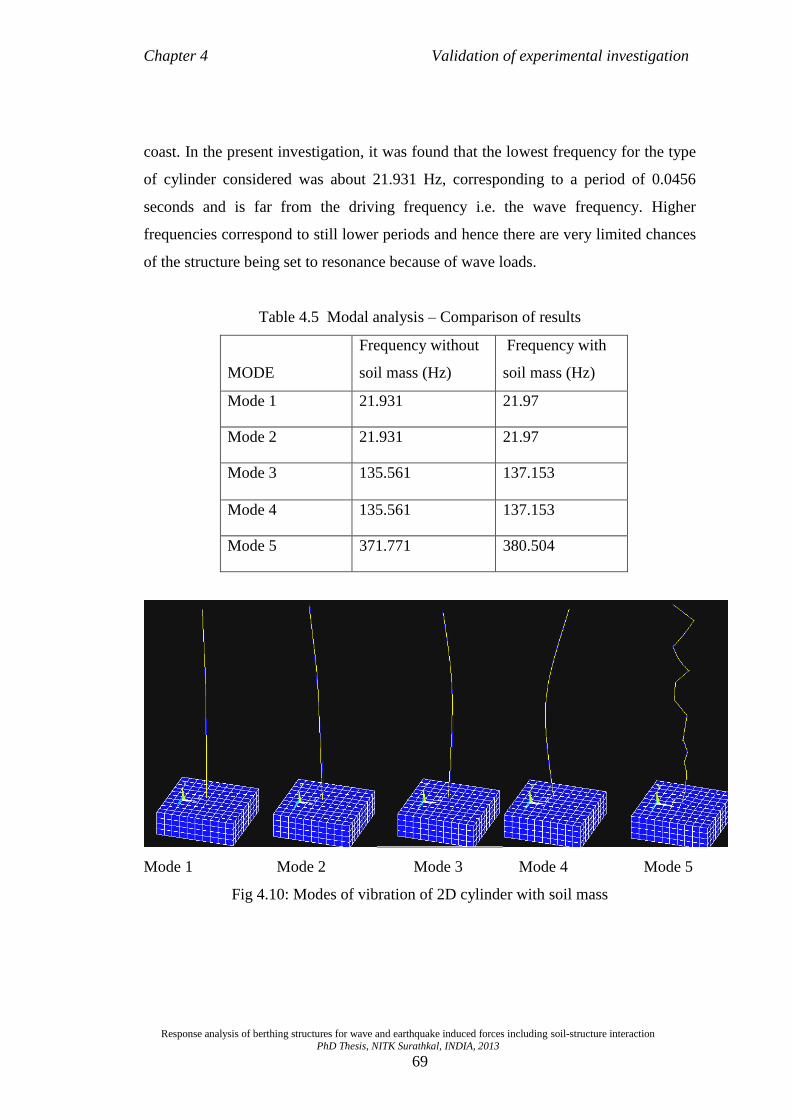
Chapter 4 Validation of experimental investigation
Response analysis of berthing structures for wave and earthquake induced forces including soil-structure interaction
PhD Thesis, NITK Surathkal, INDIA, 2013
69
coast. In the present investigation, it was found that the lowest frequency for the type
of cylinder considered was about 21.931 Hz, corresponding to a period of 0.0456
seconds and is far from the driving frequency i.e. the wave frequency. Higher
frequencies correspond to still lower periods and hence there are very limited chances
of the structure being set to resonance because of wave loads.
Table 4.5 Modal analysis – Comparison of results
MODE
Frequency without
soil mass (Hz)
Frequency with
soil mass (Hz)
Mode 1 21.931 21.97
Mode 2 21.931 21.97
Mode 3 135.561 137.153
Mode 4 135.561 137.153
Mode 5 371.771 380.504
Mode 1 Mode 2 Mode 3 Mode 4 Mode 5
Fig 4.10: Modes of vibration of 2D cylinder with soil mass

Chapter 4 Validation of experimental investigation
Response analysis of berthing structures for wave and earthquake induced forces including soil-structure interaction
PhD Thesis, NITK Surathkal, INDIA, 2013
70
4.8 TRANSIENT ANALYSIS
Quite often the loads coming on a structure are time dependent only over a small
interval of time and become either constant or decay with time. Many times the
structure experiences maximum deflections and stresses due to such transient loads.
Structures are evaluated with reference to transient loads taken in the form of
suddenly applied loads with a step/ramped variation. For a pile structure this may
simulate the condition of wave load acting on the structure. In the present
investigation the transient dynamic analysis of the vertical cylinder, subjected to
transient wave loads is attempted using ANSYS software.
The loads considered are taken in the form of ramped loading. The reduced solution
method is used for the response analysis in each time step. A time step of 2.5 sec is
chosen in the present investigation. Since the wave period in the Mangalore Coast
varies from 8-12 sec, the time response history is found for wave periods of 8- 12
seconds interval of time. The wave forces were calculated from Morison’s equation
substituting suitable wave data and are applied with a time step of 2.5 sec.
After giving suitable constraints and degrees of freedom at the nodes, the time
varying forces were applied to the structure. Then when the forces were applied, as
results, the time history response of the structure was obtained. The deflection of the
structure under the time varying force was one of the responses to be found.

Chapter 4 Validation of experimental investigation
Response analysis of berthing structures for wave and earthquake induced forces including soil-structure interaction
PhD Thesis, NITK Surathkal, INDIA, 2013
71
-30000
-20000
-10000
0
10000
20000
30000
0 5 10 15 20 25 30
Time (sec)
De
fle
cti
on
(n
m)
8 Sec
9 Sec
10 Sec
11 Sec
12 Sec
Fig.4.11 Transient response, Ux, lateral deflection of 2D cylinder at different wave
periods
The deflections of the structure, due to transient loading for the 2D cylinder is as
shown in Fig 4.11, the deflections got for the different wave periods ranging 8–12 sec,
vary from a minimum of -23.2 mm to a maximum of 25.03 mm. For 8sec period, the
maximum deflection is 24.87 mm; for 9 sec period, maximum deflection is 24.59 mm;
for 10 sec, maximum is 23.34 mm; for 11 sec, the maximum is 25.0 mm and for 12
sec, maximum is 25.03 mm.
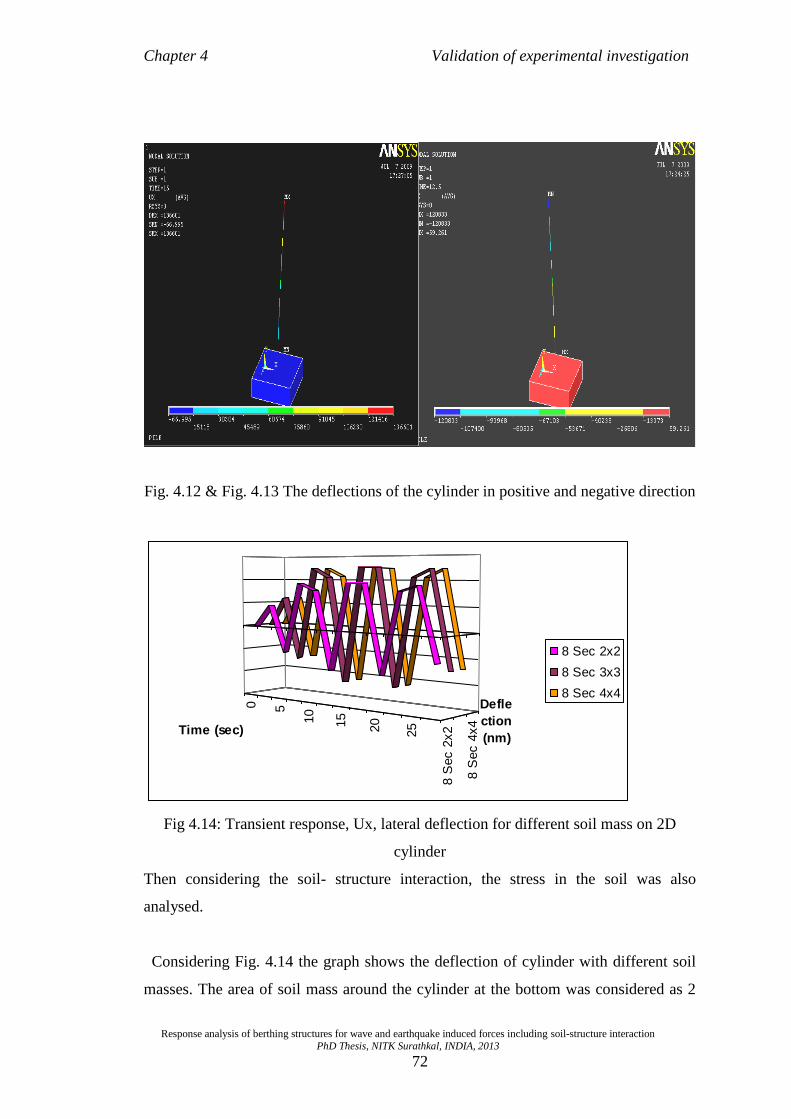
Chapter 4 Validation of experimental investigation
Response analysis of berthing structures for wave and earthquake induced forces including soil-structure interaction
PhD Thesis, NITK Surathkal, INDIA, 2013
72
Fig. 4.12 & Fig. 4.13 The deflections of the cylinder in positive and negative direction
0 5
10
15
20
25
8 S
ec 2
x2
8 S
ec 4
x4
Time (sec)
Defle
ction
(nm)
8 Sec 2x2
8 Sec 3x3
8 Sec 4x4
Fig 4.14: Transient response, Ux, lateral deflection for different soil mass on 2D
cylinder
Then considering the soil- structure interaction, the stress in the soil was also
analysed.
Considering Fig. 4.14 the graph shows the deflection of cylinder with different soil
masses. The area of soil mass around the cylinder at the bottom was considered as 2

Chapter 4 Validation of experimental investigation
Response analysis of berthing structures for wave and earthquake induced forces including soil-structure interaction
PhD Thesis, NITK Surathkal, INDIA, 2013
73
times the diameter, 3 times the diameter and 4 times the diameter. This was done to
find the optimum area of soil required for modeling around a pile. Results show that
the deflection of cylinder in 3m x 3m and 4m x 4m soil mass are similar. Further
increase in area would not affect the deflections of the cylinder. So a soil mass of area
3 x diameter of pile is considered as the optimum area for the modeling of soil mass.
Also the maximum stress in the soil was found to be approximately 5 Pa which is
negligibly small and much below the permissible stress. Based on this study berthing
structure model of size 350m x 40m was analysed taking soil mass of 3D,4D,5D and
keeping depth same for all the cases.
4.9 CONCLUSIONS
1. The natural frequency of the experimental model fairly agreed with the FEM
model.. Inclusion of water and the soil tend to increase the natural frequency
of the structure.
2. The response at the top of the vertical cylinder is slightly less than the applied
frequency at the base. This may be due to damping effect of the structure.
Further inclusion of soil and water along with vertical member tends to reduce
the natural period.
3. When structure is in water and soil, the damping ratios of vertical member at
different experimental conditions increases.
4. Detailed modal and transient dynamic analysis have been conducted on the
structure and based on this study, the natural frequency of the structure
obtained is 0.247Hz which shows that the natural time period of vibration of
the structure is nowhere near the actual field loading conditions where waves
are of 8-12 sec period. So there are little chances of resonance due to wave
loading.
5. Modal analysis was done for a 2D structure with and without soil mass at
bottom and their frequencies were found to be almost same.

Chapter 4 Validation of experimental investigation
Response analysis of berthing structures for wave and earthquake induced forces including soil-structure interaction
PhD Thesis, NITK Surathkal, INDIA, 2013
74
6. Performed time-domain transient analysis, and found that, the maximum
deflection of the structure under wave action that was obtained in the analysis
was 25 mm, which is a reasonable value as in real conditions.
7. Transient response on a 2D cylinder with varying soil mass was obtained. The
soil mass considered was 2mx2m, 3mx3m and 4mx4m square mass. From the
results, it can be seen that both 3mx3m and 4mx4m soil masses have almost
same deflection patterns. i.e. 3mx3m is the optimum soil mass that can be used
for this model study.
8. The Maximum stress in the soil due to transient loading in the structure was
obtained as 5 Pa which is also negligibly small and much below the
permissible stress in the soil.

Response analysis of berthing structures for wave and earthquake induced forces including soil-structure interaction PhD Thesis,NITK Surathkal,INDIA,2013
75
Chapter 5
WAVE RESPONSE ANALYSIS
5.1 GENERAL
The StruCAD*3D software is used to find the response due to the dynamic effects of
wave loadings on berthing structures. The member end forces calculated by the wave
response module can be used directly by the StruCAD*3D detailed fatigue module to
estimate the fatigue damage of tubular connections. The structure is subjected to a single
repeatable wave and the steady state response is calculated using the Fourier series. The
basic assumption behind this approach is that the same repeatable wave is sustained long
enough to establish a steady state response. The theoretical approach is as follows:
1 A full cycle of wave is applied to the structure. The hydrodynamic forces are
calculated using Morison's equation, and saved for each time step for each
member. These distributed member forces are then converted to equivalent joint
loads using static equilibrium.
2 For each wave time step, the joint load vector created above is multiplied by the
mode shape deflections to calculate the generalized forces for each mode.
3 Working with a mode at a time, and considering the fact that the generalized
forces calculated for different time steps represent a periodic function, a Fourier
transformation can be applied to generate a series of sinusoidal forcing functions
with different frequencies and amplitudes, which would represent the same
periodic function if they are superimposed at any given time during the wave
period.
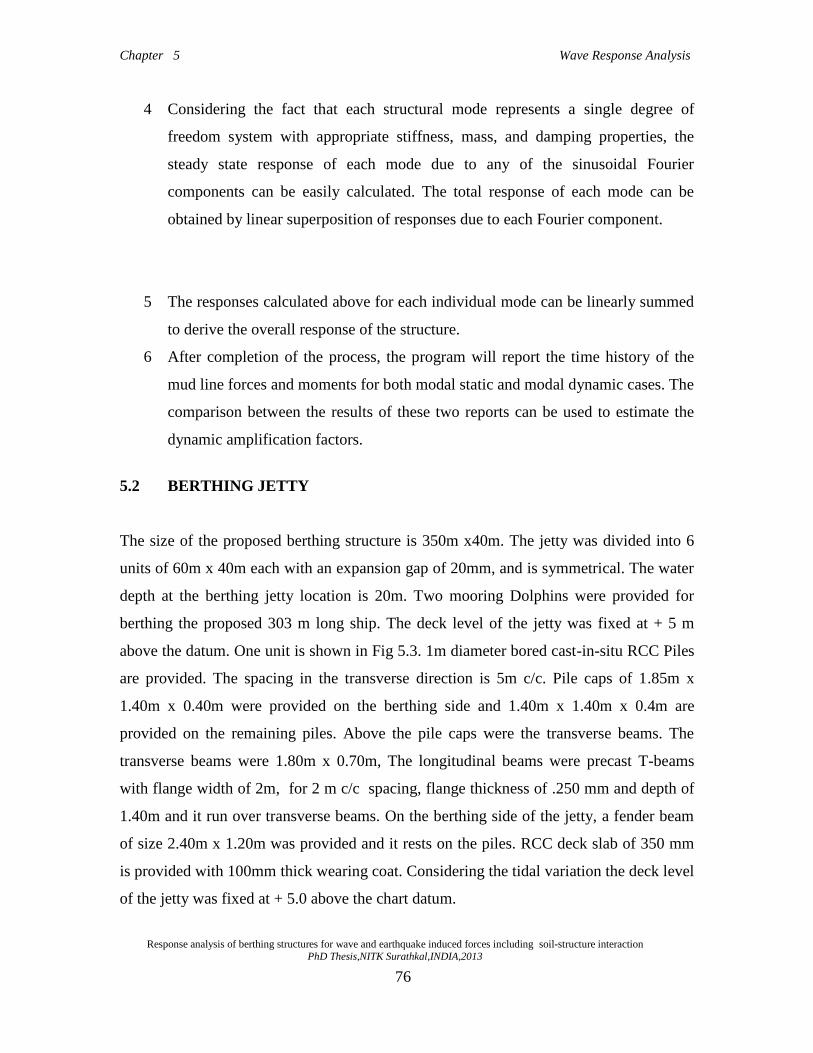
Chapter 5 Wave Response Analysis
Response analysis of berthing structures for wave and earthquake induced forces including soil-structure interaction
PhD Thesis,NITK Surathkal,INDIA,2013
76
4 Considering the fact that each structural mode represents a single degree of
freedom system with appropriate stiffness, mass, and damping properties, the
steady state response of each mode due to any of the sinusoidal Fourier
components can be easily calculated. The total response of each mode can be
obtained by linear superposition of responses due to each Fourier component.
5 The responses calculated above for each individual mode can be linearly summed
to derive the overall response of the structure.
6 After completion of the process, the program will report the time history of the
mud line forces and moments for both modal static and modal dynamic cases. The
comparison between the results of these two reports can be used to estimate the
dynamic amplification factors.
5.2 BERTHING JETTY
The size of the proposed berthing structure is 350m x40m. The jetty was divided into 6
units of 60m x 40m each with an expansion gap of 20mm, and is symmetrical. The water
depth at the berthing jetty location is 20m. Two mooring Dolphins were provided for
berthing the proposed 303 m long ship. The deck level of the jetty was fixed at + 5 m
above the datum. One unit is shown in Fig 5.3. 1m diameter bored cast-in-situ RCC Piles
are provided. The spacing in the transverse direction is 5m c/c. Pile caps of 1.85m x
1.40m x 0.40m were provided on the berthing side and 1.40m x 1.40m x 0.4m are
provided on the remaining piles. Above the pile caps were the transverse beams. The
transverse beams were 1.80m x 0.70m, The longitudinal beams were precast T-beams
with flange width of 2m, for 2 m c/c spacing, flange thickness of .250 mm and depth of
1.40m and it run over transverse beams. On the berthing side of the jetty, a fender beam
of size 2.40m x 1.20m was provided and it rests on the piles. RCC deck slab of 350 mm
is provided with 100mm thick wearing coat. Considering the tidal variation the deck level
of the jetty was fixed at + 5.0 above the chart datum.

Chapter 5 Wave Response Analysis
Response analysis of berthing structures for wave and earthquake induced forces including soil-structure interaction
PhD Thesis,NITK Surathkal,INDIA,2013
77
5.2.1 Approach jetty
The length of the approach jetty is 350 m and the width is 40m. Approach jetty is
connected to the main jetty with an expansion gap of 20mm. Approach jetty consists of
1.0m diameter bored cast in-situ RCC piles provided at 10m c/c in longitudinal direction
and 5 m in the transverse direction. Fig 5.1 shows the plan of berthing structure and all
dimensions are in meters.
Fig 5.1 plan of berthing structure
5.2.1 Structural model
The modeling of the berthing structure is done using the software StruCAD. The 3D
structural model developed is shown in the Fig 5.2
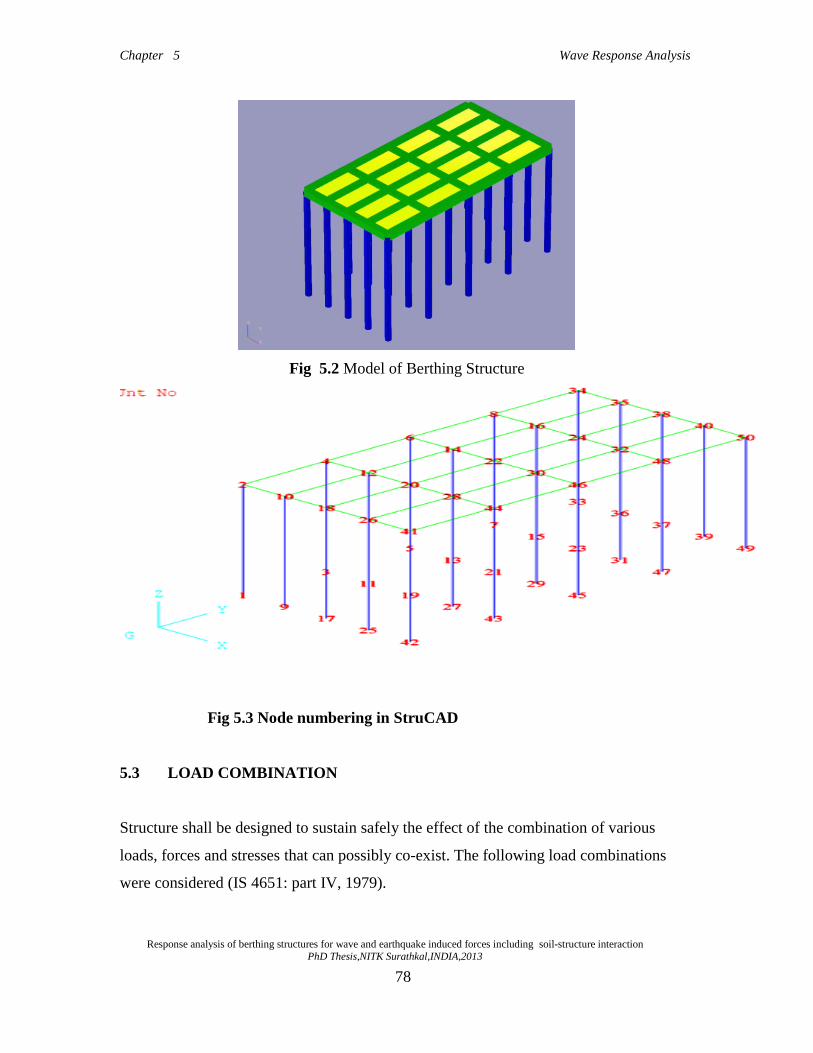
Chapter 5 Wave Response Analysis
Response analysis of berthing structures for wave and earthquake induced forces including soil-structure interaction
PhD Thesis,NITK Surathkal,INDIA,2013
78
Fig 5.2 Model of Berthing Structure
Fig 5.3 Node numbering in StruCAD
5.3 LOAD COMBINATION
Structure shall be designed to sustain safely the effect of the combination of various
loads, forces and stresses that can possibly co-exist. The following load combinations
were considered (IS 4651: part IV, 1979).

Chapter 5 Wave Response Analysis
Response analysis of berthing structures for wave and earthquake induced forces including soil-structure interaction
PhD Thesis,NITK Surathkal,INDIA,2013
79
1. Dead Load + Live Load + Wave Load + Current Load+ Berthing load
2. Dead Load + Live Load + Wind Load+ Mooring Load
3. Dead Load + Live Load + Wave Load + Current Load
5.4 STATIC ANALYSIS
Static analysis is carried out for 2, 00,000 DWT vessel using StruCAD software. Tables
5.1 and 5.2 shows the analysis result for different load combination for 1m and 1.2m
diameter piles respectively.
Table 5.1 force, moment and deflection for different load combination for 1m
diameter pile
Load combinations Maximum
Force
kN
Maximum
Moment
kN-m
Deflection at top of
the structure (mm)
Dead Load + Live Load + Wave Load
+ Current Load+ Berthing load
138.46
1726.59
136.5
Dead Load + Live Load + Wind
Load+ Mooring Load
111.18
1437.81
121.9
Dead Load + Live Load + Wave Load
+ Current Load
37.69
381.13
22.8

Chapter 5 Wave Response Analysis
Response analysis of berthing structures for wave and earthquake induced forces including soil-structure interaction
PhD Thesis,NITK Surathkal,INDIA,2013
80
Table 5.2 force, moment and deflection for different load combination for
1.2mdiameter pile
Load combinations Maximum
Force
kN
Maximum
Moment
kN-m
Deflection at top of
the structure (mm)
Dead Load + Live Load + Wave
Load + Current Load+ Berthing load
148.23
1817.76
66.9
Dead Load + Live Load + Wind
Load+ Mooring Load
125.33
1564.45
59.7
Dead Load + Live Load + Wave
Load + Current Load
69.39
622.56 14.2
The total wave force is given by the summation of drag component and inertia
component; both these forces depend on diameter of the pile. Hence from the Tables 5.1
and 5.2 we can observe that the forces and moment are maximum for larger diameter pile
compared to smaller diameter pile i.e., there is an increase of 6 % for larger diameter
piles. Also it was observed that top deflection of the structure for smaller diameter is
more compared to the larger diameter i.e., there is an increase of 50 % for smaller
diameter piles due to less stiffness. The significant wave height of 3.2m is considered
having frequency of 0.10 Hz.
5.4.1 Deflection, for significant wave height of 3.2m.
The wave directions considered for the present analyses are 45º, 90º and 135° with
respect to the structural alignment. The values of deflections for different diameters of
piles and for different wave direction are presented in Table 5.3. From the results it is
seen that deflection varies with respect to wave direction and the structural response is
maximum for wave direction perpendicular to the structural alignment. Thus it is
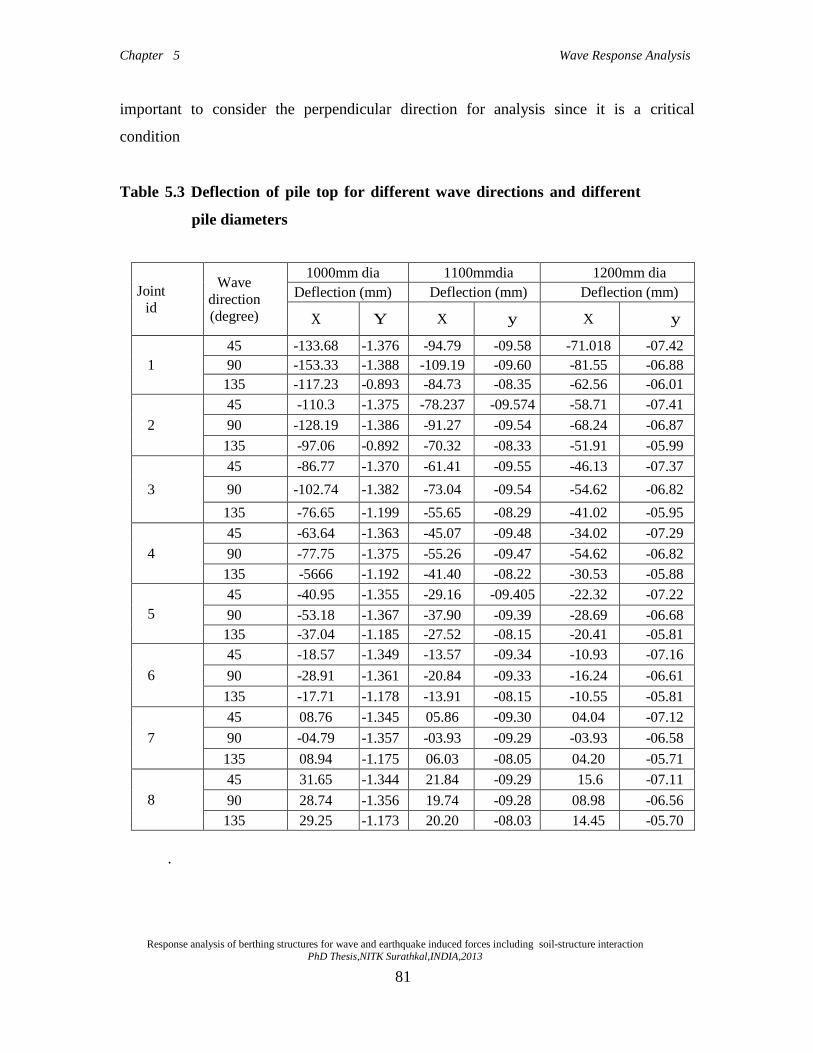
Chapter 5 Wave Response Analysis
Response analysis of berthing structures for wave and earthquake induced forces including soil-structure interaction
PhD Thesis,NITK Surathkal,INDIA,2013
81
important to consider the perpendicular direction for analysis since it is a critical
condition
Table 5.3 Deflection of pile top for different wave directions and different
pile diameters
Joint
id
Wave
direction
(degree)
1000mm dia 1100mmdia 1200mm dia
Deflection (mm) Deflection (mm) Deflection (mm)
X Y X y X y
1
45 -133.68 -1.376 -94.79 -09.58 -71.018 -07.42
90 -153.33 -1.388 -109.19 -09.60 -81.55 -06.88
135 -117.23 -0.893 -84.73 -08.35 -62.56 -06.01
2
45 -110.3 -1.375 -78.237 -09.574 -58.71 -07.41
90 -128.19 -1.386 -91.27 -09.54 -68.24 -06.87
135 -97.06 -0.892 -70.32 -08.33 -51.91 -05.99
3
45 -86.77 -1.370 -61.41 -09.55 -46.13 -07.37
90 -102.74 -1.382 -73.04 -09.54 -54.62 -06.82
135 -76.65 -1.199 -55.65 -08.29 -41.02 -05.95
4
45 -63.64 -1.363 -45.07 -09.48 -34.02 -07.29
90 -77.75 -1.375 -55.26 -09.47 -54.62 -06.82
135 -5666 -1.192 -41.40 -08.22 -30.53 -05.88
5
45 -40.95 -1.355 -29.16 -09.405 -22.32 -07.22
90 -53.18 -1.367 -37.90 -09.39 -28.69 -06.68
135 -37.04 -1.185 -27.52 -08.15 -20.41 -05.81
6
45 -18.57 -1.349 -13.57 -09.34 -10.93 -07.16
90 -28.91 -1.361 -20.84 -09.33 -16.24 -06.61
135 -17.71 -1.178 -13.91 -08.15 -10.55 -05.81
7
45 08.76 -1.345 05.86 -09.30 04.04 -07.12
90 -04.79 -1.357 -03.93 -09.29 -03.93 -06.58
135 08.94 -1.175 06.03 -08.05 04.20 -05.71
8
45 31.65 -1.344 21.84 -09.29 15.6 -07.11
90 28.74 -1.356 19.74 -09.28 08.98 -06.56
135 29.25 -1.173 20.20 -08.03 14.45 -05.70
.

Chapter 5 Wave Response Analysis
Response analysis of berthing structures for wave and earthquake induced forces including soil-structure interaction
PhD Thesis,NITK Surathkal,INDIA,2013
82
5.5 WAVE FORCE ANALYSIS
The design of the berthing structure is to be done considering the maximum wave
expected to occur during the life of the structure. Considering the wave data collected at
the site, the maximum wave height was 5.5m with a period of 11sec.
Table 5.4 Forces and Moment during a wave cycle for wave height 5.5 m and period
11 Secs for 1 m diameter pile
Crest
Position
of wave
Phase
Angle
Resultant
Force Moment
(m) (Deg) kN kN-m
0 0 321.91 5026.42
7.61 20 392.64 4907.40
15.21 40 525.73 5930.91
22.82 60 640.37 6984.68
30.42 80 651.59 6969.34
38.03 100 596.43 6437.08
45.64 120 510.41 5705.03
53.24 140 372.16 4446.96
60.85 160 255.47 3437.21
68.45 180 285.11 3775.39
76.06 200 429.38 5317.00
83.67 220 612.38 7564.83
91.27 240 769.23 9744.63
98.88 260 851.86 11170.19
106.48 280 853.02 11485.81
114.09 300 743.63 10604.85
121.69 320 612.65 9121.50
129.3 340 430.79 6866.89
136.91 360 321.91 5026.42

Chapter 5 Wave Response Analysis
Response analysis of berthing structures for wave and earthquake induced forces including soil-structure interaction
PhD Thesis,NITK Surathkal,INDIA,2013
83
The analysis of the structure for the maximum wave height of 5.5m was carried out for a
full cycle wave approaching perpendicular to the alignment of structure. The wave crest
position and phase angle of one wave cycle with respect to structure was shown.
Table 5.5 Forces and Moment during a wave cycle for wave height 5.5 m and period
11 sec for 1.2 m dia pile
Crest
Position
of wave
Phase
Angle
Resultant
Force Moment
(m) (Deg) kN kN-m
0 0 411.61 6119.12
7.61 20 534.89 6310.63
15.21 40 727.2 7961.81
22.82 60 861.25 9242.98
30.42 80 873.88 9282.53
38.03 100 787.32 8448.11
45.64 120 615.19 6801.72
53.24 140 443.4 5348.06
60.85 160 310.21 4207.39
68.45 180 384.51 4905.21
76.06 200 610.49 7322.61
83.67 220 863.59 10445.97
91.27 240 1040.47 12977.14
98.88 260 1124.67 14562.86
106.48 280 1184.95 14646.55
114.09 300 971.93 13592.52
121.69 320 706 10706.69
129.3 340 500.2 8088.36
136.91 360 411.61 6119.12
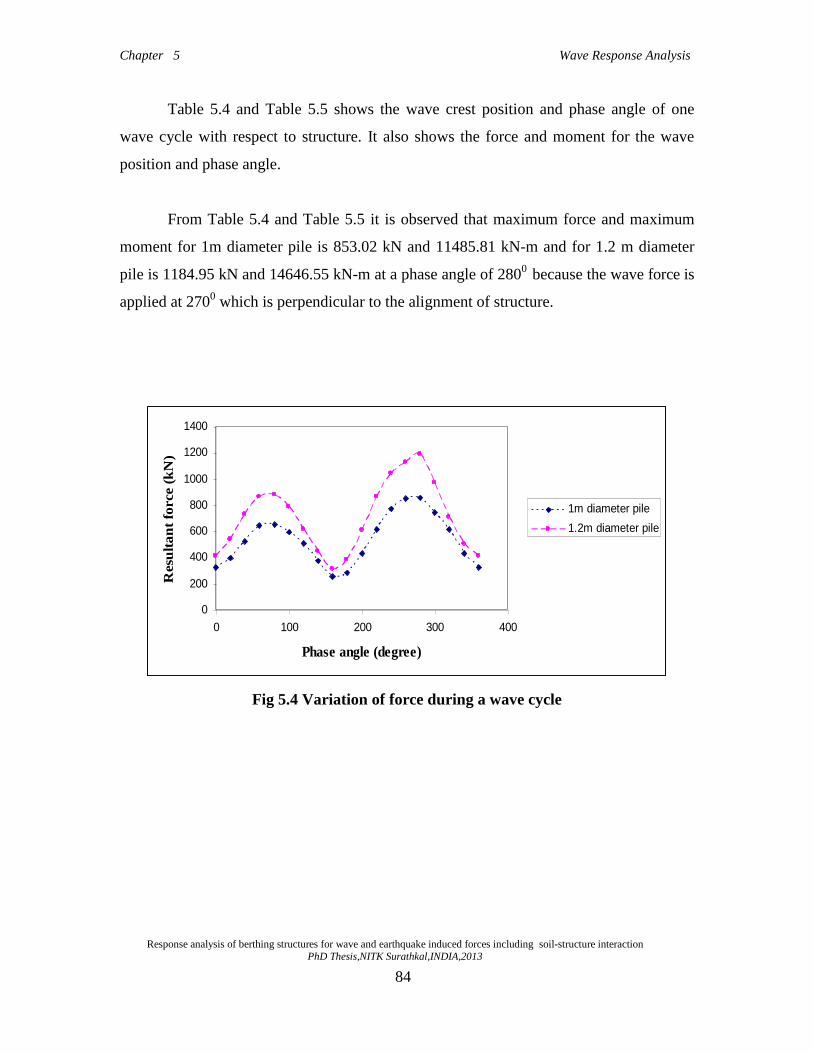
Chapter 5 Wave Response Analysis
Response analysis of berthing structures for wave and earthquake induced forces including soil-structure interaction
PhD Thesis,NITK Surathkal,INDIA,2013
84
Table 5.4 and Table 5.5 shows the wave crest position and phase angle of one
wave cycle with respect to structure. It also shows the force and moment for the wave
position and phase angle.
From Table 5.4 and Table 5.5 it is observed that maximum force and maximum
moment for 1m diameter pile is 853.02 kN and 11485.81 kN-m and for 1.2 m diameter
pile is 1184.95 kN and 14646.55 kN-m at a phase angle of 2800
because the wave force is
applied at 2700 which is perpendicular to the alignment of structure.
0
200
400
600
800
1000
1200
1400
0 100 200 300 400
Phase angle (degree)
Resu
lta
nt
force (
kN
)
1m diameter pile
1.2m diameter pile
Fig 5.4 Variation of force during a wave cycle

Chapter 5 Wave Response Analysis
Response analysis of berthing structures for wave and earthquake induced forces including soil-structure interaction
PhD Thesis,NITK Surathkal,INDIA,2013
85
0
2000
4000
6000
8000
10000
12000
14000
16000
0 100 200 300 400
Phase angle (degree)
Resu
lta
nt
mo
men
t (k
N-m
)
1m diameter pile
1.2m diameter pile
Fig 5.5 Variation of Moment during a wave cycle
A full wave cycle was considered for plotting the results. The variation of forces and
moment on the structure element were presented for one wave cycle. Fig 5.4 shows the
resultant forces for 1m and 1.2m diameter pile and Fig 5.5 shows the resultant moment
for 1.0m and 1.2m diameter pile respectively. It was also observed that force and moment
are both harmonic in nature. The force and moment for 1.2m diameter pile was 23
percent more than the 1.0m diameter pile. This is due to increase in drag and inertia
force, which is directly proportional to diameter of pile.
5.5.1 Joint deflection
The values of deflections for different diameters of pile for perpendicular wave
direction are summarized and presented in Tables 5.6 and 5.7.
From Tables 5.6 and 5.7 it is observed that top node deflection is maximum in front row
side of the pile and it decreases as it moves back side pile for both 1m and 1.2m diameter
pile because when wave hits the front side pile its energy gets dissipated and the piles
which are in-line at back side will get less wave energy.

Chapter 5 Wave Response Analysis
Response analysis of berthing structures for wave and earthquake induced forces including soil-structure interaction
PhD Thesis,NITK Surathkal,INDIA,2013
86
Table 5.6 Maximum joint deflection for 1 m diameter pile
Pile Joint
No.
Max. Top Node
Deflection
(cm)
34,35,38,40,50 1.84
6,14,22,30,46 1.73
2,10,18,26,41 1.61
Table 5.7 Maximum joint deflection for 1.2 m diameter pile
Pile Joint
No.
Max. Top Node
Deflection
(cm)
34,35,38,40,50 1.11
6,14,22,30,46 1.05
2,10,18,26,41 0.99
It decreases from 10% to 12% for both diameter piles. The maximum top joint
deflection is 1.84 cm for 1m diameter pile. It is observed that deflection decreases as the
diameter increases and it decreases about 39.67 % when compared to the smaller
diameter as it depends on stiffness of the structure. One typical variation of joint No 18 is
shown in Fig 5.6
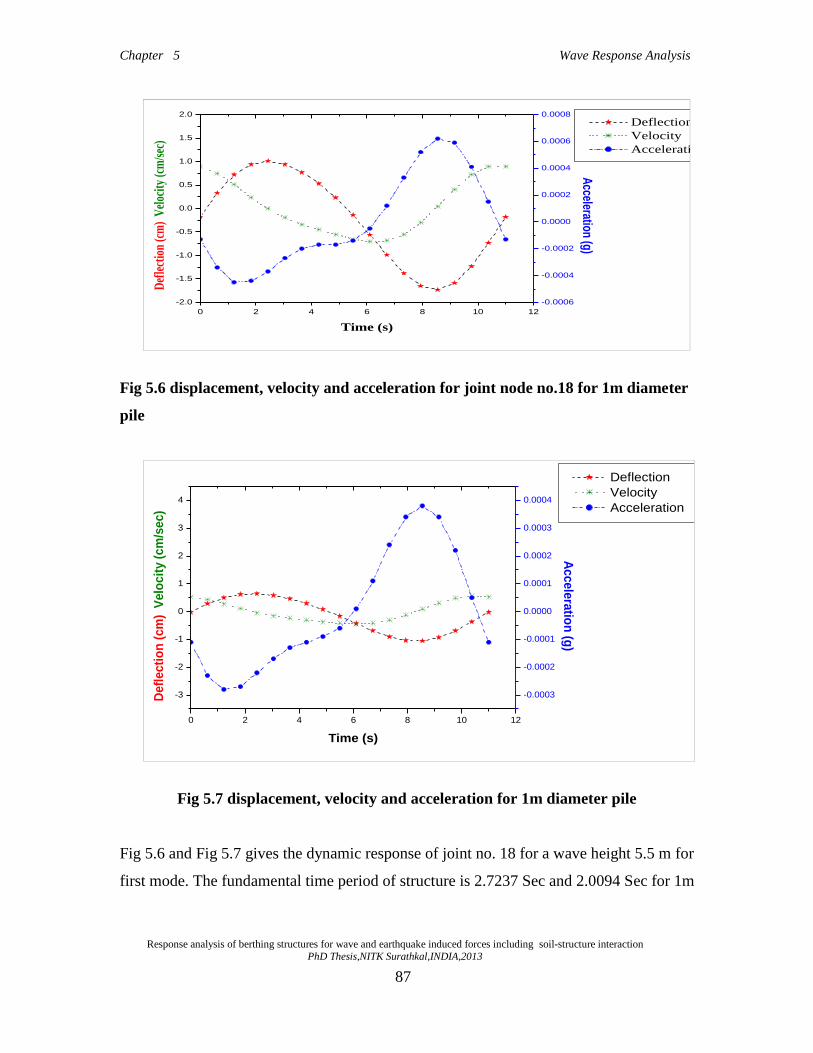
Chapter 5 Wave Response Analysis
Response analysis of berthing structures for wave and earthquake induced forces including soil-structure interaction
PhD Thesis,NITK Surathkal,INDIA,2013
87
0 2 4 6 8 10 12
-2.0
-1.5
-1.0
-0.5
0.0
0.5
1.0
1.5
2.0
Deflection
Velocity
Acceleration
Time (s)
Def
lect
ion
(cm
) V
eloc
ity
(cm
/sec
)
-0.0006
-0.0004
-0.0002
0.0000
0.0002
0.0004
0.0006
0.0008
Acceleration (g)
Fig 5.6 displacement, velocity and acceleration for joint node no.18 for 1m diameter
pile
0 2 4 6 8 10 12
-3
-2
-1
0
1
2
3
4
Deflection
Velocity
Acceleration
Time (s)
Defl
ecti
on
(cm
) V
elo
cit
y (
cm
/sec)
-0.0003
-0.0002
-0.0001
0.0000
0.0001
0.0002
0.0003
0.0004
Accele
ratio
n (g
)
Fig 5.7 displacement, velocity and acceleration for 1m diameter pile
Fig 5.6 and Fig 5.7 gives the dynamic response of joint no. 18 for a wave height 5.5 m for
first mode. The fundamental time period of structure is 2.7237 Sec and 2.0094 Sec for 1m

Chapter 5 Wave Response Analysis
Response analysis of berthing structures for wave and earthquake induced forces including soil-structure interaction
PhD Thesis,NITK Surathkal,INDIA,2013
88
and 1.2m diameter pile. So there is no chance of resonance. We can observe that there is
a phase difference of 900 between displacement and velocity and 180
o between structural
displacement and acceleration.
5.6 Static and dynamic response for wave loading
Table 5.8 to Table 5.11 shows the forces and moments during the wave cycle for
maximum wave height. Peak dynamic response for each loading is compared to its static
response. The ratio of dynamic to static response is called Dynamic Amplification Factor
(DAF). This factor is calculated by comparing static and dynamic modal analysis results
of wave action.

Chapter 5 Wave Response Analysis
Response analysis of berthing structures for wave and earthquake induced forces including soil-structure interaction
PhD Thesis,NITK Surathkal,INDIA,2013
89
Table 5.8 Modal static response for maximum wave height 5.5 m and period 11 sec
for 1 m dia pile.
Time
Step
FORCE MOMENT RESULTANT
X Y Z Mx My Mz Shear
Force
Overturning
Moment (Sec) /--------------kN-------------------/ /----------------kN-m--------------/
(kN) (kN-m)
0 211.09 -34.45 -61.17 -437.87 5879.62 -3362.88 213.88 5895.9
0.6111 183.36 78.75 -45.67 -2939.59 5034.01 -1887.03 199.55 5829.45
1.2222 167.06 165.07 -27.95 -4721.88 4452.53 -1135.13 234.86 6490.08
1.8333 149.85 216.25 -12.97 -5683.5 3875.12 -586.95 263.09 6878.86
2.4444 133.13 231.74 -0.65 -5809.36 3336.06 -540.55 267.26 6699.1
3.0556 129.87 216.21 11.73 -5157.78 3132.87 -637.07 252.21 6034.7
3.6667 135.52 175.85 25.39 -3858.43 3140.31 -919.19 222.01 4974.84
4.2778 136.93 115.67 38.28 -2079.53 3049.06 -1468.99 179.25 3690.69
4.8889 137.2 38.79 47.1 30.61 2969.36 -2208.82 142.58 2969.51
5.5 144.8 -52 50.33 2369.74 3127.64 -3472.25 153.85 3924
6.1111 157.8 -151.51 48.97 4829.54 3466.21 -5132.51 218.77 5944.66
6.7222 175.58 -250.13 44.21 7194.6 3957.54 -6735.72 305.6 8211.24
7.3333 202.15 -333.82 34.96 9091.03 4712.92 -8377.32 390.26 10240.04
7.9444 231.66 -386.84 18.46 10066.3 5612.95 -9474.45 450.9 11525.44
8.5556 252.94 -396.28 -6.07 9781.29 6385.8 -9646.01 470.13 11681.27
9.1667 264.58 -356.67 -34.15 8194.16 6952.43 -8999.03 444.09 10746.19
9.7778 264.9 -272.65 -56.99 5607.75 7184.41 -7652.77 380.14 9113.87
10.3889 245.2 -158.49 -66.62 2548.26 6786.4 -5646.78 291.97 7249.05
11 211.09 -34.45 -61.17 -437.87 5879.62 -3362.87 213.88 5895.9

Chapter 5 Wave Response Analysis
Response analysis of berthing structures for wave and earthquake induced forces including soil-structure interaction
PhD Thesis,NITK Surathkal,INDIA,2013
90
Table 5.9 Modal dynamic response for maximum wave height 5.5 m and period
11 sec for 1 m dia pile.
Time
Step
FORCE MOMENT RESULTANT
X Y Z Mx My Mz Shear Overturning
Sec /--------------kN-------------------/ /----------------kN-m--------------/ Force Moment
kN kN-m
0 221.21 -43.94 -61.22 -201.82 6133.36 -3673.8 225.54 6136.68
0.6111 173.66 81.55 -45.75 -3011.3 4792.19 -1272.6 191.85 5659.75
1.2222 152.13 176.85 -28.01 -5018 4079.59 -610.67 233.28 6467.11
1.8333 157.61 232.43 -13.03 -6089.4 4069.61 -897.76 280.82 7324.06
2.4444 149.24 248.49 -0.7 -6229.3 3739.33 -550.43 289.86 7265.48
3.0556 119.16 231.79 11.67 -5548.7 2865.76 -274.63 260.62 6245.03
3.6667 113.54 190.7 25.33 -4231.1 2591.15 -600.27 221.94 4961.44
4.2778 142.88 131.26 38.23 -2470.3 3198.38 -1295.9 194.02 4041.3
4.8889 156.59 55.92 47.08 -398.22 3454.51 -2237 166.28 3477.39
5.5 138.37 -34.55 50.33 1933.3 2966.78 -3170.5 142.62 3541.11
6.1111 135.09 -137.23 48.99 4472.57 2897.91 -4507.5 192.56 5329.33
6.7222 169.17 -243.7 44.24 7034.4 3796.93 -6569 296.66 7993.72
7.3333 208.36 -339.18 35.02 9226.35 4867.6 -8526.7 398.07 10431.63
7.9444 231.22 -405.23 18.55 10528.2 5600.78 -9796.7 466.55 11925.23
8.5556 249.68 -425.19 -5.95 10506.9 6302.95 -10085 493.08 12252.44
9.1667 268.64 -390.3 -34.03 9037.69 7052.69 -9410.5 473.81 11463.87
9.7778 276 -303.68 -56.92 6385.31 7461.39 -8135.9 410.36 9820.62
10.3889 261.11 -180.51 -66.63 3098.73 7184.31 -6268.7 317.43 7824.09
11 221.21 -43.94 -61.22 -201.83 6133.36 -3673.8 225.53 6136.68

Chapter 5 Wave Response Analysis
Response analysis of berthing structures for wave and earthquake induced forces including soil-structure interaction
PhD Thesis,NITK Surathkal,INDIA,2013
91
Table 5.10 Modal static response for maximum wave height 5.5 m and period
11 sec for 1.2 m dia pile.
Time
Step
FORCE MOMENT RESULTANT
X Y Z Mx My Mz Shear
Force
Overturning
Moment Sec /--------------kN----------------/ /----------------kN-m---------------/
kN kN-m
0.0000 257.50 -3.85 -76.38 -1529.04 7190.46 -3696.19 257.52 7351.23
0.6111 216.15 139.85 -54.04 -4647.88 5937.08 -1453.23 257.45 7540.01
1.2222 186.07 244.64 -30.02 -6757.81 4948.93 -381.26 307.36 8376.15
1.8333 172.87 301.43 -10.74 -7768.06 4429.69 -126.23 347.49 8942.3
2.4444 165.01 311.13 4.34 -7689.77 4085.07 -431.17 352.18 8707.48
3.0556 157.26 280.88 19.26 -6615.59 3744.82 -693.06 321.91 7601.95
3.6667 157.75 219.35 35.96 -4721.34 3593.29 -1116.17 270.18 5933.19
4.2778 165.43 133.3 51.8 -2231.83 3630.11 -1853.11 212.45 4261.31
4.8889 170.06 27.09 62.28 647.7 3643.05 -2952.32 172.2 3700.18
5.5 175.67 -95.01 65.19 3763.67 3754.8 -4536.01 199.71 5316.37
6.1111 193.96 -225.38 61.72 6950.68 4246.43 -6710.8 297.35 8145.19
6.7222 221.69 -350.6 53.6 9909.84 5019.97 -8904.55 414.81 11108.78
7.3333 250.32 -452.03 39.79 12153.04 5871.36 -10755.7 516.71 13497.01
7.9444 282.21 -509.68 17.22 13114.5 6890.58 -11936.8 582.59 14814.53
8.5556 314.89 -508.26 -14.68 12400.36 8021.11 -12154.2 597.9 14768.45
9.1667 331.51 -442.95 -49.87 10017.97 8782.04 -11327.5 553.27 13322.31
9.7778 322.92 -322.28 -77.08 6420.56 8834.08 -9021.38 456.23 10920.83
10.3889 295.61 -166.81 -86.49 2331.73 8243.06 -6532.87 339.42 8566.5
11 257.5 -3.85 -76.38 -1529.05 7190.45 -3696.19 257.52 7351.23

Chapter 5 Wave Response Analysis
Response analysis of berthing structures for wave and earthquake induced forces including soil-structure interaction
PhD Thesis,NITK Surathkal,INDIA,2013
92
Table 5.11 Modal dynamic response for maximum wave height 5.5 m and period
11 sec for 1.2 m dia pile.
Time FORCE MOMENT RESULTANT
Step X Y Z Mx My Mz Shear Overturning
Sec /--------------kN----------------/ /----------------kN-m---------------/ Force Moment
kN kN-m
0.00 264.35 -12.35 -76.45 -1318.07 7362.66 -4156.67 264.64 7479.71
0.6111 220.32 140.05 -54.13 -4654.87 6042.19 -1333.29 261.06 7627.31
1.2222 178.19 251.57 -30.1 -6932.96 4752.76 -541.72 308.29 8405.63
1.8333 168.82 312.25 -10.8 -8039.86 4329.02 -185.11 354.96 9131.25
2.4444 172.12 323.37 4.28 -7997.05 4263.59 -224.92 366.32 9062.61
3.0556 156.82 293.32 19.2 -6928.02 3734.53 -755.42 332.61 7870.47
3.6667 148.58 232.03 35.89 -5039.78 3364.64 -877.93 275.52 6059.71
4.2778 166.61 146.79 51.75 -2570.33 3660.07 -1599.5 222.05 4472.44
4.8889 176.47 41.46 62.26 287.92 3803.56 -2992.5 181.27 3814.45
5.5 168.86 -81.02 65.2 3413.98 3584.53 -4149.42 187.29 4950.16
6.1111 183.58 -214.41 61.75 6676.9 3986.67 -6310.55 282.27 7776.54
6.7222 223.14 -345.91 53.64 9793.54 5055.71 -9010.46 411.64 11021.5
7.3333 250.82 -456.21 39.86 12259.08 5883.35 -10720.4 520.61 13597.75
7.9444 272.98 -523.37 17.33 13459.28 6658.62 -12007.5 590.28 15016.31
8.5556 314.09 -529.56 -14.55 12936 7999.66 -12473.3 615.7 15209.69
9.1667 344.04 -467.75 -49.75 10640.89 9094.21 -11753.5 580.65 13997.62
9.7778 330.19 -345.48 -77.02 7002.34 9015.13 -9672.74 477.89 11415.13
10.3889 296.88 -183.93 -86.5 2759.77 8275.03 -6413.92 349.24 8723.1
11 264.35 -12.35 -76.45 -1318.07 7362.66 -4156.66 264.64 7479.71

Chapter 5 Wave Response Analysis
Response analysis of berthing structures for wave and earthquake induced forces including soil-structure interaction
PhD Thesis,NITK Surathkal,INDIA,2013
93
We can calculate the Dynamic Amplification Factor (DAF) (STRUCAD-3D Reference
Manual 2001) for 1.0m and 1.2 diameter piles. The DAF for 1.0m diameter pile varies
from 1.02 to 1.43. The DAF for 1.2 m diameter pile varies from 1.03 to 1.53. From the
results of dynamic amplification factor it can be observed that there is an increase in
response of 43% and 53% for 1.0m and 1.2m diameter pile respectively due to wave
loading compared to static loading. The critical wave position was determined by the
maximum moment and the critical wave position is at time step 8.56sec..
0 2 4 6 8 10
0
100
200
300
400
500
600
700 Static (1m)
Dynamic (1m)
Static (1.2m)
Dynamic (1.2m)
Res
ult
an
t F
orc
e (k
N)
Time (s)
Fig 5.8 Variation of resultant forces with time

Chapter 5 Wave Response Analysis
Response analysis of berthing structures for wave and earthquake induced forces including soil-structure interaction
PhD Thesis,NITK Surathkal,INDIA,2013
94
0 2 4 6 8 10 12
2000
4000
6000
8000
10000
12000
14000
16000R
esu
ltan
t M
omen
t (k
N-m
)
Time (s)
Static (1m)
Dynamic (1m)
Static (1.2m)
Dynamic (1.2m)
Fig 5.9 Variation of resultant moment with time
Fig. 5.8 and Fig 5.9 present the variation of forces and moments for different time steps
for static and dynamic analysis. It was observed that the values of forces and moment
calculated by dynamic analysis were more than that by static analysis. Static results are 2
00o 14 % and 1 to 6 % less than dynamic analysis for 1000mm diameter and 1200mm
diameter piles respectively.
5.7 SOIL STRUCTURE INTERACTION USING SAP 2000 SOFTWARE
SAP2000 is a full-featured program that can be used for the simplest problems or the
most complex projects. SAP2000 is a linear and non-linear, static and dynamic, analysis
and design of three dimensional structures package. From its 3D object based graphical
modeling environment to the wide variety of analysis and design options completely
integrated across one powerful user interface, SAP2000 has proven to be the most
integrated, productive and practical general purpose structural program today. The
program is composed of several modules, which are easily accessible and straight
forward to use.

Chapter 5 Wave Response Analysis
Response analysis of berthing structures for wave and earthquake induced forces including soil-structure interaction
PhD Thesis,NITK Surathkal,INDIA,2013
95
Fig 5.10 Node numbering and model in SAP without soil mass
Fig 5.11 Node numbering and model of berthing structure with soil mass using SAP

Chapter 5 Wave Response Analysis
Response analysis of berthing structures for wave and earthquake induced forces including soil-structure interaction
PhD Thesis,NITK Surathkal,INDIA,2013
96
5.7.1 METHODOLOGY FOR STATIC ANALYSIS
1 Number of bays and bay width in x and y direction and total pile length are
specified.
2 Slab is modeled as 4-noded thin plate element by specifying the thickness. The
plate element has 6 degrees of freedom at each node (3 translations and 3
rotations).
3 Pile caps are modeled as plate bending element with 3 translatory and 2 rotational
degrees of freedom.
4 Piles are modeled as 2 nodded beam elements with 6 degrees of freedom at each
node (3 translations and 3 rotations).
5 Soil mass is modeled as 3D solid 8-noded brick element with 6 degrees of
freedom at each node (3 translations and 3 rotations).
6 All the loads such as dead, live, berthing, wave, mooring, current and wind forces
are calculated manually and applied on the berthing structure and analysed.
7 Maximum force, moment and top node deflections were obtained for different
load combinations on the structure.
.
5.8 CONSIDERING SOIL MASS OF SIZE 3D
Soil Mass of size 3 times the width from the centre of the structure is taken and the depth
is kept equal to 25m for all cases. Static and wave response analysis is carried out.
5.8.1 Static analysis
From static analysis including soil structure interaction forces, moments and deflections
were found for both 1000mm and 1200mm diameter piles. 4.3. Fig 6.13 shows the bore
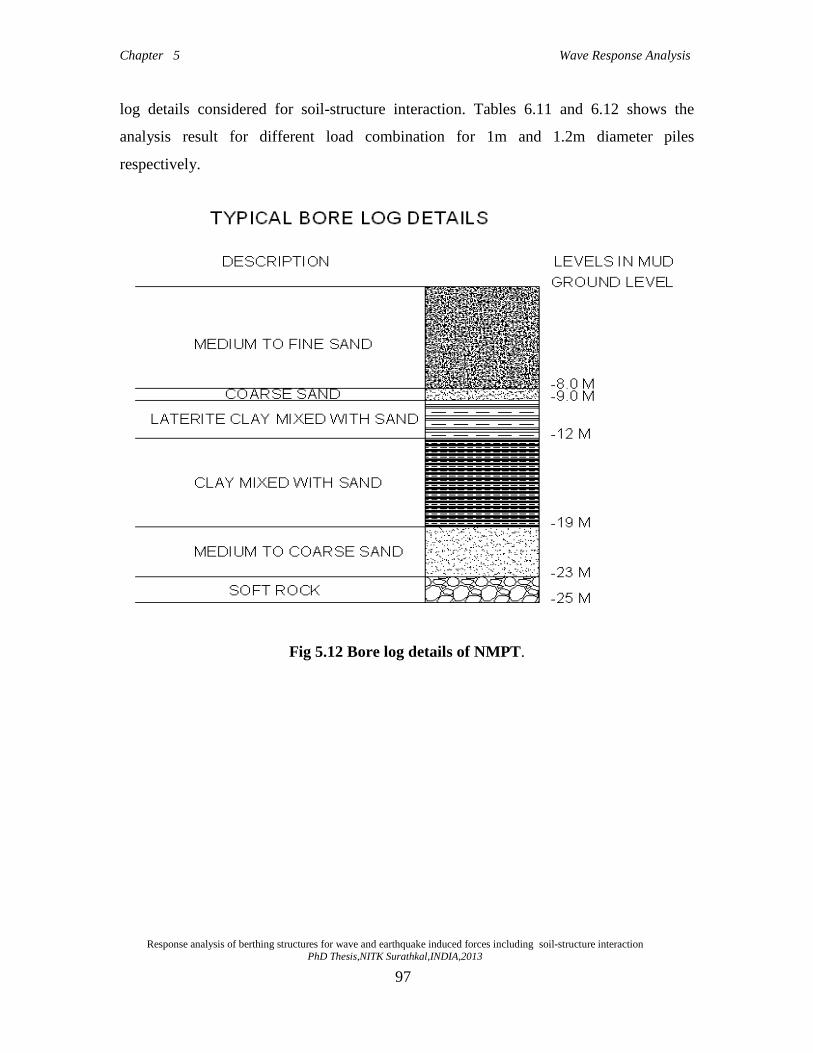
Chapter 5 Wave Response Analysis
Response analysis of berthing structures for wave and earthquake induced forces including soil-structure interaction
PhD Thesis,NITK Surathkal,INDIA,2013
97
log details considered for soil-structure interaction. Tables 6.11 and 6.12 shows the
analysis result for different load combination for 1m and 1.2m diameter piles
respectively.
Fig 5.12 Bore log details of NMPT.

Chapter 5 Wave Response Analysis
Response analysis of berthing structures for wave and earthquake induced forces including soil-structure interaction
PhD Thesis,NITK Surathkal,INDIA,2013
98
Table 5.12 force, moment and deflection for different load combination for 1m dia
pile
Load combinations Maximum
Force
kN
Maximum
Moment
kN-m
Deflection at top
of the structure
(mm)
Dead Load + Live Load +
Wave Load + Current
Load+ Berthing load
856.772
6690.746 -177.33
Dead Load + Live Load +
Wind Load+ Mooring Load
476.076 3085.772
81.22
Dead Load + Live Load +
Wave Load + Current Load
51.623 1406.16
-28.67
Table 5.13 force, moment and deflection for different load combination for 1.2m
diameter pile
Load combinations Maximum
Force
kN
Maximum
Moment
kN-m
Deflection at top
of the structure
(mm)
Dead Load + Live Load +
Wave Load + Current
Load+ Berthing load
855.319
6924.054 -88.47
Dead Load + Live Load +
Wind Load+ Mooring Load
475.277 3119.698
39.58
Dead Load + Live Load +
Wave Load + Current Load
60.901 1350.69 -16.02

Chapter 5 Wave Response Analysis
Response analysis of berthing structures for wave and earthquake induced forces including soil-structure interaction
PhD Thesis,NITK Surathkal,INDIA,2013
99
The total wave force is given by the summation of drag component and inertia
component. Both these forces depend on diameter of the pile. Hence from the Tables 5.12
and 5.13 we can observe that the forces and moment are maximum for larger diameter
pile compared to smaller diameter pile. It was also observed that top deflection of the
structure for smaller diameter is more compared to the larger diameter i.e., there is an
increase of 50 % for smaller diameter piles due to less stiffness.
The maximum top joint deflection is 28.68 mm for 1.0m diameter pile and that of 1.2m
diameter pile was found to be 16.08mm. It was observed that deflection decreases as the
diameter increases and it decreases about 44.10 % when compared to the smaller
diameter as it depends on stiffness of the structure.
5.9 CONSIDERING SOIL MASS OF SIZE 4D
Tables 5.14 and 5.15 shows the Static analysis result for different load combination for
1.0m and 1.2m diameter piles respectively.
Table 5.14 force, moment and deflection for different load combination for 1m dia
pile
Load combinations Maximum
Force
kN
Maximum
Moment
kN-m
Deflection at top
of the structure
(mm)
Dead Load + Live Load +
Wave Load + Current
Load+ Berthing load
1672.661
22998.62 -46.45
Dead Load + Live Load +
Wind Load+ Mooring Load
1128.269 14886.53
21.61
Dead Load + Live Load +
Wave Load + Current Load
1367.383 16961.33 -6.90

Chapter 5 Wave Response Analysis
Response analysis of berthing structures for wave and earthquake induced forces including soil-structure interaction
PhD Thesis,NITK Surathkal,INDIA,2013
100
Table 5.15 force, moment and deflection for different load combination for 1.2m dia
pile
Load combinations Maximum
Force
kN
Maximum
Moment
kN-m
Deflection at top
of the structure
(mm)
Dead Load + Live Load +
Wave Load + Current
Load+ Berthing load
1766.32
22345.27 -25.20
Dead Load + Live Load +
Wind Load+ Mooring Load
1127.25 13672.23
11.46
Dead Load + Live Load +
Wave Load + Current Load
1443.46 15464.89 -4.21
5.9.1 Joint deflection from wave response analysis
The values of deflections for different diameters of pile for perpendicular wave
direction The maximum top joint deflection is 6.91 cm for 1.0m diameter pile and
4.02mm for 1.2m diameter piles.. It is observed that deflection decreases as the diameter
increases and it decreases about 38.92 % when compared to the smaller diameter as it
depends on stiffness of the structure. By taking 5D there is no difference in responses .So
the optimum soil mass to resist wave forces will be 3D
5.10 SUMMARY AND CONCLUSIONS
Berthing structures are the facilities constructed in ports for berthing and mooring of
vessels, for loading and unloading of cargo and for embarkment and disembarkment of

Chapter 5 Wave Response Analysis
Response analysis of berthing structures for wave and earthquake induced forces including soil-structure interaction
PhD Thesis,NITK Surathkal,INDIA,2013
101
passengers or vehicles. The berthing structures are designed for dead load, live load,
berthing force, mooring force, earthquake load and other environmental loading due to
winds, waves, currents etc,. In the present study layout of jetty for berthing 200000 DWT
ship at NMPT is modeled using the ship dimensions from IS code and analyzed for the
available environmental data from NMPT using StruCAD*3D software. The detailed
analysis of the berthing structure for the maximum wave height of 5.5m for a period 11
secs was carried out for a full cycle of wave and the variation of deflection, forces and
moments for perpendicular wave directions and different pile diameters is done by static
and dynamic methods. Dynamic Amplification Factor was calculated by comparing
static and dynamic analysis results.
The following conclusions were drawn.
1. The wave force acting on a berthing structure depends on the diameter of piles.
The total wave force is given by the summation of drag component and inertia
component. The drag force depends on the square of the fluid particle velocity
and introduces nonlinearity to the excitation force. The higher order terms in the
dynamic analysis occur not only because of the velocity-squared term but also due
to higher order wave theory, variable submergence of elements near the water
surface, etc.
2. It is seen that maximum force and maximum moment for 1m diameter pile is
853.02 kN and 11485.81 kN-m and for 1.2 m diameter pile is 1184.95 kN and
14646.55 kN-m at a phase angle of 2800 i.e., perpendicular to the structure. It is
seen that the force and moment for 1.2m diameter pile is 23 percent more than the
1m diameter pile.
3. It is seen that top joint deflection is maximum in front row side of the pile and it
decreases as it moves back side pile for both 1m and 1.2m diameter pile. And it
decreases from 10% to 12% for both diameter piles. The maximum top joint
deflection is 1.84 cm for 1m diameter pile. It is observed that deflection decreases

Chapter 5 Wave Response Analysis
Response analysis of berthing structures for wave and earthquake induced forces including soil-structure interaction
PhD Thesis,NITK Surathkal,INDIA,2013
102
as the diameter increases and it decreases about 39.67 % when compared to the
smaller diameter.
4. It is seen that the values of forces and moment calculated by dynamic analysis are
more than that by static analysis. Static results are 2 to 14 % and 1 to 6 % less
than dynamic analysis method for 1m diameter and 1.2m diameter piles
respectively.
5. The Dynamic Amplification Factor (DAF) is calculated from static and dynamic
results. The DAF for 1m diameter pile varies from 1.02 to 1.43 and for 1.2 m
diameter pile varies from 1.03 to 1.53. From Dynamic Amplification Factor it is
seen that there is increase in response of 43% and 53% for 1m and 1.2m diameter
pile respectively due to wave loading compared to static loading.

Response analysis of berthing structures for wave and earthquake induced forces including soil-structure interaction
PhD Thesis, NITK Surathkal, INDIA, 2013
103
CHAPTER 6
EARTHQUAKE RESPONSE ANALYSIS
6.1 GENERAL
Recent earthquake disasters have revealed the importance of countermeasures against soil
liquefaction in seismic design. In particular, even the backfill soil with gravel that does
not supposed to be liquefied at the 1995 Hyogoken Nanbu earthquake (Kobe earthquake).
This new type of liquefaction gave great impact in the seismic design. Many researchers
have elucidated the behavior of soil liquefaction and developed the simulation method.
As a result, some computer programs evaluate the behavior. In order to estimate
accurately the dynamic behavior of pile supported structure, not only the super structure
but also piles and soil nonlinearity must be considered.
The first step in any seismic analysis is the definition of the seismic input. In this study,
the seismic input for structure was defined in terms of an accelerogram applied at the
base of the structures. An accelerogram basically the time history of the acceleration
experienced by the ground in a given direction during a seismic event. There are varies
methods of scaling accelerograms but the scaling procedure which is commonly in use is
scaling in terms of the amplitude. This is found to be a, good practice as the frequency
content of the time history is not altered. We need to input the accelerogram as a generic
function defined in SAP starting from a TXT file. Once the structural model under
investigation has been created, selection from the main bar for time histories was done by
clicking on display graph, we can visualize the wave form. The seismic input is the
classical El Centro earthquake recorded in Imperial valley, California, on 15 October
1940, Kobe earthquake of 1995 and North ridge earthquake of 1994.
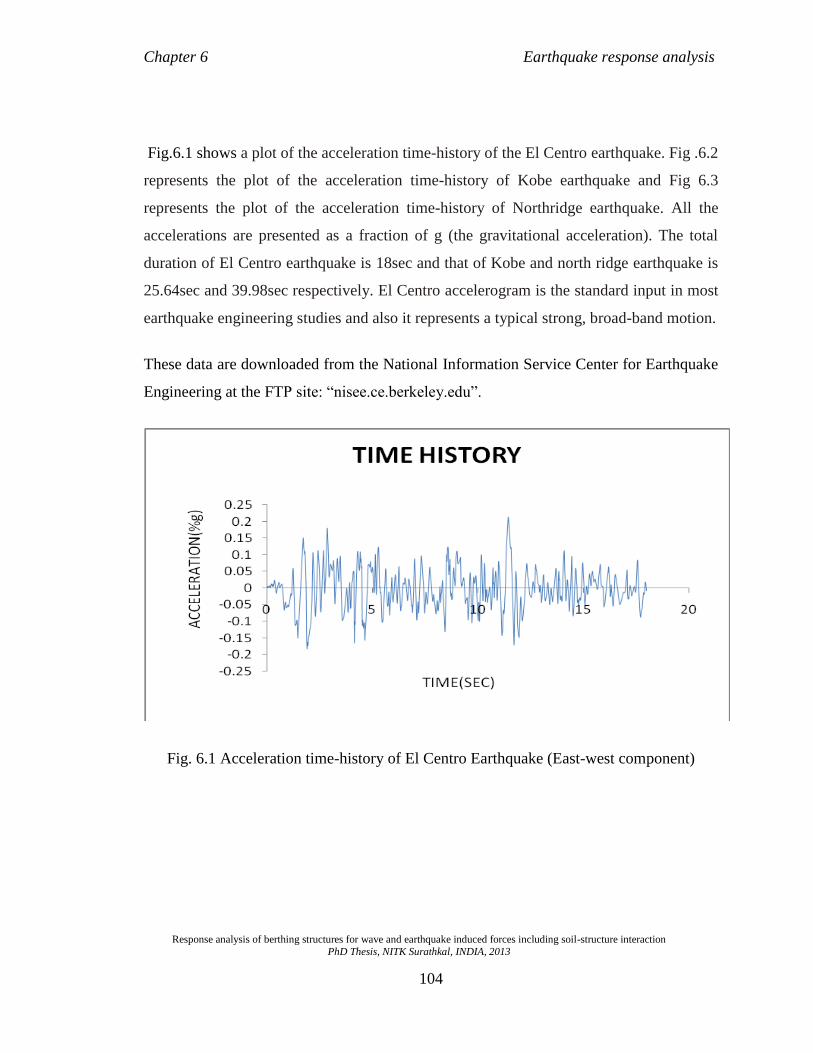
Chapter 6 Earthquake response analysis
Response analysis of berthing structures for wave and earthquake induced forces including soil-structure interaction
PhD Thesis, NITK Surathkal, INDIA, 2013
104
Fig.6.1 shows a plot of the acceleration time-history of the El Centro earthquake. Fig .6.2
represents the plot of the acceleration time-history of Kobe earthquake and Fig 6.3
represents the plot of the acceleration time-history of Northridge earthquake. All the
accelerations are presented as a fraction of g (the gravitational acceleration). The total
duration of El Centro earthquake is 18sec and that of Kobe and north ridge earthquake is
25.64sec and 39.98sec respectively. El Centro accelerogram is the standard input in most
earthquake engineering studies and also it represents a typical strong, broad-band motion.
These data are downloaded from the National Information Service Center for Earthquake
Engineering at the FTP site: “nisee.ce.berkeley.edu”.
Fig. 6.1 Acceleration time-history of El Centro Earthquake (East-west component)
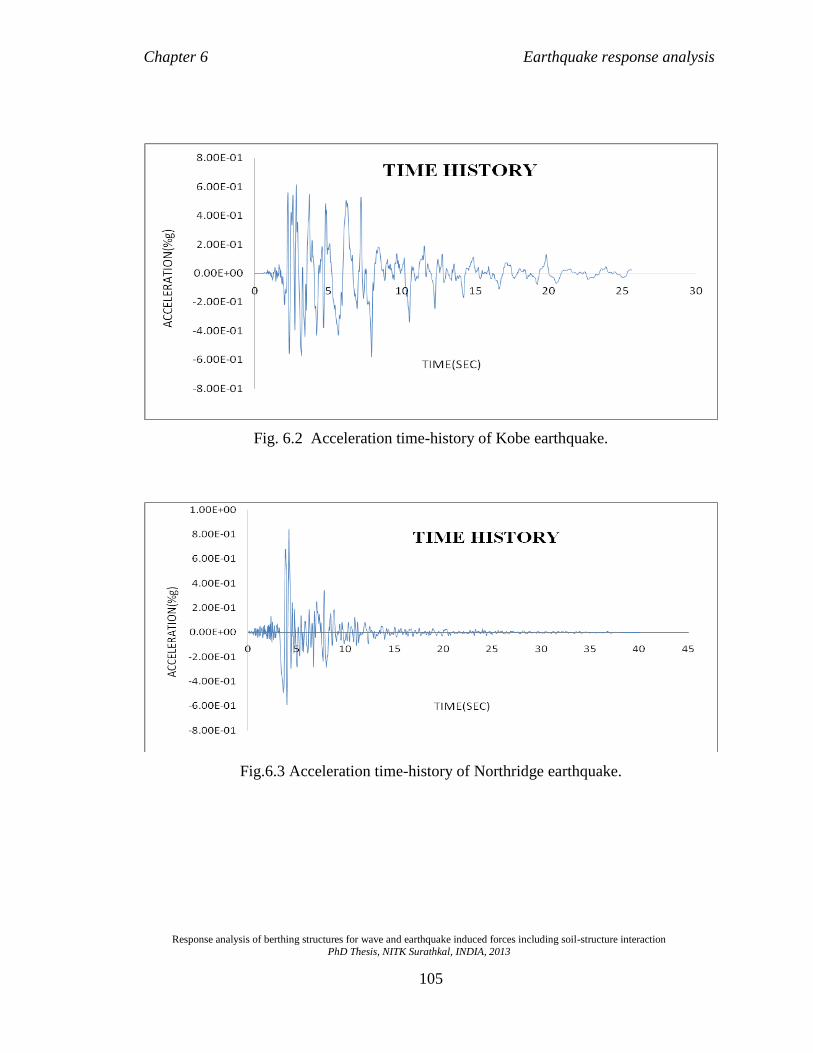
Chapter 6 Earthquake response analysis
Response analysis of berthing structures for wave and earthquake induced forces including soil-structure interaction
PhD Thesis, NITK Surathkal, INDIA, 2013
105
Fig. 6.2 Acceleration time-history of Kobe earthquake.
Fig.6.3 Acceleration time-history of Northridge earthquake.

Chapter 6 Earthquake response analysis
Response analysis of berthing structures for wave and earthquake induced forces including soil-structure interaction
PhD Thesis, NITK Surathkal, INDIA, 2013
106
6.2 RESPONSE OF THE STRUCTURE FOR EARTHQUAKE WITHOUT
SOIL -STRUCTURE INTERACTION
The displacement response of a structure to a particular earthquake motion depends on
damping and natural periods. In the analysis assumed a constant damping of 5% (IS 1893
(Part1):2002).Wave forms generated in SAP software were shown in Fig 6.4 for 1.0m
diameter pile and for pile diameter 1.2m displacement wave forms for El centro
earthquake is shown in Fig 6.5. It was observed that the maximum deflection of 21.1mm
and 13.4mm occurred for El Centro earthquake at a time step of 6.98sec and 10.18sec for
1.0m and 1.2m diameter pile respectively. We can observe from Fig. 6.6 and Fig. 6.7 the
maximum deflection of 87.77mm and 61.9mm occurred for Kobe earthquake at a time
step of 10.96sec. The maximum deflection of 76.1mm and 58.7mm occurred for North
ridge earthquake at a time step of 8.66 sec and 5.60 sec for 1.0m and 1.2m diameter pile
respectively, which can be seen from Fig.6.8 and Fig 6.9.
Fig. 6.4 Displacement of 1.0 m dia pile. Fig. 6.5 Displacement of 1.20 m dia pile for El Centro

Chapter 6 Earthquake response analysis
Response analysis of berthing structures for wave and earthquake induced forces including soil-structure interaction
PhD Thesis, NITK Surathkal, INDIA, 2013
107
Fig. 6.6 displacement of 1.0 m dia pile. Fig. 6.7 displacement of 1.20 m dia pile for kobe
earthquake
Fig. 6.8 displacement of 1.0 m dia pile. Fig. 6.9 displacement of 1.20 m dia pile for Northridge
earthquake
The difference in the displacement for 1.0m and 1.2m pile was due to varying natural
periods. Also from the above results we can conclude that longer the natural period
greater is the peak deformation. The maximum deformation for 1.2m pile is delayed
compared to 1m pile due to larger stiffness and larger mass.
6.3 RESPONSE OF THE STRUCTURE WITH SOIL-STRUCTURE
INTERACTION FOR WIDTH OF 3D
In this study, the seismic input for structure was defined in terms of an accelerogram
applied at the base of the structure.

Chapter 6 Earthquake response analysis
Response analysis of berthing structures for wave and earthquake induced forces including soil-structure interaction
PhD Thesis, NITK Surathkal, INDIA, 2013
108
The seismic input is the classical El Centro earthquake recorded in Imperial valley,
California, on 15 October 1940, Kobe earthquake of 1995 and North ridge earthquake of
1994. All the accelerations were presented as a fraction of g (the gravitational
acceleration).
Fig 6.10 Deflection time-history for 1.0 m. Fig 6.11 Deflection time-history for 1.2m for
El Centro Earthquake
Fig. 6.12 Displacement of 1.0 m dia pile Fig 6.13 Displacement of 1.2 m pile for Kobe
Earthquake

Chapter 6 Earthquake response analysis
Response analysis of berthing structures for wave and earthquake induced forces including soil-structure interaction
PhD Thesis, NITK Surathkal, INDIA, 2013
109
Fig. 6.14 Displacement of 1.0 m dia pile Fig 6.15 Displacement of 1.2 m pile
for Northridge Earthquake
It was observed from Fig.6.10 toFig.6.15 that the maximum deflection of 57.0mm and
49.2mm occurred for El Centro earthquake at a time step of 9.10sec and 13.98sec for
1.0m and 1.2m diameter pile respectively. The maximum deflection of 46.5mm and
49.2mm occurred for Kobe earthquake at a time step of 6.31sec and 6.30sec for 1.0m and
1.2m diameter pile respectively. Deflection of 51.4mm and 53.2mm occurred for North
ridge earthquake at a time step of 4.22sec and 4.21sec for 1.0m and 1.2m diameter pile
respectively.
6.4 RESPONSE OF THE STRUCTURE WITH SOIL-STRUCTURE
INTERACTION FOR WIDTH OF 4D

Chapter 6 Earthquake response analysis
Response analysis of berthing structures for wave and earthquake induced forces including soil-structure interaction
PhD Thesis, NITK Surathkal, INDIA, 2013
110
Fig. 6.16 Displacement of 1.0 m dia pile Fig 6.17 Displacement of 1.2 m pile for El
centro Earthquake
Fig. 6.18 Displacement of 1.0 m dia pile Fig 6.19 Displacement of 1.2 m pile for
Kobe Earthquake

Chapter 6 Earthquake response analysis
Response analysis of berthing structures for wave and earthquake induced forces including soil-structure interaction
PhD Thesis, NITK Surathkal, INDIA, 2013
111
.
Fig 6.20 Displacement of 1.0 m dia pile. Fig 6.21 Displacement of 1.2 m pile for
Northridge earthquake
The deflection response of a structure to a particular earthquake motion depends on
damping and natural periods. From Fig.6.16 to Fig.6.21 it is observed that the maximum
deflection of 37.7mm and 32.1 mm occurred for El Centro earthquake at a time step of
5.26sec and 4.74sec for 1.0m and 1.2m diameter pile respectively. The maximum
deflection of 89.8mm and 12.73mm occurred for Kobe earthquake at a time step of
8.70sec and 11.05sec for 1.0m and 1.2m diameter pile respectively. It is also observed
that the maximum deflection of 85.3mm and 11.43 mm occurred for Northridge
earthquake at a time step of 6.84 sec and 8.74 sec for 1.0m and 1.2m diameter pile
respectively. We can notice that the difference in the deformation was due to varying
natural periods. Also from the above results we can conclude that longer the natural
period greater is the peak deformation.

Chapter 6 Earthquake response analysis
Response analysis of berthing structures for wave and earthquake induced forces including soil-structure interaction
PhD Thesis, NITK Surathkal, INDIA, 2013
112
6.5 CONCLUSIONS
Static analysis is needed before performing dynamic analysis to define deformations
generated by time history. From time history analysis it is seen that the maximum
deflection of 34.427 cm and 20.974 cm occurred at a time step of 7.04 sec and 10.1sec
for 1 m and 1.2 m diameter pile respectively. We can notice that the larger difference in
the deformation for 1m and 1.2m pile is due to varying natural time periods.
Longer the natural period greater is the peak deformation. The maximum deformation for
1.2m pile is delayed compared to 1m pile due to larger stiffness and larger mass.
At the beginning of the earthquake with greater acceleration applied recorded
deformation has smaller values shows the energy absorbance and damping. After that
recorded deformations illustrates acceleration amplification in soil.
Even though the soil structure interaction increases damping, this causes the additional
displacement to the overall structure. It was observed that from the displacement wave
forms for El Centro earthquake, maximum deflection of 21.1mm and 13.4mm occurred
for at a time step of 6.98sec and 10.18sec for 1.0m and 1.2m diameter pile without soil
structure interaction. Taking soil structure interaction into account it was observed the
maximum deflection of 57.0mm and 49.2mm occurred for El Centro earthquake at a time
step of 9.10sec and 13.98sec for 1.0m and 1.2m diameter pile respectively.
Response analysis of berthing structures for wave and earthquake induced forces including soil-structure interaction
PhD Thesis, NITK Surathkal, INDIA, 2013
113
CHAPTER 7
SUMMARY & CONCLUSIONS
7.1 SUMMARY
Berthing structures are the facilities constructed in ports for berthing and mooring of
vessels, for loading and unloading of cargo and for embarkment and disembarkment
of passengers or vehicles. The berthing structures are designed for dead load, live
load, berthing force, mooring force, earthquake load and other environmental loading
due to wind, waves, currents etc. In the present study layout of jetty for berthing
200000 DWT ship at NMPT was modeled using the software SAP 2000 and
StruCAD*3D. Simple experiment was conducted on a single cylinder to know the
forces and moments. These forces and moments were compared with the theoretical
model of Morrison’s equation. Experiment was conducted on a small scale model of
berthing structure and the detailed analysis of the berthing structure was done without
considering soil structure interaction and with considering soil structure interaction.
The maximum wave height of 5.5 m for a period 11 sec was taken for the analysis.
For a full cycle of wave the variation of deflection, forces and moments for
perpendicular wave directions and different pile diameters was done by Static and
Dynamic methods. Dynamic Amplification Factor was calculated by comparing static
and dynamic analysis results. Time history analysis was also done for three different
earthquake motions with the combination of the wave loading and deflection of the
structure was found out.
The wave force acting on a berthing structure depends on the diameter of piles. The
total wave force is given by the summation of drag component and inertia component.
The drag force depends on the square of the fluid particle velocity and introduces
nonlinearity to the excitation force. The higher order terms in the dynamic analysis

Chapter 7 Summary and Conclusions
Response analysis of berthing structures for wave and earthquake induced forces including soil-structure interaction
PhD Thesis, NITK Surathkal, INDIA, 2013
114
occur not only because of the velocity-squared term but also due to higher order wave
theory, variable submergence of elements near the water surface, etc.
7.2 CONCLUSIONS
It is seen that maximum force and maximum moment for 1m diameter pile are
853.02 kN and 11485.81 kN-m respectively and for 1.2 m diameter pile are
1184.95 kN and 14646.55 kN-m respectively at a phase angle of 2800 i.e.,
perpendicular to the structure. It is seen that the force and moment for 1.2m
diameter pile are 23 percent more than the 1m diameter pile without
considering soil structure interaction.
It is seen that top joint deflection is maximum in front row side of the pile
and it decreases as it moves back side pile for both 1m and 1.2m diameter pile.
And it decreases from 10% to 12% for both diameter piles. The maximum top
joint deflection is 1.84 cm for 1m diameter pile. It is observed that deflection
decreases as the diameter increases and it decreases about 39.67 % when
compared to the smaller diameter without considering soil structure interaction
It is observed that the values of forces and moments calculated without
considering SSI by dynamic analysis are more than that by static analysis.
Static results are 2 to 14 % and 1 to 6 % less than dynamic analysis method for
1m diameter and 1.2m diameter piles respectively.
The Dynamic Amplification Factor (DAF) is calculated from static and
dynamic results. The DAF for 1m diameter pile varies from 1.02 to 1.43 and
for 1.2 m diameter pile. DAF varies from 1.03 to 1.53. From Dynamic
Amplification Factor it is seen that there is increase in response of 43% and
53% for 1m and 1.2m diameter pile respectively due to wave loading
compared to static loading.
From time-history analysis, it is observed that the maximum deflection of 2.11
cm occurred for El Centro earthquake at a time step of 6.98 sec for 1m
diameter pile. Maximum deflection of 8.77 cm occurred for Kobe earthquake
at a time step of 10.96 sec for 1 m diameter pile and 7.61 cm occurred for
Chapter 7 Summary and Conclusions
Response analysis of berthing structures for wave and earthquake induced forces including soil-structure interaction
PhD Thesis, NITK Surathkal, INDIA, 2013
115
North ridge earthquake at a time step of 8.66 sec for 1 m diameter pile without
considering SSI.
From time-history analysis for soil mass of size 3D, it is observed that the
maximum deflection of 57mm occurred for El Centro earthquake at a time
step of 9.10sec for 1 m diameter pile. Maximum deflection of 49.2mm
occurred for Kobe earthquake at a time step of 6.30 sec for 1.2 m diameter pile
and 53.2mm occurred for Northridge earthquake at a time step of 4.22 sec for
1.2 m diameter pile.
From time-history analysis for soil mass of size 4D and 5D it is observed that
the maximum deflection was almost same and there is no much variation in
the deflection criteria .
When soil-structure interaction effects are included, the natural period of the
structure will increase.
As we increase the width and length of the soil mass the deflection of the
structure decreases.
Deflection of the structure is less when analysed without considering soil mass
and it is more when analysed by considering soil structure interaction.
Therefore it is very important to consider soil-structure interaction in dynamic
analysis.
The natural frequency of the experimental model fairly agreed with the FEM
model.
Inclusion of water and the soil tend to increase the natural frequency of the
structure.
The response at the top of the vertical cylinder is slightly lesser than the
applied frequency at the base. This may be due to damping effect of the
structure. Further inclusion of soil and water along with vertical member tends
to reduce the natural period.
The damping ratios of vertical member at different experimental conditions
are found that the damping ratio increases when structure is in water and soil.

Chapter 7 Summary and Conclusions
Response analysis of berthing structures for wave and earthquake induced forces including soil-structure interaction
PhD Thesis, NITK Surathkal, INDIA, 2013
116
7.3 SCOPE FOR FUTURE WORK
Carryout the similar studies with breaking wave interaction
Investigate with different pile sizes and for different shapes
Testing of full size models with varying soil and water depth.
In the present analysis the effect of damping provided by the fluid medium
is not considered. Taking this factor into account more rigorous analysis
can be performed.

Response analysis of berthing structures for wave and earthquake induced forces including soil-structure interaction
PhD Thesis, NITK Surathkal, INDIA,2013
118
APPENDIX I
REFERENCES
Abul-Azm A. G. and Williams A. N. (1988), “Second order diffraction loads on
truncated cylinders”, Journal of Waterways, Harbours and Coastal Engineering
Division, ASCE, vol.114, No.4, July.
Allam, M.M, Subba Rao, K.S., Subramanya, I., (1991).“Frame soil interaction and
winkler model”, Proceedings of Institution of Civil Engineers, Part 2. pp. 477–494.
Baidya, D.K., Sridharan, A. (1994). “Stiffnesses of the foundations embedded into
elastic stratum”, Indian Geotech Journal, 24(4), 353–367.
Bao-lei Geng (2010), “A time domain analysis of wave force on small scale cylinders
of offshore structures”, Journal of Marine science and technology, Vol 18, No 6,pp
875-882
Banerjee (2003). “Effect of soil– structure interaction on building frames”, Proc
Indian Geotechnical Conference, 1, 123–136.
Bernard Molin, (1979), “Second – order diffraction loads upon three dimensional
bodies”. Applied ocean Res., 1, 197-202
Bowles, J.E. (1997). “Foundation Analysis and Design”, McGraw Hill, New York.
Brown,C.B., Laurent, J.M.,Tilton,J.R., (1977). “Beam-plate system on winkler
foundation”, Journal of Engineering Mechanics, 103(4), 589–600.
Casciati, S. and Ronaldo, I., Borja (2004). “Dynamic FE analysis of South Memnon
Colossus including 3D soil–foundation–structure interaction”, Computers and
Structures, 82, 1719–1736
Appendix I References
Response analysis of berthing structures for wave and earthquake induced forces including soil-structure interaction
PhD Thesis, NITK Surathkal, INDIA, 2013
119
Chakrabarti S. K. (1972), “Nonlinear Wave Forces on a Vertical Cylinder “ Journal
of Hydraulics Division , ASCE, Vol.98.
Chakrabarti S. K., Allan L. Wolbert, William A. Tam (1976), “Wave forces on
vertical circular cylinder”, Journal of the Waterways, Harbours and Coastal
Engineering Division ASCE ,vol 119, No 3, July
Chakrabarthi, S, (2005). “Handbook of Offshore Engineering”, volume І&II,
ELSEVIER Publication.
Chakrabarti S. and Gupta A. (2007), “Steady Wave Drift Force on Basic Objects of
Symmetry”, Vol.92, WIT Press.
Chamecki,C.( 1956). “Structural rigidity in calculating settlements”, Journal of Soil
Mechanics and Foundation Engineering ,82(1), 1–19.
Chandrashekhar, A., Jayalekshmi, B.R. and Venkataramana, K. (2005). “Dynamic
soil structure interaction effects on multistoreyed RCC frame” Proceedings of the
International conference on Advances in structural dynamics and is applications,
ICASDA, 454-467.
Chen H. L., Shah S. P, and Keer L. M. (1988). “Dynamic Response Of Shallow-
buried Cylindrical Structures”, ASCE, Vol. 116, No.1, Paper No. 24266.
Christina J. Curras, Ross W. Boulanger, Bruce L. Kutter, and Daniel W. Wilson
(2001). “Dynamic experiments and analyses of a Pile-group-supported structure”,
ASCE, Vol. 127, No. 7, Paper No. 22310
Chopra, Anil K. (2001), “Dynamics of structure”. Pearson Education (Singapore)
Pte.Ltd, Indian Branch, 482, F.I.E, Patparganji.
Christopher, B. (2002). “Soil structure interaction in the time domain using half space
Green‘s function”, Soil Dynamics and Earthquake Engineering, 22, 283-295

Appendix I References
Response analysis of berthing structures for wave and earthquake induced forces including soil-structure interaction
PhD Thesis, NITK Surathkal, INDIA, 2013
120
.
Cronin Kand Galgoul Roesset J M (1981). “Effect of Nonlinear Soil Behavior on
Inelastic Seismic Response of a Structure”, International journal of Geomechanics,
36, 104-114.
Dan M.G and Roger G.G (2002). “Stochastic Finite-Element analysis of seismic Soil–
Structure Interaction”, Journal of Engineering Mechanics, 128(1), 66-77.
Dennis, R.W.and Chen (1984). “Geotechnical Earthquake Engineering Handbook”,
Mc Graw Hill, NewYork.
Desai, C.S., Abel, J.F. (1987). “Introduction to the finite element method: a numerical
method for engineering analysis”, CBS Publishers, New Delhi.
Dawson, T.H. (1989), “Offshore Structural Engineering”. Prentice Hall, New Jersey.
Dutta, S.C. and Rana Roy (1999). “A critical review on idealization and modeling for
interaction among soil–foundation–structure system”. Computers and Structures, 80,
1579-1594.
Dutta, S.C. and Rana Roy (2002). “ Dynamic analysis of soil–foundation–structure
system”. Computers and Structures, 80, 1579-1594
Eatock Taylor R and S M Hung (1987), “Second-order diffraction forces on a vertical
cylinder in regular waves”, Applied Ocean Res., 9, 19-30
Gazetas,. (1991). “Formulas and charts for impedances of surface and embedded
foundations”, Journal of Geotechnical Engineering, 117(9), 1363–81
Ghosh B and Madabhushi S.P.G. (2006). “Centrifuge modeling of seismic soil
structure interaction effects” Nuclear Engineering and Design.
GovindaRaju,L.,Ramana,G.V.,Hanumantharao.C.,Sitharam.T.G.,(2004).“Site-specific
ground response analysis”, Current Science, 87, 1354-1362.

Appendix I References
Response analysis of berthing structures for wave and earthquake induced forces including soil-structure interaction
PhD Thesis, NITK Surathkal, INDIA, 2013
121
Graham A., Clive A. Greated and Stephen H. Salter Dixon (1979), “Wave Forces on
Partially Submerged Cylinders”, Journal of the Waterways, Harbours and Coastal
Engineering Division, ASCE vol 118, No.2, Paper No. 25436
Ghosh, B., Madabhushi, S.P.G., (2003). “Effects of localized soil in homogeneity in
modifying Seismic Soil Structure Interaction”, Paper for ASCE 16th Engineering
Mechanics Conference.
Gudehus G, R.O. Cudmani, A.B. Libreros-Bertini and M.M. Buhler (2004). “In-plane
and anti-plane strong shaking of soil systems and structures” Soil Dynamics and
Earthquake Engineering, 24, 319–342.
Grue (1997), “Studies on pressure distribution around cylindrical structures”, Journal
of marine science ,pdf , pp 456-472.
Harihara Raman and Paruchuri Venkatanarasaiah (1976), “Forces due to Nomlinear
Waves on Vertical Cylinders”, Journal of the Waterways, Harbours and Coastal
Engineering Division, ASCE, vol 206, No.1, paper No. 31345.
Havelock (1955) , “Wave forces on piles-A diffraction approach”,Proceedings of the
royal society, A mathematical,physical and Engineering science.
Hetenyi, M. (1946).“Beams on elastic foundations”, University of Michigan Press,
Ann Arbor.
Hosseinzadeh, N.A. and Nateghi, F. (2004). “Shake table study of soil structure
interaction effects on seismic response of single and adjacent buildings” 13th World
Conference on Earthquake Engineering Vancouver, B.C., Canada Paper No. 1918,
165–186.
(http://peer.berkeley.edu/nga/flatfile.html) (Last accessed in 15/02/2012).

Appendix I References
Response analysis of berthing structures for wave and earthquake induced forces including soil-structure interaction
PhD Thesis, NITK Surathkal, INDIA, 2013
122
Huaren Dou and Peter M.Byrne (1996). “Dynamic Response of Single Piles and Soil-
Pile Interaction”, Geotechnical journal , No.33, pp 80-96.
IS 4651-(part II-1969, part III-1974, part IV-1989, Part V-1980), Indian Standard
Code of Practices for the Design of Port and Harbour Structures, BIS New Delhi.
IS 875 Indian Standard (1987) Code of Practice for Wind Loads, BIS New Delhi
IS 1893 Indian Standard (Draft Code) (2000) Criteria for Earthquake Design of
.Structures, BIS New Delhi.
Jaiswal (2011), “ Comparative study of fixed base and base isolated buildings using
seismic analysis” International journal of Earth science and engineering ,Vol 04, No
06spl, oct 2011, pp 520-525.
Jen-Cheng, Spyrakos, C.C. and Xu, C. (2003). “Dynamic analysis of flexible massive
strip–foundations embedded in layered soils by hybrid BEM–FEM”, Computers and
Structures, 82, 2541–2550.
Jessica Laine handrix (2003), “Dynamic analysis techniques for quantifying bridge
pier response to barge impact loads”, M.Tech Thesis, University of Florida
John W. Gaythwaite (1981) “Hydrodynamic of Offshore Structure”, Computational
Mechanics Publication.
Kameswara Rao, N.S. (1998). “Vibration analysis and foundation dynamics”,
Wheeler Publishers, Mumbai
Kawano,K.,( 1979). “Application of the finite element method for dynamic analysis
of soil structure interaction”, PhD Thesis, Kyoto University, Japan

Appendix I References
Response analysis of berthing structures for wave and earthquake induced forces including soil-structure interaction
PhD Thesis, NITK Surathkal, INDIA, 2013
123
Kenichiro Minami,Hiroshi Yokata,Tokahiro Sugano (2002), “Damage investigation
and structural analysis of piled berthing structures during 1995 Hyogoken-Nambu
earthquake”, Proceedings of the twelth international offshore and polar Engineering
conference ,Kitakyushu,Japan, May 26-31, 2002, pp 507-513.
Kim and St. Issacson (2006), “Wave Runup around Large Circular Cylinder”, Journal
of the Waterways, Harbours and Coastal Engineering Division ASCE.
Kimura, Y., (2003). “Seismic Performance evaluation on Nonlinear Dynamic soil
structure interaction systems”, Ph.D Thesis, Kagoshima University, Japan.
Kohji Tokimatsu, Hiroko Suzuki and Masayoshi Sato (2004). “Effects of inertial and
kinematic interaction on seismic behavior of pile with embedded foundation” Soil
Dynamics and Earthquake Engineering, 25, 753–762.
Kramer, S.L. (2003). “Geotechnical and Earthquake Engineering”, Pearson Education
Kutanis, M. and Elmas, M., (2001). “Non-Linear Seismic Soil-Structure Interaction
Analysis Based on the Substructure Method in the Time Domain”, Turk Journal of
Engineering and Environmental Science, 25, 617 -626.
Lappo Raymond. and keplun L.F. (1975). “Empirical evaluation of inertial soil-
structure interaction effects”, Report No. PEER-98/07.
Lei, I.K., Geng P.T. (2010). “Structures–foundation interaction analysis”, Journal of
Structural Engineering ASCE, (11), 2413–31
Malenica S. Clark P.J.,Molin B., (1995), “Wave and Current Forces on Vertical
Cylinder Free to Surge and Sway”, Applied Ocean Research 17, pp 79-90.
Mehrdad (2004). “Interaction of continuous frames and soil media”, J Structural
Engineering ASCE, (5), 13–43.

Appendix I References
Response analysis of berthing structures for wave and earthquake induced forces including soil-structure interaction
PhD Thesis, NITK Surathkal, INDIA, 2013
124
Mamoon S. M., Kaynia A. M. and Banerjee P. K., (1990) “Frequency Domain
Dynamic Analysis of Piles and Pile Groups” Journal of Engineering Mechanics, Vol.
116, No. 10., ASCE, ISSN 0733-9399/90/0010-2237 Paper No. 25114.
Mac Murdo and Madheswaran C.K. (1989). Wave Forces on Single and Group of
Cylinder in Response to Two Wave Spectra” Third National Conference on Docks
and Harbour Engineering, 6-9 Surathkal, pp 129-139.
McCamy and Fuchs, (1954), “Wave loading on structures”, Journal of marine
science, PDF, pp 234-246.
Mehrdad H.and ,Fuladgar A. (2004). “Dynamic soil-structure interaction effects on
the seismic response of asymmetric buildings”, Soil Dynamics and Earthquake
Engineering, 24, 379-388.
Milos Novak and Bahaa El Shamouby, (1984) “Evaluation of Dynamic Experiments
on Pile Group”, Vol. 110, No. 6 ASCE, Paper No. 18931.
Micheal de St. Issacson (1978), “Vertical Cylinders of Arbitrary Section in Waves”,
Journal of the Waterways, Harbours and Coastal Engineering Division ASCE
Micheal de St. Issacson (1978), “Wave Runup Around Large Circular Cylinder”,
Journal of the Waterways, Harbours and Coastal Engineering Division ASCE.
Morris, D. (1966). “Interaction of continuous frames and soil media”, J Structural
Engineering ASCE, (5), 13–43.
Morrison, J.R., O’Brien, M.P, Johnson, J.W., Schaaf, S.A. (1950). “The Force
Exerted by Surface Waves on Piles”. Petroleum Transaction. Vol. (189), pp149-157.

Appendix I References
Response analysis of berthing structures for wave and earthquake induced forces including soil-structure interaction
PhD Thesis, NITK Surathkal, INDIA, 2013
125
Noorzaei,J., Godbole, P.N., Viladkar, M.N. (1993). “Nonlinear soil– structure
interactionof plane frames––a parametric study”, Computers and Structures, 49(3),
561–569.
Oliveto, G. A. and Santini (1995). “Time Domain Response of a one dimensional
soil-structure interacting model via complex analysis”, Engineering Structures, 18,
425-436.
Onu (1996). “Equivalences in the Soil-Structure Interaction”, Computers &
Structures, 58. No. 2, pp. 367-380.
Poluos (1975). “Dynamic Interaction Analysis of Soil and End Bearing Pile sing
Boundary Element Model Coupled with Finite Element Model”, International
Conference on Computational Intelligence, Communication Systems and Network. pp
234-244.
Per Brunn, “Port Engineering”, (1993). Gulf Publishing Company, Hudson, Texas.
Quinn A.D. (1968). “Design and Construction of Ports and Marine Structures”,
McGraw Hill, New York
Rajaram T.V. and Sassi Kumar P.K. (1985). Design and Construction of Cochin Oil
Terminal, first national conference on docks & harbour engineering, 27-29 December
Mumbai, India, pp 47-57.
Roberto Cairo, Enrico Conte and Giovanni Dente, (2005). “Interaction Factors for the
Analysis of Pile Groups in Layered Soils” 10.1061 ASCE 1090 131:4(525)
Roger G.G and Dan M.G (2002). “Stochastic Finite-Element analysis of seismic Soil–
Structure Interaction”, Journal of Engineering Mechanics, 128(1), 66-77.
Appendix I References
Response analysis of berthing structures for wave and earthquake induced forces including soil-structure interaction
PhD Thesis, NITK Surathkal, INDIA, 2013
126
Roy, R., Dutta, S.C. (2001). “Differential settlement among isolated footings of
building frames: the problem, its estimation and possible measures”, International
Journal of Applied Mechanics and Engineering , 6(1),
Satish S.Jadhav (2004). “Software Approach for Static and Dynamic Analysis of
Template Structure using FEM.” M.Tech thesis, National Institute of Technology
Karnataka, Department of Applied Mechanics and Hydraulics, Surathkal.
Shintaro, Y., Koichi, K., Nozomu, Y., and Hiroshi, M., (2004). “Interactive behavior
of soil–pile-superstructure system in transient state to liquefaction by means of large
shake table tests” Soil Dynamics and Earthquake Engineering, 24, 397–404
Shore Protection Manual (1984) (SPM), US Army Corps of Engineers, CERC,
Washington, D.C.
Skjelbreia and Hendrickson (1960), “Experience in computing wave loads on large
bodies”, Journal of Waterways, Port, Coastal and Coastal Engineering Division,
ASCE,vol 104, No ww2, pp147-161.
Shintaro, Y., Koichi, K., Nozomu, Y., and Hiroshi, M., (2004). “Interactive behavior
of soil–pile-superstructure system in transient state to liquefaction by means of large
shake table tests” Soil Dynamics and Earthquake Engineering, 24, 397–404
Srinivasa Rao, P., Rambabu, K.V. and Allam, M.M. (1995). “Representation of soil
support in analysis of open plane frames”, Computers and Structures, 56, 917-925.
Subba, K.S., Rao, H., Sharada, B.V. (1985). “Interaction analysis of frames with
beam footing”. Proc Indian Geotech Conference, Roorkee, 389–95.
STRUCAD-3D Reference Manual (2001). Research Engineering Work Ver. 4.2.

Appendix I References
Response analysis of berthing structures for wave and earthquake induced forces including soil-structure interaction
PhD Thesis, NITK Surathkal, INDIA, 2013
127
Surya Rao S.,Muralidhar K. and Bijay Kumar Pandey (1997), “Forces on Vertical
Circular Cylinder due to Regular and Random Waves”, Second Indian National
Conference on Harbour and Ocean Engg., INCHOES 97, December 7-10
Takahito Inoue Masayoshi Sato, Masoud Mohajeri, Yoshiyuki Mohri and Kazunobu
Izumi (2004). “Three dimensional analysis of soil-pile-structure model in a shake
table test”, 13th
World Conference on Earthquake Engineering Vancouver, B.C.,
Canada Paper No. 2518
Terzaghi, K.V., (1955). “Evaluation of coefficients of subgrade reaction”,
Geotechnique, 5(4), 297–326.
Tull (1997), “Fluid Forces on Oscillating Cylinders”, Journal of Waterways, Port,
Coastal and Coastal Engineering Division ASCE, vol.104, No.12389
Yang, Y.B., Kuo, S.R. and Liang, M. (1996). “A simplified procedure for formulation
of Soil-structure interaction problems”, Computers & Structures, 60, No. 4, pp. 511-
520.
Yingcai Mengi and Salih Kirkgoz M, (2009) “Dynamic Response of Caisson Plate to
Wave Impact”, Vol. 112, No. 2 ASCE, Paper No. 20473.
Zhang Hong-Wu (1995).”Dynamic finite element analysis for interaction between a
structure and two-phase saturated soil foundation”, Computers & Structures, 56, No.
1, pp. 49-58.
Zienkiewicz, O.C., Taylor, R.L. (1989). “The finite element method”, McGraw-Hill,
London

Response analysis of berthing structures for wave and earthquake induced forces including soil-structure interaction PhD Thesis,NITK Surathkal,INDIA,2013
128
APPENDIX II
PUBLICATIONS BASED ON THE PRESENT RESEARCH WORK
International Journal
1. Shanthala ,Subba Rao, Katta Venkatramana”,Time history analysis of
berthing structures including soil structure interaction” International J. of
Advances in Science and Technology (IJAST), Silicon Valley
Publishers,UK,Vol 3,No 02,August 2011, pp 77-85
2. Shanthala ,Subba Rao, Katta Venkatramana,”Analysis of Berthing structures
for wave induced forces”, International J. of Earth science and
Engineering, Elsevier Science Vol 04 No 01 February 2011, pp 112-121.
National Conferences
1. Shanthala ,Subba Rao, Katta Venkatramana,Pruthviraj U,”Experimental
investigation of wave forces on vertical cylinders”, Fourth Indian National
Conference on Harbour and Ocean Engineering (INCHOE-07) held at
N.I.T.K., Surathkal during 12th
to 14th
December, 2007, Vol. 2 pp 639- 642
2. Shanthala ,Subba Rao, Katta Venkatramana ,”Investigation on Non breaking
wave forces on slender vertical cylinder”National Conference on advances on
Civil engineering. (ACE 2008) ,held at AEC Bhatkal during 9th
&10th
March
2008 ,pp 54-58
3. Shanthala ,Subba Rao, Katta Venkatramana ,”Dynamic Analysis of Berthing
Structures For Wave Induced Forces”, National conference on ‘Sustainable
Water Resources Management’ SWaRM 2010 held at NITK, Surathkal,
during 7th
-9th
January 2010

APPENDIX II PUBLICATIONS BASED ON PRESENT RESEARCH WORK
Response analysis of berthing structures for wave and earthquake induced forces including soil-structure interaction
PhD Thesis,NITK Surathkal,INDIA,2013
129
4. Shanthala ,Subba Rao, Katta Venkatramana,Harish,”Wave response Analysis
on Berthing Structure for Maximum Wave”, Recent Development in Civil
Engineering (RDCE-2011),held at MIT Manipal during 13-14 January 2011