resource flows to fragile and conflict-affected states · figure 3.1 oda to fragile and...
TRANSCRIPT

Resource Flows to Fragile and Conflict-Affected StatesAnnual Report 2008
2008 ANNUAL REPORT ON RESOURCE FLOWS TO FRAGILE AND CONFLICT-AFFECTED STATES
2
ACKNOWLEDGMENTS
This Report was prepared by Oxford Policy Management (OPM) and the Secretariat of the OECD DAC International Network on Conflict and Fragility (INCAF). The work was undertaken by a team, including Juana de Catheu (INCAF, co-ordination of the report), Katarina Kotoglou and Dhruv Malhotra (OPM), and Margarete Jacob and Asbjorn Wee (INCAF). The team would like to thank Yasmin Ahmad, Ben Dickinson, and Frederik Ericsson (OECD), Rebecca Dale (UK Department for International Development), Odd-Helge Fjeldstad (Chr. Michelsen Institute), Sébastien Lapierre (UN Department of Peacekeeping Operations), Christian Lotz (UNDP) and Julien Serre (UN Peacebuilding Commission Support Office) who contributed or commented on earlier drafts. The report is part of a discussion process and expresses the opinions of the authors. These do not necessarily reflect the views of the INCAF. All data contained in the paper have been verified as far as possible; nevertheless, we cannot discount the possibility of errors. The authors cannot guarantee the validity, accuracy or completeness of the data contained in this paper; no liability can be accepted for any damages resulting from the use of these data.

3
TABLE OF CONTENTS
ACKNOWLEDGMENTS....................................................................... 2
TABLE OF CONTENTS ........................................................................ 3
ABBREVIATIONS ................................................................................ 6
EXECUTIVE SUMMARY ..................................................................... 8
INTRODUCTION ................................................................................. 19
Purpose ................................................................................................ 19 Background .......................................................................................... 19 Methodology ........................................................................................ 21
SECTION I. OFFICIAL DEVELOPMENT ASSISTANCE ...................... 27
CHAPTER 1. TRENDS IN OFFICIAL DEVELOPMENT ASSISTANCE ................... 27 CHAPTER 2. DAC DONOR PRESENCE, CONCENTRATION AND FRAGMENTATION 44
SECTION II. AID: ONE PART OF A COMPLEX EQUATION ............... 48
CHAPTER 3. MIXING ODA AND NON-ODA FUNDS IN SUPPORT OF SECURITY, STATE BUILDING AND
PEACE BUILDING .................................................................................... 48 CHAPTER 4. FLOWS FROM NEW INTERNATIONAL ACTORS .......................... 60 CHAPTER 5. GLOBAL FUNDS AND PHILANTHROPIC FOUNDATIONS .............. 69 CHAPTER 6. PRIVATE RESOURCE FLOWS .................................................. 77 CHAPTER 7. DOMESTIC REVENUES .......................................................... 85 CHAPTER 8. CROSS-BORDER FLOWS OF PROCEEDS FROM CRIMINAL ACTIVITIES, CORRUPTION AND
TAX EVASION ......................................................................................... 95
SECTION III. TRANSITION FINANCING IN POST-CONFLICT COUNTRIES 101
CHAPTER 9. ESTIMATING THE GAP IN TRANSITION FINANCING .................. 101 CHAPTER 10. INITIAL FINDINGS OF CHALLENGES TO TRANSITION FINANCING 107

2008 ANNUAL REPORT ON RESOURCE FLOWS TO FRAGILE AND CONFLICT-AFFECTED STATES
4
LIST OF TABLES, FIGURES AND BOXES Tables
Table 0.1 The Early Recovery Financing Gap in Humanitarian Funding Instruments .......... 15 Table 1.1 Projected increase in aid 2005 – 2010 ..................................................................... 33 Table 1.2 Aid projections, 2008 - 2010 .................................................................................... 35 Table 1.3 Projected decrease in aid 2005 – 2010 .................................................................... 36 Table 1.4 Unpredictable aid – differences in ODA commitments and disbursements as a % of
GDP, averages, 1990-2005 ............................................................................ 40 Table 1.5 Use of country systems and aid predictability, 2007 ............................................... 41 Table 2.1 Donor concentration, averages, 2005 and 2006 ...................................................... 45 Table 3.1 Peacekeeping expenditures, 2000 – 2007 (USD million) ....................................... 50 Table 5.1 Education for All-Fast Track Initiative disbursements, 2004 – 2008 (USD millions)
........................................................................................................ 70 Table 5.2 Global Fund to fight AIDS, Tuberculosis and Malaria, disbursements, 2004 – 2008
(USD millions) ............................................................................................... 71 Table 5.3 The Bill and Melinda Gates Foundation, disbursements, 2000 – 2007 (USD
millions) ........................................................................................................ 73 Table 5.4 The Ford Foundation, disbursements, 2005 – 2007 (USD millions) ..................... 74 Table 5.5 The Soros Foundation, disbursements, 2004 – 2006 (USD millions) .................... 74 Table 5.6 The Rockefeller Foundation, disbursements, 2004 – 2008 (USD millions) .......... 75 Table 6.1 Foreign direct investment, averages, 2000 – 2007 ................................................. 78 Table 6.2 Remittances, averages, 2000 – 2007 ..................................................................... 80 Table 6.3 Exports and imports, 2007 ...................................................................................... 82 Table 7.1 Government revenue (% of GDP), 2007 ................................................................... 85 Table 7.2 Government revenue (% of GDP), 1997 – 2007 .......................................................86 Table 9.1 Funding gaps for peace-building in Guinea-Bissau ............................................... 105 Table 9.2 Funding gaps for peace building in the Central African Republic ......................... 106
Figures
Figure 0.1 Net ODA to fragile and conflict-affected states (USD billion, constant 2006) 9 Figure 0.2 Fifty percent of net ODA have benefited just five out of 48 fragile and
conflict-affected states in 2007 (USD billion, constant 2006) ........................ 9 Figure 0.3 ODA to fragile and conflict-affected states for governance and security (USD
million, constant 2006)................................................................................... 11 Figure 0.4 ODA to fragile and conflict-affected states for security system reform (USD
million, constant 2006)................................................................................... 11 Figure 0.5 Peacekeeping, Net ODA and Emergency Aid (2000-2007) .......................... 13 Figure 0.6 Trends in ODA flows before and after peace agreements (USD million,
constant 2006) ............................................................................................... 16 Figure 0.7 Foreign direct investment to fragile and conflict-affected states is
concentrated to oil-rich countries and Pakistan (USD million, 2000-2007) 17 Figure 1.1 Net ODA from all donors to fragile and conflict-affected states (USD billion,
constant 2006) ............................................................................................... 27

5
Figure 1.2 Fifty percent of net ODA have benefited just five out of 48 fragile and conflict-affected states in 2007 (USD billion, constant 2006) ...................... 28
Figure 1.3 Composition of ODA to fragile and conflict-affected states (2005) .............. 28 Figure 1.4 Projected decrease in aid exceeding USD 20 million .................................... 36 Figure 1.5 Aid projected to decrease, and CPA-to-GNI ratio below 15% in 2010 ........... 37 Figure 1.6 Use of country systems and aid predictability, 2007 .................................... 40 Figure 3.1 ODA to fragile and conflict-affected states for governance and security (USD
million, constant 2006).................................................................................. 48 Figure 3.2 ODA funds for security, state building and peace building in Nepal ............. 49 Figure 3.3 Peacekeeping, Net ODA and Emergency Aid (2000-2007) .......................... 51 Figure 6.1 Remittances and FDI to fragile and conflict-affected countries, 2000 – 2006.
........................................................................................................ 79 Figure 7.1 A social contract conceptual framework ........................................................ 87 Figure 9.1 Trends in ODA flows before an dafter peace agreements (USD million,
constant 2006) ............................................................................................. 104
Boxes
Box 1.1. Dimensions of aid absorptive capacity ....................................................................... 29 Box 1.2. Country level analysis on aid absorptive capacity in Yemen ..................................... 31 Box 1.3. Sectoral absorptive capacity and institutional capacity ............................................. 32 Box 1.4. Aid predictability ........................................................................................................ 39 Box 3.1 The Dutch Stability Fund ............................................................................................ 54 Box 3.2. Experiences with multi-donor trust funds ................................................................ 56 Box 3.3 Operational challenges with multi-donor trust funds ................................................ 58 Box 7.1. Supply side factors ......................................................................................................89 Box 7.2. Demand side factors ................................................................................................. 90 Box 7.3. Examples of country-level analysis and evidence ...................................................... 91 Box 8.1. The Cassiterite trade across the Congo – Rwanda border ......................................... 96 Box 8.2. Crime as both a cause and consequence of state fragility: the case of Guinea Bissau ..
........................................................................................................ 97 Box 9.1. The early recovery financing gap in humanitarian funding instruments ................ 102
2008 ANNUAL REPORT ON RESOURCE FLOWS TO FRAGILE AND CONFLICT-AFFECTED STATES
6
ABBREVIATIONS
ARTF Afghanistan Reconstruction Trust Fund
APF EU Africa Peace Facility
AU Africa Union
CAP Consolidated appeals
CERF Central Emergency Response Fund
CFIP Carleton University Country Indicators for Foreign Policy
CHF UN Common Humanitarian Fund
CHPF Common humanitarian pooled funds
CPA Country programmable aid
CPIA Country policy and institutional assessment
DRC Democratic Republic of Congo
DRCPF DRC Pooled Fund
EC European Commission
EFA/FTI Education For All/Fast Track Initiative
EU European Union
EXIM Export/Import Bank
GAVI Global Alliance for Vaccine and Immunization
GEF Global Environment Fund
GFATM Global Fund to Fight AIDS, Tuberculosis and Malaria
FDI Foreign direct investment
GDP Gross domestic product
GNI Gross national income
GNP Gross national product
HIPC/AAP Heavily Indebted Poor Countries Public Expenditure Tracking Assessment and Action Plan
IDA International Development Association
IMF International Monetary Fund
INCAF International Network on Conflict and Fragility
IRTF Iraq Reconstruction Trust Fund
LDC Least developed countries
MDRP Multi-Country Demobilization and Reintegration Program
MDTF Multi-donor trust fund
MINUSTAH United Nations Stabilization Mission in Haiti

7
NATO North Atlantic Treaty Organisation
NGOs Non-governmental organisations
ODA Official development assistance
OPM Oxford Policy Management
OSCE Organisation for Security and Co-operation in Europe
PEFA Public expenditure and financial accountability assessments
PFM Public finance management
PRGF Poverty Reduction Growth Facility UN United Nations
UNDESA United Nations Department of Economic and Social Affairs
UNDP United Nations Development Programme
UNPBF UN Peacebuilding Fund
UNDPKO United Nations Department for Peacekeeping Operations
UNODC United Nations Office on Drugs and Crime

2008 ANNUAL REPORT ON RESOURCE FLOWS TO FRAGILE AND CONFLICT-AFFECTED STATES
8
EXECUTIVE SUMMARY
THE CURRENT GLOBAL ECONOMIC SITUATION Although the current crisis is an important backdrop to this report, the full effects are yet to be seen. A variety of factors require monitoring over coming months: pressure on Official Development Assistance (ODA) budgets, falling migrants‘ remittances, a squeeze on foreign reserves in US dollars and further terms of trade shocks. It is already clear, however, that net private capital flows to fragile states have dropped1. For example, mining investment in the Democratic Republic of Congo has plummeted after the drop of commodity prices and 200,000 mining workers have been laid off. There may be new situations of fragility, and countries that are emerging from conflict and fragility may relapse. Globally, almost 100 million extra people will be trapped in poverty by the slowdown in economic growth, on top of around 130 million people directly affected by the big rise in food prices in 20072.
AID FLOWS TO FRAGILE STATES While many countries are making progress towards achieving the Millennium Development Goals, a group of countries is falling behind. One billion people live in these countries, where half of the world‘s children die before the age of five, and one third of all people surviving on less than USD 1 per day live. Thirty-five countries considered fragile in 1979 are still fragile in 20093, and the gap with other developing countries has been widening since the 1970s: In 2007, per capita GDP grew only at 2.6 per cent in fragile states, whereas it reached 4.6 percent in other low-income countries. The regional and international spillover effects from these countries—violent conflict, instability, organised crime, migration, human trafficking, public health—continue to resonate widely beyond the development community. Donors have responded to the challenges of fragile and conflict-affected states with more aid: In 2007 USD 37.2 billion of ODA went to fragile and conflict-affected states, or 38.4 percent of total ODA (See Figure 0.1).
1 Draft European Report on Development ―Development in a context of Fragility‖ (February 2009).
2 World Bank estimate.
3 World Bank staff estimate.

9
Figure 0.1 Net ODA to fragile and conflict-affected states (USD billion, constant 2006)
0
50
100
150
200
1995 1996 1997 1998 1999 2000 2001 2002 2003 2004 2005 2006 2007
ODA to fragile and conflict-affected states Other ODA Total ODA
Total net ODA disbursements from all donors to fragile and
conflict-affected states
0
10
20
30
40
50
60
1995 1996 1997 1998 1999 2000 2001 2002 2003 2004 2005 2006 2007
Total net ODA Total net ODA excluding debt relief grants
Source: OECD DAC online database (2000-2007).
However, half the ODA for 48 fragile and conflict-affected states benefited just five countries in 2007: Iraq (23 percent), Afghanistan (9.9 percent), Ethiopia, Pakistan and Sudan (See Figure 0.2) and around a fifth was in the form of debt relief.
Figure 0.2 Fifty percent of net ODA have benefited just five out of 48 fragile and conflict-affected states in 2007 (USD billion, constant 2006)
0
1
2
3
4
5
6
7
8
9
Iraq
Afgh
anistan
Ethio
pia
Pakistan
Sud
anN
igeria
Cam
ero
on
Pale
stinian
Ad
m.
Ugan
da
Ke
nya
Co
ngo
, De
m. R
ep
.R
wan
da
Haiti
Libe
riaC
amb
od
ia
Ne
pal
Nige
rSie
rra Leo
ne
Zimb
abw
e
Bu
run
di
Laos
Som
alia
Mau
ritania
Ch
ad
Pap
ua N
ew
Gu
ine
a
Timo
r-Leste
An
gola
Solo
mo
n Islan
ds
Gu
ine
aY
em
en
Tajikistan
Myan
mar
Ce
ntral A
frican R
ep
.
Uzb
ekistan
Co
te d
'Ivoire
Eritrea
Co
ngo
, Re
p.
Gu
ine
a-Bissau
Togo
Djib
ou
ti
Ko
rea, D
em
. Re
p.
Gam
bia
Van
uatu
Co
mo
ros
Sao To
me
& P
rincip
e
Equ
atorial G
uin
ea
Ton
gaK
iribati
Source: OECD DAC online database (2000-2007).

2008 ANNUAL REPORT ON RESOURCE FLOWS TO FRAGILE AND CONFLICT-AFFECTED STATES
10
From an examination of ODA flows to fragile and conflict-affected states4, three sets of countries warrant particular attention: 1. Countries with projected decreasing aid levels
While a 2008 survey5 suggests 16 countries could expect an increase of USD 100 million or more in country programmable aid6 by 20107, 15 could expect a decrease, of which 7 could expect a decrease by more than USD 20 million: Chad, Eritrea, Guinea, Iraq, Solomon Islands, Tajikistan and Timor Leste.
Among these seven countries, Chad, Guinea and Tajikistan can currently be considered not aid dependent8 .
2. Countries with volatile aid
Fluctuations in aid are larger in fragile and conflict-affected states than in other developing countries. Seven countries experienced fluctuations of aid in excess of 5 percent of GDP over 1990-20059: Burundi, the DRC, Eritrea, Guinea Bissau, Liberia, Sierra Leone and the Palestinian administrated Areas.
Countries emerging from conflict require sustained international support—evidence suggests that in post crisis situations aid tails off just as countries reach the point where they could use it more effectively.
3. Countries with access to a limited number of donors
Twenty fragile and conflict-affected countries receive two thirds of their aid from three donors or less. Iraq currently depends on one donor – the United States – for 95% of aid. Papua New Guinea and Solomon Islands are dependent on Australia for 77% and 71% of aid, respectively.
4 The list of fragile and conflict-affected states used for the 2008 Report (not an official DAC list or definition) is a compilation of three lists: the bottom two quintiles of the Country Policy and Institutional Assessment (CPIA) 2007; the Brookings Index of State Weakness in the Developing World 2008; and the Carleton University Country Indicators for Foreign Policy (CFIP) 2007 index.
5 Survey on Aid Allocations Policies and Indicative Forward Spending Plans, OECD, 2008
6 Country programmable aid is defined as ODA minus aid that is unpredictable by nature (such as debt forgiveness and emergency aid); entails no cross border flows (such as research and student exchanges); does not form part of cooperation agreements between governments (such as food aid); or is not country programmable by the donors (such as core funding through international and national NGOs).
7 Projected increases in aid are significant for a number of countries that start with a very low 2005 baseline in terms of aid levels (below USD 100 million), notably Cote d‘Ivoire, Somalia and Liberia (percentage increase in aid is above 150%).
8 Their ODA to GNI ratio, a common measure of aid dependency, is below 15%.
9 Celasun and Walliser, 2008.

2008 ANNUAL REPORT ON RESOURCE FLOWS TO FRAGILE AND CONFLICT-AFFECTED STATES
11
Afghanistan, Comoros, Djibouti, Equatorial Guinea and Yemen are each dependent on one donor for 50% of aid.
Although donor concentration should be encouraged, changes in donor priorities and policies could impact significantly on the predictability of aid flows to countries dependent on exceptionally few donors. AID FOR STATE BUILDING, PEACEBUILDING AND SECURITY While total aid flows for fragile states matter for fragile states, more precision is needed to examine what types of aid impact on state fragility, peace building and security. ODA directed to governance and security activities has grown almost four-fold between 2000 and 2007 (see Figure 0.3). ODA for security system reform has greatly increased from 2004 to 2007 (see Figure 0.4).
Figure 0.3 ODA to fragile and conflict-
affected states for governance and security (USD million, constant 2006)
Figure 0.4 ODA to fragile and conflict-affected states for security system reform (USD million, constant 2006)
-
1,000
2,000
3,000
4,000
5,000
6,000
7,000
2000 2001 2002 2003 2004 2005 2006 2007
Government, civil society and monetary institutions
Conflict prevention and resolution, peace and security
Total for both items
Source: OECD DAC online database (2000-2007).

2008 ANNUAL REPORT ON RESOURCE FLOWS TO FRAGILE AND CONFLICT-AFFECTED STATES
12
OECD DAC DONORS ARE ONLY PART OF THE PICTURE
The above categories of countries are derived from DAC ODA flows only; but non-OECD DAC donor aid flows, global funds and private foundations are increasingly important for fragile states. Development assistance from non-DAC donors and new EU member states is estimated at 10 percent of ODA10 from DAC donors. Brazil, China, India, the Gulf States and South Africa are particularly active in fragile and conflict-affected states. China‘s priority recipients of assistance include Angola, Sudan and Ethiopia. India and China are large troop contributors in UN peacekeeping missions. Since its creation in 2001, the Global Fund to Fight AIDS, Tuberculosis and Malaria has disbursed an estimated USD 2.9 billion in fragile and conflict-affected states, or almost 8 percent of ODA to fragile and conflict-affected states (2008), and is the second largest donor in Equatorial Guinea, providing 11 percent ODA. The Bill and Melinda Gates Foundation have disbursed an estimated USD 175 million in fragile states over 2000-2007. AID AND OTHER RESOURCE FLOWS: A WHOLE OF GOVERNMENT CONCERN Aid is increasingly viewed as just one integral component in the international effort in fragile and conflict-affected states and one part of the total resource envelope. Development, trade, finance, diplomatic and security policy communities must work together if the challenges of peace building and state building—often the preconditions for growth and poverty reduction—are to be addressed. Four whole-of-government issues are highlighted below: 1. Security and development UN peacekeeping expenditures are at a historic peak with 20 ongoing missions, with about 110,000 personnel (a seven fold increase since 1999), providing wide-ranging support to peace and stabilisation, supported by a budget of 7 USD billion (one fifth of ODA to fragile and conflict-affected states). The UN integrated mission in the DRC has an approved budget of USD 1.2 billion, the equivalent of total ODA to the DRC in 2007. In post conflict countries, development efforts should commence, where possible, before the peace agreement and, at a very minimum, prior to the departure of peacekeeping missions, and be sustained over a period of years (See Figure 0.5). In all cases these decisions will require a whole of government approach. Non-OECD countries such as South Africa play a critical security role in their regions.
10 OECD estimate.

2008 ANNUAL REPORT ON RESOURCE FLOWS TO FRAGILE AND CONFLICT-AFFECTED STATES
13
Figure 0.5 Peacekeeping, Net ODA and Emergency Aid (2000-2007)
Sierra Leone: Aid increases slowly as UN peacekeeping resources decline
Burundi: Aid increases prior to reduced UN peacekeeping resources
Source: OECD DAC online database (2000-2007).
In an effort to deliver more coherent whole of government support to address state fragility, several OECD governments have set up pooled funding mechanisms and joint budgets. The Netherlands Stability Fund is one example of an innovative instrument to promote a coordinated response across government (See box below).
The Netherlands Stability Fund The Netherlands Stability Fund was created in 2004 to improve the provision of rapid and flexible financing for activities that are required to promote peace, security and development in situations of conflict and fragility, regardless of whether these activities are ODA eligible or not. To date, the fund has committed almost €400 million in support of key policy areas such as conflict prevention, mediation, peacekeeping and peace building. Financing has almost doubled, from about €58 million in 2004 to more than €100 million in 2008. The availability of non-ODA allocations have almost quadrupled between over the same period. The fund has benefited from strong political support, including from parliament, and from the clear delinking of allocation decisions from questions about ODA-eligibility.
0
20
40
60
80
100
2004 2005 2006 2007 2008
€ m
illio
n
ODA non-ODA total

2008 ANNUAL REPORT ON RESOURCE FLOWS TO FRAGILE AND CONFLICT-AFFECTED STATES
14
2. Domestic resources and state building. Historical experience suggests generating domestic revenues is critical to state building and developing state-society relations in the long term. Research into the dampening effect of aid on domestic resource mobilisation has produced mixed results but donors must be alert to the risks in fragile states.
Twelve fragile and conflict-affected states collect less than 15 percent of their GDP in tax. Afghanistan and Zimbabwe collect less than 7 percent.
Six countries collect more than 35%11 and are all resource-rich: Iraq, Angola, Republic of Congo, São Tomé e Principe, Equatorial Guinea and Uzbekistan.
While only USD 88 million of a total USD 103 billion ODA in 2006 was dedicated to tax-related activities, aid targeted at strengthening revenue administrations is money well spent. For instance, aid to the Rwanda Revenue Authority supported a dramatic increase in tax revenue, from 9% of GDP in 1998 to 14.7% in 2005. In this case, and in many others, a whole of government approach—involving development personnel and tax professionals from donor countries—was a critical success factor.
3. Out-flows of illicit money12 Outflows of illicit money from developing countries represent USD 650 billion per annum or ten times the yearly in-flows of ODA average since 199013. Global illegal trade alone is estimated at USD 400 billion. For example, at its peak, the drug economy represented 50 percent of Afghanistan‘s GDP in 200614. Theft from leaders can also be of a stunning magnitude: Nigeria‘s Sani Abacha has stolen an estimated USD2-5 billion over 1993-9815, of which USD 500 million has been recovered from Switzerland in 2005 and USD 149 million from Jersey. In successful cases of asset tracing and recovery, a complex whole of government approach has been required, involving personnel from ministries and departments of justice, interior, foreign affairs, development and law enforcement agencies.
11 OECD countries collect on average 36.2 percent of their GDP in tax (2005).
12 Illicit money comprises flows of money associated with (i) tax evasion, (ii) criminal activity, and (iii) bribery and theft by government officials.
13 Baker, 2005.
14 United Nations Office on Drugs and Crime United (2008).
15 United Nations Office on Drugs and Crime and World Bank, Stolen Asset Recovery Initiative (2007).

2008 ANNUAL REPORT ON RESOURCE FLOWS TO FRAGILE AND CONFLICT-AFFECTED STATES
15
4. Transitional Financing A final whole-of-government issue is that of transitioning from humanitarian assistance to the use of longer-term development aid. The challenge is to ensure that life-saving activities are continued while the foundations for sustainable recovery, peace building and state capacity are built. The transition period often imposes difficult coordination and cooperation challenges between different operational and policy communities. It requires a mix of humanitarian and development instruments (without compromising humanitarian principles), and a flexible and pragmatic approach. Integrated approaches across the international system are needed where different actors (humanitarian, development, security) need to work simultaneously to address different but complementary objectives. The lack of conclusive definitions and data on the levels of transition financing is a major obstacle to progress. However, the UN estimates that on average less than 50 percent of development funds required for the early recovery financing period are pledged by donors, compared to a shortfall of 25 percent for humanitarian requests (see Table 0.1).
Table 0.1 The Early Recovery Financing Gap in Humanitarian Funding Instruments
Source: United Nations Cluster Working Group on Early Recovery: Financing for Early Recovery: Highlighting the Gaps 2006-08
Appeal Gap in Early Recovery Funding
Gap in Humanitarian Funding
Flash Appeals 83% 47%
Consolidated Appeals 56% 22%
Central Emergency Response Fund
3% (Approved for early recovery)
N/A
Common Humanitarian Pooled Funds Sudan
57% 16%
Common Humanitarian Pooled Funds DRC
64% 43%

2008 ANNUAL REPORT ON RESOURCE FLOWS TO FRAGILE AND CONFLICT-AFFECTED STATES
16
Figure 0.6 below shows different aid flow trends before and after the peace agreements in Sudan and Afghanistan.
Figure 0.6 Trends in ODA flows before and after peace agreements (USD million, constant
2006)
Afghanistan: Aid increases after the Bonn peace agreement, as humanitarian aid declines
Sudan: ODA commitments peaked in the year of the peace agreement, agreement, then declined
Source: OECD DAC online database (2000-2007).
The evidence highlights the need to improve donor policies and organizational responses to accelerate the availability of rapid and flexible development financing; to identify appropriate delivery mechanisms without necessarily establishing new vertical modalities; to improve coordination between multilateral and bilateral response mechanisms.
OTHER CRITICAL RESOURCE FLOWS Other resource flows to fragile states, private for the most part, show that aid is one part of a complex equation. These flows include: 1. Windfalls from natural resources
Countries which currently have high export levels of which a large share is natural resources, which is usually associated with a high risk of natural resource curse include Angola, Cameroon, Chad, Republic of Congo and Nigeria (2007).
2. Remittances Remittances to fragile and conflict-affected states quadrupled between 2000-2007 (USD 7.2 billion to USD 28.8 billion, or 77% of ODA to fragile and conflict-affected

2008 ANNUAL REPORT ON RESOURCE FLOWS TO FRAGILE AND CONFLICT-AFFECTED STATES
17
states). Remittances to Liberia in 2007 represented the volume of its GDP; in Yemen and Nigeria four times the ODA to each country. Remittances can play a positive role in improving the lives of ordinary people and the diaspora can also mobilise international support and attention. On the other hand, remittances can fuel violent conflict—funding the Liberation Tigers of Tamil Eelam in Sri Lanka for example16. 3. Investment Investment is a critical driver of growth and employment—key issues underpinning stability and peace. Foreign direct investment (FDI) to 42 fragile and conflict-affected states more than quadrupled from USD 5 billion in 2000 to USD 21 billion in 2006. However, over 70 percent of all FDI in fragile and conflict-affected states (USD 11.1 billion per annum on average 2000-2007) went to Angola, Chad, Equatorial Guinea, Nigeria, Pakistan and Sudan—all of which but Pakistan are natural resource producers, and where FDI mostly reflects expansions in projects within the oil industry (see Figure 0.7).
Figure 0.7 Foreign direct investment to fragile and conflict-affected states is concentrated to oil-rich countries and Pakistan (USD million, 2000-2007)
0
500
1000
1500
2000
Nigeria
Pakist
an
Equato
rial G
uinea
Ethio
pia
Congo, D
em. R
ep.
Côte D
’Ivoi
re
Mya
nmar
Yemen, R
ep.
Liberia
Uzbeki
stan
Togo
Gambia
Guinea
Haiti
Djibouti
Niger
Guinea-
Bissau
Solo
mon Is
l.
Nepal
Burundi
Tonga
Source: OECD DAC online database (2000-2007).
16 McDowell 1996; Byman ed. 2001; Van Hear 2002; Cheran 2003; Wayland 2004.

2008 ANNUAL REPORT ON RESOURCE FLOWS TO FRAGILE AND CONFLICT-AFFECTED STATES
18

2008 ANNUAL REPORT ON RESOURCE FLOWS TO FRAGILE AND CONFLICT-AFFECTED STATES
19
INTRODUCTION
PURPOSE
While many countries are making progress towards achieving the Millennium Development Goals, a group of countries is falling behind. One billion people live in these countries, where half of the world‘s children die before the age of five, and one third of all people surviving on less than USD 1 per day live. Thirty-five countries considered fragile in 1979 are still fragile in 200917, and the gap with other developing countries has been widening since the 1970s: In 2007, per capita GDP grew only at 2.6 per cent in fragile states, whereas it reached 4.6 percent in other low-income countries. The regional and international spillover effects from these countries—violent conflict, instability, organised crime, migration, human trafficking, public health—continue to resonate widely beyond the development community. The purpose of the 2008 Report on Monitoring Resource Flows to Fragile and Conflict-Affected States is to provide policy makers and country offices with a tool to better monitor the levels, timing and composition of resource flows to fragile states. The report aims to contribute to improving transparency and co-ordination by triggering a discussion in donor agencies, both in the field and at headquarters, about removing the obstacles to more effective resource allocation to fragile states.
The findings from the monitoring work to date (2005-2008)– which have exposed aspects of international marginalisation – should be fed into existing country-level and regional-level meetings in the course of 2009-10. This will help to facilitate discussions on predictability of aid, on absorptive capacity constraints, and on linking country-level processes with strategic discussions in capitals.
BACKGROUND
The background to this report is an increasing concern about the implications for international stability and development progress resulting from state failure or state fragility, and the growing recognition that aid is one element in the international effort and there are important linkages between activities that can and cannot be counted as official development assistance (ODA) eligible.
Other key areas of concern include the levels and predictability of aid, as well as other aspects of engagement by bilateral and multilateral donors. Aid to countries in fragile and conflict-affected situations appears to be more volatile than aid to other low-income countries. Moreover, in cases of conflict, aid tends to plummet within five years after conflict when the need for it is highest.
Another concern is the need for situating aid within the broader context of other non-aid resources. Aid is increasingly viewed as just one of the integral components in the international effort to support turn-around in fragile states and one part of the 17 World Bank staff estimate.

2008 ANNUAL REPORT ON RESOURCE FLOWS TO FRAGILE AND CONFLICT-AFFECTED STATES
20
total resource envelope. Development, trade, finance, diplomatic and security policy communities must work together if the challenges of peace building and state building – often the preconditions for growth and poverty reduction – are to be addressed.
In response to these concerns, the January 2005 Senior Level Forum on Development Effectiveness in Fragile States suggested that the DAC Secretariat develop a proposal for the regular monitoring of resource flows to fragile states. The DAC Senior Level Meeting in December 2005 approved the DAC Secretariat proposal for a yearly report on Monitoring Resource Flows to Fragile States (DCD-DAC(2005)48 REV1).18 Furthermore, the 2007 High Level Meeting requested that the DAC undertake further research on the amount of non-ODA eligible financing spent on peace building, conflict prevention and security activities, and draw best practices on such spending.
The first, 2005 Report19 analysed a group of 35 fragile states.20 It looked in particular at four main categories: need for and levels of aid;21 governance indicators; volatility of aid flows; and international presence and attention. The 2006 Report22 was expanded to cover all International Development Association (IDA) eligible countries, and not just the bottom two quintiles of the Country Policy and Institutional Assessment (CPIA) index. This allowed comparisons between fragile and non-fragile countries, particularly those that might be slightly above the cut-off point for classification as fragile.23 The 2006 Report was presented to the DAC and the Senior Level Meeting for information.
The 2007 Report24 was expanded to include significant illustrative data from new international actors; data on non-official flows through non-governmental organisations (NGOs); and non-ODA flows such as peacekeeping and other security-related expenditures of donors. The 2007 Report‘s main findings are, first, that in 2006 donors responded to the challenges posed by fragile states with more aid, but 75% of that aid benefited just five countries – Nigeria, Afghanistan, Sudan, the Democratic Republic of Congo (DRC) and Cameroon – and half of it is debt relief. Second, aid is only part of the picture, and development, trade, finance, diplomatic and security communities must work together, engaging with new international actors, if the challenges of state building and peace building are to be addressed.
18 See DCD/DAC/M (2005)13/FINAL.
19 www.oecd.org/dac/fragilestates/resource
20 The 35 countries analysed were those in the bottom two quintiles of the World Bank‘s CPIA in 2003 and those not rated, including Afghanistan, Liberia, Myanmar, Somalia and Timor-Leste.
21 All charts are derived from DAC sources. Non-DAC donor resources, which are significant in some countries, are not captured here.
22 www.oecd.org/dac/fragilestates/resource
23 In addition, the 2006 report uses the 2005 CPIA results, which were in the public domain for the first time and which are more relevant as a measure of institutional performance. (The 2005 report was based on the World Bank Aggregate Governance Indicators dataset.)
24 www.oecd.org/dac/fragilestates/resource
2008 ANNUAL REPORT ON RESOURCE FLOWS TO FRAGILE AND CONFLICT-AFFECTED STATES
21
The report does not argue for increased aid for the countries concerned per se, but instead aims to highlight the central importance of specific country-level analysis, notably on aid absorptive capacity and other issues such as domestic resource mobilisation and the transparency of resource allocation to national poverty reduction priorities. In many cases these issues are influenced by political, economic and developmental priorities. As a result, they not only affect aid volumes, but also the type and quality of aid, the possibilities of strengthening national systems for aid co-ordination, and the management of complementary national investments. By broadening the analysis to include non-aid dimensions, co-ordination among donor agencies at the field level with partner governments can be complemented with policy coherence initiatives at headquarters. This can help to align and harmonise the different forms of aid and non-aid engagement in fragile and conflict-affected countries.
METHODOLOGY
FRAMEWORK AND SCOPE
Resource flows may be classified in various ways, including by source and destination (public, private), purpose (ODA eligible, non-ODA eligible), and whether they represent current or capital flows (e.g. remittances compared to foreign direct investment (FDI). It is important to be aware of the differences among types of resource flows in terms of their likely economic impact and the extent to which they may be regarded as substitutes, in particular substitutes for aid.
Recent literature (IDA, 2007; OECD/DAC, 2007a; World Bank, 2007a, 2007b) recognises that:
The system for development financing has become increasingly complex with the proliferation of donor channels for aid delivery and fragmentation in the number of donor-funded activities. This has created certain challenges with regard to how aid is delivered; its associated transaction costs; and the impact on already weak aid implementation capacity in recipient countries.
There are major gaps in available data sources, especially for non-DAC donors, private/philanthropic donors, and NGOs. The increasing number of private actors and public-private partnership initiatives in development financing, for instance global and sector-themed funds, has also made the division between public and private development financing less clear.
Analysing resource flows in the wider context of development financing, the report seeks to cover:
ODA flows to fragile states and situations
non-ODA flows:
o aid-like flows from non-DAC donors (states and non-state donors) o peacekeeping expenditures o FDI o trade o remittances o domestic revenues (including from natural resources)

2008 ANNUAL REPORT ON RESOURCE FLOWS TO FRAGILE AND CONFLICT-AFFECTED STATES
22
o private philanthropy o outflows of illicit money.
pooled funds mixing ODA and non-ODA resources for increased flexibility.
The report aims to provide policy makers with a tool to better monitor the levels, timing and composition of resource flows to fragile and conflict-affected states, and in particular to:
Clarify the relative importance of public and private external resource flows, domestic revenues, actors and channels for delivery to individual fragile states (where data availability permits);
Highlight particular constraints that fragile states are facing with regard to absorptive capacity, volatility, and predictability of resource flows.
DATA AND LIST OF FRAGILE AND CONFLICT-AFFECTED STATES
The list of fragile and conflict-affected states used for this 2008 Report is a compilation of three lists: the bottom two quintiles of the CPIA 2007; the Brookings Index of State Weakness in the Developing World 2008; and the Carleton University Country Indicators for Foreign Policy (CFIP) 2007 index. The resulting list of countries is a change from the 2005, 2006 and 2007 Reports, in which the bottom two quintiles of the CPIA, plus unrated countries/territories and countries that have been moving in and out of the bottom two quintiles in previous years, defined the list of countries under consideration. The use of two additional indexes that reflect the DAC definition of fragility and conflict (consideration of both the capacity and legitimacy of the state, and inclusion of the security dimension) aims to make the list more robust and consistent with the DAC‘s policy focus. Those two additional indexes add 10 countries to the 38 countries that are identified solely on the basis of the CPIA. These ten countries are marked with the sign ―+‖.
The list used in this 2008 Report is the following: Afghanistan Angola Burundi Cambodia Cameroon Central African Republic Chad Comoros Congo, Dem. Rep. Congo, Rep. Côte d‟Ivoire Djibouti + Equatorial Guinea Eritrea + Ethiopia Gambia Guinea
Guinea-Bissau Haïti + Iraq + Kenya Kiribati Laos Liberia Mauritania Myanmar + Nepal Niger Nigeria + North Korea + Pakistan Papua New Guinea + Rwanda
São Tomé and Principe Sierra Leone Solomon Islands Somalia Sudan Tajikistan Timor-Leste Togo Tonga + Uganda Uzbekistan Vanuatu + Palestinian administrated Areas Yemen, Rep. Zimbabwe

2008 ANNUAL REPORT ON RESOURCE FLOWS TO FRAGILE AND CONFLICT-AFFECTED STATES
23
Thirty-six of these 48 countries are low-income countries, 11 are lower-middle income and one (Equatorial Guinea) is high income (World Bank, 2008).
Low income Afghanistan Burundi Cambodia Central African Republic Chad Comoros Congo, Dem. Rep. Côte d‟Ivoire Eritrea + Ethiopia Gambia Guinea
Guinea-Bissau Haiti + Kenya Laos Liberia Mauritania Myanmar + Nepal Niger Nigeria + North Korea + Pakistan
Papua New Guinea + Rwanda São Tomé and Principe Sierra Leone Solomon Islands Somalia Tajikistan Togo + Uganda Uzbekistan Yemen, Rep. Zimbabwe
Lower-middle income Angola Cameroon Congo, Dem. Rep. Djibouti
+ Iraq Kiribati Sudan Timor-Leste
Tonga Vanuatu + Palestinian administrated Areas
High income + Equatorial Guinea
Where data availability permits, the report presents and analyses comparable data by country and year. Where no data are available, the report presents aggregate data, trends, qualitative findings and illustrative boxes.
MAIN ISSUES, GAPS AND CONSTRAINTS
A number of issues, gaps, and constraints with regard to monitoring resource flows to fragile and conflict-affected states include the following:
Three main data gaps that are critical to form a complete understanding of the volume of resource flows to individual countries are:
i. The challenges involved in having donor agencies communicate forward estimates of resource flows to individual countries;
ii. Comprehensive and comparable data on resource flows from non-DAC countries, some of which are major donors to fragile states; and
iii. Comprehensive and comparable data on non-official resource flows (for instance through NGOs or private donors/philanthropic foundations).
This monitoring exercise is undertaken in the context of other initiatives required to maximise the effectiveness of resource flows in achieving development goals, including i) global aid allocation decisions, i.e. the criteria by which aggregate aid should be allocated among countries receiving aid, and the process by which donors ensure that these criteria are met through co-ordination of their aid policies; and ii) the co-ordination of approaches and responses by donors (where

2008 ANNUAL REPORT ON RESOURCE FLOWS TO FRAGILE AND CONFLICT-AFFECTED STATES
24
feasible and appropriate with the national government) at the level of individual countries, which can address more detailed issues about aid modalities and constraints on aid effectiveness and absorptive capacity, as well as the Paris Declaration agenda on improving harmonisation.
There have been new developments in the literature that attempt to draw empirical conclusions about the effectiveness of aid in fragile states, and in particular aid absorptive capacity. It is not yet possible to identify a firmly, empirically grounded consensus on some of the most critical questions for determining whether or not a particular country is or is not under-aided. This suggests the need for caution in interpreting the findings of the monitoring exercise as having any specific direct conclusions for aid levels, without much more detailed country-level analysis. If possible, this exercise should be complemented with selected country case studies on aid absorption issues.
The monitoring exercise is focused on providing a regular reporting and monitoring mechanism on resource flows to fragile states, and can only modestly contribute to addressing these wider issues and concerns.
RELATED INITIATIVES
There are a number of initiatives related to this exercise that need to be mentioned. These include work on:
Donor’s forward spending plans – The DAC 2008 Survey on Aid Allocations Policies and Indicative Forward Spending Plans is collecting information on donors‘ forward spending plans to their recipient countries. The survey also presents descriptive information on each donor‘s aid allocation mechanism (OECD/DAC 2008a). Results from the 2008 Survey are presented and used in the analysis.
Concentration and fragmentation of aid – This work focuses on a better division of labour among donors, in response to concerns about the concentration and fragmentation of aid.25 The work examines the issue of having too many donors in some countries and sectors and too few in others, and how to improve the division of labour among donors. This issue is viewed as important due to the significant increases in current aid levels, which are delivered by an ever increasing number of actors. The analysis focuses in particular on country programmable aid (CPA),26 and the number of donors present in partner
25 There is no universal measure of fragmentation of aid; different methods and techniques can be used, depending on the scope of analysis. Fragmentation of aid is here understood to mean a large number of donors who each provide a small share of total aid to a given country. It is argued that each government-to-government co-operation programme creates transaction costs to the partner country. Such costs constitute an impediment to the effectiveness of aid, especially in countries with low institutional capacity. Hence, greater fragmentation will incur higher transaction costs (OECD/DAC, 2008a).
26 CPA is a measure developed by the OECD DAC that reflects the amount of aid that can be programmable at partner country level. CPA is defined through exclusion, by subtracting from total gross ODA the aid that: is unpredictable by nature (humanitarian aid and debt relief); entails no cross-border flows (administrative costs, imputed student costs, promotion of development awareness, and research and refugees in donor countries); does not form part of co-operation agreements between governments (food aid and aid from local governments); or is not country programmable by the donor (core funding of NGOs) (OECD/DAC, 2008a).

25
countries. It also considers donor contributions to specific sectors as a background for discussion on scaling up aid, including scenarios for future aid flows that will present a range of possible financing paths (i.e. ―business as usual‖, ―scaling up of aid‖ and ―financing needs‖) (OECD/DAC, 2008a).
Volatility and predictability of aid – Work and analysis is carried out here also. Volatility of aid is a statistical measure27 describing past flows. Predictability is about expectations for the future, in the short term (within the financial year), medium term (three to five years) and long term (above five years). The underlying assumption for this work is that improving the predictability of aid will help to better manage the volatility of aid. This work is a response to the scaling up of aid and associated need for partner countries to plan their budgets over the medium term. While the majority of resources comes from domestic revenue, aid accounts for a high share of public finance in many countries. Hence the focus will be on how to improve donor policies on sharing information about future aid levels with their major partner countries (OECD/DAC, 2007b).
Non-DAC donors – The OECD is the ―platform‖ for the Heiligendamm Process at the request of the G8. This was an outcome of the G8 Summit in June 2007, where leaders reached agreement with Brazil, China, India, Mexico and South Africa on a two- year structured dialogue on four topics — innovation and intellectual property rights, investment, climate change and development co-operation (particularly in Africa). In May 2007 at the OECD Ministerial Council Meeting it was decided to commence negotiations for membership with Chile, Estonia, Israel, Russia and Slovenia, and negotiations to enhance relations with a view to possible membership with Brazil, China, India, Indonesia and South Africa. This outcome was beyond expectations, following several years of deliberation among members and over a decade of developing OECD work with non-members.
27 It is common practice to measure volatility by dividing the standard deviation by the mean; nevertheless, this calculation often says little about predictability, since aid flows may stay at similar levels for many years and then undergo a change in trends because of political or other factors. The volatility of aid can also increase sharply with debt relief or large loan disbursements, as well as with exchange rate fluctuations that may have little impact on the flow of real resources. Another factor that may affect volatility is stronger conditionalities used in the context of programme-based approaches (OECD/DAC, 2007b).

2008 ANNUAL REPORT ON RESOURCE FLOWS TO FRAGILE AND CONFLICT-AFFECTED STATES
26
Bibliography
IDA (2007), ‗Aid Architecture: An Overview of the Main Trends in Official Development Assistance Flows‘, Washington D.C.: International Development Association OECD/DAC (2007a), ‗Financing Development – Aid and Beyond‘, Paris: Organisation for Economic Cooperation and Development OECD/DAC (2007b), ‗DAC Technical Meeting on Aid Allocations and Scaling up of Results – Summary Record (DCD/M(2007)5/FINAL)‘, Paris: Organisation for Economic Cooperation and Development OECD/DAC (2008a), ―Scaling Up: Aid Fragmentation, Aid Allocation and Aid Predictability – Report of 2008 Survey of Aid Allocation Policies and Forward Spending Plans‖, Paris: Organisation for Economic Cooperation and Development World Bank (2007a), ‗Global Development Finance – The Globalisation of Corporate Finance in Developing Countries‘, Washington D.C.: World Bank World Bank (2007b), ‗Global Monitoring Report – Confronting the Challenges of Gender Equality and Fragile States‘, Washington D.C.: World Bank World Bank (2008), ‗World Bank list of economies‘, July 2008

27
SECTION I. OFFICIAL DEVELOPMENT
ASSISTANCE
CHAPTER 1. TRENDS IN OFFICIAL DEVELOPMENT ASSISTANCE
OFFICIAL DEVELOPMENT ASSISTANCE FLOWS TO FRAGILE AND CONFLICT-AFFECTED STATES
Overall trends
Total net ODA reached USD 103.5 billion in 2007 (from USD 104.4 billion in 2006 and USD 107.1 billion in 2005). Donors have responded to the challenges of fragile and conflict-affected states with more aid: In 2007 USD 37.2 billion of ODA went to fragile and conflict-affected states, or 38.4 percent of total ODA (See Figure 1.1).
Figure 1.1 Net ODA from all donors to fragile and conflict-affected states (USD billion, constant 2006)
0
50
100
150
200
1995 1996 1997 1998 1999 2000 2001 2002 2003 2004 2005 2006 2007
ODA to fragile and conflict-affected states Other ODA Total ODA
Total net ODA disbursements from all donors to fragile and
conflict-affected states
0
10
20
30
40
50
60
1995 1996 1997 1998 1999 2000 2001 2002 2003 2004 2005 2006 2007
Total net ODA Total net ODA excluding debt relief grants
Source: OECD DAC online database (2000-2007).
However, half the ODA for 48 fragile and conflict-affected states benefited just five countries in 2007: Iraq (23 percent), Afghanistan (9.9 percent), Ethiopia, Pakistan and Sudan (See Figure 1.2) and around a fifth was in the form of debt relief.

2008 ANNUAL REPORT ON RESOURCE FLOWS TO FRAGILE AND CONFLICT-AFFECTED STATES
28
Figure 1.2 Fifty percent of net ODA have benefited just five out of 48 fragile and conflict-affected states in 2007 (USD billion, constant 2006)
0
1
2
3
4
5
6
7
8
9
Iraq
Afgh
anistan
Ethio
pia
Pakistan
Sud
anN
igeria
Cam
ero
on
Pale
stinian
Ad
m.
Ugan
da
Ke
nya
Co
ngo
, De
m. R
ep
.R
wan
da
Haiti
Libe
riaC
amb
od
ia
Ne
pal
Nige
rSie
rra Leo
ne
Zimb
abw
e
Bu
run
di
Laos
Som
alia
Mau
ritania
Ch
ad
Pap
ua N
ew
Gu
ine
a
Timo
r-Leste
An
gola
Solo
mo
n Islan
ds
Gu
ine
aY
em
en
Tajikistan
Myan
mar
Ce
ntral A
frican R
ep
.
Uzb
ekistan
Co
te d
'Ivoire
Eritrea
Co
ngo
, Re
p.
Gu
ine
a-Bissau
Togo
Djib
ou
ti
Ko
rea, D
em
. Re
p.
Gam
bia
Van
uatu
Co
mo
ros
Sao To
me
& P
rincip
e
Equ
atorial G
uin
ea
Ton
gaK
iribati
Source: OECD DAC online database (2000-2007).
Composition of ODA to fragile and conflict-affected states
The proportion of country programmable aid (CPA, see definition under footnote 26) is lower in fragile states than in other developing countries.
Figure 1.3 Composition of ODA to fragile and conflict-affected states (2005)

2008 ANNUAL REPORT ON RESOURCE FLOWS TO FRAGILE AND CONFLICT-AFFECTED STATES
29
AID ABSORPTIVE CAPACITY: A REVIEW OF THE ISSUES
Recent discussions of aid effectiveness have included an attention to aid absorptive capacity in the context of scaling up aid flows. There is an ongoing debate as to whether planned increases in aid can or have been absorbed or spent, and whether recipient countries have enacted the right structural and macroeconomic policies to be able to use aid efficiently and effectively for poverty reduction (see Box 1.1).
Results from recent studies show that many countries did not fully absorb or spend the aid. For instance, an International Monetary Fund (IMF) study estimated that aid-receiving countries in sub-Saharan Africa spent between 30% and 80% of their Poverty Reduction Growth Facility (PRGF) receipts, depending on the macroeconomic conditions and level of reserves (Independent Evaluation Office, 2007). In particular, econometric analysis shows that the critical level of reserves is enough reserves to finance 2.5 months of imports: Countries below that level tended to absorb almost no aid. Similarly, countries with inflation in excess of 7% per annum did not increase programmable spending in response to incremental aid.
Box 1.1. Dimensions of aid absorptive capacity
Macroeconomic – Monetary and fiscal policy stances affect the level of aid that can be effectively used in a given period (including concerns about Dutch disease). The contention is that macroeconomic policy needs to tailor itself to accommodate aid, while pursuing stabilisation, inflationary control, growth and other objectives.
Sectoral – Specific sectors may face particular constraints with regard to absorbing aid surges – for example, in health and education – because they are the subject of numerous thematic funds [e.g. Education For All/Fast Track Initiative (EFA/FTI) or the Global Fund to Fight AIDS, Tuberculosis and Malaria (GFATM)], and/or have specific and intensive managerial and other requirements for effective service delivery.
Governance – Weaknesses in transparency and accountability and the lack of sound public financial management systems generate additional constraints, both in themselves and in combination with the reporting and financial requirements of donors. Recent evidence also suggests that increased aid funding can undermine accountability to local stakeholders and domestic capacity to mobilize resources (Moss et al., 2006).
Source: 2007OECD Report on Resource Flows to Fragile States.
Assessments of aid absorption capacity based on these thresholds for inflation and months of import financing available vis-à-vis reserves – which are average estimates based on cross-country regression analysis – are necessarily crude. United Nations ―Resource Gap‖ estimates and discussions of aid absorptive capacity have, however, relied on these thresholds to make assessments of absorptive capacity – in Burundi, Guinea Bissau and Sierra Leone, among others. Nevertheless, there is no substitute for detailed country-level analysis of macroeconomic, sub-national, institutional, and donor modality-related constraints to arrive at a reasonable picture of absorptive capacity.
The literature on aid absorptive capacity specifically in countries in fragile and conflict-affected situations is limited, and that available has focused on cross-country
2008 ANNUAL REPORT ON RESOURCE FLOWS TO FRAGILE AND CONFLICT-AFFECTED STATES
30
regression analysis – thus providing ―averages‖ rather than country-specific measures. Feeny and McGillivray (2008) compare and analyse aid allocations to fragile states with a growth-efficient allocation. The ratio of ODA to Gross National Income (GNI) is utilised as an indicator for capacity to use aid under the assumption that there are diminishing returns to aid as a proportion of national income. Literature suggests that aid absorptive capacity for fragile states is around 15-30% of GDP. For instance, McGillivray and Feeny (2006a, 2006b) argue that while most fragile states are ―under-aided‖ (i.e. they can efficiently absorb greater amounts of aid than they currently receive), one group of ―highly‖ fragile states28 can only effectively absorb one-third of the amounts of aid.29 Hence, providing aid in excess will reduce aid effectiveness by decreasing its incremental impact the growth of aid per capita.
On the other hand there is no empirical consensus on the level at which returns to aid become negative. Aid absorptive capacity varies greatly across countries and contexts. Moreover, for fragile states where data quality is especially poor, the policy implications of the available evidence are even less clear. The conclusion is that more detailed country-level analysis needs to be carried out before making any further judgements about the levels of aid absorptive capacity in different fragile states and contexts (See Box 1.2 for an example of country-level analysis on aid absorptive capacity in Yemen).
28 A fragile state is here defined as a country falling into the two bottom CPIA quintiles. A group of ―highly‖ fragile states is defined as countries falling into the bottom CPIA quintile.
29 The threshold (measured as ODA as a percentage of GDP) for highly fragile states is argued to be 13.88%, while the other fragile states have a threshold of 38.33%.

2008 ANNUAL REPORT ON RESOURCE FLOWS TO FRAGILE AND CONFLICT-AFFECTED STATES
31
Box 1.2. Country level analysis on aid absorptive capacity in Yemen
An analytical study of aid absorptive capacity in Yemen took as its starting point a conceptual framework focusing on four key sources of constraints:
Macroeconomic constraints – These were of limited relevance. Compared to other many countries at similar levels of economic development, Yemen has received low levels of aid per capita and in relation to GDP/GNI. For instance, in 2005 Yemen had a CPA-to-GNI ratio of 2%, which is projected to fall to 1.9% in 2010 (OECD/DAC, 2008a). These charts suggest that Yemen is unlikely to face significant macroeconomic constraints in increasing the level of aid substantially, although a large and rapid increase in aid may incur difficulties.
Institutional and policy constraints – The establishment of a broadly agreed sector policy seems to be an essential requirement for ensuring projects are well aligned to government priorities. It also helps to provide a framework for agreeing roles and management procedures with donors. The study found significant progress in alignment of donor activities with government priorities in the basic education and water sectors.
Management and technical capacity constraints – Two key constraints in this area were noted. First, the study found that major weaknesses remain in the pool of national capacity for strengthening aid management. Second, several constraints on the government‟s capacity to establish reporting and public finance management (PFM) systems were identified, including a lack of links between policy making and budgeting processes; lack of timely financial reports; poor internal audit and control systems; and a lack of compliance with formal rules.
Constraints generated by donor behaviour – There were a variety of procurement systems across public sector organisations reflecting differing levels of donor involvement and a lack of donor confidence in the government‟s procurement processes. Generally, World Bank procurement procedures are being used for donor-funded activities, but these are not always well suited to need. Reporting and financial management arrangements for donor-funded activities were found to be driven by the requirements of donor agencies rather than by the wider information and management priorities of government. As a result, multiple reporting systems were in place.
Main conclusions – This study points to a degree of variation between and within different sectors in the speed and quality of aid absorption. The study found that the critical feature of sectors and organisations that have made particular progress is the existence of a coherent (sector) strategy that sets out agreed objectives and clearly defines the roles and responsibilities of each stakeholder. However, a major difficulty is the lack of consistent data across sectors and donors on aid commitments and disbursements. As a headline indicator, large discrepancies between actual disbursements and commitments or planned disbursements can be used to proxy overall absorption constraints – but consistent assessment of this has been made difficult due to data availability.
Source: Adapted from Yemen Ministry of Planning and International Cooperation and Oxford Policy Management (OPM), 2006.
Recent papers have also attempted to analyse absorptive capacity issues in detail specifically from the angle of post-conflict countries. Elbadawi, Kaltani and Schmidt-Hebbel (2007) show that although post-conflict countries receive substantial aid flows after brokering a peace, the flows are not well synchronised with these countries‘ capacity to absorb them. The aid tends to surge immediately after the cessation of hostilities and gradually taper off thereafter. One argument put forward for why such timing may be sub-optimal is that country capacity to absorb aid is in fact lowest immediately after conflict (Collier and Hoeffler, 2002).

2008 ANNUAL REPORT ON RESOURCE FLOWS TO FRAGILE AND CONFLICT-AFFECTED STATES
32
Consistent with this explanation, Eldabawi, Kaltani and Schmidt-Hebbel (2007) find that several post-conflict countries did not spend the full amount of aid, which concurs with the response of other aid-receiving countries. This decision to ―save‖ rather than ―spend‖ reflects the widely different macroeconomic conditions inherited at the onset of the peace. For example, El Salvador and Ethiopia started peace with high domestic debt ratios, which prompted their governments to use part of their aid in reducing public debt levels. Burundi, Ethiopia and Rwanda, concerned with exchange rate competitiveness, also accumulated reserves so as to prevent appreciation. Assessment of macro outcomes in these countries suggests that post-conflict countries see aid as a source to finance post-conflict budgets, but also strengthen public financial positions.
Other analysis – for example Gupta, 2008 – points to the necessity to assess fragile states‘ ―capacity to absorb aid at the sectoral and sub-national levels, and the strength of their fiscal institutions in deciding how much and how fast to spend aid‖ (see Box 1.3). Further, it is argued that it may make sense to ―frontload‖ spending for countries emerging from a conflict – otherwise, fragile states should seek to smoothen their spending against the background of aid volatility and uncertainty.
Box 1.3. Sectoral absorptive capacity and institutional capacity
Sectoral absorptive capacity – Conflicts affect different sectors of the economy in different ways. Besides decreasing the overall resource envelope generally, and that available to the social and growth-generating sectors in particular, conflict destroys physical assets in the economy. Once reconstruction begins, countries find that they are constrained by the lack of skilled manpower due to persons killed, injured, emigrating, etc. Moreover, in the case of protracted crises, a “lost generation” of relatively unskilled young people resulting from disruptions to the education systems may be the only manpower available. These skill shortages can pose binding constraints, in both the medium and short run, to aid-financed expenditures. Where sub-national capacities to spend and provide services are uneven, these constraints will be even more pronounced.
Institutional capacity – Institutional constraints are particularly binding in fragile contexts – here, in fact, they define fragility. First, fiscal institutions tend to be significantly weaker in fragile states as shown by data from Public Expenditure and Financial Accountability Assessments (PEFA), the Heavily Indebted Poor Countries Public Expenditure Tracking Assessment and Action Plan (HIPC/AAP) exercise, and the IMF‟s fiscal Report on Observance and Codes assessments. According to the HIPC/AAP exercise for which data are available for five fragile states, the greatest weaknesses are in budget execution, followed by budget reporting (Gupta, 2008, p. 9). Data availability in this area is notoriously low and so generalisations are difficult to make; data for the HIPC/AAP exercise were available only for Chad, the Democratic Republic of Congo, Guinea Bissau, Niger and São Tomé and Principe – and this data is available only from 2004.
Source: Gupta (2008).
In conclusion, the hypothesis that institutions matter particularly acutely as an absorptive capacity constraint in fragile and conflict-affected situations – not just in the short run, but also in the medium-to-long run – indeed appears plausible. However, more country-level research is needed to uncover the precise contribution of institutional factors to such constraints.

2008 ANNUAL REPORT ON RESOURCE FLOWS TO FRAGILE AND CONFLICT-AFFECTED STATES
33
AID PROJECTIONS, VOLATILITY AND PREDICTABILITY
Previous monitoring reports have highlighted the importance of gathering data on future/planned aid allocations in order to identify countries that may face significant changes in aid levels. Until recently, no information was available that enabled monitoring of these allocations. In 2008, the DAC conducted its first full annual Survey on Aid Allocations Policies and Indicative Forward Spending Plans (OECD/DAC, 2008a).30 The survey provides information on aid projections in an attempt to identify resources gaps and opportunities for scaling up aid in individual partner countries, as well as for improving the medium-term predictability of aid in line with the Paris Declaration commitments. In addition, a new measure on planned expenditure for CPA is used with a broad indication of trends in future aid levels31 for 153 countries.
Table 1.1 Projected increase in aid 2005 – 2010
CPA baseline CPA planned Change CPA/GNI
2005 2008 2009 2010 2005 to 2010 2005 2010
constant 2005 USD million % USD million %
Kenya 630 1,083 1,236 1,373 118% 743 3.3 5.7
Ethiopia 1,094 1,449 1,516 1,617 48% 523 9.6 9.2
Sudan 469 859 925 970 107% 501 1.8 2.2
Nigeria 760 977 1,058 1,137 50% 377 0.9 0.9
Pakistan 1,520 1,665 1,971 1,834 21% 314 1.4 1.2
Cameroon 258 422 480 547 112% 289 1.6 2.7
Nepal 372 586 632 649 74% 277 4.9 7.2
Congo, Dem. Rep. 890 1,012 1,073 1,123 26% 233 13.2 10.9
Uganda 980 1,052 1,120 1,208 23% 228 11.4 10.3
Côte D‟Ivoire 86 311 306 312 263% 226 0.6 1.8
Somalia 59 154 187 209 254% 150 .. ..
Liberia 95 284 301 238 151% 143 22.8 35.7
Rwanda 500 537 582 643 29% 143 23.6 23
Burundi 193 273 300 317 64% 124 24.9 31.6
Afghanistan 2,405 2,546 2,535 2,525 5% 120 32.8 22.9
Palestine 619 673 711 738 19% 119 14 ..
Source: OECD/DAC, 2008a.
The results show that a total of 102 countries can expect a real increase in their aid by 2010; of these, 16 countries in fragile and conflict-affected situations can expect an increase of USD 100 million or more (see Table 1.1). In terms of percentage change, increases in aid are significant for a number of countries that start with a very low 2005 baseline (aid is below USD 100 million), notably Cote d‘Ivoire, Somalia and Liberia; the percentage increase in aid levels for these countries for 2010 is above 150%.
30 http://www.oecd.org/dataoecd/37/20/40636926.pdf
31 The data do not reflect commitments to future aid levels, but projected CPA disbursements for each partner country as reported by DAC members and major multilateral organisations, supplemented by DAC Secretariat estimates (OECD/DAC, 2008a).
2008 ANNUAL REPORT ON RESOURCE FLOWS TO FRAGILE AND CONFLICT-AFFECTED STATES
34
More worryingly, however, is that 15 countries in fragile and conflict-affected situations can expect a decrease in aid by 2010 (Table 1.2, Table 1.3). Apart from the special case of Iraq, there are six countries – Chad, Eritrea, Guinea, Solomon Islands, Tajikistan and Timor-Leste – that can expect a decrease in aid levels of more than USD 20 million (see Figure 1.4). Several of these countries have in previous monitoring reports been highlighted as cases that deserve special and co-ordinated attention. Sustained international support is needed, in particular for those countries in post-crisis situations where evidence suggests that aid tends to tail off just as countries reach the point where they could use aid more effectively. A significant decrease (48%) in aid is also projected for North Korea, although increasing aid levels in this environment may be difficult to achieve.

2008 ANNUAL REPORT ON RESOURCE FLOWS TO FRAGILE AND CONFLICT-AFFECTED STATES
35
Table 1.2 Aid projections, 2008 - 2010
CPA Baseline CPA planned Change CPA/GNI
2005 2008 2009 2010 2005 to 2010 2005 2010
Constant 2005 USD million % USD million %
Afghanistan 2,405 2,546 2,535 2,525 5% 120.0 32.8 22.9
Angola 293 289 304 318 9% 25.0 1 0.5
Burundi 193 273 300 317 64% 124.0 24.9 31.6
Cambodia 484 529 540 573 18% 89.0 8.1 6.5
Cameroon 258 422 480 547 112% 289.0 1.6 2.7
Central African Republic
73 84 94 105 44% 32.0 5.4 6.1
Chad 233 207 202 195 -16% -38.0 4.8 3.7
Comoros 15 33 33 32 113% 17.0 3.9 7.5
DRC 890 1,012 1,073 1,123 26% 233.0 13.2 10.9
Congo Rep. 123 84 91 105 -15% -18.0 2.8 1.7
Côte D‟Ivoire 86 311 306 312 263% 226.0 0.6 1.8
Djibouti 54 51 50 48 -11% -6.0 7 4.6
Equatorial Guinea 27 29 34 40 48% 13.0 0.8 0.9
Eritrea 171 125 122 127 -26% -44.0 17.7 12
Ethiopia 1,094 1,449 1,516 1,617 48% 523.0 9.6 9.2
Gambia 53 57 63 71 34% 18.0 11.8 11.6
Guinea 150 133 124 127 -15% -23.0 4.6 3.2
Guinea-Bissau 57 45 46 48 -16% -9.0 19.8 14.3
Haiti 383 436 438 451 18% 68.0 8.7 8.7
Iraq 7,286 4,843 4,798 4,784 -34% -2502.0 .. ..
Kenya 630 1,083 1,236 1,373 118% 743.0 3.3 5.7
Kiribati 27 27 27 28 4% 1.0 23.8 22
North Korea 21 12 11 11 -48% -10.0 .. ..
Laos 291 335 324 330 13% 39.0 11.1 8.7
Liberia 95 284 301 238 151% 143.0 22.8 35.7
Mauritania 156 184 177 181 16% 25.0 8.2 7.1
Myanmar 92 113 118 123 34% 31.0 .. ..
Nepal 372 586 632 649 74% 277.0 4.9 7.2
Niger 359 330 343 356 -1% -3.0 10.6 8.4
Nigeria 760 977 1,058 1,137 50% 377.0 0.9 0.9
Pakistan 1,520 1,665 1,971 1,834 21% 314.0 1.4 1.2
Palestine 619 673 711 738 19% 119.0 14 ..
Papua New Guinea 290 310 325 317 9% 27.0 6.4 5.5
Rwanda 500 537 582 643 29% 143.0 23.6 23
São Tomé and Principe
32 17 17 16 -50% -16.0
Sierra Leone 262 217 234 248 -5% -14.0 22.1 15.1
Solomon Islands 192 108 117 116 -40% -76.0 64.2 32.1
Somalia 59 154 187 209 254% 150.0 .. ..
Sudan 469 859 925 970 107% 501.0 1.8 2.2
Tajikistan 167 154 149 140 -16% -27.0 7.5 4.6
Timor-Leste 176 144 143 145 -18% -31.0 25.3 17.3
Togo 51 69 72 72 41% 21.0 2.4 2.9
Tonga 33 24 23 22 -33% -11.0 15.7 10.4
Uganda 980 1,052 1,120 1,208 23% 228.0 11.4 10.3
Uzbekistan 145 173 181 193 33% 48.0 1 0.9
Vanuatu 39 51 56 53 36% 14.0 11.3 12.5
Yemen 297 335 342 356 20% 59.0 2 1.9
Zimbabwe 148 215 229 230 55% 82.0 .. ..
Source: OECD/DAC, 2008a.

2008 ANNUAL REPORT ON RESOURCE FLOWS TO FRAGILE AND CONFLICT-AFFECTED STATES
36
Figure 1.4 Projected decrease in aid exceeding USD 20 million
0
50
100
150
200
250
Chad Solomon
Islands
Timor-
Leste
Eritrea Tajikistan Guinea
Co
nst
ant
20
05
USD
mil
lio
n
2005
2010
Source: OECD/DAC (2008a)
Table 1.3 Projected decrease in aid 2005 – 2010
CPA baseline CPA planned Change CPA/GNI
2005 2008 2009 2010 2005 to 2010 2005 2010
Constant 2005 USD million % USD million %
Iraq 7,286 4,843 4,798 4,784 -34% -2,502 .. ..
Solomon Islands 192 108 117 116 -40% -76 64.2 32.1
Eritrea 171 125 122 127 -26% -44 17.7 12
Chad 233 207 202 195 -16% -38 4.8 3.7
Timor-Leste 176 144 143 145 -18% -31 25.3 17.3
Tajikistan 167 154 149 140 -16% -27 7.5 4.6
Guinea 150 133 124 127 -15% -23 4.6 3.2
Congo, Dem. Rep. 123 84 91 105 -15% -18 2.8 1.7
São Tomé & Principe 32 17 17 16 -50% -16
Sierra Leone 262 217 234 248 -5% -14 22.1 15.1
Tonga 33 24 23 22 -33% -11 15.7 10.4
North Korea 21 12 11 11 -48% -10 .. ..
Guinea-Bissau 57 45 46 48 -16% -9 19.8 14.3
Djibouti 54 51 50 48 -11% -6 7 4.6
Niger 359 330 343 356 -1% -3 10.6 8.4
Source: OECD/DAC, 2008a.
In this context, the DAC survey shows that aid dependency (measured as the ratio of CPA to GNI) is expected to decrease or remain constant for a number of countries – 23 of which are countries in fragile and conflict-affected situations. This shows a scope for increases in aid without becoming more aid dependent, most notably in Chad, the Democratic Republic of Congo, Djibouti, Eritrea, Guinea, Guinea-Bissau, Niger, Tajikistan and Tonga. All have decreases in aid projected, but at the same time a CPA-to-GNI ratio that is below 15% and expected to fall by 2010 (see Figure 1.5).
There are, however, cases where the CPA/GNI ratio is likely to exceed 30%, for instance Burundi, Liberia and Solomon Islands.

2008 ANNUAL REPORT ON RESOURCE FLOWS TO FRAGILE AND CONFLICT-AFFECTED STATES
37
Figure 1.5 Aid projected to decrease, and CPA-to-GNI ratio below 15% in 2010
02468
101214161820
Guinea
-Biss
au
Eritr
ea
Tonga
Niger
Tajik
istan
Djibouti
Chad
Guinea
Congo, D
em. R
ep.
CP
A t
o G
NI r
atio
(%
)
2005
2010
Source: OECD/DAC, 2008a.
AID VOLATILITY AND PREDICTABILITY
As mentioned above, one of the aims of the DAC survey is to improve the medium-term predictability of aid in line with the commitments and targets of the Paris Declaration. It is recognised that greater predictability in the provision of aid flows is needed to enable developing countries to effectively plan and manage their development programmes; that includes strengthening the budget planning processes for managing external and domestic resources. Timely information on annual donor commitments and disbursements is also needed, in order for partner countries to accurately record aid flows in budget and accounting systems.
Previous monitoring reports have highlighted the importance of considering aid volatility and predictability. Volatility of aid is a statistical measure describing past flows (see Note 10). Aid is volatile if it moves up and down significantly between two periods. Predictability is about expectations for the future, in the short term (within the financial year), medium term (three to five years) and long term (above five years). Aid is predictable if recipients can be confident about the amount and timing of aid disbursements (Celasun and Walliser, 2008). The underlying assumption is that improved predictability of aid will help to better manage its volatility (OECD/DAC, 2007a).
For countries in fragile and conflict-affected situations, aid volatility and unpredictability is in all probability especially damaging given the often limited capacities to manage aid flows. For instance, McGillivray and Feeny (2006a, 2006b) argue that i) aid volatility to countries in fragile and conflict situations has increased

2008 ANNUAL REPORT ON RESOURCE FLOWS TO FRAGILE AND CONFLICT-AFFECTED STATES
38
since 1990; ii) aid is more volatile if compared to other low-income countries; and iii) post-conflict countries have in the past received the most volatile aid. Similarly, Levin and Dollar (2005) suggest that the volatility of aid to countries in fragile and conflict affected situations was more than twice that to other low-income countries. Countries with the most volatile aid during the period 1990-2004 were post-conflict countries, including Afghanistan, the Democratic Republic of Congo, Somalia and Timor-Leste.
Moreover, findings from an evaluation on the IMF‘s PRGF in sub-Saharan Africa (Independent Evaluation Office, 2007) show that the predictability of aid has been raised as a frequent issue in the Democratic Republic of Congo and Guinea-Bissau. The evaluation also found that post-conflict countries are more dependent on assistance from IMF staff in projecting aid flows.
Recent comprehensive research and empirical work by the IMF and the World Bank (Celasun and Walliser, 2008) also suggest that aid is highly unpredictable for many countries (see Box 1.4 for a summary of key findings and conclusions). Unpredictability of aid – measured as the average absolute difference between aid promised and aid given (as a percentage of GDP) during the period 1990-2005 – is higher for sub-Saharan Africa (3.4%) than any other region in the world. In particular, the difference between aid promised and aid given (as a percentage of GDP) is higher for countries in fragile and conflict-affected situations.

2008 ANNUAL REPORT ON RESOURCE FLOWS TO FRAGILE AND CONFLICT-AFFECTED STATES
39
Box 1.4. Aid predictability
Key findings:
Predictability issues are prevalent, and discrepancies between donor-reported commitments and disbursements are large in absolute terms, albeit with some declining trends in recent years. Nevertheless, deviations occur in both directions, resulting in both aid shortfalls and excess aid. Contrary to common belief, sub-Saharan Africa, in particular, tends to have excess disbursements exceeding disbursement shortfalls on average and over time.
Predictability of aid is significantly higher in countries that have had IMF engagements of longer duration, which may be taken as a proxy for the stability of the country environment and donor relations. Presence of emergency aid is related to less predictability, driven largely by a few cases with large emergency aid disbursements.
One of the firmly held beliefs is that low predictability results from donors not delivering on their original promises – the “donors never live up to their commitments” view. However, low predictability in fact is a result of disbursements exceeding and falling short of promises. This finding, which holds for both donor-reported and IMF programme-level aid data, implies that managing low predictability involves managing both aid shortfalls and excess disbursements.
Suggestions for moving forward:
There is a need to link the aid predictability debate more closely to the original question of aid effectiveness. As part of the debate on aid effectiveness, it is suggested to more clearly define the types of aid for which predictability is an essential ingredient. These could include budget support and aid flows for predominantly recurrent spending under project aid. A closer focus on such aid types would again be a factor in translating the good intentions of the Paris Declaration into practical changes.
To better measure the true impact of low aid predictability, data collection to measure the Paris Declaration commitments should be improved in at least two dimensions. More closely tracking the predictability of the aid categories whose effectiveness relies on predictability – specifically budget aid – would help in better identifying those areas where aid effectiveness is reduced by low predictability. This analysis would also avoid conflating factors such as slow project implementation with donor-induced delays. In addition, it is critical to record not only donor declarations but also the mutual expectations of donors and recipients arising from these declarations, to capture the implicit discount rates of aid commitments.
The persistence of the aid predictability problem, especially for budget support, would also suggest that some of the mechanisms of aid delivery to these countries should be reconsidered. One possible way is to lengthen aid allocation periods and tie them to slower-moving country indicators rather than reconsidering fast-disbursing aid volumes annually within annual conditionality frameworks. Such mechanisms could improve predictability, while keeping some flexibility to respond to changing country circumstances.
Source: Adapted from Celasun and Walliser (2008).
For instance, in Guinea-Bissau and Sierra Leone, fluctuations in aid have been equivalent to 10% and 9% of GDP, respectively (see Table 1.4, Columns 2 and 4).

2008 ANNUAL REPORT ON RESOURCE FLOWS TO FRAGILE AND CONFLICT-AFFECTED STATES
40
More worryingly, however, is that seven out of ten countries that experienced fluctuations in excess of 5% of GDP are countries in fragile and conflict-affected situations: Burundi, the Democratic Republic of Congo, Eritrea, Guinea-Bissau, Liberia, Sierra Leone and the Palestinian Administrated Areas. This again reinforces the need to carefully consider the predictability of aid.
Table 1.4 Unpredictable aid – differences in ODA commitments and disbursements as a % of GDP, averages, 1990-2005
Annual commitments Smoothed commitments
Commitments minus
disbursements
Absolute value of commitments
minus disbursements
Smoothed commitments
minus disbursements
Absolute value of smoothed commitments
minus disbursements
(% of GDP) (% of GDP) (% of GDP) (% of GDP)
Guinea-Bissau -5.5 10.0 -3.5 11.0
Sierra Leone -2.3 9.0 -5.6 5.8
Eritrea 1.1 6.9 -1.2 6.7
Liberia -2.2 6.8 -3.4 11.0
Palestinian Adm. Areas -3.1 5.5 -4.5 5.9
Burundi -2.2 5.4 -3.7 5.8
DRC -1.2 1.5 -3.0 8.2
Source: Celasun and Walliser, 2008.
USE OF COUNTRY SYSTEMS AND AID PREDICTABILITY
As mentioned above, it is recognised that greater predictability in the provision of aid flows is needed to enable developing countries to effectively plan and manage their development programmes. This includes strengthening of budget planning processes for managing external and domestic resources, and timely information on annual donor commitments and disbursements in order for partner countries to accurately record aid flows in budget and accounting systems (see Figure 1.6).
Figure 1.6 Use of country systems and aid predictability, 2007
0%
10%
20%
30%
40%
50%
60%
PFM systems Procurement systems Disbursements on schedule
Fragile and conflict-affected countries Other countries

2008 ANNUAL REPORT ON RESOURCE FLOWS TO FRAGILE AND CONFLICT-AFFECTED STATES
41
Source: OECD/DAC, 2008b.
Recent findings, however, suggest that there are certain differences for countries in fragile and conflict-affected situations. For instance, the most recent Paris Declaration survey shows that the average use of country systems (PFM and procurement) is lower for fragile states compared to all other countries surveyed (see Figure 1.6 and Table 1.5) (OECD/DAC, 2008b). The Paris Declaration survey, however, also indicates that the correlation between the quality of PFM systems and their use by donors is weak (i.e. even if the country systems are considered relatively stronger, they are not necessarily used – indicating that there may be other factors determining the extent to which country systems are used).
The extent to which aid disbursement is on schedule and recorded by the government for countries in fragile and conflict-affected situations varies widely – from 0% to 96% - and disbursements on schedule are on average lower for countries in fragile and conflict-affected situations (see Table 1.5).
Table 1.5 Use of country systems and aid predictability, 2007
PFM systems Procurement systems Disbursements on
schedule and recorded by government
Afghanistan 48% 18% 70%
Burundi 33% 35% 44%
Cambodia 14% 16% 96%
Cameroon 53% 63% 20%
Central African Rep. 24% 10% 73%
Chad 1% 11% 47%
Congo, Dem. Rep. 0% 1% 52%
Côte D‟Ivoire 0% 9% 78%
Ethiopia 47% 41% 67%
Haiti 46% 31% 74%
Kenya 54% 37% 33%
Laos 31% 16% 51%
Liberia 32% 0% 45%
Mauritania 8% 22% 0%
Nepal 68% 56% 67%
Niger 26% 37% 67%
Nigeria 0% 0% 38%
Papua New Guinea 16% 21% 0%
Rwanda 42% 43% 47%
Sierra Leone 20% 38% 7%
Sudan 3% 0% 19%
Togo 4% 15% 30%
Uganda 57% 37% 52%
Yemen 5% 44% 14%
Average, fragile and conflict-affected countries 26% 25% 45%
Average, other countries 39% 41% 58%
Source: OECD/DAC, 2008b.

2008 ANNUAL REPORT ON RESOURCE FLOWS TO FRAGILE AND CONFLICT-AFFECTED STATES
42
Bibliography
Celasun, O. and J. Walliser (2008), ―Predictability of Aid: Do Fickle Donors Undermine Aid Effectiveness?‖, Economic Policy, Vol. 23, July, pp. 545-94. Collier, P. and A. Hoeffler (2002), ―Aid, Policy and Growth in Post-Conflict Societies‖, World Bank Policy Research Working Paper 2902, World Bank, Washington, DC. Elbadawi, I., L. Kaltani and K. Schmidt-Hebbel (2007), ―Post-Conflict Aid, Real Exchange Rate Adjustment, and Catch-up Growth‖, Paper presented at the World Bank Conference on Post-Conflict Transitions, 30 April-1 May, Washington, DC. Feeny, S. and M. McGillivray (2008), ―Aid Allocation to Fragile States: Aid Absorptive Capacity Constraints‖, Journal of International Development. Gupta, S. (2008), ―Enhancing Effective Utilization of Aid in Fragile States‖, UNU-WIDER Research Paper No. 2008/07, UNU-WIDER, Helsinki. Independent Evaluation Office (2007), An Evaluation of the IMF and Aid to Sub-Saharan Africa, International Monetary Fund, Washington, DC. Levin, V. and D. Dollar (2005), The Forgotten States: Aid Volumes and Volatility in Difficult Partnership Countries 1992-2002, World Bank, Washington, DC. Moss, T. et al. (2006), ‗An Aid-Institutions Paradox?‘ A Review Essay on Aid Dependency and State Building in Sub-Saharan Africa‘, Washington D.C.: Center for Global Development McGillivray, M. and S. Feeny (2006a), Aid and Growth in Fragile States, United Nations University-World Institute for Development Economics Research, Helsinki. McGillivray, M. and S. Feeny (2006b), Aid Allocation to Fragile States: Absorptive Capacity and Volatility, United Nations University-World Institute for Development Economics Research, Helsinki. OECD (2007a), ―Methodology for the DCA 2007 Survey of Aid Allocation Policies and Indicative Spending Plans‖, DCD/RD(2007)5/RD1. OECD (2007b), ―DAC Technical Meeting on Aid Allocations and Scaling up of Results – Summary Record‖, DCD/M(2007)5/FINAL. OECD/DAC (2008a), ―Scaling Up: Aid Fragmentation, Aid Allocation and Aid Predictability – Report of 2008 Survey of Aid Allocation Policies and Forward Spending Plans‖, May 2008. OECD/DAC (2008b), ―Better Aid: 2008 Survey on Monitoring the Paris Declaration Making Aid More Effective by 2010‖, November.

2008 ANNUAL REPORT ON RESOURCE FLOWS TO FRAGILE AND CONFLICT-AFFECTED STATES
43
Yemen Ministry of Planning and International Cooperation and Oxford Policy Management (OPM) (2006), ―Aid Absorption Capacity‖, Paper prepared for Republic Of Yemen Consultative Group Meeting, London, 15-16 November.

2008 ANNUAL REPORT ON RESOURCE FLOWS TO FRAGILE AND CONFLICT-AFFECTED STATES
44
CHAPTER 2. DAC DONOR PRESENCE, CONCENTRATION AND
FRAGMENTATION
Fragmentation of aid is generally understood to mean a large number of donors in a country or sector. Recent work on fragmentation and concentration of aid has therefore focused on achieving a better division of labour between donors at the country and sector levels in order to reduce transaction costs. Improved division of labour means deciding on which donor/s should do what in a particular country or sector. This can involve, for instance, improved donor complementarity, including delegated approaches, silent partnerships and pooled funding. Improved division of labour can be pursued from an in-country perspective, where the aim is to encourage each donor to consider its role in the country and work in fewer sectors (without diminishing overall aid). It can also be pursued from a cross-country perspective, where the aim is to reach a balance in the number of donors in different countries, with each country receiving aid according to its needs (without donor ―darlings‖ and donor ―orphans‖) (OECD/DAC, 2008).
Countries in fragile and conflict-affected situations, which often have severe capacity constraints and a wide variety of international actors present (security, humanitarian, diplomacy, development, etc.), may face particular challenges in managing a large number of actors. On the other hand, having access to a limited number of donors may become a cause of concern if there is a risk of abrupt changes in donor priorities and policies. For instance, one of the major donors may decide to decrease its aid flows and this shortfall in resources may not be ―picked up‖ or balanced by other donors. Although donor concentration should be encouraged, changes in donor priorities and policies could impact significantly on the predictability of aid flows to countries dependent on a few donors.
Fragmentation is viewed as being significant when the partner country has to deal with a large number of donors (15 or more) that provide just 10% of aid. Concentration is viewed as being significant when the partner country relies on a small number of donors that collectively provide over 90% of aid.
A number of countries can be identified that have access to a limited number of donors. For instance, 20 countries in fragile and conflict-affected situation receive two-thirds of aid from three donors or less (see Table 2.1). At the extreme is Iraq, dependent on one donor – the United States – which provides 95% of aid. Papua New Guinea and the Solomon Islands are dependent on Australia for 77% and 71% of aid, respectively. Afghanistan, Comoros, Djibouti, Equatorial Guinea and Yemen are dependent on one donor for 50% of aid.
In terms of fragmentation, 15 countries in fragile and conflict-affected situations depend on more than ten donors for 90% of aid (see Table 2.1). None of the countries in fragile and conflict-affected situations that are monitored has more than 15 donors providing 90% of aid. Moreover, several of these countries rely on three or less donors for more than 50% of aid. In order to draw any further conclusions, however, further country-level analysis and work is needed on donor composition and activities in specific sectors.

2008 ANNUAL REPORT ON RESOURCE FLOWS TO FRAGILE AND CONFLICT-AFFECTED STATES
45
Table 2.1 Donor concentration, averages, 2005 and 2006
Country No. of donors
No. of donors over 90% CPA
% of CPA by top donor
% of CPA by top 2 donors
% of CPA by top 3 donors
total % of CPA by top 3 donors
Afghanistan 29 9 United States (51%) United Kingdom (9%)
European Commission (8%)
68%
Angola 25 15 European Commission (16%)
IDA (13%) United States (10%)
39%
Burundi 25 12 IDA (31%) European Commission (15%)
Belgium (8.5%) 55%
Cambodia 27 13 Japan (22%) AsDF (15%) United States (12%)
49%
Cameroon 25 9 France (38%) European Commission (13%)
IDA (13%) 64%
Central African Republic
10 6 IDA (34%) France (21%) United States (15%)
70%
Chad 20 7 European Commission (24.5%)
IDA (24%) France (15%) 64%
Comoros 7 4 France (50%) European Commission (18%)
IDA (16%) 84%
DRC 24 8 IDA (43%) European Commission (22%)
Belgium (8%) 73%
Congo, Rep. 27 13 IDA (34%) European Commission (15%)
Belgium (9%) 58%
Côte D‟Ivoire 20 8 France (34%) United States (17%) European Commission (17%)
68%
Djibouti 11 6 France (50%) IDA (16%) United States (10%)
76%
Equatorial Guinea
8 5 Spain (54%) GFATM (11%) European Commission (10%)
75%
Eritrea 21 11 IDA (33%) European Commission (10%)
Italy (10%) 53%
Ethiopia 26 13 IDA (23%) United States (10%) European Commission (9%)
42%
Gambia 18 10 IDA (29%) AfDF (18%) GFATM (13%) 60%
Guinea 19 9 IDA (22%) United States (16%) France (13%) 51%
Guinea-Bissau 18 9 European Commission (34%)
Portugal (18%) IDA (15%) 67%
Haiti 22 8 United States (31%) IDB (19%) European Commission (12%)
62%
Iraq 25 1 United States (95%) United Kingdom (2%)
Japan (0.3%) 97%
Kenya 28 13 United States (17%) European Commission (15%)
United Kingdom (12%)
44%
Kiribati 6 4 Japan (42%) Australia (26%) European Commission (17%)
85%
North Korea 13 9 IFAD (23%) Switzerland (18%) UNDP (14%) 55%
Laos 25 13 AsDF (22%) Japan (19%) IDA (14%) 55%
Liberia 20 10 United States (43%) European Commission (15%)
GFATM (9%) 67%
Mauritania 20 9 IDA (29%) France (17%) European Commission (16%)
62%
Myanmar 19 11 Japan (30%) UNDP (12%) United Kingdom (10%)
52%
Nepal 26 12 AsDF (16%) United Kingdom (13%)
IDA (12%) 41%
Niger 24 12 IDA (24%) European France (17%) 59%

2008 ANNUAL REPORT ON RESOURCE FLOWS TO FRAGILE AND CONFLICT-AFFECTED STATES
46
Country No. of donors
No. of donors over 90% CPA
% of CPA by top donor
% of CPA by top 2 donors
% of CPA by top 3 donors
total % of CPA by top 3 donors
Commission (18%)
Nigeria 23 7 IDA (34%) European Commission (16%)
United Kingdom (16%)
66%
Pakistan 27 7 IDA (43%) ADB (16%) United States (12%)
71%
Palestinian Admin. Areas
24 12 United States (25%) European Commission (22%)
11% (Norway) 58%
Papua New Guinea
13 4 Australia (77%) European Commission (6%)
Japan (5%) 88%
Rwanda 27 10 United Kingdom (17%)
IDA (16.5%) European Commission (14%)
49%
São Tomé & Principe
12 7 Portugal (36%) European Commission (20%)
France (12%) 68%
Sierra Leone 21 10 European Commission (25%)
United Kingdom (24%)
IDA (19%) 68%
Solomon Islands 7 4 Australia (71%) European Commission (11%)
Japan (7%) 89%
Somalia 17 10 Norway (14.5%) United Kingdom (14%)
GFATM (13%) 42%
Sudan 27 13 United States (22%) European Commission (17.5%)
Norway (12.5%) 52%
Tajikistan 17 9 IDA (21.5%) United States (21%) AsDF (18.5%) 61%
Timor-Leste 21 10 Australia (22%) Portugal (20%) Japan (15%) 57%
Togo 17 9 France (33.5%) GFATM (16%) European Commission (15%)
65%
Tonga 6 5 Japan (28%) Australia (27%) New Zealand (20%)
75%
Uganda 27 13 IDA (25%) United States (14%) European Commission (8%)
47%
Uzbekistan 15 7 Japan (32%) United States (30%) Germany (9%) 71%
Vanuatu 7 5 Australia (46%) European Commission (15.5%)
New Zealand (14%)
76%
Yemen 19 8 IDA (48%) Germany (12%) The Netherlands (10%)
70%
Zimbabwe 21 13 United States (19%) European Commission (18%)
United Kingdom (12%)
49%
Source: OECD/DAC, 2008.

2008 ANNUAL REPORT ON RESOURCE FLOWS TO FRAGILE AND CONFLICT-AFFECTED STATES
47
Bibliography
OECD/DAC (2008), ―Scaling Up: Aid Fragmentation, Aid Allocation and Aid Predictability – Report of 2008 Survey of Aid Allocation Policies and Forward Spending Plans‖, May.

2008 ANNUAL REPORT ON RESOURCE FLOWS TO FRAGILE AND CONFLICT-AFFECTED STATES
48
SECTION II. AID: ONE PART OF A
COMPLEX EQUATION
CHAPTER 3. MIXING ODA AND NON-ODA FUNDS IN SUPPORT OF
SECURITY, STATE BUILDING AND PEACE BUILDING
ODA FUNDS FOR SECURITY, STATE BUILDING AND PEACE BUILDING
ODA funds that are used to support ―government; civil society and monetary institutions‖ and ―conflict prevention and resolution, peace and security‖ (codes used in the OECD Credit Reporting System) have overall been growing over the years (see Figure 3.1). However, on a country-by-country basis there is volatile support, reflecting a stop-and-go engagement and/or successive improvements and deterioration of the country context (see Figure 3.2).
Figure 3.1 ODA to fragile and conflict-affected states for governance and security (USD million, constant 2006)
-
1,000
2,000
3,000
4,000
5,000
6,000
7,000
2000 2001 2002 2003 2004 2005 2006 2007
Government, civil society and monetary institutions
Conflict prevention and resolution, peace and security
Total for both items
Source: OECD DAC online database (2000-2007).

2008 ANNUAL REPORT ON RESOURCE FLOWS TO FRAGILE AND CONFLICT-AFFECTED STATES
49
Figure 3.2 ODA funds for security, state building and peace building in Nepal
0
20
40
60
80
100
120
2000 2001 2002 2003 2004 2005 2006 2007
USD
mil
lio
n c
on
stan
t 2
00
6 p
rice
s
Government, civil society and monetary institutionsConflict prevention and resolution, peace and securityTotal for both items
Source: OECD DAC online database (2000-2007).
NON-ODA FUNDS IN SUPPORT OF SECURITY, STATE BUILDING AND PEACE BUILDING
Another aspect of international engagement and resource flows is peacekeeping operations and other security-related expenditures. Peace- and security-related expenditures can be classified as ODA or non-ODA depending on the type of activity being funded. One therefore also needs to take into account the fact that resources may be channelled as (i) ODA, bilaterally or multilaterally; or (ii) non-ODA, through the United Nations Department for Peacekeeping Operations (UNDPKO) as peacekeeping, or bilaterally direct to the recipient country in the form of military, arms, and financial assistance packages.32
Data from the UNDPKO as a proxy for peace- and security-related expenditures indicates peacekeeping missions currently under way under the command of the UNDPKO, and the levels of financial support that are being provided to them by UN member states.33 It is worth noting that total peacekeeping expenditures for the period 2000-2007 were substantial in relation to ODA levels, in particular for Liberia (see Table 3.1).
32 ODA-approved areas include management of security expenditure; enhancing civil society‘s role in the security system; child soldiers; security system reform; civilian peace building, conflict prevention and conflict resolution; and small arms and light weapons. Non-ODA-approved areas include reform and non-military training of military forces; and peacekeeping (OECD, 2007c).
33 There are other peacekeeping operations – for instance under the auspices of the European Union (EU), the Organisation for Security and Co-operation in Europe (OSCE), and the North Atlantic Treaty organisation (NATO), which are not captured in these charts. Also note that peacekeeping and security-related expenditures form UNDPKO do not take account of three of the world‘s most important operations: Iraq, Afghanistan and the Africa Union mission in Sudan.

2008 ANNUAL REPORT ON RESOURCE FLOWS TO FRAGILE AND CONFLICT-AFFECTED STATES
50
UN peacekeeping expenditures are at a historic peak with 20 ongoing missions, with about 110,000 personnel (a seven fold increase since 1999), providing wide-ranging support to peace and stabilisation, supported by a budget of 7 USD billion (one fifth of ODA to fragile and conflict-affected states). The UN integrated mission in the DRC has an approved budget of USD 1.2 billion, the equivalent of total ODA to the DRC in 2007.
Table 3.1 Peacekeeping expenditures, 2000 – 2007 (USD million)
Peacekeeping
Peacekeeping as % of ODA
2000 2001 2002 2003 2004 2005 2006 2007 2000 – 2007 2000 – 2007
Burundi . . . 40 304 239 118 . 701 29%
Côte D‟Ivoire . . . 83 337 382 450 471 1723 53%
Congo, Dem. Rep.
246 389 480 636 901 1055 1085 1116 5908 39%
Eritrea 164 185 210 184 180 156 126 113 1318 59%
Haiti . . . 35 377 480 484 535 1910 65%
Liberia . . . 548 741 707 676 688 3360 196%
Lebanon 46 50 . . 56 . . . 152 4%
Sierra Leone 521 618 603 449 265 86 . . 2541 79%
Sudan . . . . 219 801 990 846 2856 33%
Timor-Leste 528 454 288 196 82 2 0 . 1549 78%
Total 1505 1695 1581 2171 3461 3908 3929 3770 22019 49%
Source: UNDPKO website, 2008.
Some evidence suggests that countries that sink back into conflict after having had peacekeeping operations are likely to be abandoned by donors. Countries with current peacekeeping operations also often do not have a co-ordinated future aid planning process. This evidence makes a case for monitoring carefully countries with ongoing international peacekeeping operations, to ensure there is effective aid follow-up.
In post conflict countries, development efforts should commence, where possible, before the peace agreement and, at a very minimum, prior to the departure of peacekeeping missions, and be sustained over a period of years. In all cases these decisions will require a whole of government approach. Non-OECD countries such as South Africa play a critical security role in their regions. Figure 3.3 provides an illustration of different scenarios for conflict/post-conflict countries.

2008 ANNUAL REPORT ON RESOURCE FLOWS TO FRAGILE AND CONFLICT-AFFECTED STATES
51
Figure 3.3 Peacekeeping, Net ODA and Emergency Aid (2000-2007)
Burundi Haïti
Soudan Liberia
Sierra Leone Timor-Leste
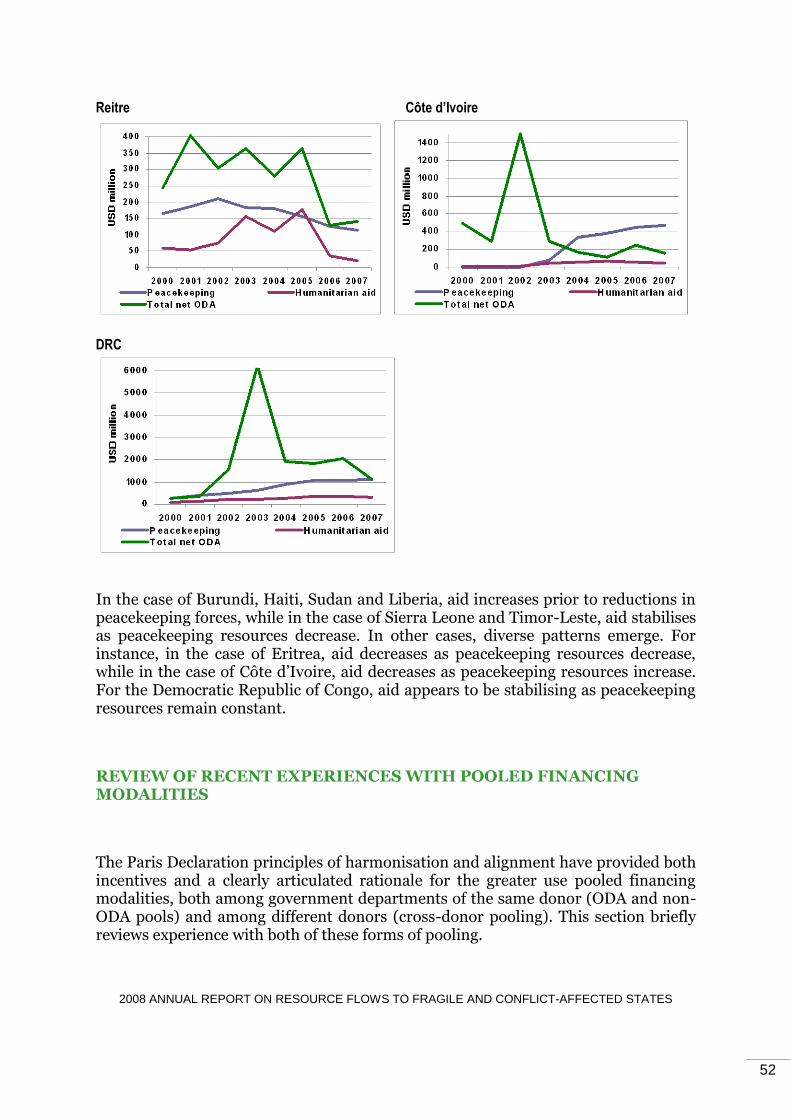
2008 ANNUAL REPORT ON RESOURCE FLOWS TO FRAGILE AND CONFLICT-AFFECTED STATES
52
Reitre Côte d’Ivoire
DRC
In the case of Burundi, Haiti, Sudan and Liberia, aid increases prior to reductions in peacekeeping forces, while in the case of Sierra Leone and Timor-Leste, aid stabilises as peacekeeping resources decrease. In other cases, diverse patterns emerge. For instance, in the case of Eritrea, aid decreases as peacekeeping resources decrease, while in the case of Côte d‘Ivoire, aid decreases as peacekeeping resources increase. For the Democratic Republic of Congo, aid appears to be stabilising as peacekeeping resources remain constant.
REVIEW OF RECENT EXPERIENCES WITH POOLED FINANCING MODALITIES
The Paris Declaration principles of harmonisation and alignment have provided both incentives and a clearly articulated rationale for the greater use pooled financing modalities, both among government departments of the same donor (ODA and non-ODA pools) and among different donors (cross-donor pooling). This section briefly reviews experience with both of these forms of pooling.

2008 ANNUAL REPORT ON RESOURCE FLOWS TO FRAGILE AND CONFLICT-AFFECTED STATES
53
Pooling of ODA and non-ODA funds
Development assistance has come to play a more active role in addressing violent conflict, security and peace-building objectives. Politicians, policy makers and development practitioners alike now acknowledge that addressing security issues in the short and medium term is often an absolute precondition for longer-term sustainable development. There is also widespread recognition that a closer and more co-ordinated working relationship among development, diplomatic and security communities is crucial in order to make progress on peace-building efforts, and that a more integrated approach is needed to ensure that peace and security objectives are achieved before, during and after peace. One immediate challenge relates to modalities for mobilising the required financing for building and securing peace. ODA as presently defined excludes some tasks that are not directly developmental but that many would agree are important prerequisites for establishing peace. An example is providing outside military help with decommissioning weapons after fighting has stopped.
Recognising that there are large political and practical constraints preventing a further widening of the ODA criteria, some countries have bilaterally moved forward to establish whole-of-government approaches and modalities that would ensure better coverage and financing of security-related activities. So far, Canada, the Netherlands and the United Kingdom have created pooled mechanisms where ODA and non-ODA budgets are combined, and where the ODA eligibility of specific activities is only determined after a financing decision has been made. In addition, multilateral funds like the UN Peacebuilding Fund (UNPBF), the EU Africa Peace Facility (APF) and the European Commission (EC) Stability Instrument have been established with mandates that enable them to finance non-ODA expenditure. Recent discussions in the OECD DAC context have indicated that such pooled mechanisms might provide the best operational option for ensuring that adequate financing is made available to critical peace and security activities. Recent analysis shows that, while the global funding shortfalls remain a concern, pooled funding and joint budget lines are being used as a way to provide incentives for collaboration and an ability to respond rapidly. The Dutch Stability Fund is one example of an innovative instrument to promote a co-ordinated response across government agencies (see Box 3.1).

2008 ANNUAL REPORT ON RESOURCE FLOWS TO FRAGILE AND CONFLICT-AFFECTED STATES
54
Box 3.1 The Dutch Stability Fund
The Dutch Stability Fund was created in 2004 to improve the provision of rapid and flexible financing for activities that are required to promote peace, security and development in situations of conflict and fragility, regardless of whether these activities are ODA-eligible or not. To date, the fund has committed almost EUR 400 million in support of key policy areas such as conflict prevention, mediation, peacekeeping and peace building, including security sector reform and demobilisation and reintegration programmes.
The fund has at its disposal resources from the development budget (ODA) and the general foreign policy budget (non-ODA). Since its creation, overall available financing has almost doubled, from about EUR 58 million in 2004 to more than EUR 100 million four years later. Furthermore, as highlighted in chart below, there has been a disproportionate increase in non-ODA allocations, which have almost quadrupled between 2004 and 2008. As a result, non-ODA financing has grown from about 20% to 30% of the total.
0
20
40
60
80
100
2004 2005 2006 2007 2008
€ m
illio
n
ODA non-ODA total
Recent evaluations of the fund show that it has been largely successful in achieving its stated objectives, as indicated by the large increase in the proportion of non-ODA funds. Two important factors can be identified to explain this success: i) the strong political support and understanding of the need to be flexible and pragmatic from the Dutch parliament; and ii) the delinking of allocation decisions from questions about ODA eligibility. A solid operational framework and decision-making process guiding allocations from the fund has also been instrumental. However, there are continuing challenges related to the inherent tension between being flexible in the face of an emerging crisis and maintaining a more strategic long-term focus on what should be accomplished through the fund.
Source: Adapted from Celasun and Walliser (2008).
UK experience, as well as that of Canada, demonstrates that funding pools can provide incentives otherwise unavailable to promote agency buy-in, compromise on objectives, reduce transaction costs, make policy more integrated and strategically focused, and enable rapid response. However, the research completed so far also highlights some key recommendations regarding operational and institutional implications:
The effectiveness and efficiency of the pools to finance ODA and non-ODA activities depend on whether decisions on funding projects and programmes can be made without prior consideration of ODA eligibility, and without being subjected to interministerial or interdepartmental political debates. In cases

2008 ANNUAL REPORT ON RESOURCE FLOWS TO FRAGILE AND CONFLICT-AFFECTED STATES
55
where specific ODA targets have been introduced to guide expenditure decisions, the result has been a reduction in flexibility, which has impacted on the availability of financing for priority activities that are not classified as ODA.
The effectiveness and impact of the pools can be constrained by limited financial and human resource capacity; bureaucratic and time-consuming procedures for preparing and approving projects; and difficulties in designing projects and programmes that can better integrate activities which are and are not ODA-eligible. Together, these constraints could result in the pool becoming fragmented, project-linked, and ultimately a funding resource of last resort. To mitigate against these constraints, staff should be assigned full time to the pools to enable rapid and high-quality responses to urgent requests, and they should be appointed from different policy communities to build horizontal capacity to address broader whole-of-government priorities. In addition, overall strategic objectives should drive financing decisions to better integrate ODA and non-ODA activities, which could result in the financing of fewer but bigger programmes.
Cross-donor pooling
The basic motivation and rationale for cross-donor pooling is the opportunity they provide to share risk, which is abundant in fragile contexts. Risks include project failure, programme failure, and fiduciary risk. Cross-donor pooling also enables the achievement – in many cases – of economies of scope and scale and reduces transaction costs. Specific features of fragile states that make pooled financing a sensible option include:
Pooled funding is central to harmonisation efforts, which can face additional challenges in fragile contexts.
Pooled funding – especially Multi Donor Trust Funds (MDTFs) – can provide a forum for joint dialogue and policy co-ordination, sometimes providing the only such avenue.
The joint oversight and implementation mechanisms can help strengthen national systems for PFM, accounting, procurement and monitoring and evaluation, thus creating positive externalities.
These mechanisms increase the probability of risk-adverse donor investments in this high-risk environment.
There are various kinds of pooled financing modalities that donors have used to finance activities in fragile states. These include, for instance: the World Bank and United Nations Development Programme (UNDP) administered MDTFs; the UN Common Humanitarian Fund (CHFs); and the UN Peacebuilding Fund (PBF).
The particular context of each fragile and conflict-affected situation determines which financing mechanism is best suited to the circumstances. The argument for MDTFs is, however, most compelling in the case of post-conflict recovery (Ball, 2007). MDTFs have been the most commonly used instruments for transition as well as post-conflict financing in fragile environments. Country experience with MDTFs in these contexts has been promising in several respects, but also brought up several design and operational challenges (highlighted in Box 3.2).

2008 ANNUAL REPORT ON RESOURCE FLOWS TO FRAGILE AND CONFLICT-AFFECTED STATES
56
Box 3.2. Experiences with multi-donor trust funds
World Bank-administered MDTFs – Aspects of the Bank approach that work well include its developing ability to link security and justice sector reform to core competencies such as PFM. Examples of such experiences include the ARTF in Afghanistan and the Timor-Leste MDTF. Moreover, Bank-administered funds can be flexible and can mobilise regionally. A successful example of the regional approach has been the Bank-administered Multi-Country Demobilization and Reintegration Program (MDRP), which has integrated demobilisation and reintegration efforts in the Great Lakes; the programme explicitly recognises the cross-border nature of the issues. Particular challenges have been speed of disbursement, the inadequate tailoring of Bank procedures, and the lack of field presence of Bank staff in many countries. These challenges have been exposed in, for example, the operation of the South Sudan MDTF, where delays in delivery of funds and operationalisation of MDTFs have occurred due to the extreme systemic weaknesses of the government of South Sudan authorities, initial lack of Bank staff in Juba, and the need to negotiate individual agreements with UN agencies (Scanteam, 2007b). However, some of these challenges are being addressed through the use of Bank-appointed monitoring agents, which, in addition to improving efficiency of disbursement, have helped address conflict of interest issues, reduce opportunities for fund diversion, and build PFM capacity in the medium term. For example, the ARTF evaluation found that the use of a monitoring agent helped enhance performance on and compliance with fiduciary standards.
UNDP-administered MDTFs – UNDP-administered MDTFs have played a significant role in transition environments. However, experience to date indicates that these MDTFs have been weak at building national capacity; turn over management to national authorities, including non-UN agencies; and promote a fully transparent proposal competition and allocation due to the conflict of interest issues. These issues have been remedied somewhat through the creation of a UNDP firewall between its role as administrative agent, and applicant for funding). The DRC Pooled Fund (DRCPF) provides a good example of these strengths and weaknesses. Evaluation has found that the DRCPF enabled the UN resident co-ordinator to target funds to critical needs, encourage early donor contribution, and address cross-cutting issues. The success with meeting humanitarian needs have been found, however, to come at the cost of building state ownership and national capacity and the sidelining of long-term development needs (Bennett, 2007).
UN CHF – Two CHFs have recently been piloted and emerging lessons point to their suitability to meet the “very earliest” recovery funding gaps through the linking of projects to agreed country work plans. For example, the DRC 2006 Action Plan was based on a countrywide participatory needs assessment, which discovered urgent needs that had not previously been incorporated. UNDP has been effective at passing funds through to other UN agencies, and also – encouragingly – has begun to pre-approve large NGOs. In the DRC, the CHF attracted more funding than anticipated, and is expected to strengthen coherence of donor approach. The primary issue with CHFs has been conflict of interest, as the same agencies have been involved in submitting and vetting proposals.
UN Peacebuilding Fund (PBF): The PBF, which was created in October 2006, is a USD 318 million (as of January 2009) fund that has been established to finance targeted measures to address root causes of conflict and to consolidate peace. The PBF has a three-window facility, including for emergency and political response, and is designed to be quick, flexible, strategic, gap-filling and catalytic. Eleven countries to date have benefited from the PBF – of which four are fully engaged as Peacebuilding Commission countries. PBF projects are selected through a National Steering Committee co-chaired by the government and the United Nations, and composed of key partners in the country.
Distilling these experiences, one should note that theoretically optimal allocation would be achieved with a single fund and a single administrator. In ideal

2008 ANNUAL REPORT ON RESOURCE FLOWS TO FRAGILE AND CONFLICT-AFFECTED STATES
57
circumstances, this would be a national fund, aligned with a nationally produced strategy and priorities. This outcome is not achieved for two principal reasons.
First, donors are unwilling (at least in the short to medium term) to entrust funding to fragile state governments due to the structural weaknesses in PFM systems and the significant risk of leakage. Second, it is difficult to create one internationally administered fund since the flexibility required in fragile situations calls for the competencies of both the UNDP and the World Bank, who are still figuring out the best way to work together to maximise the scope of their efforts in line with their comparative advantages. These are, for the World Bank, the ability to help governments address broad policy and economic development issues over the medium to long term, but with the caveat that its operational protocols make rapid mobilisation for service delivery or job creation in fragile settings slower than optimal (Scanteam, 2007a, p. 107). On the other hand, the UN agencies have proven capacity to implement activities very rapidly, but have difficulty in building government capacity to lead recovery efforts. While the UN is reportedly moving away from direct execution towards national execution, funding from the PBF and the CHFs continues to pass through UN agencies before allocation to implementing agencies, increasing overheads. Additionally, UN agencies remain intensely competitive over mandate and territory, despite the One-UN reform process (Ball, 2007, pp. 7-8).
Progress with pooling funds notwithstanding, donors continue to allocate a significant share of their financing for a given fragile state outside pooled mechanisms – which creates self-reinforcing disincentives for pooling into a single fund. For example, the Afghanistan Reconstruction Trust Fund (ARTF) and the Iraq Reconstruction Trust Fund (IRTF) manage 5% and 6% respectively of total donor commitment. Multiple channels continue to be used because of concerns about corruption, because of the mandates from donor country legislatures, or because of concerns for branding, attribution and ownership. This has three consequences:
First, as the recent review of MDTFs concludes, donor preferences for multiple funding channels continue to impose ―considerable administrative costs‖ on the receiver country (Scanteam, 2007a, p. 123).
Second, pooling funding itself is no panacea for funding shortfalls vis-à-vis the pool‘s objectives – in South Sudan, for example, only USD 600 million of the USD 2.6 billion requested was received by the two MDTFs as of 2007 (Scanteam, 2007b, p. 66).
Third, this sort of donor activity can undermine strategic coherence by bypassing or even undermining already weak government capacity; increase the risk that donors do not support nationally determined priorities; and lead to ―unsustainable‖ or ―redundant‖ investments (Ball, 2007, p. 9).
Beyond the tendency of donors to use multiple funding channels, which undermines maximising the benefits of pooling, experience with pooled funding modalities have revealed several operational challenges. These are summarized in Box 3.3.

2008 ANNUAL REPORT ON RESOURCE FLOWS TO FRAGILE AND CONFLICT-AFFECTED STATES
58
Box 3.3 Operational challenges with multi-donor trust funds
Regulatory burdens of the two main administrators – UNDP and the World Bank – have frequently hampered rapid mobilisation and execution.
Donors have explicitly or implicitly earmarked funding they commit to a MDTF. This obviously hampers the alignment of funding with national priorities. A recent report estimates that, for example, 90% of the UN‟s International Reconstruction Fund Facility for Iraq is earmarked, while donors express sector preferences for approximately two-thirds of funds provided to the World Bank window (Scanteam, 2007b, paras. 26-27).
Donors sometimes have had unrealistic expectations about what pooled funding can deliver in a given set of fragile circumstances and time frame. For example, the Sudan MDTF was expected to be the instrument for both institutional development and service delivery – an ambition it did not live up to in practice. While the fund is making significant contributions to institution building, there continues to be a “recovery gap” and service lacunae at local level (Scanteam, 2007b). Donors also consistently seem to underestimate the amount of time it takes to build national capacity. For example, the Results Focused Transition Framework for Liberia (2004) listed as a priority outcome for December 2005 the bringing of revenue collection, budgeting and financial management practices in line with best practice. By mid-2005, financial management practices of the transitional government were so widely off “best practice” that donors decided to impose a Governance and Economic Management Assistance Programme to stem the flow of public resources into private pockets, having not prioritised PFM reforms until then (Ball, 2007, p. 18).
Donors have not always been forthcoming with the required levels of political and diplomatic backing – particularly where national government is “difficult” – or with administrative support and oversight. One of the attractions of pooled funding is that it shifts part of the responsibility for programme management to other actors. However, there are some non-substitutable functions – such as political negotiation – that donors cannot back away from. For example, the problems encountered by the Bank-administered DRCPF due to host country intransigence might have been mitigated with more active diplomatic pressure from the financing donors on the Democratic Republic of Congo government.
Neither the World Bank nor the UN‟s operational procedures are well suited to working with NGOs. This point gains salience when one considers that national ownership is not coextensive with governmental ownership – especially in fragile contexts where the latter may not be the most appropriate space to pursue a state building agenda. This has limited the ability of non-governmental actors to participate in development and other activities in fragile contexts, even when they are best suited – in the context of the breakdown of the machinery of the state for the delivery of services – to fulfil many of the basic functions of the state.
In sum, while MDTFs are clearly a positive step forward, their implementation, as well as donor strategy and commitment, needs to be improved. Most generally, MDTFs cannot substitute for the medium-term task of building national capacity, and linking explicitly what donors wish to do with a nationally created, costed and strategic plan. If this is to happen, national capacity – especially PFM but also other state building functions, such as conduits for citizen voice and accountability – has to be built in the medium term; adequate room must be made to engage with non-governmental actors; and as much support as feasible should be provided ―on budget‖ (even if not through budget), complemented by a capable monitoring agent with ―minimal preferencing and maximum alignment with a national recovery plan, existing or emerging‖ (Ball, 2007, p. 17).

2008 ANNUAL REPORT ON RESOURCE FLOWS TO FRAGILE AND CONFLICT-AFFECTED STATES
59
Bibliography
Ball, N. (2007), ―Financing Mechanisms for Post Conflict Reconstruction‖, Clingendael Conflict Research Unit. Bennett, N. (2007), ―Impact of Humanitarian Reform Mechanisms in the DRC‖, Oxfam Discussion Paper, Oxfam, London. Brown, K. and S. Patrick (2007), ―Greater than the Sum of its Parts? Assessing ‗Whole of Government Approaches to Fragile States‘‖, International Peace Academy, New York. OECD (2008c), ―Concepts and Dilemmas of State Building in Fragile Situations: From Fragility to Resilience‖, OECD/DAC Discussion Paper. Scanteam (2007a), ―Review of Post-Crisis Multi-Donor Trust Funds/ Final Report‖. Scanteam (2007b), ―Review of Post-Crisis Multi-Donor Trust Funds/ Country Studies Annex‖.

2008 ANNUAL REPORT ON RESOURCE FLOWS TO FRAGILE AND CONFLICT-AFFECTED STATES
60
CHAPTER 4. FLOWS FROM NEW INTERNATIONAL ACTORS
Members of the DAC provide around 90% of the world‘s ODA. However, international actors that are not part of the DAC and that have been growing in influence in fragile states, such as Brazil, China and India, are currently gaining increasing importance and influence in development co-operation, peacekeeping and humanitarian assistance. According to recent OECD estimates, ODA currently provided by non-DAC donors and new EU member states accounts currently for USD 8 billion to USD 10 billion. However, there is little knowledge about the explicit amount and destination of aid allocation of these emerging international donors. Furthermore, even though non-DAC donors play an increasing role in fragile states such as Afghanistan, little is known about the extent and the approaches these actors take in addressing fragility. Little information is made public about the precise volume or allocation of flows going into fragile states. Moreover, it is unclear whether these aid flows can be subsumed under ―ODA‖ or if the flows from emerging donors take different forms, not necessarily matching with ODA criteria. Collaborative attempts of DAC members in collecting precise data on aid flows from non-DAC donors have not been successful until now. For instance, only three countries (Chile, Malaysia and Thailand) responded to a survey on aid flows from various non-DAC donors, conducted by the DAC, the United Nations Department of Economic and Social Affairs (UNDESA), UNDP and the World Bank in 2006. However, further efforts are currently being undertaken by the DAC to initiate dialogue and stimulate co-operation. In this context, some promising initiatives indeed seem to enhance mutual understanding and interest between traditional DAC-donors and emerging international actors. These initiatives include the Heiligendamm process between the G8 and G5, the ―Enhanced Co-operation Programme‖ of the OECD and the DAC‘s ―outreach‖ activities. Meanwhile, discussions on development co-operation in fragile states have not been a priority in the context of these exchanges between DAC donors and non-DAC donors, and appear to be a sensitive issue to tackle. In this monitoring exercise, it is therefore not possible to report on aid flows from non-DAC donors in a comprehensive and systematic way. However, the following section will highlight some anecdotal evidence on the role of some major non-DAC donors (Brazil, China, the Gulf States, India, Indonesia and South Africa), identified in the wider literature. Some key findings of the research undertaken can be summarised as follows:
Information on development assistance from international emerging actors such as China, India, etc. is hardly publicly accessible.
Non-DAC donors tend to avoid ―development language and expressions‖ such as ―donor‖ and ―ODA‖, which to them are associated with DAC donor assistance. This strong reluctance often derives from domestic political considerations.

2008 ANNUAL REPORT ON RESOURCE FLOWS TO FRAGILE AND CONFLICT-AFFECTED STATES
61
Development assistance from emerging international actors is not recorded according to ODA criteria. It is thus difficult to know which part of their aid flows can indeed be classified under ODA. ODA seems to be mixed with loans, often through a national export/import (EXIM) bank and/or national development funds.
The choice of recipient countries that emerging international actors make is closely linked to their strategic interests, such as foreign policy considerations, ideological motivations, or economic issues. Historical and linguistic ties also play a significant role in the choice of the respective partner country.
Aside from pure development assistance, international emerging actors play an increasing role in the field of peacekeeping and peace building as well as humanitarian assistance.
Box 4.1. Brazil
Brazil‟s development approach relies to a large extent on the idea of South-South co-operation with mutual benefit for all partners involved. Brazil is thus reluctant to use DAC criteria when defining aid and has never reported its aid flows publicly. According to official declarations, Brazil‟s ODA is free of any political or economic conditions. Its main focus in development co-operation is to improve the livelihood of citizens, sustainable growth and social development through technical assistance as well as capacity building and knowledge transfer (de Sousa, 2008). In terms of resources, the 2005-07 budget indicates that the Brazilian ministry of health has the largest amount available for international co-operation, followed by the ministries of foreign affairs, education, agriculture, and science and technology. According to Costa da Vaz (2007), the total budget for international co-operation in 2007 is estimated to reach USD 85 million. Around USD 68.7 million is concentrated in these five ministries, which demonstrates the sectoral focus of Brazil‟s aid flows (Vaz and Inoue, 2007). Of Brazil‟s bilateral aid, 38% goes to countries in Latin America, mainly to Paraguay and the Andean Region and not necessarily to fragile states (de Sousa, 2008). However, in Haiti, Brazil is heavily engaged in issues pertaining to both security and development. It has signed an agreement with Canada to co-operate in Haiti‟s key development sectors (such as education, health and social development). In the South East Asian region, Brazil was and is notably active in the reconstruction of Timor-Leste, with both development co-operation (according to Schläger, 22% of Brazilian aid flows went to Timor-Leste in 2007) and a strong contingent in the former UN peacekeeping mission UNAMIT (Schläger, 2007). The last third of Brazil‟s bilateral ODA goes to Lusophone Africa, notably to the fragile states of Angola and Guinea-Bissau. Brazil invests mainly in their social sectors as well as in the agriculture sector. Brazil has also recently initiated several projects in Guinea-Bissau‟s education sector. As far as trade is concerned, exports from Brazil to Angola accounted for around USD 836 million in 2006. In addition, as a member of the Paris Club with observer status, Brazil has participated in multilateral debt relief measures, for example in the Democratic Republic of Congo, Guinea-Bissau, Mauretania and Nigeria. Reports suggest that Brazil has cancelled debt to Guinea-Bissau (USD 5 million) and Mauritania (USD 9 million). Brazil is also increasingly engaged in security-related activities, which for instance is reflected in its support for the Guinea-Bissau security sector. Over the past years, Brazil has contributed to the Fund for Security Service, run by UNDP with USD 750 000. Furthermore, Brazil is finalising studies, together with the UNDP, on the construction of military installations (deposits for weapons and ammunition) in Guinea-Bissau (USD 4.1 million), and will enrol 30 military officers in technical courses on agriculture (the programme has started in 2008 with a budget of USD 356 600). Over the past years, Brazilian security forces have participated in 23 peacekeeping missions, most prominently in the current UN mission MINUSTAH in Haiti. The Brazilian contingent represents with around 1 200 forces, the largest contribution of any country. In light of Brazil‟s ambitions to position itself and then expand that position as a regional and global player, it can be expected that the country will further strengthen its role in future peacekeeping operations.
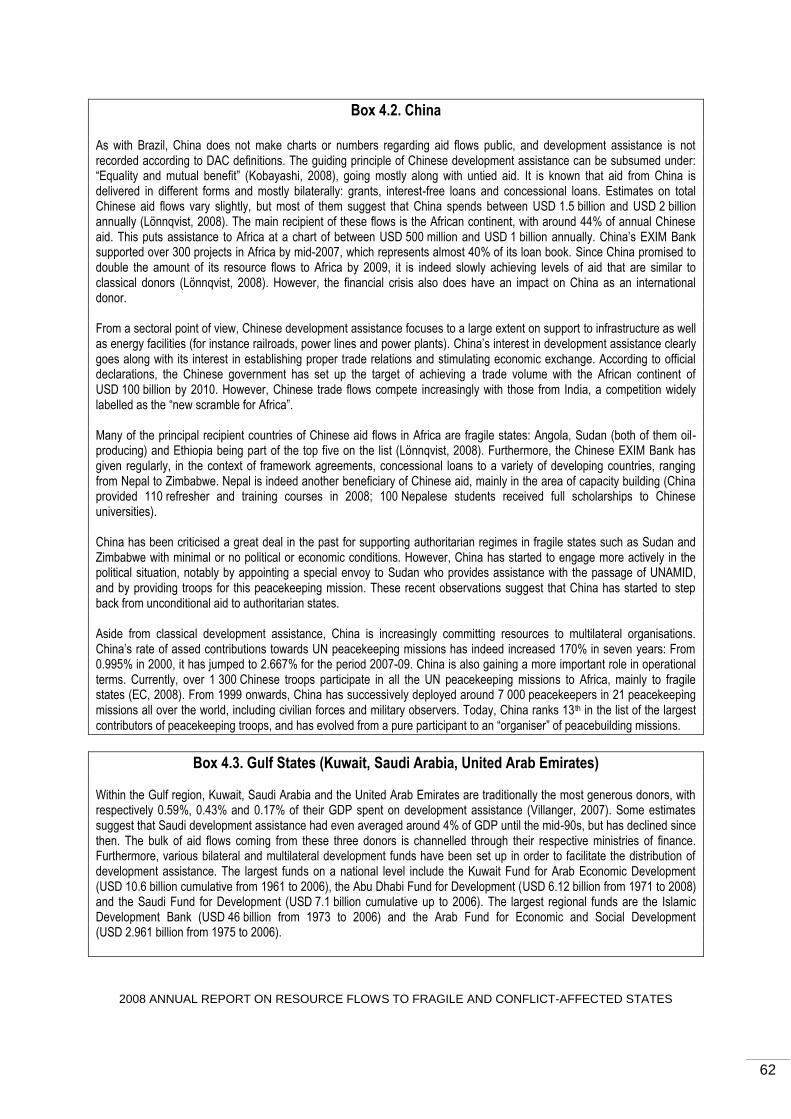
2008 ANNUAL REPORT ON RESOURCE FLOWS TO FRAGILE AND CONFLICT-AFFECTED STATES
62
Box 4.2. China
As with Brazil, China does not make charts or numbers regarding aid flows public, and development assistance is not recorded according to DAC definitions. The guiding principle of Chinese development assistance can be subsumed under: “Equality and mutual benefit” (Kobayashi, 2008), going mostly along with untied aid. It is known that aid from China is delivered in different forms and mostly bilaterally: grants, interest-free loans and concessional loans. Estimates on total Chinese aid flows vary slightly, but most of them suggest that China spends between USD 1.5 billion and USD 2 billion annually (Lönnqvist, 2008). The main recipient of these flows is the African continent, with around 44% of annual Chinese aid. This puts assistance to Africa at a chart of between USD 500 million and USD 1 billion annually. China‟s EXIM Bank supported over 300 projects in Africa by mid-2007, which represents almost 40% of its loan book. Since China promised to double the amount of its resource flows to Africa by 2009, it is indeed slowly achieving levels of aid that are similar to classical donors (Lönnqvist, 2008). However, the financial crisis also does have an impact on China as an international donor. From a sectoral point of view, Chinese development assistance focuses to a large extent on support to infrastructure as well as energy facilities (for instance railroads, power lines and power plants). China‟s interest in development assistance clearly goes along with its interest in establishing proper trade relations and stimulating economic exchange. According to official declarations, the Chinese government has set up the target of achieving a trade volume with the African continent of USD 100 billion by 2010. However, Chinese trade flows compete increasingly with those from India, a competition widely labelled as the “new scramble for Africa”. Many of the principal recipient countries of Chinese aid flows in Africa are fragile states: Angola, Sudan (both of them oil-producing) and Ethiopia being part of the top five on the list (Lönnqvist, 2008). Furthermore, the Chinese EXIM Bank has given regularly, in the context of framework agreements, concessional loans to a variety of developing countries, ranging from Nepal to Zimbabwe. Nepal is indeed another beneficiary of Chinese aid, mainly in the area of capacity building (China provided 110 refresher and training courses in 2008; 100 Nepalese students received full scholarships to Chinese universities). China has been criticised a great deal in the past for supporting authoritarian regimes in fragile states such as Sudan and Zimbabwe with minimal or no political or economic conditions. However, China has started to engage more actively in the political situation, notably by appointing a special envoy to Sudan who provides assistance with the passage of UNAMID, and by providing troops for this peacekeeping mission. These recent observations suggest that China has started to step back from unconditional aid to authoritarian states. Aside from classical development assistance, China is increasingly committing resources to multilateral organisations. China‟s rate of assed contributions towards UN peacekeeping missions has indeed increased 170% in seven years: From 0.995% in 2000, it has jumped to 2.667% for the period 2007-09. China is also gaining a more important role in operational terms. Currently, over 1 300 Chinese troops participate in all the UN peacekeeping missions to Africa, mainly to fragile states (EC, 2008). From 1999 onwards, China has successively deployed around 7 000 peacekeepers in 21 peacekeeping missions all over the world, including civilian forces and military observers. Today, China ranks 13th in the list of the largest contributors of peacekeeping troops, and has evolved from a pure participant to an “organiser” of peacebuilding missions.
Box 4.3. Gulf States (Kuwait, Saudi Arabia, United Arab Emirates) Within the Gulf region, Kuwait, Saudi Arabia and the United Arab Emirates are traditionally the most generous donors, with respectively 0.59%, 0.43% and 0.17% of their GDP spent on development assistance (Villanger, 2007). Some estimates suggest that Saudi development assistance had even averaged around 4% of GDP until the mid-90s, but has declined since then. The bulk of aid flows coming from these three donors is channelled through their respective ministries of finance. Furthermore, various bilateral and multilateral development funds have been set up in order to facilitate the distribution of development assistance. The largest funds on a national level include the Kuwait Fund for Arab Economic Development (USD 10.6 billion cumulative from 1961 to 2006), the Abu Dhabi Fund for Development (USD 6.12 billion from 1971 to 2008) and the Saudi Fund for Development (USD 7.1 billion cumulative up to 2006). The largest regional funds are the Islamic Development Bank (USD 46 billion from 1973 to 2006) and the Arab Fund for Economic and Social Development (USD 2.961 billion from 1975 to 2006).

2008 ANNUAL REPORT ON RESOURCE FLOWS TO FRAGILE AND CONFLICT-AFFECTED STATES
63
The large majority of the aid flows is channelled bilaterally. Development assistance from Kuwait has mostly taken the form of grants, export credits and loans; grants and concessional loans from Saudi Arabia; grants and loans from the United Arab Emirates (Kragelund, 2008) and it is mostly untied (Kragelund, 2008). Various reports suggest that there is a clear regional repartition of aid flows from Arab donors: whereas 50% of it goes to Arab countries, 23% are paid to Asia (mainly Bangladesh and Pakistan) and only 15% to African countries (the fragile state Guinea receiving 1.1% of total Arab aid) (Villanger, 2007). The Arab-dominated focus is also reflected when it comes to flows to support fragile states. Fragile states particularly favoured by the Arab donors are Djibouti, Iraq, Mauretania, Somalia, Sudan, Yemen and Comoros (Villanger, 2007). This indicates that aid from Arab donors is largely driven by geopolitical and religious considerations (Kragelunder, 2008). A particular feature of aid from Arab donors has always been its volatility. Even though especially generous, it is strongly dependent on rarely constant oil revenues and gas exports, potentially varying enormously (Villanger, 2007). Since the financial and economic crisis had particularly strong consequences for the Gulf States, aid flows might decrease significantly in the coming year.
Box 4.4. India Over the past decade, India has increasingly evolved from a recipient into a donor. This development is primarily motivated by India‟s effort to strengthen its position as an emerging international actor. However, little is known about where Indian aid flows go in detail and with what exact purpose. The Indian government, for reasons related to domestic politics, strongly rejects the terminology of “donor”, “development assistance” and “ODA”. However, in 2007-08, Indian development assistance, delivered through the Indian development agency and the Ministry of External Affairs, accounted for USD 420 million and was thereby 20% higher than the previous year‟s chart. In addition to that, in his 2007-08 budget speech, the Indian Finance Minister announced his country would provide aid flows accounting in total for around USD 1 billion through various ministries and agencies (Agrawal, 2008). India pursues a twofold regional approach. On the one hand, it engages intensely with its direct surroundings in Asia, namely Nepal (in total USD 250 million between 2005 and 2008) and Afghanistan (in total USD 750 million between 2002 and 2008) (Agrawal, 2008). With regard to fragile states, it furthermore has a prominent role in co-operating with Myanmar, mainly motivated by geostrategic reasons. On the other hand, India also provides significant assistance to African countries. Further to the Indian-Africa Forum in Delhi in early 2008, it is estimated that India will further strengthen its partnerships with African countries. This Forum comes as one of the consequences of the Indian “non-paper” on its partnership with Africa from 2006, according to which India has launched an initiative on technical assistance to Africa accounting for around USD 1 billion (Jobelius, 2007). India‟s aid to Africa is divided as follows: 60% goes into to training of civil servants, engineers, and public sector managers of recipient nations; 30% of the assistance consists of loans; and 10% is invested into project-related activities (Agrawal, 2008). Indian aid to fragile states in Africa goes predominantly to the following countries: Angola (USD 40 million), Djibouti (USD 1 million), Gambia (USD 7 million), Côte d'Ivoire (USD 27 million), Niger (USD 17 million), Togo (USD 10 million), and Uganda (USD 1.7 million) (Kragelund, 2008). In addition to development assistance, India has engaged more intensively in Africa over the past years. In this context, India pledged USD 500 million to countries in the Gulf of Guinea region in form of concessional credit facilities, among them Chad, Côte d'Ivoire, Equatorial Guinea and Guinea-Bissau. Further to these flows, India‟s trade volume (excluding oil) with African countries has significantly risen: from USD 914 million in 1990-91 to more than USD 10 billion in 2007-08 (Agrawal, 2008). Also, Indian firms have invested in African countries around USD 400 million in the 2006-07 period. When it comes to the “new African scramble”, China still clearly dominates the aid and trade landscape. Indian development assistance and aid flows are largely devoted to training, capacity building, and other soft investments in recipient nations, mostly under the umbrella of the technical co-operation programme entitled Indian Technical and Economic Cooperation (Vines and Oruitemeka, 2008). However, the country also supports various capital-intense projects through financial and technical assistance (Agrawal, 2008). According to various reports, 1 000 to 3 000 individuals from sub-Saharan countries undergo technical training in India each year. Furthermore, it is estimated that around 15 000 African students are currently being educated in Indian universities.
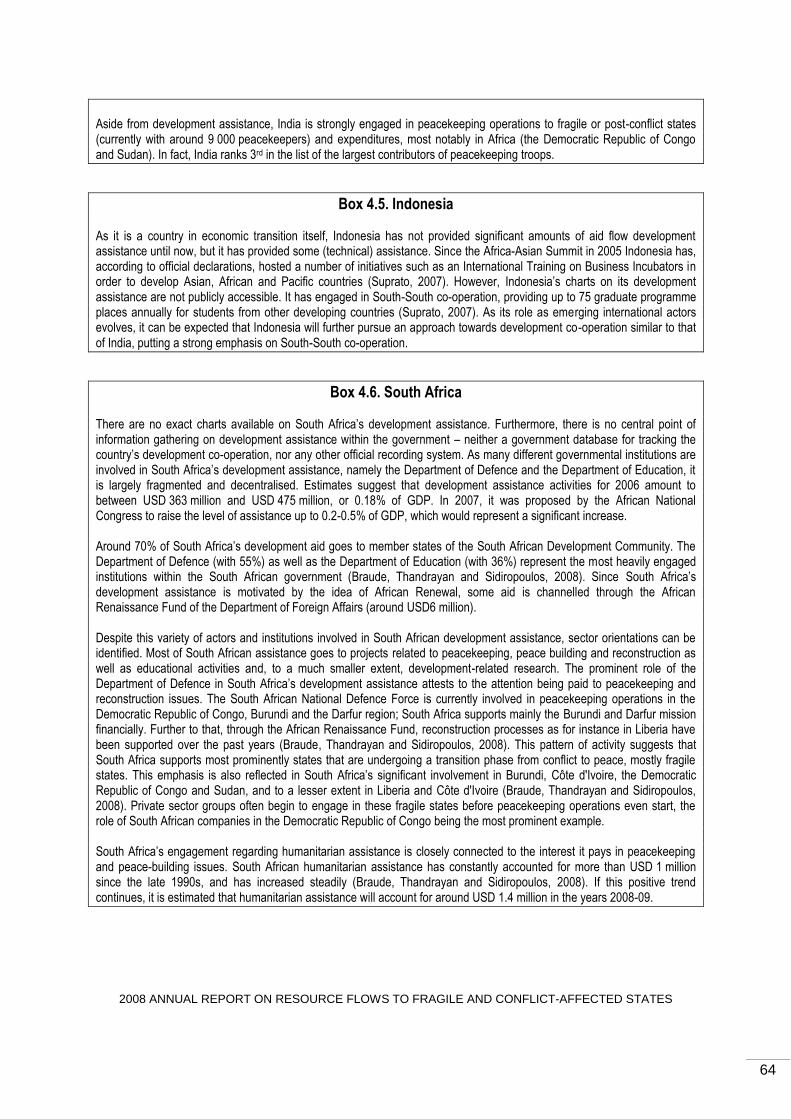
2008 ANNUAL REPORT ON RESOURCE FLOWS TO FRAGILE AND CONFLICT-AFFECTED STATES
64
Aside from development assistance, India is strongly engaged in peacekeeping operations to fragile or post-conflict states (currently with around 9 000 peacekeepers) and expenditures, most notably in Africa (the Democratic Republic of Congo and Sudan). In fact, India ranks 3rd in the list of the largest contributors of peacekeeping troops.
Box 4.5. Indonesia As it is a country in economic transition itself, Indonesia has not provided significant amounts of aid flow development assistance until now, but it has provided some (technical) assistance. Since the Africa-Asian Summit in 2005 Indonesia has, according to official declarations, hosted a number of initiatives such as an International Training on Business Incubators in order to develop Asian, African and Pacific countries (Suprato, 2007). However, Indonesia‟s charts on its development assistance are not publicly accessible. It has engaged in South-South co-operation, providing up to 75 graduate programme places annually for students from other developing countries (Suprato, 2007). As its role as emerging international actors evolves, it can be expected that Indonesia will further pursue an approach towards development co-operation similar to that of India, putting a strong emphasis on South-South co-operation.
Box 4.6. South Africa There are no exact charts available on South Africa‟s development assistance. Furthermore, there is no central point of information gathering on development assistance within the government – neither a government database for tracking the country‟s development co-operation, nor any other official recording system. As many different governmental institutions are involved in South Africa‟s development assistance, namely the Department of Defence and the Department of Education, it is largely fragmented and decentralised. Estimates suggest that development assistance activities for 2006 amount to between USD 363 million and USD 475 million, or 0.18% of GDP. In 2007, it was proposed by the African National Congress to raise the level of assistance up to 0.2-0.5% of GDP, which would represent a significant increase. Around 70% of South Africa‟s development aid goes to member states of the South African Development Community. The Department of Defence (with 55%) as well as the Department of Education (with 36%) represent the most heavily engaged institutions within the South African government (Braude, Thandrayan and Sidiropoulos, 2008). Since South Africa‟s development assistance is motivated by the idea of African Renewal, some aid is channelled through the African Renaissance Fund of the Department of Foreign Affairs (around USD6 million). Despite this variety of actors and institutions involved in South African development assistance, sector orientations can be identified. Most of South African assistance goes to projects related to peacekeeping, peace building and reconstruction as well as educational activities and, to a much smaller extent, development-related research. The prominent role of the Department of Defence in South Africa‟s development assistance attests to the attention being paid to peacekeeping and reconstruction issues. The South African National Defence Force is currently involved in peacekeeping operations in the Democratic Republic of Congo, Burundi and the Darfur region; South Africa supports mainly the Burundi and Darfur mission financially. Further to that, through the African Renaissance Fund, reconstruction processes as for instance in Liberia have been supported over the past years (Braude, Thandrayan and Sidiropoulos, 2008). This pattern of activity suggests that South Africa supports most prominently states that are undergoing a transition phase from conflict to peace, mostly fragile states. This emphasis is also reflected in South Africa‟s significant involvement in Burundi, Côte d'Ivoire, the Democratic Republic of Congo and Sudan, and to a lesser extent in Liberia and Côte d'Ivoire (Braude, Thandrayan and Sidiropoulos, 2008). Private sector groups often begin to engage in these fragile states before peacekeeping operations even start, the role of South African companies in the Democratic Republic of Congo being the most prominent example. South Africa‟s engagement regarding humanitarian assistance is closely connected to the interest it pays in peacekeeping and peace-building issues. South African humanitarian assistance has constantly accounted for more than USD 1 million since the late 1990s, and has increased steadily (Braude, Thandrayan and Sidiropoulos, 2008). If this positive trend continues, it is estimated that humanitarian assistance will account for around USD 1.4 million in the years 2008-09.

2008 ANNUAL REPORT ON RESOURCE FLOWS TO FRAGILE AND CONFLICT-AFFECTED STATES
65
The financial crisis and non-DAC donors
The financial crisis is likely to have an impact on both the domestic economies of new international actors and on their capacity to provide development assistance. According to World Bank estimates, economies in all developing parts of the world will slow down, including those of new international actors. With regard to domestic economies, the crisis could hit countries with high current account deficits, such as South Africa, particularly hard. The crisis will probably have significant consequences on the capacity of these actors to engage in development co-operation. At the same time, big emerging donors such as China are still willing to engage in regional stability and prosperity, and to develop crisis response mechanisms. China, together with Japan, is financing an East Asian initiative to establish a crisis fund in this context (Draper, 2008). From a structural viewpoint, the crisis will cause a change in the institutional landscape of the world‘s economy. The G20 leader summit organised in late 2008 as a response to the crisis was the first foretaste of the new role the new international actors will play with regard to the international financial architecture. This role is likely to be also reflected in international development co-operation in the decades to come.

2008 ANNUAL REPORT ON RESOURCE FLOWS TO FRAGILE AND CONFLICT-AFFECTED STATES
66
Bibliography Global Kragelund, P. (2008), The Return of Non-DAC Donors to Africa: New Prospects for African Development?, Overseas Development Institute. OECD DAC, Global Development Finance Report 2007: Data on flows from non-DAC OECD donors, Arab countries, Korea, Turkey, Cyprus, Estonia, Israel, Kuwait, Latvia, Lithuania, Slovenia, Chinese Taipei. OECD Development Co-operation Report 2006, including statistical annex and bilateral donors‘ Country Notes, www.sourceoecd.org/development. Ongoing work by the Global Forum on Development, www.oecd.org/development/globalforum. ODA reports from various non-DAC donors, e.g. Turkey‘s TIKA Development Assistance report www.tika.gov.tr. Funds by donor for each country: http://ocha.unog.ch/fts/reporting/reporting.asp Honda, T. (2008), ―BRICs Aid Practices in the Context of the Paris Declaration on Aid Effectiveness‖, OECD DAC, June. Brazil Vaz, A.C. and C. Y. A. Inoue (2007), Emerging Donors in International Development Assistance: The Brazil Case, International Development Research Centre, Ottawa, October. de Sousa, S.-L.J. (2008), Brazil as a New International Development Actor, South-South Cooperation and the IBSA Initiative. Fundación para las Relaciones Internacionales y el Diálogo Exterior. Schläger, C. (2007), Herausforderungen für die internationale Entwicklungszusammenarbeit: Das Beispiel Brasilien, (Challenges for international development cooperation: the case of Brazil), Friedrich-Ebert Foundation. International Poverty Centre (2008), Brazil & Africa Newsletter, April-May. China Dahle Huse, M. and and S.L. Muyakwa (2008), China in Africa: Lending, Policy Space and Governance. Norwegian Campaign for Debt Cancellation/Norwegian Council for Africa.

2008 ANNUAL REPORT ON RESOURCE FLOWS TO FRAGILE AND CONFLICT-AFFECTED STATES
67
Davies, M. with Hannah Edinger, Nastasya Tay and Sanusha Naidu (2008), How China Delivers Development Assistance to Africa, Center for Chinese Studies. Edinger, H., ed. (2008), New Impulses from the South: China’s Engagement of Africa, Center for Chinese Studies, May. Oya, C. (2008), Greater Africa-China Economic Cooperation: Will This Widen ‘Policy Space’?, Department of Development Studies, School of Oriental and African Studies, London. Guerrero, D.-G. and F. Manji, eds. (2008), China’s New Role in Africa and the South: A Search for a New Perspective, Fahamu and Focus on the Global South, Nairobi, Oxford and Bangkok. Kleine-Ahlbrandt, S. and A. Small (2008), ―China‘s New Dictatorship Diplomacy: Is Beijing Parting with Pariahs?‖, Foreign Affairs, January/February. Guerin, E. (2008), Bailleurs émergents et gouvernance mondiale de l’aide au développement: Ou en est la Chine en Afrique?, Institut du développement durable et des relations internationales, Paris. Kobayashi, T. (2008), Evolution of China’s Aid Policy, Japan Bank for International Cooperation, April. Lönnqvist, L. (2008), China’s Aid to Africa: Implications for Civil Society, International NGO Research and Training Centre. EC (2008), ―The EU, Africa and China: Towards Trilateral Dialogue and Cooperation‖, EC Staff Working Document. Gulf States (Kuwait, Saudi Arabia, United Arab Emirates) Villanger, E. (2007), Arab Foreign Aid: Disbursement Patterns, Aid Policies and Motives, Chr. Michelsen Institute. India W. Braude, P. Thandrayan and E. Sidiropoulos (2008), Emerging Donors in International Development Assistance: The South Africa Case, South African Institute of International Affairs, January. Chaturvedi, S. (2008), Emerging Patterns in Architecture for Management of Economic Assistance and Development Cooperation: Implications and Challenges for India, Research and Information System for Developing Countries, June. Jobelius, M. (2007), ―New Powers for Global Change?‖, Challenges for the International Development Cooperation: The Case of India, Friedrich-Ebert Foundation, March.
2008 ANNUAL REPORT ON RESOURCE FLOWS TO FRAGILE AND CONFLICT-AFFECTED STATES
68
Vines, A. and B. Oruitemeka (2008), India’s Engagement with the African Indian Ocean Rim States, Chatham House, 4 April. Indonesia Statement by Mr. Suprato, Head of Bureau for Technical Cooperation before the 15th High Level Committee on South-South Cooperation, Indonesian Delegation to the United Nations, 29 May 2007. South Africa Braude, W., P. Thandrayan and E. Sidiropoulos (2008), Emerging Donors in International Development Assistance: The South Africa Case, South African Institute of International Affairs, January. Davies, M. (2008), South Africa’s Formulation of an ODA Policy in Africa, Presentation prepared for the University of Stellenbosch, March. Non-ODA flows such as peacekeeping and other security-related expenditures of donors Documents from the OECD Working Party on Statistics and the OECD DAC Conflict, Peace and Development Co-operation Network, including contributions to the UN Peacebuilding Fund [DCD/DAC/STAT(2007)9]; ODA Eligibility of Conflict, Peace and Security Expenditures [DCD/DAC(2007)23/REV2]; ODA Casebook on Conflict, Peace and Security Activities [DCD/DAC(2007)20]. Annual reviews of ODA-eligible organisations. UN Department of Peacekeeping Operations: http://www.un.org/Depts/dpko/dpko/contributors/financing.html. UN Peacebuilding Commission (2008): Mapping of resources and gaps for Peacebuilding in Guinea-Bissau, (PBC/2/GNB/5). Impact of the financial crisis G20 (2008), ―Global Financial Crisis: Responding Today, Securing Tomorrow‖, Background Paper prepared by the World Bank Group for the G20 Summit on Financial Markets and the World Economy, 15 November. Draper, P. (2008), ―Towards a New ‗Washington Consensus‘: South Africa, the G20 Leaders‘ Summit, and the Financial Crisis‖, South African Institute of International Affairs, November.

2008 ANNUAL REPORT ON RESOURCE FLOWS TO FRAGILE AND CONFLICT-AFFECTED STATES
69
CHAPTER 5. GLOBAL FUNDS AND PHILANTHROPIC FOUNDATIONS
This section examines the role of global/sector/thematic funds and private donors/philanthropic foundations. Public-private partnerships—such as the Global Environment Fund (GEF), the Global Fund to fight AIDS, Tuberculosis and Malaria (GFATM), The Education for All-Fast Track Initiative (EFA/FTI) and the Global Alliance for Vaccine and Immunization (GAVI)—are increasingly being funded by bilateral donors in co-operation with private donors/philanthropic foundations—such as the Bill and Melinda Gates Foundation and the Rockefeller Foundation.
The precise volume and composition of contributions from these sources are, however, very difficult to quantify, and the area is significantly under-researched. For instance, there are no comprehensive measures of disbursements made by private foundations to recipient countries for development purposes. The procedures used to collect data on the activities also differ greatly over time and across countries, which makes comparisons problematic. Nevertheless, by looking at some of the largest global/sector/thematic funds and private donors, one may get an indication of the magnitude of flows, and to what extent certain sources or actors are important for particular countries.
GLOBAL/SECTOR/THEMATIC FUNDS
Presented below is a snapshot of funding by some of the main global funds. Funding from these sources is, however, relatively small compared to bilateral and multilateral aid. It also appears that engagement and disbursements from these sources have been concentrated in a few countries.
The Education for All-Fast Track Initiative: It is estimated that the Education for All-Fast Track Initiative disbursed around USD 280 million to countries in fragile and conflict-affected situations during the period 2004-08, most notably (above USD 10 million) to Cameroon, Gambia, Kenya, Niger, Rwanda, Tajikistan, Gambia and Yemen.
The Global Fund to fight AIDS, Tuberculosis and Malaria: During the period 2003-08, the Global Fund has spent an estimated USD 2.9 billion on projects in fragile and conflict-affected countries. Disbursements (above USD 100 million) are particularly noticeable for Cambodia, the Democratic Republic of Congo, Ethiopia, Haiti, Kenya, Nigeria, Rwanda, Sudan and Uganda.

2008 ANNUAL REPORT ON RESOURCE FLOWS TO FRAGILE AND CONFLICT-AFFECTED STATES
70
Table 5.1 Education for All-Fast Track Initiative disbursements, 2004 – 2008 (USD millions)
2004 2005 2006 2007 2008 2004 - 2008
Kenya .. 24.20 .. 48.41 48.40 121.01
Rwanda .. .. .. 13.00 35.00 48.00
Cameroon .. .. .. 11.30 11.20 22.50
Yemen 3.00 7.00 10.00 0.07 0.82 20.89
Gambia .. 4.00 4.00 5.41 .. 13.41
Tajikistan .. .. 3.10 6.33 3.71 13.13
Niger 5.00 4.00 .. 0.01 4.00 13.01
Mauritania 3.50 3.50 1.00 1.00 0.00 9.00
Timor-Leste .. .. 1.50 2.63 4.10 8.23
Djibouti .. .. 3.00 3.00 0.38 6.38
Cambodia .. .. .. 0.12 1.28 1.40
Pakistan .. .. .. 0.59 0.56 1.14
Nepal .. .. .. 0.52 0.05 0.57
Central African Republic .. .. .. 0.10 0.25 0.35
Togo .. .. .. 0.01 0.25 0.26
Angola .. .. .. .. 0.25 0.25
Chad .. .. .. .. 0.25 0.25
Guinea Bissau .. .. .. .. 0.25 0.25
Burundi .. .. .. 0.22 .. 0.22
Lao PDR .. .. .. .. 0.20 0.20
Afghanistan .. .. .. 0.17 .. 0.17
Haiti .. .. .. 0.15 .. 0.15
Liberia .. .. .. 0.12 .. 0.12
Ethiopia .. .. .. 0.12 .. 0.12
Myanmar .. .. .. .. 0.10 0.10
Papua New Guinea .. .. .. .. 0.08 0.08
Sierra Leone .. .. .. 0.06 .. 0.06
Uganda .. .. .. 0.05 .. 0.05
Guinea .. .. .. 0.05 0.00 0.05
Congo, Rep .. .. .. 0.02 .. 0.02
São Tomé & Principe .. .. .. 0.02 .. 0.02
Eritrea .. .. .. 0.01 .. 0.01
Congo, Dem. Rep. .. . .. 0.01 .. 0.01
11.50 42.70 22.60 93.50 111.13 281.43
Source: Education for All-Fast Track Initiative website, 2009.

2008 ANNUAL REPORT ON RESOURCE FLOWS TO FRAGILE AND CONFLICT-AFFECTED STATES
71
Table 5.2 Global Fund to fight AIDS, Tuberculosis and Malaria, disbursements, 2004 – 2008 (USD millions)
2004 2005 2006 2007 2008 2004 - 2008
Ethiopia .. 77.9 130.6 161.7 111.5 481.7
Rwanda 21.0 30.0 52.3 37.4 81.6 222.2
Nigeria 9.2 21.1 41.2 39.6 68.1 179.1
Congo, Dem. Rep. 8.9 37.8 25.0 27.8 67.7 167.2
Uganda 37.7 41.2 27.7 44.0 7.2 157.9
Kenya 28.1 0.0 55.7 28.2 39.8 151.8
Sudan 7.0 20.3 33.8 18.2 57.4 136.7
Haiti 16.4 15.6 26.2 23.5 34.8 116.6
Cambodia 5.5 18.9 22.2 21.1 37.9 105.5
Cameroon 11.1 10.3 15.8 27.8 21.9 86.9
Angola .. 30.7 11.8 14.5 29.6 86.6
Burundi 7.7 11.3 9.7 8.3 22.6 59.6
Somalia 7.0 9.7 12.8 13.8 13.2 56.5
Niger 5.1 12.7 10.4 6.8 20.3 55.3
Côte d‟Ivoire 6.0 12.6 6.0 16.6 13.9 55.2
Togo 7.5 10.9 8.4 16.9 10.3 54.0
Central African Republic 5.4 5.6 13.1 4.7 18.9 47.7
Laos 2.3 9.4 7.2 11.6 14.6 45.0
Liberia 5.1 9.2 10.1 4.4 15.7 44.4
Mauritania 1.0 0.6 3.0 3.5 36.4 44.4
Eritrea 4.5 4.8 5.9 11.1 15.3 41.6
Zimbabwe .. 8.2 4.2 26.0 -1.5 36.9
Gambia 2.7 7.7 6.2 10.2 9.4 36.1
Pakistan 4.9 3.2 6.3 12.2 9.1 35.7
Sierra Leone 0.9 6.4 7.0 4.4 14.4 33.0
Djibouti .. 3.2 3.5 5.5 16.3 28.5
Nepal 0.8 0.6 5.5 9.2 12.2 28.2
Papua New Guinea 2.2 5.9 0.9 8.1 10.0 27.0
Tajikistan 2.9 1.3 2.9 8.6 9.6 25.4
Uzbekistan 0.4 3.9 5.7 8.4 6.3 24.8
Yemen 1.5 5.2 4.1 3.9 8.6 23.2
Afghanistan 1.7 1.1 3.9 3.5 9.2 19.4
Equatorial Guinea .. 2.1 4.4 2.2 7.4 16.1
Guinea 2.2 5.6 -1.4 5.3 2.9 14.6
Myanmar 2.4 9.5 .. -0.4 -0.4 11.1
Chad 1.6 3.3 3.1 0.6 2.1 10.6
Congo, Rep. .. .. 4.0 1.8 4.8 10.6
Guinea-Bissau 0.8 1.5 1.2 1.9 2.1 7.5
Iraq .. .. .. 3.3 3.2 6.4
Timor-Leste 1.0 0.7 1.3 1.5 1.0 5.5
São Tomé & Principe .. 1.1 1.0 0.6 2.7 5.3
Comoros 1.0 0.5 0.7 0.6 0.5 3.2
Palestinian Administrated Areas .. .. .. .. 2.4 2.4
223.2 461.3 593.4 658.8 870.7 2807.4
Source: Global Fund website, 2009.

2008 ANNUAL REPORT ON RESOURCE FLOWS TO FRAGILE AND CONFLICT-AFFECTED STATES
72
PRIVATE DONORS/PHILANTHROPIC FOUNDATIONS
An increasing number of private donors and foundations34 have joined official bilateral and multilateral donors in financing development. Still, most of the foundations are active at a national level, and estimates suggest that only 1% (100 000 foundations) are active at the international level. Indications are that contributions in the development field are roughly around USD 5 billion annually. US foundations35 are playing a larger role than European and Asian foundations, and are mainly active in areas such as health and education. Most of the foundations work through global and sector/thematic funds, and a few of the foundations have offices in developing countries (Sulla, 2008).
The Bill and Melinda Gates Foundation is the largest foundation in the world, with an estimated endowment of USD 33 billion. The Gates Foundation is projected to disburse around USD 2.8 billion in 2007 – an amount equal to almost 3% of projected ODA disbursements by DAC donors (World Bank, 2007). Data on US foundations suggest that USD 3.8 billion of the disbursements in 2005 went to development activities (US Foundation Center, 2006). There is little comprehensive information on resource flows from European foundations to developing countries, but contributions are around USD 600 million annually. Little is known about Asian foundations, but estimates suggest that Australian foundations contribute around USD 250 million annually. International activities by Japanese foundations are estimated to be around USD 50 million. In total, international funding by Asian foundations is around USD 400 million annually (DECPG, 2006).
The tables below illustrate flows from some of the major foundations. Funding from these sources is, however, relatively small compared to bilateral and multilateral ODA, and appears to be concentrated in a few countries.
The Bill and Melinda Gates Foundation
A snapshot of key trends of funding to some countries in fragile and conflict-affected situations can be seen through the disbursement amounts for global health grants and global development grants. During the period 2000-07, an estimated USD 175.5 million has been disbursed, most notably to Nigeria and Uganda but also Afghanistan, the Democratic Republic of Congo, Haiti, Sudan and Niger.
34Foundations can be defined as non-governmental, non-profit organisations possessing a principal fund of their own, managed by their own trustees and directors, which promote social, educational, charitable, and religious or other activities serving common welfare either domestically or internationally (World Bank Development Economics Prospects Group, 2006).
35 The top US foundations active in development activities are: the Ford, Rockefeller, Mellon, Kellogg and Mott Foundations, the Open Society Institute, Carnegie Cooperation and the MacArthur Foundation. It is estimated that these foundations implement more than USD 1.5 billion in international activities (World Bank Development Economics Prospects Group, 2006).

2008 ANNUAL REPORT ON RESOURCE FLOWS TO FRAGILE AND CONFLICT-AFFECTED STATES
73
Table 5.3 The Bill and Melinda Gates Foundation, disbursements, 2000 – 2007 (USD millions)
2000 2001 2002 2003 2004 2005 2006 2007 2000 - 2007
Afghanistan 650,000 2,850,000
1,000,000
500,000 .. 1,849,666
.. .. 6,849,666
Angola .. .. 673,571 .. .. .. 385,900 .. 1,059,471
Burundi .. .. 500,000 .. .. .. .. .. 500,000
Cambodia .. .. .. .. .. 5,000 .. .. 5,000
Central African Republic
.. .. .. 500,000 .. .. .. 750,000 1,250,000
Chad .. .. .. .. .. 537,228 .. .. 537,228
Congo, Dem. Rep. 0 300,000 500,000 500,000 .. 254,638 2,429,664
1,999,545
5,983,847
Côte d‟Ivoire .. .. .. 250,000 .. .. 2,777,777
.. 3,027,777
Haiti 82,000 .. 1,716,000
.. 1,082,185
.. 4,428,606
.. 7,308,791
Liberia .. .. .. .. 401,018 .. .. .. 401,018
Myanmar 243,000 .. .. .. -- .. 3,361,152
.. 3,604,152
Nepal 904,772 .. 870,276 .. 300,000 5,000 3,361,152
.. 5,441,200
Niger .. .. .. .. .. 811,300 6,103,047
.. 6,914,347
Nigeria 24,988,788
840,000 .. .. .. .. 55,551,235
.. 81,380,023
North Korea .. .. .. 156,663 .. .. .. .. 156,663
Pakistan 350,000 .. .. .. .. 3,226,991
.. .. 3,576,991
Papua New Guinea .. .. .. .. .. 2,581,669
.. .. 2,581,669
Somalia .. .. .. .. .. .. 950,000 .. 950,000
Sudan .. .. .. .. 2,250,000
794,784 4,831,694
.. 7,876,478
Togo .. .. .. .. .. .. 2,777,777
.. 2,777,777
Uganda 14,475,817
2,860,100
4,746,533
.. 3,090,014
.. 4,021,856
485,732 29,680,052
Vanuatu .. .. 200,000 555,727 .. .. .. .. 755,727
Zimbabwe .. .. 798,375 832,695 .. 1,334,752
.. .. 2,965,822
41,694,377
6,850,100
11,004,755
3,295,085
7,123,217
11,401,028
90,979,860
3,235,277
175,583,699
Source: Bill and Melinda Gates Foundation's Grants Database at: http://www.gatesfoundation.org/Grants/default.htm, 2009.

2008 ANNUAL REPORT ON RESOURCE FLOWS TO FRAGILE AND CONFLICT-AFFECTED STATES
74
The Ford Foundation
Information on disbursements is not comprehensive and very difficult to collect, but it appears to have been concentrated on a few countries. In total, an estimated USD 17 million has been disbursed during the period 2005-07, in particular within areas of peace and security and governance, and most notably to Nepal, Nigeria, Sudan and Uganda.
Table 5.4 The Ford Foundation, disbursements, 2005 – 2007 (USD millions)
2005 2006 2007 2005 - 2007
Afghanistan 200,000 .. .. 200,000
Angola 183,333 .. .. 183,000
Bangladesh 226,000 .. .. 226,000
Gambia 200,000 .. .. 200,000
Nepal 691,150 716,000 .. 1,407,150
Nigeria 6,325,380 4,220,470 200,000 10,745,850
North Korea 392,000 .. .. 392,000
Sierra Leone 100,000 150,000 .. 250,000
Sudan 713,000 316,666 .. 1,029,666
Timor-Leste 163,333 .. .. 163,333
Uganda 1,525,000 127,876 100,000 1,752,876
Zimbabwe 640,000 .. .. 640,000
11,359,196 5,531,012 300,000 17,189,875
Data compiled from the Ford Foundations Grants' Database at: http://www.fordfound.org/grants_db/view_grant_detail1.cfm, 2009.
The Soros Foundation
The majority of the Soros Foundation‘s grants mainly go to individual researchers, or for the purposes of scholarships and fellowships, most notably to Uzbekistan and Tajikistan. In total, an estimated USD 1.9 million has been disbursed during the period 2004-06.
Table 5.5 The Soros Foundation, disbursements, 2004 – 2006 (USD millions)
2004 2005 2006 2004 - 2006
Afghanistan .. .. 50,000 50,000
Cameroon .. .. 2,199 2,199
Haiti 35,076 14,740 .. 49,816
Iraq .. .. 170,021 170,021
Nigeria .. .. 16,865 16,865
Pakistan .. .. 134,100 134,100
Sierra Leone .. .. 19,997 19,997
Sudan .. .. 100,943 100,943
Tajikistan 308,600 270,000 255,000 833,600
Uganda .. .. 16,573 16,573
Uzbekistan 515,900 30,000 28,000 573,900
859,576 314,740 793,698 1,968,014
Source: Data compiled from the Open Society Institute‟s Grants Database at: http://www.soros.org/grants/research/.

2008 ANNUAL REPORT ON RESOURCE FLOWS TO FRAGILE AND CONFLICT-AFFECTED STATES
75
The Rockefeller Foundation
In total, an estimate of USD 38 million has been disbursed during the period 2004-08, and concentrated on a few countries, most notably Cambodia, Kenya, Laos, Uganda and Zimbabwe.
Table 5.6 The Rockefeller Foundation, disbursements, 2004 – 2008 (USD millions)
2004 2005 2006 2007 2008 2004 - 2008
Bangladesh .. 23,000 .. .. .. 23,000
Cambodia 918,670 1,592,736 650,000 150,000 250,000 3,561,406
Cameroon 73,436 .. 24,250 .. .. 97,686
Central African Republic .. 11,987 .. .. .. 11,987
Kenya .. .. .. .. 5,579,330 5,579,330
Lao PDR 1,399,357 810,096 1,102,122 50,000 .. 3,361,575
Myanmar 37,815 .. .. .. .. 37,815
Nigeria 73,000 60,000 .. .. 950,000 1,083,000
Pakistan .. .. .. .. 480,900 480,900
Rwanda .. .. .. .. 220,000 220,000
Sierra Leone .. .. 7,148 .. .. 7,148
Sudan .. 150,000 .. .. .. 150,000
Tanzania .. .. .. .. 899,000 899,000
Uganda 5,673,741 5,405,290 4,873,623 550,500 1,630,000 18,133,154
Zimbabwe .. 1,985,962 623,831 1,058,000 .. 3,667,793
8,176,019 10,039,071 7,280,974 1,808,500 11,028,567 38,333,131
Source: Data compiled from the Rockefeller Foundation‟s Grants Database at: http://www.rockfound.org/grants/grants.shtml, 2009.

2008 ANNUAL REPORT ON RESOURCE FLOWS TO FRAGILE AND CONFLICT-AFFECTED STATES
76
Bibliography
DECPG (2006), Philanthropic Foundations: Actual Versus Potential Role in International Development Finance, World Bank, Washington, DC. Sulla, O. (2008), ―Philanthropic Foundations and Multilateral Institutions Like the World Bank: Increased Opportunities for Collaboration in ACP Agriculture‖, Briefing Session No. 6: New Drivers, New Players in ACP Rural Development, July. US Foundation Centre (2006), International Grantmaking Update: A Snapshot of U.S. Foundation Trends, U.S. Foundation Center, New York. World Bank (2007), Global Development Finance – The Globalisation of Corporate Finance in Developing Countries, World Bank, Washington, DC.

2008 ANNUAL REPORT ON RESOURCE FLOWS TO FRAGILE AND CONFLICT-AFFECTED STATES
77
CHAPTER 6. PRIVATE RESOURCE FLOWS
REMITTANCES, FOREIGN DIRECT INVESTMENT AND EXPORT EARNINGS
Aid flows cannot be equated to private resource flows such as remittances, FDI and export earnings in terms of their potential economic impact. While private resource flows cannot be viewed as a substitute for ODA, they have a significant impact on poverty and import capacity, and there is therefore a need to consider these as part of the analysis. In this context there is also a need to distinguish between private resource flows to the current and capital account, respectively:
current account – (i) private/household transfers, e.g. remittances, and (ii) international trade, e.g. export earnings;
capital account – (i) commercial firms, e.g. FDI, (ii) commercial banks, export/import banks, e.g. loans, export credits, financial guarantees, (iii) private investors, e.g. portfolio and equity investments.
While this section shows aggregate trends, it should be noted that for all private resource flows, in-depth country-level analysis is needed to draw any further conclusions as to what the impact of private resource flows are on a country-by-country basis.
Foreign direct investment
Private capital flows have grown significantly in recent years, including FDI, commercial bank lending and portfolio investments. For instance, net private capital flows to Africa increased sharply in 2007 by USD 30 billion to reach USD 81 billion (ECA, 2008). FDI36 flows to 42 fragile and conflict-affected countries more than quadrupled from USD 5.0 billion in 2000 to USD 20.9 billion in 2006 (see Figure 6.1). Almost 80% of FDI in 2006 was nevertheless concentrated in a few countries, notably Angola, Chad, Equatorial Guinea, Nigeria, Pakistan, Sudan and Yemen. The ratio of FDI to ODA for these countries is in the magnitude of 50–4700%. The growth in FDI flows is mainly concentrated on natural resource producers – notably Nigeria and Chad, where FDI mostly reflected expansions in projects within the oil industry (see Table 6.1).
36 While it would have been desirable to look at portfolio and equity investments and bank- and trade-related lending, no comprehensive comparable data are available on these flows.

2008 ANNUAL REPORT ON RESOURCE FLOWS TO FRAGILE AND CONFLICT-AFFECTED STATES
78
Table 6.1 Foreign direct investment, averages, 2000 – 2007
FDI / GDP FDI / ODA FDI
(%) (%) (USD million)
Equatorial Guinea 29.2% 4711.8% 1141.0
Liberia 23.5% 79.6% 103.3
Chad 20.2% 228.4% 584.9
Gambia 11.1% 80.0% 47.8
Angola 10.9% 281.4% 1186.9
Vanuatu 7.0% 54.8% 21.0
Mauritania 6.5% 32.8% 82.9
Sudan 6.4% 196.4% 1482.6
Congo, Rep. 6.3% 261.5% 279.6
Tajikistan 5.1% 48.9% 109.4
Congo, Dem. Rep. 4.5% 30.1% 279.1
Cambodia 4.0% 44.0% 217.3
Djibouti 3.9% 30.8% 27.7
Sierra Leone 3.7% 12.4% 38.7
Uganda 3.5% 23.5% 252.3
Ethiopia 3.5% 22.9% 333.5
Togo 3.2% 89.7% 55.2
Guinea-Bissau 3.1% 10.9% 8.9
Nigeria 2.7% 436.8% 2220.4
São Tomé & Principe 2.6% 8.1% 2.7
Cameroon 2.1% 40.9% 272.4
Solomon Isl. 2.0% 3.1% 6.4
Côte D‟Ivoire 1.9% 126.0% 256.5
Eritrea 1.9% 5.6% 12.7
Laos 1.8% 14.9% 47.8
Papua New Guinea 1.6% 23.6% 57.0
Guinea 1.4% 24.2% 47.2
Pakistan 1.3% 80.7% 1377.1
Yemen, Rep. 1.0% 53.0% 164.2
Niger 0.7% 4.9% 19.9
Haiti 0.7% 7.7% 32.7
Zimbabwe 0.6% 11.0% 29.7
Uzbekistan 0.6% 43.2% 71.9
Central African Republic 0.4% 5.3% 4.7
Kenya 0.3% 8.7% 49.1
Rwanda 0.3% 1.6% 6.7
Burundi 0.2% 1.8% 1.8
Comoros 0.2% 2.3% 0.6
Nepal 0.1% 0.8% 3.5
Tonga 0.0% -0.5% -0.4
Myanmar .. 181.1% 228.8
Somalia .. 6.4% 20.1
Source: World Development Indicators, 2008; OECD/DAC online database on annual ODA aggregates, 2008.
Remittances
Remittances – personal flows from migrants to their friends and families – have grown significantly in recent years. The exact magnitude of remittances is difficult to estimate, but unrecorded flows through formal and informal channels are believed to be even larger than recorded flows. However, total remittances through official channels to all developing counties are estimated at USD 265 billion in 2007 –

2008 ANNUAL REPORT ON RESOURCE FLOWS TO FRAGILE AND CONFLICT-AFFECTED STATES
79
making it the largest source of external financing compared to other external flows (ECA, 2008).
There are no data available on remittances for many of the countries in fragile and conflict-affected situations. Where data are available, however, remittances to 35 countries quadrupled, from USD 7.2 billion in 2000 to USD 28.8 billion in 2007 (Figure 6.1).
Figure 6.1 Remittances and FDI to fragile and conflict-affected countries, 2000 – 2006
0.0
5.0
10.0
15.0
20.0
2000 2001 2002 2003 2004 2005 2006
USD
bill
ion
FDI Remittances
Source: World Bank Global Economic Prospects, 2008 and World Development Indicators, 2008.
More than 90% of remittances in 2007 were nevertheless concentrated on a few countries, notably Haiti, Kenya, Liberia, Nepal, Nigeria, Pakistan, Sudan, Tajikistan, Uganda, the Palestinian Administrated Areas and Yemen. The average ratio of remittances to ODA during the period 2000-07 for these countries is in the magnitude of 50-440%. The average ratio of remittances to GDP for the period 2000-07 is above 10% for a number of countries, notably Haiti, Liberia, Nepal, Tajikistan, the Palestinian Administrated Areas and Yemen (see Table 6.2).
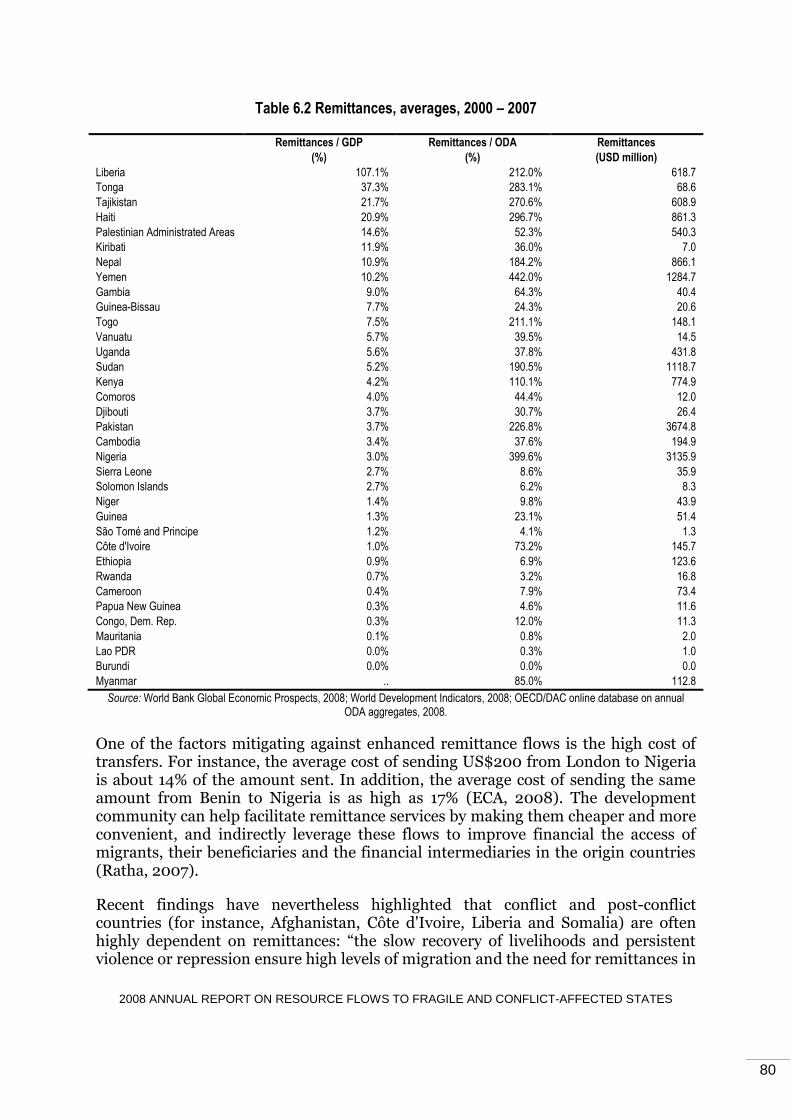
2008 ANNUAL REPORT ON RESOURCE FLOWS TO FRAGILE AND CONFLICT-AFFECTED STATES
80
Table 6.2 Remittances, averages, 2000 – 2007
Remittances / GDP Remittances / ODA Remittances
(%) (%) (USD million)
Liberia 107.1% 212.0% 618.7
Tonga 37.3% 283.1% 68.6
Tajikistan 21.7% 270.6% 608.9
Haiti 20.9% 296.7% 861.3
Palestinian Administrated Areas 14.6% 52.3% 540.3
Kiribati 11.9% 36.0% 7.0
Nepal 10.9% 184.2% 866.1
Yemen 10.2% 442.0% 1284.7
Gambia 9.0% 64.3% 40.4
Guinea-Bissau 7.7% 24.3% 20.6
Togo 7.5% 211.1% 148.1
Vanuatu 5.7% 39.5% 14.5
Uganda 5.6% 37.8% 431.8
Sudan 5.2% 190.5% 1118.7
Kenya 4.2% 110.1% 774.9
Comoros 4.0% 44.4% 12.0
Djibouti 3.7% 30.7% 26.4
Pakistan 3.7% 226.8% 3674.8
Cambodia 3.4% 37.6% 194.9
Nigeria 3.0% 399.6% 3135.9
Sierra Leone 2.7% 8.6% 35.9
Solomon Islands 2.7% 6.2% 8.3
Niger 1.4% 9.8% 43.9
Guinea 1.3% 23.1% 51.4
São Tomé and Principe 1.2% 4.1% 1.3
Côte d'Ivoire 1.0% 73.2% 145.7
Ethiopia 0.9% 6.9% 123.6
Rwanda 0.7% 3.2% 16.8
Cameroon 0.4% 7.9% 73.4
Papua New Guinea 0.3% 4.6% 11.6
Congo, Dem. Rep. 0.3% 12.0% 11.3
Mauritania 0.1% 0.8% 2.0
Lao PDR 0.0% 0.3% 1.0
Burundi 0.0% 0.0% 0.0
Myanmar .. 85.0% 112.8
Source: World Bank Global Economic Prospects, 2008; World Development Indicators, 2008; OECD/DAC online database on annual ODA aggregates, 2008.
One of the factors mitigating against enhanced remittance flows is the high cost of transfers. For instance, the average cost of sending US$200 from London to Nigeria is about 14% of the amount sent. In addition, the average cost of sending the same amount from Benin to Nigeria is as high as 17% (ECA, 2008). The development community can help facilitate remittance services by making them cheaper and more convenient, and indirectly leverage these flows to improve financial the access of migrants, their beneficiaries and the financial intermediaries in the origin countries (Ratha, 2007).
Recent findings have nevertheless highlighted that conflict and post-conflict countries (for instance, Afghanistan, Côte d'Ivoire, Liberia and Somalia) are often highly dependent on remittances: ―the slow recovery of livelihoods and persistent violence or repression ensure high levels of migration and the need for remittances in

2008 ANNUAL REPORT ON RESOURCE FLOWS TO FRAGILE AND CONFLICT-AFFECTED STATES
81
such countries for several years after conflict and crisis have ended‖ (International Peace Academy, 2006). A number of challenges and difficulties are identified in these contexts. One relates to the fact that anti-terror and anti-crime regulations preclude legal money transfers to some countries. Another is that restrictive immigration policies limit remittances (regulations can be tighter and treatment of immigrants worse in countries that border conflict, conflict-affected, and crisis countries) (International Peace Academy, 2006).
Furthermore, are there concerns that remittances can fuel violent conflict (McDowell, 1996; Byman, 2001; Cheran, 2003; Wayland, 2004). The conclusion from a comprehensive review is, however, that the actions taken to address the problem of remittances being used to support conflict and crime need to be revised. Often, the groups mostly negatively affected by the stricter regulatory environment are those in countries where governments are relatively weak and where institutions do not function or are unreliable, or where criminality is high (International Peace Academy, 2006).
Exports and imports
Countries with highly variable export revenues may be exposed to particular economic vulnerability, and may therefore also face particular needs of aid.37 It is suggested that high levels of dependence on mineral and oil exports are associated with countries facing particularly severe macroeconomic management and development problems, including effective management of aid.38 There may also be a higher risk of civil war in countries where primary commodities constitute a large share of exports.39
There may therefore be a case for monitoring countries because of the special complexities related to effective aid management in these environments. As a proxy for economic vulnerability the following is used: i) the level of export and imports in relation to GDP; ii) exports minus imports as a percentage of GDP [(export – imports)/GDP], also referred to as the ―trade gap‖; and iii) the relative importance of ODA in relation to exports and imports (see Table 6.3).
Countries with relatively high export levels and a positive ―trade gap‖ include Angola, Cameroon, Chad, the Democratic Republic of Congo, Côte d‘Ivoire, Nigeria and Uzbekistan.
37 See for instance Chauvet and Guillaumont (2004) who suggest that aid has a larger impact on growth in countries with more unstable export earnings and adverse trends in terms of trade. Collier and Dehn (2001) also suggest that aid has a larger impact on growth in countries experiencing or recovering from adverse terms-of-trade shocks.
38 Since the 1970s there has been increasing evidence (particularly from comparative and econometric studies) of a negative link between natural resource abundance and development performance in terms of economic growth and poverty reduction – also referred to as the ―Dutch disease‖ (see for instance Stevens, 2003, 2006; Rosser, 2006).
39 Collier and Hoeffler (2004) argue that the relationship between higher share of primary commodities in exports and higher risk of civil war can be explained by the rent-seeking behaviour of rebels and their easier access to finance.

2008 ANNUAL REPORT ON RESOURCE FLOWS TO FRAGILE AND CONFLICT-AFFECTED STATES
82
Countries with relatively low levels of exports – less than 10% of GDP – and with relatively high proportion of ODA in relation to exports include Burundi, Eritrea, Rwanda and São Tomé and Principe.
In order to draw any further conclusion from this section, however, further country-level analysis is needed to determine case-by-case impact. This analysis could include qualitative and quantitative analysis of factors that are relevant to assessing resources available and in relation to absorptive capacity of aid.
Table 6.3 Exports and imports, 2007
[(Exports – imports)/GDP]
Exports Imports ODA / exports ODA / imports
(%) (% of GDP) (% of GDP) (%) (%)
Equatorial Guinea 36% 93 57 0% 1%
Congo, Rep. 30% 73 43 3% 4%
Angola 26% 67 41 1% 1%
Chad 15% 49 34 10% 15%
Uzbekistan 10% 33 22 2% 3%
Nigeria 9% 39 30 3% 4%
Côte d'Ivoire 8% 49 41 2% 2%
Cameroon 1% 22 21 42% 44%
Guinea -2% 37 39 13% 12%
Guinea-Bissau -4% 43 46 81% 74%
Sudan -6% 16 23 27% 20%
Yemen -7% 35 41 3% 2%
Central African Republic -7% 15 22 69% 47%
Pakistan -8% 14 22 11% 7%
Congo, Dem. Rep. -9% 28 37 48% 36%
Kenya -10% 23 33 19% 13%
Niger -11% 20 31 65% 42%
Sierra Leone -14% 26 39 125% 81%
Nepal -16% 12 28 47% 21%
Gambia -16% 36 52 31% 21%
Rwanda -18% 9 28 228% 77%
Uganda -19% 13 32 116% 48%
Mauritania -19% 25 44 49% 28%
Ethiopia -19% 13 32 98% 39%
Djibouti -20% 58 79 23% 17%
Togo -21% 42 63 12% 8%
Comoros -26% 13 39 79% 26%
Eritrea -38% 7 45 181% 29%
Liberia -39% 25 64 378% 149%
Burundi -40% 8 48 577% 99%
Tajikistan -45% 19 64 31% 9%
Palestinian Administrated Areas -52% 17 69 276% 68%
Afghanistan -55% 17 72 198% 47%
São Tomé and Principe -58% 8 65 327% 38%
Source: World Bank Development Indicators website, 2008; IMF, 2008a, 2008b; OECD/DAC online database on annual ODA aggregates (2008).

2008 ANNUAL REPORT ON RESOURCE FLOWS TO FRAGILE AND CONFLICT-AFFECTED STATES
83
Bibliography
Byman, D. et al. 2001. Trends in Outside Support for Insurgent Movements Chauvet, L. and P. Guillaumont (2004), Aid And Growth Revisited: Policy, Economic Vulnerability, And Political Instability, World Bank, Washington, DC. Cheran, R. 2003 Diaspora Circulation and Transnationalism as Agents for Change in the Post Conflict Zones of Sri Lanka. Berlin, Germany, Berghof Foundation for Conflict Studies. Policy Paper. Collier, P. and J. Dehn (2001), Aid, Stocks, and Growth, World Bank, Washington, DC. Collier, P. and A. Hoeffler (2004), ―Aid, Policy and Growth in Post-conflict Countries‖, European Economic Review 48, pp. 1125-1145. IMF (2008a), Regional Economic Outlook – Sub-Saharan Africa, International Monetary Fund, Washington, DC. IMF (2008b), Regional Economic Outlook – Middle East and Central Asia, International Monetary Fund, Washington, DC. International Peace Academy (2006), ―Remittances in Conflict and Crises: How Remittances Sustain Livelihoods in War, Crises, and Transitions to Peace‖, Policy Paper, February. McDowell, C. (1996), A Tamil Asylum Diaspora: Sri Lankan Migration. Oxford and New York: Berghahn Books. Ratha, D. (2007), Leveraging Remittances for Development, World Bank, Washington, DC. Rosser, A. (2006), The Political Economy of the Resource Curse: A Literature Survey, Institute of Development Studies, Brighton. Stevens, P. (2003), Resource Impact – Curse or Blessing? A Literature Survey, International Petroleum Industry Environmental Conservation Association, London. Stevens, P. (2006), ―Resource Curse and How To Avoid It‖, The Journal of Energy and Development, Vol. 31, No. 1, pp. 1-21. UN Economic Commission for Africa (2008), ―Development Finance in Africa: From Monterrey to Doha‖, Document prepared for the 11th Meeting of the Africa Partnership Forum, Addis Ababa, 17-18 November.

2008 ANNUAL REPORT ON RESOURCE FLOWS TO FRAGILE AND CONFLICT-AFFECTED STATES
84
Wayland, S. 2004 Ethnonationalist Networks and Transnational Opportunities: The Sri Lankan Tamil Diaspora. Review of International Studies 30: 405-426. World Bank (2008), Global Economic Prospects, Washington D.C. World Bank, World Development Indicators (2008), Washington D.C.

2008 ANNUAL REPORT ON RESOURCE FLOWS TO FRAGILE AND CONFLICT-AFFECTED STATES
85
CHAPTER 7. DOMESTIC REVENUES
TRENDS IN DOMESTIC REVENUES
The ECA (2008) estimates that after remaining basically unchanged between the early 1990s and the early 2000s, government revenue (tax and non-tax, excluding grants) as a share of GDP has been steadily improving in most African countries, both resource rich and otherwise. Excluding Nigeria and South Africa, the increase in government revenue expressed as a share of GDP rose from 18.8% as an average for 1997-2002 to 25.4% in 2007, equivalent to over 6 percentage points of GDP. However, these charts are average estimates – and more than half of sub-Saharan Africa continues to collect less than 15% of GDP in tax revenue (a tax-to-GDP ratio of at least 15% is considered a reasonable target for most low-income countries) (OECD, 2008a). Table 7.1 shows that for a number of countries in fragile and conflict-affected situations, government revenue as a share of GDP is well below 15%, notably North Korea, Guinea, the Democratic Republic of Congo, Ethiopia, Comoros, Uganda, Nepal, Rwanda, Sierra Leone, Central African Republic, Afghanistan and Zimbabwe.
Table 7.1 Government revenue (% of GDP), 2007
Less than 15% 15% to 25% 25% to 35% 35% to 45% More than 45%
North Korea 14.9 Chad 22.9 Yemen 32.3 Congo, Dem. Rep. 42.7 Iraq 71.3
Guinea 14.3 Eritrea 22.8 Djibouti 30.1 São Tomé & Principe 40.2 Angola 45.1
Congo, Dem. Rep. 14.1 Kenya 22.5 Mauritania 25.6 Equatorial Guinea 38.3
Ethiopia 12.8 Gambia 21.6 Uzbekistan 35.4
Comoros 12.7 Tajikistan 20.5
Uganda 12.7 Côte D‟Ivoire 19.6
Nepal 11.8 Sudan 19.3
Rwanda 11.6 Cameroon 18.8
Sierra Leone 10.8 Burundi 18.7
Central African Republic 10.2 Liberia 18.6
Afghanistan 7.0 Nigeria 17.2
Zimbabwe 6.0 Togo 17.0
Guinea-Bissau 15.6
Niger 15.5
Source: World Bank Development Indicators, 2008; IMF, 2008a, 2008b.
Gupta and Tareq (2008) argue that while the average tax-to-GDP ratio in sub-Saharan Africa increased from less than 15% of GDP in 1980 to more than 18% of GDP in 2005, the majority of the increase in tax revenue came from natural resources tax (such as royalties and corporate income tax on oil and mining companies). Non-resource-related revenues, however, increased by less than 1% of GDP during the past 25 years. Moreover, in several low-income oil importing countries, revenue mobilisation has not kept the same pace as public spending, resulting in a larger share of public spending being financed by aid. Gupta and Tareq further argue that increased domestic revenue can militate against the adverse

2008 ANNUAL REPORT ON RESOURCE FLOWS TO FRAGILE AND CONFLICT-AFFECTED STATES
86
impacts of volatility and uncertainty in aid flows (which are generally more volatile than domestic revenues and remittances).
Some fragile and conflict-affected countries in Africa have, however, managed to increase their revenue mobilisation by 3% of GDP over recent years. Table 7.2 gives a picture of revenue trends in a number of African fragile and conflict-affected countries. The increased use of autonomous revenue agencies has also been interpreted as a positive sign in this direction. Fjelstad and Moore (2008) contend that in Anglophone Africa, instead of fragmenting state authority and ―privatising‖ the revenue collection process, the rise of autonomous tax agencies has contributed (even if modestly) to improved revenue collection (especially from corporate tax payers) and increased revenue collection efficiency (again modest), while reducing some of the frictions and intractabilities that affect tax administration in neo-patrimonial and weak states. The section below discusses in more detail the relationship between aid, taxation and institutions.
Table 7.2 Government revenue (% of GDP), 1997 – 2007
Pre-Monterrey 1997-2002 Avg 2003-05 Avg 2006-08 2006 2007 2008
Burundi 17.7 20.4 18.6 18.9 18.7 18.3
Central African Republic 9.2 8.2 10.0 9.5 10.2 10.4
Comoros 12.9 15.8 12.9 13.6 12.7 12.4
Congo, Dem. Rep. 5.8 9.5 14.5 12.8 14.1 16.7
Côte d'Ivoire 17.7 17.1 18.9 18.4 19.6 18.6
Eritrea 28.9 27.3 23.1 23 22.8 23.5
Gambia 17.6 18.7 21.3 21.2 21.6 21.1
Guinea 11.3 12.3 14.9 14.8 14.3 15.6
Guinea-Bissau 15 16.7 18.5 19.6 15.6 20.4
Liberia … 13.2 14.9 2.3 18.6 23.8
Niger 9.7 10.8 13.8 13.2 15.5 12.8
Saõ Tomé & Principe 16.7 32.2 32.0 21.1 40.2 34.6
Sierra Leone 9.4 12.2 11.5 11.8 10.8 11.8
Togo 13.6 16.5 16.8 16.9 17 16.6
Zimbabwe 24 27.4 10.2 14.3 6 …
Source: IMF Africa Regional Economic Outlook, 2008.
AID, TAXATION AND INSTITUTIONS
Historical experiences suggest that taxation is critical to state building and developing state-society relations in the long term, and that institutional quality is a crucial intervening variable in development outcomes. However, the relationship between volumes of aid and institutional quality generally, and between aid and the building of fiscal institutions specifically (the latter being held to be a critical aspect of indigenous development and governance quality) – including assessments of critical threshold levels – remains an open and contested question; different studies seem to find ambiguous impacts, or parameters with different signs. Research on the aid-tax-governance relationship in fragile and conflict-affected situations specifically is not extensive; further evidence is needed to make confident statements about the

2008 ANNUAL REPORT ON RESOURCE FLOWS TO FRAGILE AND CONFLICT-AFFECTED STATES
87
directions and strength of the posited theoretical relationships. This conceptual framework is driven by, and centred round, the social contract lens on state fragility versus resilience recently brought forth by the OECD (OECD, 2008a). Analytically separating the ―supply side‖ – or the state – and the demand side, or citizens, this conceptual framework tries to make sense of the various ways in which aid interacts with the meso level of institutions, and ultimately its impact on the durability and quality of the social contract equilibrium. That equilibrium can fruitfully be thought of as determined by state responsiveness to citizen demands for accountability. Thinking of this equilibrium in terms of a ―bargain‖ between the supply and demand side, it becomes apparent that taxation – besides raising the necessary funds for development expenditures over time – also has a ―governance dividend‖ as it incentivises this bargaining process and forces governments to be more accountable to their citizens, rather than to donors (OECD 2008b).
Figure 7.1 A social contract conceptual framework
Source: Authors.
Supply side factors – The supply side of accountability refers to the structure of incentives, and the institutional structure of government, elected officials and policy makers. When looking at state fragility as the outcome of an unstable equilibrium or
Institutional capacity
Electoral incentives
Nature of the budget constraint
Willingness/ability to demand of ‘service users’
Willingness/ability to demand of ‘taxpayers’
Broad or narrow base of tax and other institutions
Accountability
Responsiveness Supply side Demand side
S o c i a l c o n t r a c
t
Aid
Natural resource
rents

2008 ANNUAL REPORT ON RESOURCE FLOWS TO FRAGILE AND CONFLICT-AFFECTED STATES
88
disequilibrium between the expectations of citizens and the ability and willingness of the state to provide services, be responsive to citizen demands, and be accountable, the notable factors are institutional capacity, electoral incentives, and the nature of the budget constraint (Box 7.1).
Demand side factors – The ―social contract‖ approach requires a focus on the demand side as well: that is, the ability and willingness of citizens to make demands of their governments, to hold them accountable, and to negotiate a durable agreement on the expectations (Box 7.2).

2008 ANNUAL REPORT ON RESOURCE FLOWS TO FRAGILE AND CONFLICT-AFFECTED STATES
89
Box 7.1. Supply side factors
Institutional capacity – The ability or capacity to tax is a function of how well developed the fiscal infrastructure is, as well as the public financial management system and its ability to translate whatever revenue is raised into appropriate spending on providing goods and services. Aid can influence institutional capacity through investments in capacity building, in technical assistance, and in strengthening mechanisms for transparency in budgetary systems. In fragile and conflict-affected situations, this capacity is particularly lacking – and high returns may accrue to donor investments in building budgetary and fiscal infrastructure in the immediate aftermath of conflict, assuming that partner country commitment is in place. However, DAC donors spend as little as 0.073% of ODA, or USD 88 million (2006 chart) on tax- and revenue-related tasks (OECD, 2008b). If examining support to fragile and conflict-affected countries, this is even lower – only around USD 11 million (2006 chart), and support to tax-related activities is implemented in only three countries: Afghanistan, Kenya and Rwanda. The form of assistance to fiscal institutions matters as well. As remarked in OECD, 2008a, the results of the focus on enhancing tax administration have been mixed, and there is an increasing recognition that donors must not only support formal fiscal institutions, but also support governments to make the taxation process more consensual, and fairer, acknowledging the tradeoffs involved.
Electoral incentives – When governments depend on a large number of taxpayers for revenue, then they have incentives to a) build responsive bureaucracies that collect tax efficiently, b) deliver services well because they regularly face election and are held accountable (assuming they are). Aid can diminish these incentives by reducing the need for governments to depend on, and thus negotiate the social contract with, their taxpayers. As Sindzingre (2007, p. 625) puts it, “the combination of aid dependence, aid fungibility and aid volatility has detrimental effects on government revenues and on the consolidation of state capacity” by severing or weakening the “fiscal contract”. Obviously, the form of aid matters for this argument to be successful, as proponents have recognised. (See for example Chauvet and Collier (2007) who qualifies their argument about the equivalence of aid and oil by recognising that technical assistance can make a positive contribution versus programmatic funding – even, and especially, in an environment where institutions are weak.) Similarly, Gupta et al. (2003) has argued that loans are less detrimental than grants in some circumstances vis-à-vis their effect on incentives to maintain the “fiscal contract”.
Nature of the budget constraint – The nature of the budget constraint has an impact on the supply side‟s quality. If the budget constraint is perceived as „hard‟, governments will try to spend within their means, as well as (assuming a moderate level of capacity) try to target their spending in a responsive way (due to the electoral factor). However relaxing the budget constraint – or making it „soft‟ – which is what can happen (although need not necessarily) if there are large volumes of aid flows over a significant period, may lead to aid dependency in the wide sense (that is, governments cannot provide goods and services without significant amounts of aid).

2008 ANNUAL REPORT ON RESOURCE FLOWS TO FRAGILE AND CONFLICT-AFFECTED STATES
90
Box 7.2. Demand side factors
The willingness and ability of citizens to make demands as service users depend on the political space for citizen voice and the modalities and incentives governing service delivery. Aid can help create these spaces through investments in civil society programming and through capacity building for service delivery. In fragile and conflict-affected situations with fraught state-society relations, scope for citizen voice may be particularly low –and deserving of donor attention.
The ability of citizens to negotiate the social contract as taxpayers depends, in the most basic sense, on their ability to influence their legislatures through elections. Donor support can help through the democratisation agenda (even if the record, as is well remarked, has been mixed), but it can also harm through propping up illegitimate regimes that are electorally unresponsive. (Browne‟s analysis of donor support to the pre-1994 Rwanda regime is a compelling example of this – see Browne, 2007, pp. 15-17.)
What matters is not just how much tax, but the progressivity (or regressivity) of the fiscal base, as recognised by OECD, 2008a. For the social contract negotiation process and durable equilibrium to be effective, the tax base should be broad, fair, and transparent. However, many citizens may be unwilling to pay tax because of the perception that governments consistently misuse public funds. Moreover, many poorer households already face de facto taxes in bribes and fees.
What does the evidence say?
Several cross-country studies have been conducted on the aid-fiscal behaviour relationship. There are also some country-level studies attempting to understand the behavioural response of national fiscal authorities to increased aid flows. The relationships uncovered and the parameters estimated do not point conclusively toward either a negative or a positive relationship between aid levels and domestic tax effort.
According to 16 empirical studies reviewed by the IMF, the impact of aid on domestic revenue collection is negative or insignificant (Moss, Petterson and van de Valle, 2006). Where aid constitutes more than 10% of GDP, as much as 10% of grant flows may crowd out an equivalent amount of domestic revenue mobilisation. If scaled-up aid indeed displaces national revenue collection through reduced incentives for collection, then from a state-building point of view, the supply-side incentives to negotiate a sustainable social contract are reduced through aid surges, especially over a long period.
There is some evidence that high levels of aid can relax the budget constraint and reduce incentives for fiscal discipline through softening the constraint. Bräutingam and Knack (2004) find that access to foreign resources has the effect of softening the constraint and promotes fiscal indiscipline. Moreover, as donor financing increases, disparities between budgeted expenditures and actual spending on various items increase. This suggests that spending becomes more aligned with donor priorities than national ones – again undermining the state-society contract negotiation process.

2008 ANNUAL REPORT ON RESOURCE FLOWS TO FRAGILE AND CONFLICT-AFFECTED STATES
91
Box 7.3. Examples of country-level analysis and evidence
Pakistan – Modelling aid endogenously so as to examine the fiscal and behavioural implications of aid, and recognising that the impact of aid is mediated through public institutions (they being the major recipient of flows), Franco-Rodriguez et al. find that aid has a negative impact on consumption and a slightly positive impact on investment; the overall incremental impact on public expenditure was negative, and – to an even greater extent – the impact on taxation was negative. The authors also find that the overall incremental impact on public sector borrowing was positive. These findings suggest an overall negative picture of the implications of aid on the behaviour of fiscal institutions. (Franco-Rodriguez, Morrisey and McGillivray, 1998)
Côte d’Ivoire – McGillivray and Outtara have examined the impact of aid on fiscal behaviour between 1975 and 1999. They find, among other things, that aid seems to reduce taxation effort in addition to worsening public saving. The findings were driven by the fact that most aid to Côte D‟Ivoire was spent on debt servicing. Moreover, aid does not reduce domestic borrowing. That has implications for long-term interest rates and, thus, the potential to “crowd in” the private sector and growth. (McGillivray and Outtara, 2003)
However, other country studies find a positive relationship between aid and revenue collection – for example in Indonesia, Pack and Pack (1990) find that not only does aid not lead to reduced revenue raising efforts, it stimulates rather than displaces development expenditures, and evidence for fungibility was absent. Similarly, in Uganda and Malawi, Fagernas and Robert (2004) find that aid has a long-run positive impact on the developmental budget, a negative impact on domestic borrowing, and an insignificant impact on revenue effort.
Recent debates and opinions have voiced the need for further consideration of the fact that several countries have high levels of aid dependence – in excess of 10% of GDP, or half of government spending. Some – for example Wood (2008)40 – question whether this has been helpful. Concerns about high aid dependence relate mainly to the risk of distorting political accountability, e.g. governments that are highly dependent on aid pay too much attention to donors and too little attention to their citizens. As the interests of citizens and donors seldom coincide, this can result in confused and shifting policies, volatile aid and erratic spending. Wood therefore proposes that donors collectively ―cap aid at 50 percent of the amount of tax revenue that the aid-receiving government raises from its own citizens, by non-coercive means and excluding revenue from oil and minerals‖. Doing this would also ―encourage governments to raise more taxes from their citizens, since every extra dollar of tax raised would attract a matching increase of 50 cents of aid‖ (Wood, 2008). Nevertheless, it is also recognised that such a cap on aid would raise certain operational and technical questions, such as: How should aid and taxes be defined for the purposes of calculating this percentage? Who would monitor and validate the data? Who would determine whether taxes were non-coercive? And can donors collectively agree on a cap on aid? Moreover, an ―arbitrary‖ cap on aid at 50% of the amount of tax revenue can be viewed as rather unhelpful when each specific case and country will differ and needs to be analysed separately.
More empirical work is needed, however, to clarify the fiscal behavioural response to increased or sustained levels of aid dependence. Adequate attention must be paid to 40 http://blogs.ft.com/wolfforum/2008/09/how-donors-should-cap-aid-in-africa/

2008 ANNUAL REPORT ON RESOURCE FLOWS TO FRAGILE AND CONFLICT-AFFECTED STATES
92
long-run institutional factors – particularly the capacity, political base, and fiscal attitudes of government and citizens alike. Empirical research into the dampening effect of aid dependency on taxation suggests mixed results, but donors must be alert to the risks in fragile states.

2008 ANNUAL REPORT ON RESOURCE FLOWS TO FRAGILE AND CONFLICT-AFFECTED STATES
93
Bibliography
Bräutigam, D. and S. Knack (2004), ―Foreign Aid, Institutions and Governance in Sub-Saharan Africa‖, Economic Development and Cultural Change, Vol. 52, No. 1, pp. 255-285. Browne, S. (2007), ―Aid to Fragile States: Do Donors Help or Hinder?‖, UNU-WIDER Discussion Paper No. 2007/01. Chauvet, L. and P. Collier (2007), ―What are the preconditions for turnarounds in failing states?‖, Développement, institutions & analyses de long terme (DIAL), Paris; Centre for the Study of African Economies, Department of Economics, Oxford University, Oxford Fagernas, S. and J. Roberts (2004), ―Fiscal Impact of Aid: A Survey of Issues and Synthesis of Country Studies of Malawi, Uganda and Zambia‖, ESAU Working Paper 11, Economics and Statistics Analysis Unit, Overseas Development Institute, London. Fjelstad, O. and M. Moore (2008), ―Revenue Authorities and State Capacity in Anglophone Africa‖, Chr. Michelsen Institute Working Paper 2008: 1. Franco-Rodriguez, S., O. Morrisey and M. McGillivray (1998), ―Aid and the Public Sector in Pakistan: Evidence with Endogenous Aid‖, World Development 26, pp. 1241-1250. Gupta, S., B. Clements, A. Pivovarsky and E. Tiongson (2003), ―Foreign Aid and Revenue Response: Does the Composition of Aid Matter?‖, Working Paper No. 03/176, International Monetary Fund, Washington, DC. Gupta, S. and S. Tareq (2008), ―Mobilizing Revenue‖, Finance and Development, Vol. 45, No. 3, September. IMF (2008a), Regional Economic Outlook – Sub-Saharan Africa, International Monetary Fund, Washington, DC. IMF (2008b), Regional Economic Outlook – Middle East and Central Asia, International Monetary Fund, Washington, DC. McGillivray, M. and B. Outtara (2003), ―Aid, Debt Burden and Government Fiscal Behaviour in Côte D‘Ivoire‖, CREDIT Research Paper 03/05, Centre for Research in Economic Development and International Trade, University of Nottingham, Nottingham, United Kingdom. Moss T., G. Petterson and N. van de Walle (2006), ―An Aid-Institutions Paradox? A Review Essay on Aid Dependency and State Building in Sub-Saharan Africa‖, Working Paper 74, Centre for Global Development, January.

2008 ANNUAL REPORT ON RESOURCE FLOWS TO FRAGILE AND CONFLICT-AFFECTED STATES
94
OECD (2008a), ―Concepts and Dilemmas of State Building in Fragile Situations: From Fragility to Resilience‘, OECD/DAC Discussion Paper. OECD (2008b), ―Taxation, State Building, and Aid‖ Factsheet, March. Paris: Organisation for Economic Co-operation and Development. OECD (2008c), ―Governance, Taxation, and Accountability: Issues and Practice‖. Paris: Organisation for Economic Co-operation and Development. Pack, H. and J. Pack (1990), ―Is Foreign Aid Fungible? The Case of Indonesia‖, The Economic Journal 100(399), pp. 188-190. Sindzingre, A. (2007), ‗‖Financing the Developmental State: Tax and Revenue Issues‖, Development Policy Review, Vol. 25, No. 5, pp. 615-632. UN Economic Commission for Africa (2008), ―Development Finance in Africa: From Monterrey to Doha‖, Document prepared for the 11th Meeting of the Africa Partnership Forum, Addis Abbaba, 17-18 November. Wood, A. (2008), ―How Donors Should Cap Aid in Africa‖, Financial Times, 3 September.

2008 ANNUAL REPORT ON RESOURCE FLOWS TO FRAGILE AND CONFLICT-AFFECTED STATES
95
CHAPTER 8. CROSS-BORDER FLOWS OF PROCEEDS FROM CRIMINAL
ACTIVITIES, CORRUPTION AND TAX EVASION
ILLICIT MONEY WORLDWIDE
The official net outflow of capital from developing countries since in 2007 exceeds USD 700 billion. This capital flight depresses the resources available for the financing of development, particularly in sub-Saharan Africa which has a larger share of private wealth held abroad than other regions (Collier, Hoeffler and Pattilo, 2001). In addition to this capital flight, there is an equivalent illicit outflow not captured by official statistics. It is estimated at USD 500-800 billion has an even more pernicious impact on financing for development than the official capital flight.
Illicit outflows comprise flows of money associated with (i) tax evasion, (ii) criminal activity, (iii) bribery and theft by government officials. Illicit outflows from developing countries represent half of all illicit flows (between USD 1 trillion and USD 1.6 trillion of illicit money flows across borders annually) and represent ten times the yearly ODA average since 1990 (USD 50-80 billion per year). Tax evasion is estimated to cause 60-65% of these illicit flows, criminal activity 30-35%, and bribery and theft by government officials 3% (Baker, 2005; Christian Aid, 2008).
Recent research finds that illicit financial flows shifted out of developing countries averaged USD 612-715 billion per year between 2002 and 2006, growing at an average rate of 18.2% each year and reaching between USD 858 billion and USD 1.06 trillion in 2006 (Global Financial Integrity, 2008).
Putting resource-rich countries such as Nigeria, Angola and the Democratic Republic of Congo aside, Global Financial Integrity finds that illicit flows from fragile states are modest, but that their own research understates the share of illicit flows from such countries, which would be higher if more complete and reliable trade and external debt data were available.
TAX EVASION
Christian Aid estimates, from just two activities (transfer mispricing and false invoicing), that the loss of corporate taxes to the developing world is currently running at USD 160 billion a year (Christian Aid, 2008), which is more than one-and-a-half times ODA in 2007 (USD 103.5 billion – OECD online database, 2008). Sixty per cent of trade transactions in Africa are mispriced by an average exceeding 11%. The case of the cassiterite trade across the DRC-Rwanda border illustrates the magnitude of illicit flows in war economies (see Box 8.1).
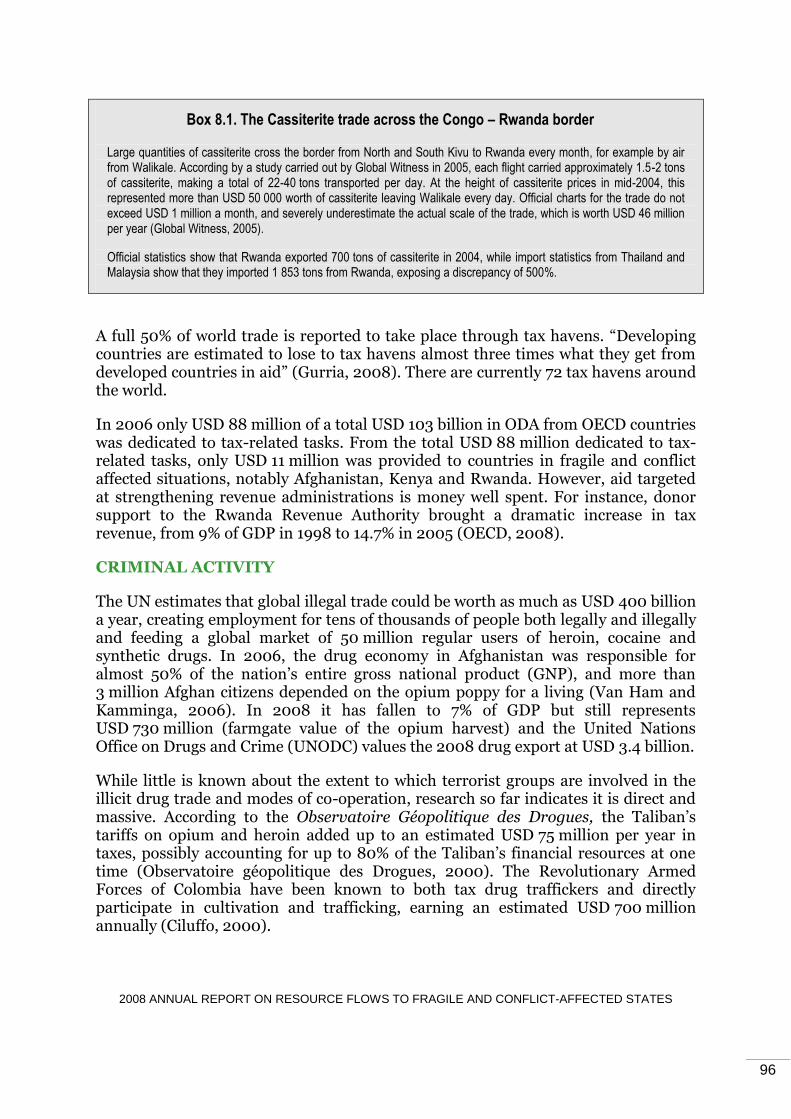
2008 ANNUAL REPORT ON RESOURCE FLOWS TO FRAGILE AND CONFLICT-AFFECTED STATES
96
Box 8.1. The Cassiterite trade across the Congo – Rwanda border
Large quantities of cassiterite cross the border from North and South Kivu to Rwanda every month, for example by air from Walikale. According by a study carried out by Global Witness in 2005, each flight carried approximately 1.5-2 tons of cassiterite, making a total of 22-40 tons transported per day. At the height of cassiterite prices in mid-2004, this represented more than USD 50 000 worth of cassiterite leaving Walikale every day. Official charts for the trade do not exceed USD 1 million a month, and severely underestimate the actual scale of the trade, which is worth USD 46 million per year (Global Witness, 2005).
Official statistics show that Rwanda exported 700 tons of cassiterite in 2004, while import statistics from Thailand and Malaysia show that they imported 1 853 tons from Rwanda, exposing a discrepancy of 500%.
A full 50% of world trade is reported to take place through tax havens. ―Developing countries are estimated to lose to tax havens almost three times what they get from developed countries in aid‖ (Gurria, 2008). There are currently 72 tax havens around the world.
In 2006 only USD 88 million of a total USD 103 billion in ODA from OECD countries was dedicated to tax-related tasks. From the total USD 88 million dedicated to tax-related tasks, only USD 11 million was provided to countries in fragile and conflict affected situations, notably Afghanistan, Kenya and Rwanda. However, aid targeted at strengthening revenue administrations is money well spent. For instance, donor support to the Rwanda Revenue Authority brought a dramatic increase in tax revenue, from 9% of GDP in 1998 to 14.7% in 2005 (OECD, 2008).
CRIMINAL ACTIVITY
The UN estimates that global illegal trade could be worth as much as USD 400 billion a year, creating employment for tens of thousands of people both legally and illegally and feeding a global market of 50 million regular users of heroin, cocaine and synthetic drugs. In 2006, the drug economy in Afghanistan was responsible for almost 50% of the nation‘s entire gross national product (GNP), and more than 3 million Afghan citizens depended on the opium poppy for a living (Van Ham and Kamminga, 2006). In 2008 it has fallen to 7% of GDP but still represents USD 730 million (farmgate value of the opium harvest) and the United Nations Office on Drugs and Crime (UNODC) values the 2008 drug export at USD 3.4 billion.
While little is known about the extent to which terrorist groups are involved in the illicit drug trade and modes of co-operation, research so far indicates it is direct and massive. According to the Observatoire Géopolitique des Drogues, the Taliban‘s tariffs on opium and heroin added up to an estimated USD 75 million per year in taxes, possibly accounting for up to 80% of the Taliban‘s financial resources at one time (Observatoire géopolitique des Drogues, 2000). The Revolutionary Armed Forces of Colombia have been known to both tax drug traffickers and directly participate in cultivation and trafficking, earning an estimated USD 700 million annually (Ciluffo, 2000).

2008 ANNUAL REPORT ON RESOURCE FLOWS TO FRAGILE AND CONFLICT-AFFECTED STATES
97
Box 8.2. Crime as both a cause and consequence of state fragility: the case of Guinea Bissau
2007 data show that West Africa is suffering from a spectacular growth of criminal networks using Senegal, Guinea-Bissau, Mauritania and Cabo Verde as transit points for drug smuggling, from Latin America en route to European markets (UN Office on Drugs and Crime, 2007; International Crisis Group, 2008).
The case of Guinea-Bissau illustrates the consequences of a state‟s weak capacity to enforce the law. According to the UN Office on Drugs and Crime, several hundred kilograms of cocaine pass through Guinea-Bissau every week, before being redistributed in small quantities to Europe. The police lack cars and manpower, there are no prisons, and in 2006 a seizure worth EUR 20 million vanished. The weak Bissau-Guinean state lends itself to criminalisation of state structures, further weakening it: the army is said to be involved in the trafficking (International Crisis Group, 2007). Ongoing reforms and the inclusion of Guinea-Bissau on the agenda of the Peacebuilding Commission are attempts to limit the potential instability.
BRIBERY AND THEFT BY GOVERNMENT OFFICIALS
Countries that tackle corruption and improve their rule of law can increase their national incomes by as much as four times in the long term: there is a ―400 percent good governance dividend‖ (Kaufmann, Kray and Mastruzzi, 2005).
Corruption money (money transferred through the abuse of public office for private gain) received by public officials from developing and transition countries is estimated at USD 20-40 billion per year, which is equivalent to 20-40% of ODA (StAR, 2007). An estimated USD 148 billion per year, or 25% of the GDP of African states, is lost to corruption every year (Africa Union, 2004, cited by Smith, Pieth and Jorge, 2007). Research on corruption in the water sector estimates that corruption raises the price for connecting a household to a water network by 30%, inflating the costs to achieve the MDGs for water and sanitation by over USD 48 billion (Transparency International, 2008).
―Weak governance, corruption, and insecurity combine in a downward spiral‖ (Zoellick, 2008): Chad, the Democratic Republic of Congo, Myanmar and Sudan rank in the bottom 5% of Transparency International‘s 2008 Corruption Perceptions Index. Corruption is often at the core of the political economy of many fragile and conflict-affected states, both on the side of authorities abusing their power and on that of ordinary people who resort to corrupted practices to survive. Natural resources and ODA are particularly easy targets.
―The loot-seeking elites that control parts of Africa illicitly send capital out of the region to the tune of USD 20 to USD 28 billion per year‖, which roughly equals the amount of ODA going to the region (Collier, 2008). Zaire‘s Mobutu Sese Seko has stolen an estimated USD 5 billion over 1965-1986 (equivalent to an average of 1.8% of GDP every year) and Nigeria‘s Sani Abacha between USD 2-5 billion over 1993-98 (Transparency International, 2004; StAR, 2007). As part of an international effort to recover stolen assets, Nigeria has recovered USD 500 million from Switzerland in 2005 (StAR, 2007) and USD 149 million from Jersey. The UK authorities agreed in July 2006 to return USD 1.9 million allegedly stolen by Diepreye Alamieyeseigha,

2008 ANNUAL REPORT ON RESOURCE FLOWS TO FRAGILE AND CONFLICT-AFFECTED STATES
98
governor of the oil-rich Bayelsa State, to Nigeria. The Democratic Republic of Congo estimates that Swiss banks still hold USD 7.9 billion allegedly stolen by Mobutu. CHF 8 million have been frozen in Switzerland since Mobutu‘s move into exile in 1997 and a procedure is still ongoing for their recovery by the Democratic Republic of Congo.
Outside Africa, Indonesia‘ General Suharto has stolen an estimated USD 15-35 billion over 1967-98; and Haiti‘s Jean-Claude Duvalier USD 300-800 million over 1971-1986. Duvalier‘s assets in Switzerland were frozen in 2002 but the recovery process is still ongoing. More recently, Saddam Hussein has made an estimated USD 4.4 billion from kickbacks during the seven years of the Oil for Food programme (US General Accounting Office, 2004).
What is the impact of corruption on aid flows? According to research by Alesina and Weder (2002), donors overall neither favour nor sanction corrupt countries. Speck (cited by Mathisen, 2007) has broken down the charts and found that the United States gives more money to corrupt governments than other donors do; the international agencies have a more balanced approach; and Scandinavian countries are seen to favour less corrupt countries.

2008 ANNUAL REPORT ON RESOURCE FLOWS TO FRAGILE AND CONFLICT-AFFECTED STATES
99
Bibliography Alesina A. and Beatrice Weder, 2002. "Do Corrupt Governments Receive Less Foreign Aid?," American Economic Review, American Economic Association, vol. 92(4), pages 1126-1137, September. Baker, R. (2005), Capitalism’s Achilles Heel: Dirty Money and How to Renew the Free-Market System, John Wiley & Sons Ltd. Basel Institute on Governance (2008), Recovering Stolen Assets. Car, D. and D. Cartwright-Smith (2008), Illicit Financial Flows from Developing Countries: 2002-2006, Global Financial Integrity. Christian Aid (2008), Stripping the Riches. Ciluffo, Frank J. ―The Threat Posed from the Convergence of Organized Crime, Drug Trafficking, and Terrorism,‖ Statement to the Subcommittee on Crime, U.S. House of Representatives, December 13, 2000. Collier P., Anke Hoeffler and Cathy Pattilo, 2001. Capital Flight as a Portfolio Choice, World Bank Economic Review. Collier, P. (2008), ―A Chance to Crack Down on Africa‘s Loot-Seeking Elites‖, The Guardian, 7 October. Global Witness (2005), Under-Mining Peace—The explosive Trade in Cassiterite in Eastern DRC. Carr D. and Devon Cartwright-Smith (2008), ―Illicit Financial Flows from Developing Countries 2002—2006‖. Global Financial Integrity. Gurria, A. (2008), ―The Global Dodgers‖, The Guardian, 27 November. International Crisis Group (2009). Guinea-Bissau: Building a Real Stability Pact, Africa Briefing N°57, January. International Crisis Group (2008). Guinea-Bissau: In Need of a State, Africa Report N°142, July. Kaufmann, D., A. Kray and M. Mastruzzi (2005), Governance Matters IV: Updated Governance Indicators 1996-2004, World Bank. Mathisen, H. (2007), Addressing Corruption in Fragile States: What Role for Donors?, U4/Christian Michelsen Institute. La Géopolitique Mondiale des Drogues 1998/1999 (2000). Paris, Observatoire Géopolitique des Drogues.

2008 ANNUAL REPORT ON RESOURCE FLOWS TO FRAGILE AND CONFLICT-AFFECTED STATES
100
Smith J., Mark Pieth and Guillermo Jorge, ―The Recovery of Stolen Assets: A Fundamental Principle of the UN Convention against Corruption‖, U4 Anti-Corruption Resource Centre Brief, vol. 2, February 2007. Task Force on the Development Impact of Illicit Financial Flows, 2008. Transparency International (2004), Global Corruption Report: Political Corruption Transparency International (2008a), Global Corruption Report: Corruption in the Water Sector Transparency International (2008b), Corruption and (In)security. UN Office on Drugs and Crime and World Bank (2007), Stolen Asset Recovery Initiative (StAR): Challenges, Opportunities and Action Plan, World Bank, Washington, DC. UN Office on Drugs and Crime (2008), Afghanistan Opium Survey. UN Office on Drugs and Crime (2007), Cocaine Trafficking in Western Africa, October. US General Accounting Office, Report GAO-04-579T, 2004. Van Ham, P. and Kamminga, 2006, ―Poppies for Peace: Reforming Afghanistan‘s Opium Industry,‖ The Washington Quarterly, Vol. 30, No. 1, Winter 2006-07, 69-81. Zoellick, R. , speech at the International Institute for Strategic Studies, 12 September 2008.
2008 ANNUAL REPORT ON RESOURCE FLOWS TO FRAGILE AND CONFLICT-AFFECTED STATES
101
SECTION III. TRANSITION FINANCING IN
POST-CONFLICT COUNTRIES
Experiences show that donors face difficulties in managing financial support to countries recovering from conflict. The following section will outline some evidence of the transition financing gap, and provide an overview of recent debates and recommendations to address this gap.
CHAPTER 9. ESTIMATING THE GAP IN TRANSITION FINANCING
The transition period from humanitarian assistance to development is characterised by fluidity and unpredictability, which has clear implications for international assistance. Peace agreements often occur before or in parallel with actual cessation of hostilities, and complex humanitarian situations may coexist while efforts are made to gradually scale up development efforts. There is little clarity on how to sequence and prioritise between short- and medium-term activities; nor is it clear how to ensure support for long-term development that would contribute to the building of effective and resilient states, in particular as existing modalities for engagement are often mandated only after a peace agreement is signed. In addition, the proliferation and fragmentation of mechanisms at country level remains a challenge, which is further compounded by limited donor field presence and a lack of flexible and rapid delivery by pooled funds. Consequently, there is a need for comprehensive and integrated approaches across the international system where different actors (humanitarian, development, military) need to work simultaneously to address different but complementary objectives.
A complicating factor is the lack of conclusive transition funding data. There is no definitive tracking of the level of resources going into the transition period, nor clear definitions of activities and actors involved. As a consequence, there is a lack of clarity on the level of funding required and through what instrument.
GAPS IN FUNDING FOR EARLY RECOVERY
Recent attempts to track resource flows to the transition period include work by the Financing Task Force of the Cluster Working Group on Early Recovery, which highlighted early recovery needs through an analysis of existing humanitarian financing instruments. Box 9.1 highlights some of the findings of this study. From these findings it is clear that there is a funding gap; on average less than 50% of early recovery financing is pledged compared to a shortfall of only 25% for humanitarian requests.

2008 ANNUAL REPORT ON RESOURCE FLOWS TO FRAGILE AND CONFLICT-AFFECTED STATES
102
The below findings only explore the financing gap in terms of early recovery activities that are financed through humanitarian aid instruments; they thus exclude other types of funding instruments available during the transition period. Looking at selected ODA charts for Afghanistan, Burundi, Haiti and Sudan, it is difficult to draw conclusive data on the financial flows during the transition period. Nonetheless, a brief analysis of aid levels before and after peace/independence highlights the following trends.
Box 9.1. The early recovery financing gap in humanitarian funding instruments
A total of 3 859 projects were included in the sample for review, selected from Flash Appeals, Consolidated Appeals (CAPs), the Central Emergency Response Fund (CERF) and the Common Humanitarian Pooled Funds (CHPFs) from the period 2006-08. The results of the analysis are as follows.
Appeal Gap in early recovery funding Gap in humanitarian funding
Flash Appeals 83% 47%
Consolidated Appeals 56% 22%
CERF 3% (approved for early recovery) n/a
CHPF Sudan 57% 16%
CHPF DRC 64% 43%
Of the fifteen Flash Appeals reviewed from 2006 to 2008, 17% of the early recovery funding requirement was met, leaving an unfunded gap of 83%. In comparison, 53% of the requirement for humanitarian assistance was met, leaving an unfunded gap of 47%.
For fifteen CAPs reviewed from 2006 to 2008, 44% of the early recovery funding requirement was met, leaving an unfunded gap of 56%. In comparison, 78% of the humanitarian requirement was met, leaving an unfunded gap of 22%.
In terms of the CERF41, a total of USD 1bn was approved for all projects in 20 natural disaster and conflict countries under both the Rapid Response and the Under Funded Emergencies windows, included in the sample from 2006-08. Of the USD 1 002 863 476 approved, USD 29 856 408 was approved for early recovery projects. Three per cent of total funding for the period for the sample under review was therefore allocated to early recovery projects.
For the CHPF for Sudan (2008), 43% of the early recovery requirement was funded, leaving an unfunded gap of 57%. In comparison, 84% of the humanitarian requirement was funded, leaving an unfunded gap of 16%.
For the CHPF for DRC (2008), 36% of the early recovery requirement was funded, leaving an unfunded gap of 64%. In comparison, 57% of the humanitarian requirement was met, leaving an unfunded gap of 43%.
Source: United Nations Cluster Working Group on Early Recovery (2008).
In the case of Afghanistan, Sudan, and Timor-Leste, ODA commitments increased in the year immediately following peace/independence, while in the case of Burundi and Haiti there were no changes to the overall ODA commitments.
41 Official CERF data publically available provided information only on approvals of funding to specific projects and disbursement dates. Data on funding requested by specific agencies for specific projects are not available on the CERF website.

2008 ANNUAL REPORT ON RESOURCE FLOWS TO FRAGILE AND CONFLICT-AFFECTED STATES
103
Sector allocatable aid (ODA excluding general programme aid, debt relief, humanitarian aid, aid through NGOs, administrative costs, and aid that is not specified by sector– an indication of the financing available for in-country programming) increased immediately following peace/independence in Afghanistan, Sudan and Timor-Leste, remained stable in Haiti, and decreased in Burundi.
Humanitarian aid increased or remained stable in all five cases following the onset of peace/independence.
While no conclusive evidence can be drawn from the above analysis, this lack of evidence shows the struggle that donors are facing when transitioning from one financing instrument to another in support of conflict-affected situations. More specifically, three different scenarios are worth noting, as highlighted below:
In Sudan, allocatable aid peaked around the time of the peace agreement, and then declined more rapidly than humanitarian aid.
In Afghanistan, allocatable aid rose sharply after the Bonn Agreement, as humanitarian aid declined.
In Burundi, allocatable aid declined dramatically the year following the peace agreement, as humanitarian aid more than doubled. It took more than two years before allocable aid reached pre-peace levels.
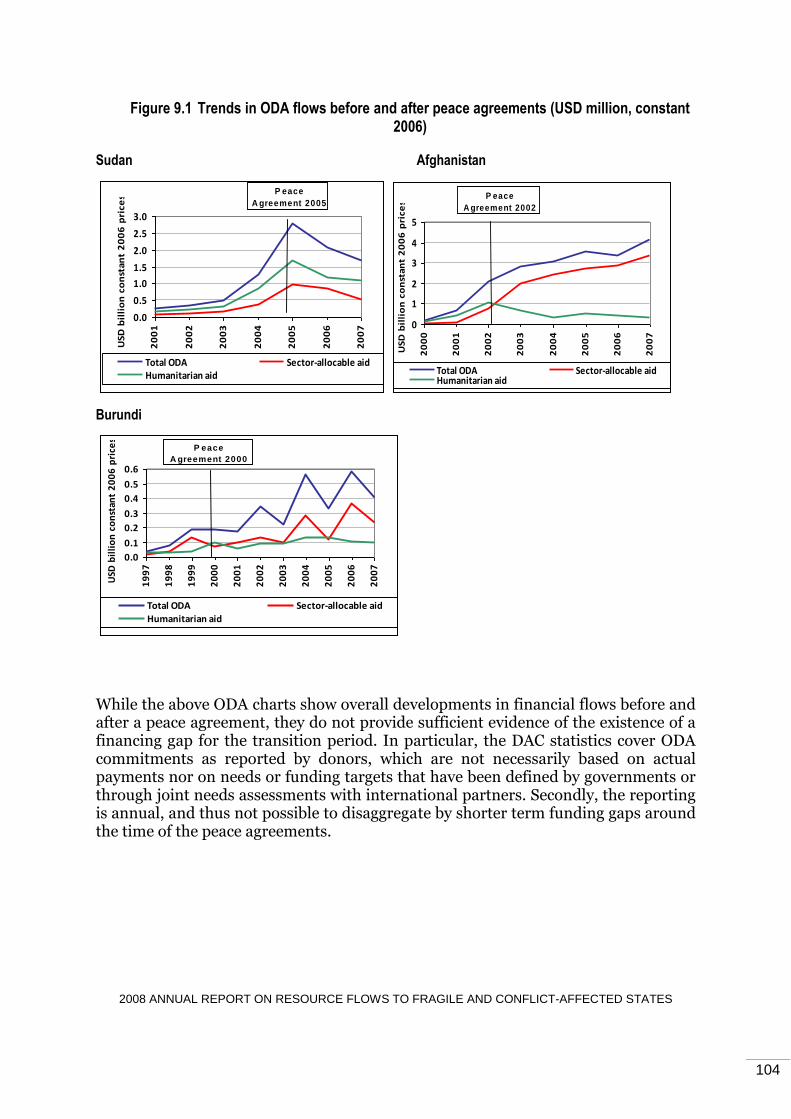
2008 ANNUAL REPORT ON RESOURCE FLOWS TO FRAGILE AND CONFLICT-AFFECTED STATES
104
Figure 9.1 Trends in ODA flows before and after peace agreements (USD million, constant 2006)
Sudan Afghanistan
0.0
0.5
1.0
1.5
2.0
2.5
3.0
20
01
20
02
20
03
20
04
20
05
20
06
20
07
USD
bil
lio
n c
on
stan
t 2
00
6 p
rice
s
Total ODA Sector-allocable aidHumanitarian aid
P eace
A greement 2005
0
1
2
3
4
5
20
00
20
01
20
02
20
03
20
04
20
05
20
06
20
07
US
D b
illi
on
co
nst
an
t 2
00
6 p
ric
es
Total ODA Sector-allocable aidHumanitarian aid
P eace
A greement 2002
Burundi
0.0
0.1
0.2
0.3
0.4
0.5
0.6
19
97
19
98
19
99
20
00
20
01
20
02
20
03
20
04
20
05
20
06
20
07
USD
bil
lio
n c
on
stan
t 2
00
6 p
rice
s
Total ODA Sector-allocable aid
Humanitarian aid
P eace
A greement 2000
While the above ODA charts show overall developments in financial flows before and after a peace agreement, they do not provide sufficient evidence of the existence of a financing gap for the transition period. In particular, the DAC statistics cover ODA commitments as reported by donors, which are not necessarily based on actual payments nor on needs or funding targets that have been defined by governments or through joint needs assessments with international partners. Secondly, the reporting is annual, and thus not possible to disaggregate by shorter term funding gaps around the time of the peace agreements.

2008 ANNUAL REPORT ON RESOURCE FLOWS TO FRAGILE AND CONFLICT-AFFECTED STATES
105
GAPS IN FUNDING FOR PEACE BUILDING
Recently, the UN Peace-Building Support Office has identified gaps in funding for peace building in a number of countries, such as Burundi, the Central African Republic and Guinea-Bissau. Typically, peace-building efforts in post-conflict countries exhibit three types of gaps: (i) financing gaps; (ii) project and thematic gaps; and (iii) co-ordination gaps for mobilising additional resources.
Furthermore, access to other external and domestic resources is often low. Where the macroeconomic and fiscal situation may be improving and tax revenues increasing, these often remain far from sufficient for the peace building and recovery needed.
The experience in Guinea-Bissau confirms many of these gaps and challenges. In particular, non-coordinated actions by donors are a problem – many initiatives for peace building have been launched in Guinea-Bissau recently, but have not received full funding. Table 9.1 provides an illustration of the various actions and funding gaps related to peace building.
Table 9.1 Funding gaps for peace-building in Guinea-Bissau
Gap
USD million % PRSP 2007 – 2010 252 43% UNDAF 2008 – 2013 92 20% Restructuring modernisation of the defence and security sector 2007-2010
121 34%
Geneva Round Table Conference, November 2006 246 54% Operational Plan –International Conference on Drugs 12 35%
Source: UNPBSO, 2008a
ODA to the Central African Republic has increased in recent years. Still, support to peace building will continue to require external resources, despite significant absorption capacity constraints. Moreover, donor presence in the country is low – hence, the Central African Republic is dependent on a few donors (often with a limited funding envelope). There are significant funding gaps for peace-building-related activities in both the United Nations Development Assistance Framework and the Poverty Reduction Strategy Paper. As of June 2008, a third of the financing required for peace consolidation, conflict prevention and security has not been funded.

2008 ANNUAL REPORT ON RESOURCE FLOWS TO FRAGILE AND CONFLICT-AFFECTED STATES
106
Table 9.2 Funding gaps for peace building in the Central African Republic
UNDAF 2007 – 2011
Gap PRSP 2008 – 2010
Gap
% USD million % USD million
Governance 72% 46 Peace consolidation, conflict prevention and security
34% 24.8
Post-conflict 81% 102 Governance, rule of law 24% 17.8
HIV/AIDS 76% 57.8 Economic recovery 58% 512.6
Development of human capital
33% 99.9
Source: UNPBSO, 2008b

2008 ANNUAL REPORT ON RESOURCE FLOWS TO FRAGILE AND CONFLICT-AFFECTED STATES
107
CHAPTER 10. INITIAL FINDINGS OF CHALLENGES TO TRANSITION
FINANCING
The transition phase is neither strictly humanitarian nor developmental, which poses challenges for financing of transition interventions. Humanitarian funding instruments focus predominantly on immediate life-saving interventions, whereas development funding focuses on promoting long-term and sustained positive socio-economic change. Often, funding gaps occur when humanitarian funding is phased out and before developmental funds can be accessed and mobilised. Hence, there is the risk that transition needs remain largely unmet, leaving affected populations highly vulnerable to the resumption of conflict, secondary disasters or dependence on relief assistance for extended periods. In addition, development programmes are often constrained by limited national capacity to co-ordinate, plan and implement recovery and development programmes.
There are financing, co-ordination and capacity constraints related to bilateral and multilateral donor mechanisms, procedures and processes, which obstruct broad-based, coherent and rapid engagement to address fragility, provide needed peace dividends and support immediate post-conflict and early recovery needs. As a result, aid flows remain volatile over time and volumes are not in line with immediate needs.
Based on initial analysis of donor behaviour during the transition period, the following challenges and tensions can be identified:
On the donor side, there are systemic constraints related to existing procedures and policies that prevent donors from making funds available at different stages of the transition period and through the right financing channels (humanitarian and development funding; ODA and non-ODA). Furthermore, there are whole-of-government operational constraints related to difficulties of involving political, development, security and humanitarian actors in a strategic way as well as how these actors co-ordinate and partner with countries emerging from conflict. Finally, there is the limited capacity and willingness to accept and manage sufficient levels of risk early enough when transitioning from humanitarian to development aid.
At the global level, constraints can be associated with the existing aid architecture, in particular the different paradigms and principles guiding humanitarian and development aid, which often result in limited timeliness of transition initiatives. That is to say, when transition activities are funded using humanitarian funds, the funding cycle is by nature short (generally a maximum of one year); when transition is funded through development funding instruments, they fall under the same requirements and principles as ―regular‖ development programmes, although the situation requires approaches that allow for more flexibility and speed.

2008 ANNUAL REPORT ON RESOURCE FLOWS TO FRAGILE AND CONFLICT-AFFECTED STATES
108
In terms of implementation constraints, there is a lack of clarity on how to transfer accountability, capacity and responsibility from the international community under humanitarian action to national ownership. In addition, existing modalities and mechanisms are not adequately targeted to address the transition period, and require lead time and extensive planning to become operational. The result is a proliferation of mechanisms in-country and a fragmentation of international response, as different actors are rapidly gearing up to respond to urgent needs.
SOME INITIAL RECOMMENDATIONS
A number of political and analytical processes are under way to further explore and address the above constraints, including efforts to improve the UN peace-building architecture and response to the immediate conflict challenges. Initial findings from these processes suggest that: i) development funds are needed to plug a large part of the transition financing gap, given the need to start transitioning towards improved national involvement and ownership; and ii) the initial focus should be on improving existing mechanisms and modalities rather than creating new vertical funding modalities. While it is still too early to provide specific solutions, some recommendations for how to address the existing constraints have already emerged:
Donors need to improve internal processes to increase flexibility in development financing for early recovery and development systems, to ensure rapid release of funds and appropriate risk management systems.
International partners need to review existing mechanisms to identify adequate/appropriate front-loaded delivery mechanisms for the transition period based on appropriate triggers for allocation and an improved understanding of the appropriate implementation vehicles.
The focus should be on improving existing international multilateral financing mechanisms to ensure adequate transition financing at different times, rather than to establish new vertical modalities. This would also help decrease fragmentation of aid delivered through multilateral mechanisms.
While much has been done to improve how the multilateral system responds to the transition period, there is limited clarity on where bilateral donors fit into the current operational/co-ordinated approaches and how they can engage more effectively with the multilaterals.

2008 ANNUAL REPORT ON RESOURCE FLOWS TO FRAGILE AND CONFLICT-AFFECTED STATES
109
Bibliography
Copenhagen Early Recovery Practitioners and Policy Forum (2008), ―Towards Joint Action‖, October.
United Nations Cluster Working Group on Early Recovery (2008), ―Financing for Early Recovery: Highlighting the Gaps‖, September.
UN Peace-Building Support Office (2008a), ―Mapping of Resources and Gaps for Peacebuilding in Guinea-Bissau‖, April.
UN Peace-Building Support Office (2008b), ―Overview of the Mapping of Resources and Gaps for Peacebuilding in the Central African Republic‖, October.