resolvin d1 elisa kit · cayman’s resolvin d1 (rvd1) elisa kit is a competitive assay that can be...
TRANSCRIPT
www.caymanchem.comCustomer Service 800.364.9897Technical Support 888.526.53511180 E. Ellsworth Rd · Ann Arbor, MI · USA
Resolvin D1 ELISA Kit
Item No. 500380
3GENERAL INFORMATION
TABLE OF CONTENTS GENERAL INFORMATION 3 Materials Supplied
4 Safety Data4 Precautions5 If You Have Problems5 Storage and Stability5 Materials Needed but Not Supplied
INTRODUCTION 6 Background
7 About This Assay
8 DescriptionofAChECompetitiveELISAs
10 Biochemistry of Acetylcholinesterase
12 Definition of Key Terms
PRE-ASSAY PREPARATION 13 Buffer Preparation
14 Sample Preparation
16 Sample Matrix Properties
ASSAY PROTOCOL 19 Preparation of Assay-Specific Reagents
22 Plate Set Up
23 Performing the Assay
ANALYSIS 24 Calculations
28 Performance Characteristics
RESOURCES 32 Troubleshooting
33 References
34 Plate Template
35 Notes
35 Warranty and Limitation of Remedy
GENERAL INFORMATION
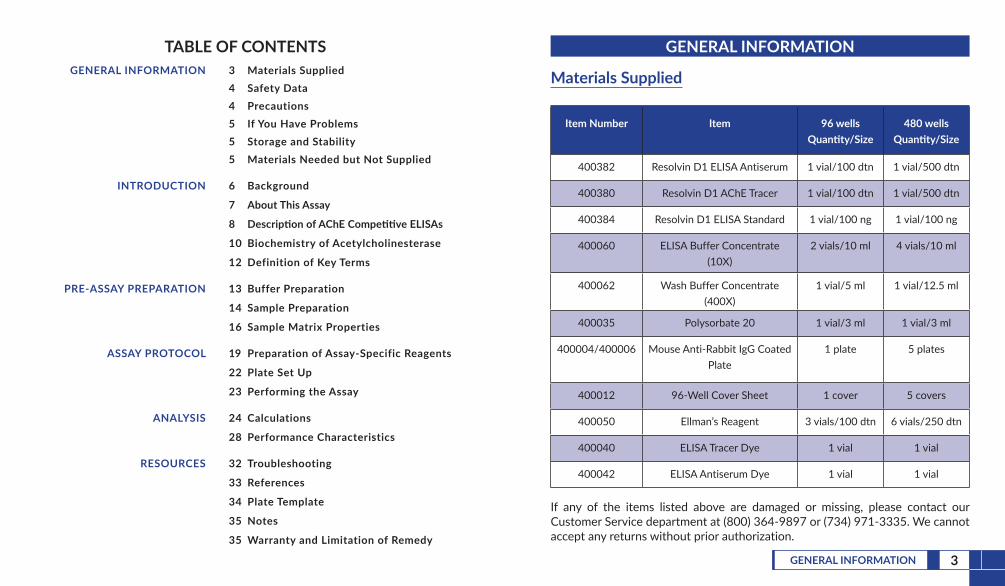
Materials Supplied
Item Number Item 96 wells Quantity/Size
480 wells Quantity/Size
400382 Resolvin D1 ELISA Antiserum 1 vial/100 dtn 1 vial/500 dtn
400380 Resolvin D1 AChE Tracer 1 vial/100 dtn 1 vial/500 dtn
400384 Resolvin D1 ELISA Standard 1 vial/100 ng 1 vial/100 ng
400060 ELISA Buffer Concentrate (10X)
2 vials/10 ml 4 vials/10 ml
400062 Wash Buffer Concentrate (400X)
1 vial/5 ml 1 vial/12.5 ml
400035 Polysorbate 20 1 vial/3 ml 1 vial/3 ml
400004/400006 Mouse Anti-Rabbit IgG Coated Plate
1 plate 5 plates
400012 96-Well Cover Sheet 1 cover 5 covers
400050 Ellman’s Reagent 3 vials/100 dtn 6 vials/250 dtn
400040 ELISA Tracer Dye 1 vial 1 vial
400042 ELISA Antiserum Dye 1 vial 1 vial
If any of the items listed above are damaged or missing, please contact our Customer Service department at (800) 364-9897 or (734) 971-3335. We cannot accept any returns without prior authorization.

4 GENERAL INFORMATION 5GENERAL INFORMATION
! WARNING: THIS PRODUCT IS FOR RESEARCH ONLY - NOT FORHUMAN OR VETERINARY DIAGNOSTIC OR THERAPEUTIC USE.
Safety DataThis material should be considered hazardous until further information becomes available. Do not ingest, inhale, get in eyes, on skin, or on clothing. Wash thoroughly after handling.Before use, the user must review the complete Safety Data Sheet, which has been sent via email to your institution.
PrecautionsPleasereadtheseinstructionscarefullybeforebeginningthisassay.The reagents in this kit have been tested and formulated to work exclusively with Cayman Chemical’s AChE ELISA Kits. This kit may not perform as described if any reagent or procedure is replaced or modified.When compared to quantification by LC/MS or GC/MS, it is not uncommon for immunoassays to report higher analyte concentrations. While LC/MS or GC/MS analyses typically measure only a single compound, antibodies used in immunoassays sometimes recognize not only the target molecule, but also structurally related molecules, including biologically relevant metabolites. In many cases, measurement of both the parent molecule and metabolites is more representative of the overall biological response than is the measurement of a short-lived parent molecule. It is the responsibility of the researcher to understand the limits of both assay systems and to interpret their data accordingly.
If You Have ProblemsTechnicalServiceContactInformation
Phone: 888-526-5351 (USA and Canada only) or 734-975-3888Fax: 734-971-3640Email: [email protected]
In order for our staff to assist you quickly and efficiently, please be ready to supply the lot number of the kit (found on the outside of the box).
Storage and StabilityThis kit will perform as specified if stored as directed at -80°C and used before the expiration date indicated on the outside of the box.
Materials Needed But Not Supplied1. A plate reader capable of measuring absorbance between 405-420 nm.2. Adjustable pipettes and a repeating pipettor.3. A source of ‘UltraPure’ water. Water used to prepare all ELISA reagents and
buffers must be deionized and free of trace organic contaminants (‘UltraPure’). Use activated carbon filter cartridges or other organic scavengers. Glass distilled water (even if double distilled), HPLC-grade water, and sterile water (for injections) are not adequate for ELISA. NOTE: UltraPure water is available for purchase from Cayman (Item No. 400000).
4. Materials used for Sample Preparation (see page 14).
6 INTRODUCTION 7INTRODUCTION
INTRODUCTION
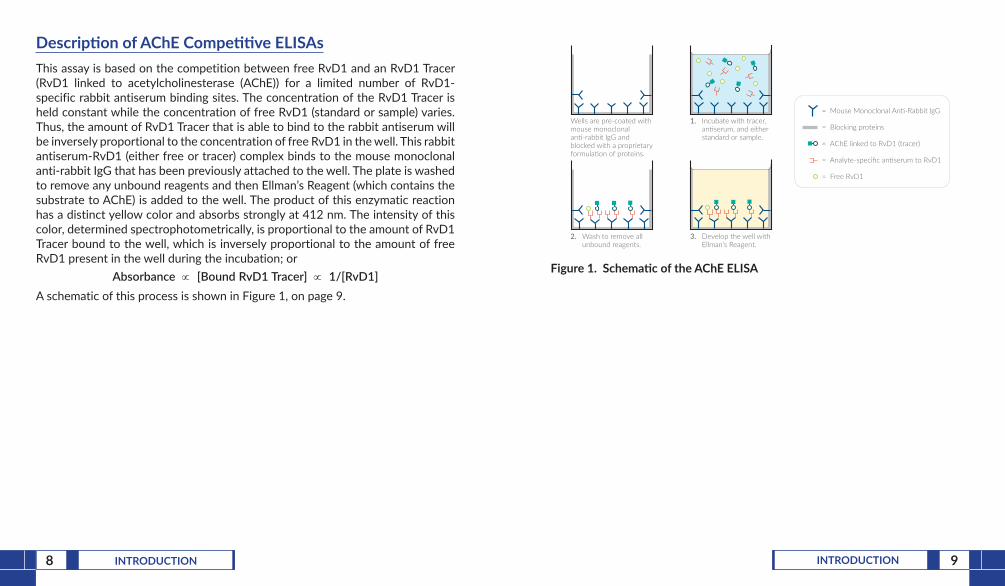
BackgroundResolvins are a family of potent lipid mediators derived from both eicosapentaenoic acid (EPA) and docosahexaenoic acid (DHA).1,2 Resolvins promote the resolution of the inflammatory response back to a non-inflamed state.3 Resolvin D1 (RvD1, 17(S)-Resolvin D1) is produced from the sequential oxygenation of DHA by 15- and 5-lipoxygenases.1 The 17(R)- epimer of RvD1 can also be generated with aspirin-treatment.4 Both RvD1 and its 17(R) configuration reduce human polymorphonuclear leukocyte (PMNL) transendothelial migration, the earliest event in acute inflammation, with EC50 values of ~30 nM.4 RvD1 and its aspirin-triggered form also exhibit a dose-dependent reduction in leukocyte infiltration in a murine model of peritonitis with a maximal inhibition of ~35% at a 10-100 ng dose.5 In a rat model of adjuvant-induced arthritis, RvD1 exhibited antihyperalgesic effects.6 It was also shown to prevent and attenuate post-operative pain in a rat model.7 Furthermore, resolvins inhibit the Transient Receptor Potential (TRP) channels, specifically TRPA1, TRPV3, and TRPV4,8,9 producing anti-nociceptive effects. Resolvins also specifically interact with human phagocytes via the ALX and GPR32 receptors suggesting each plays a role in acute inflammation.10 Additionally, RvD1 has been shown to improve insulin sensitivity in leptin receptor-deficient (db/db) mice, possibly related to the reduction of pro-inflammatory macrophages found in adipose tissues.11
About This AssayCayman’s Resolvin D1 (RvD1) ELISA Kit is a competitive assay that can be used for quantification of RvD1 (17(S)-Resolvin D1) in plasma, serum, and cell culture supernatants. The assay has a range from 3.3-2,000 pg/ml and a sensitivity (80% B/B0) of approximately 15 pg/ml.
8 INTRODUCTION 9INTRODUCTION
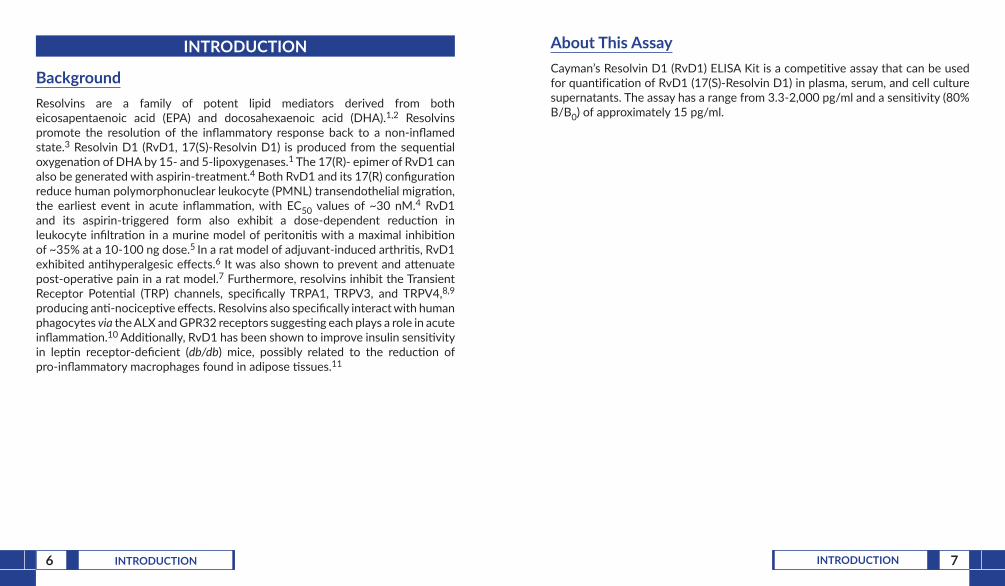
1. Incubate with tracer, an�serum, and either standard or sample.
2. Wash to remove all unbound reagents.
3. Develop the well with Ellman’s Reagent.
Wells are pre-coated with mouse monoclonal an�-rabbit IgG and blocked with a proprietary formula�on of proteins.
= Mouse Monoclonal An�-Rabbit IgG
= Blocking proteins
= AChE linked to RvD1 (tracer)
= Analyte-specific an�serum to RvD1
= Free RvD1
Figure1.SchematicoftheAChEELISA
DescriptionofAChECompetitiveELISAsThis assay is based on the competition between free RvD1 and an RvD1 Tracer (RvD1 linked to acetylcholinesterase (AChE)) for a limited number of RvD1-specific rabbit antiserum binding sites. The concentration of the RvD1 Tracer is held constant while the concentration of free RvD1 (standard or sample) varies. Thus, the amount of RvD1 Tracer that is able to bind to the rabbit antiserum will be inversely proportional to the concentration of free RvD1 in the well. This rabbit antiserum-RvD1 (either free or tracer) complex binds to the mouse monoclonal anti-rabbit IgG that has been previously attached to the well. The plate is washed to remove any unbound reagents and then Ellman’s Reagent (which contains the substrate to AChE) is added to the well. The product of this enzymatic reaction has a distinct yellow color and absorbs strongly at 412 nm. The intensity of this color, determined spectrophotometrically, is proportional to the amount of RvD1 Tracer bound to the well, which is inversely proportional to the amount of free RvD1 present in the well during the incubation; or
Absorbance ∝ [Bound RvD1 Tracer] ∝ 1/[RvD1]A schematic of this process is shown in Figure 1, on page 9.

10 INTRODUCTION 11INTRODUCTION
Biochemistry of AcetylcholinesteraseThe electric organ of the electric eel, E. electricus, contains an avid AChE capable of massive catalytic turnover during the generation of its electrochemical discharges. The electric eel AChE has a clover leaf-shaped tertiary structure consisting of a triad of tetramers attached to a collagen-like structural fibril. This stable enzyme is capable of high turnover (64,000 s-1) for the hydrolysis of acetylthiocholine.A molecule of the analyte covalently attached to a molecule of AChE serves as the tracer in AChE enzyme immunoassays. Quantification of the tracer is achieved by measuring its AChE activity with Ellman’s Reagent. This reagent consists of acetylthiocholine and 5,5’-dithio-bis-(2-nitrobenzoic acid). Hydrolysis of acetylthiocholine by AChE produces thiocholine (see Figure 2, on page 11). The non-enzymatic reaction of thiocholine with 5,5’-dithio-bis-(2-nitrobenzoic acid) produces 5-thio-2-nitrobenzoic acid, which has a strong absorbance at 412 nm (ε = 13,600).AChE has several advantages over other enzymes commonly used for enzyme immunoassays. Unlike horseradish peroxidase, AChE does not self-inactivate during turnover. This property of AChE also allows redevelopment of the assay if it is accidentally splashed or spilled. In addition, the enzyme is highly stable under the assay conditions, has a wide pH range (pH 5-10), and is not inhibited by common buffer salts or preservatives. Since AChE is stable during the development step, it is unnecessary to use a ‘stop’ reagent, and the plate may be read whenever it is convenient.
O
SN+ Acetylthiocholine
O
O- -SN+ Thiocholine
S S NO2O2N
COO--OOC
5,5'-dithio-bis-(2-Nitrobenzoic Acid)
SS
O2N
-OOC
N+
NO2
COO-
-S
5-thio-2-Nitrobenzoic Acidλmax: 412 nm
ε: 13,600
Figure2.Reactioncatalyzedbyacetylcholinesterase
13PRE-ASSAY PREPARATION12 INTRODUCTION
DefinitionofKeyTerms
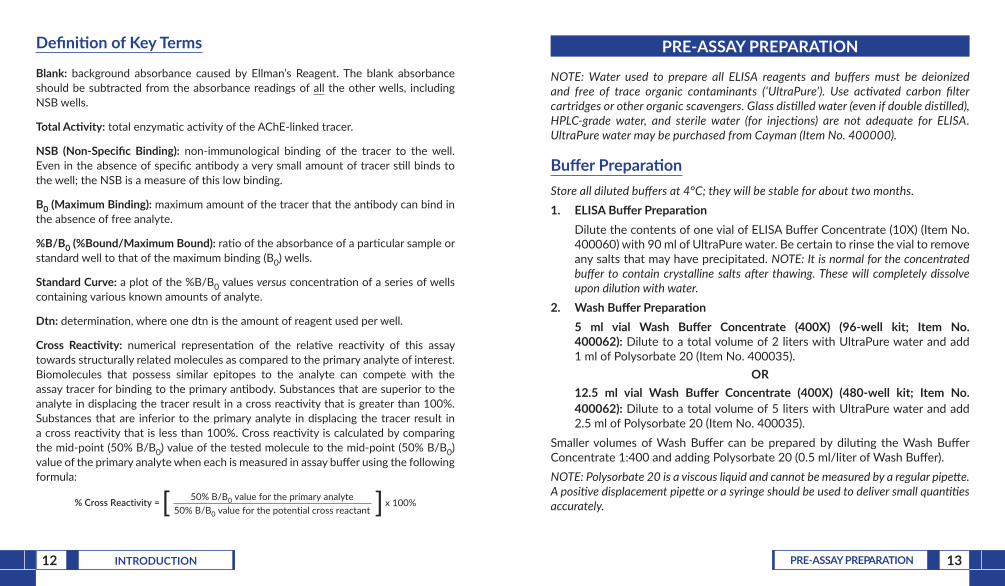
Blank: background absorbance caused by Ellman’s Reagent. The blank absorbance should be subtracted from the absorbance readings of all the other wells, including NSB wells.
TotalActivity: total enzymatic activity of the AChE-linked tracer.
NSB (Non-Specific Binding): non-immunological binding of the tracer to the well. Even in the absence of specific antibody a very small amount of tracer still binds to the well; the NSB is a measure of this low binding.
B0(MaximumBinding): maximum amount of the tracer that the antibody can bind in the absence of free analyte.
%B/B0(%Bound/MaximumBound): ratio of the absorbance of a particular sample or standard well to that of the maximum binding (B0) wells.
Standard Curve: a plot of the %B/B0 values versus concentration of a series of wells containing various known amounts of analyte.
Dtn: determination, where one dtn is the amount of reagent used per well.
Cross Reactivity: numerical representation of the relative reactivity of this assay towards structurally related molecules as compared to the primary analyte of interest. Biomolecules that possess similar epitopes to the analyte can compete with the assay tracer for binding to the primary antibody. Substances that are superior to the analyte in displacing the tracer result in a cross reactivity that is greater than 100%. Substances that are inferior to the primary analyte in displacing the tracer result in a cross reactivity that is less than 100%. Cross reactivity is calculated by comparing the mid-point (50% B/B0) value of the tested molecule to the mid-point (50% B/B0) value of the primary analyte when each is measured in assay buffer using the following formula:
% Cross Reactivity = 50% B/B0 value for the primary analyte50% B/B0 value for the potential cross reactant
x 100%[ ]
PRE-ASSAY PREPARATION
NOTE: Water used to prepare all ELISA reagents and buffers must be deionized and free of trace organic contaminants (‘UltraPure’). Use activated carbon filter cartridges or other organic scavengers. Glass distilled water (even if double distilled), HPLC-grade water, and sterile water (for injections) are not adequate for ELISA. UltraPure water may be purchased from Cayman (Item No. 400000).
BufferPreparationStore all diluted buffers at 4°C; they will be stable for about two months.1. ELISABufferPreparation
Dilute the contents of one vial of ELISA Buffer Concentrate (10X) (Item No. 400060) with 90 ml of UltraPure water. Be certain to rinse the vial to remove any salts that may have precipitated. NOTE: It is normal for the concentrated buffer to contain crystalline salts after thawing. These will completely dissolve upon dilution with water.
2. WashBufferPreparation5 ml vial Wash Buffer Concentrate (400X) (96-well kit; Item No. 400062): Dilute to a total volume of 2 liters with UltraPure water and add 1 ml of Polysorbate 20 (Item No. 400035).
OR12.5 ml vial Wash Buffer Concentrate (400X) (480-well kit; Item No.400062): Dilute to a total volume of 5 liters with UltraPure water and add 2.5 ml of Polysorbate 20 (Item No. 400035).
Smaller volumes of Wash Buffer can be prepared by diluting the Wash Buffer Concentrate 1:400 and adding Polysorbate 20 (0.5 ml/liter of Wash Buffer).NOTE: Polysorbate 20 is a viscous liquid and cannot be measured by a regular pipette. A positive displacement pipette or a syringe should be used to deliver small quantities accurately.

14 PRE-ASSAY PREPARATION 15PRE-ASSAY PREPARATION
SamplePreparation
Testing for InterferencePlasma and other heterogeneous mixtures may contain contaminants which can interfere in the assay. It is best to check for interference to evaluate the need for sample purification before embarking on a large number of sample measurements. To test for interference, dilute one or two test samples to obtain at least two different dilutions of each sample between approximately 20 and 500 pg/ml (i.e., between 20-80% B/B0, which is the linear portion of the standard curve). If the two different dilutions of the sample show good correlation (differ by 20% or less) in the final calculated RvD1 concentration, purification is not required. If you do not see good correlation of the different dilutions, purification is advised.
GeneralPrecautions • All samples must be free of organic solvents prior to assay.• Samples should be assayed immediately after collection; samples that
cannot be assayed immediately should be stored at -80°C.• Samples of rabbit origin may contain antibodies which interfere with the
assay by binding to the mouse anti-rabbit plate. We recommend that all rabbit samples be purified prior to use in this assay.
• AEBSF (Pefabloc SC®) and PMSF inhibit AChE. Samples containing these protease inhibitors should not be used in this assay.
Plasma and Serum
We strongly advise to purify plasma and serum samples prior to the assay, using the following sample purification protocol.
1. Prepare SPE Cartridges (C-18) (6 ml) by rinsing with 5 ml of methanol followed immediately by 5 ml of water.
2. Apply samples (0.5 ml is recommended).3. Wash C-18 cartridges with water.4. Elute Resolvin D1 with 3 ml of ethyl acetate5. Evaporate ethyl acetate under a gentle stream of nitrogen. Samples can be
heated up to 37°C to accelerate drying.6. Dissolve residues in 0.5 ml of ELISA buffer (original sample volume) or in
0.25 ml of ELISA buffer to concentrate your samples two-fold.NOTE: SPE Catridges (C18) are available from Cayman, Item No 400020.
Culture MediumGenerally, samples in culture medium can be assayed without purification.

16 PRE-ASSAY PREPARATION 17PRE-ASSAY PREPARATION
SampleMatrixProperties
Spike and RecoveryPlasma and serum were spiked with different amounts of Resolvin D1, purified as described in the Sample Preparation Section (see page 14), and analyzed using the Resolvin D1 ELISA Kit. The results are shown below. The error bars represent standard deviations obtained from multiple dilutions of each sample.
Human Serum
Human Plasma
Mea
sure
d R
eso
lvin
D1
(pg
/ml)
0 250 500 750 1,000 1,2500
500
1,000
1,500
2,000
Spiked Resolvin D1 (pg/ml)
Human Plasma
Human Serum
Y = 1.282*X + 59.72
Y = 0.8494*X + 33.66
R2 = 0.9941
R2 = 0.9932
Figure3.Spikeandrecoveryinpurifiedplasmaandserum
DMEM cell culture medium, containing phenol red and 10% FBS was spiked with different amounts of Resolvin D1, then diluted with ELISA buffer and tested using the Resolvin D1 ELISA.
Levelspiked(pg/ml) Average(pg/ml) % Recovery %CV
5,000 4,622 92.4 4.1
1,000 1,013 101.3 10.4
100 91.7 91.7 8.2
20 16.4 82.0 10.8
0 1.9 - 22.4
Table1.SpikeandrecoveryofResolvinD1inacellculturemediumDMEM containing phenol red and 10% FBS was spiked with the above levels of RvD1. These samples were measured at multiple dilutions in duplicate. 5,000 and 1,000 pg/ml samples were diluted to fall within 20-80% B/B0.

19ASSAY PROTOCOL18 PRE-ASSAY PREPARATION
3,000
4,000
6,000M
easu
red
Res
olv
in D
1 (
pg
/ml)
Spiked Resolvin D1 into DMEM (pg/ml)
0 2,000 3,000 4,0000
6,000
1,000
y = 0.9233x + 18.695r2 = 0.9996
5,000
5,000
2,000
1,000
Figure4.SpikeandrecoveryofResolvinD1inacellculturemediumError bars represent standard deviations obtained from multiple dilutions of each sample.
ASSAY PROTOCOL
PreparationofAssay-SpecificReagents
Resolvin D1 ELISA StandardEquilibrate a pipette tip in ethanol by repeatedly filling and expelling the tip with ethanol several times. Using the equilibrated pipette tip, transfer 100 µl of the Resolvin D1 ELISA Standard (Item No. 400384) into a clean test tube, then dilute with 900 µl of UltraPure water. The concentation of this solution (the bulk standard) will be 20 ng/ml.NOTE: If assaying culture medium samples, culture medium should be used in place of ELISA Buffer for dilution of the standard curve and samples.To prepare the standard for use in ELISA: Obtain eight clean test tubes and number them #1 through #8. Aliquot 900 µl ELISA Buffer to tube #1 and 600 µl ELISA Buffer to tubes #2-8. Transfer 100 µl of the bulk standard (20 ng/ml) to tube #1 and mix thoroughly. Serially dilute the standard by removing 400 µl from tube #1 and placing in tube #2; mix thoroughly. Next, remove 400 µl from tube #2 and place it into tube #3; mix thoroughly. Repeat this process for tubes #4-8. The diluted standards may be stored at 4°C for no more than 24 hours.
200 ng/mlStandard
100 µl 400 µl 400 µl 400 µl 400 µl 400 µl
900 µlELISABu�er
600 µlELISABu�er
Final
2,000pg/ml
S1 S2 S3 S4 S5 S6 S7 S8
800pg/ml
320pg/ml
128pg/ml
51.2pg/ml
20.5pg/ml
8.2pg/ml
3.3pg/ml
600 µlELISABu�er
600 µlELISABu�er
600 µlELISABu�er
600 µlELISABu�er
600 µlELISABu�er
600 µlELISABu�er
400 µl100 µl
900 µlUltraPure
H2O
20 ng/mlBulk Standard
400 µl
Figure5.PreparationoftheRvD1standards
20 ASSAY PROTOCOL 21ASSAY PROTOCOL
Resolvin D1 AChE TracerReconstitute the Resolvin D1 AChE Tracer as follows:
100 dtn Resolvin D1 AChE Tracer (96-well kit; Item No. 400380): Reconstitute with 6 ml ELISA Buffer.
OR500 dtn Resolvin D1 AChE Tracer (480-well kit; Item No. 400380): Reconstitute with 30 ml ELISA Buffer.
Store the reconstituted Resolvin D1 AChE Tracer at 4°C (do not freeze!) and use within four weeks. A 20% surplus of tracer has been included to account for any incidental losses.
TracerDyeInstructions(optional) This dye may be added to the tracer, if desired, to aid in visualization of tracer-containing wells. Add the dye to the reconstituted tracer at a final dilution of 1:100 (add 60 µl of dye to 6 ml tracer or add 300 µl of dye to 30 ml of tracer).
Resolvin D1 ELISA AntiserumReconstitute the Resolvin D1 ELISA Antiserum as follows:
100 dtn Resolvin D1 ELISA Antiserum (96-well kit; Item No. 400382): Reconstitute with 6 ml ELISA Buffer.
OR500 dtn Resolvin D1 ELISAAntiserum (480-well kit; ItemNo. 400382): Reconstitute with 30 ml ELISA Buffer.
Store the reconstituted Resolvin D1 ELISA Antiserum at 4°C. It will be stable for at least four weeks. A 20% surplus of antiserum has been included to account for any incidental losses.
AntiserumDyeInstructions(optional) This dye may be added to the antiserum, if desired, to aid in visualization of antiserum-containing wells. Add the dye to the reconstituted antiserum at a final dilution of 1:100 (add 60 µl of dye to 6 ml antiserum or add 300 µl of dye to 30 ml of antiserum).

22 ASSAY PROTOCOL 23ASSAY PROTOCOL
Plate Set UpThe 96-well plate(s) included with this kit is supplied ready to use. It is not necessary to rinse the plate(s) prior to adding the reagents. NOTE: If you do not need to use all the strips at once, place the unused strips back in the plate packet and store at 4°C. Be sure the packet is sealed with the desiccant inside. Each plate or set of strips must contain a minimum of two blanks (Blk), two non-specific binding wells (NSB), two maximum binding wells (B0), and an eight point standard curve run in duplicate. NOTE: Each assay must contain this minimum configuration in order to ensure accurate and reproducible results. Each sample should be assayed at two dilutions and each dilution should be assayed in duplicate. For statistical purposes, we recommend assaying samples in triplicate.A suggested plate format is shown in Figure 5, below. The user may vary the location and type of wells present as necessary for each particular experiment. The plate format provided below has been designed to allow for easy data analysis using a convenient spreadsheet offered by Cayman (see page 24, for more details). We suggest you record the contents of each well on the template sheet provided (see page 34).
Blk - BlankTA - Total Ac�vityNSB - Non-Specific BindingB0 - Maximum BindingS1-S8 - Standards 1-81-24 - Samples
A
B
C
D
E
F
G
H
1 2 3 4 5 6 7 8 9 10 11 12S1
S2
S3
S4
S5
S6
S7
S8 S8
S7
S6
S5
S4
S3
S2
S1
8
7
6
5
4
3
2
1
8
7
6
5
4
3
2
1
8
7
6
5
4
3
2
1
16
15
14
13
12
11
10
9
16
15
14
13
12
11
10
9
16
15
14
13
12
11
10
9
24
23
22
21
20
19
18
17
24
23
22
21
20
19
18
17 17
24
23
22
21
20
19
18
Blk
Blk
NSB
NSB
B0
B0
B0
TA
Figure6.Sampleplateformat
Performing the Assay
PipettingHints
• Use different tips to pipette each reagent.• Before pipetting each reagent, equilibrate the pipette tip in that
reagent (i.e., slowly fill the tip and gently expel the contents, repeat several times).
• Do not expose the pipette tip to the reagent(s) already in the well.
Addition of the Reagents1. ELISABuffer
Add 100 µl ELISA Buffer to NSB wells. Add 50 µl ELISA Buffer to B0 wells. If culture medium was used to dilute the standard curve, substitute 50 µl of culture medium for ELISA Buffer in the NSB and B0 wells (i.e., add 50 µl culture medium to NSB and B0 wells and 50 µl ELISA Buffer to NSB wells).
2. ResolvinD1ELISAStandardAdd 50 µl from tube #8 to both of the lowest standard wells (S8). Add 50 µl from tube #7 to each of the next two standard wells (S7). Continue with this procedure until all the standards are aliquoted. The same pipette tip should be used to aliquot all the standards. Before pipetting each standard, be sure to equilibrate the pipette tip in that standard.
3. SamplesAdd 50 µl of sample per well. Each sample should be assayed at a minimum of two dilutions. Each dilution should be assayed in duplicate (triplicate recommended).
4. ResolvinD1AChETracerAdd 50 µl to each well except the TA and the Blk wells.
5. ResolvinD1ELISAAntiserumAdd 50 µl to each well except the TA, the NSB, and the Blk wells.

24 ASSAY PROTOCOL 25ASSAY PROTOCOL
Well ELISABuffer Standard/Sample
Tracer Antiserum
Blk - - - -
TA - - 5 µl (at devl. step) -
NSB 100 µl - 50 µl -
B0 50 µl - 50 µl 50 µl
Std/Sample - 50 µl 50 µl 50 µl
Table2.Pipettingsummary
Incubation of the PlateCover each plate with plastic film (Item No. 400012) and incubate for 18 hours at 4°C.
Development of the Plate1. Reconstitute Ellman’s Reagent immediately before use (20 ml of reagent is
sufficient to develop 100 wells):100dtnvialEllman’sReagent(96-wellkit;ItemNo.400050): Reconstitute with 20 ml of UltraPure water.
OR
250dtnvialEllman’sReagent(480-wellkit;ItemNo.400050): Reconstitute with 50 ml of UltraPure water.
NOTE: Reconstituted Ellman’s Reagent is unstable and should be used the same day it is prepared; protect the Ellman’s Reagent from light when not in use. Extra vials of the reagent have been provided should a plate need to be re-developed or multiple assays be run on different days.
2. Empty the wells and rinse five times with Wash Buffer. 3. Add 200 µl of Ellman’s Reagent to each well.4. Add 5 µl of tracer to the TA wells.5. Cover the plate with plastic film. Optimum development is obtained by
using an orbital shaker equipped with a large, flat cover to allow the plate(s) to develop in the dark. This assay typically develops (i.e., B0 wells ≥0.3 A.U. (blank subtracted)) in 90-120 minutes.
Reading the Plate1. Wipe the bottom of the plate with a clean tissue to remove fingerprints, dirt,
etc. 2. Remove the plate cover being careful to keep Ellman’s Reagent from
splashing on the cover. NOTE: Any loss of Ellman’s Reagent will affect the absorbance readings. If Ellman’s Reagent is present on the cover, use a pipette to transfer the Ellman’s Reagent into the well. If too much Ellman’s Reagent has splashed on the cover to easily redistribute back into the wells, wash the plate three times with wash buffer and repeat the development with fresh Ellman’s Reagent.
3. Read the plate at a wavelength between 405 and 420 nm. The absorbance may be checked periodically until the B0 wells have reached a minimum of 0.3 A.U. (blank subtracted). The plate should be read when the absorbance of the B0 wells in the range of 0.3-1.0 A.U. (blank subtracted). If the absorbance of the wells exceeds 1.5, wash the plate, add fresh Ellman’s Reagent and let it develop again.

26 ANALYSIS 27ANALYSIS
ANALYSISMany plate readers come with data reduction software that plots data automatically. Alternatively a spreadsheet program can be used. The data should be plotted as either %B/B0 versus log concentration using a four-parameter logistic fit or as logit B/B0 versus log concentration using a linear fit. NOTE: Cayman has a computer spreadsheet available for data analysis. Please contact Technical Service or visit our website (www.caymanchem.com/analysis/elisa) to obtain a free copy of this convenient data analysis tool.
Calculations
Preparation of the DataThe following procedure is recommended for preparation of the data prior to graphical analysis.NOTE: If the plate reader has not subtracted the absorbance readings of the blank wells from the absorbance readings of the rest of the plate, be sure to do that now.1. Average the absorbance readings from the NSB wells.2. Average the absorbance readings from the B0 wells.3. Subtract the NSB average from the B0 average. This is the corrected B0 or
corrected maximum binding.4. Calculate the B/B0 (Sample or Standard Bound/Maximum Bound) for the
remaining wells. To do this, subtract the average NSB absorbance from the S1 absorbance and divide by the corrected B0 (from Step 3). Repeat for S2-S8 and all sample wells. (To obtain %B/B0 for a logistic four-parameter fit, multiply these values by 100.)
NOTE: The TA values are not used in the standard curve calculations. Rather, they are used as a diagnostic tool; the corrected B0 divided by the actual TA (10X measured absorbance) will give the %Bound. This value should closely approximate the %Bound that can be calculated from the Sample Data (see page 28). Erratic absorbance values and a low (or no) %Bound could indicate the presence of organic solvents in the buffer or other technical problems (see page 32 for Troubleshooting).
Plot the Standard CurvePlot %B/B0 for standards S1-S8 versus RvD1 concentration using linear (y) and log (x) axes and perform a 4-parameter logistic fit.Alternative Plot - The data can also be lineraized using a logit transformation. The equation for this conversion is shown below. NOTE: Do not use %B/B0 in this calculation.
logit(B/B0)=ln[B/B0/(1-B/B0)]
Plot the data as logit (B/B0) versus log concentrations and perform a linear regression fit.
Determine the Sample ConcentrationCalculate the B/B0 (or %B/B0) value for each sample. Determine the concentration of each sample by identifying the %B/B0 on the standard curve and reading the corresponding values on the x-axis. NOTE: Remember to account for any concentration of the sample prior to the addition to the well. Samples with %B/B0 values greater than 80% or less than 20% should be re-assayed as they generally fall out of the linear range of the standard curve. A 20% or greater disparity between the apparent concentration of two different dilutions of the same sample indicates interference which could be eliminated by purification.
28 ANALYSIS 29ANALYSIS
PerformanceCharacteristics
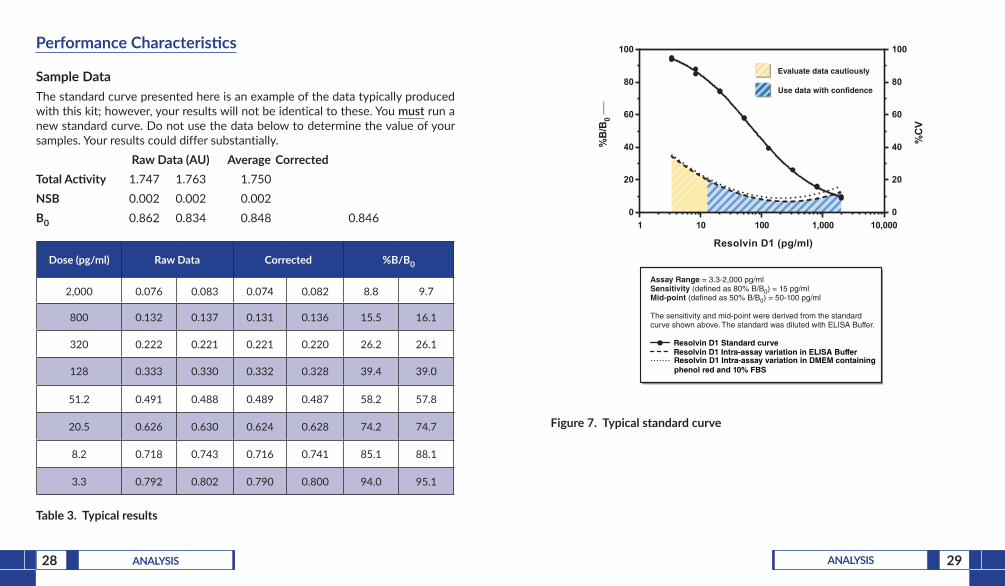
Sample DataThe standard curve presented here is an example of the data typically produced with this kit; however, your results will not be identical to these. You must run a new standard curve. Do not use the data below to determine the value of your samples. Your results could differ substantially. RawData(AU) AverageCorrectedTotalActivity 1.747 1.763 1.750NSB 0.002 0.002 0.002B0 0.862 0.834 0.848 0.846
Dose(pg/ml) Raw Data Corrected %B/B0
2,000 0.076 0.083 0.074 0.082 8.8 9.7
800 0.132 0.137 0.131 0.136 15.5 16.1
320 0.222 0.221 0.221 0.220 26.2 26.1
128 0.333 0.330 0.332 0.328 39.4 39.0
51.2 0.491 0.488 0.489 0.487 58.2 57.8
20.5 0.626 0.630 0.624 0.628 74.2 74.7
8.2 0.718 0.743 0.716 0.741 85.1 88.1
3.3 0.792 0.802 0.790 0.800 94.0 95.1
Table3.Typicalresults
0
20
40
60
80
100
0
20
40
60
80
100
Resolvin D1 (pg/ml)
%B
/B0 __
__
%C
V
1 10 100 1,000 10,000
Assay Range = 3.3-2,000 pg/mlSensitivity (defined as 80% B/B0) = 15 pg/mlMid-point (defined as 50% B/B0) = 50-100 pg/ml
The sensitivity and mid-point were derived from the standard curve shown above. The standard was diluted with ELISA Buffer.
Resolvin D1 Standard curveResolvin D1 Intra-assay variation in ELISA BufferResolvin D1 Intra-assay variation in DMEM containing phenol red and 10% FBS
Evaluate data cautiously
Use data with confidence
Figure7.Typicalstandardcurve
30 ANALYSIS 31ANALYSIS
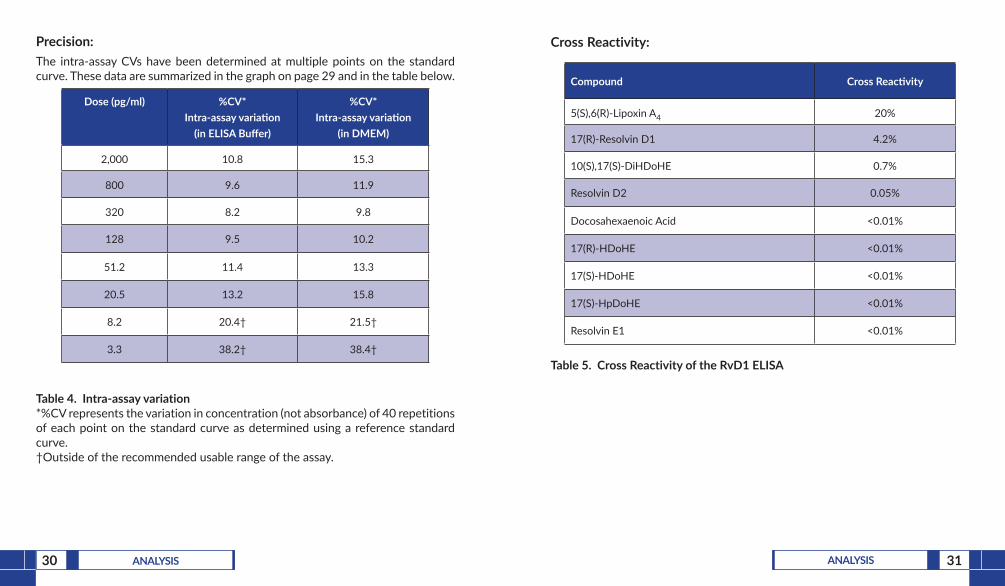
Precision:The intra-assay CVs have been determined at multiple points on the standard curve. These data are summarized in the graph on page 29 and in the table below.
Dose(pg/ml)
%CV* Intra-assayvariation (inELISABuffer)
%CV* Intra-assayvariation
(inDMEM)
2,000 10.8 15.3
800 9.6 11.9
320 8.2 9.8
128 9.5 10.2
51.2 11.4 13.3
20.5 13.2 15.8
8.2 20.4† 21.5†
3.3 38.2† 38.4†
Table4.Intra-assayvariation*%CV represents the variation in concentration (not absorbance) of 40 repetitions of each point on the standard curve as determined using a reference standard curve.†Outside of the recommended usable range of the assay.
Cross Reactivity:
Compound CrossReactivity
5(S),6(R)-Lipoxin A4 20%
17(R)-Resolvin D1 4.2%
10(S),17(S)-DiHDoHE 0.7%
Resolvin D2 0.05%
Docosahexaenoic Acid <0.01%
17(R)-HDoHE <0.01%
17(S)-HDoHE <0.01%
17(S)-HpDoHE <0.01%
Resolvin E1 <0.01%
Table5.CrossReactivityoftheRvD1ELISA
32 RESOURCES 33RESOURCES
RESOURCES
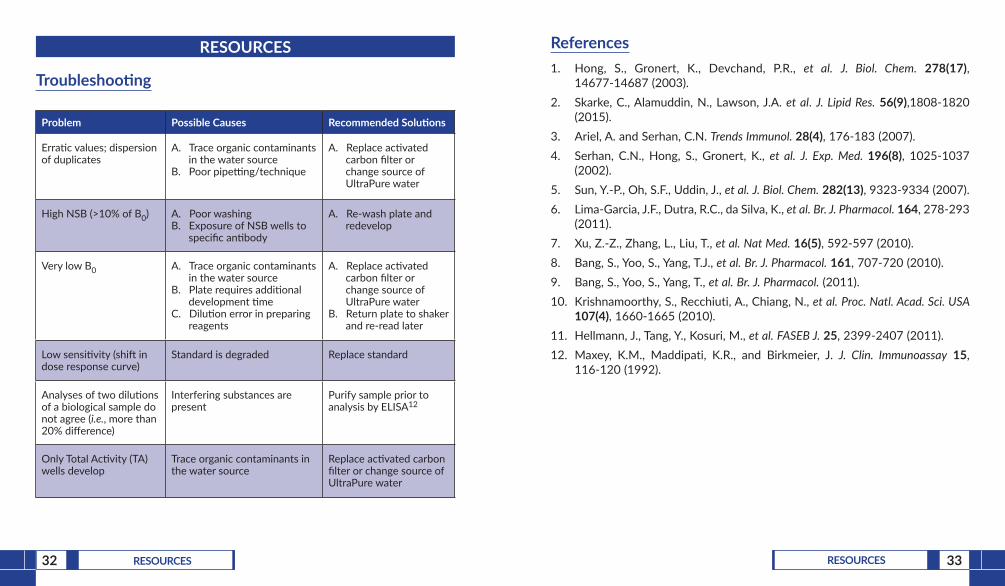
Troubleshooting
Problem Possible Causes RecommendedSolutions
Erratic values; dispersion of duplicates
A. Trace organic contaminants in the water source
B. Poor pipetting/technique
A. Replace activated carbon filter or change source of UltraPure water
High NSB (>10% of B0) A. Poor washing B. Exposure of NSB wells to
specific antibody
A. Re-wash plate and redevelop
Very low B0 A. Trace organic contaminants in the water source
B. Plate requires additional development time
C. Dilution error in preparing reagents
A. Replace activated carbon filter or change source of UltraPure water
B. Return plate to shaker and re-read later
Low sensitivity (shift in dose response curve)
Standard is degraded Replace standard
Analyses of two dilutions of a biological sample do not agree (i.e., more than 20% difference)
Interfering substances are present
Purify sample prior to analysis by ELISA12
Only Total Activity (TA) wells develop
Trace organic contaminants in the water source
Replace activated carbon filter or change source of UltraPure water
References1. Hong, S., Gronert, K., Devchand, P.R., et al. J. Biol. Chem. 278(17),
14677-14687 (2003).2. Skarke, C., Alamuddin, N., Lawson, J.A. et al. J. Lipid Res. 56(9),1808-1820
(2015).3. Ariel, A. and Serhan, C.N. Trends Immunol. 28(4), 176-183 (2007).4. Serhan, C.N., Hong, S., Gronert, K., et al. J. Exp. Med. 196(8), 1025-1037
(2002).5. Sun, Y.-P., Oh, S.F., Uddin, J., et al. J. Biol. Chem. 282(13), 9323-9334 (2007).6. Lima-Garcia, J.F., Dutra, R.C., da Silva, K., et al. Br. J. Pharmacol. 164, 278-293
(2011).7. Xu, Z.-Z., Zhang, L., Liu, T., et al. Nat Med. 16(5), 592-597 (2010).8. Bang, S., Yoo, S., Yang, T.J., et al. Br. J. Pharmacol. 161, 707-720 (2010).9. Bang, S., Yoo, S., Yang, T., et al. Br. J. Pharmacol. (2011).10. Krishnamoorthy, S., Recchiuti, A., Chiang, N., et al. Proc. Natl. Acad. Sci. USA
107(4), 1660-1665 (2010).11. Hellmann, J., Tang, Y., Kosuri, M., et al. FASEB J. 25, 2399-2407 (2011).12. Maxey, K.M., Maddipati, K.R., and Birkmeier, J. J. Clin. Immunoassay 15,
116-120 (1992).
34 RESOURCES 35RESOURCES
A B C D E F G H
12
34
56
78
910
1112
NOTES
WarrantyandLimitationofRemedyBuyer agrees to purchase the material subject to Cayman’s Terms and Conditions. Complete Terms and Conditions including Warranty and Limitation of Liability information can be found on our website. This document is copyrighted. All rights are reserved.This document may not, in whole or part, be copied, photocopied, reproduced, translated, or reduced to any electronic medium or machine-readable form without prior consent, in writing, from Cayman Chemical Company.©06/17/2020, Cayman Chemical Company, Ann Arbor, MI, All rights reserved. Printed in U.S.A.

%d1%81%d0%b5%d1%80%d1%82%d0%b8%d1%84%d0%b8%d0%ba%d0%b0%d1%82 %d1%82%d1%80%d1%83%d0%b1%d0%b0 %d1%81%d
%d0%a0%d0%b5%d0%b7%d0%be%d0%bb%d1%8e%d1%86%d1%96%d1%8f %d1%81%d1%82%d0%b0%d0%bb%d0%b8%d0%b9 %d1%80%d
%d1%82%d0%b5%d1%85%d0%bd%d0%b8%d1%87%d0%b5%d1%81%d0%ba%d0%b0%d1%8f %d0%b1%d1%80%d0%be%d1%88%d1%8e%d1
%d1%80%d0%b5%d1%88%d0%b5%d0%bd%d0%b8%d1%8f %d0%b4%d0%bb%d1%8f %d0%be%d1%84%d0%b8%d1%81%d0%bd%d1%8b%d
%d1%80%d0%b5%d1%88%d0%b5%d0%bd%d0%b8%d1%8f %d0%b4%d0%bb%d1%8f %d1%81%d0%bf%d0%be%d1%80%d1%82%d0%b8%d