impact of resolvin e1 on experimental periodontitis and
TRANSCRIPT
Impact of Resolvin E1 on Experimental Periodontitis and Periodontal Biofilm
CitationLee, Chun-Teh. 2015. Impact of Resolvin E1 on Experimental Periodontitis and Periodontal Biofilm. Doctoral dissertation, Harvard School of Dental Medicine.
Permanent linkhttp://nrs.harvard.edu/urn-3:HUL.InstRepos:17331953
Terms of UseThis article was downloaded from Harvard University’s DASH repository, and is made available under the terms and conditions applicable to Other Posted Material, as set forth at http://nrs.harvard.edu/urn-3:HUL.InstRepos:dash.current.terms-of-use#LAA
Share Your StoryThe Harvard community has made this article openly available.Please share how this access benefits you. Submit a story .
Accessibility

Impact of Resolvin E1 on Experimental Periodontitis and Periodontal Biofilm
A Thesis Presented by
Chun-Teh Lee, DDS, MS
to
The Faculty of the Harvard School of Dental Medicine
in partial fulfillment of the requirements
for the degree of
Doctor of Medical Sciences in Oral Biology
Research Mentors:
Ricardo Teles, DDS, DMSc
Alpodogan Kantarci. DDS, PhD
Thomas Van Dyke, DDS, PhD
Applied Oral Sciences, the Forsyth Institute
Harvard School of Dental Medicine
Boston, Massachusetts

ii
DEDICATION
To my parents, my wife, and family for their love and support
iii
ACKNOWLEDGEMENTS
I wish to express my sincere appreciation to the following people:
To Dr. Thomas Van Dyke, for his guidance and support
To Dr. Ricardo Teles, for introducing me to research and starting the project
To Dr. Alpdogan Kantarci, for his day-to-day support and guidance in the laboratory
To the staff of the Forsyth Institute, especially Lynn Martin, Michele Patel, Justine Dobeck, and Daniel Nguyen for their assistance

iv
TABLE OF CONTENTS
COPYRIGHT STATEMENT……………………………………………………………...i
DEDICATION………………………………………………………………………….....ii
ACKNOWLEDGEMENTS……………………………………………………………....iii
TABLE OF CONTENTS…………………………………………………………………iv
ABSTRACT…………………………………………………………………………….....1
LIST OF TABLES………………………………………………………………………...4
LIST OF FIGURES……………………………………………………………………….5
CHAPTER ONE: BACKGROUND
Periodontitis…………………………………………………………………………….....7
Treatment of Periodontitis……………………………………………………………….11
Resolution of Inflammation and Specialized Pro-Resolving Mediators (SPMs)……......13
The Temporal Relationship between Biofilm Dysbiosis and Inflammation…………….19
Animal Models of Experimental Periodontitis……………………………......................20
Subgingival Microbiota in Periodontitis: Biased vs. Unbiased Analytical Approaches...31
CHAPTER TWO: SUBGINGIVAL MICROBIOTA SHIFTS IN PERIODONTITIS
FOLLOWING RESOLVIN E1 APPLICAITON
Introduction……………………………………………...……………………………….37
Materials and Methods………………………….………………………………………..40
Results……………………………………………………………………………………50
Discussion………………………………………………………………………………..75

v
CHAPTER THREE: PREVENTION OF SUBGINGIVAL MICROBIOTA SHIFT
FOLLOWING RESOLVIN E1 APPLICATION
Introduction………………………………………………………………………………81
Materials and Methods..………………………………………………………………….82
Results…..………………………………………………………………………………..88
Discussion…..…………………………………………………………………………..105
CONCLUSIONS……………………………………………………………………….109
REFERENCES…………………………………………………………………………110
APPENDIX……………………………………………………………………………..130
1
ABSTRACT Objective: The goal of this project was to determine the impact of local
inflammation on changes in the subgingival biofilm composition in ligature-induced
periodontitis in rats using the specialized pro-resolving mediator (SPM), resolvin E1
(RvE1).
Materials and Methods: The impact of RvE1 on the microbiota of ligature-
induced periodontitis was assessed in two separate experiments; treatment of established
periodontitis and prevention of ligature-induced periodontitis. In the treatment study,
eighteen rats were separated into four groups comprising no ligature, ligature alone (no
treatment), ligature with topical RvE1 treatment (ligature+RvE1) and, ligature with
topical vehicle treatment (ligature + Vehicle). 3-0 silk ligatures were tied around
maxillary second molars bilaterally for three weeks to induce disease. After three weeks,
the treatment phase began with the application of RvE1 or vehicle (ethanol) every other
day for an additional three weeks. Subgingival plaque samples were collected every four
days throughout the experiment. The composition of the subgingival microbiota was
initially screened by checkerboard DNA-DNA hybridization using probes on 40
subgingival species. Definitive, unbiased characterization of the subgingival microbiota
was accomplished with next-generation sequencing using the Illumina MiSeq® platform.
Six rats were sacrificed on Days 1, 21 and 42 and maxillae were dissected to collect
samples for gingival RNA extraction, bone morphometric measurements, and
histomorphometric analysis. Local tissue gene expression (Cxcl1, Ptgs2, Nos2) was
detected using qRT-PCR. Tissue specimens were prepared for histology and stained with

2
H&E and tartrate resistant acid phosphatase (TRAP). In the prevention study, sixteen rats
were separated into four groups (no ligature, ligature + RvE1 (0.1µg/µl), ligature + RvE1
(0.5 µg/µl), ligature + Vehicle). 5-0 silk ligatures were placed around maxillary second
molars bilaterally to induce disease. At the time of ligature placement, animals received
assigned treatment thrice weekly (M, W, F) for four weeks. Subgingival plaque samples
were collected every four days (M and F). Four rats were sacrificed at baseline (Day 1)
and the vehicle and two treatment groups (four each) were sacrificed at day 28 and
samples processed as described above. The two-group comparisons were assessed by
Student’s t-test. The multiple-group comparison was assessed by one-way ANOVA and
post hoc tests.
Results: In the first study (treatment), topical application of RvE1 significantly
reversed the bone loss associated with periodontitis compared to the vehicle. RvE1
application significantly reduced the expression of Cxcl1 and osteoclast density compared
to the vehicle application. In the prevention study, RvE1 treatment significantly
prevented the bone loss during the disease progression. RvE1 application significantly
reduced the expression of Ptgs2, Nos2 compared to the vehicle application. Osteoclast
density and inflammatory cell infiltration in the RvE1 groups were significantly lower
than these in the Vehicle group.
The cell counts of bacterial species gradually increased and the subgingival
microbiota shifted during the disease progression. In the treatment study, RvE1 treatment
significantly reduced cell counts compared to the vehicle application at the end of
treatment phase. The shift of subgingival microbiota was limited by the RvE1 treatment.

3
In the prevention study, the taxonomic composition and diversity of subgingival
microbiota was controlled by the RvE1 application. The change of subgingival
microbiota appeared to be associated with the state of inflammation in the periodontal
environment.
Conclusion: Resolvin E1 treatment of existing ligature-induced periodontitis
significantly regenerates lost alveolar bone and prevents alveolar bone loss. Resolvin E1
treatment limits microbial shifts and reduces total bacterial load by inhibiting
inflammation of local environment in experimental periodontitis.

4
LIST OF TABLES
Table 2.1 List of forty species identified in the checkerboard DNA-DNA
hybridization by the order of periodontal microbial complexes…………………….56
Table 2.2 Mean counts (x 105) (Mean±SEM) of 40 species in the disease induction
phase……………………………………………………………………………………..57
Table 2.3 Mean counts (x 105) (Mean±SEM) of 40 species in the treatment
phase……………………………………………………………………………………..58
Table 2.4 Relative proportions of periodontal microbial complexes in the disease
induction phase…………………………………………………………………………59
Table 2.5 Relative proportions of periodontal microbial complexes between the
Vehicle group and the RvE1 group……………………………………………………59
Table 2.6 Relative abundance of phylum level during the treatment phase………..59

5
LIST OF FIGURES
Figure 1.1 Biosynthetic cascades and actions of specialized pro-resolving
mediators………………………………………………………………………..………15
Figure 1.2 Structure of resolvin E1……………………………………………………18
Figure 2.1 Experimental timeline……………………………………………………...60
Figure 2.2 Bone morphometric analysis: exposed root surface & distance between
CEJ and alveolar bone…………………………………………………………………61
Figure 2.3 Alveolar bone level at baseline and 3-weeks after disease induction……62
Figure 2.4 Bone morphometric analysis………………………………………………63
Figure 2.5 Histological area of interproximal bone…………………………..………64
Figure 2.6 Inflammatory cell infiltrate………………………………………………..65
Figure 2.7 Osteoclast density…………………………………………………………..66
Figure 2.8 Relative quantity of inflammation-related gene expression (2-ΔΔCT)…….67
Figure 2.9 Mean counts (x105) of subgingival taxa on day 20 and day 40…………..68
Figure 2.10 Taxonomic composition of the subgingival microbiota during disease
induction phase (genus level)…………………………………………………………..69
Figure 2.11 Mean difference of taxonomic relative abundance between day0 and day
20……………………………………………………………………………………...…70
Figure 2.12 Mean difference of taxonomic relative abundance between the RvE1
group and the Vehicle group…………………………………………………………...71
Figure 2.13 Alpha diversity of subgingival microbial community…………………..72

6
Figure 2.14 Principal coordinate analysis (PCoA)……………………………………73
Figure 2.15 Beta diversity of subgingival microbioal community during the disease
induction phase…………………………………………………………………………74
Figure 3.1 Experimental timeline………………………………...……………………92
Figure 3.2 Bone morphometric analysis………………………………………………93
Figure 3.3 Histological area of interproximal bone……………………..……………94
Figure 3.4 Inflammatory cell infiltrate…………………………………..……………95
Figure 3.5 Osteoclast density…………………………………………………………..96
Figure 3.6 Relative quantity of inflammation-related gene expression (2-ΔΔCT)...….97
Figure 3.7 Taxonomic composition of the subgingival microbiota (genus
level)……………………………………………………………………………………..98
Figure 3.8 Mean difference of taxonomic relative abundance between RvE1 and
Vehicle on day 14………………………………………………………………………99
Figure 3.9 Mean difference of taxonomic relative abundance between RvE1 and
Vehicle on day 28……………………………………………………………………...100
Figure 3.10 Alpha diversity of subgingival microbial community…………………101
Figure 3.11 Principal coordinate analysis (PCoA)……………………………..……102
Figure 3.12 Beta diversity of subgingival microbioal community at different time
points……………………………………………………………………...……………103
Figure 3.13 Mean body weight change during the experiment……………...……..104

7
CHAPTER ONE: BACKGROUND Periodontitis
Chronic periodontitis is a multifactorial inflammatory disease with high
prevalence in different populations. In the US, around 64 million over 30 year-old adults
have chronic periodontitis (47.2%). The prevalence of chronic periodontitis is higher than
the prevalence of diabetes (Eke et al., 2012). Chronic periodontitis has been associated
with several systemic inflammatory diseases, including rheumatoid arthritis, Type 2
diabetes and cardiovascular diseases (Demmer and Papapanou, 2010, Kebschull et al.,
2010, Lalla and Papapanou, 2011). These inflammatory diseases share similar
pathological mechanisms, such as an accumulation of immune cells and production of
excessive pro-inflammatory cytokines that lead to unresolved inflammation. Infection
with (putative) bacterial pathogens in a susceptible host has been considered the primary
etiological factor of periodontal disease. Although some periodontal pathogens produce
enzymes damaging periodontal tissues directly, the immune responses, including
production of pro-inflammatory cytokines, reactive oxygen species (ROS) and collagen-
dissolving enzymes, induced by these bacterial species are the major causes of
periodontitis (Hausmann et al., 1972, Stashenko et al., 1987, Cekici et al., 2014, Jiao et
al., 2014). Several cultivable bacterial species, such as Porphyromonas gingivalis
(P.gingivalis), Tannerella forsythia (T. forsythia) and Treponema denticola (T. denticola),
have been shown to induce alveolar bone loss around teeth in animal models (Lalla et al.,
1998, Schreiner et al., 2003, Hasturk et al., 2006), and are correlated with severity of
periodontitis clinically (Socransky et al., 2004, Paster et al., 2006). The composition of

8
the microbiota in health and periodontitis is quite different (Teles et al., 2006). With the
advent of molecular methodologies to identify yet uncultured bacteria, it was realized that
the number and diversity of microorganisms in the subgingival microbiota were greater
than previously appreciated. Likewise, the complexity of the host immune response to
the biofilm was also under appreciated. It is now known that different species induce
distinct immune responses in animal models of periodontitis (Gemmell et al., 2004,
Kopitar et al., 2006). There is no specific bacterial profile or specific bacteria generally
associated with periodontitis in every patient (Pihlstrom et al., 2005). Although it is
debatable whether specific pathogens initiate periodontal diseases, the effect of reducing
bacteria on controlling periodontal disease is undeniable (Socransky and Haffajee, 2005).
Adjunctive use of antibiotics with periodontal scaling and root planing improves clinical
outcomes of periodontal treatment (Goodson et al., 2012, Feres et al., 2012). The change
in the subgingival microbiota accompanying the improvement of the clinical outcomes
with antibiotic use has also been demonstrated (Soares et al., 2014).
The periodontium comprises gingiva, cementum, periodontal ligament, and
alveolar bone. Histologically, the pathogenesis of periodontitis is characterized by stages,
including the initial lesion, the early lesion, the established lesion, and the advanced
lesion (Page and Schroeder, 1976). The initial lesion starts within 24 hours after dental
plaque is deposited on the tooth’s surface. Dilation of the arterioles, capillaries and
venules of the dentogingival plexus is evident underneath the junctional epithelium.
Exudate forms in the gingival tissue, because the permeability of the microvascular bed
increases. As intercellular gaps in the epithelium become larger with increased

9
inflammation, the exudate, which is called gingival crevicular fluid, seeps into the
gingival sulcus. Unattached bacteria are flushed away and plasma proteins, such as
antibodies, complement, and proteinase inhibitors in gingival crevicular fluid can have an
impact of the composition of the biofilm. Neutrophils consistently appear adjacent to the
epithelium of gingival sulcus, which is essentially an open environment routinely
challenged by bacteria and food debris. Eventually neutrophils migrate out of the
junctional epithelium into the sulcus following a chemoattractant gradient of bacterial
peptides. These activated neutrophils express selectins and intracellular adhesion
molecules on their surfaces that bind to upregulated adhesion molecules on junctional
epithelial cells (Moughal et al., 1992).
In the next stage, the early lesion, the vessels underneath the junctional epithelium
remain dilated, and the number of vessels increases. The increased size and quantity of
microvasculature units are reflected in the clinical redness of the gingival margin (Lindhe
and Rylander, 1975). Gingiva tends to bleed easily when a periodontal probe is placed
into the sulcus. Gingival redness and bleeding on probing are the first clinical signs of
gingivitis. Lymphocytes and neutrophils are the predominant cells infiltrating in the
connective tissue and very few plasma cells are observed within the lesion at this stage
(Seymour et al., 1983, Brecx et al., 1987). Fibroblasts in the lesion degenerate and
collagen fibers are damaged with cell apoptosis and production of matrix
metalloproteinases by inflammatory leukocytes and resident stromal cells. The loss of
collagen fibers permit additional leukocyte infiltration (Page and Schroeder, 1976,
Takahashi et al., 1995). The basal cells of the junctional and sulcular epithelium start to

10
proliferate rapidly. The proliferation of these cells represents an attempt to enhance the
mechanical barrier to block bacteria and bacterial products. Epithelial rete pegs become
elongated and invade the coronal portion of the lesion (Schroeder, 1970). The start of
early lesion was seen as early as one week after plaque accumulation and could persist
for weeks. The required time for the early lesion to convert to the next stage, the
established lesion, was hypothesized to depend on host susceptibility and virulence of
bacteria.
The established lesion is an enhanced inflammatory lesion compared to the early
lesion. Increased fluid exudation and leukocyte migration into the tissues and the gingival
sulcus are observed. The tissues are more swollen clinically compared to the early lesion.
The loss of collagen and the proliferation of epithelium continue and even more
leukocytes infiltrate the connective tissue. The diseased epithelium is more permeable
and bacterial products can pass into the connective tissue more easily. The established
lesion is dominated by plasma cells (Page and Schroeder, 1976). In the gingival biopsies
of adults younger than 30, (Brecx et al., 1988, Fransson et al., 1996), lymphocytes
occupy a larger area in the lesion than plasma cells. However, plasma cells are dominant
in the established lesion of gingival biopsies from subjects who are over 65 years old
(Fransson et al., 1996). The established lesion may persist for months or years and never
progress to a more advanced lesion.
The final stage of progression is known as the advanced lesion. The first three
stages are considered gingivitis, but the advanced lesion is periodontitis. In the advanced
lesion, the elongation of junctional epithelium, the destruction of collagen, and the

11
infiltration of leukocytes continue. The changes in the tissues, including a deepening of
the pocket, excessive inflammation and anaerobiosis, establish a habitat for the growth of
periodontitis associated Gram-negative anaerobic bacteria considered pathogens
(Socransky and Haffajee, 2005). The most distinct characteristic of the advanced lesion is
the loss of connective tissue attachment to the tooth and the destruction of alveolar bone.
Periodontitis is clinically distinct from gingivitis. Generally, it is accepted that plasma
cells are the dominant cell type in the advanced lesion (Grant and Mulvihill, 1972,
Berglundh and Donati, 2005).
In summary, the dynamics of periodontitis pathogenesis is well established from a
myriad of observations. However, the timing of transition from one lesion to another
really depends on the individual and is affected by many factors, such as systemic health,
oral hygiene habits, smoking, and other factors, both modifiable and non-modifiable.
Severe gingivitis characterized by the established lesion increases risk for periodontitis,
but it may never progress to an advanced lesion.
Treatment of Periodontitis
Mechanical debridement has been the standard treatment of periodontitis for
decades (Heitz-Mayfield and Lang, 2013, Jan Lindhe, 2008). Mechanical debridement
usually starts with scaling and root planing, which is a procedure designed to clean
calculus from crown and root surfaces using special instruments without surgically
elevating gingival tissues. A surgical approach is sometimes required when scaling and
root planing alone does not generate positive outcomes usually due to inadequate access.
Elimination of bacterial plaque and calculus is the goal of mechanical debridement. It is

12
believed that removal of subgingival plaque is sufficient to reduce the immune response
stimulated by bacteria and stop tissue destruction. However, subgingival debridement
has efficiency limitations and cleansing of diseased areas is often incomplete (Slots,
2002). Regardless, of completeness of debridement, bacteria grow back gradually after
the mechanical therapy in the absence of further treatment or maintenance (Haffajee et al.,
2006). Adjunctive use of antibiotics improves clinical outcomes, but antibiotic resistance
and other side effect are always a concern. In refractory periodontitis patients, severe
periodontal tissue destruction is seen often despite relatively low bacterial challenge,
appropriate periodontal maintenance and treatment (Teles et al., 2010).
In recent years, it has become apparent the pathogenesis of periodontal diseases is
mediated by the host and that susceptibility to disease is a function of the inflammatory
response (Van Dyke, 2011, Van Dyke, 2014). Subjects with severe periodontitis exhibit
measurable excess inflammation that includes excess cytokine production (Graves, 2008)
and oxidative stress (Kantarci et al., 2003, Chapple and Matthews, 2007). It is also now
realized that there is little if any tissue destruction that is the direct result of bacterial
enzymes or toxins. The presence of, or number of, specific bacteria do not predict
disease, but inflammation does (Tanner et al., 2007). Efforts to control the host
inflammatory response have shown that disease can be arrested with COX inhibitors
without modifying bacteria (Williams et al., 1989, Howell, 1993, Jeffcoat et al., 1995),
but these treatments are not safe long term. Hence now, considerable effort is now being
devoted to the development of rational and safe host modulation therapies to prevent and
treat periodontitis.

13
Resolution of Inflammation and Specialized Pro-Resolving Mediators (SPMs)
In addition to the acute pro-inflammatory phase, “resolution” is an active phase of
the inflammatory process first described and extensively characterized by Charles N.
Serhan (Serhan, 2014). Failure to resolve inflammation leads to chronic inflammation,
which causes tissue damage and induces disease. It is now realized that inflammatory
disease may be a failure of resolution rather than overproduction of pro-inflammatory
mediators (Serhan et al., 2008). The resolution response reduces tissue damage, removes
cell debris and helps tissues return to homeostasis (Serhan and Savill, 2005). Specialized
pro-resolving mediators (SPMs) play an important role in the resolution phase of acute
inflammation.
These SPMs, including lipoxins (LXA4, LXB4), resolvins (RvE, RvD), protectins
(PD), and maresins (MaR), are derived from ω-6 [arachidonic acid], and ω-3
[eicosapentaenoic acid (EPA); docosahexaenoic acid (DHA)] polyunsaturated fatty acids,
respectively (Serhan, 2010) (Fig. 1.1). The ω-3 fatty acids are found in marine oils and
have been recognized having anti-inflammation properties (Albert et al., 2002, Calder
and Yaqoob, 2009). However, the molecular mechanism behind the anti-inflammation
properties was not clear until the metabolic products of ω-3 fatty acids, resolvins,
protectins and maresins, were described. These molecules were first found in the
exudates of the acute inflammation phase in a murine model (Serhan et al., 2000). In the
process of acute inflammation, lipids in the cells and tissues are either transformed to
pro-inflammatory lipid mediators, such as prostaglandins (PGD2, PGE2) and
leukotrienes (LTC4, LTB4), or SPMs (Serhan et al., 2009, Serhan, 2014). The pathway of

14
lipid mediators changing from pro-inflammatory molecules to pro-resolution molecules is
called “class switch” (Levy et al., 2001, Serhan et al., 2007). The process of class switch
is triggered by lipoxygenases (LO) and other enzymes, such as aspirin acetylated
cyclooxygenase-2 (COX2), which becomes a 15R-lipoxygenase, or cytochrome P450,
during cell-cell interactions. The importance of these enzymes to initiate the production
of SPMs and activate resolution of inflammation has been demonstrated in many studies.
For example, the overexpression of 15-lipooxygenase in the transgenic rabbit model
increased available arachidonic acid derived substrate (15-HETE) for 5-LO leading to
increased circulating LXA4 and increased resolution of inflammation (Shen et al., 1996,
Serhan et al., 2003). Moreover, aspirin acetylated COX-2 produces similar products from
EPA and DHA, and these intermediates can be transformed by human neutrophils in vitro.
This class of compound is collectively known as aspirin-triggered lipoxins or aspirin-
triggered resolvins (Serhan et al., 2000, Serhan et al., 2002).
In the process of class switch, different cell-cell interactions, such as leukocytes
and leukocytes, leukocytes and platelets, leukocytes and epithelial cells, produce SPMs
through different pathways of transcellular biosynthesis (Romano and Serhan, 1992,
Gronert et al., 1998, Wallace and Fiorucci, 2003, Tian et al., 2009). Lipid mediator class
switching is induced significantly during inflammation and this process has been
observed in humans doing resistance exercise (Markworth et al., 2013).

15
Figure 1.1 Biosynthetic cascades and actions of specialized pro-resolving mediators (from Serhan & Petasis 2011)
In the resolution phase, the SPMs can reduce neutrophil infiltration, promote
neutrophil apoptosis (El Kebir et al., 2012), and recruit non-phlogistic macrophages (Oh
et al., 2011, Oh et al., 2012, Stables et al., 2011) which perform efferocytosis (Serhan et
al., 2008). These activities can clean up the “battlefields” of inflammation to restore the
original biologic-architecture following acute inflammation. In addition to the impact of
SPMs on innate immunity, adaptive immunity is also regulated by SPMs, including
inhibiting Th17 cell response, activating natural killer (NK) cell homing, activating NK
cell mediated clearance of antigen specific T cells and eosinophils in allergic
inflammation (Levy, 2012), reducing T cell migration and production of interferon-γ,
tumor necrosis factor-α (TNF-α) (Ariel et al., 2005), stimulating chemokine scavenging
from apoptotic T-cells in peritonitis model (Ariel et al., 2006), and stimulating human B
cell differentiation (Ramon et al., 2012).
SPMs bind to G-protein-coupled receptors (GPCRs) on cells to activate the
functions. Several SPM receptors, including leukotriene B4 receptor 1 (BLT1),
Chemokine like receptor 1 (ChemR23), formyl peptide receptor 2 (ALX/FPR2), G
protein-coupled receptor 32 (GPR32), have been identified on a variety of cell types. For
example, resolvin E1 (RvE1) specifically binds to receptors BLT1 on the neutrophils and

16
ChemR23 on macrophages to evoke pro-resolving responses (Arita et al., 2005a). The
binding of RvE1-BLT1 also blocks the LTB4-BLT1 binding which activates the survival
signaling in neutrophils. RvE1 activation of ChemR23 can enhance macrophage
phagocytosis by phosphoprotein-mediated signaling (Ohira et al., 2010).
In addition to regulating the immune response, SPMs also actively play the role in
the wound healing and tissue regeneration. Resolvin D1 (RvD1) and D2 (RvD2) are able
to stimulate wound healing in diabetic mice by inducing resolution of inflammation
(Tang et al., 2013). RvE1 and Maresin 1 (MaR1) both can reduce time required for
regeneration of head segment in the flatworm (Dugesia tigrina) model (Serhan et al.,
2012). In a rabbit periodontitis model, RvE1 showed the ability of regenerating lost
alveolar bone following three weeks of treatment (Hasturk et al., 2007). Further
experiments explain the possible mechanisms of alveolar bone regeneration induced by
SPMs. In vitro, RvE1 inhibits osteoclast differentiation and fusion, and restores
osteoprotegerin (OPG) production of bone cells in the inflammatory condition (Herrera et
al., 2008, Gao et al., 2013, Zhu et al., 2013). SPMs not only have an impact on bone cells,
but also on cells of gingival tissue. RvD1 significantly enhances proliferation, wound
closure, and fibroblast growth factor (FGF) release of human periodontal ligament (PDL)
cells. Also, RvD1 reduces cytokine-induced prostaglandin E2 production and increases
lipoxin production of human PDL cells (Mustafa et al., 2013).
In addition to previously mentioned disadvantages, taking NSAIDs impedes the
resolution phase because they block the production of prostaglandins, which enhance the
synthesis of SPMs (Levy et al., 2001, Serhan et al., 2007, Chan and Moore, 2010).

17
Therefore, SPMs, which are endogenous autacoids, can replace NSAIDs in treating
inflammation by not only inhibiting inflammation but also actively inducing and
enhancing the resolution phase. Given periodontitis is a multispecies biofilm-induced
inflammatory disease, SPMs application could be a promising approach to treat
periodontitis. The ability of SPMs (e.g. RvE1) in preserving and regenerating periodontal
tissue in experimental periodontitis has been demonstrated (Hasturk et al., 2006, Hasturk
et al., 2007). In addition to animal and in vitro studies, clinical evidence also supports the
effect of SPMs on treating periodontitis. The ratios of precursors of pro-resolution/ pro-
inflammatory lipid mediators were higher in healthy subjects than the ratios in
aggressive periodontitis subjects (Elabdeen et al., 2013), suggesting that the lack of SPMs
might be associated with periodontitis. In one clinical trial, adjunctive daily omega-3
fatty acid dietary supplement (900mg EPA+ DHA) with aspirin 81mg improved the
clinical outcomes of scaling and root planing significantly three and six months after
therapy. The percentage of probing depth >4mm significantly changed from 59.6% to
20.5% in the experimental group compared to the change in the control group (from
55.4% to 45.3%). Moreover, the salivary receptor activator of nuclear factor kappa-β
ligand (RANKL) and matrix metalloproteinase-8 (MMP-8) levels showed significant
reductions compared to the levels in subjects having scaling and root planing alone (El-
Sharkawy et al., 2010). All these results support the possibility of applying SPMs for
treating periodontitis, and RvE1 (Fig. 1.2) seems to have the strongest potential based on
the available evidence.

18
Figure 1.2 Structure of resolvin E1 (RvE1, C20H30O5, molecular weight: 350.5)
RvE1 derived from EPA is one of the specialized pro-resolving mediators. It has
been used to treat periodontitis (Hasturk et al., 2006, Hasturk et al., 2007), peritonitis
(Arita et al., 2005b, Arita et al., 2005a, Bannenberg et al., 2005, Schwab et al., 2007),
allergic airway inflammation (Haworth et al., 2008), heart reperfusion injury (Keyes et al.,
2010), and retinopathy (Connor et al., 2007) in different animal models. The function of
RvE1 in promoting inflammation resolution have been demonstrated from various
perspectives, including stopping transepithelial and transendothelial migration of
neutrophils, stimulating macrophages perform non-phlogistic phagocytosis of apoptotic
neutrophils, blocking interlukin-12 (IL-12) production of dentritic cells, upregulating C-C
chemokine receptor type 5 (CCR5) expression of apoptotic neutrophils and T cells
(Serhan et al., 2008), inhibiting production of interleukin-4 (IL-4) and interferon-gamma
(IFN-γ) of activated CD4 T cells in skin lesion model (Kim et al., 2012), enhancing
phagocytosis and ROS production of neutrophils (El Kebir et al., 2012), rescuing
phagocytosis of macrophages of localized aggressive periodontitis patients (Fredman et
al., 2011), and inhibiting myeloperoxidase suppressed neutrophil apoptosis (El Kebir and
Filep, 2013). These reactions induce the resolution phase and help tissue environment

19
reach homeostasis. Moreover, as previously mentioned, RvE1 regulates bone remodeling
and improves bone regeneration (Gao et al., 2013, Zhu et al., 2013). RvE1 serves to
regenerate destructive tissues following activating inflammation resolution.
The Temporal Relationship Between Biofilm Dysbiosis and Inflammation
As for the application of SPMs in treating periodontitis or other bacteria-induced
inflammatory diseases, the impact of SPMs on the microbiota has to be discussed. In the
rabbit P.gingivalis-induced periodontitis model, P.gingivalis (109 CFU) was inoculated
around the ligated teeth in the first six weeks of disease induction phase. The inoculation
was discontinued in the subsequent six-week treatment phase. At the end of six-week
RvE1 application during the treatment phase, regeneration of lost alveolar bone was
accompanied by elimination of P.gingivalis. Cell counts of some bacterial species,
including Prevotella intermedia, Fusobacterium nucleatum, Streptococcus intermedius,
significantly increased from baseline to the end of treatment (Hasturk et al., 2007). The
detailed dynamics of microbial changes and the mechanism resulting in these changes
were not determined. Two hypotheses have been proposed to explain these findings : (i)
resolvins might have promoted the release of antimicrobial peptides, such as defensins
and other bactericidal ⁄ permeability-increasing proteins, increased phagocytosis activity,
stimulated nitric oxide synthase (NOS), or production of ROS in immune cells; or (ii) the
resolution of the inflammation “starved” P. gingivalis because this species depends on
peptides derived from host-tissue degradation as a source of nutrients, such as hemin
(Van Dyke, 2008, Van Dyke, 2011). Several studies have shown increased killing ability
of immune cells stimulated by SPMs. RvD2 increased neutrophil phagocytosis and ROS

20
production in E.coli phagocytosis assay and also reduced colony-forming units (CFU) by
stimulating macrophage phagocytosis in a caecal ligation model (Spite et al., 2009).
RvD1, RvD5 and PD1 enhanced phagocytosis of neutrophil and macrophage, and
stimulated ROS production by neutrophils. Combination of SPMs (e.g. RvD1,RvD5, or
PD1) and antibiotics reduced the bacterial load in the mice peritonitis model and the mice
skin pouch model (Chiang et al., 2012). RvE1 enhanced phagocytosis of human PMN in
vitro. Neutrophil phagocytosis evoked a rapid, robust ROS production and increased
caspase-3,8 activity in murine acute lung injury model following RvE1 application (El
Kebir et al., 2012, El Kebir and Filep, 2013). In summary, resolvins regulate
phagocytosis and ROS production in the neutrophils and macrophages to kill bacteria. No
appreciable direct antimicrobial effect of SPMs has been observed. These mechanisms
could actively cause a change in the composition of the subgingival microbiota. However,
the shift in microbial composition might still be indirectly caused by the resolution of the
inflammatory environment. Further experiments need to be conducted to elucidate these
mechanisms.
Animal Models of Experimental Periodontitis
To select an appropriate animal model to study the question of interest is a crucial
part of the research project. There are several animal models that have been used to study
the microbiota, immune response, and treatment effect in periodontal diseases. Different
animal models have advantages and disadvantages, and no single animal model is perfect.
The first thing to consider when selecting the animal model is which animal
species should be used. Non-human primates, dogs, miniature pigs, rabbits, ferrets,

21
hamsters, mice, rats and others have been used to study periodontal disease. Non-human
primates, such as monkeys, are assumed to be the best species used to study human
disease since their anatomic structures and physiological systems are much closer to
humans than are other species. Some of the non-human primates, including rhesus
monkeys (Macaca mulatta), cynomolgus monkeys (Macaca fascicularis), and baboons
(Papio anubis), have naturally occurring dental plaque, calculus, human oral bacterial
species (e.g., Prevotella, Porphyromonas species), and periodontal disease (Schou et al.,
1993). Non-primate model established the fundamental knowledge of pathogenesis of
periodontitis decades ago (Page and Schroeder, 1976). In order to expedite the induction
of periodontal disease, ligatures or orthodontic wires can be placed around teeth
(Kennedy and Polson, 1973, Kantor, 1980). These ligatures or wires serve as plaque traps
and stimulants to induce immune responses resulting in periodontal disease. Nowadays, it
is very difficult to obtain approval for using non-human primates in research if there is no
undeniable reason. Due to stricter ethical rules and the necessary expense and special
facility, non-primates models rarely have been used to study periodontal disease.
Miniature pigs have naturally occurring periodontal disease and human oral
pathogens, such as P. gingivalis (Wang et al., 2007). Periodontal disease can also be
induced or progressed by placing bands or wires between teeth (Lang et al., 1998, Van
Dyke et al., 2015). Miniature pigs are relatively more expensive than rodents which are
widely used in scientific research, and not many studies of periodontal disease using
miniature pigs are available (Oz and Puleo, 2011).

22
The pathogenesis of periodontal disease in dogs has been studied for decades
(Lindhe et al., 1973). Canine models are frequently used in the studies of periodontology
and implantology because it is relatively easy to conduct periodontal or implant surgery
in dogs compared to smaller animals (Berglundh et al., 1991, Wikesjo et al., 2003). Also,
periodontitis can be induced in several weeks by placing the ligature around the tooth or
changing diet to allow plaque accumulation (Lindhe et al., 1992). Periodontitis does
occur naturally (Haney et al., 1995) and progresses with age in dogs. Several periodontal
pathogens in humans were detected in dogs (Rober et al., 2008). However, the relatively
high costs limit the popularity of dog models.
The rabbit model is usually used to perform surgery. The tibia or fibular of rabbits
is usually used to place implants or regeneration materials (Johnson et al., 1997, Schmitt
et al., 1997). In the periodontal abscesses of rabbits, several human periodontal bacteria,
such as Fusobacterium nucleatum, Peptostreptococcus micra, Actinomyces israelii, can
be isolated (Tyrrell et al., 2002). Periodontitis can be induced by P. gingivalis on the
ligatures placed around teeth (Hasturk et al., 2007). The roots of teeth in rabbits
continually grow and rabbits’ teeth have different shapes from human teeth. Not many
studies of experimental periodontitis in rabbits are available.
Compared to other larger animals, rodents are more cost-effective for scientific
research. The expense of purchasing and raising rodents is much less than is the expense
of purchasing and raising larger animals. It is also relatively easy to handle rodents
because of the small body size. Mice and rats are the most frequently used rodents as an
animal model in periodontal disease and other scientific projects. The immune systems

23
and anatomic structures in mice and rats are well-studied. In general, mice and rats have
very similar physiological systems and genomes (Gibbs et al., 2004, Brudno et al., 2004).
In the past 20 years, the application of transgenic murines, especially mice, makes murine
models even more widely used.
Given periodontitis is induced by an imbalanced immune response, it is important
to know the characteristics of immune systems in mice and rats. Mice are the mainstay of
in vivo immunological experimentation because many biological mechanism in humans
can be observed in mice (Mestas and Hughes, 2004). More than 90% of the mouse and
human genomes can be partitioned into corresponding regions of conserved synteny and
only about 300 genes appear to be unique to one species, reflecting the conservation of
function in both species. (Mouse Genome Sequencing et al., 2002). However, there are
still several key differences of the immunological systems in humans and mice (Shay et
al., 2013). The proportions of leukocytes are quite different in the two species. Human
blood is neutrophil rich (50–70% neutrophils, 30–50% lymphocytes) whereas mouse
blood has a preponderance of lymphocytes (75–90% lymphocytes,10–25% neutrophils)
(Doeing et al., 2003). Some featured characteristics of leukocytes and immunity are also
different. In humans, neutrophils are a rich source of leukocyte defensins, but defensins
are not expressed by neutrophils in mice (Risso, 2000). IFN-α promotes Th1 cell
differentiation in humans, but not in mice (Farrar et al., 2000). Some cytokines and
receptors, such as interleukin-8 (IL-8), neutrophil-activating protein-2 (NAP-2 or
CXCL7), interferon-inducible T-cell alpha chemoattractant (ITAC or CXCL11),
chemokine receptor 1 (CXCR1), are missing in mice (Olson and Ley, 2002, Zlotnik and
24
Yoshie, 2000). Although the murine model is the most popular animal model, the distinct
physiological systems between murines and humans should always be kept in mind.
Regarding the periodontitis model, the complexities of the subgingival microbiota
and immune response in humans cannot be closely duplicated in any in vitro environment
(Graves et al., 2008). However, it is known that the pathogenesis of experimental
periodontitis in mice and rats is close to humans (Roy C. Page, 1982, Klausen, 1991, Fine,
2009). Oral bacteria induce immune response starting with the infiltration of neutrophils
and recruitment of macrophages, and then the lymphocytes invade the inflamed
periodontium. The disease progresses with epithelium elongation, degradation of tissue
fibers, and resorption of alveolar bone. Various models have been utilized to study
periodontitis in mice and rats, such as the air pouch model, (Gilroy et al., 1998), the
chamber model (Genco et al., 1991, Gyurko et al., 2003), the calvaria model (Zubery et
al., 1998), the ligature model (Rovin et al., 1966), the gavage model (Baker et al., 1994),
the feeding model (Fine et al., 2001), and the lipopolysaccharide injection model
(Dumitrescu et al., 2004). The air pouch is produced by injecting sterile air
subcutaneously into the back of a rat or a mouse. The chamber model is produced by
surgically implanting a chamber made of stainless-steel wire in the tissue of the
dorsolumbar region. The bacterial or inflammatory stimulants, such as lipopolysaccharide,
can be injected into the pouch or chamber, and the fluid or tissue samples can be
collected following a specific period of inflammation. The air pouch model and chamber
model are designed to investigate the interaction between periodontal pathogen(s) or
inflammatory irritant(s) and immune cells in a localized environment. The calvarial

25
model has been adapted to study the effect of bacteria on bone resorption or the host–
bacteria interactions on connective tissues (Graves et al., 2008). A stimulus is injected
directly into the connective tissue overlying the calvarial bone to induce an inflammatory
reaction. The production of pro-inflammatory cytokines and the recruitment of
neutrophils can be observed in hours (Graves et al., 2005), and bone resorption can be
induced within five days (Li et al., 2002). In the air pouch model, chamber model, and
calvaria model, no infection or inflammation is established in periodontal tissues. The
goal of these models is to study the inflammatory reaction in a well-controlled
environment by injecting a known stimulus.
In order to observe the clinical changes, such as alveolar bone resorption, collage
fiber degeneration and epithelium migration, it is necessary to induce periodontal disease
around teeth. Moreover, the interaction between host and microbiota around the
periodontium is still much more realistic than the interaction happening in other tissues.
Periodontitis does occur naturally in mice and rats, but it takes more than one year to be
observed (Liang et al., 2010). Therefore, injection of lipopolysaccharide, ligature
placement, and inoculation of human oral pathogen are often used to accelerate disease
progression.
Lipopolysaccharide injection model
Lipopolysaccharide (LPS), which is a component of the cell wall of the gram
negative bacteria, is a strong inflammatory stimulus triggering innate immunity. The aim
of LPS injection model is to examine the innate immune response and the change of
periodontal tissue following the stimulation of LPS. This model produces a

26
histopathological change similar to that observed in human periodontitis, characterized
by increased infiltration of leukocytes, enhanced levels of pro-inflammatory cytokines,
collagen degradation and alveolar bone resorption. Significant destruction of periodontal
tissue can be observed within three to eight weeks in mice (Sartori et al., 2009) or rats
(Rogers et al., 2007). Compared to the gavage model and ligature model, the
inflammation in periodontal tissue is more controllable by injecting definite amount of
LPS.
Oral gavage model
Several bacterial species associated with periodontitis in humans have been used
in the oral gavage model, including P. gingivalis (Lalla et al., 1998), A.
actinomycetemcomitans (Garlet et al., 2006), T. forsythia (Sharma et al., 2005) and
Treponema denticola (Lee et al., 2009). Inoculation of these species can induce alveolar
bone loss both in mice and rats. Different strains of animals have different degrees of
reactions due to genetic variation (Breivik et al., 2001, Nakamura et al., 2008, Hiyari et
al., 2015).
Typically, a specific amount of bacteria (109 CFU) mixed in the suspension (2%
carboxymethylcellulose) is inoculated in the oral cavity of the animal. Bacteria usually
only stay in the oral cavity transiently, and do not colonize permanently. Different
bacterial species persist for different periods following the inoculation. In a rat model, P.
gingivalis has been detected in the oral cavity for up to 11 weeks (Bainbridge et al., 2010).
The periodontitis associated bacteria, including P. gingivalis, T. denticola or T. forsythia,
can be inoculated separately or together to induce disease, and are detected four to six
27
weeks following the inoculation. These bacteria exhibit synergistic virulence resulting in
significant inflammation-induced bone resorption (Kesavalu et al., 2007). In addition to
the direct stimulation by the exogenous bacteria, the inoculation of periodontal pathogens,
such as P.gingivalis, can cause a change of the original oral microbiota by manipulating
the immune response to induce disease (Hajishengallis et al., 2011).
In the gavage model, the inoculation of bacteria usually continues for one to two
weeks and significant alveolar bone loss can be observed from two weeks (Okada et al.,
2010) to four weeks (Baker et al., 2000, Yu et al., 2007) following the last inoculation.
This model induces an inflammatory reaction similar to periodontitis in humans, such as
the infiltration of neutrophils and monocytes in the gingival connective tissue, increased
inflammatory cytokines (TNF- α, IL- 12 and IFN- γ) and decreased anti-inflammatory
cytokines (IL-10), proliferation of the junctional epithelium, and increased levels of
serum antibody (IgG1 and IgG2) against the periodontal pathogens (Bainbridge et al.,
2010, Lee et al., 2009, Garlet et al., 2005). The advantage of this model is having human
oral pathogens to induce periodontitis. However, the oral gavage model usually takes at
least four weeks to observe the initial alveolar bone loss.
Feeding model
The idea of inoculating human periodontal disease related bacteria in animal is to
investigate the specific species simulating the periodontal infection. However, many of
the human oral pathogens are not able to colonize in animal’s oral cavity for long periods
of time since the animals do not harbor these bacteria naturally. The species, A.
actinomycetemcomitans, is a periodontal pathogen observed in different types of animals,
28
including humans, monkeys, and rats (Fine et al., 2005). A. actinomycemcomitans is
highly associated with localized aggressive periodontitis (Fine et al., 2007). In the
feeding model, rats are pretreated with antibiotics and fed A.actinomycetemcomitans in
their diets for four days. The pathogen, A.actinomycetemcomitans, could be observed in
the mucosa or saliva weeks or months after the last feeding (Fine et al., 2001). However,
only a specific strain of A.actinomycetemcomitans (CU1010) can induce periodontitis
successfully in animals (Fine et al., 2001). Rats usually are used in the feeding model
because it is difficult to colonize the oral cavity of mice with A.actinomycetemcomitans
(Graves et al., 2012).
In addition to innate immunity, adaptive immunity is also induced in the feeding
model. B cells and CD4 T cells are activated and their numbers increase, resulting in
enhanced isotype-switched serum IgG, increased level of several cytokines and proteins,
including IL- 1, IL- 2, TNF, CD40 ligand, Fas ligand (FasL), RANKL and
osteoprotegerin in the lymph nodes (Li et al., 2010).
The exclusive use of A.actinomycetemcomitans in the feeding model limits the
popularity of this model given that A.actinomycetemcomitans is generally recognized as a
putative pathogen for localized aggressive periodontitis, but not necessarily highly related
to chronic periodontitis.
Ligature Model
Ligature placement around teeth to induce periodontal disease is widely used in
different species of animals, such as monkeys, dogs, mice, and rats (Struillou et al., 2010,

29
Oz and Puleo, 2011). The amount of bacteria increases significantly around the area of
ligature placement given that the ligature traps plaque (Duarte et al., 2010). Presence of
bacteria is required to induce periodontitis in this model. Germ-free rats do not have
alveolar bone loss after ligature placement (Rovin et al., 1966). Treatment of
chlorhexidine or antibiotics significantly inhibits the loss of alveolar bone in the ligature
model (Weiner et al., 1979, Kenworthy and Baverel, 1981). In addition to accumulating
bacteria, ligature causes traumatic wound which establishes an inflammatory
environment for oral pathogens to grow. For example, the pathogen, Eikenella corrodens,
does not cause alveolar bone loss in rats without ligature placement (Samejima et al.,
1990). The commensal bacteria become primed to induce periodontal disease in mice
following ligature placement (Jiao et al., 2013).
The ligature model can induce alveolar bone loss in one to two weeks which is a
shorter period of time compared to other models (Bezerra et al., 2000, de Lima et al.,
2000, Benatti et al., 2003). Some studies report the period of disease induction of up to
two months (Kenworthy and Baverel, 1981, Holzhausen et al., 2002, Kuhr et al., 2004,
Nakamura-Kiyama et al., 2014). The varied period of disease induction depends on the
study design and characteristics of the ligature (e.g. diameter of ligature). Generally, in
ligature models, the most significant alveolar bone loss happens within two weeks and
then bone destruction starts to slow down (Kuhr et al., 2004).
Similar to the initial phase of periodontitis in humans, increased vascular
permeability and leukocytes infiltration are observed following one week of ligature
placement (Gyorfi et al., 1994). Some studies show inhibition of inflammatory cytokine

30
(Bezerra et al., 2000) or matrix metalloproteinase (Bezerra et al., 2002, Cesar Neto et al.,
2004) controls the progress of periodontitis in the ligature model. These results mean the
disease progression is accompanied with locally or systematically increased levels of
inflammatory cytokines, such as IL-1, IL-6, and TNF-α (Endo et al., 2010, Gaspersic et
al., 2003). The periodontitis related risk factors, such as smoking (Cesar Neto et al., 2004)
and diabetes (Liu et al., 2006), also affect the loss of alveolar bone in the ligature model.
This experimental periodontitis model simulates the progression of periodontitis in
humans to a certain extent.
Compared to the oral gavage model, which initiates experimental periodontitis by
inoculating high doses of human periodontal pathogens around animal teeth, the ligature
model has the advantage of representing the natural process of biofilm-induced
inflammation. The reasons are that periodontal pathogens usually only have relatively
low abundance in human periodontal microbiota and these pathogens are present in the
oral cavity even before the subjects have periodontal disease (Teles et al., 2013). In the
ligature model, excess bacteria accumulate around the ligature to initiate the experimental
periodontitis (Abe and Hajishengallis, 2013). For humans, total cell counts of bacteria
and total mass of plaque are usually positively related to the severity of chronic
periodontitis. Moreover, mice and rats do have some oral pathogens, which are similar to
human periodontal pathogens, detected in the ligature model (Duarte et al., 2010, Jiao et
al., 2013). Taken together, the ligature-induced periodontitis model might be a relatively
more appropriate model to study microbiota in experimental periodontitis than the oral
gavage model. Also, it is practical to collect plaque samples from the ligatures. However,

31
it is still debatable if the periodontal tissue inflammation initiated by the trauma of
ligature placement does completely represent the inflammation environment of
periodontitis in humans.
Subgingival Microbiota in Periodontitis: Biased vs. Unbiased Analytical Approaches
Bacteria-mediated inflammation is the main etiology of periodontitis. Oral biofilm
attached on the root surface is the habitat for the periodontal microbiota. Different
microbiotas form in oral mucosa, tongue, gingiva, and the tooth surface. The composition
of the microbiota reflects its specific habitat in the oral cavity as well as changes in the
local environment that is induced by intrinsic metabolism of the microbiota (Mager et al.,
2003, Kolenbrander et al., 2010). In the microbial community, each species is colonized
sequentially and has reciprocal interaction with others. A spatiotemporal model of
periodontal microbiota colonization has been proposed (Kolenbrander and London, 1993).
The initial colonizers, such as Streptococcus gordonii, Streptococcus mitis,
Streptococcus oralis, Streptococcus sanguinis, bind to complementary salivary receptors,
including sialylated mucins, proline-rich protein, α-amylase, salivary agglutinin and
bacterial cell fragments, in the pellicle coating the crown or root surface. Then the early
colonizers, such as Actinomyces naeslundii, Capnocytophaga gingivalis,
Capnocytophaga ochracea, and late colonizers, such as Aggregatibacter
actinomycetemcomitans, Porphyromonas gingivalis, Prevotella intermedia, bind
previously bound bacteria sequentially. In the microbial complex, many species
coaggregate with each other to stabilize the network. For example, Fusobacterium spp.
plays an important role in bridging early and late colonizers. Different species also

32
change genetic information or provide nutrients to each other to survive in the
community.
In 1998, Dr. Sigmund Socransky proposed the concept of periodontal microbial
complexes based on the results of multiple cluster and community ordination analyses
from more than 13,000 plaque samples. The complexes are named by different colors,
and the species in the same complex are associated with each other temporally and
spatially (Socransky et al., 1998). Moreover, increased total cell counts of species in
specific complexes (e.g. orange or red complexes) and increased relative proportions of
specific complexes are associated with the status of the periodontal tissues. The concept
of periodontal microbial complexes has been widely used while analyzing human plaque
sample.
Tooth-associated oral biofilms can be roughly divided into supragingival biofilms
(on exposed tooth surface or above the gingival margin) and subgingival biofilms (below
the gingival margin and within the periodontal pocket or sulcus) (Kolenbrander et al.,
2010). The microbial community living in the biofilm is categorized into supragingival
microbiota or subgingival microbiota. The supragingival microbiota not only plays an
important role in caries formation, but also initiates the formation of subgingival
microbiota. The surpragingival microbiota, as detected by checkerboard DNA-DNA
hybridization, is reestablished within two days following the cleaning of supragingival
plaque (Haffajee et al., 2008). The species in the purple (e.g. Veillonella parvula), green
(e.g. C. gingivalis, E. corrodens), and orange complexes (e.g. F. nucleatum) flourish
during seven days of new biofilm formation. The sequences of bacterial colonization are

33
similar to the sequences proposed in the spatiotemporal model of periodontal bacterial
colonization. The composition of supragingival microbiota and total cell counts of
bacterial species between the healthy subjects and the periodontitis subjects are slightly
different during the reformation of oral biofilms (Haffajee et al., 2008).
Having a similar design to Haffajee et al. (2008), another study investigates the
change of subgingival microbiota during one week of biofilm reformation (Uzel et al.,
2011). Unlike the supragingival microbiota, the pattern of subgingival microbiota
reformation between the healthy subjects and the periodontitis subjects is significantly
different. The cell counts of bacterial species detected by checkerboard DNA-DNA
hybridization in the periodontitis subjects increase more rapidly than do these in the
healthy subjects. The difference might be explained by a larger source of nutrients
provided by the elevated flow of gingival crevicular fluid and many residual cells in the
diseased periodontal pockets that contribute to the repopulation of the microbiota. The
results of these two studies (Haffajee et al., 2008, Uzel et al., 2011) indicate distinct
environments affecting the composition of the local microbiota. Although the microbial
composition of supragingival plaque is associated with subgingival microbiota and
periodontal status clinically to a certain degree (Mayanagi et al., 2004, Haffajee et al.,
2008), the supragingival microbiota cannot completely represent the subgingival
microbiota, especially in a diseased site with deep probing depth (Teles et al., 2006).
Therefore, most studies collect subgingival plaque to evaluate the association between
microbial composition and clinical status in periodontitis patients.
34
The interaction between the microbial and non-microbial components (e.g.
immune cells, nutrients) of an ecosystem ultimately leads to homeostasis in which
microbial and non-microbial forms exist in harmony and equilibrium with their
environment. This is the climax community (Socransky and Haffajee, 2005). Specific
climax communities exist in distinct environments. Therefore, the subgingival microbiota
in healthy subjects and periodontitis subjects are very different given that the periodontal
environment is distinct. When a tooth has periodontitis, the depth of the gingival sulcus
increases due to the loss of periodontal attachment and alveolar bone. The inflammation
happening in the periodontal tissue and the deepened gingival sulcus causes the changes
of metabolism resulting in increased pH, increased variety of nutrients, elevated flow of
gingival crevicular fluid, elevated temperature, decreased oxygen level, and low
reduction potential. The changed environmental conditions favor the growth of
periodontal pathogens, such as P. intermedia, P.gingivlais, T.denticola, which have
generally low numbers in the healthy periodontal environment (Marsh and Devine, 2011).
Moreover, the gene expressions of the species also change in the periodontitis
environment. The upregulation of putative virulence factor could enhance inflammation
(Duran-Pinedo et al., 2014). The change of environment affects the microbiota, and
changes in the microbiota also affect the environment.
There are many methods to investigate the subgingival microbiota. Culture
method is the traditional way to identify bacteria, but this method cannot identify large
numbers of bacterial species at the same time. Moreover, the inability of identifying
uncultivable bacteria is a major issue to analyze complex microbiotas (e.g. microbiota in
35
the gut and the oral cavity). Therefore, the use of molecular approaches became the
preferred method for studying the microbiota of different habitats nowadays. In
periodontal research, several culture independent techniques have been frequently
utilized: quantitative real-time PCR (qPCR), checkerboard DNA-DNA hybridization, and
microarray hybridization (16S ribosomal RNA-based) (Teles et al., 2013). qPCR gives
the relative amount of bacterial species after amplification, but the number of species
analyzed in each sample at the same time is limited (Sakamoto et al., 2001).
Checkerboard DNA-DNA hybridization can detect multiple species simultaneously and
gives the absolute counts of bacterial species, but each membrane only quantifies a
maximum of forty-five cultivable species in a specified range (the DNA amount of a
single species in a given sample should range between 104 to 107) (Socransky et al., 1994,
Socransky et al., 2004). Microarray hybridization gives the relative detected frequencies
of multiple species simultaneously (over 300 species), but the frequency of each species
can be biased by the 16S rRNA gene PCR amplification process (Paster et al., 2006).
Next-generation sequencing (NGS) is an open-ended molecular technique, which is
different from the other closed-ended methods mentioned above. The detection of
bacteria in the microbiota is not restricted by the specificity of the probes or primers as in
other techniques (Griffen et al., 2012). Large numbers of known and unknown bacterial
species can be detected in an environmental or clinical sample by next-generation
sequencing through “metagenomics” (Thomas et al., 2012). Metagenomic studies are
commonly performed by analyzing the specific regions of prokaryotic 16S ribosomal
RNA gene (16S rRNA) to conduct phylogenetic classifications such as genus or species

36
in diverse microbiota. 16s rRNA is approximately 1,500 bp long and contains nine
variable regions interspersed between conserved regions. The difference of copy numbers
of 16s rRNA in species may cause bias in the relative abundance results of NGS
(Vetrovsky and Baldrian, 2013). More importantly, NGS can analyze the functions of
species efficiently by RNA sequencing (RNA-Seq), exome sequencing, and chromatin
immunoprecipitation sequencing (ChIP-Seq). Large numbers of gene sequences can be
analyzed in a short period of time.
However, while conducting phylogenetic classifications, NGS can only generate
relative abundance of different taxa, and the detected frequencies are biased during the
PCR amplification step. Since different techniques have advantages and disadvantages,
the technique which can best answer the experimental question should be utilized.

37
CHAPTER TWO: SUBGINGIVAL MICROBIOTA SHIFTS IN PERIODONTITIS
FOLLOWING RESOLVIN E1 APPLICAITON
Introduction
Periodontitis is a biofilm-induced inflammatory disease. The initiation and
progression of periodontal disease requires the simultaneous occurrence of a number of
factors, including the virulent periodontal pathogen, host susceptibility, and the local
environment favoring expression of virulence factors (Haffajee and Socransky, 1994).
Although it is still debatable whether bacteria or immune response or both are the
primary initiators of periodontal disease progression, it is clear that the inflammatory
response followed by the acquired immune response drives the pathogenesis of
periodontitis after the initial bacteria challenge. Therefore, regulating the immune
response appears to be a promising approach to treat periodontitis. Several years ago, the
discovery of the active resolution phase of inflammation provided a missing link in our
understanding of chronic inflammatory diseases. Chronic inflammation may be due to a
failure of resolution, rather than too much inflammatory stimulation. If the resolution
phase can be activated, the inflamed tissue will return to homeostasis and regeneration of
tissue will occur (Serhan et al., 2008, Van Dyke, 2014). Specialized pro-resolving
mediators (SPMs), including lipoxins, resolvins, protectins, maresins, are molecules
which initiate the resolution phase. As discussed above, resolvins have already been used
to treat periodontitis in animal models.
Previous studies demonstrated that the local application of RvE1 in a P.
gingivalis-induced periodontitis model in rabbits prevented the onset of periodontitis and

38
promoted the regeneration of the periodontium destroyed by the disease (Hasturk et al.,
2006, Hasturk et al., 2007). An interesting outcome of one of these studies in rabbits was
the apparent spontaneous disappearance of P. gingivalis following the regeneration of
periodontal tissue treated by resolvin E1 application (Hasturk et al., 2007). No
mechanical or antimicrobial therapies were used. The rabbit ligature model experiment
was initiated with a six-week disease induction phase (P. gingivalis inoculation) followed
by subsequent six-week treatment phase (RvE1 application) after P. gingivalis
inoculation was stopped. Microbial dental plaque (pooled supragingival and subgingival
biofilm) was sampled at baseline, at six and twelve weeks. The authors reported that
infection with P. gingivalis altered the composition of the existing oral microbiota of the
rabbits, resulting in the detection of previously undetected species, such as A.
actinomycetemcomitans and F. nucleatum, and in the disappearance of Camphylobacter
curvus and Campylobacter rectus, among other changes at the end of the disease
induction. Application of RvE1 resulted in a return of the microbiota to its baseline
composition and the apparent elimination of P. gingivalis, whereas placebo treated
animals maintained the complex pathogenic microbiota. Two potential mechanisms were
proposed to explain these findings: (i) RvE1 might have stimulated the antibacterial
activities of immune cells; or (ii) the resolution of the inflammation “starved” P.
gingivalis reducing nutrients which were derived from host-tissue degradation (Van Dyke,
2008). The dynamics of microbiota shift after inflammation resolution and tissue
regeneration following RvE1 application is still not clear.
39
The goal of our studies was to characterize the kinetics of changes in the
subgingival microbiota in an experimental periodontitis model after treatment of the
disease with resolvin E1, and to start to explore the mechanisms leading to these changes.
A ligature-induced periodontitis model in the rat was utilized because, unlike the rabbit
model, which requires exogenous addition of P. gingivalis to induce disease, rats develop
disease presumably induced by their own microbiota. The goal was to fill a gap in
knowledge regarding the impact of specialized pro-resolving lipid mediators (SPMs) on
the composition of the subgingival microbiota during periodontitis progression.
The hypothesis was that resolvin E1 would result in the resolution of periodontal
inflammation leading to changes in the local environment that would lead in a shift in the
composition of the adjacent subgingival biofilm. To test this hypothesis, we proposed two
specific aims:
Specific Aim 1 – To examine the changes in the rat subgingival microbiota during
the induction and treatment phases of ligature-induced periodontitis using
checkerboard DNA-DNA hybridization and next-generation sequencing.
We hypothesized that after ligature placement, the total mass of the subgingival
biofilm would increase, and the microbiota would shift towards a higher proportion of
periodontal disease associated pathogens during disease progression. Conversely,
resolution of the periodontitis following RvE1 application would reverse those changes
and reestablish a health-associated microbiota.

40
In pilot studies, checkerboard DNA-DNA hybridization was used to determine
whether shifts could be detected after RvE1 treatment. This relatively inexpensive
screening tool employed probes to human pathogens, so the applicability to rat associated
microbiota is relative. Next-generation sequencing is a powerful tool to perform
metagenomics for the characterization of the rat microbiota associated with health and
disease. Once the potential impact of RvE1 was established, this technique was used to
characterize microbial dysbiosis caused by ligature placement and the impact of RvE1 in
reversing this dysbiosis.
Specific Aim 2 – To characterize the clinical and local inflammatory response
changes in the periodontium of rats.
We hypothesized that in the presence of RvE1, bone regeneration would be
observed with a reduction of the inflammatory infiltrate in the tissues at the histological
level. Tissue expression of specific inflammatory gene pathways should also be inhibited.
Materials and Methods
Animals and experimental periodontitis model
This experiment was approved by Institutional Animal Care and Use Committee
(IACUC) of the Forsyth Institute. Eighteen six-week old male Wistar rats (weight 180-
200 g, Charles River Laboratories, New York, NY) were used. All animals were
maintained in a controlled temperature (220 C to 250 C) and dark/light cycle (12/12 hours)
facility. Rats received a standard laboratory chow diet and water ad libitum. Rats were
sedated by isoflurane 2-3% before being anesthetized with ketamine (80mg/kg,

41
intraperitoneally) and xylazine (16 mg/kg, intraperitoneally). It was necessary to
anesthetize the rats before performing all experimental procedures, including placing the
ligature, checking the ligature position, collecting subgingival plaques, or applying RvE1.
Eighteen rats were divided into four groups (no ligature: n=6, ligature alone: n=6, ligature
+ Vehicle: n=3, ligature + RvE1: n=3). 3–0 silk ligatures were placed subgingivally on
the maxillary right and left second molars of each ligated rat on the first day of the
experiment to induce periodontitis. The knots were tightened on the buccal side of the
maxillary second molars to prevent being disturbed by the tongue. The experimental
period lasted six weeks, including a three-week disease induction phase and the
subsequent three-week treatment phase. The stability of the ligatures was checked every
other day for every rat. RvE1 (C20H30O5, molecular weight: 350.5, purity>97%, λmax: 272
nm) was obtained from Cayman Chemical (Ann Arbor, MI). The RvE1 provided by
Cayman was prepared by stereospecific total synthesis guided by the published structure
described in the published reference (Arita et al., 2005a). Analytical and biological
comparisons with endogenously derived RvE1 have confirmed its identity as matching
the natural product.
Six rats in the non-ligature (healthy) group were sacrificed on the first day of the
experiment to collect baseline tissue samples. At the end of the disease induction phase
(21st day), the six rats in the ligature alone group were sacrificed to quantify the amount
of disease induced. During the treatment phase, 1 µg RvE1 (Cayman Chemical Co. Inc.,
Ann Arbor, MI) dissolved in 4 µl of ethanol was applied to the ligated teeth of the rats in
the RvE1 group (2 µl on buccal or palatal side respectively), and 4 µl of ethanol (vehicle

42
alone) was applied on the ligated teeth of the rats in the Vehicle group with a Hamilton
syringe (25G needle, 5µl syringe). RvE1 (0.7mM) and vehicle were applied every other
day during the treatment phase (weeks four to six). At the end of six weeks, the rats from
both remaining groups were sacrificed. All rats were euthanized by CO2 inhalation. The
timeline of the experiment is summarized in Fig. 2.1.
The following samples were collected: subgingival plaque, gingival tissue,
maxillary bone block, and serum. Subgingival plaque samples were collected on day 0, 8,
12, 16, 20, 24, 28, 32, 36, and 40. Other samples were collected immediately after
sacrifice. The maxillae were split into two halves: one half was taken for the analyses of
bone morphometry and gene expression. The palatal gingiva of the ligated tooth was
incised and stored in 200µl of RNAlater (Sigma-Aldrich, St. Louis, MO) for the qRT-
PCR assay. Then the remaining specimen was defleshed by beetles to obtain a clean bone
block. The other half was processed for histomorphometric analysis. Blood was obtained
using heart aspiration and centrifuged to collect serum. Serum was aliquoted and stored at
-80 0C (eight aliquots of 100µl each) for future analysis.
Bacterial DNA extraction and amplification
Subgingival plaque samples were collected using the tip of a 2-Whiteside scaler
(Hu-Friedy, Chicago, IL) from the palatal site of the maxillary second molars. Before
placing the ligature on the maxillary second molars, a plaque sample was collected from
four teeth (two maxillary second molars and two mandibular second molars) of each rat
at baseline and then the samples were pooled in one collection tube. The sample was
collected from one ligated tooth of each rat each time after the ligature placement. The

43
DNA of subgingival plaque was extracted using the MolYsis Basic (CaerusBio Inc.,
Dowingtown, PA) and QIAamp® mini kit (QIAGEN Inc., Valencia, CA). The MolYsis
Basic kit was used to isolate the bacterial DNA from the sample to exclude DNA of
mammalian cells. Mammalian cells were lysed under chaotropic conditions to release
DNA. The released mammalian DNA was enzymatically degraded, and then the bacterial
cells were lysed (Horz et al., 2008, Horz et al., 2010). After selectively removing
mammalian DNA, the bacterial DNA was extracted with QIAamp® mini kit (QIAGEN
Inc., Valencia, CA). Briefly, the isolated bacterial cells were mixed with lysozyme (20
mg/ml) and Proteinase K, and incubated at 56 0C for two hours to lyse the cell wall to
release DNA. DNA was then isolated and eluted following the manufacturer’s
instructions.
The extracted bacterial DNA was amplified with the multiple displacement
amplification kit (GenomiPhiTM V3 DNA amplification kit, GE Healthcare Bio-Sciences,
Pittsburgh, PA). Multiple displacement amplification (MDA) enables the whole genomic
amplification of DNA targets (Dean et al., 2002, Brito et al., 2007). The unique Φ29
DNA polymerase used in this technique is able to amplify DNA isothermally at 30 o C
and gives the most complete coverage, avoid sequence effects, and results in unbiased
amplification. The MDA technique can increase the bacterial DNA amount up to one
thousand fold. In brief, 3 µl of each of the DNA templates was added to 7µl pure water in
200 µl microcentrifuge tubes, and then was mixed with 10µl 2X Denaturation Buffer.
Templates in denaturing buffer were heat denatured at 95 o C for 3 minutes in the thermal
cycler and cooled to 4 oC. Then the 20 μl of denatured DNA template was added to each
44
Ready-To-Go GenomiPhi V3 cake in the well. The wells were sealed with the domed
caps provided. The mixtures were kept on ice prior to incubation. The samples were
incubated at 30 ºC for 1.5 hours for DNA amplification, and then the samples were heated
to 65 ºC for 10 minutes to inactivate the Φ 29 DNA polymerase enzyme. The
amplification reactions were stored at -20°C for future use. The concentration of
amplified DNA samples was measured with fluorescent nucleic acid stain (Quant-iT™
PicoGreen® dsDNA Assay, Life Technologies, Grand Island, NY).
Checkerboard DNA-DNA hybridization
Forty human periodontal disease associated bacterial probes (Socransky et al.,
2004) (Table 2.1) were selected to detect the bacterial DNA of rat subgingival plaque
after multiple displacement amplification using checkerboard DNA-DNA hybridization.
In brief, 8 µl amplified bacterial DNA was added in 1ml Tris EDTA buffer (10 mm Tris–
HCl, 1 mm ethylenediaminetetraacetic acid, pH 7.6). Immediately after, the solution with
DNA was placed in lanes on a nylon membrane using a Minislot device (Immunetics,
Cambridge, MA). After fixation of the DNA to the membrane, the membrane was placed
in Miniblotter 45 (Immunetics, Cambridge, MA), with the lanes of DNA at 90o to the
lanes of the device. Digoxigenin-labeled whole genomic DNA probes to forty
subgingival species were hybridized in individual lanes of the Miniblotter. After
hybridization, the membranes were washed at high stringency. The DNA probes were
detected using antibody to digoxigenin, and conjugated with alkaline phosphatase and
chemifluorescence detection. Signals were detected using AttoPhos substrate (Amersham
Life Sciences, Arlington Heights, IL) and were read using a Typhoon Trio Variable Mode

45
Imager (GE Healthcare Bio-Sciences, Pittsburgh, PA), a computer-linked instrument that
reads the intensity of the fluorescence signals resulting from the probe-target
hybridization. Two lanes in each run contained standards at the concentration of 105 and
106 cells of each species. The sensitivity of the assay was adjusted to permit the detection
of 104 cells of a given species by adjusting the concentration of each DNA probe. Signals
were evaluated using the Phoretix Array (TotalLab Ltd, UK) and converted to absolute
counts by comparison with the regression line determined from data from the standards
on the same membrane. Failure to detect a signal was recorded as zero.
Next-generation sequencing
The microbial composition of the plaque samples (50ng DNA/10µl) were
characterized by sequencing the hyper-variable V3 and V4 regions of the 16S rRNA gene
using the Illumina MiSeq® platform. Paired-end sequencing allows the capture of the
entire V3-V4 region by overlapping and merging the read pairs. Successfully merged
reads were processed through the QIIME pipeline (Caporaso et al., 2010) filtering out
low quality sequences using a quality score threshold of 20. Operation Taxonomic Units
(OTUs) were created by clustering the merged quality filtered reads at a 97% identity
threshold using sequences from a reference database (SILVA/Greengenes) (DeSantis et
al., 2006, Quast et al., 2013) as a guide. All remaining sequences entered a de novo
clustering step where they were clustered at the same 97% identity threshold without
guidance from the reference database. Potential chimeric OTUs were removed through
the use of UCHIME (Edgar et al., 2011) and the gold 16 database (Public domain version
of UCHIME, version 4.1, http://drive5.com/uchime/uchime_download.html). Taxonomic

46
assignments to OTUs from phylum to genus level were completed through QIIME’s use
of the given reference database (SILVA/Greengenes) and the UCLUST algorithm (Edgar,
2010). Further analysis included alpha diversity (e.g. Shannon evenness), beta diversity
(weighted UniFrac) (Lozupone et al., 2006), principal coordinate analysis (PCoA) and
relative abundance profiles of the microbial community in the samples.
Relative abundance of taxa in each sample was defined as dividing the hit of each
taxon by the total hits of all taxa in the sample. In ecology, diversity is usually thought of
as being composed of richness (the number of species) and evenness (the relative
abundance of species). Alpha diversity is defined as the richness and evenness within a
habitat unit (a sample). Beta diversity is defined as the expression of diversity between
habitats (samples).
In this study, richness was evaluated by the number of observed OTUs, and
evenness was measured as Shannon evenness or non-parametric Shannon Index (Anne
Chao, 2003). A higher value of the number of observed OTUs means more species
existing within a sample. A high value of Shannon index or non-parametric Shannon
evenness is representative of a diverse and equally distributed community and a lower
value represents a less diverse community. Beta diversity was represented by weighted
UniFrac distance. UniFrac distance is used to measure the phylogenetic distance between
sets of taxa in a phylogenetic tree as the fraction of the branch length of the tree. UniFrac
distance can determine whether communities are significantly different. Weighted
UniFrac distance accounts for the relative abundance of each taxon within the
47
communities. The data in this distance matrix was visualized with principal coordinates
analysis (PCoA).
Morphometric analysis
The dissected maxilla bones were defleshed and stored in 0.3% hydrogen
peroxide for 24 hours. Then the bones were dried completely before being stained. The
alveolar bone loss of three maxillary molars was analyzed using a dissecting microscope.
The dissected maxilla bones were stained with methylene blue and the images (at
0.63X10 times magnification) were taken under the dissecting microscope (Axio
observer A1, ZEISS) using AxioVision 4.8 software. The area of exposed root surface
was measured at the buccal and palatal sites of three maxillary molars. The distance
between the alveolar bone margin and the cementoenamel junction (CEJ) was measured
at nine sites (mesial, middle, and distal sites of the first molar; interproximal site between
the first molar and the second molar; mesial and distal sites of the second molar;
interproximal site between the second molar and the third molar; mesial and distal sites of
the third molar) of three maxillary molars at the buccal site and the palatal site. The
direction of the distance line was parallel with the axis of the root (Fig. 2.2). All
measurements were performed using computer software (ImageJ). The measurements of
buccal and palatal sites were added for statistical analysis.
Histomorphometry
Half of the maxilla was immersed in 20 volumes of 10% formalin for 48 hours
and rinsed with water for four hours. Then the tissue specimen was immersed in 20
48
volumes of 10% EDTA, which was replaced every 48 hours for two to three weeks. The
completion of decalcification was confirmed by the chemical reaction of calcium oxalate
precipitation. After the process of decalcification, the tissue specimens were rinsed for
four to eight hours in running water, and soaked in 50% and 70% ethanol sequentially.
The tissue specimens were immersed in 90% ethanol the day before embedding with
paraffin. Serial mesio-distal sections (6 µm) parallel to the long axis of the teeth were cut.
Thin sections were either stained with H&E for light microscopy and identification of the
cellular composition of inflammatory infiltrates, or stained with tartrate resistant acid
phosphatase (TRAP) to examine osteoclastic activity.
Sections with similar anatomic positions were selected for quantitative
measurement. Different sections were measured randomly to avoid bias. Specific areas of
mesial and distal interproximal sites were selected for histological assessment. Each
measurement had three different sections. The number of inflammatory cells, including
neutrophils, lymphocytes and plasma cells, was counted in the area of connective tissue
above the alveolar bone at 400x magnification. The total number of osteoclasts around
the interproximal bone was counted. The area of interproximal bone was measured.
Osteoclast density was defined as dividing the number of osteoclasts by the area of
interproximal bone. All the measurements were performed using computer software
(ImageJ). All measurements in each sample were the mean of the mesial side and the
distal site from three sequential sections.
Quantitative reverse transcription polymerase chain reaction assay

49
Total RNA was extracted from gingival tissue with Trizol reagent (Invitrogen,
Grand Island, NY) as per the manufacturer's protocol. Gingival tissue was homogenized
by pestle homogenizer before adding Trizol reagent. The concentration and purity of
RNA was estimated by the A260/A280 ratio spectrophotometrically (NanoDrop 2000c,
Thermo Fisher Scientific, Waltham, MA). A total of 1 μg RNA was converted to cDNA
using a high-capacity cDNA reverse transcriptase kit (Applied Biosystems, Grand Island,
NY). The 20 µl reaction mixtures were thoroughly mixed and assayed at 25°C for 10
minutes, 37°C for 120 minutes, and 85°C for five minutes in a thermal cycler (ABI 9700,
Applied Biosystems).
Quantitative reverse transcription polymerase chain reaction (qRT-PCR) was
performed using primers and TaqMan probes for Cxcl1, Ptgs2, Nos2, and labeled with
FAM dye (Applied Bio-systems, TaqMan gene expression assays). β-actin (Actb) was
utilized as an internal control and amplified using preformulated VIC-TAMRA-labeled
TaqMan probes (Applied Biosystems, Endogenous Control). Quantification was
performed in an automated thermal cycler (StepOnePlus™ System, Applied Biosystems).
The reaction mixtures were kept at 50°C for two minutes (one cycle), 95°C for 20
seconds (one cycle), 95°C for one second and 60°C for 20 seconds (40 cycles). The
results were analyzed through a software interface and spreadsheet for the calculation of
relative expression (2-ΔΔCT).
The gene Cxcl1 (GRO-α, CINC, CXCL1 in humans) controls the production of
chemokine (C-X-C motif) ligand 1 (CXCL1), which is a chemokine expressed in
endothelial cells, fibroblasts, neutrophils, monocytes and other cells. CXCL1 is highly

50
chemotactic for neutrophils. For rodents, there is no IL-8 gene expression; therefore,
CXCL1 plays an important role in recruiting the neutrophils during acute inflammation.
The gene Ptgs2 controls the production of prostaglandin-endoperoxide synthase 2
(PTGS2 or COX-2), which is an enzyme involving in the conversion of arachidonic acid
to prostaglandin H2 and thromboxane A2. COX-2 is unexpressed under normal
conditions in most cells, but has elevated levels during inflammation. The expression of
Ptgs2 is associated with bone resorption, platelet aggregation, vessel tone and other
physiological functions.
The gene Nos2 controls the expression of inducible nitric oxide synthase (iNOS).
The production of iNOS is stimulated by lipopolysaccharide and cytokines, such as IL-1β,
TNF-α, and IFN-γ. Inducible nitric oxide synthase produces large quantities of nitric
oxide (NO) upon stimulation react with superoxide (O2-) leading to peroxynitrite
(ONOO-) formation and cell toxicity.
Statistical Analysis
The comparisons between two groups were analyzed by unpaired or paired two-
tailed Student’s t-test. The comparisons between multiple groups were analyzed by one-
way analysis of variance (one-way ANOVA) and post hoc analysis was performed
(pairwise t-test). All values were expressed as mean ± standard error of the mean. P-value
<0.05 was considered statistically significant.
Results
Ligature placement induces experimental periodontitis

51
After three weeks of ligature placement, significant bone loss was observed in the
ligature alone group (mean area of exposed root surface in three molars- no-ligature
(healthy): 3.2±0.4 mm2, ligature alone: 7.3±0.6 mm2, p< 0.01; mean distance between
CEJ and alveolar bone level- no ligature: 4.1±0.5 mm, ligature alone: 9.9±0.8 mm,
p<0.01) (Fig. 2.3). Histologically, the mean area of interproximal bone in the ligature
alone group was also significantly smaller than the area in the no ligature group (no
ligature: 0.35±0.03 mm2, ligature alone: 0.18±0.03 mm2, p<0.01).
RvE1 treatment regenerates lost alveolar bone
Three weeks of RvE1 treatment significantly reversed alveolar bone loss induced
by ligature placement compared to vehicle application (mean area of exposed root surface
in molars - Vehicle: 8.0±0.4mm2, RvE1: 5.8±0.2 mm2, p<0.01; mean distance between
CEJ and alveolar bone level - Vehicle: 11.4±0.5 mm, RvE1: 8.3±0.2 mm, p<0.01) (Fig.
2.4). The alveolar bone level in the RvE1 group was higher than that in the ligature alone
group (mean area of exposed root surface in molars - ligature alone: 7.3±0.2 mm2, RvE1:
5.8±0.2 mm2, p<0.01; mean distance between CEJ and alveolar bone level - ligature
alone: 9.9±0.3 mm2, RvE1: 8.3±0.2 mm2, p=0.03) (Fig. 2.4). Histologically, regeneration
of interproximal bone following RvE1 treatment was also observed (mean area of
interproximal bone- Vehicle: 0.16±0.01 mm2, RvE1:0.22±0.02 mm2) (Fig. 2.5).
RvE1 treatment reduces osteoclast activity and inhibits inflammation in
experimental periodontitis

52
The mean count of inflammatory cells in the connective tissue in the RvE1 group
was lower than the count in the ligature alone and Vehicle group but the difference was
not statistically significant (Fig. 2.6). RvE1 treatment significantly inhibited osteoclast
activity compared to vehicle application (p<0.05). Also, the osteoclast density in the
RvE1 group was lower than that in the ligature alone group (p=0.02) (Fig. 2.7).
Expression of inflammation related genes was inhibited by RvE1 treatment. The
relative gene expression levels (2-ΔΔCT) of Cxcl1, Ptgs2, Nos2 in the RvE1 groups were
lower than the other two groups, and RvE1 treatment significantly reduced relative gene
expression level of Cxcl1 compared to vehicle application (p=0.02).
Subgingival microbiota shift during disease induction phase and treatment phase
Pilot experiments were performed with checkerboard DNA-DNA hybridization to
identify subgingival microbiota and analyze the cell counts (CFU) of 40 species derived
from human samples. Since DNA probes were made of human bacterial DNA, the
terminology ‘‘like species’’ was employed to describe the detection of probe signal
(Rober et al., 2008, Duarte et al., 2010). Mean cell counts of 33 out of 40 species
identified by checkerboard DNA-DNA hybridization significantly increased from the
baseline to the end of disease induction phase (Table 2.2). Only five species
(Capnocytophaga gingivalis, Prevotella intermedia, T. forsythia, Propionibacterium
acnes, Prevotella melaninogenica-like species) did not exhibit statistically significant
differences. Nine species, Streptococcus oralis, Veillonella parvula, Streptococcus mitis,
Streptococcus gordonii, Streptococcus intermedia, Streptococcus sanguini, Actinomyces
gerencseriae, Streptococcus constellatus, and Eubacterium saburreum-like species, had

53
cell counts more than 2 x10⁵ on day 20. Total cell counts significantly increased from
baseline to the end of disease induction phase (p<0.01).
RvE1 treatment significantly reduced bacteria at the end of treatment phase (day
40). At the beginning of treatment phase (day 20), mean cell counts of species had no
significant difference between the Vehicle group and the RvE1 group, except for one
species: Campylobacter showae-like species. On day 40, mean cell counts of species in
the RvE1 group were lower than mean cell counts of species in the Vehicle group, except
two species: Streptococcus mitis and Streptococcus oralis-like species (Fig. 2.9). Mean
cell counts of nineteen species (e.g. T. forsythia, P. gingivalis-like species) in the RvE1
group were significantly lower than these in the Vehicle group on day 40 (Table 2.3).
Total cell counts were significantly reduced by RvE1 treatment compared to vehicle
application.
The data was grouped and represented as the relative proportions of periodontal
microbial complexes as defined by Socransky. The pattern of baseline (day 0) was quite
different from the patterns of other time points after disease induction. Yellow and other
complexes (27.55%, 22.32%) had higher relative proportions than did other complexes
on day 0. The yellow complex became the only dominant microbial complex after disease
was induced (Table 2.4). During the treatment phase, RvE1 treatment limited changes of
the relative proportions of periodontal microbial complexes compared to vehicle
application. Before treatment started (day 20), the relative proportions of microbial
complexes in the Vehicle group were similar to those in the RvE1 group. At the end of
treatment (day 40), the Vehicle group had a relatively lower proportion of yellow

54
complex and higher proportions of orange and red complexes than did RvE1 group
(Yellow complex - Vehicle: 33.76 %, RvE1:40.41 %; Orange complex - Vehicle: 20.53%,
RvE1: 16.92%; Red complex: Vehicle: 4.34%, 2.93%, Table 2.5).
Having established an impact of RvE1 on the microbiota with the checkerboard
pilot, the definitive experimental analysis of the rat microbiota was performed using next-
generation sequencing. There was a clear shift in the subgingival microbiota following
ligature placement (Fig. 2.10). Considering the variation of relative abundance and
limited sample size, a less conservative significant level (p<0.3) was chosen to find the
potential genera representing subgingival microbiota in different groups. Several genera
changed significantly from baseline to the end of the disease induction phase. Two genera,
Streptococcus and Rothia, had the largest changes in mean relative abundance during
disease induction phase (Fig. 2.11). In the treatment phase, the subgingival microbiota
shift was compared between the RvE1 and the Vehicle treatment groups. At the phylum
level, Firmicutes were dominant in the RvE1 group during the treatment phase.
Actinobacteria and Firmicutes in the Vehicle group had similar relative abundance at the
end of treatment phase (Table 2.6). Four genera (Enterococcus, Veillonella, Allobaculum,
Lactobacillus) demonstrated more significant difference (p<0.3) between the RvE1 group
and the Vehicle group on day 32 than did other genera. On day 40, 11 genera
(Coprococcus, Lactobacillus, Blautia, Sutterella, Veillonella, Streptococcus,
Corynebacterium, Collinsella, Facklamia, Dorea, Aggregatibacter) had more significant
difference (p<0.3) between the RvE1 group and the Vehicle group than did other genera
(Fig. 2.12).
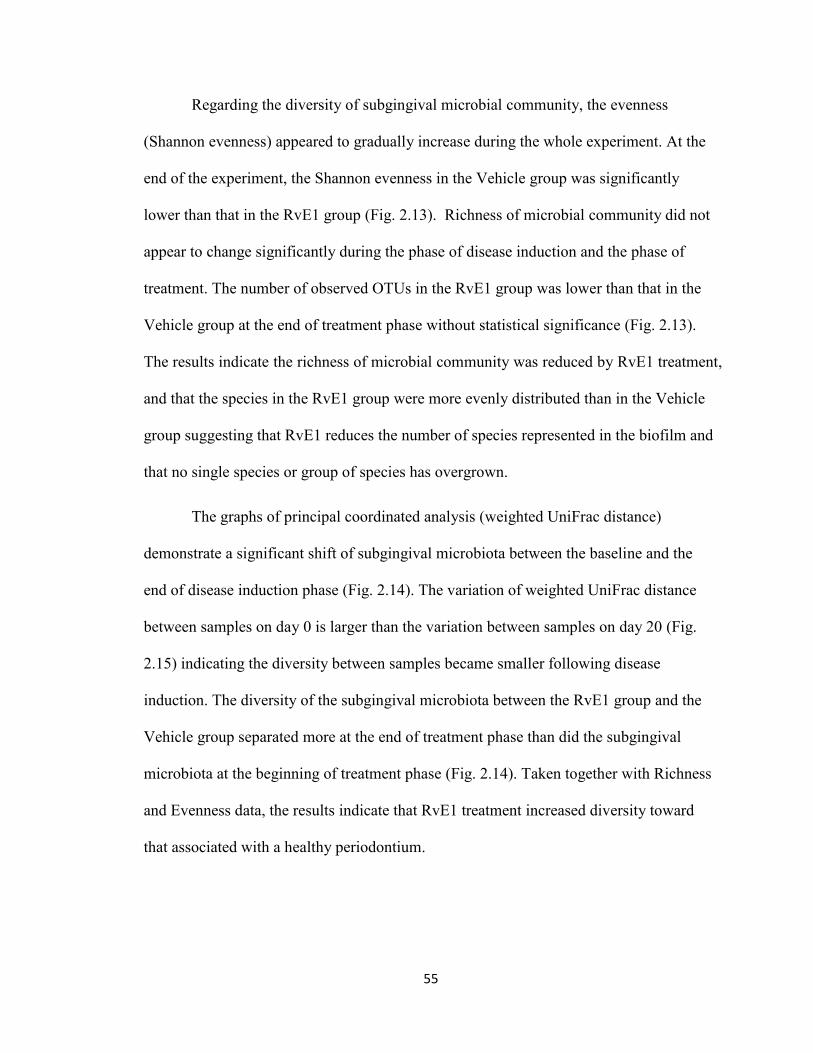
55
Regarding the diversity of subgingival microbial community, the evenness
(Shannon evenness) appeared to gradually increase during the whole experiment. At the
end of the experiment, the Shannon evenness in the Vehicle group was significantly
lower than that in the RvE1 group (Fig. 2.13). Richness of microbial community did not
appear to change significantly during the phase of disease induction and the phase of
treatment. The number of observed OTUs in the RvE1 group was lower than that in the
Vehicle group at the end of treatment phase without statistical significance (Fig. 2.13).
The results indicate the richness of microbial community was reduced by RvE1 treatment,
and that the species in the RvE1 group were more evenly distributed than in the Vehicle
group suggesting that RvE1 reduces the number of species represented in the biofilm and
that no single species or group of species has overgrown.
The graphs of principal coordinated analysis (weighted UniFrac distance)
demonstrate a significant shift of subgingival microbiota between the baseline and the
end of disease induction phase (Fig. 2.14). The variation of weighted UniFrac distance
between samples on day 0 is larger than the variation between samples on day 20 (Fig.
2.15) indicating the diversity between samples became smaller following disease
induction. The diversity of the subgingival microbiota between the RvE1 group and the
Vehicle group separated more at the end of treatment phase than did the subgingival
microbiota at the beginning of treatment phase (Fig. 2.14). Taken together with Richness
and Evenness data, the results indicate that RvE1 treatment increased diversity toward
that associated with a healthy periodontium.

56
Table 2.1 List of forty species identified in the checkerboard DNA-DNA hybridization by the order of periodontal microbial complexes aPeirodontal Microbial Complexes Bacterial Species Actinomyces Actinomyces gerencseriae Actinomyces Actinomyces israelii Actinomyces Actinomyces naeslundii I Actinomyces Actinomyces visocosus Purple Actinomyces odontolyticus Purple Veillonella parvula Yellow Streptococcus gordonii Yellow Streptococcus intermedius Yellow Streptococcus mitis Yellow Streptococcus oralis Yellow Streptococcus sanguis Green Aggregatibacter actinomycetemcomitans Green Capnocytophaga gingivalis Green Capnocytophaga ochracea Green Capnocytophaga sputigena Green Eikenella corrodens Orange Campylobacter gracilis Orange Campylobacter rectus Orange Campylobacter showae Orange Eubacterium nodatum Orange Fusobacterium nucleatum ss nucleatum Orange Fusobacterium nucleatum ss polymorphum Orange Fusobacterium nucleatum ss vincentii Orange Fusobacterium periodonticum Orange Parvimonas micra Orange Prevotella intermedia Orange Prevotella nigrescens Orange Streptococcus constellatus Red Tannerella forsythia Red Porphyromonas gingivalis Red Treponema denticola Others Eubacterium saburreum Others Gemella morbillorum Others Leptotrichia buccalis Others Neisseria mucosa Others Propionibacterium acnes Others Prevotella melaninogenica Others Streptococcus anginosus Others Selenomonas noxia Others Treponema socranskii aThe species are listed in complex order (Actinomyces, Pulple, Yellow, Green, Orange, Red, Others)
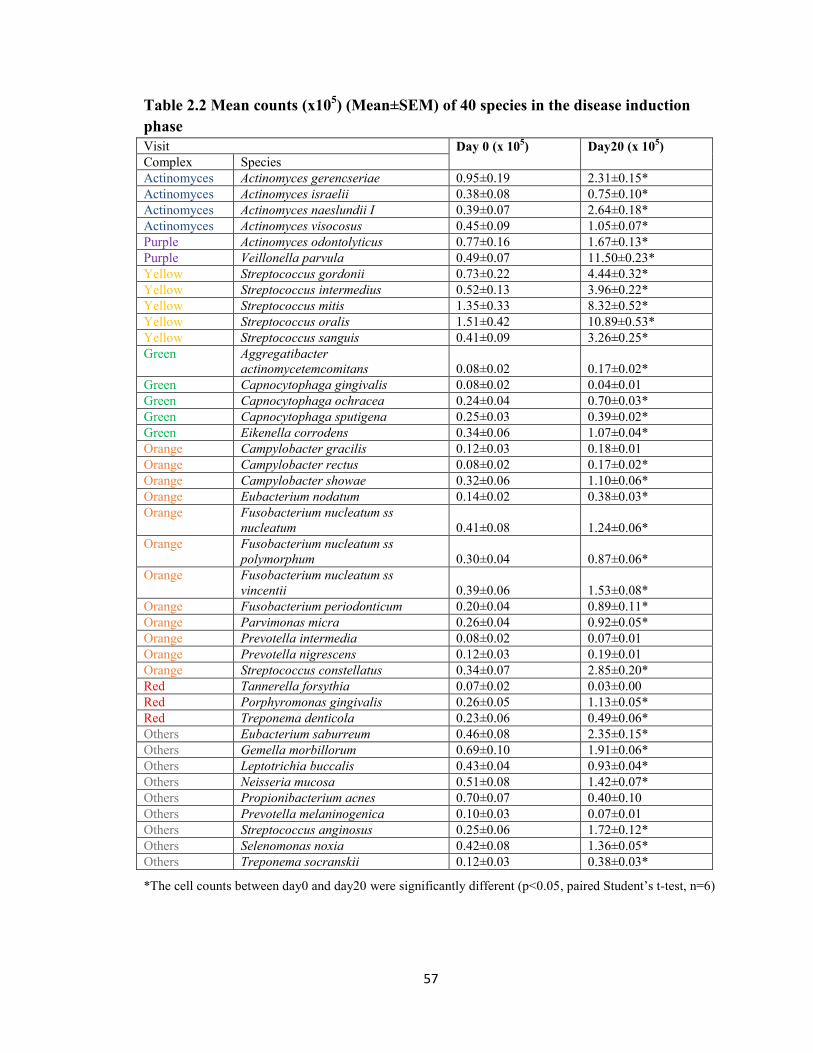
57
Table 2.2 Mean counts (x105) (Mean±SEM) of 40 species in the disease induction phase Visit Day 0 (x 105) Day20 (x 105) Complex Species Actinomyces Actinomyces gerencseriae 0.95±0.19 2.31±0.15* Actinomyces Actinomyces israelii 0.38±0.08 0.75±0.10* Actinomyces Actinomyces naeslundii I 0.39±0.07 2.64±0.18* Actinomyces Actinomyces visocosus 0.45±0.09 1.05±0.07* Purple Actinomyces odontolyticus 0.77±0.16 1.67±0.13* Purple Veillonella parvula 0.49±0.07 11.50±0.23* Yellow Streptococcus gordonii 0.73±0.22 4.44±0.32* Yellow Streptococcus intermedius 0.52±0.13 3.96±0.22* Yellow Streptococcus mitis 1.35±0.33 8.32±0.52* Yellow Streptococcus oralis 1.51±0.42 10.89±0.53* Yellow Streptococcus sanguis 0.41±0.09 3.26±0.25* Green Aggregatibacter
actinomycetemcomitans 0.08±0.02 0.17±0.02* Green Capnocytophaga gingivalis 0.08±0.02 0.04±0.01 Green Capnocytophaga ochracea 0.24±0.04 0.70±0.03* Green Capnocytophaga sputigena 0.25±0.03 0.39±0.02* Green Eikenella corrodens 0.34±0.06 1.07±0.04* Orange Campylobacter gracilis 0.12±0.03 0.18±0.01 Orange Campylobacter rectus 0.08±0.02 0.17±0.02* Orange Campylobacter showae 0.32±0.06 1.10±0.06* Orange Eubacterium nodatum 0.14±0.02 0.38±0.03* Orange Fusobacterium nucleatum ss
nucleatum 0.41±0.08 1.24±0.06* Orange Fusobacterium nucleatum ss
polymorphum 0.30±0.04 0.87±0.06* Orange Fusobacterium nucleatum ss
vincentii 0.39±0.06 1.53±0.08* Orange Fusobacterium periodonticum 0.20±0.04 0.89±0.11* Orange Parvimonas micra 0.26±0.04 0.92±0.05* Orange Prevotella intermedia 0.08±0.02 0.07±0.01 Orange Prevotella nigrescens 0.12±0.03 0.19±0.01 Orange Streptococcus constellatus 0.34±0.07 2.85±0.20* Red Tannerella forsythia 0.07±0.02 0.03±0.00 Red Porphyromonas gingivalis 0.26±0.05 1.13±0.05* Red Treponema denticola 0.23±0.06 0.49±0.06* Others Eubacterium saburreum 0.46±0.08 2.35±0.15* Others Gemella morbillorum 0.69±0.10 1.91±0.06* Others Leptotrichia buccalis 0.43±0.04 0.93±0.04* Others Neisseria mucosa 0.51±0.08 1.42±0.07* Others Propionibacterium acnes 0.70±0.07 0.40±0.10 Others Prevotella melaninogenica 0.10±0.03 0.07±0.01 Others Streptococcus anginosus 0.25±0.06 1.72±0.12* Others Selenomonas noxia 0.42±0.08 1.36±0.05* Others Treponema socranskii 0.12±0.03 0.38±0.03*
*The cell counts between day0 and day20 were significantly different (p<0.05, paired Student’s t-test, n=6)

58
Table 2.3 Mean counts (x 105) (Mean±SEM) of 40 species in the treatment phase Group/Visit Vehicle/Day20
(x 105) RvE1/Day20 (x 105)
Vehicle/Day40 (x 105)
RvE1/ Day 40 (x 105) Complex Species
Actinomyces Actinomyces gerencseriae 2.22±0.26 2.00±0.07 6.45±0.70 4.91±0.36 Actinomyces Actinomyces israelii 0.67±0.12 0.51±0.04 2.43±0.25 1.78±0.15 Actinomyces Actinomyces naeslundii I 2.68±0.38 2.30±0.09 3.16±0.38 2.22±0.18 Actinomyces Actinomyces visocosus 1.06±0.12 0.90±0.05 2.89±0.29 2.23±0.16 Purple Actinomyces odontolyticus 1.54±0.15 1.33±0.04 4.94±0.44 3.88±0.35 Purple Veillonella parvula 11.40±0.19 12.10±0.17 18.63±0.98 17.93±0.52 Yellow Streptococcus gordonii 4.22±0.36 5.49±0.35 12.66±0.47 11.50±0.96 Yellow Streptococcus intermedius 3.57±0.30 4.56±0.24 9.39±0.28 6.74±0.66 Yellow Streptococcus mitis 7.92±0.67 9.66±0.76 15.92±0.89 17.81±0.51 Yellow Streptococcus oralis 10.50±0.73 12.09±0.67 20.04±1.50 21.56±0.72 Yellow Streptococcus sanguis 3.48±0.26 3.86±0.31 8.02±0.41 6.65±0.62 Green Aggregatibacter
actinomycetemcomitans 0.23±0.03 0.19±0.02 1.36±0.03 0.95±0.07* Green Capnocytophaga gingivalis 0.05±0.01 0.05±0.01 1.10±0.03 0.76±0.01* Green Capnocytophaga ochracea 0.69±0.07 0.74±0.01 2.27±0.13 1.96±0.12 Green Capnocytophaga sputigena 0.39±0.00 0.42±0.02 1.73±0.03 1.36±0.03* Green Eikenella corrodens 1.05±0.06 1.17±0.03 3.02±0.15 2.12±0.11* Orange Campylobacter gracilis 0.19±0.02 0.22±0.02 1.17±0.04 0.82±0.03* Orange Campylobacter rectus 0.19±0.02 0.21±0.01 1.17±0.05 0.76±0.03* Orange Campylobacter showae 1.28±0.00 1.12±0.03 3.36±0.15 2.29±0.06* Orange Eubacterium nodatum 0.39±0.03 0.46±0.02 1.56±0.04 1.17±0.01* Orange Fusobacterium nucleatum ss
nucleatum 1.30±0.06 1.35±0.09 4.83±0.63 3.15±0.29 Orange Fusobacterium nucleatum ss
polymorphum 0.94±0.07 0.90±0.08 4.46±0.80 3.03±0.39 Orange Fusobacterium nucleatum ss
vincentii 1.58±0.07 1.73±0.12 4.73±0.58 2.84±0.15 Orange Fusobacterium periodonticum 1.12±0.03 0.95±0.17 6.16±1.71 4.21±0.97 Orange Parvimonas micra 0.98±0.04 1.03±0.04 2.64±0.11 1.83±0.05* Orange Prevotella intermedia 0.07±0.01 0.08±0.01 0.92±0.06 0.46±0.02* Orange Prevotella nigrescens 0.18±0.02 0.20±0.01 1.43±0.04 1.07±0.02* Orange Streptococcus constellatus 2.85±0.16 3.42±0.27 7.71±0.33 5.29±0.38* Red Tannerella forsythia 0.03±0.01 0.03±0.00 0.85±0.03 0.48±0.02* Red Porphyromonas gingivalis 1.15±0.08 1.25±0.06 3.42±0.16 2.02±0.06* Red Treponema denticola 0.35±0.05 0.64±0.08 4.22±1.05 2.15±0.30 Others Eubacterium saburreum 2.48±0.16 2.71±0.16 6.49±0.29 3.48±0.04* Others Gemella morbillorum 1.89±0.06 2.08±0.08 5.65±0.17 4.26±0.03* Others Leptotrichia buccalis 1.05±0.03 0.94±0.03 2.43±0.09 2.03±0.06 Others Neisseria mucosa 1.63±0.06 1.46±0.05 5.09±0.23 3.54±0.15* Others Propionibacterium acnes 0.55±0.21 0.30±0.09 1.48±0.08 1.20±0.07 Others Prevotella melaninogenica 0.05±0.01 0.10±0.02 1.42±0.13 1.37±0.04 Others Streptococcus anginosus 1.80±0.10 2.02±0.13 4.55±0.28 3.20±0.17* Others Selenomonas noxia 1.28±0.08 1.53±0.03 4.17±0.34 2.90±0.10 Others Treponema socranskii 0.41±0.02 0.41±0.02 1.67±0.09 1.11±0.02*
*Mean cell counts between the RvE1 group (n=3) and the Vehicle group (n=3) on d40 was significantly different (p<0.05, Student’s t test)

59
Table 2.4 Relative proportions of periodontal microbial complexes in the disease induction phase Visit Day 0
(%) Day 8 (%)
Day 12 (%)
Day 16 (%)
Day 20 (%) aComplex
Actinomyces 15.2 6.5 8.0 8.0 8.9 Purple 8.4 13.5 16.8 16.2 17.4 Yellow 27.6 41.4 43.3 42.4 40.8 Green 6.4 4.5 3.3 3.6 3.1 Orange 16.8 15.4 11.7 13.4 13.7 Red 3.4 2.6 1.6 2.0 2.2 Others 22.3 15.9 15.3 14.5 13.9 Total 100 100 100 100 100
aThe definition of periodontal microbial complex was described in the previous publications (Socransky et al., 1998, Socransky and Haffajee, 2005)
Table 2.5 Relative proportions of periodontal microbial complexes between the Vehicle group and the RvE1 group Group/Visit Vehicle/Day20
(%) RvE1/Day20 (%)
Vehicle/Day 40 (%)
RvE1/ Day 40 (%) Complex
Actinomyces 8.79 6.93 7.64 7.01 Purple 17.16 16.28 12.05 13.71 Yellow 39.36 43.21 33.76 40.41 Green 3.20 3.11 4.85 4.50 Orange 14.71 14.15 20.53 16.92 Red 2.03 2.33 4.34 2.93 Others 14.76 14.00 16.85 14.52 Total 100 100 100 100
Table 2.6 Relative abundance of phylum level during the treatment phase Group/Visit Vehicle/D20
(%) RvE1/D20 (%)
Vehicle/D32 (%)
RvE1/D32 (%)
Vehicle/D40 (%)
RvE1/D40 (%) Phylum
Actinobacteria 14.8±6.6 10.0±2.0 10.8±1.1 15.5±5.0 52.3±2.5 19.9±10.3 Firmicutes 84.0±7.0 89.5±1.8 87.9±2.2 84.1±5.1 46.1±1.4 79.1±18.4 Fusobacteria 0.1±0.1 0.2±0.2 0.2±0.2 0.1±0 0.7±0.7 0.4±0.2 Proteobacteria 0.6±0.4 0.3±0.1 1.0±1.0 0.2±0.2 1.0±0.4 0.7±0.3 Verrucomicrobia 0.4±0.4 0±0 0±0 0±0 0±0 0±0

60
0d: healhty baseline plaque sample
collection
8d: 1st plaque sample
collection
12d: 2nd plaque sample
collection
16d: 3rd plaque sample
collection
20d: 4th plaque sample
collection
24d: 5th plaque sample
collection
28d: 6th plaque sample
collection
32d: 7th plaque sample
collection
36d: 8th plaque sample
collection
40d: the last
plaque sample
collection
Figure 2.1: Experimental Timeline. Eighteen rats were assigned to four groups (no ligature: n=6, ligature alone: n=6, ligature + Vehicle: n=3, ligature + RvE1: n=3). The first three weeks of the experiment were the disease induction phase and the subsequent three weeks of the experiment were the treatment phase. RvE1 (0.25µg/µl) or vehicle (ethanol only) was applied to the ligated teeth every other day during the treatment phase. Subgingival plaque samples were collected from one tooth of each rat at each time point (day 0, 8, 12, 16, 20, 24, 28, 32, 36, 40).
Sacrifice the rats in the RvE1
group (n=3) and the Vehicle group (n=3)
RvE1 treatment starts
Sacrifice 6 rats in the ligature alone group at
the end of disease induction phase
Sacrifice 6 rats in the no
ligature group

61
Figure 2.2: Bone morphometric analysis: exposed root surface & distance between CEJ and alveolar bone. The exposed root surfaces on the buccal and palatal of three maxillary molars were measured. The distance between alveolar bone margin and cementoenamel junction (CEJ) was measured at the nine indicated sites.
Buccal Palatal

62
0
2
4
6
8
10
no ligature ligature alone
Are
a (m
m2 )
Exposed root surface of three molars
0
2
4
6
8
10
12
14
no ligature ligature alone
Dis
tan
ce (
mm
)
Distance between CEJ and alveolar bone
Figure 2.3: Alveolar bone level at baseline and three weeks after disease induction. Alveolar bone destruction was seen following three weeks of ligature placement in rats. The exposed root surface and the distance between CEJ and alveolar bone in the ligature alone group were significantly larger than these in the no ligature group.
Buccal: baseline Palatal: baseline
Buccal: 3-week disease induction Palatal: 3-week disease induction
*P<0.01 *P<0.01

63
0
1
2
3
4
5
6
7
8
9
10
Are
a (m
m2)
Exposed root surface of three molars
0
2
4
6
8
10
12
14
Dis
tan
ce (
mm
)
Distance between CEJ and alveolar bone
Figure 2.4: Bone morphometric analysis. The exposed root surface of the molars in the RvE1 group was significantly smaller than that in the Vehicle and the ligature alone group. The distance between CEJ and alveolar bone in the RvE1 group was also significantly shorter than that in the Vehicle group and the ligature group. RvE1 treatment significantly reversed alveolar bone loss associated with experimental periodontitis. The p-value was calculated by pair-wise t-test following one-way analysis of variance (ANOVA).
RvE1 group Vehicle group
*P<0.01
*P<0.01 *P<0.01
*P=0.03

64
0
0.1
0.2
0.3
0.4
no ligature ligature alone ligature+Vehicle ligature+RvE1
Are
a (m
m2 )
Area of interproximal bone
Figure 2.5: Histological area of interproximal bone. The area of interproximal bone in the RvE1 group was larger than that in the ligature alone group and the Vehicle group (p=0.18). The p-value was calculated by pair-wise t-test following one-way analysis of variance (ANOVA).
RvE1 group
P=0.18
Vehicle group
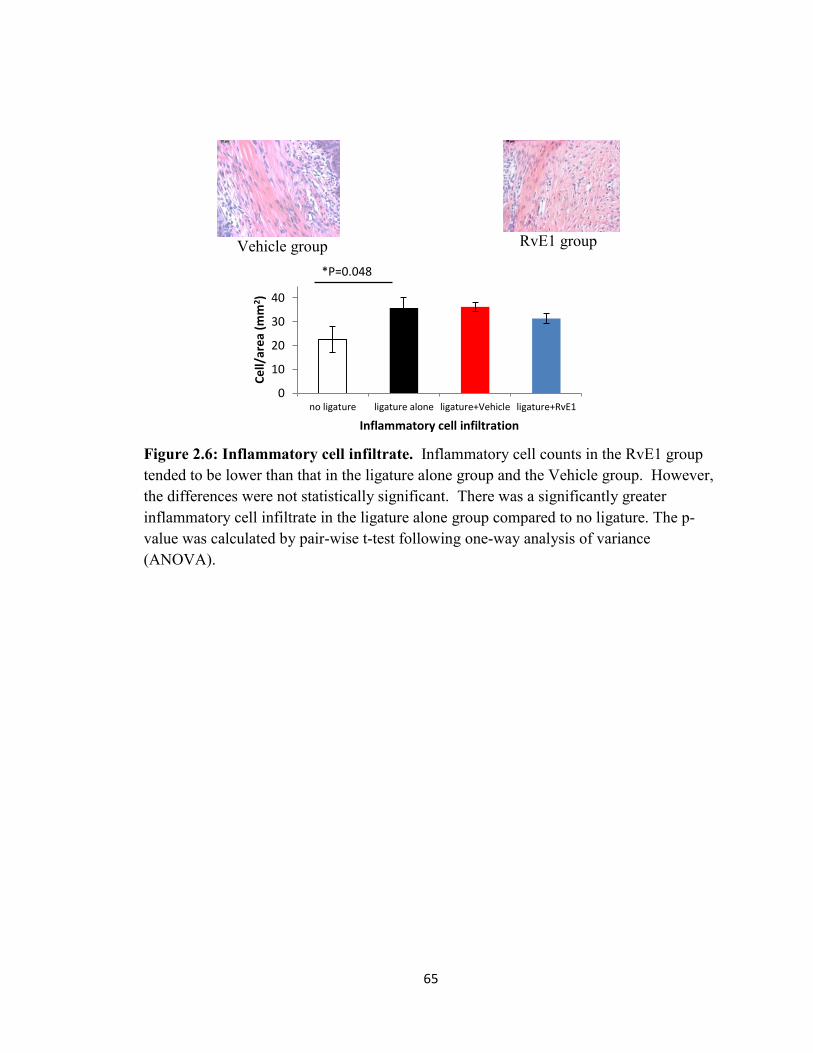
65
0
10
20
30
40
no ligature ligature alone ligature+Vehicle ligature+RvE1
Ce
ll/ar
ea
(mm
2 )
Inflammatory cell infiltration
Figure 2.6: Inflammatory cell infiltrate. Inflammatory cell counts in the RvE1 group tended to be lower than that in the ligature alone group and the Vehicle group. However, the differences were not statistically significant. There was a significantly greater inflammatory cell infiltrate in the ligature alone group compared to no ligature. The p-value was calculated by pair-wise t-test following one-way analysis of variance (ANOVA).
Vehicle group RvE1 group
*P=0.048

66
0
10
20
30
40
50
60
70
80
90
100
no ligature ligature alone ligature+Vehicle ligature+RvE1
Ce
ll/ar
ea
(mm
2 )
Osteoclast density
Figure 2.7: Osteoclast density. Osteoclast density was defined by dividing active osteoclast count (TRAP positive multinucleated osteoclasts) around the interproximal bone by the total area of the interproximal bone. The osteoclast density in the RvE1 group was significantly lower than that in the Vehicle and the ligature alone group. The p-value was calculated by pair-wise t-test following one-way analysis of variance (ANOVA).
Vehicle group RvE1 group
*P=0.046
*P=0.02

67
0
2
4
6
8
10
12
Re
lati
ve m
RN
A e
xpre
ssio
n
Cxcl1
0
2
4
6
8
10
12
Re
lati
ve m
RN
A e
xpre
ssio
n
Ptgs2
0
2
4
6
8
10
12
Re
lati
ve m
RN
A e
xpre
ssio
n
Nos2
Figure 2.8: Relative quantity of inflammation-related gene expression (2-ΔΔCT). Relative mRNA expression (2-ΔΔCT) was used to analyze the gene expression levels of inflammation related genes in different groups. Gene expression of Cxcl1 in the RvE1 group was significantly lower than that in the Vehicle group. Gene expression of Ptgs2 in the RvE1 group was significantly lower than that in the ligature alone group. Gene expression of Nos2 in the RvE1 group was lower than that in the ligature alone group and the Vehicle group but was not statistically significant. The p-value was calculated by pair-wise t-test following one-way analysis of variance (ANOVA).
*P=0.02
P=0.32
*P=0.02
P=0.10
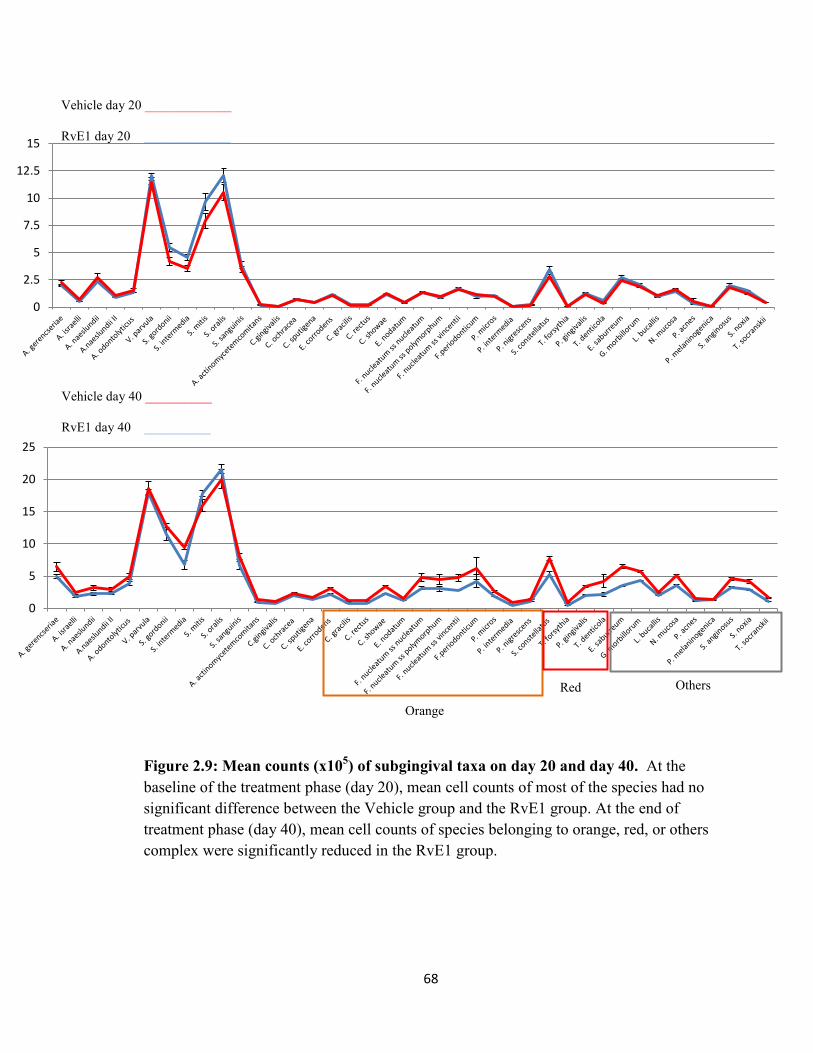
68
0
2.5
5
7.5
10
12.5
15
0
5
10
15
20
25
Figure 2.9: Mean counts (x105) of subgingival taxa on day 20 and day 40. At the baseline of the treatment phase (day 20), mean cell counts of most of the species had no significant difference between the Vehicle group and the RvE1 group. At the end of treatment phase (day 40), mean cell counts of species belonging to orange, red, or others complex were significantly reduced in the RvE1 group.
Vehicle day 20 _____________
RvE1 day 20 _____________
Vehicle day 40 __________
RvE1 day 40 __________
Orange
Red Others

69
Figure 2.10: Taxonomic composition of the subgingival microbiota during disease induction phase (genus level). The taxonomic composition of subgingival microbiota in six samples is shown. The listed color-coded genera were the dominant genera during disease induction phase (day 0 to day 20). More information relating to color-coding taxonomy can be found in Appendix 1.

70
Figure 2.11: Mean difference of taxonomic relative abundance between day 0 and day 20. Mean relative abundance difference between day 0 and day 20 was calculated by subtracting mean relative abundance on day 0 from mean relative abundance on day 20 in the same sample. Positive values indicate the mean relative abundance on day 20 was larger than the relative abundance on day 0. Some OTUs did not match any known genera in the reference data base, therefore, only the names of family level (f__) were listed for these OTUs. The p-values were calculated by paired Student’s t test (***P<0.05; **0.05≤P<0.1; *0.1≤P<0.2).

71
-2.0% -1.5% -1.0% -0.5% 0.0% 0.5% 1.0% 1.5% 2.0%
Coprococcus
Lactobacillus
Blautia
Sutterella
Veillonella
Streptococcus
Corynebacterium
f__Micrococcaceae;g__
Collinsella
Facklamia
Dorea
Aggregatibacter
Mean relative abundance difference
RvE1 vs. Vehicle D40
-10.0% -8.0% -6.0% -4.0% -2.0% 0.0% 2.0% 4.0% 6.0% 8.0% 10.0%
Enterococcus
Veillonella
Allobaculum
Lactobacillus
Mean relative abundance difference
RvE1 vs. Vehicle D32
Figure 2.12: Mean difference of taxonomic relative abundance between the RvE1 group and the Vehicle group. Mean relative abundance difference between the RvE1 group and the Vehicle group was calculated by subtracting mean relative abundance of the Vehicle group from mean relative abundance of the RvE1 group. Positive values indicate the mean relative abundance of the RvE1 group was larger than the relative abundance of the Vehicle group. The p-values were calculated by Student’s t test ( ***p<0.1; **0.1≤p<0.2; *0.2≤p<0.3)
*
***
**
*
*
*
*
**
***
*
**
**
**
* *
*
*
*
46.7%
-5.4%
-22.5%

72
0
0.1
0.2
0.3
0.4
0.5
0.6
0.7
Shan
no
n E
ven
ne
ss
Evenness
0
0.5
1
1.5
2
2.5
3
3.5
4
4.5
No
n-p
aram
etr
ic S
han
no
n
0
20
40
60
80
100
120
140
160
180
200
Ob
serv
ed
OTU
s
Richness
Figure 2.13: Alpha diversity of subgingival microbial community. The difference in Shannon evenness, non-parametric Shannon index and number of observed OTUs between the Vehicle group and the RvE1 group at each time point (n=3 in each group) was compared (Student’s t-test). The Shannon evenness and non-parametric Shannon index in the Vehicle group were significantly lower than in the RvE1 group on day 40.
*P=0.02
*P=0.02
P=0.42

73
Figure 2.14: Principal coordinate analysis (PCoA). Principal coordinate analysis plots depicting distances among microbial communities based on qualitative community metrics show that the inflammation induced by ligature placement drove the composition change in the microbial community. The microbial community in the RvE1 group clustered apart from the microbial community in the Vehicle group at the end of treatment phase (day 40). Larger values of each component (PC) explain more of the variance in the data.
Day 0
Day 32 Day 40
Day 20
Vehicle
RvE1

74
Figure 2.15: Beta diversity of subgingival microbial community during the disease induction phase. Distances were calculated by weighted UniFrac. RvETx vs. RvETx represents the distance between samples in the RvE1 group. Vehicle vs. Vehicle represents the distance between samples in the Vehicle group. RvETx vs. Vehicle represents the distances between samples in the RvE1 group and samples in the Vehicle group. There were no statistically significant differences between any group comparison (p>0.05).
Day 0 Day 20

75
Discussion
Regeneration of tissues lost to disease induced SPMs has been demonstrated in
several models in addition to periodontitis (Serhan et al., 2012, Serhan, 2014), but the
mechanism of regeneration induced by SPMs is not entirely clear. It is believed that
enhanced recruitment of non-phlogistic macrophages in the resolution phase might play a
critical role given that macrophages of the proper phenotype are necessary for various
types of tissue regeneration (Yin et al., 2006, Godwin et al., 2013, Aurora et al., 2014)
The present study suggests that RvE1 application regenerated alveolar bone lost to
periodontitis that along with inhibition of inflammation and reduction of osteoclast
activity. Regeneration of alveolar bone following SPM application has been
demonstrated in a P .gingivalis induced periodontitis rabbit model (Hasturk et al., 2007)
and a surgery and plaque induced periodontitis minipig model (Van Dyke et al., 2015).
The present model had a relatively more horizontal bone loss induced by ligature
placement compared to the bone loss in the rabbit or minipig model and thus presented a
more challenging model to regenerate lost alveolar bone than the previous studies. It has
been reported that the distance between CEJ and alveolar bone in the molar region of the
rat gradually increases during physiological growth (Kuhr et al., 2004). Although this
could not be controlled in this experiment, the potential for underestimation of the impact
of RvE1 treatment exists. Taken together, the data suggest that RvE1 demonstrates
promise as a topical therapy to regenerate tissues lost to periodontal inflammation.
It is well established that RvE1 inhibits neutrophil infiltration, osteoclast
differentiation, and enhances efferocytosis of apoptotic cells during inflammation

76
resolution (Serhan et al., 2008). In the present study, RvE1 treatment significantly
reduced osteoclast density compared to vehicle. The inhibition of immune cell
infiltration and inflammation related gene expression were observed following RvE1
application. While all inflammation related genes tested were reduced, only the reduction
in expression of Cxcl1 was statistically significantly different from the Vehicle group at
the end of RvE1 treatment. Given Cxcl1 is a very important neutrophil chemoattractant in
rodents, downregulation of the Cxcl1 gene product likely plays a major role in reduction
of local inflammation following RvE1 application. The peak of inflammation in the
ligature model usually occurs in the first two weeks as reflected in the degree of alveolar
bone destruction (de Lima et al., 2000). In the present study, therapy began at week 3 to
ensure the periodontitis was chronic, mimicking the human situation.
The concept, a breakdown in the balance between “protective” bacterial species
and “harmful” bacterial species, has been termed ‘‘dysbiosis”. Dysbiosis within the
resident biofilm is associated with several inflammation related diseases in humans, such
as inflammatory bowel disease, colitis, obesity, and cancer (Tamboli et al., 2004, Round
and Mazmanian, 2009, Sobhani et al., 2011, Henao-Mejia et al., 2012). Periodontitis is
one of the best characterized human diseases associated with dysbiosis, which is also
known as a microbial-shift disease (Darveau, 2010, Jiao et al., 2014). Taxonomic
composition and cell counts within the subgingival microbiota have been related to the
status of periodontal disease in a myriad of studies (Socransky et al., 1998, Paster et al.,
2001, Socransky and Haffajee, 2005, Teles et al., 2013). Periodontal treatment results in
a shift within the microbiota back to a health-related subgingival microbiota. Stability of

77
the shift requires appropriate professional maintenance (Haffajee et al., 2006, Colombo et
al., 2012). From an ecological point of view, the alpha diversity decreases, but the beta
diversity increases in the resolved state of periodontal disease compared to the diversity
in active periodontal disease (Griffen et al., 2012, Liu et al., 2012, Abusleme et al., 2013,
Li et al., 2014, Shi et al., 2015). In active (untreated) periodontal disease, many disease-
associated species are able to grow well by obtaining required nutrients from the
inflamed environment. Therefore, the diseased microbial community is more diverse at
the local site (alpha diversity) than is the healthy microbial community. However, the
microbial community of different diseased samples becomes more similar (beta diversity)
compared to the microbial community of different healthy samples because the diseased
environment favors the growth of similar taxa.
In the present study, the changes in the subgingival microbiota were significant,
following the induction of experimental periodontitis (Table 2.2, 2.4, Fig. 2.10, 2.11).
The increased cell counts of species and shift of relative proportions of microbial
complexes were significant based on the results of checkerboard DNA-DNA
hybridization. Regarding the diversity of ecological community, the richness and
evenness of microbial community increased during the disease induction phase. At the
end of the treatment phase, the lower number of OTUs observed in the RvE1 group
compared to the Vehicle group, coupled with our understanding of an increased alpha
diversity with the onset of periodontal disease, suggests that RvE1 was associated with
resolution of periodontal disease (Fig. 2.13). The microbial community became less

78
diverse at the end of disease induction compared to the microbial community of different
samples at baseline (Fig. 2.15).
At the end of the treatment phase, RvE1 treatment significantly inhibited bacterial
cell growth (Table 2.3), and reversed the shift of the relative proportions of periodontal
microbial complexes (Table 2.5). The dominance of Streptococcus species in the
subgingival microbiota following RvE1 treatment could be observed both in the results of
checkerboard DNA-DNA hybridization and 16s rRNA gene sequencing (Table. 2.5, Fig.
12). The profile of the subgingival microbiota in the RvE1 group is different from the
profile of the subgingival microbiota in the Vehicle group at the end of treatment phase
(Table 2.6, Fig. 2.12, 2.14). Considering the difference of periodontal environment (Fig.
2.4, 2.7, 2.8) and the differences in the subgingival microbiota between the RvE1 group
and the Vehicle group following RvE1 application, the change of subgingival microbiota
appeared to be induced by changes in the local environment.
The purpose of the pilot studies using DNA Checkerboard analysis was to screen
for microbial changes using a relatively less expensive and faster technique before the
unbiased 16S DNA sequencing was used. The pilot studies served their purpose, but the
information obtained beyond the observation that changes occurred should not be ignored.
After experimental periodontitis was induced, the species or genera of the human red
complex and orange complex were detected by checkerboard DNA-DNA hybridization,
but they were barely detected by next-generation sequencing suggesting that the human
probes were cross-reacting with rat associated species that are quite distinct. The ability
of checkerboard DNA-DNA hybridization to detect bacteria in rat biofilm is not a new

79
observation since it was previously shown that 25 species were detected by human
bacterial DNA probes in the biofilm collected from the rat ligature induced periodontitis
model utilizing checkerboard DNA-DNA hybridization (Duarte et al., 2010). It is fair to
say that the species of rat biofilm detected by checkerboard DNA-DNA hybridization are
not the same species detected in human biofilm. However, the changes in counts of
species and the change of relative proportions in clusters are likely valid.
Although identifying taxa by 16s rRNA gene sequencing can avoid the problem
of cross reactions, interpretation of the relative abundance in the taxonomic composition
is difficult. Further, OUT assignment based on existing reference databases such as
SILVA and Greengenes using 97% similarity in sequences of the V3 and V4 regions of
the 16S gene can also result in OUT misclassifications, even at the genus level. One
should also take into account the fact that these databases were not build solely with
sequences from murine microorganisms, increasing the chances of misclassifications.
According to results published only in abstract form, a mock community consisting of the
same amount of the 40 human periodontitis associated species could be detected
accurately by checkerboard DNA-DNA hybridization, but not all the species were
detected by 16s rRNA gene sequencing. Also, the relative abundance of these species
was biased in the sequencing results (Teles F, 2015 ). The bias in sequencing might be
caused by different copy numbers of 16s rRNA in different species, the primers used to
amplified DNA, the relative composition of bacteria in a community, and the DNA
extraction method (Diaz et al., 2012, Abusleme et al., 2014).

80
In order to describe the microbiota in rat oral biofilm comprehensively, it was
necessary to use a next-generation sequencing technique. Because there is no rat oral
bacterial DNA probe set available and there is lack of information on the rat subgingival
microbiota, it was not possible to directly compare techniques. Since the threshold of
97% sequence similarity was used to assign the OTUs in the present study, only results of
genus level were reported. At the end of the treatment phase, several genera had smaller
mean relative abundance in the RvE1 group than the mean relative abundance in the
Vehicle group (Fig. 2.12). Some of the genera, such as Coprococcus, Blautia, Sutterella,
Collinsella and Dorea, were anaerobic and reduced relative abundance with RvE1
treatment. These genera might be the experimental periodontitis associated pathogens in
rat ligature model; many of the periodontitis associated pathogens in humans are also
anaerobic and have small relative abundance (Teles et al., 2013). The results indicate that
the local environment became less favorable for multiple species to grow following the
continuation of RvE1 application.
It is interesting to observe that Streptococcus was the dominant genus in the RvE1
group at the end of the treatment phase, but not in the Vehicle group. Since Streptococcus
was the dominant genus caused by ligature placement, the results can be explained by the
overgrowth of pathogens in the Vehicle group reducing the percentage of Streptococcus.
The same phenomenon was also observed in the change of relative proportions of
periodontal microbial complexes. Taken together these results indicate that the difference
in periodontal environment created by control of inflammation resulted in the changes in
taxonomic composition of the subgingival microbiota.

81
CHAPTER THREE: PREVENTION OF SUBGINGIVAL MICROBIOTA SHIFT FOLLOWING RESOLVIN E1 APPLICATION
Introduction
The ‘‘ecological plaque hypothesis’’ was proposed to describe and explain the
dynamics between the host environment and the oral microbiota in healthy and diseased
conditions from the ecological point of view (Marsh, 1994, Marsh, 2003). The hypothesis
emphasizes there is a direct link between local environmental conditions and the activity
and composition of the microbial community. The changes in local environment will
trigger the changes in the microbiota, and vice versa. For example, as a periodontal
pocket forms an environment is created favoring putative pathogen growth and
expression of virulence factors. Flourishing periodontal pathogens compete with health-
related pathogens leading to the shift in the microbiota. In order to prevent periodontitis,
it is best to avoid the initial establishment of diseased environment (gingivitis) and thus
prevent the deleterious microbial shift.
In Chapter 2, it was demonstrated that application of resolvin E1 (RvE1) reverses
the shift in the subgingival microbiota by inhibiting inflammation and reversing bone loss
in ongoing experimental periodontitis. The results imply the recovery of a diseased local
environment leads the change of subgingival microbiota. If the ecological plaque
hypothesis regarding the relationship between host environment and characteristics of the
microbiota is true, prevention of formation of a diseased environment should stop the
shift of the microbiota. In order to test this hypothesis, we proposed two specific aims:

82
Specific Aim 1 – To examine the changes of rat subgingival microbiota during
periodontitis progression with or without prophylactic RvE1 treatment using next-
generation sequencing
We hypothesize that prophylactic RvE1 application will prevent or reduce
periodontitis progression in the ligature induced periodontitis rat model, and the
subgingival microbiota composition will be relatively stable.
Specific Aim 2 – To examine the changes of the clinical and local inflammatory
response in the periodontium of rats with or without prophylactic treatment
We hypothesize that the resolution of inflammation will prevent changes in the
subgingival microbiota. Bone morphometry, histomorphometry, and real time
quantitative reverse transcription polymerase chain reaction (qRT-PCR) are used to
analyze the change of local environment and inflammatory response.
Materials and methods
Animals and experimental periodontitis model
This experiment was approved by Institutional Animal Care and Use Committee
(IACUC) of the Forsyth Institute. Twelve six-week old male Wistar rats (weight 180-200
g, Charles River Laboratories, New York, NY) were used, and all animals were housed in
controlled temperature (22o C to 25o C) and dark/light cycle (12/12 hours) conditions.
These rats received standard laboratory chow diet and water ad libitum. Rats were
sedated by isoflurane 2-3% before being anesthetized with ketamine (80mg/kg,
intraperitoneally) and xylazine (16 mg/kg, intraperitoneally).

83
Sixteen rats were divided into four groups (no ligature, ligature + Vehicle, ligature
+ RvE1 (0.1µg/µl), ligature + RvE1 (0.5µg/µl)), and each group had four rats. 5–0 silk
ligature placed subgingivally on the first day of this experiment to induce periodontitis on
the maxillary right and left second molars of all rats. The experimental period was four
weeks. During the experiment, 1 µg/µl RvE1 (Cayman Chemical Co. Inc., Ann Arbor,
MI) dissolved in 9 µl of saline was applied on the ligated teeth of the rats in the RvE1
(0.1µg/µl=0.28mM) group, 1 µg/µl RvE1 dissolved in 1 µl of saline was applied on the
ligated teeth of the rats in the RvE1 (0.5µg/µl=1.4mM) group, and 10 µl of 10% ethanol
(vehicle alone) was applied on the ligated teeth of the rats in the Vehicle group. RvE1
solution and vehicle were applied three times a week (M, W, F). Four rats in the no
ligature group were sacrificed on the first day of the experiment to collect healthy
baseline tissue samples. At the end of four weeks, all rats in other groups were sacrificed
to collect tissue samples. The timeline of the experiment is summarized in Fig. 3.1.
The collected samples included subgingival plaque, gingival tissue, maxillae, and
serum. Subgingival plaque samples were collected on day 0, 7, 10, 14, 17, 21, 24, and 28.
Other samples were collected immediately after sacrificing the rats. The maxillae were
split into two halves: one half was taken for the analyses of bone morphometry and
gingival gene expression. The palatal gingiva of the ligated molar was harvested and
stored in 200µl of RNAlater (Sigma-Aldrich) for the qRT-PCR assay. The remaining
specimen was defleshed by beetles to obtain clean bone block. The other half was
processed for histomorphometric analysis. Blood was obtained by heart aspiration and
84
centrifuged to collect serum. Serum was aliquoted and stored at -80 oC (eight aliquots of
100µl each) for future analysis.
Bacterial DNA extraction and amplification
Subgingival plaque samples were collected by using the tip of 2-Whiteside scaler
(Hu-Friedy, Chicago, IL) from the palatal site of the maxillary second molars. Before
placing the ligature on the maxillary second molars, the plaque sample was collected
from two teeth (two maxillary second molars) of each rat at baseline and then the samples
were pooled in one collection tube. The sample was collected from one ligated tooth of
each rat each time after ligature placement. The DNA of subgingival plaque was
extracted using the MolYsis Basic (CaerusBio Inc., Dowingtown, PA) and QIAamp®
mini kit (QIAGEN Inc., Valencia, CA).
The extracted bacterial DNA was amplified with the multiple displacement
amplification kit (GenomiPhiTM V3 DNA amplification kit, GE Healthcare Bio-Sciences,
Pittsburgh, PA). The concentration of amplified DNA samples was measured with
fluorescent nucleic acid stain (Quant-iT™ PicoGreen® dsDNA Assay, Life Technologies,
Grand Island, NY).
Next-generation sequencing
The microbial composition of the plaque samples (50ng/10µl) were characterized
by sequencing the hyper-variable V3 and V4 regions of the 16S rRNA gene using the
Illumina MiSeq® platform. Successfully merged reads following paired-end sequencing
were processed through the QIIME pipeline (Caporaso et al., 2010) filtering out low
85
quality sequences using a quality score threshold of 20. Operation Taxonomic Units
(OTUs) were created by clustering the merged quality filtered reads at a 97% identity
threshold using sequences from a reference database (SILVA/Greengenes) (DeSantis et
al., 2006, Quast et al., 2013) as a guide. All remaining sequences entered a de novo
clustering step where they were clustered at the same 97% identity threshold without
guidance from the reference database. Potential chimeric OTUs were removed through
the use of UCHIME (Edgar et al., 2011) and the gold 16 database (Public domain version
of UCHIME, version 4.1, http://drive5.com/uchime/uchime_download.html). Taxonomic
assignments to OTUs from phylum to genus level were completed through QIIME’s use
of the given reference database (SILVA/Greengenes) and the UCLUST algorithm (Edgar,
2010). Further analysis included alpha and beta diversity and abundance profiles of the
microbial community in the samples.
Morphometric analysis
The dissected maxilla bones were stained with methylene blue and the images (in
0.63X10 times magnification) were taken under the dissecting microscope (Axio
observer A1, ZEISS) using AxioVision 4.8 software. The areas of exposed root surface
were measured at the buccal and palatal sites of three maxillary molars. The distance
between alveolar bone margin and cementoenamel junction (CEJ) was measured at nine
sites (mesial, middle, and distal sites of the first molar; interproximal site between the
first molar and the second molar; mesial and distal sites of the second molar;
interproximal site between the second molar and the third molar; mesial and distal sites of
the third molar) of three maxillary molars at the buccal site and the palatal site. The

86
direction of the distance line was parallel with the axis of root. All measurements were
performed using computer software (ImageJ). The measurements of buccal and palatal
sites were added for statistical analysis.
Histomorphometry
Half of the maxilla was processed following the protocol in chapter 2. Serial
mesio-distal sections (6 µm) parallel to the long axis of the teeth were cut. Thin sections
were either stained with H&E for light microscopy and identification of the cellular
composition of inflammatory infiltrates, or stained with tartrate resistant acid phosphatase
(TRAP) to examine osteoclastic activity.
Sections with similar anatomic positions were selected for quantitative
measurements. Different sections were measurement randomly to avoid bias. The specific
areas of mesial and distal interproximal sites were selected for histological assessment.
Each measurement had three different sections. The number of inflammatory cells,
including neutrophils, lymphocytes and plasma cells, was counted in the area of
connective tissue above the alveolar bone at 400x magnification. The total number of
osteoclasts associated with the interproximal bone was counted. The area of
interproximal bone was measured. Osteoclast density was defined by dividing the number
of osteoclasts by the area of interproximal bone. All the measurements were performed
with computer software (ImageJ). The mean of the mesial site and the distal site from
three sequential sections was determined.
Quantitative reverse transcription polymerase chain reaction assay

87
Total RNA was extracted from gingival tissue with Trizol reagent (Invitrogen,
Grand Island, NY) as per the manufacturer's protocol. The concentration and purity of
RNA was estimated by the A260/A280 ratio spectrophotometrically (NanoDrop 2000c,
Thermo Fisher Scientific, Waltham, MA). A total of 1 μg RNA was converted to cDNA
using a high-capacity cDNA reverse transcriptase kit (Applied Biosystems, Grand Island,
NY).
Quantitative reverse transcription polymerase chain reaction (qRT-PCR) was
performed using primers and TaqMan probes for Cxcl1, Ptgs2, Nos2, and labeled with
FAM dye (Applied Bio-systems, TaqMan gene expression assays). β-actin (Actb) was
utilized as an internal control and amplified using preformulated VIC-TAMRA-labeled
TaqMan probes (Applied Biosystems, Endogenous Control). Quantification was
performed in an automated thermal cycler (StepOnePlus™ System, Applied Biosystems).
The reaction mixtures were kept at 50°C for two minutes (one cycle), 95°C for 20 seconds
(one cycle), 95°C for one second and 60°C for 20 seconds (40 cycles). The results were
analyzed through a software interface and spreadsheet for the calculation of relative
expression (2-ΔΔCT).
Statistical Analysis
The comparison between two groups was analyzed by unpaired or paired two-
tailed Student’s t test. The comparison between multiple groups was analyzed by one-
way analysis of variance (one-way ANOVA) and post hoc analysis was performed

88
(pairwise t-test). All values were expressed as mean ± standard error of the mean. P-value
<0.05 was considered statistically significant.
Results
Prophylactic RvE1 treatment prevents alveolar bone loss in the ligature induced
periodontitis rat model
One rat in the RvE1 (0.5µg/µl) group died from the anesthesia in the second week
of the experiment; the results of the RvE1 (0.5µg/µl) group were derived from three rats.
Prophylactic RvE1 treatment significantly prevented alveolar bone loss compared to
vehicle application (Mean area of exposed root surface in molars - ligature + Vehicle:
6.8±0.4 mm2, ligature + RvE1 (0.1µg/µl): 5.3±0.3 mm2, ligature + RvE1 (0.5µg/µl):
5.1±0.4 mm2; distance between CEJ and alveolar bone level- ligature + Vehicle: 8.9±0.5
mm, ligature + RvE1 (0.1µg/µl): 6.9±0.5 mm, ligature + RvE1 (0.5µg/µl): 6.5±0.4 mm)
(Fig. 3.2). Mean histological area of interproximal bone in the RvE1 (0.1µg/µl) group
and the RvE1 (0.5µg/µl) group was larger than the area in the Vehicle group (Fig.3.3).
Prophylactic RvE1 treatment inhibits inflammation and reduces osteoclast activity
Prophylactic RvE1 treatment significantly inhibited inflammatory cell infiltration
compared to vehicle application. The cell counts in the connective tissue between the
RvE1 (0.1µg/µl) group and the RvE1 (0.5µg/µl) group was not significantly different
(Fig. 3.4). Osteoclast activity was significantly inhibited by prophylactic RvE1 treatment.
Osteoclast density between the RvE1 (0.1µg/µl) group and the RvE1 (0.5µg/µl) group
was not significantly different (Fig. 3.5).
89
Prophylactic RvE1 treatment (0.1µg/µl) significantly inhibited the expression
levels of Ptgs2 and Nos2 genes compared to vehicle application (Fig. 3.6). The gene
expression level of Ptgs2 in the RvE1 (0.5µg/µl) group was significantly lower than that
in the Vehicle group, but the gene expression level of Nos2 in the RvE1 (0.5µg/µl) group
was lower than that in the Vehicle group with no statistical significance (p=0.07). Both
RvE1 treatments (0.1µg/µl and 0.5µg/µl) did not significantly reduce the expression level
of Cxcl1 gene.
Subgingival microbiota change is inhibited by prophylactic RvE1 treatment
The taxonomic composition of subgingival microbiota at the genus level is
demonstrated in Fig. 3.7. The taxonomic composition of the subgingival microbiota at
baseline was significantly different from the compositions on day 14 and day 28. One
genus, Rothia, exhibited dominant and consistent relative abundance in all the samples at
baseline (72.6±6.6 %). After the disease was induced, the taxonomic composition became
diverse in different samples. Generally, four genera, Streptococcus, Lactobacillus,
Bifidobacterium, and Enterococcus, had relatively higher relative abundance than other
genera in samples during disease progression (Fig. 3.7).
While comparing the mean relative abundance of each genus in the RvE1 groups
with the mean relative abundance of each genus in the vehicle group on day 14, several
genera had a higher difference (p<0.3) between the RvE1 (0.5µg/µl) group or the RvE1
(0.1µg/µl) group and the Vehicle group than did other genera (Fig. 3.8.a&b). Among
these genera, three genera, Jeotgalicoccus, f__Enterococcaceae;g__, Haemophilus, were

90
shared in the comparisons between the RvE1 groups (0.1 or 0.5 µg/µl ) and the Vehicle
group.
While comparing the mean relative abundance of each genus in the RvE1 groups
with the mean relative abundance of each genus in the vehicle group on day 28, five
genera (f__Enterobacteriaceae;g__, f__Clostridiaceae;g__, f__Coriobacteriaceae;g__,
Rothia, Granulicatella) had a higher difference (p<0.3) between the RvE1 (0.1µg/µl)
group and the Vehicle group than did other genera, and eight genera
(f__Enterobacteriaceae;g__, Lactobacillus, Granulicatella, f__Micrococcaceae;g__,
Turicibacter, f__Planococcaceae;g__, Facklamia, f__Clostridiaceae;Other) had a higher
difference (p<0.3) between the RvE1 (0.5µg/µl) group and the Vehicle group than did
other genera. Most of these genera had lower relative abundance in the RvE1 groups than
the relative abundance in the Vehicle group (Fig. 3.9.a&b). Among these genera,
Granulicatella and f__Enterobacteriaceae had lower mean relative abundance in both of
the RvE1 groups than mean relative abundance in the Vehicle group.
The diversity of microbial community increased significantly after the disease
was induced. Generally, the Vehicle group had higher evenness (Shannon evenness) and
richness (number of observed OTUs) than did the RvE1 groups indicating more species
grew in the inflamed environment without RvE1 application. Moreover, the Shannon
evenness and the number of observed OTUs in each group on day 14 were higher than
these on day 0 and day28 (Fig. 3.10).
The subgingival microbiota in all three groups shifted significantly following the
induction of periodontitis. The diversity between samples in three groups became larger

91
on day 14 and day 28 compare to the diversity between samples on day 0 (Fig. 3.11). At
the end of experiment, the mean weighted UniFrac distance between samples in the
Vehicle was shorter than the mean weighted UniFrac distances between samples in RvE1
groups without statistically significant differences (Fig. 3.12). The results indicate the
phylogenetic profile of subgingival microbiota between samples in the Vehicle group was
closer to each other than that in the RvE1 groups.
RvE1 application appeared to be correlated to the body weight change of animals
The mean increased body weight of rats in the RvE1 (0.5µg/µl) group was significantly
higher than the mean increased body weight of rats in the RvE1 (0.1µg/µl) group and in
the Vehicle group during the experimental period (four weeks). The mean increased body
weight of rats in the Vehicle group was lower than the mean increased body weight of
rats in the RvE1 groups (Fig.3.13). The results implied RvE1 application might be
correlated to the body weigh change of animals.

92
0d: baseline plaque sample
collection
7d: plaque sample
collection
10d: plaque sample
collection
14d: plaque sample
collection
17d: plaque sample
collection
21d: plaque sample
collection
24d: plaque sample
collection
28d: plaque sample
collection
Figure 3.1: Experimental Timeline. Sixteen rats were assigned to four groups, but one rat in the RvE1 (0.5µg/µl) group was excluded from the study because of accidental anesthesia death (no ligature: n=4, ligature + Vehicle: n=4, ligature + RvE1 (0.1µg/µl): n=4, ligature + RvE1 (0.5µg/µl): n=3). The period of this experiment was four weeks. All rats had bilateral maxillary second molars ligated except the rats in the no ligature group. Rats in the no ligature group were sacrificed at baseline, and other rats were sacrificed at the end of the experiment. RvE1 (0.1µg/µl), RvE1 (0.5µg/µl), or vehicle (10% ethanol) was applied on the ligated teeth of rats in the different groups three times a week (M, W, F). Subgingival plaque samples were collected twice a week (M, F).
The treatment started on the first day of the experiment.
RvE1 (0.5µg/µl): 1µg RvE1/2µl RvE1 (0.1µg/µl): 1µg RvE1/10µl
Vehicle: 10µl ethanol 10%
Sacrifice the rats in each group: RvE1 (0.5µg/µl) (n=3) RvE1 (0.1µg/µl) (n=4)
Vehicle (n=4)

93
0
1
2
3
4
5
6
7
8
9
10
Are
a (m
m2 )
Exposed root surface of three molars
0
2
4
6
8
10
12
14
Dis
tan
ce (
mm
)
Distance between CEJ and alveolar bone
Figure 3.2: Bone morphometric analysis. The exposed root surface of three molars in the RvE1 groups (RvE1(0.1µg/µl) or RvE1 (0.5µg/µl)) was significantly smaller than that in the Vehicle group. The distance between CEJ and alveolar bone in the RvE1 groups was also significantly shorter than that in the Vehicle group. RvE1 application significantly prevented alveolar bone loss. The p-value was calculated by pair-wise t-test following one-way analysis of variance (ANOVA).
Vehicle group RvE1 group
*P=0.02
*P=0.01 *P=0.01
*P=0.02
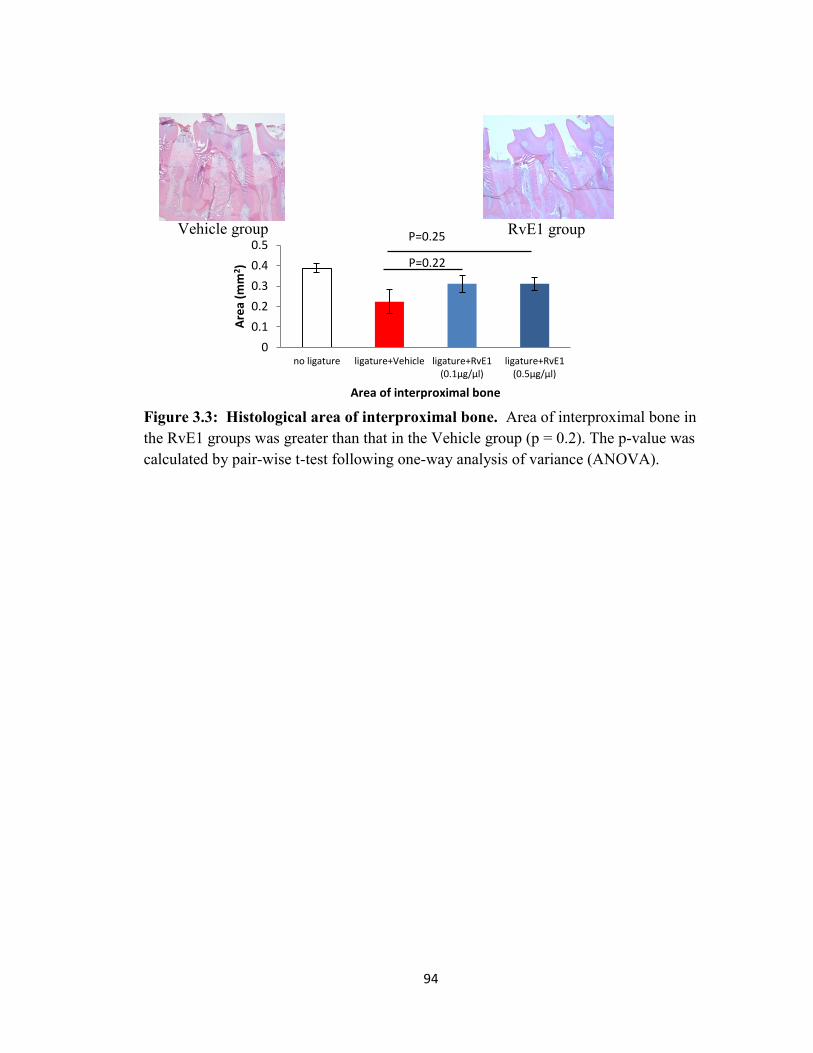
94
0
0.1
0.2
0.3
0.4
0.5
no ligature ligature+Vehicle ligature+RvE1(0.1µg/µl)
ligature+RvE1(0.5µg/µl)
Are
a (m
m2 )
Area of interproximal bone
Figure 3.3: Histological area of interproximal bone. Area of interproximal bone in the RvE1 groups was greater than that in the Vehicle group (p = 0.2). The p-value was calculated by pair-wise t-test following one-way analysis of variance (ANOVA).
RvE1 group Vehicle group P=0.25
P=0.22

95
0
10
20
30
40
no ligature ligature+Vehicle ligature+RvE1(0.1µg/µl)
ligature+RvE1(0.5µg/µl)
Ce
ll/ar
ea
(mm
2)
Inflammtory cell infiltration
Figure 3.4: Inflammatory cell infiltrate. Inflammatory cell count in the RvE1 groups was significantly lower than that in the Vehicle group. There was no significant difference of inflammatory cell count between the RvE1 (0.1µg/µl) group and the RvE1 (0.5µg/µl) group. The p-value was calculated by pair-wise t-test following one-way analysis of variance (ANOVA).
Vehicle group RvE1 group *P=0.04
*P<0.01

96
0
5
10
15
20
25
30
35
40
Ce
ll/ar
ea
(mm
2 )
Osteoclast density
Figure 3.5: Osteoclast density. Osteoclast density was defined by dividing active osteoclast count (TRAP positive multinucleated osteoclasts) around the interproximal bone by the total area of the interproximal bone. The osteoclast density in the RvE1 groups (RvE1 (0.1µg/µl) or RvE1 (0.5µg/µl)) was significantly lower than that in the Vehicle group. Osteoclast density of the RvE1 (0.1µg/µl) group was not significantly different from that of the RvE1 (0.5µg/µl) group. The p-value was calculated by pair-wise t-test following one-way analysis of variance (ANOVA).
Vehicle group RvE1 group
*P<0.01
*P<0.01
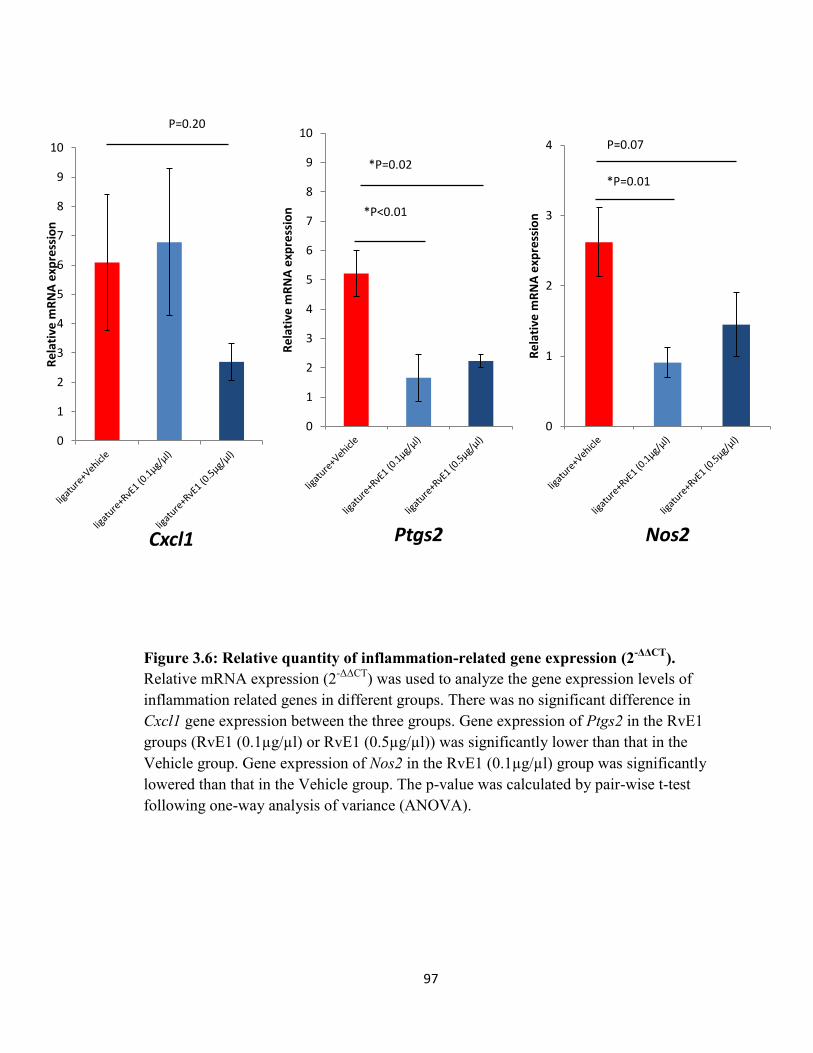
97
0
1
2
3
4
5
6
7
8
9
10
Re
lati
ve m
RN
A e
xpre
ssio
n
Cxcl1
0
1
2
3
4
5
6
7
8
9
10
Re
lati
ve m
RN
A e
xpre
ssio
n
Ptgs2
0
1
2
3
4
Re
lati
ve m
RN
A e
xpre
ssio
n
Nos2
Figure 3.6: Relative quantity of inflammation-related gene expression (2-ΔΔCT). Relative mRNA expression (2-ΔΔCT) was used to analyze the gene expression levels of inflammation related genes in different groups. There was no significant difference in Cxcl1 gene expression between the three groups. Gene expression of Ptgs2 in the RvE1 groups (RvE1 (0.1µg/µl) or RvE1 (0.5µg/µl)) was significantly lower than that in the Vehicle group. Gene expression of Nos2 in the RvE1 (0.1µg/µl) group was significantly lowered than that in the Vehicle group. The p-value was calculated by pair-wise t-test following one-way analysis of variance (ANOVA).
P=0.20
*P=0.02
*P<0.01
P=0.07
*P=0.01

98
D0 All samples D14 Vehicles D14 RvE1 D14 RvE1 D28 Vehicle D28 RvE1 D28RvE1
(0.1µg/µl) (0.5µg/µl) (0.1µg/µl) (0.5µg/µl)
Figure 3.7: Taxonomic composition of the subgingival microbiota (genus level). Taxonomic compositions of eleven samples in three groups are presented (Vehicle: n=4, RvE1 (0.1µg/µl): n=4, RvE1 (0.5µg/µl): n=3). The dynamics of the subgingival microbiota composition at different time points (day 0, 14, 28) was recorded. Rothia species was dominant at baseline. Streptococcus and Lactobacillus species had larger relative abundance than did other species after disease induction. Complete information of color coding genera can be found in Appendix 1.
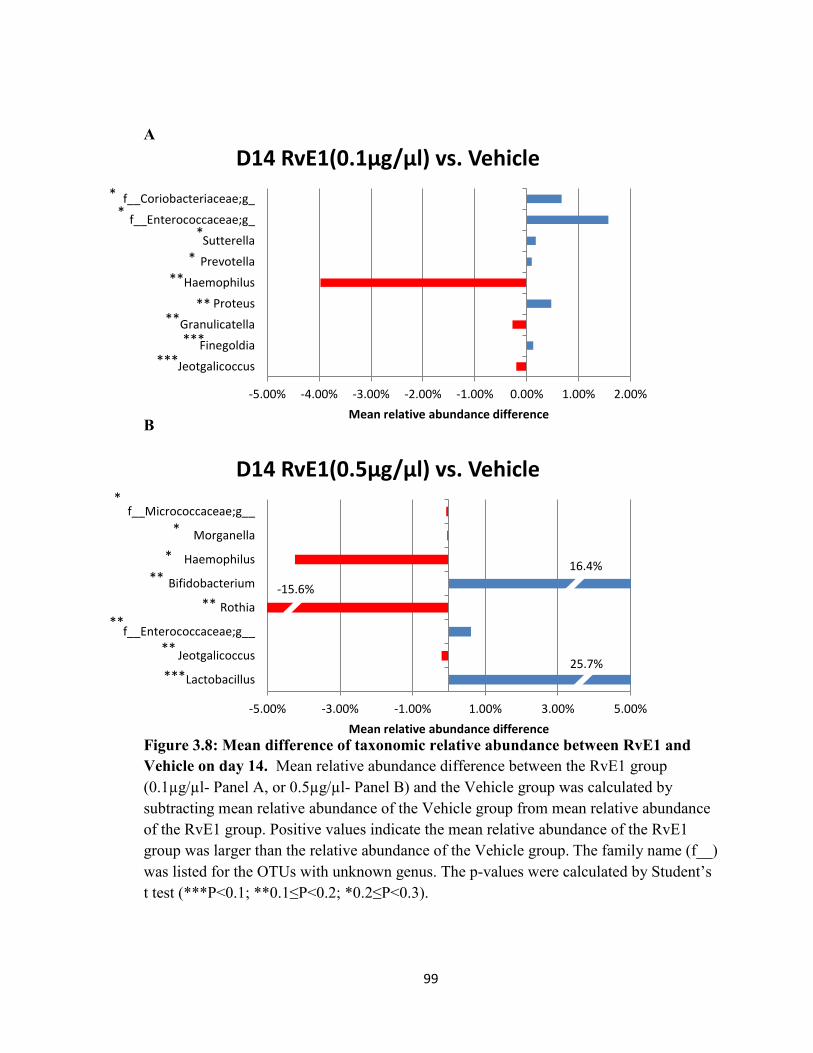
99
-5.00% -3.00% -1.00% 1.00% 3.00% 5.00%
Lactobacillus
Jeotgalicoccus
f__Enterococcaceae;g__
Rothia
Bifidobacterium
Haemophilus
Morganella
f__Micrococcaceae;g__
Mean relative abundance difference
D14 RvE1(0.5µg/µl) vs. Vehicle
-5.00% -4.00% -3.00% -2.00% -1.00% 0.00% 1.00% 2.00%
Jeotgalicoccus
Finegoldia
Granulicatella
Proteus
Haemophilus
Prevotella
Sutterella
f__Enterococcaceae;g_
f__Coriobacteriaceae;g_
Mean relative abundance difference
D14 RvE1(0.1µg/µl) vs. Vehicle
A
B
Figure 3.8: Mean difference of taxonomic relative abundance between RvE1 and Vehicle on day 14. Mean relative abundance difference between the RvE1 group (0.1µg/µl- Panel A, or 0.5µg/µl- Panel B) and the Vehicle group was calculated by subtracting mean relative abundance of the Vehicle group from mean relative abundance of the RvE1 group. Positive values indicate the mean relative abundance of the RvE1 group was larger than the relative abundance of the Vehicle group. The family name (f__) was listed for the OTUs with unknown genus. The p-values were calculated by Student’s t test (***P<0.1; **0.1≤P<0.2; *0.2≤P<0.3).
***
***
** **
**
*
*
*
**
**
**
**
***
*
*
*
25.7%
-15.6%
*
16.4%

100
-1.0% -0.5% 0.0% 0.5% 1.0% 1.5% 2.0% 2.5% 3.0%
f__Enterobacteriaceae;g__
Lactobacillus
Granulicatella
f__Micrococcaceae;g__
Turicibacter
f__Planococcaceae;g__
Facklamia
f__Clostridiaceae;Other
Mean relative abundance difference
D28 RvE1(0.5µg/µl) vs. Vehicle
-1.0% 0.0% 1.0% 2.0%
f__Enterobacteriaceae;g__
f__Clostridiaceae;g__
f__Coriobacteriaceae;g__
Rothia
Granulicatella
Mean relative abundance difference
D28 RvE1(0.1µg/µl) vs. Vehicle A
B
Figure 3.9: Mean difference of taxonomic relative abundance between RvE1 and the Vehicle on day 28. Mean relative abundance difference between the RvE1 group (0.1µg/µl- Panel A, or 0.5µg/µl- Panel B) and the Vehicle group was calculated by subtracting mean relative abundance of the Vehicle group from mean relative abundance of the RvE1 group. Positive values indicate the mean relative abundance of the RvE1 group was larger than that of the Vehicle group. Most of the genera had smaller relative abundance in the RvE1 group. The family name (f__) was listed for the OTUs with unknown genus. The p-values were calculated by Student’s t test (***P<0.1; **0.1≤P<0.2; *0.2≤P<0.3).
***
**
***
*
**
*
*
*
*
**
**
*
*
-20.5%
*
-6.4%

101
00.5
11.5
22.5
33.5
4
No
n-p
aram
etr
ic S
han
no
n
0
0.1
0.2
0.3
0.4
0.5
0.6
Shan
no
n E
ven
ne
ss
Evenness
020406080
100120140160180
Ob
serv
ed
OTU
s
Richness
Figure 3.10: Alpha diversity of subgingival microbial community. The differences in Shannon evenness, non-parametric Shannon index or number of observed OTUs in the same group at different time points (d0 vs. d14, d14 vs. d28) were calculated (Student’s t-test). Generally, the richness and evenness of microbial community were the highest on day 14. The evenness and richness of the Vehicle group were higher than the RvE1 groups (RvE1 (0.1µg/µl) or RvE1 (0.5µg/µl)) at all three time points. The results indicate that inflammation in the local environment in the Vehicle group might be more severe than that in the RvE1 groups as more species are expected in an inflammatory environment compared to an uninflamed environment.
*P=0.04
P=0.05

102
Figure 3.11: Principal coordinate analysis (PCoA). Principal coordinate analysis plots depicting distances among microbial communities based on qualitative community metrics reveal that there were significant shifts of microbial communities during disease progression. At the end of the experiment, microbial communities in three groups were not separated clearly. However, the communities within the Vehicle group appeared to be closer to each other than did communities of other two groups. The profile indicated the Vehicle group had smaller beta diversity (diversity between communities) than did other two groups. Reduced beta diversity is one of the characteristics of microbial community in periodontitis. Larger values of each component (PC) explain more of the variance in the data.
Day 0
Vehicle
RvE1 (0.1µg/µl)
RvE1 (0.5µg/µl)
Day 28
Day 14

103
Figure 3.12: Beta diversity of subgingival microbial community at different time points. The mean distance between communities of the Vehicle group became shorter than that of other two groups at the end of the experiment (day 28). This result is consistent with principal coordinate analysis plot. The distances were calculated by weighted UniFrac (High: RvE1 (0.5µg/µl) group, Low: RvE1 (0.1µg/µl) group, Vehicle: Vehicle group).
Day 28 Day 14
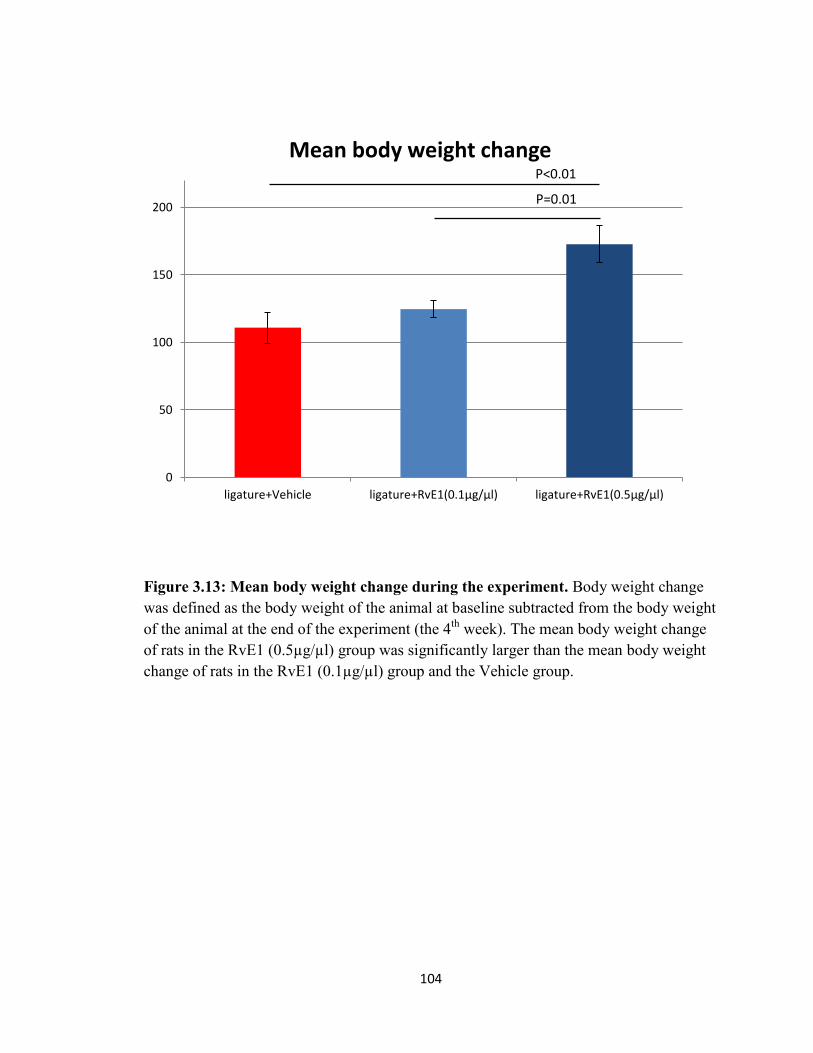
104
Figure 3.13: Mean body weight change during the experiment. Body weight change was defined as the body weight of the animal at baseline subtracted from the body weight of the animal at the end of the experiment (the 4th week). The mean body weight change of rats in the RvE1 (0.5µg/µl) group was significantly larger than the mean body weight change of rats in the RvE1 (0.1µg/µl) group and the Vehicle group.
0
50
100
150
200
ligature+Vehicle ligature+RvE1(0.1µg/µl) ligature+RvE1(0.5µg/µl)
Mean body weight change
P=0.01
P<0.01

105
Discussion
Prophylactic RvE1 treatment did not completely stop alveolar bone loss induced by
ligature placement, but prophylactic RvE1 treatment significantly inhibited alveolar bone
loss compared to vehicle application (Fig. 3.2). The prevention of alveolar bone loss was
associated with the inhibition of inflammatory cell infiltration and the reduction of
osteoclast activity following RvE1 application (Fig. 3.4, 3.5). The results confirmed the
impact of RvE1 on the inhibition of neutrophil infiltration in the inflammatory
environment (Arita et al., 2005b, Hasturk et al., 2007) and the inhibition of osteoclast
differentiation (Gao et al., 2013). The gene expression of Ptgs2 and Nos2 in the gingival
tissue was significantly inhibited by RvE1 application (Fig. 3.6). However, RvE1
application did not inhibit the expression of Cxcl1 gene significantly. The result of
limited change of Cxcl1 gene expression following RvE1 application might be related to
the acute nature of the insult as opposed to the chronic lesion in Chapter 2. Resolvins do
not inhibit inflammation. Rather, they provide a feed forward, receptor agonist driven
enhancement of resolution. Since Cxcl1 expression is critical in the acute phase and the
other two genes are expressed later, the lack of impact of RvE1 on Cxcl1 in the acute
phase should not be unexpected. Different concentrations of RvE1 (0.1 or 0.5 µg/µl) did
not have significantly different impact on prevention of alveolar bone loss, inhibition of
inflammatory cell infiltration, inhibition of osteoclastogenesis, and reduction of
expression of inflammation related genes in gingival tissue.
The taxonomic composition of the subgingival microbiota at baseline was
significantly different from that following ligature placement (Fig. 3.7). Generally,

106
Rothia was the dominant genus with the highest relative abundance (72.4±6.6 %) and
Streptococcus species had the second largest relative abundance (9.8±3.4 %) at baseline.
Similar results were reported earlier in the taxonomic composition of supragingival
biofilm in rats (Manrique et al., 2013). Bifidobacterium, Lactobacillus, or Streptococcus,
were generally the dominant genera during disease progression. Considering the variation
of relative abundance and limited sample size, a less conservative significant level (p<0.3)
was chosen to find the potential genera representing subgingival microbiota in different
groups. While comparing the mean relative abundance of different genera between the
RvE1 groups (0.1 or 0.5 µg/ml) and the Vehicle group, several genera had a relatively
more significant difference (p<0.3) than other genera (Fig. 3.8, 3.9). Most of the genera
on day 14 were different from the genera on day 28. The results indicate the subgingival
microbiota composition was dynamic during disease progression. For example,
Lactobacillus genus had an inverse relationship in the three groups on day 14 and day 28
(Mean relative abundance ± SEM: RvE1 (0.5µg/µl) vs. RvE1 (0.1µg/µl) vs. Vehicle-
28.9±3, 8.6±4.9, 3.3±1.4 % on day 14; RvE1 (0.5µg/µl) vs. RvE1 (0.1µg/µl) vs. Vehicle-
7.4±7.4, 17.5±10.7, 27.9±8.0 % on day 28). At the end of the experiment, these genera,
which had more significant difference of relative abundance between groups than did
other genera, generally had small relative abundance (< 1%) and had reduction of relative
abundance in the RvE1 groups (Fig. 3.9.a&b). Two of these genera were found in both
RvE1 groups. One genus, which belongs to Enterobacteriaceae family, could not be
assigned to any known genus in the reference genome. Another genus, Granulicatella,
has species in the commensal oral bacteria found in dental plaque (Mikkelsen et al.,

107
2000). The Granulicatella species are also related to refractory periodontitis
(Granulicatella elegans) (Colombo et al., 2012) , acute dental abscess (Granulicatella
adiacens) (Robertson and Smith, 2009), endodontic infection (Granulicatella adiacens)
(Siqueira and Rocas, 2006) and endocarditis (Granulicatella adiacens, Granulicatella
elegans) (Cargill et al., 2010) in humans.
The richness and evenness of the microbial community in the Vehicle group were
higher than in the RvE1 groups following disease induction. Although the richness and
evenness of the microbial community in the Vehicle group were also higher than in the
RvE1 groups at baseline, the difference between the groups became more significant
following disease induction (Fig. 3.10). The dose effect of RvE1 appeared to play a role
in affecting community diversity given the richness and evenness of microbial
community in the RvE1 group (0.5µg/µl) was lower than these in the RvE1 group
(0.1µg/µl). While considering the dynamics of community diversity at different time
points, the evenness and richness were highest on day 14 and lowest on day 0. Given the
evenness and richness of microbial community were positively related to diseased state of
periodontitis (Abusleme et al., 2013, Shi et al., 2015), the dynamics of community
diversity might represent the change of inflammation process in experimental
periodontitis. The most severe inflammation happened within the first two weeks, but
then the inflammation decreased gradually. The inhibition of inflammation by RvE1
appeared to repress the growth of multiple species resulting in the decrease of richness
and evenness of microbial community.

108
The subgingival microbiota of all groups shifted following ligature placement
(Fig. 3.11). At the end of the treatment, the mean distance representing the diversity
between samples was the lowest in the Vehicle group (Fig. 3.13). The reduced beta
diversity in the Vehicle group could be linked to the unresolved inflammation. Taken
together, the change of subgingival microbiota was different between the RvE1 groups
and the Vehicle group. The results indicate that the prevention of local environment
change induced by experimental periodontitis might be associated with the changes of
diversity and taxonomic composition in subgingival microbiota.
RvE1 and other SPMs have shown the analgesic properties by regulating specific
receptors, such as transient receptor potential cation channel subfamily V member
(TRPV), dependent nociception (Xu et al., 2010, Bang et al., 2010). RvE1 treatment also
prevented body weight loss in the colitis mice model by controlling acute inflammation
(Arita et al., 2005b). It is interesting to observe the correlation between RvE1 application
and body weight change of the animals (Fig. 3.13). RvE1 treatment might affect the gain
of weight in animals by controlling pain and inflammation induced by ligature placement.
It has been demonstrated that body weight change was affected by post-operative pain in
animal model (Jablonski et al., 2001, Brennan et al., 2009). However, more studies have
to be conducted to investigate the correlation between body weight change and trauma
induced by the ligature placement in experimental periodontitis model.

109
CONCLUSIONS
Resolvin E1 treatment of existing ligature induced periodontitis significantly
regenerates lost alveolar bone. Prophylactic resolvin E1 treatment significantly prevents
alveolar bone loss in ligature induced periodontitis rat model. The limited shift of
subgingival microbiota in experimental periodontitis following resolvin E1 application
was associated with reduced inflammation and repressed osteoclast activity in the local
environment. The results of this experimental periodontitis model suggest that changes in
the composition of the subgingival microbiota emerge as a result of inflammation.

110
REFERENCES Abe, T. & Hajishengallis, G. (2013) Optimization of the ligature-induced periodontitis
model in mice. J Immunol Methods 394, 49-54. doi:10.1016/j.jim.2013.05.002. Abusleme, L., Dupuy, A. K., Dutzan, N., Silva, N., Burleson, J. A., Strausbaugh, L. D.,
Gamonal, J. & Diaz, P. I. (2013) The subgingival microbiome in health and periodontitis and its relationship with community biomass and inflammation. ISME J 7, 1016-1025. doi:10.1038/ismej.2012.174.
Abusleme, L., Hong, B. Y., Dupuy, A. K., Strausbaugh, L. D. & Diaz, P. I. (2014) Influence of DNA extraction on oral microbial profiles obtained via 16S rRNA gene sequencing. J Oral Microbiol 6. doi:10.3402/jom.v6.23990.
Albert, C. M., Campos, H., Stampfer, M. J., Ridker, P. M., Manson, J. E., Willett, W. C. & Ma, J. (2002) Blood levels of long-chain n-3 fatty acids and the risk of sudden death. N Engl J Med 346, 1113-1118. doi:10.1056/NEJMoa012918.
Anne Chao, T.-J. S. (2003) Nonparametric estimation of Shannon's index of diversity when there are unseen species in sample. Environmental and Ecological Statistics 10, 429-443.
Ariel, A., Fredman, G., Sun, Y. P., Kantarci, A., Van Dyke, T. E., Luster, A. D. & Serhan, C. N. (2006) Apoptotic neutrophils and T cells sequester chemokines during immune response resolution through modulation of CCR5 expression. Nat Immunol 7, 1209-1216. doi:10.1038/ni1392.
Ariel, A., Li, P. L., Wang, W., Tang, W. X., Fredman, G., Hong, S., Gotlinger, K. H. & Serhan, C. N. (2005) The docosatriene protectin D1 is produced by TH2 skewing and promotes human T cell apoptosis via lipid raft clustering. J Biol Chem 280, 43079-43086. doi:10.1074/jbc.M509796200.
Arita, M., Bianchini, F., Aliberti, J., Sher, A., Chiang, N., Hong, S., Yang, R., Petasis, N. A. & Serhan, C. N. (2005a) Stereochemical assignment, antiinflammatory properties, and receptor for the omega-3 lipid mediator resolvin E1. J Exp Med 201, 713-722. doi:10.1084/jem.20042031.
Arita, M., Yoshida, M., Hong, S., Tjonahen, E., Glickman, J. N., Petasis, N. A., Blumberg, R. S. & Serhan, C. N. (2005b) Resolvin E1, an endogenous lipid mediator derived from omega-3 eicosapentaenoic acid, protects against 2,4,6-trinitrobenzene sulfonic acid-induced colitis. Proc Natl Acad Sci U S A 102, 7671-7676. doi:10.1073/pnas.0409271102.
Aurora, A. B., Porrello, E. R., Tan, W., Mahmoud, A. I., Hill, J. A., Bassel-Duby, R., Sadek, H. A. & Olson, E. N. (2014) Macrophages are required for neonatal heart regeneration. J Clin Invest 124, 1382-1392. doi:10.1172/JCI72181.
Bainbridge, B., Verma, R. K., Eastman, C., Yehia, B., Rivera, M., Moffatt, C., Bhattacharyya, I., Lamont, R. J. & Kesavalu, L. (2010) Role of Porphyromonas gingivalis phosphoserine phosphatase enzyme SerB in inflammation, immune response, and induction of alveolar bone resorption in rats. Infect Immun 78, 4560-4569. doi:10.1128/IAI.00703-10.
Baker, P. J., Dixon, M., Evans, R. T. & Roopenian, D. C. (2000) Heterogeneity of Porphyromonas gingivalis strains in the induction of alveolar bone loss in mice. Oral Microbiol Immunol 15, 27-32.

111
Baker, P. J., Evans, R. T. & Roopenian, D. C. (1994) Oral infection with Porphyromonas gingivalis and induced alveolar bone loss in immunocompetent and severe combined immunodeficient mice. Arch Oral Biol 39, 1035-1040.
Bang, S., Yoo, S., Yang, T. J., Cho, H., Kim, Y. G. & Hwang, S. W. (2010) Resolvin D1 attenuates activation of sensory transient receptor potential channels leading to multiple anti-nociception. Br J Pharmacol 161, 707-720. doi:10.1111/j.1476-5381.2010.00909.x.
Bannenberg, G. L., Chiang, N., Ariel, A., Arita, M., Tjonahen, E., Gotlinger, K. H., Hong, S. & Serhan, C. N. (2005) Molecular circuits of resolution: formation and actions of resolvins and protectins. J Immunol 174, 4345-4355.
Benatti, B. B., Nogueira-Filho, G. R., Diniz, M. C., Sallum, E. A., Sallum, A. W. & Nociti, F. H., Jr. (2003) Stress may enhance nicotine effects on periodontal tissues. An in vivo study in rats. J Periodontal Res 38, 351-353.
Berglundh, T. & Donati, M. (2005) Aspects of adaptive host response in periodontitis. J Clin Periodontol 32 Suppl 6, 87-107. doi:10.1111/j.1600-051X.2005.00820.x.
Berglundh, T., Lindhe, J., Ericsson, I., Marinello, C. P., Liljenberg, B. & Thomsen, P. (1991) The soft tissue barrier at implants and teeth. Clin Oral Implants Res 2, 81-90.
Bezerra, M. M., Brito, G. A., Ribeiro, R. A. & Rocha, F. A. (2002) Low-dose doxycycline prevents inflammatory bone resorption in rats. Braz J Med Biol Res 35, 613-616.
Bezerra, M. M., de Lima, V., Alencar, V. B., Vieira, I. B., Brito, G. A., Ribeiro, R. A. & Rocha, F. A. (2000) Selective cyclooxygenase-2 inhibition prevents alveolar bone loss in experimental periodontitis in rats. J Periodontol 71, 1009-1014. doi:10.1902/jop.2000.71.6.1009.
Brecx, M. C., Frohlicher, I., Gehr, P. & Lang, N. P. (1988) Stereological observations on long-term experimental gingivitis in man. J Clin Periodontol 15, 621-627.
Brecx, M. C., Gautschi, M., Gehr, P. & Lang, N. P. (1987) Variability of histologic criteria in clinically healthy human gingiva. J Periodontal Res 22, 468-472.
Breivik, T., Thrane, P. S., Gjermo, P., Opstad, P. K., Pabst, R. & von Horsten, S. (2001) Hypothalamic-pituitary-adrenal axis activation by experimental periodontal disease in rats. J Periodontal Res 36, 295-300.
Brennan, M. P., Sinusas, A. J., Horvath, T. L., Collins, J. G. & Harding, M. J. (2009) Correlation between body weight changes and postoperative pain in rats treated with meloxicam or buprenorphine. Lab Anim (NY) 38, 87-93. doi:10.1038/laban0309-87.
Brito, L. C., Teles, F. R., Teles, R. P., Franca, E. C., Ribeiro-Sobrinho, A. P., Haffajee, A. D. & Socransky, S. S. (2007) Use of multiple-displacement amplification and checkerboard DNA-DNA hybridization to examine the microbiota of endodontic infections. J Clin Microbiol 45, 3039-3049. doi:10.1128/JCM.02618-06.
Brudno, M., Poliakov, A., Salamov, A., Cooper, G. M., Sidow, A., Rubin, E. M., Solovyev, V., Batzoglou, S. & Dubchak, I. (2004) Automated whole-genome multiple alignment of rat, mouse, and human. Genome Res 14, 685-692. doi:10.1101/gr.2067704.

112
Calder, P. C. & Yaqoob, P. (2009) Omega-3 polyunsaturated fatty acids and human health outcomes. Biofactors 35, 266-272. doi:10.1002/biof.42.
Caporaso, J. G., Kuczynski, J., Stombaugh, J., Bittinger, K., Bushman, F. D., Costello, E. K., Fierer, N., Pena, A. G., Goodrich, J. K., Gordon, J. I., Huttley, G. A., Kelley, S. T., Knights, D., Koenig, J. E., Ley, R. E., Lozupone, C. A., McDonald, D., Muegge, B. D., Pirrung, M., Reeder, J., Sevinsky, J. R., Turnbaugh, P. J., Walters, W. A., Widmann, J., Yatsunenko, T., Zaneveld, J. & Knight, R. (2010) QIIME allows analysis of high-throughput community sequencing data. Nat Methods 7, 335-336. doi:10.1038/nmeth.f.303.
Cargill, J. S., Boyd, G. J. & Weightman, N. C. (2010) Nocardia cyriacigeorgica: a case of endocarditis with disseminated soft-tissue infection. J Med Microbiol 59, 224-230. doi:10.1099/jmm.0.011593-0.
Cekici, A., Kantarci, A., Hasturk, H. & Van Dyke, T. E. (2014) Inflammatory and immune pathways in the pathogenesis of periodontal disease. Periodontol 2000 64, 57-80. doi:10.1111/prd.12002.
Cesar Neto, J. B., de Souza, A. P., Barbieri, D., Moreno, H., Jr., Sallum, E. A. & Nociti, F. H., Jr. (2004) Matrix metalloproteinase-2 may be involved with increased bone loss associated with experimental periodontitis and smoking: a study in rats. J Periodontol 75, 995-1000. doi:10.1902/jop.2004.75.7.995.
Chan, M. M. & Moore, A. R. (2010) Resolution of inflammation in murine autoimmune arthritis is disrupted by cyclooxygenase-2 inhibition and restored by prostaglandin E2-mediated lipoxin A4 production. J Immunol 184, 6418-6426. doi:10.4049/jimmunol.0903816.
Chapple, I. L. & Matthews, J. B. (2007) The role of reactive oxygen and antioxidant species in periodontal tissue destruction. Periodontol 2000 43, 160-232. doi:10.1111/j.1600-0757.2006.00178.x.
Chiang, N., Fredman, G., Backhed, F., Oh, S. F., Vickery, T., Schmidt, B. A. & Serhan, C. N. (2012) Infection regulates pro-resolving mediators that lower antibiotic requirements. Nature 484, 524-528. doi:10.1038/nature11042.
Colombo, A. P., Bennet, S., Cotton, S. L., Goodson, J. M., Kent, R., Haffajee, A. D., Socransky, S. S., Hasturk, H., Van Dyke, T. E., Dewhirst, F. E. & Paster, B. J. (2012) Impact of periodontal therapy on the subgingival microbiota of severe periodontitis: comparison between good responders and individuals with refractory periodontitis using the human oral microbe identification microarray. J Periodontol 83, 1279-1287. doi:10.1902/jop.2012.110566.
Connor, K. M., SanGiovanni, J. P., Lofqvist, C., Aderman, C. M., Chen, J., Higuchi, A., Hong, S., Pravda, E. A., Majchrzak, S., Carper, D., Hellstrom, A., Kang, J. X., Chew, E. Y., Salem, N., Jr., Serhan, C. N. & Smith, L. E. (2007) Increased dietary intake of omega-3-polyunsaturated fatty acids reduces pathological retinal angiogenesis. Nat Med 13, 868-873. doi:nm1591 [pii]
10.1038/nm1591. Darveau, R. P. (2010) Periodontitis: a polymicrobial disruption of host homeostasis. Nat
Rev Microbiol 8, 481-490. doi:10.1038/nrmicro2337.

113
de Lima, V., Bezerra, M. M., de Menezes Alencar, V. B., Vidal, F. D., da Rocha, F. A., de Castro Brito, G. A. & de Albuquerque Ribeiro, R. (2000) Effects of chlorpromazine on alveolar bone loss in experimental periodontal disease in rats. Eur J Oral Sci 108, 123-129.
Dean, F. B., Hosono, S., Fang, L., Wu, X., Faruqi, A. F., Bray-Ward, P., Sun, Z., Zong, Q., Du, Y., Du, J., Driscoll, M., Song, W., Kingsmore, S. F., Egholm, M. & Lasken, R. S. (2002) Comprehensive human genome amplification using multiple displacement amplification. Proc Natl Acad Sci U S A 99, 5261-5266. doi:10.1073/pnas.082089499.
Demmer, R. T. & Papapanou, P. N. (2010) Epidemiologic patterns of chronic and aggressive periodontitis. Periodontol 2000 53, 28-44. doi:PRD326 [pii]
10.1111/j.1600-0757.2009.00326.x. DeSantis, T. Z., Hugenholtz, P., Larsen, N., Rojas, M., Brodie, E. L., Keller, K., Huber,
T., Dalevi, D., Hu, P. & Andersen, G. L. (2006) Greengenes, a chimera-checked 16S rRNA gene database and workbench compatible with ARB. Appl Environ Microbiol 72, 5069-5072. doi:10.1128/AEM.03006-05.
Diaz, P. I., Dupuy, A. K., Abusleme, L., Reese, B., Obergfell, C., Choquette, L., Dongari-Bagtzoglou, A., Peterson, D. E., Terzi, E. & Strausbaugh, L. D. (2012) Using high throughput sequencing to explore the biodiversity in oral bacterial communities. Mol Oral Microbiol 27, 182-201. doi:10.1111/j.2041-1014.2012.00642.x.
Doeing, D. C., Borowicz, J. L. & Crockett, E. T. (2003) Gender dimorphism in differential peripheral blood leukocyte counts in mice using cardiac, tail, foot, and saphenous vein puncture methods. BMC Clin Pathol 3, 3. doi:10.1186/1472-6890-3-3.
Duarte, P. M., Tezolin, K. R., Figueiredo, L. C., Feres, M. & Bastos, M. F. (2010) Microbial profile of ligature-induced periodontitis in rats. Arch Oral Biol 55, 142-147. doi:10.1016/j.archoralbio.2009.10.006.
Dumitrescu, A. L., Abd-El-Aleem, S., Morales-Aza, B. & Donaldson, L. F. (2004) A model of periodontitis in the rat: effect of lipopolysaccharide on bone resorption, osteoclast activity, and local peptidergic innervation. J Clin Periodontol 31, 596-603. doi:10.1111/j.1600-051X.2004.00528.x.
Duran-Pinedo, A. E., Chen, T., Teles, R., Starr, J. R., Wang, X., Krishnan, K. & Frias-Lopez, J. (2014) Community-wide transcriptome of the oral microbiome in subjects with and without periodontitis. ISME J 8, 1659-1672. doi:10.1038/ismej.2014.23.
Edgar, R. C. (2010) Search and clustering orders of magnitude faster than BLAST. Bioinformatics 26, 2460-2461. doi:10.1093/bioinformatics/btq461.
Edgar, R. C., Haas, B. J., Clemente, J. C., Quince, C. & Knight, R. (2011) UCHIME improves sensitivity and speed of chimera detection. Bioinformatics 27, 2194-2200. doi:10.1093/bioinformatics/btr381.
Eke, P. I., Dye, B. A., Wei, L., Thornton-Evans, G. O., Genco, R. J. & Cdc Periodontal Disease Surveillance workgroup: James Beck, G. D. R. P. (2012) Prevalence of

114
periodontitis in adults in the United States: 2009 and 2010. J Dent Res 91, 914-920. doi:10.1177/0022034512457373.
El-Sharkawy, H., Aboelsaad, N., Eliwa, M., Darweesh, M., Alshahat, M., Kantarci, A., Hasturk, H. & Van Dyke, T. E. (2010) Adjunctive treatment of chronic periodontitis with daily dietary supplementation with omega-3 Fatty acids and low-dose aspirin. J Periodontol 81, 1635-1643. doi:10.1902/jop.2010.090628.
El Kebir, D. & Filep, J. G. (2013) Modulation of Neutrophil Apoptosis and the Resolution of Inflammation through beta2 Integrins. Front Immunol 4, 60. doi:10.3389/fimmu.2013.00060.
El Kebir, D., Gjorstrup, P. & Filep, J. G. (2012) Resolvin E1 promotes phagocytosis-induced neutrophil apoptosis and accelerates resolution of pulmonary inflammation. Proc Natl Acad Sci U S A 109, 14983-14988. doi:10.1073/pnas.1206641109.
Elabdeen, H. R., Mustafa, M., Szklenar, M., Ruhl, R., Ali, R. & Bolstad, A. I. (2013) Ratio of pro-resolving and pro-inflammatory lipid mediator precursors as potential markers for aggressive periodontitis. PLoS One 8, e70838. doi:10.1371/journal.pone.0070838.
Endo, Y., Tomofuji, T., Ekuni, D., Irie, K., Azuma, T., Tamaki, N., Yamamoto, T. & Morita, M. (2010) Experimental periodontitis induces gene expression of proinflammatory cytokines in liver and white adipose tissues in obesity. J Periodontol 81, 520-526. doi:10.1902/jop.2009.090574.
Farrar, J. D., Smith, J. D., Murphy, T. L., Leung, S., Stark, G. R. & Murphy, K. M. (2000) Selective loss of type I interferon-induced STAT4 activation caused by a minisatellite insertion in mouse Stat2. Nat Immunol 1, 65-69. doi:10.1038/76932.
Feres, M., Soares, G. M., Mendes, J. A., Silva, M. P., Faveri, M., Teles, R., Socransky, S. S. & Figueiredo, L. C. (2012) Metronidazole alone or with amoxicillin as adjuncts to non-surgical treatment of chronic periodontitis: a 1-year double-blinded, placebo-controlled, randomized clinical trial. J Clin Periodontol 39, 1149-1158. doi:10.1111/jcpe.12004.
Fine, D. H. (2009) Of mice and men: animal models of human periodontal disease. J Clin Periodontol 36, 913-914. doi:10.1111/j.1600-051X.2009.01456.x.
Fine, D. H., Goncharoff, P., Schreiner, H., Chang, K. M., Furgang, D. & Figurski, D. (2001) Colonization and persistence of rough and smooth colony variants of Actinobacillus actinomycetemcomitans in the mouths of rats. Arch Oral Biol 46, 1065-1078.
Fine, D. H., Markowitz, K., Furgang, D., Fairlie, K., Ferrandiz, J., Nasri, C., McKiernan, M. & Gunsolley, J. (2007) Aggregatibacter actinomycetemcomitans and its relationship to initiation of localized aggressive periodontitis: longitudinal cohort study of initially healthy adolescents. J Clin Microbiol 45, 3859-3869. doi:10.1128/JCM.00653-07.
Fine, D. H., Velliyagounder, K., Furgang, D. & Kaplan, J. B. (2005) The Actinobacillus actinomycetemcomitans autotransporter adhesin Aae exhibits specificity for buccal epithelial cells from humans and old world primates. Infect Immun 73, 1947-1953. doi:10.1128/IAI.73.4.1947-1953.2005.

115
Fransson, C., Berglundh, T. & Lindhe, J. (1996) The effect of age on the development of gingivitis. Clinical, microbiological and histological findings. J Clin Periodontol 23, 379-385.
Fredman, G., Oh, S. F., Ayilavarapu, S., Hasturk, H., Serhan, C. N. & Van Dyke, T. E. (2011) Impaired phagocytosis in localized aggressive periodontitis: rescue by Resolvin E1. PLoS One 6, e24422. doi:10.1371/journal.pone.0024422.
Gao, L., Faibish, D., Fredman, G., Herrera, B. S., Chiang, N., Serhan, C. N., Van Dyke, T. E. & Gyurko, R. (2013) Resolvin E1 and chemokine-like receptor 1 mediate bone preservation. J Immunol 190, 689-694. doi:10.4049/jimmunol.1103688.
Garlet, G. P., Avila-Campos, M. J., Milanezi, C. M., Ferreira, B. R. & Silva, J. S. (2005) Actinobacillus actinomycetemcomitans-induced periodontal disease in mice: patterns of cytokine, chemokine, and chemokine receptor expression and leukocyte migration. Microbes Infect 7, 738-747. doi:10.1016/j.micinf.2005.01.012.
Garlet, G. P., Cardoso, C. R., Silva, T. A., Ferreira, B. R., Avila-Campos, M. J., Cunha, F. Q. & Silva, J. S. (2006) Cytokine pattern determines the progression of experimental periodontal disease induced by Actinobacillus actinomycetemcomitans through the modulation of MMPs, RANKL, and their physiological inhibitors. Oral Microbiol Immunol 21, 12-20. doi:10.1111/j.1399-302X.2005.00245.x.
Gaspersic, R., Stiblar-Martincic, D., Osredkar, J. & Skaleric, U. (2003) Influence of subcutaneous administration of recombinant TNF-alpha on ligature-induced periodontitis in rats. J Periodontal Res 38, 198-203.
Gemmell, E., Bird, P. S., Ford, P. J., Ashman, R. B., Gosling, P., Hu, Y. & Seymour, G. J. (2004) Modulation of the antibody response by Porphyromonas gingivalis and Fusobacterium nucleatum in a mouse model. Oral Microbiol Immunol 19, 247-251. doi:10.1111/j.1399-302X.2004.00147.x.
Gibbs, R. A., Weinstock, G. M., Metzker, M. L., Muzny, D. M., Sodergren, E. J., Scherer, S., Scott, G., Steffen, D., Worley, K. C., Burch, P. E., Okwuonu, G., Hines, S., Lewis, L., DeRamo, C., Delgado, O., Dugan-Rocha, S., Miner, G., Morgan, M., Hawes, A., Gill, R., Celera, Holt, R. A., Adams, M. D., Amanatides, P. G., Baden-Tillson, H., Barnstead, M., Chin, S., Evans, C. A., Ferriera, S., Fosler, C., Glodek, A., Gu, Z., Jennings, D., Kraft, C. L., Nguyen, T., Pfannkoch, C. M., Sitter, C., Sutton, G. G., Venter, J. C., Woodage, T., Smith, D., Lee, H. M., Gustafson, E., Cahill, P., Kana, A., Doucette-Stamm, L., Weinstock, K., Fechtel, K., Weiss, R. B., Dunn, D. M., Green, E. D., Blakesley, R. W., Bouffard, G. G., De Jong, P. J., Osoegawa, K., Zhu, B., Marra, M., Schein, J., Bosdet, I., Fjell, C., Jones, S., Krzywinski, M., Mathewson, C., Siddiqui, A., Wye, N., McPherson, J., Zhao, S., Fraser, C. M., Shetty, J., Shatsman, S., Geer, K., Chen, Y., Abramzon, S., Nierman, W. C., Havlak, P. H., Chen, R., Durbin, K. J., Egan, A., Ren, Y., Song, X. Z., Li, B., Liu, Y., Qin, X., Cawley, S., Worley, K. C., Cooney, A. J., D'Souza, L. M., Martin, K., Wu, J. Q., Gonzalez-Garay, M. L., Jackson, A. R., Kalafus, K. J., McLeod, M. P., Milosavljevic, A., Virk, D., Volkov, A., Wheeler, D. A., Zhang, Z., Bailey, J. A., Eichler, E. E., Tuzun, E., Birney, E., Mongin, E.,

116
Ureta-Vidal, A., Woodwark, C., Zdobnov, E., Bork, P., Suyama, M., Torrents, D., Alexandersson, M., Trask, B. J., Young, J. M., Huang, H., Wang, H., Xing, H., Daniels, S., Gietzen, D., Schmidt, J., Stevens, K., Vitt, U., Wingrove, J., Camara, F., Mar Alba, M., Abril, J. F., Guigo, R., Smit, A., Dubchak, I., Rubin, E. M., Couronne, O., Poliakov, A., Hubner, N., Ganten, D., Goesele, C., Hummel, O., Kreitler, T., Lee, Y. A., Monti, J., Schulz, H., Zimdahl, H., Himmelbauer, H., Lehrach, H., Jacob, H. J., Bromberg, S., Gullings-Handley, J., Jensen-Seaman, M. I., Kwitek, A. E., Lazar, J., Pasko, D., Tonellato, P. J., Twigger, S., Ponting, C. P., Duarte, J. M., Rice, S., Goodstadt, L., Beatson, S. A., Emes, R. D., Winter, E. E., Webber, C., Brandt, P., Nyakatura, G., Adetobi, M., Chiaromonte, F., Elnitski, L., Eswara, P., Hardison, R. C., Hou, M., Kolbe, D., Makova, K., Miller, W., Nekrutenko, A., Riemer, C., Schwartz, S., Taylor, J., Yang, S., Zhang, Y., Lindpaintner, K., Andrews, T. D., Caccamo, M., Clamp, M., Clarke, L., Curwen, V., Durbin, R., Eyras, E., Searle, S. M., Cooper, G. M., Batzoglou, S., Brudno, M., Sidow, A., Stone, E. A., Venter, J. C., Payseur, B. A., Bourque, G., Lopez-Otin, C., Puente, X. S., Chakrabarti, K., Chatterji, S., Dewey, C., Pachter, L., Bray, N., Yap, V. B., Caspi, A., Tesler, G., Pevzner, P. A., Haussler, D., Roskin, K. M., Baertsch, R., Clawson, H., Furey, T. S., Hinrichs, A. S., Karolchik, D., Kent, W. J., Rosenbloom, K. R., Trumbower, H., Weirauch, M., Cooper, D. N., Stenson, P. D., Ma, B., Brent, M., Arumugam, M., Shteynberg, D., Copley, R. R., Taylor, M. S., Riethman, H., Mudunuri, U., Peterson, J., Guyer, M., Felsenfeld, A., Old, S., Mockrin, S., Collins, F. & Rat Genome Sequencing Project, C. (2004) Genome sequence of the Brown Norway rat yields insights into mammalian evolution. Nature 428, 493-521. doi:10.1038/nature02426.
Gilroy, D. W., Tomlinson, A. & Willoughby, D. A. (1998) Differential effects of inhibition of isoforms of cyclooxygenase (COX-1, COX-2) in chronic inflammation. Inflamm Res 47, 79-85.
Godwin, J. W., Pinto, A. R. & Rosenthal, N. A. (2013) Macrophages are required for adult salamander limb regeneration. Proc Natl Acad Sci U S A 110, 9415-9420. doi:10.1073/pnas.1300290110.
Goodson, J. M., Haffajee, A. D., Socransky, S. S., Kent, R., Teles, R., Hasturk, H., Bogren, A., Van Dyke, T., Wennstrom, J. & Lindhe, J. (2012) Control of periodontal infections: a randomized controlled trial I. The primary outcome attachment gain and pocket depth reduction at treated sites. J Clin Periodontol 39, 526-536. doi:10.1111/j.1600-051X.2012.01870.x.
Grant, P. R. & Mulvihill, J. E. (1972) The fine structure of gingivitis in the beagle. 3. Plasma cell infiltration of the subepithelial connective tissue. J Periodontal Res 7, 161-172.
Graves, D. (2008) Cytokines that promote periodontal tissue destruction. J Periodontol 79, 1585-1591. doi:10.1902/jop.2008.080183.
Graves, D. T., Fine, D., Teng, Y. T., Van Dyke, T. E. & Hajishengallis, G. (2008) The use of rodent models to investigate host-bacteria interactions related to periodontal diseases. J Clin Periodontol 35, 89-105. doi:10.1111/j.1600-051X.2007.01172.x.

117
Graves, D. T., Kang, J., Andriankaja, O., Wada, K. & Rossa, C., Jr. (2012) Animal models to study host-bacteria interactions involved in periodontitis. Front Oral Biol 15, 117-132. doi:10.1159/000329675.
Graves, D. T., Naguib, G., Lu, H., Leone, C., Hsue, H. & Krall, E. (2005) Inflammation is more persistent in type 1 diabetic mice. J Dent Res 84, 324-328.
Griffen, A. L., Beall, C. J., Campbell, J. H., Firestone, N. D., Kumar, P. S., Yang, Z. K., Podar, M. & Leys, E. J. (2012) Distinct and complex bacterial profiles in human periodontitis and health revealed by 16S pyrosequencing. ISME J 6, 1176-1185. doi:10.1038/ismej.2011.191.
Gronert, K., Gewirtz, A., Madara, J. L. & Serhan, C. N. (1998) Identification of a human enterocyte lipoxin A4 receptor that is regulated by interleukin (IL)-13 and interferon gamma and inhibits tumor necrosis factor alpha-induced IL-8 release. J Exp Med 187, 1285-1294.
Gyorfi, A., Fazekas, A., Suba, Z., Ender, F. & Rosivall, L. (1994) Neurogenic component in ligature-induced periodontitis in the rat. J Clin Periodontol 21, 601-605.
Haffajee, A. D. & Socransky, S. S. (1994) Microbial etiological agents of destructive periodontal diseases. Periodontol 2000 5, 78-111.
Haffajee, A. D., Socransky, S. S., Patel, M. R. & Song, X. (2008) Microbial complexes in supragingival plaque. Oral Microbiol Immunol 23, 196-205. doi:10.1111/j.1399-302X.2007.00411.x.
Haffajee, A. D., Teles, R. P. & Socransky, S. S. (2006) The effect of periodontal therapy on the composition of the subgingival microbiota. Periodontol 2000 42, 219-258. doi:10.1111/j.1600-0757.2006.00191.x.
Hajishengallis, G., Liang, S., Payne, M. A., Hashim, A., Jotwani, R., Eskan, M. A., McIntosh, M. L., Alsam, A., Kirkwood, K. L., Lambris, J. D., Darveau, R. P. & Curtis, M. A. (2011) Low-abundance biofilm species orchestrates inflammatory periodontal disease through the commensal microbiota and complement. Cell Host Microbe 10, 497-506. doi:10.1016/j.chom.2011.10.006.
Haney, J. M., Zimmerman, G. J. & Wikesjo, U. M. (1995) Periodontal repair in dogs: evaluation of the natural disease model. J Clin Periodontol 22, 208-213.
Hasturk, H., Kantarci, A., Goguet-Surmenian, E., Blackwood, A., Andry, C., Serhan, C. N. & Van Dyke, T. E. (2007) Resolvin E1 regulates inflammation at the cellular and tissue level and restores tissue homeostasis in vivo. J Immunol 179, 7021-7029.
Hasturk, H., Kantarci, A., Ohira, T., Arita, M., Ebrahimi, N., Chiang, N., Petasis, N. A., Levy, B. D., Serhan, C. N. & Van Dyke, T. E. (2006) RvE1 protects from local inflammation and osteoclast- mediated bone destruction in periodontitis. FASEB J 20, 401-403. doi:10.1096/fj.05-4724fje.
Hausmann, E., Weinfeld, N. & Miller, W. A. (1972) Effects of lipopolysaccharides on bone resorption in tissue culture. Calcif Tissue Res 9, 272-282.
Haworth, O., Cernadas, M., Yang, R., Serhan, C. N. & Levy, B. D. (2008) Resolvin E1 regulates interleukin 23, interferon-gamma and lipoxin A4 to promote the resolution of allergic airway inflammation. Nat Immunol 9, 873-879. doi:ni.1627 [pii]

118
10.1038/ni.1627. Heitz-Mayfield, L. J. & Lang, N. P. (2013) Surgical and nonsurgical periodontal therapy.
Learned and unlearned concepts. Periodontol 2000 62, 218-231. doi:10.1111/prd.12008.
Henao-Mejia, J., Elinav, E., Jin, C., Hao, L., Mehal, W. Z., Strowig, T., Thaiss, C. A., Kau, A. L., Eisenbarth, S. C., Jurczak, M. J., Camporez, J. P., Shulman, G. I., Gordon, J. I., Hoffman, H. M. & Flavell, R. A. (2012) Inflammasome-mediated dysbiosis regulates progression of NAFLD and obesity. Nature 482, 179-185. doi:10.1038/nature10809.
Herrera, B. S., Ohira, T., Gao, L., Omori, K., Yang, R., Zhu, M., Muscara, M. N., Serhan, C. N., Van Dyke, T. E. & Gyurko, R. (2008) An endogenous regulator of inflammation, resolvin E1, modulates osteoclast differentiation and bone resorption. Br J Pharmacol 155, 1214-1223. doi:bjp2008367 [pii]
10.1038/bjp.2008.367. Hiyari, S., Atti, E., Camargo, P. M., Eskin, E., Lusis, A. J., Tetradis, S. & Pirih, F. Q.
(2015) Heritability of periodontal bone loss in mice. J Periodontal Res. doi:10.1111/jre.12258.
Holzhausen, M., Rossa Junior, C., Marcantonio Junior, E., Nassar, P. O., Spolidorio, D. M. & Spolidorio, L. C. (2002) Effect of selective cyclooxygenase-2 inhibition on the development of ligature-induced periodontitis in rats. J Periodontol 73, 1030-1036. doi:10.1902/jop.2002.73.9.1030.
Horz, H. P., Scheer, S., Huenger, F., Vianna, M. E. & Conrads, G. (2008) Selective isolation of bacterial DNA from human clinical specimens. J Microbiol Methods 72, 98-102. doi:10.1016/j.mimet.2007.10.007.
Horz, H. P., Scheer, S., Vianna, M. E. & Conrads, G. (2010) New methods for selective isolation of bacterial DNA from human clinical specimens. Anaerobe 16, 47-53. doi:10.1016/j.anaerobe.2009.04.009.
Howell, T. H. (1993) Blocking periodontal disease progression with anti-inflammatory agents. J Periodontol 64, 828-833.
Jablonski, P., Howden, B. O. & Baxter, K. (2001) Influence of buprenorphine analgesia on post-operative recovery in two strains of rats. Lab Anim 35, 213-222.
Jan Lindhe, N. P. L., Thorkild Karring (2008) Clinical Periodontology and Implant Dentistry, 5th Edition, Volume 1: Basic Concepts, Chapter 11. Pathogenesis of Periodontitis
Wiley-Blackwell. Jeffcoat, M. K., Reddy, M. S., Haigh, S., Buchanan, W., Doyle, M. J., Meredith, M. P.,
Nelson, S. L., Goodale, M. B. & Wehmeyer, K. R. (1995) A comparison of topical ketorolac, systemic flurbiprofen, and placebo for the inhibition of bone loss in adult periodontitis. J Periodontol 66, 329-338.
Jiao, Y., Darzi, Y., Tawaratsumida, K., Marchesan, J. T., Hasegawa, M., Moon, H., Chen, G. Y., Nunez, G., Giannobile, W. V., Raes, J. & Inohara, N. (2013) Induction of

119
bone loss by pathobiont-mediated Nod1 signaling in the oral cavity. Cell Host Microbe 13, 595-601. doi:10.1016/j.chom.2013.04.005.
Jiao, Y., Hasegawa, M. & Inohara, N. (2014) The Role of Oral Pathobionts in Dysbiosis during Periodontitis Development. J Dent Res 93, 539-546. doi:10.1177/0022034514528212.
Johnson, M. W., Sullivan, S. M., Rohrer, M. & Collier, M. (1997) Regeneration of peri-implant infrabony defects using PerioGlas: a pilot study in rabbits. Int J Oral Maxillofac Implants 12, 835-839.
Kantarci, A., Oyaizu, K. & Van Dyke, T. E. (2003) Neutrophil-mediated tissue injury in periodontal disease pathogenesis: findings from localized aggressive periodontitis. J Periodontol 74, 66-75. doi:10.1902/jop.2003.74.1.66.
Kantor, M. (1980) The behavior of angular bony defects following reduction of inflammation. J Periodontol 51, 433-436. doi:10.1902/jop.1980.51.8.433.
Kebschull, M., Demmer, R. T. & Papapanou, P. N. (2010) "Gum bug, leave my heart alone!"--epidemiologic and mechanistic evidence linking periodontal infections and atherosclerosis. J Dent Res 89, 879-902. doi:0022034510375281 [pii]
10.1177/0022034510375281. Kennedy, J. E. & Polson, A. M. (1973) Experimental marginal periodontitis in squirrel
monkeys. J Periodontol 44, 140-144. doi:10.1902/jop.1973.44.3.140. Kenworthy, R. & Baverel, M. (1981) Studies of a periodontal tissue lesion in the rat,
untreated or treated with chlorhexidine digluconate. J Clin Periodontol 8, 349-358. Kesavalu, L., Sathishkumar, S., Bakthavatchalu, V., Matthews, C., Dawson, D., Steffen,
M. & Ebersole, J. L. (2007) Rat model of polymicrobial infection, immunity, and alveolar bone resorption in periodontal disease. Infect Immun 75, 1704-1712. doi:10.1128/IAI.00733-06.
Keyes, K. T., Ye, Y., Lin, Y., Zhang, C., Perez-Polo, J. R., Gjorstrup, P. & Birnbaum, Y. (2010) Resolvin E1 protects the rat heart against reperfusion injury. Am J Physiol Heart Circ Physiol 299, H153-164. doi:10.1152/ajpheart.01057.2009.
Kim, T. H., Kim, G. D., Jin, Y. H., Park, Y. S. & Park, C. S. (2012) Omega-3 fatty acid-derived mediator, Resolvin E1, ameliorates 2,4-dinitrofluorobenzene-induced atopic dermatitis in NC/Nga mice. Int Immunopharmacol 14, 384-391. doi:10.1016/j.intimp.2012.08.005.
Klausen, B. (1991) Microbiological and immunological aspects of experimental periodontal disease in rats: a review article. J Periodontol 62, 59-73. doi:10.1902/jop.1991.62.1.59.
Kolenbrander, P. E. & London, J. (1993) Adhere today, here tomorrow: oral bacterial adherence. J Bacteriol 175, 3247-3252.
Kolenbrander, P. E., Palmer, R. J., Jr., Periasamy, S. & Jakubovics, N. S. (2010) Oral multispecies biofilm development and the key role of cell-cell distance. Nat Rev Microbiol 8, 471-480. doi:10.1038/nrmicro2381.
Kopitar, A. N., Ihan Hren, N. & Ihan, A. (2006) Commensal oral bacteria antigens prime human dendritic cells to induce Th1, Th2 or Treg differentiation. Oral Microbiol Immunol 21, 1-5. doi:10.1111/j.1399-302X.2005.00237.x.

120
Kuhr, A., Popa-Wagner, A., Schmoll, H., Schwahn, C. & Kocher, T. (2004) Observations on experimental marginal periodontitis in rats. J Periodontal Res 39, 101-106.
Lalla, E., Lamster, I. B., Feit, M., Huang, L. & Schmidt, A. M. (1998) A murine model of accelerated periodontal disease in diabetes. J Periodontal Res 33, 387-399.
Lalla, E. & Papapanou, P. N. (2011) Diabetes mellitus and periodontitis: a tale of two common interrelated diseases. Nat Rev Endocrinol 7, 738-748. doi:10.1038/nrendo.2011.106
nrendo.2011.106 [pii]. Lang, H., Schuler, N. & Nolden, R. (1998) Attachment formation following replantation
of cultured cells into periodontal defects--a study in minipigs. J Dent Res 77, 393-405.
Lee, S. F., Andrian, E., Rowland, E. & Marquez, I. C. (2009) Immune response and alveolar bone resorption in a mouse model of Treponema denticola infection. Infect Immun 77, 694-698. doi:10.1128/IAI.01004-08.
Levy, B. D. (2012) Resolvin D1 and Resolvin E1 Promote the Resolution of Allergic Airway Inflammation via Shared and Distinct Molecular Counter-Regulatory Pathways. Front Immunol 3, 390. doi:10.3389/fimmu.2012.00390.
Levy, B. D., Clish, C. B., Schmidt, B., Gronert, K. & Serhan, C. N. (2001) Lipid mediator class switching during acute inflammation: signals in resolution. Nat Immunol 2, 612-619. doi:10.1038/89759.
Li, L., Khansari, A., Shapira, L., Graves, D. T. & Amar, S. (2002) Contribution of interleukin-11 and prostaglandin(s) in lipopolysaccharide-induced bone resorption in vivo. Infect Immun 70, 3915-3922.
Li, Y., He, J., He, Z., Zhou, Y., Yuan, M., Xu, X., Sun, F., Liu, C., Li, J., Xie, W., Deng, Y., Qin, Y., VanNostrand, J. D., Xiao, L., Wu, L., Zhou, J., Shi, W. & Zhou, X. (2014) Phylogenetic and functional gene structure shifts of the oral microbiomes in periodontitis patients. ISME J 8, 1879-1891. doi:10.1038/ismej.2014.28.
Li, Y., Messina, C., Bendaoud, M., Fine, D. H., Schreiner, H. & Tsiagbe, V. K. (2010) Adaptive immune response in osteoclastic bone resorption induced by orally administered Aggregatibacter actinomycetemcomitans in a rat model of periodontal disease. Mol Oral Microbiol 25, 275-292. doi:10.1111/j.2041-1014.2010.00576.x.
Liang, S., Hosur, K. B., Domon, H. & Hajishengallis, G. (2010) Periodontal inflammation and bone loss in aged mice. J Periodontal Res 45, 574-578. doi:10.1111/j.1600-0765.2009.01245.x.
Lindhe, J., Berglundh, T., Ericsson, I., Liljenberg, B. & Marinello, C. (1992) Experimental breakdown of peri-implant and periodontal tissues. A study in the beagle dog. Clin Oral Implants Res 3, 9-16.
Lindhe, J., Hamp, S. & Loe, H. (1973) Experimental periodontitis in the beagle dog. J Periodontal Res 8, 1-10.
Lindhe, J. & Rylander, H. (1975) Experimental gingivitis in young dogs. Scand J Dent Res 83, 314-326.

121
Liu, B., Faller, L. L., Klitgord, N., Mazumdar, V., Ghodsi, M., Sommer, D. D., Gibbons, T. R., Treangen, T. J., Chang, Y. C., Li, S., Stine, O. C., Hasturk, H., Kasif, S., Segre, D., Pop, M. & Amar, S. (2012) Deep sequencing of the oral microbiome reveals signatures of periodontal disease. PLoS One 7, e37919. doi:10.1371/journal.pone.0037919.
Liu, R., Bal, H. S., Desta, T., Krothapalli, N., Alyassi, M., Luan, Q. & Graves, D. T. (2006) Diabetes enhances periodontal bone loss through enhanced resorption and diminished bone formation. J Dent Res 85, 510-514.
Lozupone, C., Hamady, M. & Knight, R. (2006) UniFrac--an online tool for comparing microbial community diversity in a phylogenetic context. BMC Bioinformatics 7, 371. doi:10.1186/1471-2105-7-371.
Mager, D. L., Ximenez-Fyvie, L. A., Haffajee, A. D. & Socransky, S. S. (2003) Distribution of selected bacterial species on intraoral surfaces. J Clin Periodontol 30, 644-654.
Manrique, P., Freire, M. O., Chen, C., Zadeh, H. H., Young, M. & Suci, P. (2013) Perturbation of the indigenous rat oral microbiome by ciprofloxacin dosing. Mol Oral Microbiol 28, 404-414. doi:10.1111/omi.12033.
Markworth, J. F., Vella, L., Lingard, B. S., Tull, D. L., Rupasinghe, T. W., Sinclair, A. J., Maddipati, K. R. & Cameron-Smith, D. (2013) Human inflammatory and resolving lipid mediator responses to resistance exercise and ibuprofen treatment. Am J Physiol Regul Integr Comp Physiol 305, R1281-1296. doi:10.1152/ajpregu.00128.2013.
Marsh, P. D. (1994) Microbial ecology of dental plaque and its significance in health and disease. Adv Dent Res 8, 263-271.
Marsh, P. D. (2003) Are dental diseases examples of ecological catastrophes? Microbiology 149, 279-294.
Marsh, P. D. & Devine, D. A. (2011) How is the development of dental biofilms influenced by the host? J Clin Periodontol 38 Suppl 11, 28-35. doi:10.1111/j.1600-051X.2010.01673.x.
Mayanagi, G., Sato, T., Shimauchi, H. & Takahashi, N. (2004) Detection frequency of periodontitis-associated bacteria by polymerase chain reaction in subgingival and supragingival plaque of periodontitis and healthy subjects. Oral Microbiol Immunol 19, 379-385. doi:10.1111/j.1399-302x.2004.00172.x.
Mestas, J. & Hughes, C. C. (2004) Of mice and not men: differences between mouse and human immunology. J Immunol 172, 2731-2738.
Mikkelsen, L., Theilade, E. & Poulsen, K. (2000) Abiotrophia species in early dental plaque. Oral Microbiol Immunol 15, 263-268.
Moughal, N. A., Adonogianaki, E., Thornhill, M. H. & Kinane, D. F. (1992) Endothelial cell leukocyte adhesion molecule-1 (ELAM-1) and intercellular adhesion molecule-1 (ICAM-1) expression in gingival tissue during health and experimentally-induced gingivitis. J Periodontal Res 27, 623-630.
Mouse Genome Sequencing, C., Waterston, R. H., Lindblad-Toh, K., Birney, E., Rogers, J., Abril, J. F., Agarwal, P., Agarwala, R., Ainscough, R., Alexandersson, M., An, P., Antonarakis, S. E., Attwood, J., Baertsch, R., Bailey, J., Barlow, K., Beck, S.,

122
Berry, E., Birren, B., Bloom, T., Bork, P., Botcherby, M., Bray, N., Brent, M. R., Brown, D. G., Brown, S. D., Bult, C., Burton, J., Butler, J., Campbell, R. D., Carninci, P., Cawley, S., Chiaromonte, F., Chinwalla, A. T., Church, D. M., Clamp, M., Clee, C., Collins, F. S., Cook, L. L., Copley, R. R., Coulson, A., Couronne, O., Cuff, J., Curwen, V., Cutts, T., Daly, M., David, R., Davies, J., Delehaunty, K. D., Deri, J., Dermitzakis, E. T., Dewey, C., Dickens, N. J., Diekhans, M., Dodge, S., Dubchak, I., Dunn, D. M., Eddy, S. R., Elnitski, L., Emes, R. D., Eswara, P., Eyras, E., Felsenfeld, A., Fewell, G. A., Flicek, P., Foley, K., Frankel, W. N., Fulton, L. A., Fulton, R. S., Furey, T. S., Gage, D., Gibbs, R. A., Glusman, G., Gnerre, S., Goldman, N., Goodstadt, L., Grafham, D., Graves, T. A., Green, E. D., Gregory, S., Guigo, R., Guyer, M., Hardison, R. C., Haussler, D., Hayashizaki, Y., Hillier, L. W., Hinrichs, A., Hlavina, W., Holzer, T., Hsu, F., Hua, A., Hubbard, T., Hunt, A., Jackson, I., Jaffe, D. B., Johnson, L. S., Jones, M., Jones, T. A., Joy, A., Kamal, M., Karlsson, E. K., Karolchik, D., Kasprzyk, A., Kawai, J., Keibler, E., Kells, C., Kent, W. J., Kirby, A., Kolbe, D. L., Korf, I., Kucherlapati, R. S., Kulbokas, E. J., Kulp, D., Landers, T., Leger, J. P., Leonard, S., Letunic, I., Levine, R., Li, J., Li, M., Lloyd, C., Lucas, S., Ma, B., Maglott, D. R., Mardis, E. R., Matthews, L., Mauceli, E., Mayer, J. H., McCarthy, M., McCombie, W. R., McLaren, S., McLay, K., McPherson, J. D., Meldrim, J., Meredith, B., Mesirov, J. P., Miller, W., Miner, T. L., Mongin, E., Montgomery, K. T., Morgan, M., Mott, R., Mullikin, J. C., Muzny, D. M., Nash, W. E., Nelson, J. O., Nhan, M. N., Nicol, R., Ning, Z., Nusbaum, C., O'Connor, M. J., Okazaki, Y., Oliver, K., Overton-Larty, E., Pachter, L., Parra, G., Pepin, K. H., Peterson, J., Pevzner, P., Plumb, R., Pohl, C. S., Poliakov, A., Ponce, T. C., Ponting, C. P., Potter, S., Quail, M., Reymond, A., Roe, B. A., Roskin, K. M., Rubin, E. M., Rust, A. G., Santos, R., Sapojnikov, V., Schultz, B., Schultz, J., Schwartz, M. S., Schwartz, S., Scott, C., Seaman, S., Searle, S., Sharpe, T., Sheridan, A., Shownkeen, R., Sims, S., Singer, J. B., Slater, G., Smit, A., Smith, D. R., Spencer, B., Stabenau, A., Stange-Thomann, N., Sugnet, C., Suyama, M., Tesler, G., Thompson, J., Torrents, D., Trevaskis, E., Tromp, J., Ucla, C., Ureta-Vidal, A., Vinson, J. P., Von Niederhausern, A. C., Wade, C. M., Wall, M., Weber, R. J., Weiss, R. B., Wendl, M. C., West, A. P., Wetterstrand, K., Wheeler, R., Whelan, S., Wierzbowski, J., Willey, D., Williams, S., Wilson, R. K., Winter, E., Worley, K. C., Wyman, D., Yang, S., Yang, S. P., Zdobnov, E. M., Zody, M. C. & Lander, E. S. (2002) Initial sequencing and comparative analysis of the mouse genome. Nature 420, 520-562. doi:10.1038/nature01262.
Mustafa, M., Zarrough, A., Bolstad, A. I., Lygre, H., Mustafa, K., Hasturk, H., Serhan, C., Kantarci, A. & Van Dyke, T. E. (2013) Resolvin D1 protects periodontal ligament. Am J Physiol Cell Physiol 305, C673-679. doi:10.1152/ajpcell.00242.2012.
Nakamura-Kiyama, M., Ono, K., Masuda, W., Hitomi, S., Matsuo, K., Usui, M., Nakashima, K., Yokota, M. & Inenaga, K. (2014) Changes of salivary functions in experimental periodontitis model rats. Arch Oral Biol 59, 125-132. doi:10.1016/j.archoralbio.2013.11.001.

123
Nakamura, H., Fukusaki, Y., Yoshimura, A., Shiraishi, C., Kishimoto, M., Kaneko, T. & Hara, Y. (2008) Lack of Toll-like receptor 4 decreases lipopolysaccharide-induced bone resorption in C3H/HeJ mice in vivo. Oral Microbiol Immunol 23, 190-195. doi:10.1111/j.1399-302X.2007.00410.x.
Oh, S. F., Dona, M., Fredman, G., Krishnamoorthy, S., Irimia, D. & Serhan, C. N. (2012) Resolvin E2 formation and impact in inflammation resolution. J Immunol 188, 4527-4534. doi:10.4049/jimmunol.1103652.
Oh, S. F., Pillai, P. S., Recchiuti, A., Yang, R. & Serhan, C. N. (2011) Pro-resolving actions and stereoselective biosynthesis of 18S E-series resolvins in human leukocytes and murine inflammation. J Clin Invest 121, 569-581. doi:10.1172/JCI42545.
Ohira, T., Arita, M., Omori, K., Recchiuti, A., Van Dyke, T. E. & Serhan, C. N. (2010) Resolvin E1 receptor activation signals phosphorylation and phagocytosis. J Biol Chem 285, 3451-3461. doi:M109.044131 [pii]
10.1074/jbc.M109.044131. Okada, Y., Hamada, N., Kim, Y., Takahashi, Y., Sasaguri, K., Ozono, S. & Sato, S.
(2010) Blockade of sympathetic b-receptors inhibits Porphyromonas gingivalis-induced alveolar bone loss in an experimental rat periodontitis model. Arch Oral Biol 55, 502-508. doi:10.1016/j.archoralbio.2010.04.002.
Olson, T. S. & Ley, K. (2002) Chemokines and chemokine receptors in leukocyte trafficking. Am J Physiol Regul Integr Comp Physiol 283, R7-28. doi:10.1152/ajpregu.00738.2001.
Oz, H. S. & Puleo, D. A. (2011) Animal models for periodontal disease. J Biomed Biotechnol 2011, 754857. doi:10.1155/2011/754857.
Page, R. C. & Schroeder, H. E. (1976) Pathogenesis of inflammatory periodontal disease. A summary of current work. Lab Invest 34, 235-249.
Paster, B. J., Boches, S. K., Galvin, J. L., Ericson, R. E., Lau, C. N., Levanos, V. A., Sahasrabudhe, A. & Dewhirst, F. E. (2001) Bacterial diversity in human subgingival plaque. J Bacteriol 183, 3770-3783. doi:10.1128/JB.183.12.3770-3783.2001.
Paster, B. J., Olsen, I., Aas, J. A. & Dewhirst, F. E. (2006) The breadth of bacterial diversity in the human periodontal pocket and other oral sites. Periodontol 2000 42, 80-87. doi:10.1111/j.1600-0757.2006.00174.x.
Pihlstrom, B. L., Michalowicz, B. S. & Johnson, N. W. (2005) Periodontal diseases. Lancet 366, 1809-1820. doi:10.1016/S0140-6736(05)67728-8.
Quast, C., Pruesse, E., Yilmaz, P., Gerken, J., Schweer, T., Yarza, P., Peplies, J. & Glockner, F. O. (2013) The SILVA ribosomal RNA gene database project: improved data processing and web-based tools. Nucleic Acids Res 41, D590-596. doi:10.1093/nar/gks1219.
Ramon, S., Gao, F., Serhan, C. N. & Phipps, R. P. (2012) Specialized proresolving mediators enhance human B cell differentiation to antibody-secreting cells. J Immunol 189, 1036-1042. doi:10.4049/jimmunol.1103483.

124
Risso, A. (2000) Leukocyte antimicrobial peptides: multifunctional effector molecules of innate immunity. J Leukoc Biol 68, 785-792.
Rober, M., Quirynen, M., Haffajee, A. D., Schepers, E. & Teughels, W. (2008) Intra-oral microbial profiles of beagle dogs assessed by checkerboard DNA-DNA hybridization using human probes. Vet Microbiol 127, 79-88. doi:10.1016/j.vetmic.2007.08.007.
Robertson, D. & Smith, A. J. (2009) The microbiology of the acute dental abscess. J Med Microbiol 58, 155-162. doi:10.1099/jmm.0.003517-0.
Rogers, J. E., Li, F., Coatney, D. D., Rossa, C., Bronson, P., Krieder, J. M., Giannobile, W. V. & Kirkwood, K. L. (2007) Actinobacillus actinomycetemcomitans lipopolysaccharide-mediated experimental bone loss model for aggressive periodontitis. J Periodontol 78, 550-558. doi:10.1902/jop.2007.060321.
Romano, M. & Serhan, C. N. (1992) Lipoxin generation by permeabilized human platelets. Biochemistry 31, 8269-8277.
Round, J. L. & Mazmanian, S. K. (2009) The gut microbiota shapes intestinal immune responses during health and disease. Nat Rev Immunol 9, 313-323. doi:10.1038/nri2515.
Rovin, S., Costich, E. R. & Gordon, H. A. (1966) The influence of bacteria and irritation in the initiation of periodontal disease in germfree and conventional rats. J Periodontal Res 1, 193-204.
Roy C. Page, H. E. S. (1982) Periodontitis in Man and Other Animals: A Comparative Review S Karger Pub.
Sakamoto, M., Takeuchi, Y., Umeda, M., Ishikawa, I. & Benno, Y. (2001) Rapid detection and quantification of five periodontopathic bacteria by real-time PCR. Microbiol Immunol 45, 39-44.
Samejima, Y., Ebisu, S. & Okada, H. (1990) Effect of infection with Eikenella corrodens on the progression of ligature-induced periodontitis in rats. J Periodontal Res 25, 308-315.
Sartori, R., Li, F. & Kirkwood, K. L. (2009) MAP kinase phosphatase-1 protects against inflammatory bone loss. J Dent Res 88, 1125-1130. doi:10.1177/0022034509349306.
Schmitt, J. M., Buck, D. C., Joh, S. P., Lynch, S. E. & Hollinger, J. O. (1997) Comparison of porous bone mineral and biologically active glass in critical-sized defects. J Periodontol 68, 1043-1053. doi:10.1902/jop.1997.68.11.1043.
Schou, S., Holmstrup, P. & Kornman, K. S. (1993) Non-human primates used in studies of periodontal disease pathogenesis: a review of the literature. J Periodontol 64, 497-508. doi:10.1902/jop.1993.64.6.497.
Schreiner, H. C., Sinatra, K., Kaplan, J. B., Furgang, D., Kachlany, S. C., Planet, P. J., Perez, B. A., Figurski, D. H. & Fine, D. H. (2003) Tight-adherence genes of Actinobacillus actinomycetemcomitans are required for virulence in a rat model. Proc Natl Acad Sci U S A 100, 7295-7300. doi:10.1073/pnas.1237223100.
Schroeder, H. E. (1970) Quantitative parameters of early human gingival inflammation. Arch Oral Biol 15, 383-400.

125
Schwab, J. M., Chiang, N., Arita, M. & Serhan, C. N. (2007) Resolvin E1 and protectin D1 activate inflammation-resolution programmes. Nature 447, 869-874. doi:nature05877 [pii]
10.1038/nature05877. Serhan, C. N. (2010) Novel lipid mediators and resolution mechanisms in acute
inflammation: to resolve or not? Am J Pathol 177, 1576-1591. doi:10.2353/ajpath.2010.100322.
Serhan, C. N. (2014) Pro-resolving lipid mediators are leads for resolution physiology. Nature 510, 92-101. doi:10.1038/nature13479.
Serhan, C. N., Brain, S. D., Buckley, C. D., Gilroy, D. W., Haslett, C., O'Neill, L. A., Perretti, M., Rossi, A. G. & Wallace, J. L. (2007) Resolution of inflammation: state of the art, definitions and terms. FASEB J 21, 325-332. doi:10.1096/fj.06-7227rev.
Serhan, C. N., Chiang, N. & Van Dyke, T. E. (2008) Resolving inflammation: dual anti-inflammatory and pro-resolution lipid mediators. Nat Rev Immunol 8, 349-361. doi:10.1038/nri2294.
Serhan, C. N., Clish, C. B., Brannon, J., Colgan, S. P., Chiang, N. & Gronert, K. (2000) Novel functional sets of lipid-derived mediators with antiinflammatory actions generated from omega-3 fatty acids via cyclooxygenase 2-nonsteroidal antiinflammatory drugs and transcellular processing. J Exp Med 192, 1197-1204.
Serhan, C. N., Dalli, J., Karamnov, S., Choi, A., Park, C. K., Xu, Z. Z., Ji, R. R., Zhu, M. & Petasis, N. A. (2012) Macrophage proresolving mediator maresin 1 stimulates tissue regeneration and controls pain. FASEB J 26, 1755-1765. doi:10.1096/fj.11-201442.
Serhan, C. N., Hong, S., Gronert, K., Colgan, S. P., Devchand, P. R., Mirick, G. & Moussignac, R. L. (2002) Resolvins: a family of bioactive products of omega-3 fatty acid transformation circuits initiated by aspirin treatment that counter proinflammation signals. J Exp Med 196, 1025-1037.
Serhan, C. N., Jain, A., Marleau, S., Clish, C., Kantarci, A., Behbehani, B., Colgan, S. P., Stahl, G. L., Merched, A., Petasis, N. A., Chan, L. & Van Dyke, T. E. (2003) Reduced inflammation and tissue damage in transgenic rabbits overexpressing 15-lipoxygenase and endogenous anti-inflammatory lipid mediators. J Immunol 171, 6856-6865.
Serhan, C. N. & Savill, J. (2005) Resolution of inflammation: the beginning programs the end. Nat Immunol 6, 1191-1197. doi:10.1038/ni1276.
Serhan, C. N., Yang, R., Martinod, K., Kasuga, K., Pillai, P. S., Porter, T. F., Oh, S. F. & Spite, M. (2009) Maresins: novel macrophage mediators with potent antiinflammatory and proresolving actions. J Exp Med 206, 15-23. doi:10.1084/jem.20081880.
Seymour, G. J., Powell, R. N., Cole, K. L., Aitken, J. F., Brooks, D., Beckman, I., Zola, H., Bradley, J. & Burns, G. F. (1983) Experimental gingivitis in humans. A histochemical and immunological characterization of the lymphoid cell subpopulations. J Periodontal Res 18, 375-385.
126
Sharma, A., Inagaki, S., Honma, K., Sfintescu, C., Baker, P. J. & Evans, R. T. (2005) Tannerella forsythia-induced alveolar bone loss in mice involves leucine-rich-repeat BspA protein. J Dent Res 84, 462-467.
Shay, T., Jojic, V., Zuk, O., Rothamel, K., Puyraimond-Zemmour, D., Feng, T., Wakamatsu, E., Benoist, C., Koller, D., Regev, A. & ImmGen, C. (2013) Conservation and divergence in the transcriptional programs of the human and mouse immune systems. Proc Natl Acad Sci U S A 110, 2946-2951. doi:10.1073/pnas.1222738110.
Shen, J., Herderick, E., Cornhill, J. F., Zsigmond, E., Kim, H. S., Kuhn, H., Guevara, N. V. & Chan, L. (1996) Macrophage-mediated 15-lipoxygenase expression protects against atherosclerosis development. J Clin Invest 98, 2201-2208. doi:10.1172/JCI119029.
Shi, B., Chang, M., Martin, J., Mitreva, M., Lux, R., Klokkevold, P., Sodergren, E., Weinstock, G. M., Haake, S. K. & Li, H. (2015) Dynamic changes in the subgingival microbiome and their potential for diagnosis and prognosis of periodontitis. MBio 6, e01926-01914. doi:10.1128/mBio.01926-14.
Siqueira, J. F., Jr. & Rocas, I. N. (2006) Catonella morbi and Granulicatella adiacens: new species in endodontic infections. Oral Surg Oral Med Oral Pathol Oral Radiol Endod 102, 259-264. doi:10.1016/j.tripleo.2005.09.021.
Slots, J. (2002) Selection of antimicrobial agents in periodontal therapy. J Periodontal Res 37, 389-398.
Soares, G. M., Mendes, J. A., Silva, M. P., Faveri, M., Teles, R., Socransky, S. S., Wang, X., Figueiredo, L. C. & Feres, M. (2014) Metronidazole alone or with amoxicillin as adjuncts to non-surgical treatment of chronic periodontitis: a secondary analysis of microbiological results from a randomized clinical trial. J Clin Periodontol 41, 366-376.
Sobhani, I., Tap, J., Roudot-Thoraval, F., Roperch, J. P., Letulle, S., Langella, P., Corthier, G., Tran Van Nhieu, J. & Furet, J. P. (2011) Microbial dysbiosis in colorectal cancer (CRC) patients. PLoS One 6, e16393. doi:10.1371/journal.pone.0016393.
Socransky, S. S. & Haffajee, A. D. (2005) Periodontal microbial ecology. Periodontol 2000 38, 135-187. doi:10.1111/j.1600-0757.2005.00107.x.
Socransky, S. S., Haffajee, A. D., Cugini, M. A., Smith, C. & Kent, R. L., Jr. (1998) Microbial complexes in subgingival plaque. J Clin Periodontol 25, 134-144.
Socransky, S. S., Haffajee, A. D., Smith, C., Martin, L., Haffajee, J. A., Uzel, N. G. & Goodson, J. M. (2004) Use of checkerboard DNA-DNA hybridization to study complex microbial ecosystems. Oral Microbiol Immunol 19, 352-362. doi:10.1111/j.1399-302x.2004.00168.x.
Socransky, S. S., Smith, C., Martin, L., Paster, B. J., Dewhirst, F. E. & Levin, A. E. (1994) "Checkerboard" DNA-DNA hybridization. Biotechniques 17, 788-792.
Spite, M., Norling, L. V., Summers, L., Yang, R., Cooper, D., Petasis, N. A., Flower, R. J., Perretti, M. & Serhan, C. N. (2009) Resolvin D2 is a potent regulator of leukocytes and controls microbial sepsis. Nature 461, 1287-1291. doi:nature08541 [pii]

127
10.1038/nature08541. Stables, M. J., Shah, S., Camon, E. B., Lovering, R. C., Newson, J., Bystrom, J., Farrow,
S. & Gilroy, D. W. (2011) Transcriptomic analyses of murine resolution-phase macrophages. Blood 118, e192-208. doi:10.1182/blood-2011-04-345330.
Stashenko, P., Dewhirst, F. E., Peros, W. J., Kent, R. L. & Ago, J. M. (1987) Synergistic interactions between interleukin 1, tumor necrosis factor, and lymphotoxin in bone resorption. J Immunol 138, 1464-1468.
Struillou, X., Boutigny, H., Soueidan, A. & Layrolle, P. (2010) Experimental animal models in periodontology: a review. Open Dent J 4, 37-47. doi:10.2174/1874210601004010037.
Takahashi, K., Poole, I. & Kinane, D. F. (1995) Detection of interleukin-1 beta mRNA-expressing cells in human gingival crevicular fluid by in situ hybridization. Arch Oral Biol 40, 941-947.
Tamboli, C. P., Neut, C., Desreumaux, P. & Colombel, J. F. (2004) Dysbiosis in inflammatory bowel disease. Gut 53, 1-4.
Tang, Y., Zhang, M. J., Hellmann, J., Kosuri, M., Bhatnagar, A. & Spite, M. (2013) Proresolution therapy for the treatment of delayed healing of diabetic wounds. Diabetes 62, 618-627. doi:10.2337/db12-0684.
Tanner, A. C., Kent, R., Jr., Kanasi, E., Lu, S. C., Paster, B. J., Sonis, S. T., Murray, L. A. & Van Dyke, T. E. (2007) Clinical characteristics and microbiota of progressing slight chronic periodontitis in adults. J Clin Periodontol 34, 917-930. doi:10.1111/j.1600-051X.2007.01126.x.
Teles F, P. M., Soares GM, Valverde L, Brito LC, Minguez M, Martin L, Cotton S, Krishnan K, McCafferty J, Paster B, Teles RP (2015 ) Validation of Next Generation Sequencing Approaches for Oral Microbiome Studies. 93rd General Session & Exhibition of the IADR (International Association for Dental Research).
Teles, R., Teles, F., Frias-Lopez, J., Paster, B. & Haffajee, A. (2013) Lessons learned and unlearned in periodontal microbiology. Periodontol 2000 62, 95-162. doi:10.1111/prd.12010.
Teles, R. P., Gursky, L. C., Faveri, M., Rosa, E. A., Teles, F. R., Feres, M., Socransky, S. S. & Haffajee, A. D. (2010) Relationships between subgingival microbiota and GCF biomarkers in generalized aggressive periodontitis. J Clin Periodontol 37, 313-323. doi:10.1111/j.1600-051X.2010.01534.x.
Teles, R. P., Haffajee, A. D. & Socransky, S. S. (2006) Microbiological goals of periodontal therapy. Periodontol 2000 42, 180-218. doi:10.1111/j.1600-0757.2006.00192.x.
Thomas, T., Gilbert, J. & Meyer, F. (2012) Metagenomics - a guide from sampling to data analysis. Microb Inform Exp 2, 3. doi:10.1186/2042-5783-2-3.
Tian, H., Lu, Y., Sherwood, A. M., Hongqian, D. & Hong, S. (2009) Resolvins E1 and D1 in choroid-retinal endothelial cells and leukocytes: biosynthesis and mechanisms of anti-inflammatory actions. Invest Ophthalmol Vis Sci 50, 3613-3620. doi:10.1167/iovs.08-3146.

128
Tyrrell, K. L., Citron, D. M., Jenkins, J. R. & Goldstein, E. J. (2002) Periodontal bacteria in rabbit mandibular and maxillary abscesses. J Clin Microbiol 40, 1044-1047.
Uzel, N. G., Teles, F. R., Teles, R. P., Song, X. Q., Torresyap, G., Socransky, S. S. & Haffajee, A. D. (2011) Microbial shifts during dental biofilm re-development in the absence of oral hygiene in periodontal health and disease. J Clin Periodontol 38, 612-620. doi:10.1111/j.1600-051X.2011.01730.x.
Van Dyke, T. E. (2008) The management of inflammation in periodontal disease. J Periodontol 79, 1601-1608. doi:10.1902/jop.2008.080173.
Van Dyke, T. E. (2011) Proresolving lipid mediators: potential for prevention and treatment of periodontitis. J Clin Periodontol 38 Suppl 11, 119-125. doi:10.1111/j.1600-051X.2010.01662.x.
Van Dyke, T. E. (2014) Commentary: periodontitis is characterized by an immuno-inflammatory host-mediated destruction of bone and connective tissues that support the teeth. J Periodontol 85, 509-511. doi:10.1902/jop.2014.130701.
Van Dyke, T. E., Hasturk, H., Kantarci, A., Freire, M. O., Nguyen, D., Dalli, J. & Serhan, C. N. (2015) Proresolving nanomedicines activate bone regeneration in periodontitis. J Dent Res 94, 148-156. doi:10.1177/0022034514557331.
Vetrovsky, T. & Baldrian, P. (2013) The variability of the 16S rRNA gene in bacterial genomes and its consequences for bacterial community analyses. PLoS One 8, e57923. doi:10.1371/journal.pone.0057923.
Wallace, J. L. & Fiorucci, S. (2003) A magic bullet for mucosal protection...and aspirin is the trigger! Trends Pharmacol Sci 24, 323-326. doi:10.1016/S0165-6147(03)00166-4.
Wang, S., Liu, Y., Fang, D. & Shi, S. (2007) The miniature pig: a useful large animal model for dental and orofacial research. Oral Dis 13, 530-537. doi:10.1111/j.1601-0825.2006.01337.x.
Weiner, G. S., DeMarco, T. J. & Bissada, N. F. (1979) Long term effect of systemic tetracycline administration on the severity of induced periodontitis in the rat. J Periodontol 50, 619-623. doi:10.1902/jop.1979.50.12.619.
Wikesjo, U. M., Lim, W. H., Thomson, R. C. & Hardwick, W. R. (2003) Periodontal repair in dogs: gingival tissue occlusion, a critical requirement for GTR? J Clin Periodontol 30, 655-664.
Williams, R. C., Jeffcoat, M. K., Howell, T. H., Rolla, A., Stubbs, D., Teoh, K. W., Reddy, M. S. & Goldhaber, P. (1989) Altering the progression of human alveolar bone loss with the non-steroidal anti-inflammatory drug flurbiprofen. J Periodontol 60, 485-490. doi:10.1902/jop.1989.60.9.485.
Xu, Z. Z., Zhang, L., Liu, T., Park, J. Y., Berta, T., Yang, R., Serhan, C. N. & Ji, R. R. (2010) Resolvins RvE1 and RvD1 attenuate inflammatory pain via central and peripheral actions. Nat Med 16, 592-597, 591p following 597. doi:10.1038/nm.2123.
Yin, Y., Henzl, M. T., Lorber, B., Nakazawa, T., Thomas, T. T., Jiang, F., Langer, R. & Benowitz, L. I. (2006) Oncomodulin is a macrophage-derived signal for axon regeneration in retinal ganglion cells. Nat Neurosci 9, 843-852. doi:10.1038/nn1701.

129
Yu, J. J., Ruddy, M. J., Wong, G. C., Sfintescu, C., Baker, P. J., Smith, J. B., Evans, R. T. & Gaffen, S. L. (2007) An essential role for IL-17 in preventing pathogen-initiated bone destruction: recruitment of neutrophils to inflamed bone requires IL-17 receptor-dependent signals. Blood 109, 3794-3802. doi:10.1182/blood-2005-09-010116.
Zhu, M., Van Dyke, T. E. & Gyurko, R. (2013) Resolvin E1 regulates osteoclast fusion via DC-STAMP and NFATc1. FASEB J 27, 3344-3353. doi:10.1096/fj.12-220228.
Zlotnik, A. & Yoshie, O. (2000) Chemokines: a new classification system and their role in immunity. Immunity 12, 121-127.
Zubery, Y., Dunstan, C. R., Story, B. M., Kesavalu, L., Ebersole, J. L., Holt, S. C. & Boyce, B. F. (1998) Bone resorption caused by three periodontal pathogens in vivo in mice is mediated in part by prostaglandin. Infect Immun 66, 4158-4162.
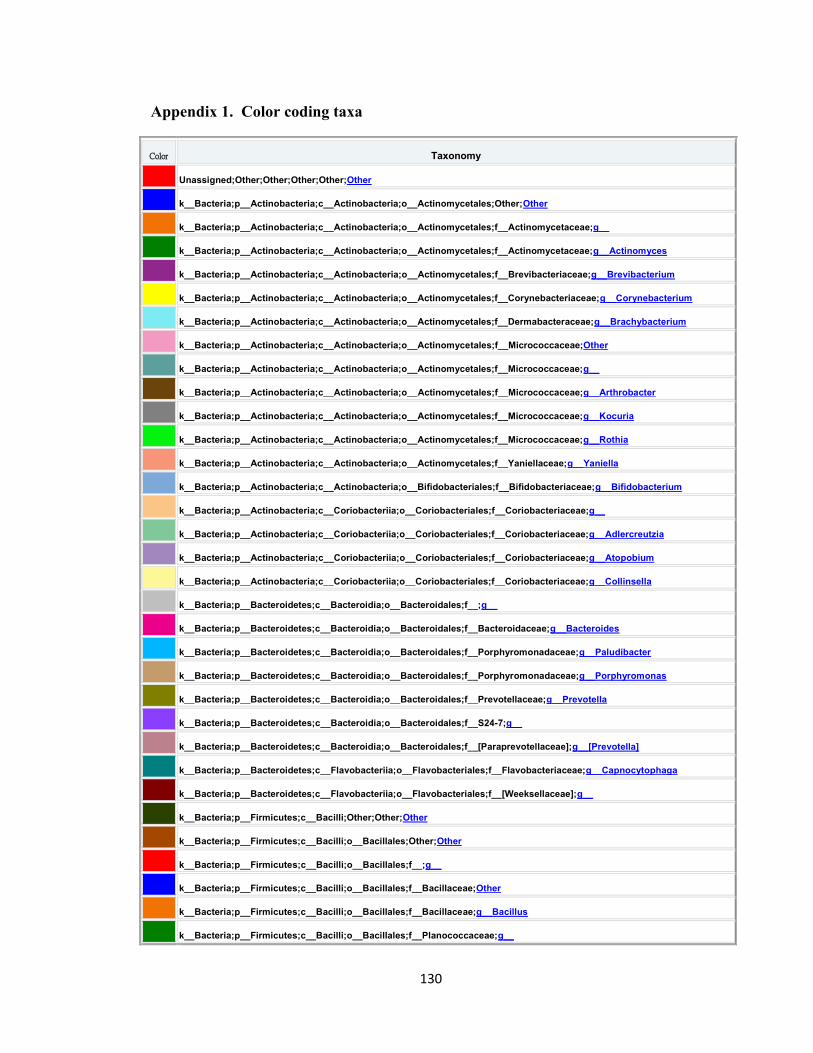
130
Color Taxonomy
Unassigned;Other;Other;Other;Other;Other
k__Bacteria;p__Actinobacteria;c__Actinobacteria;o__Actinomycetales;Other;Other
k__Bacteria;p__Actinobacteria;c__Actinobacteria;o__Actinomycetales;f__Actinomycetaceae;g__
k__Bacteria;p__Actinobacteria;c__Actinobacteria;o__Actinomycetales;f__Actinomycetaceae;g__Actinomyces
k__Bacteria;p__Actinobacteria;c__Actinobacteria;o__Actinomycetales;f__Brevibacteriaceae;g__Brevibacterium
k__Bacteria;p__Actinobacteria;c__Actinobacteria;o__Actinomycetales;f__Corynebacteriaceae;g__Corynebacterium
k__Bacteria;p__Actinobacteria;c__Actinobacteria;o__Actinomycetales;f__Dermabacteraceae;g__Brachybacterium
k__Bacteria;p__Actinobacteria;c__Actinobacteria;o__Actinomycetales;f__Micrococcaceae;Other
k__Bacteria;p__Actinobacteria;c__Actinobacteria;o__Actinomycetales;f__Micrococcaceae;g__
k__Bacteria;p__Actinobacteria;c__Actinobacteria;o__Actinomycetales;f__Micrococcaceae;g__Arthrobacter
k__Bacteria;p__Actinobacteria;c__Actinobacteria;o__Actinomycetales;f__Micrococcaceae;g__Kocuria
k__Bacteria;p__Actinobacteria;c__Actinobacteria;o__Actinomycetales;f__Micrococcaceae;g__Rothia
k__Bacteria;p__Actinobacteria;c__Actinobacteria;o__Actinomycetales;f__Yaniellaceae;g__Yaniella
k__Bacteria;p__Actinobacteria;c__Actinobacteria;o__Bifidobacteriales;f__Bifidobacteriaceae;g__Bifidobacterium
k__Bacteria;p__Actinobacteria;c__Coriobacteriia;o__Coriobacteriales;f__Coriobacteriaceae;g__
k__Bacteria;p__Actinobacteria;c__Coriobacteriia;o__Coriobacteriales;f__Coriobacteriaceae;g__Adlercreutzia
k__Bacteria;p__Actinobacteria;c__Coriobacteriia;o__Coriobacteriales;f__Coriobacteriaceae;g__Atopobium
k__Bacteria;p__Actinobacteria;c__Coriobacteriia;o__Coriobacteriales;f__Coriobacteriaceae;g__Collinsella
k__Bacteria;p__Bacteroidetes;c__Bacteroidia;o__Bacteroidales;f__;g__
k__Bacteria;p__Bacteroidetes;c__Bacteroidia;o__Bacteroidales;f__Bacteroidaceae;g__Bacteroides
k__Bacteria;p__Bacteroidetes;c__Bacteroidia;o__Bacteroidales;f__Porphyromonadaceae;g__Paludibacter
k__Bacteria;p__Bacteroidetes;c__Bacteroidia;o__Bacteroidales;f__Porphyromonadaceae;g__Porphyromonas
k__Bacteria;p__Bacteroidetes;c__Bacteroidia;o__Bacteroidales;f__Prevotellaceae;g__Prevotella
k__Bacteria;p__Bacteroidetes;c__Bacteroidia;o__Bacteroidales;f__S24-7;g__
k__Bacteria;p__Bacteroidetes;c__Bacteroidia;o__Bacteroidales;f__[Paraprevotellaceae];g__[Prevotella]
k__Bacteria;p__Bacteroidetes;c__Flavobacteriia;o__Flavobacteriales;f__Flavobacteriaceae;g__Capnocytophaga
k__Bacteria;p__Bacteroidetes;c__Flavobacteriia;o__Flavobacteriales;f__[Weeksellaceae];g__
k__Bacteria;p__Firmicutes;c__Bacilli;Other;Other;Other
k__Bacteria;p__Firmicutes;c__Bacilli;o__Bacillales;Other;Other
k__Bacteria;p__Firmicutes;c__Bacilli;o__Bacillales;f__;g__
k__Bacteria;p__Firmicutes;c__Bacilli;o__Bacillales;f__Bacillaceae;Other
k__Bacteria;p__Firmicutes;c__Bacilli;o__Bacillales;f__Bacillaceae;g__Bacillus
k__Bacteria;p__Firmicutes;c__Bacilli;o__Bacillales;f__Planococcaceae;g__
Appendix 1. Color coding taxa

131
k__Bacteria;p__Firmicutes;c__Bacilli;o__Bacillales;f__Planococcaceae;g__Sporosarcina
k__Bacteria;p__Firmicutes;c__Bacilli;o__Bacillales;f__Staphylococcaceae;Other
k__Bacteria;p__Firmicutes;c__Bacilli;o__Bacillales;f__Staphylococcaceae;g__Jeotgalicoccus
k__Bacteria;p__Firmicutes;c__Bacilli;o__Bacillales;f__Staphylococcaceae;g__Staphylococcus
k__Bacteria;p__Firmicutes;c__Bacilli;o__Gemellales;f__Gemellaceae;g__
k__Bacteria;p__Firmicutes;c__Bacilli;o__Lactobacillales;Other;Other
k__Bacteria;p__Firmicutes;c__Bacilli;o__Lactobacillales;f__;g__
k__Bacteria;p__Firmicutes;c__Bacilli;o__Lactobacillales;f__Aerococcaceae;g__
k__Bacteria;p__Firmicutes;c__Bacilli;o__Lactobacillales;f__Aerococcaceae;g__Aerococcus
k__Bacteria;p__Firmicutes;c__Bacilli;o__Lactobacillales;f__Aerococcaceae;g__Facklamia
k__Bacteria;p__Firmicutes;c__Bacilli;o__Lactobacillales;f__Carnobacteriaceae;g__Granulicatella
k__Bacteria;p__Firmicutes;c__Bacilli;o__Lactobacillales;f__Enterococcaceae;Other
k__Bacteria;p__Firmicutes;c__Bacilli;o__Lactobacillales;f__Enterococcaceae;g__
k__Bacteria;p__Firmicutes;c__Bacilli;o__Lactobacillales;f__Enterococcaceae;g__Enterococcus
k__Bacteria;p__Firmicutes;c__Bacilli;o__Lactobacillales;f__Enterococcaceae;g__Vagococcus
k__Bacteria;p__Firmicutes;c__Bacilli;o__Lactobacillales;f__Lactobacillaceae;g__Lactobacillus
k__Bacteria;p__Firmicutes;c__Bacilli;o__Lactobacillales;f__Lactobacillaceae;g__Pediococcus
k__Bacteria;p__Firmicutes;c__Bacilli;o__Lactobacillales;f__Streptococcaceae;g__
k__Bacteria;p__Firmicutes;c__Bacilli;o__Lactobacillales;f__Streptococcaceae;g__Lactococcus
k__Bacteria;p__Firmicutes;c__Bacilli;o__Lactobacillales;f__Streptococcaceae;g__Streptococcus
k__Bacteria;p__Firmicutes;c__Bacilli;o__Turicibacterales;f__Turicibacteraceae;g__Turicibacter
k__Bacteria;p__Firmicutes;c__Clostridia;o__Clostridiales;Other;Other
k__Bacteria;p__Firmicutes;c__Clostridia;o__Clostridiales;f__;g__
k__Bacteria;p__Firmicutes;c__Clostridia;o__Clostridiales;f__Clostridiaceae;Other
k__Bacteria;p__Firmicutes;c__Clostridia;o__Clostridiales;f__Clostridiaceae;g__
k__Bacteria;p__Firmicutes;c__Clostridia;o__Clostridiales;f__Clostridiaceae;g__Clostridium
k__Bacteria;p__Firmicutes;c__Clostridia;o__Clostridiales;f__Clostridiaceae;g__SMB53
k__Bacteria;p__Firmicutes;c__Clostridia;o__Clostridiales;f__Lachnospiraceae;Other
k__Bacteria;p__Firmicutes;c__Clostridia;o__Clostridiales;f__Lachnospiraceae;g__
k__Bacteria;p__Firmicutes;c__Clostridia;o__Clostridiales;f__Lachnospiraceae;g__Blautia
k__Bacteria;p__Firmicutes;c__Clostridia;o__Clostridiales;f__Lachnospiraceae;g__Catonella
k__Bacteria;p__Firmicutes;c__Clostridia;o__Clostridiales;f__Lachnospiraceae;g__Coprococcus
k__Bacteria;p__Firmicutes;c__Clostridia;o__Clostridiales;f__Lachnospiraceae;g__Dorea
k__Bacteria;p__Firmicutes;c__Clostridia;o__Clostridiales;f__Lachnospiraceae;g__[Ruminococcus]

132
k__Bacteria;p__Firmicutes;c__Clostridia;o__Clostridiales;f__Peptostreptococcaceae;g__
k__Bacteria;p__Firmicutes;c__Clostridia;o__Clostridiales;f__Peptostreptococcaceae;g__Peptostreptococcus
k__Bacteria;p__Firmicutes;c__Clostridia;o__Clostridiales;f__Ruminococcaceae;g__
k__Bacteria;p__Firmicutes;c__Clostridia;o__Clostridiales;f__Ruminococcaceae;g__Oscillospira
k__Bacteria;p__Firmicutes;c__Clostridia;o__Clostridiales;f__Ruminococcaceae;g__Ruminococcus
k__Bacteria;p__Firmicutes;c__Clostridia;o__Clostridiales;f__Veillonellaceae;g__Dialister
k__Bacteria;p__Firmicutes;c__Clostridia;o__Clostridiales;f__Veillonellaceae;g__Veillonella
k__Bacteria;p__Firmicutes;c__Clostridia;o__Clostridiales;f__[Mogibacteriaceae];g__
k__Bacteria;p__Firmicutes;c__Clostridia;o__Clostridiales;f__[Tissierellaceae];g__
k__Bacteria;p__Firmicutes;c__Clostridia;o__Clostridiales;f__[Tissierellaceae];g__Finegoldia
k__Bacteria;p__Firmicutes;c__Clostridia;o__Clostridiales;f__[Tissierellaceae];g__Parvimonas
k__Bacteria;p__Firmicutes;c__Clostridia;o__Clostridiales;f__[Tissierellaceae];g__Peptoniphilus
k__Bacteria;p__Firmicutes;c__Erysipelotrichi;o__Erysipelotrichales;f__Erysipelotrichaceae;g__
k__Bacteria;p__Firmicutes;c__Erysipelotrichi;o__Erysipelotrichales;f__Erysipelotrichaceae;g__Allobaculum
k__Bacteria;p__Firmicutes;c__Erysipelotrichi;o__Erysipelotrichales;f__Erysipelotrichaceae;g__Bulleidia
k__Bacteria;p__Firmicutes;c__Erysipelotrichi;o__Erysipelotrichales;f__Erysipelotrichaceae;g__[Eubacterium]
k__Bacteria;p__Fusobacteria;c__Fusobacteriia;o__Fusobacteriales;f__Fusobacteriaceae;g__Fusobacterium
k__Bacteria;p__Fusobacteria;c__Fusobacteriia;o__Fusobacteriales;f__Leptotrichiaceae;g__
k__Bacteria;p__Fusobacteria;c__Fusobacteriia;o__Fusobacteriales;f__Leptotrichiaceae;g__Leptotrichia
k__Bacteria;p__Proteobacteria;c__Betaproteobacteria;o__Burkholderiales;f__Alcaligenaceae;g__Sutterella
k__Bacteria;p__Proteobacteria;c__Betaproteobacteria;o__Burkholderiales;f__Burkholderiaceae;g__Lautropia
k__Bacteria;p__Proteobacteria;c__Betaproteobacteria;o__Burkholderiales;f__Comamonadaceae;g__
k__Bacteria;p__Proteobacteria;c__Betaproteobacteria;o__Neisseriales;f__Neisseriaceae;g__
k__Bacteria;p__Proteobacteria;c__Betaproteobacteria;o__Neisseriales;f__Neisseriaceae;g__Neisseria
k__Bacteria;p__Proteobacteria;c__Epsilonproteobacteria;o__Campylobacterales;f__Campylobacteraceae;g__Campylobacter
k__Bacteria;p__Proteobacteria;c__Gammaproteobacteria;o__Cardiobacteriales;f__Cardiobacteriaceae;g__Cardiobacterium
k__Bacteria;p__Proteobacteria;c__Gammaproteobacteria;o__Enterobacteriales;f__Enterobacteriaceae;Other
k__Bacteria;p__Proteobacteria;c__Gammaproteobacteria;o__Enterobacteriales;f__Enterobacteriaceae;g__
k__Bacteria;p__Proteobacteria;c__Gammaproteobacteria;o__Enterobacteriales;f__Enterobacteriaceae;g__Morganella
k__Bacteria;p__Proteobacteria;c__Gammaproteobacteria;o__Enterobacteriales;f__Enterobacteriaceae;g__Proteus
k__Bacteria;p__Proteobacteria;c__Gammaproteobacteria;o__Pasteurellales;f__Pasteurellaceae;g__Actinobacillus
k__Bacteria;p__Proteobacteria;c__Gammaproteobacteria;o__Pasteurellales;f__Pasteurellaceae;g__Aggregatibacter
k__Bacteria;p__Proteobacteria;c__Gammaproteobacteria;o__Pasteurellales;f__Pasteurellaceae;g__Haemophilus
k__Bacteria;p__Proteobacteria;c__Gammaproteobacteria;o__Pseudomonadales;f__Pseudomonadaceae;g__Pseudomonas

133
k__Bacteria;p__Spirochaetes;c__Spirochaetes;o__Spirochaetales;f__Spirochaetaceae;g__Treponema
k__Bacteria;p__TM7;c__TM7-3;o__I025;f__Rs-045;g__
k__Bacteria;p__Verrucomicrobia;c__Verrucomicrobiae;o__Verrucomicrobiales;f__Verrucomicrobiaceae;g__Akkermansia

134