resistivity and permeability anisotropy measured in
TRANSCRIPT
SPWLA 46th Annual Logging Symposium, June 26-29, 2005
RESISTIVITY AND PERMEABILITY ANISOTROPY MEASURED INLAMINATED SANDS VIA DIGITAL CORE ANALYSIS
A. Ghous1,2, F. Bauget1, C. H. Arns1, A. Sakellariou1, T.J. Senden1, A. P. Sheppard1, R. M.Sok1,2, W. V. Pinczewski2, R. G. Harris3, G. F. Beck4 and M.A. Knackstedt1,2,∗
1Department of Applied Mathematics, Research School of Physical Sciences and Engineering,Australian National University, Canberra, Australia
2School of Petroleum Engineering, University of New South Wales, Sydney, Australia3ConocoPhillips (UK) Limited, Aberdeen, Scotland UK
4EOG Resources, Houston, Texas, USA∗Corresponding Author: [email protected]
Copyright 2005, held jointly by the Society of Petrophysicists and Well Log An-alysts (SPWLA) and the submitting authors.
This paper was prepared for presentation at the SPWLA 46th Annual LoggingSymposium held in New Orleans, Louisiana, United States, June 26-29, 2005.
ABSTRACT
Many aeolian sandstone reservoirs contain significant vol-umes of recoverable hydrocarbons in intervals where theaverage lamina thickness is well below the resolution ofany logging tool. The variability in petrophysical prop-erties of the laminations increases uncertainties and inturn can lead to an underestimation of the hydrocarbon inplace. To date estimates of the Archie exponents m andn in thinly laminated sand reservoirs have been based onsimplified model structures. Here we illustrate an abilityto visualize the anisotropy in aeolian sands at the porescale via digital microtomographic imaging, and to mea-sure the anisotropy in transport properties via direct cal-culation on the resultant images.
In this study, 3D pore scale imaging of an aeolian coreplug exhibiting fine scale laminae (laminations at the mmscale) is undertaken via high resolution micro-CT. Thefull 3D image is obtained at 5.6 micron resolution. Thecomposite image is made up of a 2000 squared voxelcross section (7.5 mm squared) parallel to the beddingplanes and a continuous 3 cm length perpendicular to thebedding plane (6,000 voxels). Strong variation in lam-ina porosity is observed along the length of the core andmore than 30 distinct bedding planes are evident. Petro-physical calculations are performed on a 20003 subset ex-hibiting over 10 laminations. Permeability and resistivityare derived for individual lamina including estimation ofArchie’s cementation exponent m and saturation expo-nent n. A composite permeability and m and n are thencalculated both parallel and perpendicular to the beddingplanes across varying numbers of lamina. These upscaledpermeabilities are in good agreement with experimental
core data. The values of m and n are found to stronglydepend on the relative volume fractions of the differentlaminae and the orientation of the conductivity measure-ments. Estimates of m parallel and perpendicular to thebedding planes based on simple averaging are in pooragreement with laboratory measurements for the samecore material. Predictions of m for the multi-layered sys-tem based on idealized layering (Kennedy and Herrick,2003) give good estimates.
The resistivity exponent n based upon the imaged poros-ity increases when averaged across multiple laminationsboth perpendicular and parallel to the bedding plane. Thisis in contradiction to laboratory measurements. This high-lights the need to include the contribution of pores belowthe current image resolution to accurately calculate theresistivity index. We use a radiographic method to esti-mate the total unresolved porosity of the sample acrossfine and coarse grained laminae. Including this estimateof the unresolved porosity to the formation resisitivity in-dex leads to a realistic estimate of n.
EXPERIMENTAL METHODOLOGY
A high-resolution and large-field X-ray µCT facility hasbeen used (Sakellariou et al., 2003; Sakellariou et al.,2004a; Sakellariou et al., 2004b) to analyse the 3D struc-ture in thinly bedded core plugs at the micron scale andto study multiphase drainage displacements in the porespaces of these materials. The CT has a cone beam geom-etry. Details of the equipment and experimental method-ology used to image the microstructure of sedimentaryrock have been given previously (Sakellariou et al., 2004a;Knackstedt et al., 2004; Arns et al., 2005). Here webriefly describe the experimental work undertaken andpresent the primary results of the imaging, visualization,resistivity, permeability and drainage displacement mod-eling study.
1
VVV

SPWLA 46th Annual Logging Symposium, June 26-29, 2005
Tomographic Imaging
From the aeolian sample we cut a 3 cm x 7.5 mm x 7.5 mmfragment with the long axis perpendicular to the beddingplanes (Fig. 1). This has been imaged at a resolution of5.6 microns (total image voxels = 20002 × 6000). Over30 laminations are observed in the image. We discuss theanalysis on a single 20003 subsample ( 11.5 mm × 7.5mm ×7.5 mm) of the imaged core. Images of 2 slicesthrough the tomogram through this subsection are givenin Fig. 2.
Figure 1: The sample imaged in this study of 7.5mm x7.5mm cross section and 3 cm in length mounted on thetomography rotation stage.
Phase Identification
Phase separation was then undertaken on the cores to de-lineate the pore phase from the mineral phase. Ideallyone would wish to have a multi-modal distribution givingunambiguous phase separation of the pore and variousmineral phase peaks. In particular one would like to ob-tain a clear bimodal distribution separating the pore phasefrom mineral phase peaks. Unfortunately, the presenceof pores at scales below the image resolution leads to aspread in the low density signal making it difficult to un-ambiguously differentiate the pore from the microporousand solid mineral phases. To quantitatively analyse tomo-grams it is necessary to have a well-defined and consis-tent method to label each voxel. We employ an advancedapproach (Sheppard et al., 2004) using parallelized algo-rithms because of the size of the 3D images. The firststage is a nonlinear anisotropic diffusion (AD) filter (Per-ona and Malik, 1990) which removes noise while pre-serving significant features, i.e. the boundary regionsbetween the phases. The second stage applies an un-sharp mask (UM) sharpening filter (Pratt, 2nd Ed 1991)which has proven itself in practice to be highly effec-
Figure 2: Illustration of the density map obtained on twoslices through tomograms. The slices are taken parallelto the bedding plane. Note in the top figure the abrupttransition between bedding planes; (left) fine grained and(right) coarse grained.
tive at sharpening edges without overly exaggerating thenoise. An original image and image after applying ADand UM filters is shown in Fig. 3. The resultant binarizedpore/solid image of a slice of the thin-bedded sandstonetomogram is given in Fig. 4.
The resultant image size for analysis was 1904× 1088×1056. The measured image porosity φimage of the sam-ple is 12.8%. It should be noted that the image porositywe measure is associated with pore sizes at and aboveimage resolution (≥ 5.6µm) and does not include con-tributions to porosity from pores at smaller scales. TheHe porosity φHe of the imaged core fragment is 20%.An MICP study of sister core material finds that the con-tribution to the total porosity from pores ≥ 4 µm is �11%; this is reasonably consistent with the estimate ofφimage = 12.8%
2

SPWLA 46th Annual Logging Symposium, June 26-29, 2005
Figure 3: Grayscale Image of a slice from the middle ofthe dataset before (top) and after (bottom) fi ltering of theimage.
Figure 4: Zooming in on a 256× 256 piece of the middleslice. Left: original data set. Middle: after anisotropicdiffusion and unsharp mask filters. Right: after binariza-tion. (offset 256, 256)
NUMERICAL SIMULATION AND ERROR ANAL-YSIS
A microstructure defined by a digital image is alreadynaturally discretized and lends itself immediately to nu-merical computation of many properties. In this sub-section we review the numerical methods used to cal-culate length scales associated with pore sizes and var-ious petrophysical properties directly on the 3D digitalimages (Arns et al., 2005).
Generation of Multiphase Drainage Distributions
Drainage simulations can be performed directly on voxe-lated images by defining locally for every point within thestructure, the diameter of the largest sphere which fullylies within the pore phase and covers that point (Coles etal., 1998; Hilpert and Miller, 2001). At a fixed capillarypressure (pore entry radius) we consider all the sphereswhich have radius greater than or equal to the equivalentpore entry radius. Starting with the largest sphere andincrementing the sphere radius downwards (equivalent toincrementing capillary pressure upwards), the non-wettingphase saturation is measured as the subset of all spheresthat have invaded the pore space (see Fig. 5). This re-sults in a capillary pressure vs. saturation (Pc : S) curvefor the imaged core. The spatial distributions of the non-wetting phase, evaluated at different values of the satu-ration S, are then used in the calculation of resistivityindex. In the drainage simulations boundary conditionsequivalent to MICP are always used; all outside faces areconnected to the non-wetting phase.
Permeability
The permeability calculation is based on the lattice-Boltz-mann method (LB) (Martys and Chen, 1996). The LB ap-proach is a mesoscopic numerical method used in compu-tational fluid dynamics, where the macroscopic dynamicsof the solution of a discretized Boltzmann equation canbe shown to match the Navier-Stokes equation. Due toits simplicity in form and adaptability to complex flowgeometries, like the presence of solid-fluid boundaries,one of the most successful applications of the LB methodhas been to flow in porous media. We use LB to solvefor the pressure drop along the image for a fixed flow rateand calculate k in the conventional manner.
Formation Factor
The formation factor and resistivity index calculation isbased on a solution of the Laplace equation with chargeconservation boundary conditions using a conjugate gra-dient technique (Arns et al., 2001). For the formationfactor calculation we consider an idealized case assigning
3
VVV

SPWLA 46th Annual Logging Symposium, June 26-29, 2005
[a]
[b]
[c]
Figure 5: Illustration of the development of the mul-tiphase drainage saturation distribution and subsequentmeasurement of the drainage capillary pressure. In [a] a2D slice of a reservoir core is shown with the pore phaseshown as the white phase. [b] shows the correspondingslice of the 3D field of covering radii rc(r) of the porephase in [a] with the grey scale proportional to coveringdisk radius (brighter gives larger covering radii. [c] illus-trates in white the phase distribution of the non-wettingphase within a slice of the system at an intermediate sat-uration within the core.
zero conductivity to all mineral phases. For the resistiv-ity index calculation both the non-wetting phase and themineral phase are assumed to be non-conductive. Wateris the only conductive phase.
Numerical Error and Resolution
Before reporting numerical results of transport proper-ties we discuss numerical artefacts and resolution limi-tations. As discussed previously, the porosity measuredin this micro-CT imaging study is associated with cleanmacroporosity. Porosity associated with capillary boundwater (� .5 µm → 4µm) and clay bound porosity (10-500 nm) remains unresolved. Therefore the simulationsperformed here only include contributions from the macro-porosity. Here we discuss the implications to the digitallyderived properties.
Insufficient image resolution can lead to underestimationof the core permeability. As a quality control parame-ter, we use a length scale which has been shown to bestrongly correlated to the permeability; rc, a characteris-tic pore radius corresponding to the diameter of the small-est pore of the set of largest pores that percolate throughthe rock (Katz and Thompson, 1987). If rc is close to theimage resolution, constrictions which dominate the mag-nitude of the permeability are poorly resolved, and thismay lead to errors in the permeability estimation. If rc
is larger than the image resolution one would expect anaccurate permeability prediction. We find rc = 14.3µmparallel and rc = 6.5µm perpendicular to the beddingplane, indicating that the image is of sufficient resolutionto provide good estimates of permeability.
For electrical transport properties derived from imageswe are limited to the condition that transport is via the (re-solved) macropores. This will certainly lead to an under-estimation of the electrical conduction pathways. Moreaccurate analysis will require the simultaneous resolu-tion of the porous microstructure across a range of lengthscales and treating regions with unresolved porosity (sec-ondary, clay and micro porosity) as effective homoge-neous regions of varying conductivity. Attempts to moreaccurately measure resistivity by incorporating contribu-tions from unresolved porosity are discussed later in thispaper in the section titled “RI upscaled”.
Limitations on Direct Simulation and Upscaling
While one can perform the full drainage simulation onthe complete image, performing direct numerical simula-tions (LB or finite difference) on a single sample consist-ing of 2 billion voxels requires extensive supercomput-ing facilities. For example, a single permeability run at
4
SPWLA 46th Annual Logging Symposium, June 26-29, 2005
2000 × 10002 would require � (512 Gbytes) of memoryand over 10000 CPU hours to complete. This precludesthe calculation of permeability directly on the full imagevolume. Although one cannot perform numerical simu-lations on the full sample using direct pore scale meth-ods, one can calculate properties of subsets of the fullimage volume. Previous research has shown (Auzeriaset al., 1996; Arns et al., 2002; Arns et al., 2001; Arnset al., 2004) that one may obtain meaningful predictionsof petrophysical properties at scales of � (mm)3 by en-suring that the sample size is representative. Previoussimulations of resistivity and permeability on a range ofsandstone samples at a scale of (1mm3) were in goodagreement with predictions on larger cells (Arns et al.,2001; Arns et al., 2005). In this paper we consider cellsat the mm3 scale which allows the measurement of petro-physical properties within individual laminae.
A goal of this work is to measure resistivity and per-meability both parallel and perpendicular to the beddingplanes when the measurement is made across multiplelaminations. This is done by upscaling the data from themm3 scale to the full image scale (� cm3). From the re-sultant array of resistivity or permeability data on smallersubsets, a block resistivity or permeability tensor is cal-culated by resolving the following equations over largersub-domains; for permeability
�∇ ·(k�∇(p)
)= 0, (1)
where k is the permeability and p the pressure, and forresistivity:
�∇ ·(σ�∇(U)
)= 0. (2)
where σ is the conductance and U is the electrostatic po-tential. Calculations are performed on the array of sub-samples with periodic boundary conditions. Only theprincipal direction of resistivity/permeability were usedin each subset. In all cases the upscaled resistivity andpermeability tensors exhibit very small off-diagonal com-ponents, so only the principal directions are reported. Theseupscaled data correspond to a conventional petrophysicalmeasurement across several laminae.
RESULTS
Image Porosity
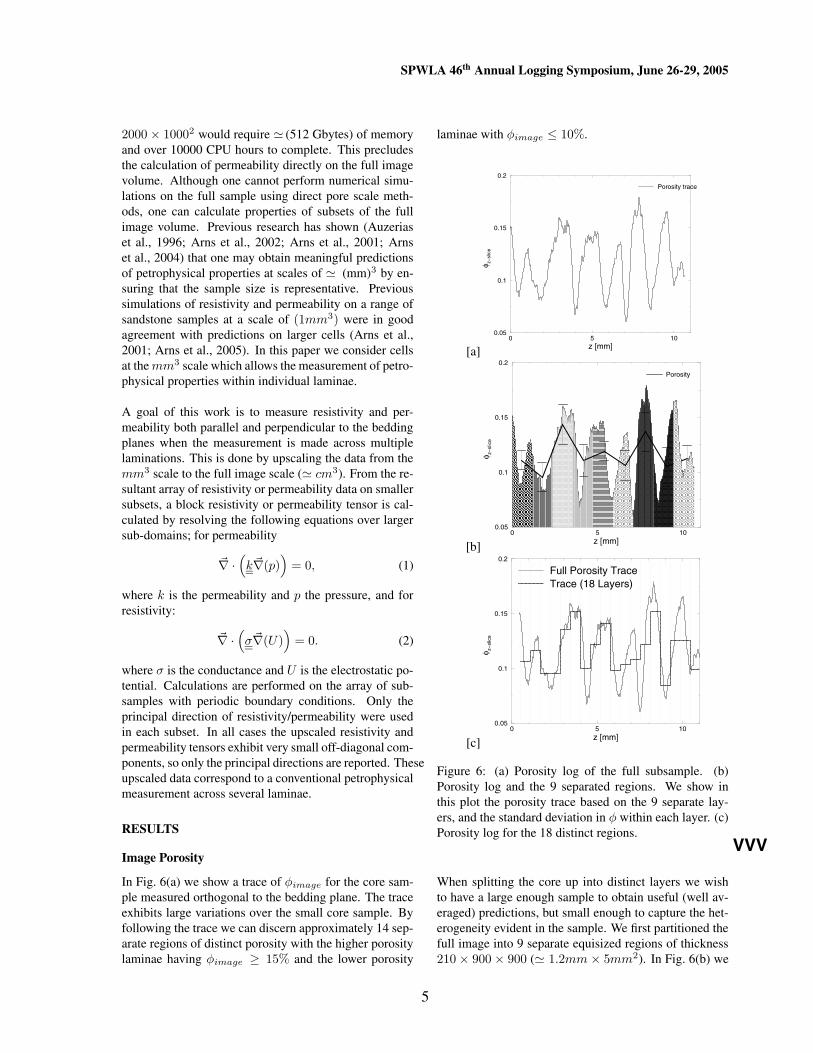
In Fig. 6(a) we show a trace of φimage for the core sam-ple measured orthogonal to the bedding plane. The traceexhibits large variations over the small core sample. Byfollowing the trace we can discern approximately 14 sep-arate regions of distinct porosity with the higher porositylaminae having φimage ≥ 15% and the lower porosity
laminae with φimage ≤ 10%.
[a]0 5 10
z [mm]
0.05
0.1
0.15
0.2
φ z−sl
ice
Porosity trace
[b]0 5 10
z [mm]
0.05
0.1
0.15
0.2
φ z−sl
ice
Porosity
[c]0 5 10
z [mm]
0.05
0.1
0.15
0.2
φ z−sl
ice
Full Porosity TraceTrace (18 Layers)
Figure 6: (a) Porosity log of the full subsample. (b)Porosity log and the 9 separated regions. We show inthis plot the porosity trace based on the 9 separate lay-ers, and the standard deviation in φ within each layer. (c)Porosity log for the 18 distinct regions.
When splitting the core up into distinct layers we wishto have a large enough sample to obtain useful (well av-eraged) predictions, but small enough to capture the het-erogeneity evident in the sample. We first partitioned thefull image into 9 separate equisized regions of thickness210 × 900 × 900 (� 1.2mm × 5mm2). In Fig. 6(b) we
5
VVV
SPWLA 46th Annual Logging Symposium, June 26-29, 2005
plot an average porosity across the different regions. Thechange in the porosity between regions follows the tracebut does not show the extremes observed in the full trace.
To capture more of the heterogeneity, we separated thecore into 18 separate regions of thickness 105×900×900(� .6mm × 5mm2) orthogonal to the bedding planes.In Fig. 6(c) we note that this partitioning scale displaysmore of the heterogeneity in the core.
Total Porosity
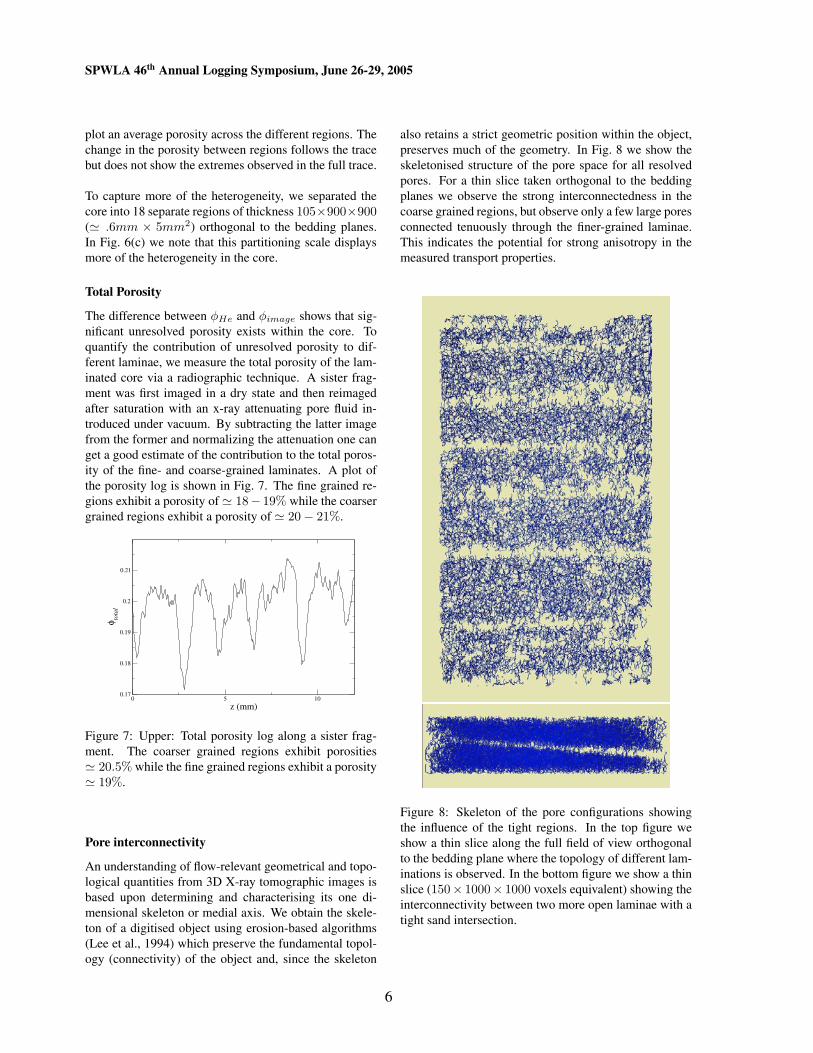
The difference between φHe and φimage shows that sig-nificant unresolved porosity exists within the core. Toquantify the contribution of unresolved porosity to dif-ferent laminae, we measure the total porosity of the lam-inated core via a radiographic technique. A sister frag-ment was first imaged in a dry state and then reimagedafter saturation with an x-ray attenuating pore fluid in-troduced under vacuum. By subtracting the latter imagefrom the former and normalizing the attenuation one canget a good estimate of the contribution to the total poros-ity of the fine- and coarse-grained laminates. A plot ofthe porosity log is shown in Fig. 7. The fine grained re-gions exhibit a porosity of � 18− 19% while the coarsergrained regions exhibit a porosity of � 20 − 21%.
0 5 10
z (mm)
0.17
0.18
0.19
0.2
0.21
φ tota
l
Figure 7: Upper: Total porosity log along a sister frag-ment. The coarser grained regions exhibit porosities� 20.5% while the fine grained regions exhibit a porosity� 19%.
Pore interconnectivity
An understanding of flow-relevant geometrical and topo-logical quantities from 3D X-ray tomographic images isbased upon determining and characterising its one di-mensional skeleton or medial axis. We obtain the skele-ton of a digitised object using erosion-based algorithms(Lee et al., 1994) which preserve the fundamental topol-ogy (connectivity) of the object and, since the skeleton
also retains a strict geometric position within the object,preserves much of the geometry. In Fig. 8 we show theskeletonised structure of the pore space for all resolvedpores. For a thin slice taken orthogonal to the beddingplanes we observe the strong interconnectedness in thecoarse grained regions, but observe only a few large poresconnected tenuously through the finer-grained laminae.This indicates the potential for strong anisotropy in themeasured transport properties.
Figure 8: Skeleton of the pore configurations showingthe influence of the tight regions. In the top figure weshow a thin slice along the full field of view orthogonalto the bedding plane where the topology of different lam-inations is observed. In the bottom figure we show a thinslice (150× 1000× 1000 voxels equivalent) showing theinterconnectivity between two more open laminae with atight sand intersection.
6

SPWLA 46th Annual Logging Symposium, June 26-29, 2005
Formation Resistivity Factor
The initial calculation is performed on 5 × 5 × 9 2103
subsets of the full image. The scatter plot of the F versusφ results for all subsets is given in Fig. 9. Subsets atthis scale already exhibit anisotropy in F . The upscaledvalues show significant anisotropy.
9 Separate Layers + Upscaling
To mimic measurement on a layer by layer basis, wecompute the resistivity directly on each of the nine 1.2mm thick slices within the full image volume 1.2mm ×(6mm)2 in Fig. 10(a). In Table 1 we summarise the ef-fective values of m in the three orthogonal directions. Insome cases, layers 1, 4, 5 and 9, significant anisotropy(up to a factor of 5) in the resistivity is already observedat this small scale. In other cases, layers 2, 3, 6, 7 and 8smaller anisotropy is noted. When considering the poros-ity trace in Fig. 6 for the 9 layers we note that layerswith significant anisotropy in F exhibit strong variationswithin the layer.
Table 1: Values of mx,my and mz for each of the 9 lay-ers.
Layer Number φ mx my mz
1 .111 2.34 2.36 3.112 .096 2.85 3.01 2.893 .144 2.19 2.34 2.044 .111 2.37 2.39 3.115 .119 2.19 2.25 2.736 .106 2.52 2.63 2.757 .137 2.15 2.17 2.418 .105 2.78 2.69 2.879 .112 2.42 2.49 2.91
We also show in Fig. 10(a) the tensor formation resis-tivity factor for the system (largest symbols). Upscalingthe resistivity to the full image volume we observe stronganisotropy in resistivity (Fz > 6 × Fx, Fy) and derivedistinct values for mx,my = 2.37, 2.30 and mz = 3.14.The values for mx and my are slightly larger than mea-surements based on regional data (m = 1.93 − 2.10).This overestimation of m was observed in previous digi-tal analysis of resistivity (Arns et al., 2005). Experimen-tal data for m⊥ (perpendicular to the bedding plane) arenot available for comparison, but the observed increasecompared to m|| (parallel to bedding) is expected for themeasurement of m across multiple laminations.
The reason for the overestimation of m|| is most probablythe limited resolution of the image. The micro-CT image
0.1
φ
1
10
100
1000
10000
F
2103 (//)
2103 (⊥)
5*5*5 and 5*5*4 ~10003 (//)
5*5*5 and 5*5*4 ~10003 (⊥)
5*5*9 (//)5*5*9 (⊥)
Figure 9: Formation factor vs porosity for all 2103 sub-sets of the full image. Anisotropy is seen in the data al-ready at this scale. Data upscaled to 10003 and 10002 ×2000 is also shown with larger data points and exhibitssignificant anisotropy.
0.1
φ
10
100
1000
10000F
1
2
3
4
5
6
7
8
9
0.1
φ
12
23
34
45
56
67
78
89
0.1
φ
10
100
1000
10000
F
123
234
345
456
567
678
789
0.1
φ
1234
2345
3456
4567
5678
6789
Figure 10: Upper left (a): Formation factor vs porosityfor each of the nine separate layers within the core; eachof thickness 1.2 mm. The values parallel to the beddingplane are given by the red and black symbols, while or-thogonal to the bedding plane is given by the green sym-bols. The upscaled resistivity in the three orthogonal di-rections are given by the larger (cross hatched) symbols.The three other plots give the Formation factor for in-creasing thicknesses of the layers: Upper right (b), 2 lay-ers, or 2.4 mm thick: Lower left (c), 3 layer or 3.6 mm:Lower right (d), 4 layers or 4.8 mm. Once the thicknessof the measurement window is ≥ 3 mm, data equivalentto the overall measurement on the full core is obtained.
7
VVV

SPWLA 46th Annual Logging Symposium, June 26-29, 2005
only allows us to resolve pores ≥ 5.6 microns in diam-eter. The simulated electrical properties do not take intoaccount any contribution from porosity below this resolu-tion although pores below image resolution do contributeto the formation resistivity (compare Figs. 6 and 7). Ifthe porosity, which we can not currently resolve has theeffect of bypassing (or short circuiting) a very highly tor-tuous electrical pathway through the larger pores, the re-sult would be a lowering of the electrical tortuosity. Con-sequently, the value of m would decrease. Imaging athigher resolutions will be required to confirm this.
To show at which scale the anisotropy is first observed,we generate tensor formation factor values for systemsmade of 2, 3, and 4 layers of 1.2 mm thickness and com-pare these to the full tensor formation resisitvity factor.These results are shown in Fig. 10(b-d). At the scale of2-3 laminations (� 3 mm thick) the anisotropy observedin the full tensor is mimicked by the data. It seems quiteremarkable that the larger scale anisotropy observed onthe full core fragment (1 cm in length) is largely capturedat the scale of 2-3 laminae.
18 Separate Layers + Upscaling
Given the observation of significant resistivity anisotropywhen measuring resistivity on slices of 1 mm thicknessorthogonal to the bedding plane, we now subsection thecore into 18 separate layers of thickness 600 µm. InFig. 11 we show the resistivity in three orthogonal di-rections for the 18 separate layers. We now observe noanisotropy in the resistivity (layers within distinct lami-nae). Upscaling the resistivity to the full image volumewe observe the strong anisotropy in resistivity (Fz >5 × Fx, Fy) and derive distinct values for mz = 3.31and mx,my = 2.41, 2.42. These values are consistentwith those upscaled from the 9 layer analysis.
Permeability
In Figure 12 we show the analogous plot to Fig. 10 for thepermeability of the core simulated along slices of thick-ness 1.2mm and then derived for progressively thickerslices. A similar scale of anisotropy (� factor 10) is ob-served in permeability as was observed in resistivity (�factor 6) (Table 2). We again observe strong anisotropyin k across 2-3 laminations– equivalent to permeabilitymeasurement derived across the full image (14 lamina-tions). The permeabilities derived from the image paral-lel to the bedding plane kx = 178 mD and ky = 137mD are in excellent agreement with the measurement ofpermeability on the original plug (k = 149 mD).
0.1
φ10
100
1000
10000
F
Individual LayersUpscaled
Figure 11: Formation factor vs porosity for each of theeighteen separate layers within the core. Symbol coloursare red/black for parallel to bedding and green for per-pendicular to the bedding plane. The upscaled resistivityin the three orthogonal directions are given by the largersymbols. Note that for the laminates exhibiting higherporosity, the value of F is lower orthogonal to the bed-ding plane than parallel to it.
0.1
φ
0.01
0.1
1
K(D
)
1234
5
6789
0.1
φ
122334
45
56
677889
0.1
φ
0.01
0.1
1
K(D
)
123
234
345
456
567
678
789
0.1
φ
1234
2345
3456
4567
5678
6789
Figure 12: Permeability for 9 separate regions of theimage and progressively larger subsections. Sub-plotshave the same definitions as those stated in the captionof Fig. 10.
8

SPWLA 46th Annual Logging Symposium, June 26-29, 2005
Table 2: Values of permeability derived from the imageparallel and perpendicular to the bedding plane and com-parison with experiment on the same core material.
kx ky kz kexp
178 mD 138 mD 17 mD 149 mD
Drainage Saturation Distributions
We now consider the multiphase petrophysical propertiesof the imaged fragment. In Fig. 13 we plot the drainagecapillary pressure curve for the imaged data. The satu-ration is rescaled to φHe (Arns et al., 2005). In Fig. 13we also plot the Pc : S curve measured experimentallyon the full core. The match is satisfactory over the rangeof pore sizes imaged. A reasonably classical behaviouris noted; no hint of layering within the system can beinferred from the drainage plot; no bimodal pore size dis-tribution is evident from the curve.
20 40 60 80 100Sw, eff [%]
0
10
20
30
40
50
Pc
[psi
]
Figure 13: Capillary pressure curve for the drainage sim-ulation on the full core image. The curve from the imagedata of the fragment (full curve) is in reasonable agree-ment with the MICP curve from analysis on the full core(dashed curve). Variations may be due to the differencein sample volumes and heterogeneity.
In Fig. 14 we show the saturation profile along the im-aged core orthogonal to the bedding plane across a rangeof observed macroscopic wetting phase saturations Sw.One can see that different laminae have quite distinctdrainage capillary pressure behaviour and that the dif-ferent laminae behave independently (one could obtaindistinct pc curves for each laminate). For example, at aglobal Sw = 74% the high porosity region at z � 7.5−9mm locally is at Sw � 30% while other laminae remainwater saturated. The trace exhibits large saturation vari-ations over the whole imaged core sample with regionsof lowest porosity exhibiting Sw >> S̄w and regions of
0 5 10z [mm]
0
0.05
0.1
0.15
0.2
φ z−sl
ice
Porosity LogSW = 74%SW = 64%SW = 41%SW = 28%
Figure 14: Saturation profile along the core orthogonalto the bedding planes at varying water saturation. Notethat most of the drainage occurs in the high porosity(open) zones, and their seems to be no interaction be-tween zones.
higher porosity exhibiting Sw << S̄w. Clearly this lo-cal variation in Sw will strongly effect the behaviour ofthe simulated resistivity index RI(S) over varying lengthscales.
Resistivity Index
Simulations of sample resistivity were undertaken for arange of capillary pressures (saturations). At each capil-lary pressure one obtains an equivalent water saturationand, assuming only the water phase is conductive, mea-sure the resistivity of the sample. For the drainage simu-lation the non-wetting fluid invades along all edges of thesample. Data are measured on the central 600x600x1200subsection of the full 1000x1000x1800 image. This elim-inates potential boundary effects from biasing the RI cal-culation.
Separate Layers
As noted in the previous section, the saturation profilealong the core varied greatly orthogonal to the beddingplane for various values of the full image water satura-tion S̄w. We therefore first simulated RI data averagedacross the 18 different layers described in Fig. 6(c). Cal-culations were made on regions of (600µm3) and themean value for all subsets in a layer calculated to given. Due to possible saturation boundary effects, data arenot reported for laminations near the top and bottom ofthe imaged sample. Results are summarised in Table 3
9
VVV

SPWLA 46th Annual Logging Symposium, June 26-29, 2005
and Fig. 15. We observe that high porosity layers exhibitlower values of n — an example is given in Fig. 15(a). Ahigh porosity, low F layer, Layer 6 (φ = 15.2%, Fx =47, Fy = 48, Fz = 38), exhibits smaller values for n andlittle scatter in the value of n along different axes (nx =2.2, ny = 2.6, nz = 2.8). At low porosities larger valuesof n are observed and anisotropy in the saturation expo-nent is observed. In Fig 15 we also show data for Layer7, (φ = 10%, Fx = 161, Fy = 135, Fz = 454). Analy-sis of RI for this layer gives nx = 3.7, ny = 4.5, nz =4.1. Overall the values of n summarised in Table 3 arehigher than observed from previous digital analyses onsands (Arns et al., 2005).
0.1 1.0Sw
100
101
102
103
Res
istiv
ity In
dex
nx=2.2ny=2.6nz=2.8
0 11
10
100
nx=3.7ny=4.5nz=3.1
Figure 15: Mean resistivity index simulated on twoneighbouring layers. (Left) High porosity layer and(right) low porosity layer.
RI Upscaled
We further calculate the effective RI on the full core acrossall laminations. The values of n are similar across the 3directions (nx = 5.8, ny = 5.1, nz = 6.0). All three val-ues of n are significantly larger than that observed on theindividual layers.
The reason that n is larger than expected (particularlyparallel to the bedding plane) can be quantified by esti-
Table 3: Values of Fx,y,z and nx,y,z for each of the 18laminations.
Layer φ Fx Fy Fz nx ny nz
3 .099 332 331 400 2.0 3.5 3.34 .096 205 220 260 2.6 3.8 6.15 .136 69 68 59 2.7 3.7 4.26 .152 47 48 38 2.2 2.6 2.87 .100 161 135 454 3.7 4.5 4.18 .122 94 95 81 4.6 3.0 3.19 .141 63 66 54 3.0 3.3 3.7
10 .098 223 169 537 7.4 5.2 6.111 .103 217 183 192 4.4 2.9 5.212 .108 144 127 282 3.4 2.3 3.313 .122 75 79 100 4.1 3.5 3.014 .152 47 41 43 3.8 4.4 2.515 .084 403 438 927 5.7 5.5 4.616 .126 100 97 94 3.9 3.8 3.2
mating the contribution to RI from the unresolved poros-ity. The porosity resolved in the image (associated withpores of diameter ≥ 4 microns) was 12.8%. The Heporosity of the same sample was measured as � 20%(recall Fig. 7). This appreciable porosity which is not re-solved via microtomography will not have been swept bythe non-wetting fluid during the simulated drainage andcan provide a water filled interconnected pathway. Thisin turn will dramatically decrease the resistivity of therock.
An estimate of the contribution of unresolved porositywithin each layer can be made by considering the dataobtained via x-ray radiography. This gives a signature ofthe total porosity along the sample volume which we candirectly compare to the porosity trace derived from theimage. We note that for finer-grained regions in Fig. 7the total porosity remains � 19% while resolved porosityis φimage = 8 − 9%. The contribution of the unresolvedporosity is large and can amount to 10% by volume. Incontrast the higher φ regions exhibit φHe � 20% whileφimage = 13 − 15%. The contribution of unresolvedporosity is significantly smaller.
We assume that if the unresolved porosity within a layeris greater than 5% this porosity would exhibit a connectedwater saturated short circuit. The contribution to the over-all resistivity is predicted by using the classic Archie’slaw with formation factor proportional to Funresolved =(φ<4µm)2.0. If we include this contribution to the for-mation resistivity we observe a distinct curvature in theRI plot and much lower values for nx and ny (Fig. 16).The value for nz remains large. The need to account forthe contribution to electrical properties from porosities at
10

SPWLA 46th Annual Logging Symposium, June 26-29, 2005
length scales below current image resolution remains animportant challenge. Meeting the challenge will requirehigher resolution imaging. This work is currently beingundertaken.
0.1 1
Sw
1
10
100
RI
n = 2.09n = 2.01
Figure 16: Behaviour of nx, ny when including the con-tribution from microporosity. Now nx = ny � 2 inagreement with experiment.
COMPARISON TO THEORY
Formation Resistivity factor and m
In Table 4 we compare the predictions of m in the layeredsands based on simple averaging and based on the layeredmodel of (Kennedy and Herrick, 2004). The compositevalues for m|| and m⊥ based on simple averaging is 2.42and 2.75 for the 9 layer system. Use of the multicom-ponent theory (Kennedy and Herrick, 2004) with valuesobtained from all k = 9 layers via:
mpar =ln
∑ki=1 Viφ
mii
ln∑k
i=1 Viφi
, (3)
mperp = − ln∑k
i=1 Vi/φmii
lnφ̄,
leads to an underestimation of the variation in m|| andm⊥. This is primarily due to the choice of layers, whichdo not accurately reflect the range of lithofacies and thetrue variation of φ and m in the system.
The underestimation of the extrema given by the formu-lae of (Kennedy and Herrick, 2004) is primarily due tothe problem of not capturing the true behaviour of in-dividual laminations. To make a fairer comparison we
Table 4: Values of m|| and m⊥ based on simple averag-ing and multicomponent theory. Recall that the upscaledvalues calculated for the composite core was mx,y =2.41, 2.42 and mz = 3.31.
9 Layer mx my mz
Simple Averaging 2.42 2.41 2.75Multicomponent 2.31 2.28 2.9318 Layer mx my mz
Simple Averaging 2.76 2.56 2.33Multicomponent 2.53 2.47 2.56
assume a two component model, and use the values ofφ,m for two layers which primarily lie within the highand low porosity zones respectively. From the 18 layermodel (recall Fig. 6(c)) we note that the sixth layer ex-hibits the maximum φ and the seventh layer the mini-mum φ. These layers act as ’porosity end members’ withvalues φupper = .152,mupper = 2.21 and φlower =.100,mlower = 3.15. Taking these two layers as theprimary layers that comprise the full laminated sand, weuse the two component model of (Kennedy and Herrick,2004), varying the volume of the two component Vi inEqn. 4 to predict m|| and m⊥ as a function of meanporosity φ̄. The locus of m values is given in Fig. 17along with the values determined directly from the fullconductivity simulation. The predictions of Eqn. 4 are in
0.08 0.1 0.12 0.14 0.16
φ2
2.4
2.8
3.2
3.6
Cem
enta
tion
Exp
onen
t (m
)
m⊥m
//m
upscale
Figure 17: Locus of points giving the prediction of thecementation exponent m parallel and perpendicular tothe bedding plane based on porosity end members withvalues φupper = .152,mupper = 2.21 and φlower =.100,mlower = 3.15 and Equation (3). The agreementbetween the theoretical prediction and simulation is ex-cellent.
good agreement with the data. This shows the accuracyof the multicomponent model of (Kennedy and Herrick,2004) if one can accurately ascertain the porosity end
11
VVV

SPWLA 46th Annual Logging Symposium, June 26-29, 2005
members for the layered system. As shown above, thisinformation is easily obtained from the porosity trace forthe imaged rock fragments.
CONCLUSIONS
1. 3D pore scale imaging of an aeolian core plug ex-hibiting fine scale laminae (laminations at the mmscale) has been undertaken via high resolution micro-CT. The image is obtained at 5.6 micron resolu-tion on a 3 cm x 7.5 mm x 7.5 mm fragment withthe long axis perpendicular to the bedding planes.Over 30 laminations are evident from the imagedata. The porosity resolved at this resolution ismeasured as 12.8%. This is in reasonable agree-ment with MICP data on the same core material forthe contribution of pores with diameter ≥ 5.6µm.However the sample contains significant porosityin pores having sizes below the resolution of thescanner (100 nm - 3 microns).
2. Computational results are presented for the forma-tion factor, permeability and drainage capillary pres-sure of the imaged core. Comparisons of the pre-dictions of permeability and drainage capillary pres-sure with experimental data on the same core ma-terial are good. The resistivity of the formation isoverestimated due to the inability to resolve poresbelow 4 microns.
3. Significant anisotropy in resistivity and permeabil-ity are observed when simulated in three orthog-onal directions on the imaged core fragment; Re-sistivity perpendicular to the bedding plane is 5-6 times greater than parallel to the bedding plane.Permeability is 10 times greater parallel to the bed-ding plane.
4. Evaluation of resistivity index exponent n requiresone to include contributions to the RI from unre-solved image porosity. Including the contributionfrom unresolved pores leads to values of n � 2.0parallel to the bedding plane and n > 4 perpendic-ular to the bedding plane.
5. Tomographic imaging combined with He porositymeasurements and the multicomponent model of(Kennedy and Herrick, 2004) can provide realisticvalues for m and n in finely laminated sandstones.
6. The present resolution of 4 µm is sufficient to pro-vide very good estimates of permeability becauseunresolved porosity below this resolution contributeslittle to overall fluid transport. It is expected thatrealistic composite relative permeability data willalso be obtained.
FUTURE WORK
The challenge from the current work remains to extendthe imaging technique to higher resolutions. Clearly alayer made up of connected microporosity (e.g. a shalelayer) aligned parallel to the bedding plane would notbe swept until very high capillary pressures and wouldtherefore maintain a short circuit (low resistivity path-way) parallel to the bedding plane. There is a need toanalyse the interconnectivity of these regions for con-nected microporous pathways. The radiographic tech-nique used in this study to measure total image porositycan be extended to tomography. This should allow a vi-sualisation of the contributions of microporosity in 3D inparallel with the resolved pore phase, enable a more rig-orous quantifying of the microporous contributions andgive a more accurate estimate of resistivity.
ACKNOWLEDGEMENTS
The authors acknowledge the Australian Government fortheir support through the ARC grant scheme. We thankConocoPhillips for support and the provision of core ma-terial for this study and thank the CRC for FCS, CRCLEME, BHP-Billiton Petroleum, and Woodside Energyfor financial support for the digital core facility. We thankthe A.N.U. Supercomputing Facility and the AustralianPartnership for Advanced Computing for very generousallocations of computer time.
REFERENCES CITED
Arns, C. H., Knackstedt, M. A., Pinczewski, W. V.,and Lindquist, W. B., 2001, Accurate computation oftransport properties from microtomographic images:Geophysical Research Letters, 28, 3361–3364.
Arns, C. H., Knackstedt, M. A., Pinczewski, W. V.,and Garboczi, E. G., 2002, Computation of lin-ear elastic properties from microtomographic images:Methodology and agreement between theory and ex-periment: Geophysics, 67, 1396–1405.
Arns, C. H., Knackstedt, M. A., Pinczewski, W. V.,and Martys, N., 2004, Virtual permeametry on micro-tomographic images: J. Petroleum Sci. and Eng., 45,41–46.
Arns, C. H., Sakellariou, A., Senden, T. J., Sheppard,A. P., Sok, R. M., Pinczewski, W. V., and Knackstedt,M. A., 2005, Digital core laboratory: Reservoir coreanalysis from 3d images: Petrophysics, 46, to appear.Presented at 2004 SPWLA Annual Logging Sympo-sium.
12
SPWLA 46th Annual Logging Symposium, June 26-29, 2005
Auzerias, F. M., Dunsmuir, J., Ferreol, B. B., Martys,N., Olson, J., Ramakrishnan, T. S., Rothman, D. H.,and Schwartz, L. M., 1996, Transport in sandstone: Astudy based on three dimensional microtomography:Geophys. Res. Lett., 23, 705–708.
Coles, M. E., Hazlett, R. D., Muegge, E. L., Jones,K. W., Andrews, B., Dowd, B., Siddons, P., Peskin,A., Spanne, P., and Soll, W. E., 1998, Developments insynchrotron x-ray microtomography with applicationsto flow in porous media: SPE Reservoir Evaluationand Engineering, 36531, 288–296.
Hilpert, M., and Miller, C. T., 2001, Pore-morphologybased simulation of drainage in totally wetting porousmedia: Advances in Water Resources, 24, 243–255.
Katz, A. J., and Thompson, A. H., 1987, Predictionof rock electrical conductivity from mercury injectionexperiments: J. Geophys. Res., 92, 599–607.
Kennedy, W. D., and Herrick, D. C., 2004, Conductiv-ity anisotropy in shale-free sandstone: Petrophysics,45, 38–58.
Knackstedt, M. A., Arns, C. H., Sakellariou, A.,Senden, T. J., Sheppard, A. P., Sok, R. M., Pinczewski,W. V., and Bunn, G. F., 2004, Digital core laboratory:Properties of reservoir core derived from 3d images:Digital core laboratory: Properties of reservoir corederived from 3d images:, Presented at the Asia-PacificConference on Integrated Modelling for Asset Man-agement.
Lee, T. C., Kashyap, R. L., and Chu, C.-N., 1994,Building skeleton models via 3d medial surface/axisthinning algorithms: CVGIP: Graphical Models andImage Processing, 56, 462–478.
Martys, N. S., and Chen, H., 1996, Simulation of mul-ticomponent fluids in complex three-dimensional ge-ometries by the lattice boltzmann method: Phys. Rev.E, 53, 743–750.
Perona, P., and Malik, J., 1990, Scale-space and edge-detection using anisotropic diffusion: IEEE Trans.Pattern Anal. Mach. Intell., 12, 629–639.
Pratt, W. K., 2nd Ed, 1991, Digital image processing:John Wiley and Sons, New York.
Sakellariou, A., Arns, C. H., Limaye, A., Senden,T. J., Sheppard, A. P., Sok, R. M., Pinczewski, W. V.,Knackstedt, M. A., Berge, L., and Øren, P., October2003, µ-ct facility for imaging reservoir rocks at porescales: µ-ct facility for imaging reservoir rocks at porescales:, SEG Technical Program.
Sakellariou, A., Sawkins, T. J., Senden, T. J., and Li-maye, A., 2004a, X-ray tomography for mesoscalephysics applications: Physica A, 339, 152–158.
Sakellariou, A., Senden, T. J., Sawkins, T. J., Knack-stedt, M. A., Turner, M. L., Jones, A. C., Saadatfar,M., Roberts, R. J., Limaye, A., Arns, C. H., Shep-pard, A. P., Sok, R. M., An x-ray tomography facilityfor quantitative prediction of mechanical and transportproperties in geological, biological and synthetic sys-tems, in “Development in X-Ray Tomography IV”,edited bu Ulrich Bonse, Proceedings of SPIE 5535(SPIE, Bellingham, WA, 2004) 473–484.
Sheppard, A. P., Sok, R. M., and Averdunk, H., 2004,Techniques for image enhancement and segmentationof tomographic images of porous materials: PhysicaA, 339, 145–151.
A. Ghous: Abid Ghous is a doctoral candidate in PetroleumEngineering, University of New South Wales (UNSW).He has an MSc in Petroleum Engineering from UNSW(2005) and B.Sc Petroleum Engineering from Universityof Engineering & Technology (UET), Lahore (2002). Heis working on both experimental imaging and computa-tional studies of multi-phase flow and transport propertiesin reservoir core.
F. Bauget: Fabrice Bauget was awarded a PhD in Physicsof Liquids from the University Paris XI in 2002. He holdsa Post-doctoral Fellow appointment at the Australian Na-tional University. His thesis work concentrated on flowand phase change in porous media. At the departmentof Applied Mathematics he continues working on flow inporous media, with a special interest on flow propertiesupscaling.
C. H. Arns: Christoph Arns was awarded a Diploma inPhysics (1996) from the University of Technology Aachenand a PhD in Petroleum Engineering from the Universityof New South Wales in 2002. He is a Research Fellow atthe Department of Applied Mathematics at the AustralianNational University. His research interests include themorphological analysis of porous complex media from3D images and numerical calculation of transport and lin-ear elastic properties with a current focus on NMR re-sponses and dispersive flow. Member: AMPERE, ANZ-MAG, ARMA, DGG.
A. Sakellariou: Arthur Sakellariou was awarded a B.Sc(Hons) in 1994 and a Ph.D. in Experimental Physics in2002 from The University of Melbourne. He currentlyholds a Research Fellow appointment at Australian Na-tional University (ANU). Work at ANU includes the con-tinual development of an advanced X-ray tomography fa-cility capable of imaging samples with 8 billion voxels
13
VVV

SPWLA 46th Annual Logging Symposium, June 26-29, 2005
and down to a resolution of 2 microns per voxel. Histhesis work concentrated on developing a technique tomeasure the three dimensional distribution of mass den-sity and elemental composition in micro-samples with anuclear microprobe. His primary interest remains in to-mography and its associated software and hardware tech-nology. Member: AIP, IOP, SPIE.
T.J. Senden: Timothy John Senden received his train-ing and PhD in physical chemistry at the Australian Na-tional University in 1994. His principal techniques areatomic force microscopy and surface force measurement,but more recently micro-X-ray tomography. His researchcentres around the application of interfacial science toproblems in porous media, granular materials, polymeradsorption and single molecule interactions.
A.P. Sheppard: Adrian Sheppard received his B.Sc. fromthe University of Adelaide in 1992 and his PhD in 1996from the Australian National University and is currentlya Research Fellow in the Department of Applied Mathe-matics at the Australian National University. His researchinterests are network modelling of multiphase fluid flowin porous material, topological analysis of complex struc-tures, and tomographic image processing.
R. M. Sok: Rob Sok studied chemistry and received hisPhD (1994) at the University of Groningen in the Nether-lands and is currently a Research Fellow in the Depart-ment of Applied Mathematics at the Australian NationalUniversity. His main areas of interest are computationalchemistry and structural analysis of porous materials.
W. V. Pinczewski: W.V Pinczewski holds BE (Chem.Eng)and PhD degrees from the University of New South Wales(UNSW). He is Head of the School of Petroleum En-gineering at UNSW. His research interests include im-proved oil recovery, multi-phase flow and transport prop-erties in porous media and network modelling.
Richard Harris: is a petrophysicist with ConocoPhillips(U.K.) Ltd. Based in Aberdeen, Scotland, where he workson CoP’s North Sea Business Unit assets in the U.K.and Norway. Richard graduated with a BSc in Engineer-ing Science from the University of Warwick, England,in 1981 and joined the British National Oil Corporation.He moved into petrophysics in 1984 and joined PhillipsPetroleum Co as a petrophysicist in 1987. He workedfor Phillips in the U.K. and Norway on a wide varietyof petrophysical projects, specialising in recent years inwater saturation correlation techniques. He took up hiscurrent post in 2002.
Gary Beck: is a petrophysical specialist with EOG Re-sources in Houston, TX where he is responsible for petro-physical evaluations of EOGs International activities andoffshore GoM. Gary graduated with a MSc in Geologyfrom Purdue University in 1982 and joined Chevron USAas a geologist and moved into petrophysics in 1986. Garyjoined Vastar in 1997, which became part of BP in 2000.In 2003 he moved to EOG Resources where he works ona wide range of projects. Gary has presented numerouspapers at SPWLA, SPE, AAPG and EAGE meetings andreceived the Best Paper Award for the 1996 SPWLA An-nual Symposium. A long time board member of SPWLA,Gary is a past president of SPWLA and is presently serv-ing as VP-Information Technology.
M.A. Knackstedt: Mark Knackstedt was awarded a BScin 1985 from Columbia University and a PhD in Chemi-cal Engineering from Rice University in 1990. He is anAssociate Professor at the Department of Applied Math-ematics at the Australian National University and a Vis-iting Professor at the School of Petroleum Engineeringat the University of NSW. His work has focussed on thecharacterisation and realistic modelling of disordered ma-terials. His primary interests lie in modelling transport,elastic and multi-phase flow properties and developmentof 3D tomographic image analysis for complex materials.
14