influence of permeability anisotropy and reservoir...
TRANSCRIPT
Society of Petroleum Engineers
SPE 60295
Influence of Permeability Anisotropy and Reservoir Heterogeneity on Optimization of Infill Drilling in Naturally Fractured Tight-Gas Mesaverde Sandstone Reservoirs, San Juan Basin H.K. Al-Hadrami and L.W.Teufel, New Mexico Tech
Copynght 2000, Society of Petroleum Engineers Inc.
This paper was prepared for presentation at the 2000 SPE Hocky Mountain Regional/Low Permeability Reservoirs Symposium held in Denver, CO, 12-15 March 2000.
This paper was selected for presentation by an SPE Program Committee following review of information contained in an abstract submitted by the authors). Contents of the paper, as presented, have not been reviewed by the Society of Petroleum Engineers and arB subject to correction by the author(s). The material, as presented, does not necessarily reflect any position of the Society of Petroleum Engineers, its officers, or members. Papers presented at SPE meetings are subject to publication review by Editorial Committees of the Society of Petroleum Engineers. Electronic reproduction, distribution, or storage of any part of this paper for commercial purposes without the written consent of the Society of Petroleum Engineers is prohibited. Permission to reproduce in print is restricted to an abstract of not more than 300 words; illustrations may not be copied. The abstract must contain conspicuous acknowledgment of where and by whom the paper was presented. Write Librarian, SPE, P.O. Box 833836, Richardson, TX 75083-3836, U.S.A., fax 01-972-952-9435.
undrained. Knowledge of the orientation and magnitude of horizontal permeability anisotropy therefore has significant economic importance in developing and managing a reservoir. Such knowledge allows optimization of the location of infill wells for maximum recovery and drainage of the reservoir with the fewest number of wells.
Natural fractures are of particular importance in stratigraphic traps in low-permeability gas reservoirs, such as the Mesaverde and Dakota sandstones in the San Juan Basin of northwestern New Mexico. Regional extension fractures provide the essential reservoir permeability in these tight-gas sandstone reservoirs. Production is highly dependent on the fracture intensity. Locally, fracture swarms associated with extensional faulting can create narrow bands of higher permeability and stronger permeability anisotropy.
The Blanco Mesaverde reservoir was discovered in 1927. Extensive development took place on 320 acre spacing during the 1950's and defined areas of high initial gas potential and thick net pay. The time required to reach pressure stabilization in long term shut-in pressure buildup tests conducted by El Paso Natural Gas Company in the late 1950's and early 1960's indicated low permeabilities and low drainage efficiency at 320 acre spacing. In 1974 infill drilling on 160 acre spacing was approved"'.
Production on 160 acre spacing in the Mesaverde and Dakota formation reservoirs may still be insufficient for proper gas drainage. Pressure plots generated from the initial pressure of wells drilled in the 1950's compared to wells drilled in the 1970's indicate that some areas had almost initial reservoir pressure even after 20 years of production. Pressures from infill wells were considerable higher than those obtained from 7-day shut-in pressures of the original wells. Remaining gas reserves are usually based on the performance of existing wells. If these wells have high interference and low drainage efficiency, then the remaining reserves will be underestimated.
Winegen(2) defined optimum well spacing as the density of wells that result in the greatest ultimate profit to the operator. Several authors have presented studies on field development
ABSTRACT Production of Mesaverde tight-gas reservoirs is highly dependent on natural fractures. Fractures not only enhance the overall permeability, they also create significant permeability anisotropy that causes the drainage area of the wells to be elliptical. Elongated drainage areas creates production interference and drainage overlap between adjacent wells that are aligned in the maximum horizontal permeability direction, and increases the potential for leaving large sections of the reservoirs undrained. In addition, the Mesaverde sandstone reservoirs are locally heterogeneous, because of their fluvial depositional environment. Reservoir characterization and simulation models have been conducted in two pilot areas to predict reservoir quality, permeability anisotropy, well productivity for infill wells drilled on 80 acre spacing. Simulation results are compared to well performance of these infill wells and demonstrate the value of reservoir simulation in determining effective drainage areas, optimum location, and additional recovery of infill wells.
INTRODUCTION Fractures are present in almost all oil and gas reservoirs, but it is only when fractures form an interconnected network that their effect on fluid flow becomes important. Fractures not only enhance the overall permeability of many reservoirs they also create significant permeability anisotropy. Permeability anisotropy causes the drainage area around the wells to be elliptical. Elongated drainage creates more production interference and drainage overlap between adjacent wells and increases the potential for leaving parts of the reservoir
2 H. AL-HADRAMI AND LW.TEUFEL SPE 60295
involving infill wells " . The two questions these studies have attempted to address are (1) what is the optimum number of wells and (2) where should the infill wells be located. Beckner and Song(7> used simulated annealing combined with reservoir simulation and economic calculations to give infill well location and the number of wells needed. The method combines various well placements and production sequences. In their field case the reservoir properties are included. None of these studies consider permeability anisotropy and the consequent effect on drainage area.
The effect of permeability anisotropy on drainage area has been demonstrated in a study of the Mesaverde Formation in San Juan 30-6 township'8'. New wells were drilled on 160-acre spacing with a typical distance of about 2,500 feet between an old well and a new well. The study shows a clear relationship in pressure between infill well locations relative to existing wells. Initial pressure was a function of where the new well intersected the elongated drainage from the existing well. The maximum horizontal permeability direction at this location in the basin is about N10E, and is aligned with the local trend of regional fractures and maximum horizontal stress direction. An increase in initial pressure in the new wells is observed with increasing angular deviation from north and the maximum permeability direction. Knowledge of permeability anisotropy a priori can clearly optimize the location of new infill wells in areas of higher pressure potential and increased drainage efficiency.
This paper is a part of an integrated study of reservoir characterization and simulation studies of tight-gas reservoirs in the San Juan Basin, New Mexico. This multidisciplinary study is investigating the influence of natural fractures and geological heterogeneities on productivity of sandstone reservoirs in the Mesaverde Group and Dakota Fonnation. This paper focuses on a reservoir characterization and simulation study of two pilot areas where well spacing was reduced from 160 acres to 80 acres spacing for the Mesaverde Group.
The Mesaverde Group consists of three major tight formations. From top to bottom, these are the Cliffhouse, Menefee, and Point Lookout sandstones. The Cliffhouse and Point Lookout Formations are continous massive sandstone deposits. The Menefee consists of fluvial-deltaic and channel sand deposits that are, in general, heterogeneous and discontinuous.
In this study the magnitude and orientation of the anisotropic permeability determined by Harstad and others has been incorporated into the simulation study. A geological model, that provides the basis for the flow simulation model, has been constructed from available well logs using geostatistical analysis techniques. Simulation results are compared to well performance of these infill wells and demonstrate the value of reservoir simulation in determining
effective drainage areas, optimum location, and additional recovery of infill wells.
GEOSTATISTICAL STUDY Two areas, SJ29N7W and SJ27N5W, were used as a pilot study for the Mesaverede Group. Each study area covers a four-section area containing 23-25 producing wells. Logs for each of the wells were digitized and interpreted. The tops and thicknesses for the Cliffhouse, Menefee and Point Lookout Formations of the Mesaverede Group are shown in Tables 1 and 2. The effective porosity was calculated from the neutron-density crossplot for each well. All well logs were exported into a geostatistical software program. A geostatistical analysis was then conducted for each fonnation in the Mesaverede Group.
Variograms were used extensively in the geostatistical analysis. Building variograms in a particular direction provides insight in determining the spatial distribution of a given reservoir property. In this study, an average porosity was calculated for each formation at each well location. A sequentional guassian simulation was then conducted using variograms in specificed directions to distribute the porosity. This variogram model has the same characteristics of sill, range and direction of the real data from all of the wells. One hundred sequential simulations were conducted for each formation. The average of these simulations was used as input into the flow simulation model. Sequential simulations were also conducted to define the formation tops and thicknesses of each formation in the Mesaverde Group in the two pilot areas.
The permeability model was obtained from porosity-permeability correlations. The maximum and minimum anisotropic permeability was provided from the interference well test results. These permeability values are shown in Tables 3 and 4. Correlations were developed from the well test data and the porosity field was converted into permeability anisotropy. The permeability field follows the same anisotropic direction as in the porosity field conducted using geostatistics. Permeability anisotropy represents both the matrix and fracture permeability.
The geostatistical model was built for the four sections in each of the pilot areas. Different realizations of the geological models were constructed to investigate the anisotropic direction of fluid flow in the Mesaverde Group. An isotropic model was also constructed as a comparison model that uses the effective mean of the anisotropic permeability in the anisotropic model.
FLOW-SIMULATION STUDY Small-scale Model A 50 x 50 x 3 grids simulation model was conducted for each area to predict a general fluid flow response in each formation of the Mesaverde Group and to estimate the effect of permeability anisotropy on gas production. Only one layer was
SPE 60295 INFLUENCE OF PERMEABILITY ANISOTROPY AND HETEROGENEITY ON
OPTIMIZATION OF INFILL DRILLING IN NATURALLY FRACTURED TIGHT-GAS 3
used in the vertical direction for each formation in the Mesaverde Group (Cliffhouse, Menefee and Point Lookout Formations). Simulations of both anisotropic and isotropic flow models were conducted. Different anisotropic directional flow models were also investigated. Production of 20 years of gas flow, from 1970 to 1989, was modeled.
Large-Scale Model This model has dimensions of 50 x 50 x 10 grid blocks. In this model, six vertical layers were used for the Menefee Formation and two layers were used in each of the Cliffhouse and Point Lookout Formations. Production of 30 years of gas flow, from 1970 to 1999, was simultated in this model. The first 20 years (from 1970 to end of 1989) were used to history match the production from the model with the historical production data. This history matching was based both on the total 'field' production of the pilot area and also to each individual well production. The best model to historical data, in terms of production, geological integrity and validity of the input data, was chosen for the history matching. The last 10 years of production history (from end of 1989 to end of 1999) was used to verify the history matching by running the history matching model for this 10 year period without adjusting any variables in the model. The history matched flow simulation models were then used to predict the gas production in the Mesaverde Formation for an additional 30 years until 2030.
RESULTS AND DISCUSSIONS The results presented in this paper are for the pilot study areas in SJ29N7W and SJ27N5W. All flow simulation models were conducted using MERLIN flow simulator. This simulator is a black oil type using windows operating system.
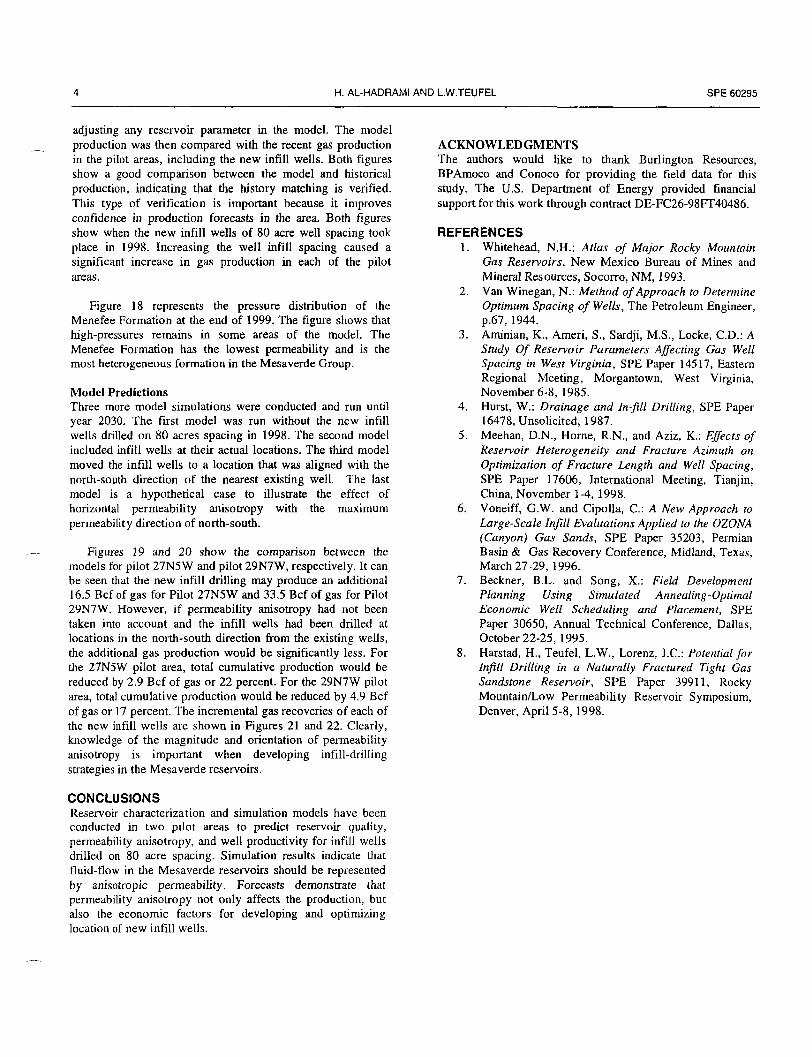
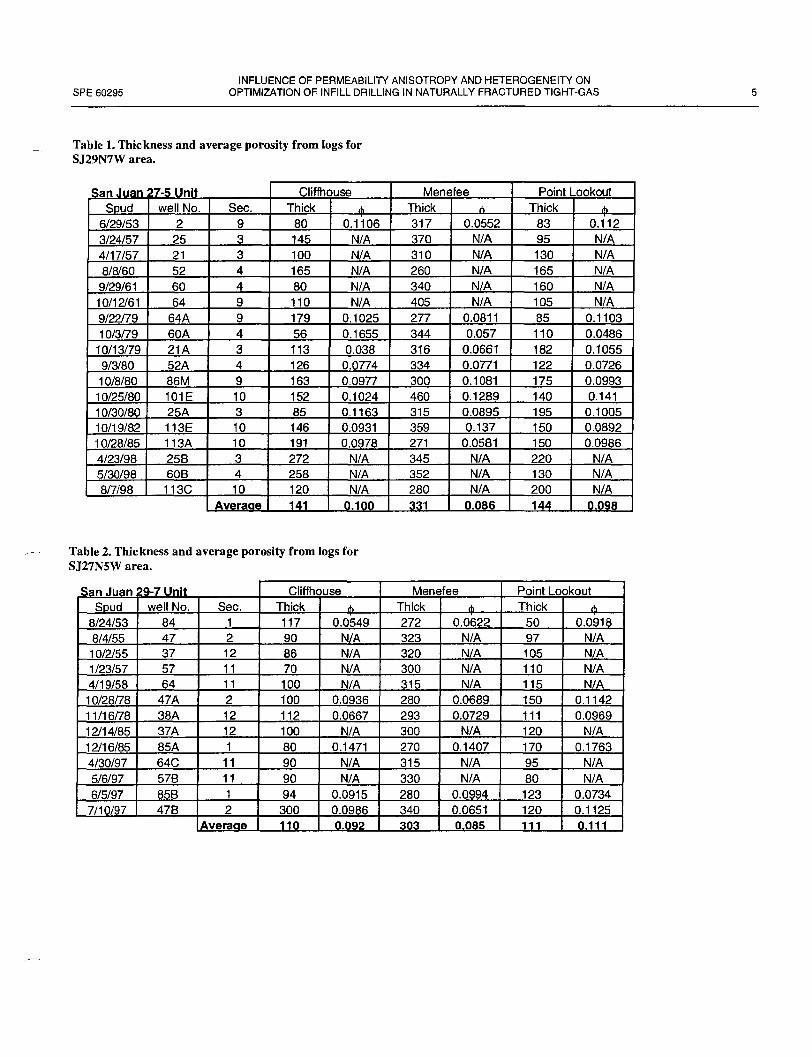
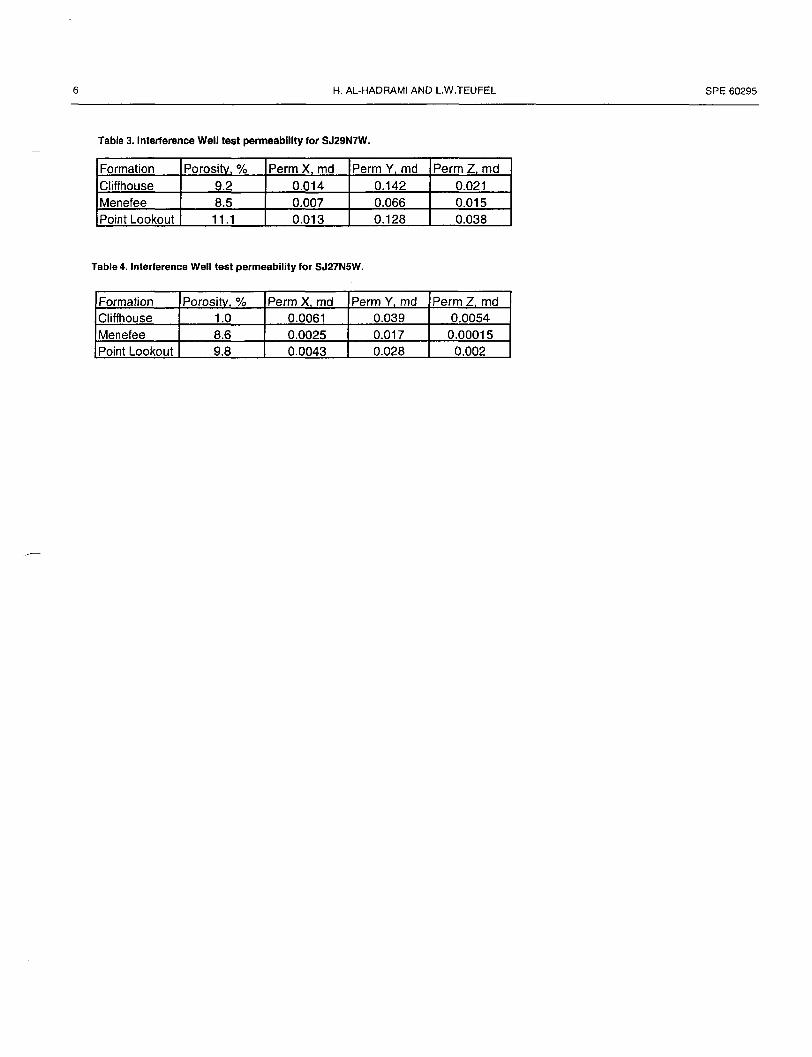
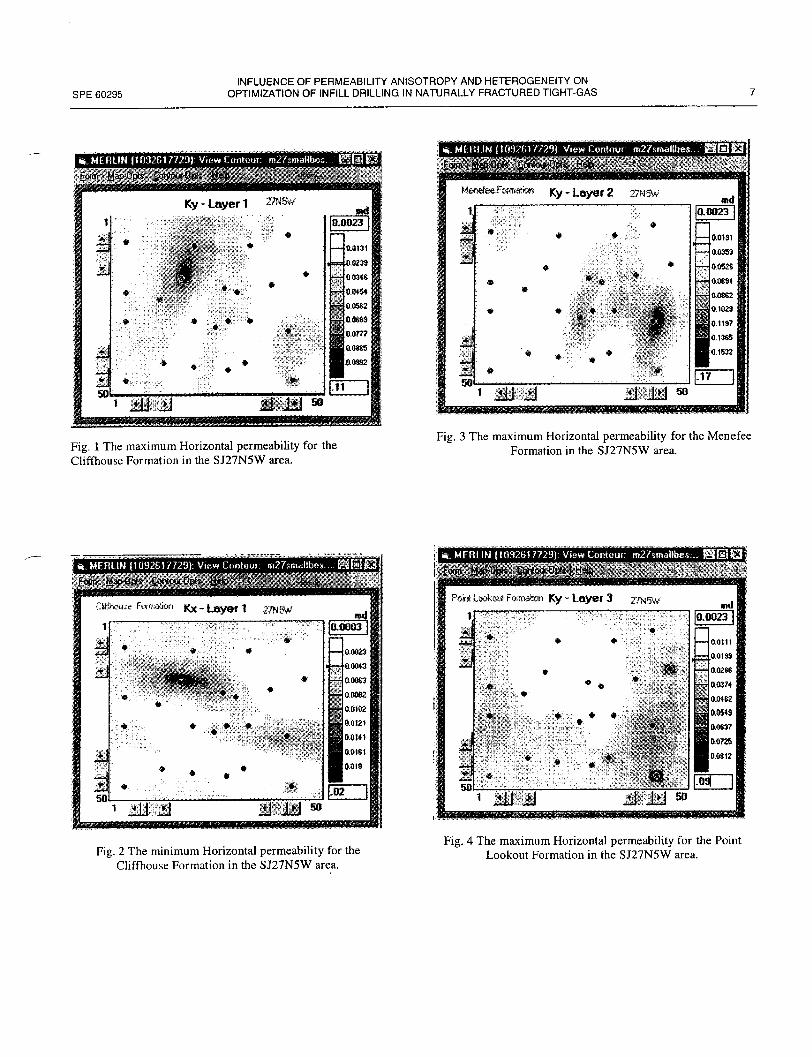
The Geological Model Figures 1 and 2 show the permeability anisotropy for SJ27N5W pilot area. The maximum horizontal permeability is aligned with the N10E direction and the minimum horizontal permeability is orthogonal to this trend at N80W. These permeability trends provide the most reliable geological model representation for the study area. Since the permeability values are collected from the interference well test, this anisotropic permeability model represents both the matrix and fractures. Figures 3 and 4 provide similar information for the SJ27N5W area and show the maximum horizontal permeability for the Menefee and Point Lookout Formations.
Effect of Permeability Anisotropy - Small-Scale Model Two simulation models for each area were built, one represents an isotropic case and the other represents the anisotropic permeability. The isotropic model has one permeability value for each formation. This value is the mean effective permeability of the maximum and minimum horizontal permeability of the anisotropic model. Both models were run in the simulator, prior to any history matching, and their model production was compared with the historical data.
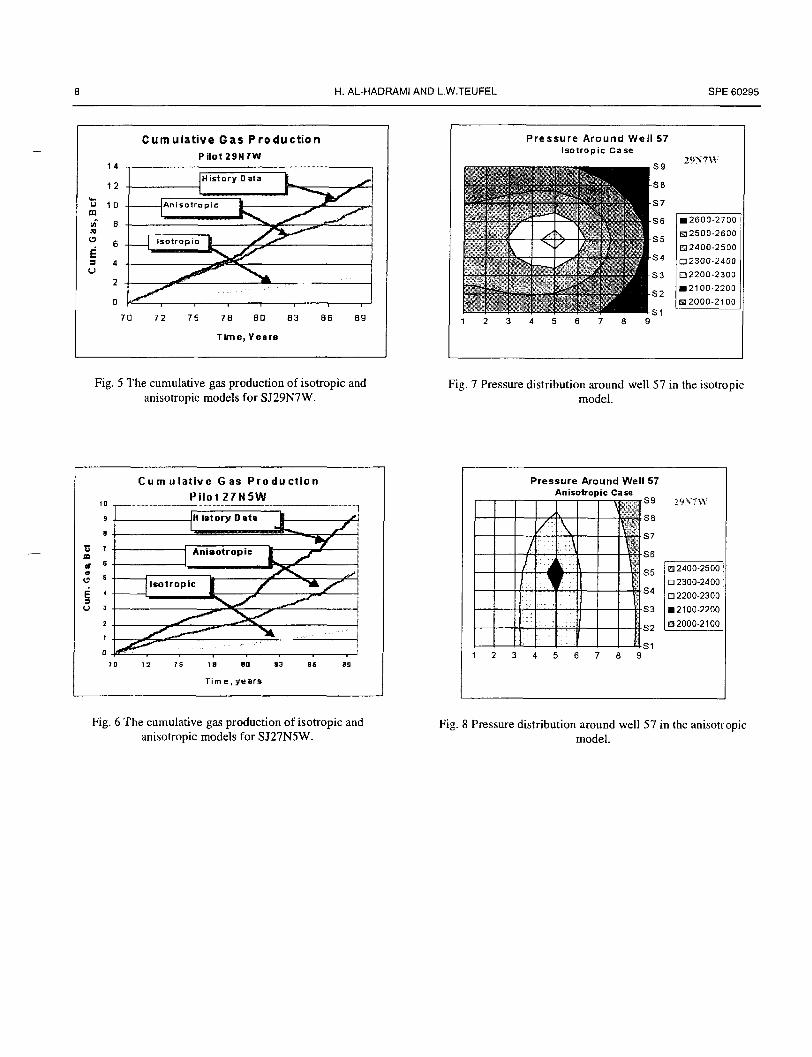
Figures 5 and 6 show the cumulative gas production from both models compared with historical data for SJ297W and SJ27N5W, respectively. There are significant differences between the two model cases. The anisotropic case is closer to the history production.
The difference in the drainage area between the two models is shown in Figures 7 and 8. Figure 7 has a circular shape for drainage area and represents radial flow of the isotropic permeability model. The elliptical shape drainage area shown in Figure 8 represents the anisotropic permeability model. A larger drainage area is shown in the anisotropic case, in terms of production, is a resultant effect from all the wells in the model.
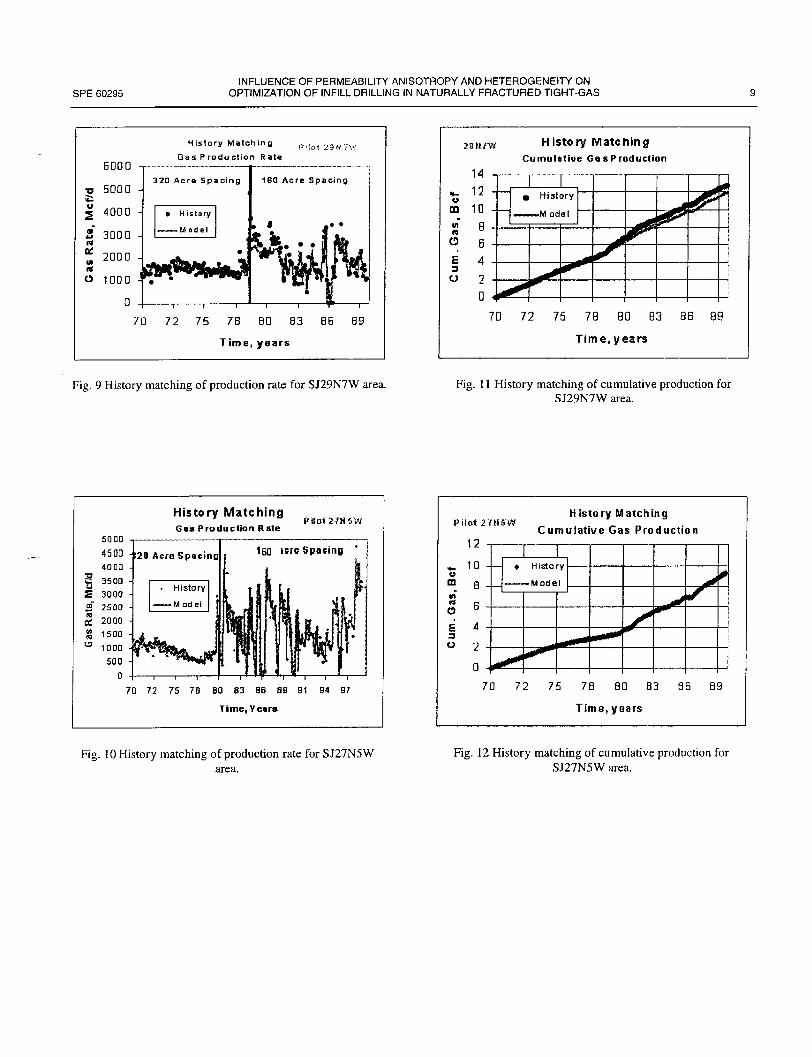
History Matching - Large-Scale Model The anisotropic model was chosen for history matching. Historical production from 1970 to 1989 was used to compare with the model production. Figures 9 and 10 show the gas production rates for SJ29N7W and SJ27N5W, respectively. The history matches were achieved by adjusting the magnitude of the permeability (both the maximum (Ky) and minimum (Kx)), as well as other reservoir parameters. The permeability around each individual well was altered. However, the anisotropic permeability ratio of 10 to 1 was kept unchanged. The large increase in gas production occurred where the infill drilling of 160 acre well spacing was started. The cumulative gas production for both areas is shown in Figures 11 and 12. There is a good match between observed and predicted production, indicating that a good geological model was developed through the geostatistical analysis.
The cumulative production in SJ29N7W is higher than SJ27N5W. Formation thicknesses and porosity are similar for the two pilot areas. Therefore, it suggested that the higher production in SJ29N7W could be related to higher fracture intensity.
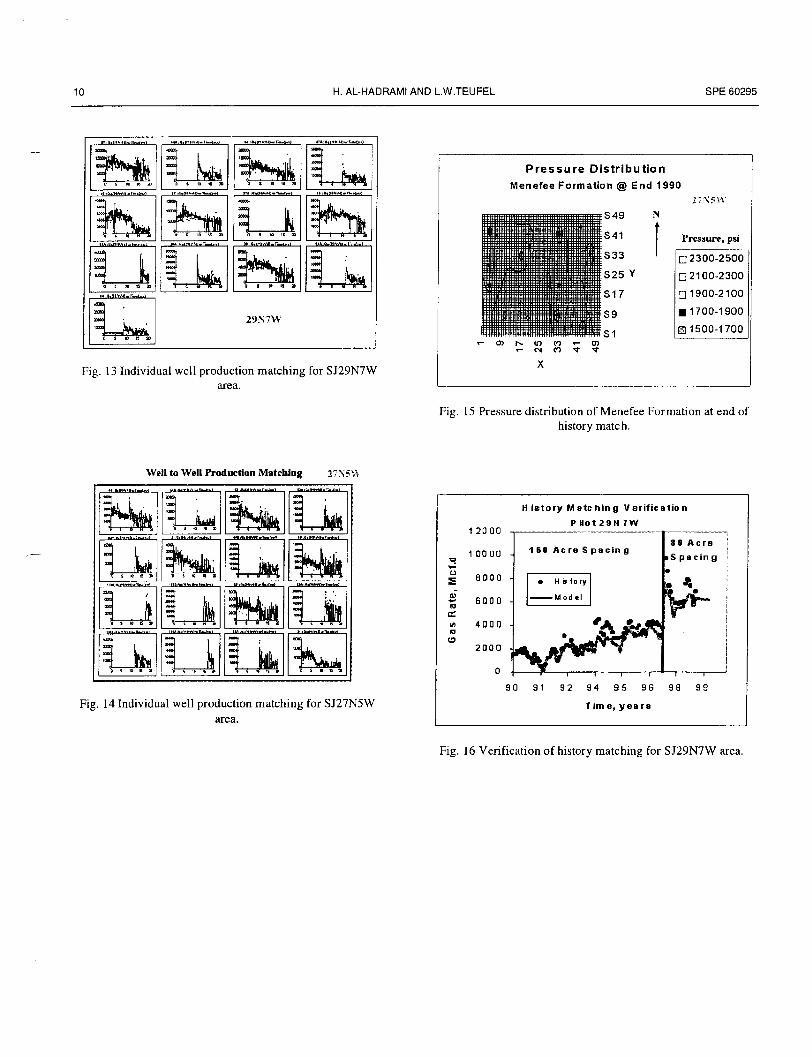
Figures 13 and 14 show the individual gas production rate for each well in the model for both areas. Individual well history matching was also achieved.
Figure 15 shows the pressure distribution plots for the Menefee Formation at the end of history matching. It shows high pressure in some areas of the model. However, some areas are overlapped if the wells are aligned in the north direction. These areas should be avoided by placing the wells away from the north-south direction.
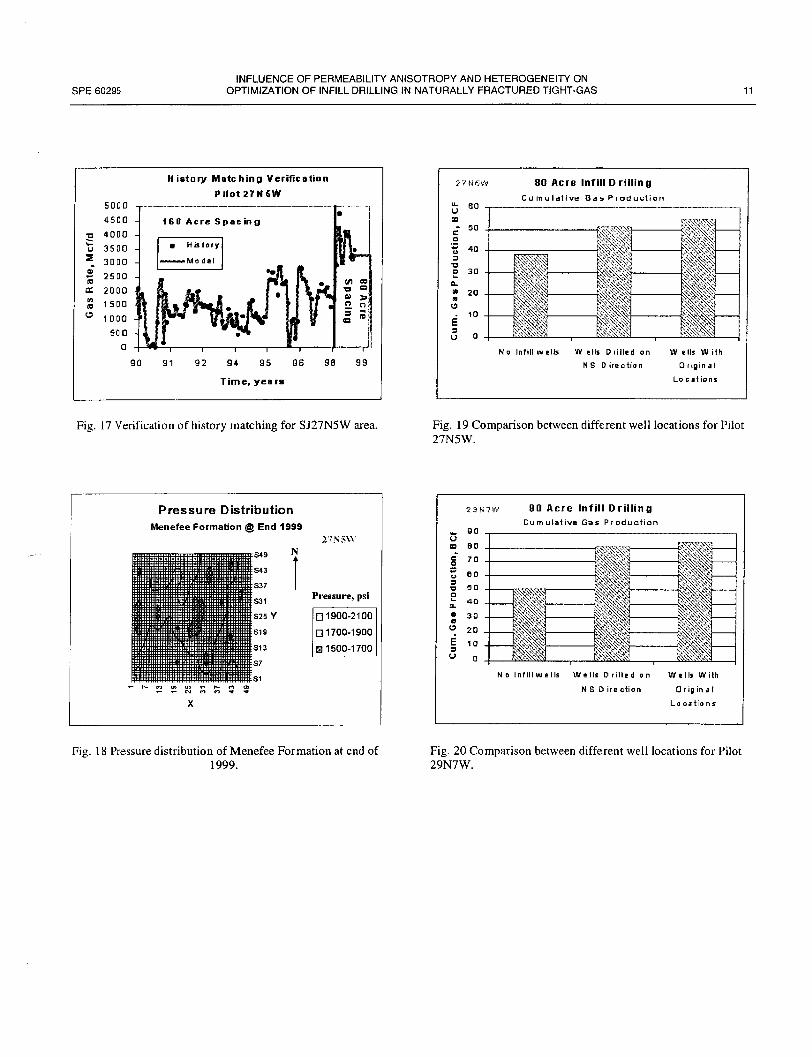
Verification of History Matching Verifying the history matching is important when using the simulation model to forecast future production. Figures 16 and 17 represent the verification of history matching for SJ29N7W and SJ27N5W, respectively. Simulation of production was continued for an additional 10 years (from 1990 to 1999) after the initial history matching without
4 H. AL-HADRAMI AND L.W.TEUFEL SPE 60295
adjusting any reservoir parameter in the model. The model production was then compared with the recent gas production in the pilot areas, including the new infill wells. Both figures show a good comparison between the model and historical production, indicating that the history matching is verified. This type of verification is important because it improves confidence in production forecasts in the area. Both figures show when the new infill wells of 80 acre well spacing took place in 1998. Increasing the well infill spacing caused a significant increase in gas production in each of the pilot areas.
Figure 18 represents the pressure distribution of the Menefee Formation at the end of 1999. The figure shows that high-pressures remains in some areas of the model. The Menefee Formation has the lowest permeability and is the most heterogeneous formation in the Mesaverde Group.
Model Predictions Three more model simulations were conducted and run until year 2030. The first model was run without the new infill wells drilled on 80 acres spacing in 1998. The second model included infill wells at their actual locations. The third model moved the infil l wells to a location that was aligned with the north-south direction of the nearest existing well. The last model is a hypothetical case to illustrate the effect of horizontal permeability anisotropy with the maximum permeability direction of north-south.
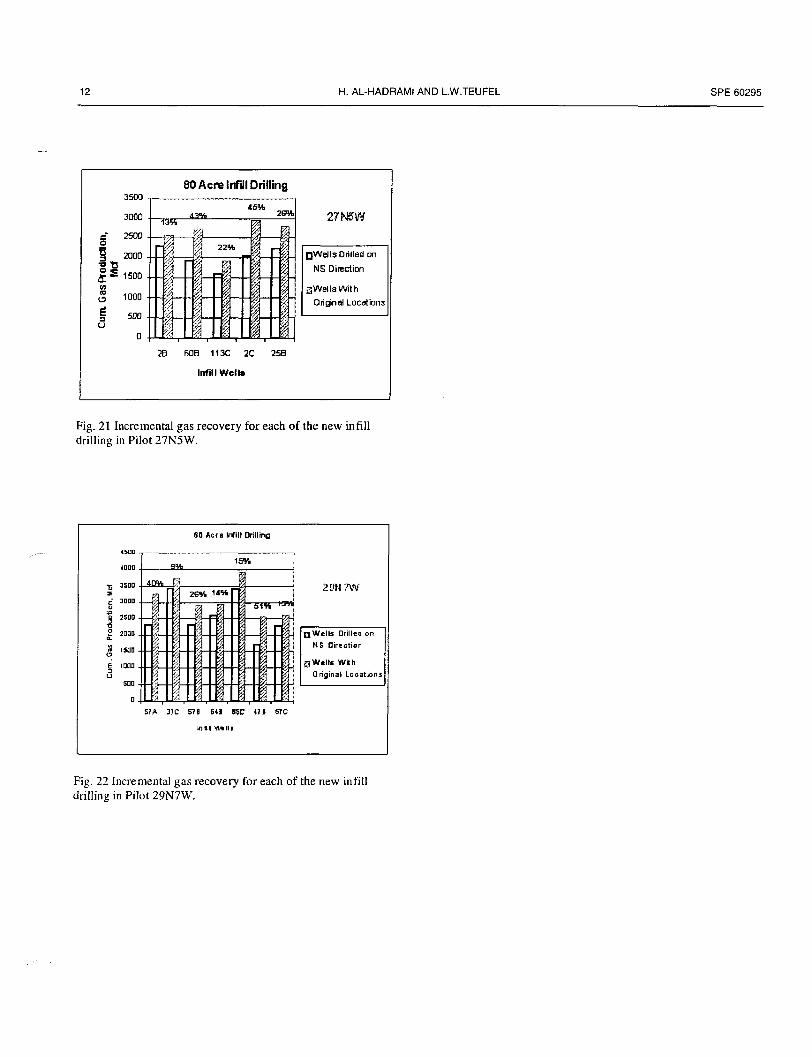
Figures 19 and 20 show the comparison between the models for pilot 27N5W and pilot 29N7W, respectively. It can be seen that the new infill drilling may produce an additional 16.5 Bcf of gas for Pilot 27N5W and 33.5 Bcf of gas for Pilot 29N7W. However, i f permeability anisotropy had not been taken into account and the infill wells had been drilled at locations in the north-south direction from the existing wells, the additional gas production would be significantly less. For the 27N5W pilot area, total cumulative production would be reduced by 2.9 Bcf of gas or 22 percent. For the 29N7W pilot area, total cumulative production would be reduced by 4.9 Bcf of gas or 17 percent. The incremental gas recoveries of each of the new infill wells are shown in Figures 21 and 22. Clearly, knowledge of the magnitude and orientation of permeability anisotropy is important when developing infill-drilling strategies in the Mesaverde reservoirs.
ACKNOWLEDGMENTS The authors would like to thank Burlington Resources, BPAmoco and Conoco for providing the field data for this study. The U.S. Department of Energy provided financial support for this work through contract DE-FC26-98FT40486.
REFERENCES 1. Whitehead, N.H.: Atlas of Major Rocky Mountain
Gas Reservoirs, New Mexico Bureau of Mines and Mineral Resources, Socorro, NM, 1993.
2. Van Winegan, N.: Method of Approach to Determine Optimum Spacing of Wells, The Petroleum Engineer, p.67,1944.
3. Aminian, K., Ameri, S., Sardji, M.S., Locke, CD.: A Study Of Reservoir Parameters Affecting Gas Well Spacing in West Virginia, SPE Paper 14517, Eastern Regional Meeting, Morgantown, West Virginia, November 6-8, 1985.
4. Hurst, W.: Drainage and ln-fill Drilling, SPE Paper 16478, Unsolicited, 1987.
5. Meehan, D.N., Home, R.N., and Aziz, K.: Effects of Reservoir Heterogeneity and Fracture Azimuth on Optimization of Fracture Length and Well Spacing, SPE Paper 17606, International Meeting, Tianjin, China, November 1-4, 1998.
6. Voneiff, G.W. and Cipolla, C: A New Approach to Large-Scale Infill Evaluations Applied to the OZONA (Canyon) Gas Sands, SPE Paper 35203, Permian Basin & Gas Recovery Conference, Midland, Texas, March 27-29, 1996.
7. Beckner, B.L. and Song, X.: Field Development Planning Using Simulated Annealing-Optimal Economic Well Scheduling and Placement, SPE Paper 30650, Annual Technical Conference, Dallas, October 22-25,1995.
8. Harstad, H., Teufel, L.W., Lorenz, J.C.: Potential for Infill Drilling in a Naturally Fractured Tight Gas Sandstone Reservoir, SPE Paper 39911, Rocky Mountain/Low Permeability Reservoir Symposium, Denver, April 5-8, 1998.
CONCLUSIONS Reservoir characterization and simulation models have been conducted in two pilot areas to predict reservoir quality, permeability anisotropy, and well productivity for infill wells drilled on 80 acre spacing. Simulation results indicate that fluid-flow in the Mesaverde reservoirs should be represented by anisotropic permeability. Forecasts demonstrate that permeability anisotropy not only affects the production, but also the economic factors for developing and optimizing location of new infill wells.
SPE 60295 INFLUENCE OF PERMEABILITY ANISOTROPY AND HETEROGENEITY ON
OPTIMIZATION OF INFILL DRILLING IN NATURALLY FRACTURED TIGHT-GAS 5
Table 1. Thickness and average porosity from logs for SJ29N7W area.
San Juan 27-5 Unit Cliffhouse Menefee Point Lookout
Soud well No. Sec. Thick t Thick if» Thick <j> 6/29/53 2 9 80 0.1106 317 0.0552 83 0.112
3/24/57 25 3 145 N/A 370 N/A 95 N/A
4/17/57 21 3 100 N/A 310 N/A 130 N/A
8/8/60 52 4 165 N/A 260 N/A 165 N/A
9/29/61 60 4 80 N/A 340 N/A 160 N/A
10/12/61 64 9 110 N/A 405 N/A 105 N/A
9/22/79 64A 9 179 0.1025 277 0.0811 85 0.1103
10/3/79 60A 4 56 0.1655 344 0.057 110 0.0486
10/13/79 21A 3 113 0.038 316 0.0661 182 0.1055
9/3/80 52A 4 126 0.0774 334 0.0771 122 0.0726
10/8/80 86M 9 163 0.0977 300 0.1081 175 0.0993
10/25/80 101E 10 152 0.1024 460 0.1289 140 0.141
10/30/80 25A 3 85 0.1163 315 0.0895 195 0.1005
10/19/82 113E 10 146 0.0931 359 0.137 150 0.0892
10/28/85 113A 10 191 0.0978 271 0.0581 150 0.0986
4/23/98 25B 3 272 N/A 345 N/A 220 N/A
5/30/98 60B 4 258 N/A 352 N/A 130 N/A
8/7/98 113C 10 120 N/A 280 N/A 200 N/A
Averaae 141 0.100 331 0.086 144 0.098
Table 2. Thickness and average porosity from logs for SJ27N5W area.
San Juan 29-7 Unit Cliffhouse Menefee Point Lookout
Spud well No. Sec. Thick <|> Thick <)> Thick
8/24/53 84 1 117 0.0549 272 0.0622 50 0.0918
8/4/55 47 2 90 N/A 323 N/A 97 N/A
10/2/55 37 12 86 N/A 320 N/A 105 N/A
1/23/57 57 11 70 N/A 300 N/A 110 N/A
4/19/58 64 11 100 N/A 315 N/A 115 N/A
10/28/78 47A 2 100 0.0936 280 0.0689 150 0.1142
11/16/78 38A 12 112 0.0667 293 0.0729 111 0.0969
12/14/85 37A 12 100 N/A 300 N/A 120 N/A
12/16/85 85A 1 80 0.1471 270 0.1407 170 0.1763
4/30/97 64C 11 90 N/A 315 N/A 95 N/A
5/6/97 57B 11 90 N/A 330 N/A 80 N/A
6/5/97 85B 1 94 0.0915 280 0.0994 123 0.0734
7/10/97 47B 2 300 0.0986 340 0.0651 120 0.1125 Averaae 110 0.092 303 0.085 111 0.111
6 H. AL-HADRAMI AND L.W.TEUFEL SPE 60295
Table 3. Interference Well test permeability for SJ29N7W.
Formation Porosity, % Perm X, md Perm Y, md Perm Z, md Cliffhouse 9.2 0.014 0.142 0.021 Menefee 8.5 0.007 0.066 0.015 Point Lookout 11.1 0.013 0.128 0.038
Table 4. Interference Well test permeability for SJ27N5W.
Formation Porositv, % Perm X, md Perm Y, md Perm Z. md Cliffhouse 1.0 0.0061 0.039 0.0054 Menefee 8.6 0.0025 0.017 0.00015 Point Lookout 9.8 0.0043 0.028 0.002
SPE 60295 INFLUENCE OF PERMEABILITY ANISOTROPY AND HETEROGENEITY ON
OPTIMIZATION OF INFILL DRILLING IN NATURALLY FRACTURED TIGHT-GAS 7
MERLIN (1092817729): View r i i II
Form MjfOpts £onrour0pti Help
Ky-Layer 1 27N5W
50
* *
tnd
1 _LU iJ
a0023 |
0.0131
0.8239
— 003*9
00454
— 00562
1 Q.08S5
1 0.8992
L i i |
Fig. 1 The maximum Horizontal permeability for the Cliffhouse Formation in the SJ27N5W area.
fit MERLIN (1092617729): View Contour: m2?smallhes... S t e l l a Foirn Map Opts Contour Opts Help
MenenseJ'care*wri Ky . Layer 2 7N5W md
0.0023
0.0131
00353
0.0526
oom 00SS2
0.1029
0.1197
0 1395
01532
-17
1 >jj ll <j |>j 50
Fig. 3 The maximum Horizontal permeability for the Menefee Formation in the SJ27N5W area.
« MERLIN |!u9?B1/72iI) V.. w f i.ntuui n.?7.inJibes . H I S S
Form Map Opts Contour Opts Kelp
»!house Formation K x - L a y e r 1 27NSW
zl « 50
0.0003
.02
i l i l l 5 0
« Mf HI IN (1092617729): View Contour. m2?smallbes... H H I 3 :
| Form Map-Op's Contour Opt? j Help
Port Lookout Formaton Ky - L a y e r 3 27N5W
I j
* • # »
50L i JLLJ 2i
0.0023 |
6.0111
aom 0.0289
0.0374
0.0462
0.0543
B.0S37
00725
0.0912
Fig. 2 The minimum Horizontal permeability for the Cliffhouse Formation in the SJ27N5W area.
Fig. 4 The maximum Horizontal permeability for the Point Lookout Formation in the SJ27N5W area.
8 H. AL-HADRAMI AND L.W.TEUFEL SPE 60295
Cumulative Gas Production Pilot 29N7W
Fig. 5 The cumulative gas production of isotropic and anisotropic models for SJ29N7W.
P r e s s u r e Around Wel l 57 Isotropic Case
S9 29X7W
S8
S 7
S 6 • 2600-2700
S5 £32500-2600
S5 EU2400-2500
S 4 D 2 3 0 0 - 2 4 0 0
S 3 • 2200-2300
S2 • 2100-2200
S2 £3 2000-2100
S1
Fig. 7 Pressure distribution around well 57 in the isotropic model.
Fig. 6 The cumulative gas production of isotropic and anisotropic models for SJ27N5W.
Fig. 8 Pressure distribution around well 57 in the anisotropic model.
SPE 60295 INFLUENCE OF PERMEABILITY ANISOTROPY AND HETEROGENEITY ON
OPTIMIZATION OF INFILL DRILLING IN NATURALLY FRACTURED TIGHT-GAS 9
6D00
-a 5D0Q
| 4000
S 3D0Q rs * 2000 n O 1DD0
History Matching p . , o ( 2 g N 7 w
Gas Product ion Rate
32D A c r e S p a c i n g 160 A c r e S p a c i n g
• His tory
M o d e l
I I I i i i I I I
7D 72 75 7FJ BD 83 86 89
Time, years
Fig. 9 History matching of production rate for SJ29N7W area.
23N7W
14
History Matching Cumulative GasProduct ion
«. 12 m 10
5 6
O B E 4 3
O 2 0
I I a History
—M od el
i 70 72 75 79 80 S3 86 89
Time, years
Fig. 11 History matching of cumulative production for SJ29N7W area.
History Matching Gas Production Rate
Pi lot2 7NSW
160 'ere Spacing *
t3
n ID
Time, Years
Pilot 2 7M5W H istory Matching
Cumulative Gas Production
70 72 75 78 80 83 06 Q9
Time, years
Fig. 10 History matching of production rate for SJ27N5W area.
Fig. 12 History matching of cumulative production for SJ27N5W area.
10 H. AL-HADRAMI AND L.W.TEUFEL SPE 60295
S 10 IS
0 J tt B X
M ; a . l H f l 7 < 1 ^ 1 ^ . l ^ l
feat f_jk 1*5* a s io is »
9 3 19 IS X
29N7W
Fig. 13 Individual well production matching for SJ29N7W area.
P r e s s u r e D i s t r i b u t i o n
Menefee Formation @ End 1990
27X5W N
Pressure, psi
• 2300-2500
• 2100-2300
• 1900-2100
• 1700-1900
01500-1700
Fig. 15 Pressure distribution of Menefee Formation at end of history match.
Fig. 16 Verification of history matching for SJ29N7W area.
SPE 60295 INFLUENCE OF PERMEABILITY ANISOTROPY AND HETEROGENEITY ON
OPTIMIZATION OF INFILL DRILLING IN NATURALLY FRACTURED TIGHT-GAS 11
History Matching Verification
P i l o t 2 7 H S W
160 Acre S p a c i n g
90 91 92 94 95 96
T i m e , yea rs
Fig. 17 Verification of history matching for SJ27N5W area.
E 3 (J
?N5Vt
SO .
50 .
40 -
30 -
20 -
10 -
80 Acre Infill D r i l l ing
C u m u l a t i v e Ga s P r o d u c t i o n
No Infill wel ls W ells Dr i l led on
NS D i rec t i on
W ells W ith
• rigin al
Lo ca t ions
Fig. 19 Comparison between different well locations for Pilot 27N5W.
Fig. 18 Pressure distribution of Menefee Formation at end of 1999.
Fig. 20 Comparison between different well locations for Pilot 29N7W.
12 H. AL-HADRAMI AND L.W.TEUFEL SPE 60295
o
(« (5
o
3500
3000
2500
2000
1500
1000
500
0
80 Acre Infill Drilling
2B BOB 113C 2C
Infill We l ls
25B
27N5W
• W e l l s Drilled on
NS Direction
0 W e l l s W i t h
Original Locations
Fig. 21 Incremental gas recovery for each of the new infill drilling in Pilot 27N5W.
80 Acre Infill Dnl lino
STA 37C 571 6 t l 85C 4-71
in ii II tt'tiii
29M7W
QWells Drilled on
NS Direction
jg Wells With
Original Locations
Fig. 22 Incremental gas recovery for each of the new infill drilling in Pilot 29N7W.
Fracture Orientation: Use of the Dipmeter Type Fracture Log
ALAN EMMENDORFER Mesa Grande Resources, Inc., 1-200 Philtower Building, Tulsa, OK 74103
ABSTRACT
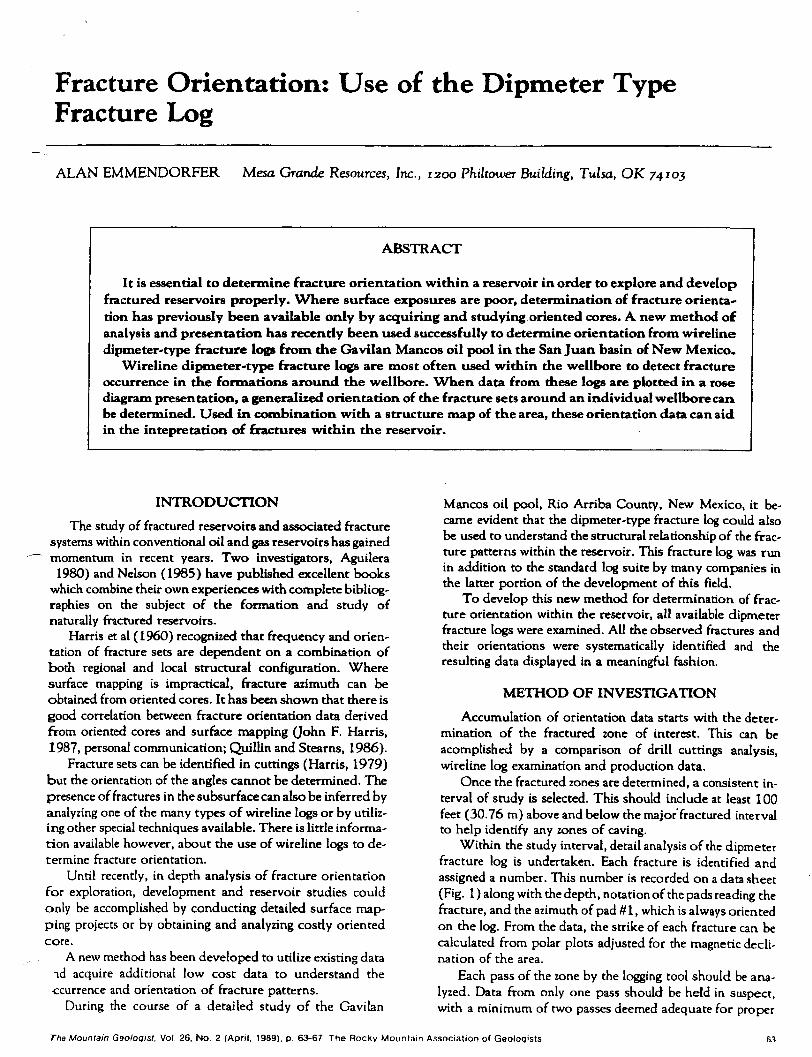
I t is essential to determine fracture orientation w i t h i n a reservoir i n order to explore and develop fractured reservoirs properly. Where surface exposures are poor, determination of fracture orientation has previously been available only by acquiring and studying oriented cores. A new method of analysis and presentation has recently been used successfully to determine orientation f rom wireline dipmeter-type fracture logs f r o m the Gavilan Mancos oi i pool i n the San Juan basin of New Mexico.
Wireline dipmeter-type fracture logs are most often used w i t h i n the wellbore to detect fracture occurrence in the formations around the wellbore. When data f rom these logs are plotted i n a rose diagram presentation, a generalized orientation of the fracture sets around an individual wellbore can be determined. Used i n combination w i t h a structure map of the area, these orientation data can aid in the intepretation of fractures w i t h i n the reservoir.
I N T R O D U C T I O N
The study of fractured reservoirs and associated fracture systems within conventional oil and gas reservoirs has gained momentum in recent years. Two investigators, Aguilera
1980) and Nelson (1985) have published excellent books which combine their own experiences with complete bibliographies on the subject of the formation and study of naturally fractured reservoirs.
Harris et al (1960) recognized that frequency and orientation of fracture sets are dependent on a combination of both regional and local structural configuration. Where surface mapping is impractical, fracture azimuth can be obtained from oriented cores. It has been shown that there is good correlation between fracture orientation data derived from oriented cores and surface mapping (John F. Harris, 1987, personal communication; Quillin and Stearns, 1986).
Fracture sets can be identified in cuttings (Harris, 1979) but the orientation of the angles cannot be determined. The presence of fractures in the subsurface can also be inferred by analyzing one of the many types of wireline logs or by utilizing other special techniques available. There is little information available however, about the use of wireline logs to determine fracture orientation.
Until recently, in depth analysis of fracture orientation for exploration, development and reservoir studies could only be accomplished by conducting detailed surface mapping projects or by obtaining and analyzing cosdy oriented core.
A new method has been developed to utilize existing data id acquire additional low cost data to understand the •ccurrence and orientation of fracture patterns.
During the course of a detailed study of the Gavilan
Mancos oil pool, Rio Arriba County, New Mexico, it became evident that the dipmeter-type fracture log could also be used to understand the structural relationship of the fracture patterns within the reservoir. This fracture log was run in addition to the standard log suite by many companies in the latter portion of the development of this field.
To develop this new method for determination of fracture orientation within the reservoir, all available dipmeter fracture logs were examined. All the observed fractures and their orientations were systematically identified and the resulting data displayed in a meaningful fashion.
METHOD OF INVESTIGATION
Accumulation of orientation data starts with the determination of the fractured zone of interest. This can be acomplished by a comparison of drill cuttings analysis, wireline log examination and production data.
Once the fractured zones are determined, a consistent interval of study is selected. This should include at least 100 feet (30.76 m) above and below the major fractured interval to help identify any zones of caving.
Within the study interval, detail analysis of the dipmeter fracture log is undertaken. Each fracture is identified and assigned a number. This number is recorded on a datasheet (Fig. 1) along with the depth, notation of the pads reading the fracture, and the azimuth of pad #1, which is always oriented on the log. From the data, the strike of each fracture can be calculated from polar plots adjusted for the magnetic declination of the area.
Each pass of the zone by the logging tool should be analyzed. Data from only one pass should be held in suspect, with a minimum of two passes deemed adequate for proper
The Mountain Geologist, Vol 26, No. 2 (April. 1989). p 63-67. The Rocky Mountain Association of Geologists fit
64 A. EMMENDORFER
FRACTURE ORIENTATION WORKSHEET
WtM N W :
L K S I I O K :
f f t t . Lot} Run H i
ND Dtpth foot Heading,
F/ecWre
A/ int t ih ol
Pod # 1 Str ike Comments
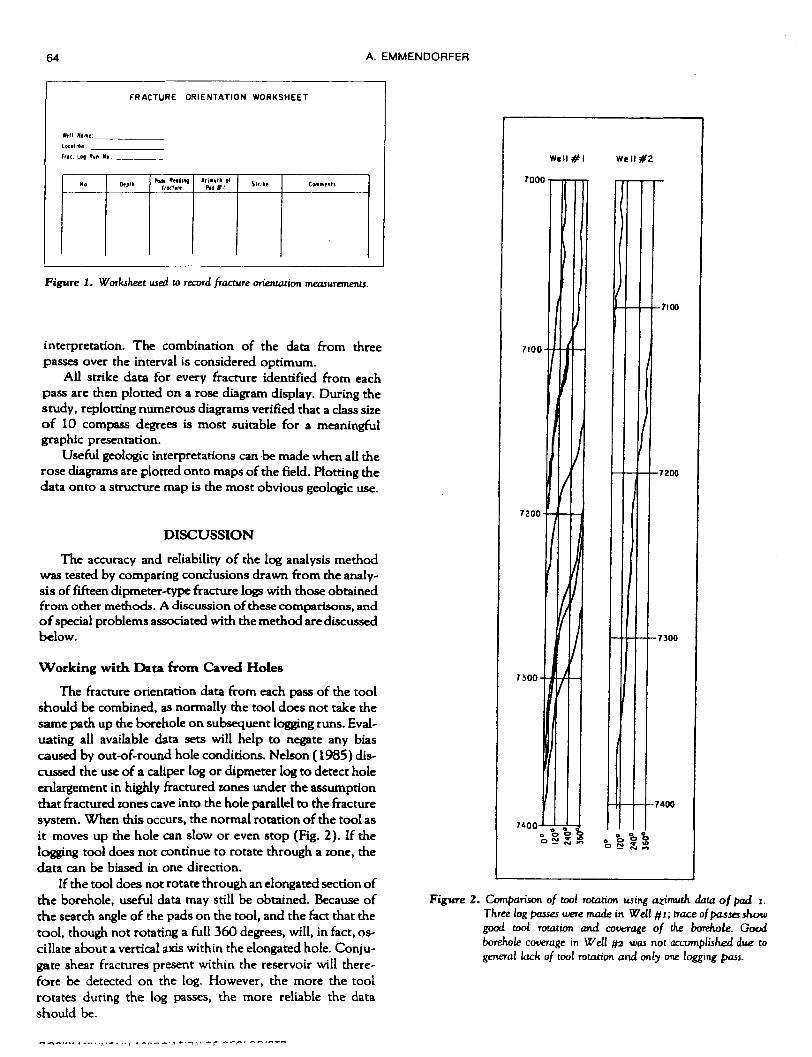
Figure 1. Worksheet used to record fracture orientation measurements.
interpretation. The combination of" the data from three passes over the interval is considered optimum.
Al l strike data for every fracture identified from each pass are then plotted on a rose diagram display. During the study, replotting numerous diagrams verified that a class size of 10 compass degrees is most suitable for a meaningful graphic presentation.
Useful geologic interpretations can be made when ail the rose diagrams are plotted onto maps of the field. Plotting the data onto a structure map is the most obvious geologic use.
DISCUSSION
The accuracy and reliability of the log analysis method was tested by comparing conclusions drawn from the analysis of fifteen dipmeter'type fracture logs with those obtained from other methods. A discussion of these comparisons, and of special problems associated with the method are discussed below.
Working wi th Data f rom Caved Holes
The fracture orientation data from each pass of the tool should be combined, as normally the tool does not take the same path up the borehole on subsequent logging runs. Evaluating all available data sets will help to negate any bias caused by out-of-round hole conditions. Nelson (1985) discussed the use of a caliper log or dipmeter log to detect hole enlargement in highly fractured zones under the assumption that fractured zones cave into the hole parallel to the fracture system. When mis occurs, the normal rotation of the tool as it moves up the hole can slow or even stop (Fig. 2). I f the logging tool does not continue to rotate through a zone, the data can be biased in one direction.
If the tool does not rotate through an elongated section of the borehole, useful data may still be obtained. Because of the search angle of the pads on the tool, and the fact that the tool, though not rotating a full 360 degrees, will, in fact, oscillate about a vertical axis within the elongated hole. Conjugate shear fractures present within the reservoir will therefore be detected on the log. However, the more the tool rotates during the log passes, the more reliable the data should be.
Figure 2. Companion of tool rotation using azimuth data of pad i. Three log passes were made in Well f f i ; trace of passes show good tool rotation and coverage of the borehole. Good borehole coverage in Well #2 was not accomplished due to general lack of tool rotation ana" only one logging pass.
FRACTURE ORIENTATION - DIPMETER LOG 65
Core Analysis
Several cores were cut in the Gavilan Mancos field. Examination of the cores revealed multiple fracture orientations and different types of fractures. Open, partially open,
— and filled fractures; penetrative and non-penetrative "ractures were all described from these cores. Comparison of diese cores with the dipmeter logs indicated that all the fracture types were recorded by the micro resistivity readings of the dipmeter tool. Fracture orientation for the entire fracture system could then be determined from these logs with greater confidence.
Televiewer Logs
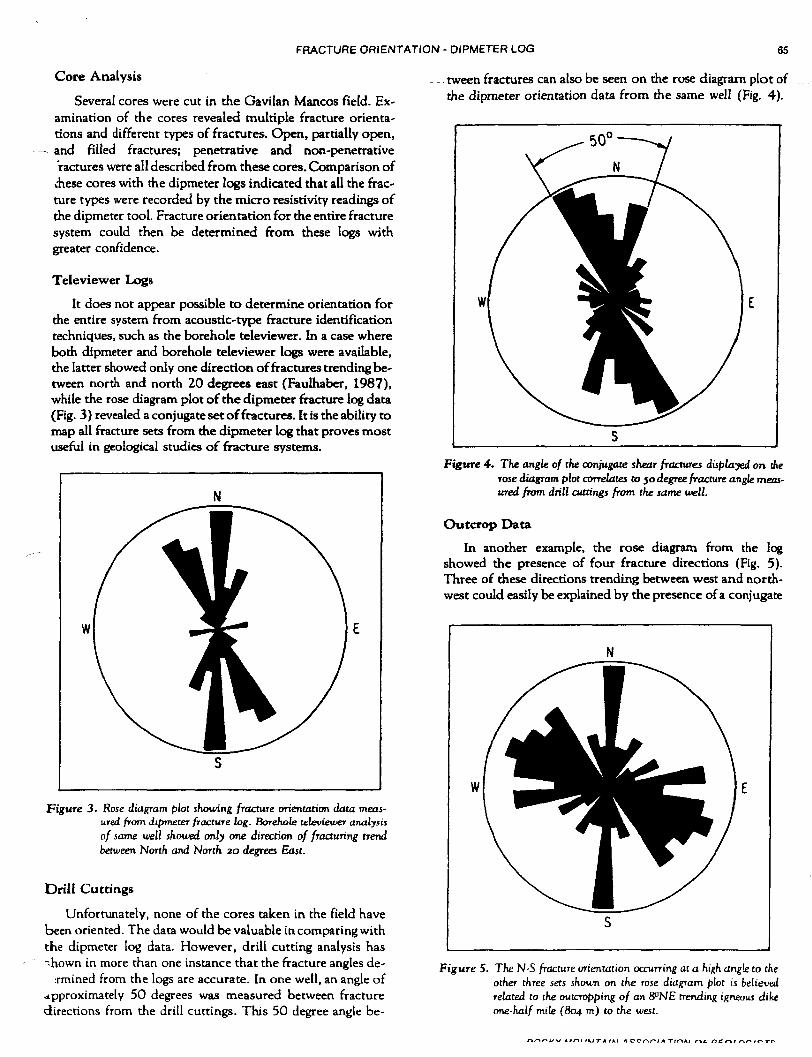
It does not appear possible to determine orientation for the entire system from acoustic-type fracture identification techniques, such as the borehole televiewer. In a case where both dipmeter and borehole televiewer logs were available, the latter showed only one direction of fractures trending between north and north 20 degrees east (Faulhaber, 1987), while the rose diagram plot of the dipmeter fracture log data (Fig. 3) revealed a conjugate set of fractures. It is the ability to map all fracture sets from the dipmeter log that proves most useful in geological studies of fracture systems.
N
Figure 3. Rose diagram plot showing fracture orientation data measured from dipmeter fracture log. Borehole televiewer analysis of same well showed only one direction of fracturing trend between North and North 20 degrees East.
D r i l l Cuttings
Unfortunately, none of the cores taken in the field have been oriented. The data would be valuable in comparing with the dipmeter log data. However, drill cutting analysis has -hown in more than one instance that the fracture angles de-
rmined from the logs are accurate. In one well, an angle of sipproximatety 50 degrees was measured between fracture directions from the drill cuttings. This 50 degree angle be-
tween fractures can also be seen on the rose diagram plot of the dipmeter orientation data from the same well (Fig. 4).
S
Figure 4. The angle of the conjugate shear fractures displayed on the rose diagram plot correlates to 50 degree fracture angle measured from drill cuttings from the same well.
Outcrop Data
In another example, the rose diagram from the log showed the presence of four fracture directions (Fig. 5). Three of these directions trending between west and northwest could easily be explained by the presence of a conjugate
N
1 I Figure 5. The N-S fracture orientation occurring at a high angle to the
other three sets shown on the rose diagram plot is believed related to the outcro/sping of an 8°N£ treruitng igneous dike one-half mile (804 m) to the west.
66 A. EMMENDORFER
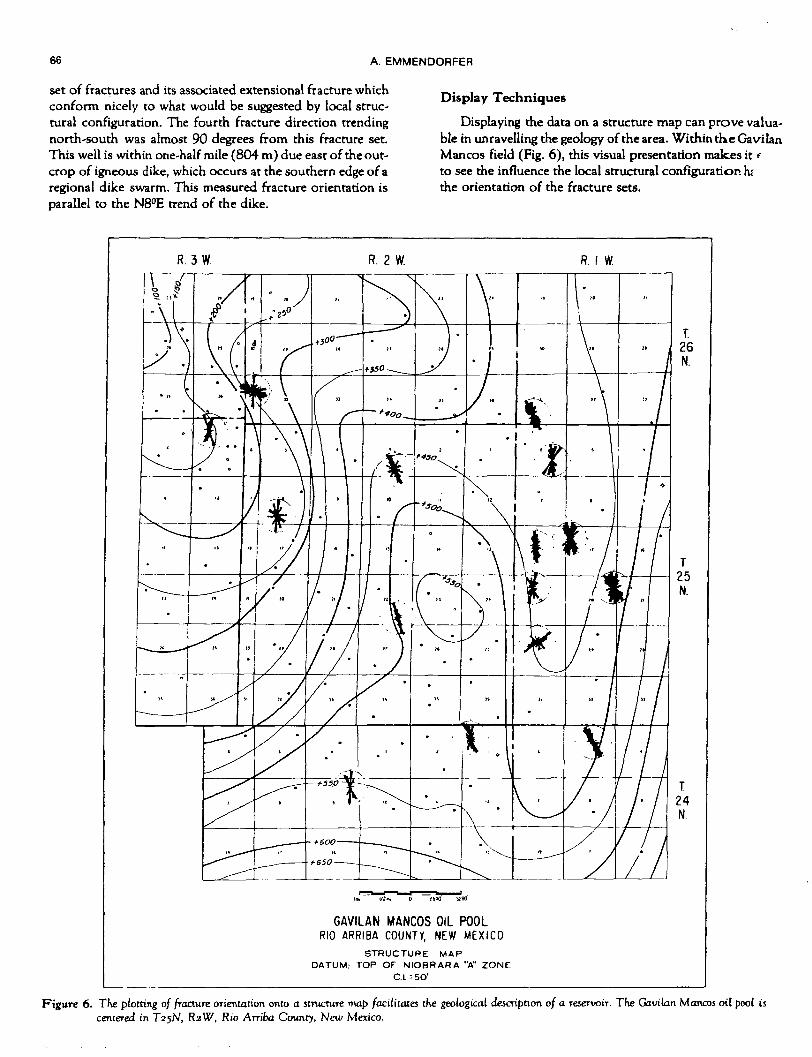
set of fractures and its associated extensional fracture which conform nicely to what would be suggested by local structural configuration. The fourth fracture direction trending north-south was almost 90 degrees from this fracture set. This well is within one-half mile (804 m) due east of the outcrop of igneous dike, which occurs at the southern edge of a regional dike swarm. This measured fracture orientation is parallel to the N8°E trend of the dike.
Display Techniques
Displaying the data on a structure map can prove valuable in unravelling the geology of the area. Within the Gavilan Mancos field (Fig. 6), this visual presentation makes it f to see the influence the local structural configuration h£ the orientation of the fracture sets.
R. 2 W. R. I W.
GAVILAN MANCOS OIL POOL RIO ARRIBA COUNTY, NEW MEXICO
STRUCTURE MAP DATUM: TOP OF NIOBRARA "A" ZONE
C l - 50'
Figure 6. The plotting of fracture orientation onto a structure map facilitates the geological description of a reservoir. The Gavilan Mancos oil pool is centered in T25N, R2W, Rio Arriba County, "New Mexico.
FRACTURE ORIENTATION - DIPMETER LOG 67
CONCLUSIONS
Fracture orientation data from the systematic study of dipmeter-type fracture logs are useful in the geologic study of an area.
The plotting of all fracture orientation measurements on rose diagram plots gives meaningful data for each well in a field or area.
The fracture angle of the orientation data derived from the logs has been shown to match fracture angles measured from drill cuttings from the same wells.
Plotting the rose diagrams onto the structure map of the Gavilan Mancos oil pool has aided in the geologic description of the area by showing what effect the local structure has in controlling the orientation of the fracture sets present.
A C K N O W L E D G M E N T S
I would like to thank John F. Harris for the many discussions on fractures and his critical review of this paper.
Thanks are also due Randy Schmidt for drafting work, Diane Wehrenberg for typing the manuscript and Cathy Orban for help in the original data colletion.
Mesa Grande Resources, Inc. gave permission to publish.
REFERENCES
Aguilera, R., 1980, Naturally Fractured Reservoirs: Penwell Books, Tulsa, OK, 703 p.
Faulhaber, J. F., 1987, Mobile Exhibit No. 1 in Cases Nos. 7980. 8946. 8950, 9113, 9114: New Mexico Oil Conservation Division.
Harris, J. F., G. L. Taylor and J. L. Walper, I960, Relation o f deforma-tional fractures in sedimentary rocks to regional and local structures: AAPG Bulletin, v. 44, p. 1853-1873.
Harris, J. F., 1979, Austin chalk, stratigraphic and diageneric controls of oil entrapment: Houston Geological Society, Continuing Education Course No. 3.
Nelson, R. A., 1985, Geologic analysis of naturally fractured reservoirs: Gulf Publishing Company, Houston, TX, 320 p.
Quillin, J. A. and D. W. Stearns, 1986, Field study of fracture characteristics as function of bed curvature in folded dolomites (abs.): AAPG Bulletin, v. 70. p. 636.
MANUSCRIPT RECEIVED: February, 1988 REVISED: July, 1988 ACCEPTED: January, 1989
OPEN APERTURES, FRACTURE ORIENTATIONS, AND THEIR
CORRELATION TO PRODUCTION IN THE MESAVERDE GROUP
IN THE SAN JUAN BASIN
HARRY THKBI-S I , . ;R
! Amoco r e d u c t i o n Company, PO. Bo:- ; 00. IH nv r t '• ) .S(K'(;I
I ..ate < 'enozoic fault trends affiliated will the Rio Grande Rift liave been identified as ,-ag nifieanl conduits for enhanced gas p -oduciion in the San Juan Basin Open aperture Iraetures have been studied at scales ranging rom inn. roseopie t o n analyses to .< D seismic mapping.
AiKimalously high producing w :11s ai e aligned along these sets oi iraetures and demon •Urate as much as ten times the production are. ol mat roe wells. The primary oriental um ofthe open aperture fractures is N5-10H with a secondary orientation of NM) 40E along reactivated Lai amide aults.
The iniegration of geologic studies, ciigu eermg data, and seismic interpretation 1 ave been critical to developing these conelusi .>ns. onsirueting Ihe lectonie history ol the 1 >asni was the fust and most important step. Ueld weak along the Hanks of the basin was followed bv peloi physical evaluations of cores bom wel s in the basin. Several wells were evaluated foi their performance and. their interfenie wit!» surrounding wells.
Th.jse studies have mutually support ;d these two orientations for open npenurc lrae tures. In I 995 four well were drilled io te-.i these conclusions All tour were successf ul beyond expectation.
ui.(,.ii i-'< ii OHO Svterns I'•>') / mt (. \ >; no .•; ( Jculo o.il S, i. :o
WW Sadaty of Ptfrotum Engineers
SPE 25466
Determination of Hydraulic Fracture Direction, San Juan Basin, New Mexico D.P. Yale, M.K. Strubhar, and A.W. El Rabaa, Mobil R&D Corp.
SPE Members
Copyright tW3, Society ol Petroleum Englneera. Inc.
Thle paper was prepared lor presentation M tht Production Operauona Symposium held In Oklahoma City, OK. USA.. March 21-23, tW3.
Thle paper WM selected lor ptaeenlallnn by an SPE Program Commit!*! Mlowlng review ol Intormallon contained In an abstract submitted by tha aulhorls). Contents ol the paper, aa presented, hava ml been raviawad by tha Sectary ol Petroleum Englrwan and ar* aubjad to corf act kin by tha authorts). The malarial, as presented, dooi not necessarily leflact any poaMon ot tha Society ot Patrolauni Engineers, ka officers, or members Papers presented at SPE meetings a/a subject to publication review by Editorial CommllMes ot the Society ol Petroleum Engineers. Permission lo copy Is restricted lo an abstract ol not mora than 300 words, muttralloni may not ba copied. Tha abstract should contain conspicuous acknowledgment ol where and by whom tha paper la prasantad. Write Ltxarian, SPE, P.O. Box «33o3«. Rlehardeon, TX 750oMa36. U.S.A. Telex, 163245 SPEUT.
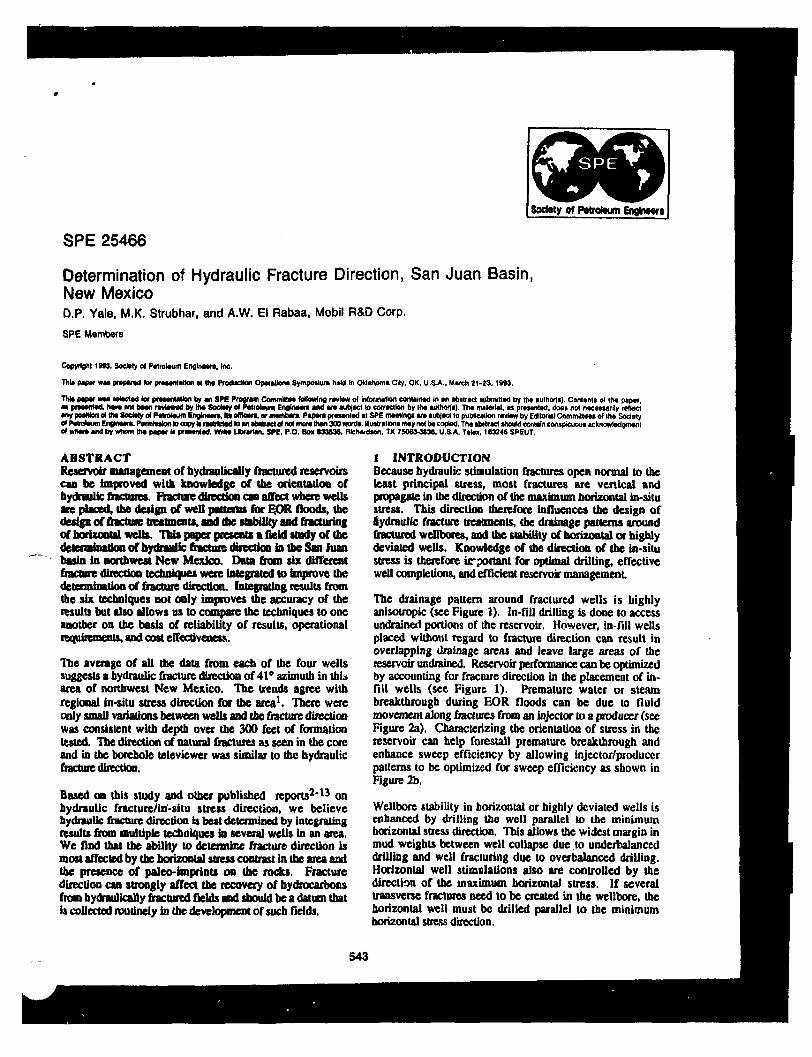
ABSTRACT Reservoir management of bydraulically fractured reservoirs can be improved with knowledge of the orientation of hydraulic fractures. Fracture directioa can affect where wells are placed, the design of well patterns for 3QR floods, tbe design of fracture treatments, and tne stability and fracturing of horizontal wells. This paper presents a field study of the determination of bytjnulk fracture direction in the San Juan basin in northwest New Mexico. Data from six different fracture direction tediniqiie* were integrated to improve the determinatioQ of fracture direction. Integrating results from the six techniques not only improves the accuracy of the results but also allows us to compare tbe techniques to one another ou the basis of reliability of results, operational requirements, and cost effectiveness.
The average of all tbe data from each of the four wells suggests a hydraulic fracture direction of 41* azimuth in this area of northwest New Mexico. The trends agree with regional in-situ stress direction for tbe area1. There were only small variations between wells and tbe fracture direction was consistent with depth over tbe 300 feet of fonnation tested. Tbe direction of natural fractures as seen in tbe core and in the borehole televiewer was similar to tbe hydraulic fracture direction.
Based on this study and other published reports2'13 on hydraulic fracture/iri-situ stress direction, we believe hydraulic fracture direction is best determined by integrating results from multiple techniques in several wells in an area. We find that tbe ability to determine fracture direction is most affected by the horizontal stress contrast in tbe area and the presence of paleo-imprints on (he rocks. Fracture direction can strongly affect tbe recovery of hydrocarbons from bydraulically fractured fields nd should be a datum that is collected routinely in tbe development of such fields.
1 INTRODUCTION Because hydraulic stimulation fractures open normal to the least principal stress, most fractures are vertical and propagate in the direction of the maximum horizontal in-situ stress. This direction therefore influences tbe design of Hydraulic fracture treatments, the drainage patterns around fractured wellbores, and the stability of horizontal or highly deviated wells. Knowledge of the direction of the in-situ stress is therefore irrportant for optimal drilling, effective well completions, and efficient reservoir management
The drainage pattern around fractured wells is highly anisotropic (see Figure 1). In-fill drilling is done to access undrained portions of the reservoir. However, in fill wells placed without regard to fracture direction can result in overlapping drainage areas and leave large areas of the reservoir undrained. Reservoir performance can be optimized by accounting for fracture direction in the placement of infill wells (see Figure 1). Premature water or steam breakthrough during EOR floods can be due to fluid movement along fractures from an injector lo a producer (see Figure 2a). Characterizing the orientation of stress in the reservoir can help forestall premature breakthrough and enhance sweep efficiency by allowing injector/producer patterns to be optimized for sweep efficiency as shown in Figure 2b.
Wellbore stability in horizontal or highly deviated wells is enhanced by drilling the well parallel lo the minimum horizontal stress direction. This allows the widest margin in mud weights between well collapse due to underbalanced drilling and well fracturing due to overbalanced drilling. Horizontal well stimulations also are controlled by the direction of tbe maximum horizontal stress. If several transverse fractures need to be created in the wellbore, the horizontal well must be drilled parallel to the minimum horizontal stress direction.
543
2 DFTF.RMINATTON OF HYDRADTJC FRACTURE DIRECTION SEE_254ft
2 DESCRIPTION OF STUDY
This report details a field study of six different techniques for determining or predicting the azimuthal orientation of hydraulkally induced fractures. The techniques used include: 1) sbear acoustic anisotropy measurements on oriented core, 2) anelastic strain recovery measurements on oriented core, 3) overcoring of fractures induced by microfrac tests, 4) natural and coring induced fractures in oriented core, 5) passive borehole microseismic monitoring, and 6) borehole televiewer measurements of induced and natural fractures.
With the possible exception of tbe overcoring of microfrac induced fractures, all tbe current techniques for determining in-situ stress direction or hydraulic fracture direction inter Ihe direction based on core or log measurements. Because actual fracture direction is difficult if not impossible to determine, the best way to determine the utility of various techniques is' to compare them to one another.
This field study was undertaken in four wells in the San Juan Basin in northwest New Mexico, near Cuba. Tbe tests were done in tbe Dakota formation, which is a low permeability sandstone between 7000 and 8000 feet in depth. The formation is not highly naturally fractured in (he area and wells are generally stimulated with bydraulically induced fractures before, producing at economic rates. The well pattern for the study .wells is a rough square covering an area of approximately 25 square miles.
3 DESCRIPTION OF TECHNIQUES
3.1 Shear Acoustic Anisotropy Tbe shear acoustic anisotropy technique for in-situ stress direction14 is based on the premise that microcracks are generated in a core sample due to the relief of in-situ stress during coring. The relief of an anisotropic stress field leads to an anisotropic distribution of microcracks with more microcracks having strikes perpendicular to the direction of the maximum horizontal stress. By propagating plane polarized sbear acoustic waves vertically through an oriented core sample between a pair of cross-polarized sbear acoustic transducers, the direction of these microcracks can be determined and tbe direction of maximum horizontal stress inferred.
The technique is fully described in Yale and Sprunt14 and Yale15 and is similar to determining tbe crystallographic axis of minerals by rotating a thin section between cross-polarizsd lenses in a peirographlc microscope. In this case, however, a core sample is rotated between cross-polarized shear transducers and the points at which the acoustic signal reaches "extinction1' (goes to zero) are the microcrack directions. The technique is fairly new but nas achieved excellent results10-11'14'16.
3.2 Anelastic Strain Recovery As in shear acoustic anisotropy, the anelastic strain recovery technique relies on the development of microcracks from the relief of the anisotropic in-situ stress field to determine the direction of the in-situ stress. The technique utilizes extremely sensitive LVDT (linear voltage differential transducers) to measure the deformation with time of the core (in a number of different azimuths) immediately after it Is removed from the core bane].
Assuming the expansion of the core is ellipsoidal with one axis vertical, Ihe measured strains can be resolved into the three principal strain directions (vertical, horizontal minimum, and horizontal maximum). The maximum stress direction and hydraulic fracture direction is inferred to be the direction of maximum horizontal expansion. The technique, originally developed by Teufel17 ar<d Blanion19, has received widespread usage for determining in-situ stress directio..M-7,l7,l8,t9
3.3 Overcoring of Microfracs Ihe use of the microfracturing procedure is described by Dane shy et. al. 2 0. The procedure consists of performing a very small volume, low rate fracture treatment over a small open bole section near the bottom of tbe wellbore. This is followed by coring tbe formation immediately below the fracture interval. In many cases, tbe fracture will extend downward as well as out into Ihe formation. When the fracture propagates down through the bottom of tbe bole, the imprint of it is captured in Ihe subsequent coring. By orienting the core, the azimuthal direction of the fracture can be determined. Since tbe fracture is formed in-situ at existing reservoir stress conditions, its orientation should be indicative of the (rue induced fracture azimuth, within the accuracy of core orientation procedures.
3.4 Natural and Coring induced Core Fractures The oriented core from three of the wells was inspected for natural and coring induced fractures. The character of the fractures and their strike in the horizontal plane was determined. Frequently the strike of natural fractures is oriented similarly to the strike of hydraulically induced fractures. This is if tbe fractures are natural hydraulic fractures (i.e. no shear motion detected in the fracture plane) and the stress field direction, at the time the fractures were formed, is the same as the current day stress field direction. Tbe orientation of drilling or coring induced fractures has been used more recently5'7 as an indication of present day maximum horizontal stress direction. Their orieniation has been found to be parallel to the maximum horizontal stress direction.
3.5 Borehole Microseismic Monitoring Tbe borehole microseismic technique is based on the observation that microseismic events apparently continue to occur several hours after cessation of pumping a fracture treatment. These events are due lo the "closure" of the
544
SPF. 2M66 YALE. STRlfBHAR. AND RL RABAA 2
fracture21. Tbe microseismic technique, described in Schuster21 and Sorrels and Mulcahy22, utilizes an oriented three component geophone placed in tbe wellbore near the location of the hydraulic fracture to record the microseismic events after a fracture treatment has ceased. By polarization analysis of these events, a coherent pattern of signals emerges to define the hydraulic fracture plane, giving both strike and dip. Tbe geophone should be run before a fracture treatment as well to determine background noise effects. The geophone is usually oriented using a check shot at a known azimuth away from the wellbore. It also has been used extensively with good results2'3 ,12 ,22.
3.6 Borehole Televiewer Imaging of Induced and Natural Fractures Description of the borehole televiewer (BHTV) was first published by Zemanek et. al. 2 3. The BHTV is an acoustic device employing a high frequency transmitter/receiver acoustic transducer that is rotated about the axis of a logging tool. As the transducer rotates, an acoustic signal is transmitted to toe wellbore wall, reflected back, and received by the transducer. Tbe transducer rotates as tbe logging tool is moved slowly up tbe borehole, allowing the borehole wall to be "imaged*. If tbe wellbore wall is smooth, the majority of tbe transmitted signal is reflected back and received, but if tbe wall is rough, very litUe of tbe signal is reflected back. Variations in the amplitude of tbe returned signal are converted to a gray scale "picture" of the wellbore. Washouts, breakouts, and fractures show up as dark features, while smooth wellbore shows up as light colored areas. As the transducer rotates, a magnetometer in the logging tool
marks a north line on the record to orient features found in the images.
3.7 Core Orientation Tbe first four methods (acoustic anisotropy, strain recovery, microfracing, and core fractures) all require oriented core. Oriented core was taken in all four wells through tbe Dakota formation. Tbe core was oriented during coring using the scribe and survey method. This technique utilizes a scribe shoe attached lo tbe bottom of tbe inner core barrel to mark a line on the core as it is retrieved. A well survey tool, attached to the top of tbe core barrel, records the orientation of the scribe shoe during the coring process. At the time of this study, compass and camera survey tools were standard and were used for this study. The service company responsible for the core orientation claimed an accuracy of ± 7° to ±10°. Nelson's24 study of the accuracy of tbe scribe and survey method suggested a minimum error of ±11°.
4 RESULTS
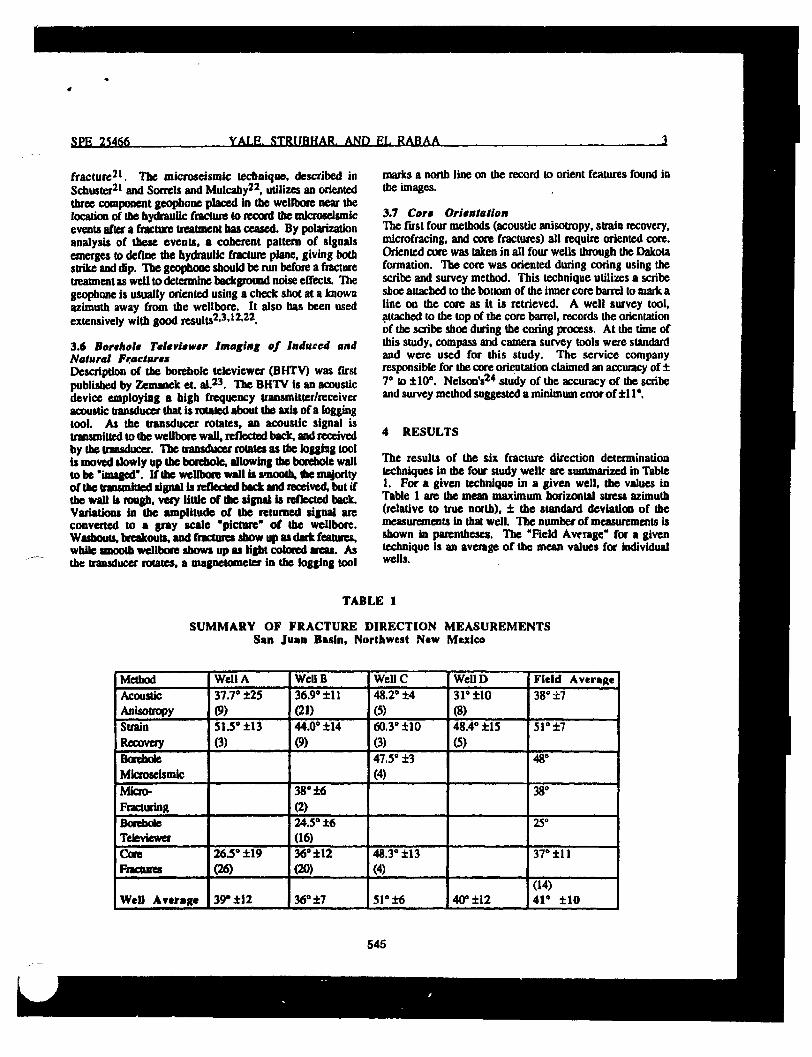
The results of the six fracture direction determination techniques in the four study well? are summarized in Table 1. For a given technique in a given well, tbe values in Table 1 are the mean maximum horizontal stress azimuth (relative to true north), ± the standard deviation of tbe measurements in that well. Tbe number of measurements is shown in parentheses. The "Field Average" for a given technique is an average of die mean values for individual wells.
TABLE 1
SUMMARY OF FRACTURE DIRECTION MEASUREMENTS San Juan Basin, Northwest New Mexico
Method Well A WellB WellC WellD Field Average Acoustic Anisotropy
37.7° ±25 (?)
36.9* ±11 (21)
48.2° ±4 (5)
31° ±10 (8)
38° ±7
Strain Recovery
513° ±13 (3)
44.0* ±14 (9)
60,3* ±10 (3)
48.4* ±15 (5)
51° ±7
Borehole Microseismic
47.5° ±3 (4)
48°
Micro-Fracturing
38° ±6 (2)
38°
Borehole Televiewer
24.5° ±6 (16)
25°
Core noctures
26.5* ±19 (26)
36* ±12 (20)
48.3° ±13 (4)
37° ±11
Well Average 39* ±12 36° ±7 5I*±6 40° ±12 (14) 41° ±10
545
nRTRRMINATlON OF HYDRAULIC FRACTURE DIRECTION SPE 25466
Tbe data in Table 1 show a mean stress direction for the field of 41° azimuth. This corresponds well with the northeast-southwest trend in maximum horizontal regional stress as determined by a number of different techniques1. Figure 3 is a rose diagram of all of tbe data collected from this study. The data suggest that the fracture direction will be similar in wells A, B, and D (about 38°) but that tbe fracture direction in well C will be about 10° further east (about 51°). A discussion of the results from the various methods follows.
4.1 Shear Acoustic Anisotropy Acoustic anisotropy measurements were made on 43 core samples from the 4 study wells. Tbe data suggest a maximum horizontal stress direction of 38° azimuth for the field (mean of all dau is 37s with a standard deviation of 15°). There is little well-to-well variation with the exception of well C in which only 5 samples were tested. Considering tbe potential error in the core orientation survey, ihe acoustic anisotropy results are excellent. Tbe rose diagram in Figure 4 shows the very tight clustering of tbe data.
Four of the 43 samples suggest a stress direction which was 90° from the main trend. Because natural fractures trend in (be same northeast-southwest direction as the maximum horizontal stress, natural (or tectonically induced) microfractures would be at right angles to (he stress-relief microfracture*. In these four cores, the density of natural microfractures may be higher man the density of stress-relief microfractures and thus tne apparent stress direction is 90° from the majority of the data.
4.2 Anelastic Strain Recovery Anelastic strain recovery measurements were done on 20 core samples from the four wells. The ro e diagram of the raw data in Figure 5 shows two trends, northeast-southwest and northwest-southeast. We believe tbat natural microfractures also are affecting tbe strain recovery data, rotating tbe apparent stress direction by 90°. This effect of natural fractures or microfractures on strain recovery testing has been noted by others4'7. Because 50% of tbe strain recovery data snows northeast apparent stress orieniation and 50% shows northwest, it would be difficult using tbe strain recovery data alone to determine tbe true stress orientation.
It is interesting to note tbat tbe acoustic anisotropy measurements are much less affected by the natural fractures/microfractures than the strain recovery measurements despite tbe fact that both techniques rely on the opening of stress-relief microcracks. Tbe polarization of tbe sbear acoustic waves is influenced by the total aaxk density of microfractures23 whereas the azimuth of maximum strain recovery is influenced by the total crack strain due to the opening of (be microfractures. The data collected suggest that at least for tbe area studied, tbe density of stress-relief microcracks is larger than the density of natural microcracks but tbe strain associated with the
opening of natural microfractures is similar to the strain associated with opening of stress-relief microfractures.
4.3 Overcoring of Microfracs Four zones in well B were tested using the overcoring of microfracs technique. Tbe first test was inadvertently done in the shale above the Dakota (about 7450 feet depth) and the core retrieved after the test showed no fracture. The second test was rjeafonned near 7516 feet depth and showed a fracture with strike of 23° azimuth at tbe top of the core rotating to 40° azimuth at the bottom of Ihe core (2 feel lower). The fracture had a dip of approximately 80°. Tbe (bird test was performed at 7568 and tbe recovered core showed at clear fracture with an azimuth of 44° and a dip of 78°. The fourth test was performed near 7658 feet, but after an apparent breakdown at surface pressure 2160 psi, tbe fracture could not be reopened even at (he limit of surface pressure, 3000 psi. A fracture was found in the subsequently recovered core, but it is questionable whether tbe fracture was induced by the microfrac treatment. The azimuth of the fracture was 315° azimuth and may be a stress-relief fracture rather than an induced fracture.
AA Natural and Coring Induced Core Fractures Figure 6 shows a rose diagram of tbe strikes of tbe natural and coring induced fractures from wells A, B, and C. The data have a mean of 32° and a standard deviation of 17°. None of the fractures were filled so that the determination of natural versus drilling induced fractures was made on tbe basis of fracture dip and surface roughness. Natural fractures were identified as those which have dips shallower than 80° and high surface roughness or large fracture opening. Tbe drilling or coring induced fractures were characterized generally as hairline cracks with nearly vertical dips or core splitting with little surface roughness.
The core fractures snow a predominantly northeast-southwest trend but there is a snull northwest-southeast trend. Nearly all the fractures from wells B and C appeared to be coring induced. In well A, half the fractures appear coring induced and half natural. There only was a 2° difference in the fracture strike means between Ihe coring induced and natural fracture sub-populations from well A.
4.5 Borehole Microseismic Monitoring The borehole seismic tests were conducted in well C in two separate zones. Tbe measurements were made in relation to two fracture treatments, one in (be upper part of the Dakota (7400-7524 feet) and one In the very lower part of the Dakota (7596 7626 feet). In each test, measurements were done: 1) prior lo any treatment, 2) after a mini-frac test, and 3) following the main fracture treatment.
For both test sequences, the pre-lreaunent lest showed little noise. Tbe post mini-frac test in the lower zone showed seismic signals coming from two orientations, one at 50° and one at 68° azimuth. However, tbe main fracturing treatment in the lower zone showed signals predominantly
546
SPR 25466 YALE STRtfBHAR. AND EL RABAA $
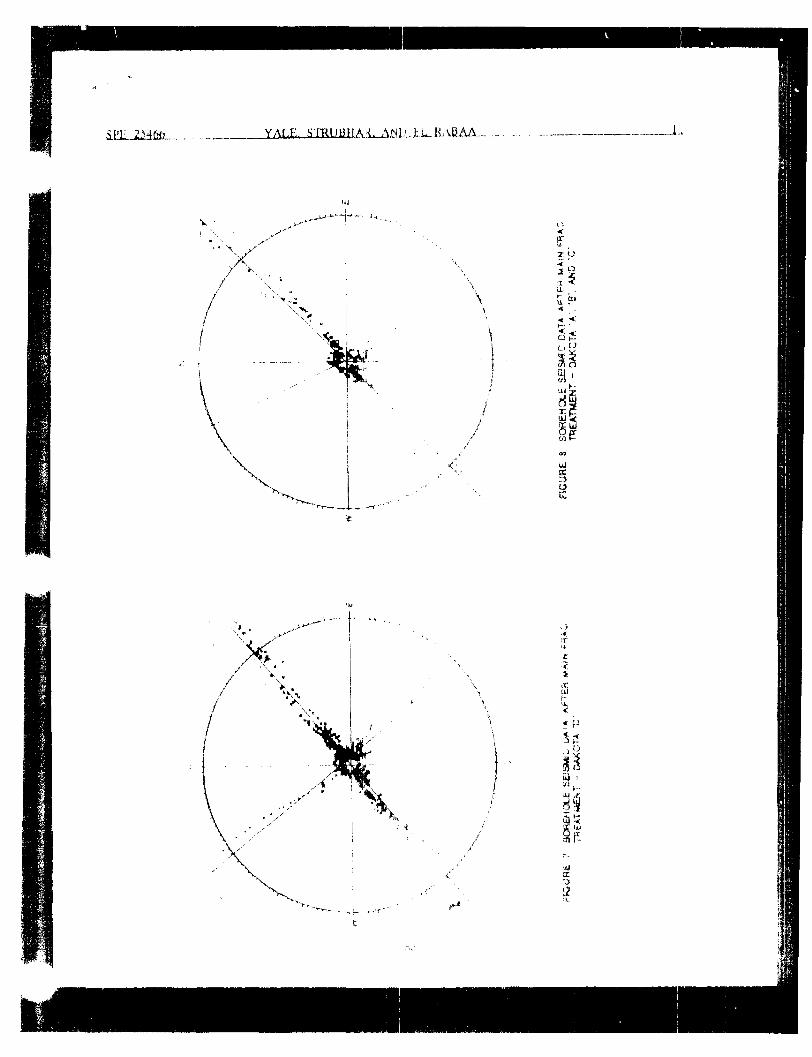
oriented in the 50* azimuth direction so that we interpret the main fracture to have a 50s azimuth (see Figure 7). A secondary feature with a 141° azimuth was also seen and was interpreted as due to microseismic signals rotated 90° by sbear wave splitting23. Since this feature is nearly 90° from (he predominant (rend, it supports tbe interpretation that tbe main fracture in tbe lower zone is at SO" azimuth. In the upper zone, pc«t-minifrac data suggested features at 45° and 135° azimuth but signals after tbe main frac indicated only tbe 45° azimuth fracture (see Figure 8). Both main frac results (Figures 7 and 8) show distinct trends with little scatter which give us a high degree of confidence in the results.
4.6 Borehole Televiewer Imaging of Induced and Natural Fractures Tbe BHTV was run only in well B. Logs were run over the interval exposed by coring after each microfrac test and then a final log was run over tbe entire cored interval (7406 • 7724 feet); A number of different types of features were mapped. Fractures were interpreted as natural if tbe dip was less than 85*. Coring or pressure induced fractures are those which lend to run nearly vertical for long lengths of (he borehole. Tbe microfrac induced fractures were not seen by tbe televiewer. Breakouts were also seen and the maximum horizontal stress direction was interpreted to be 90° from the center of the breakout Tbe rough nature of the breakouts in tbe televiewer togs, however, made it difficult to determine stress and thus fracture direction from tbem. We also found that tbe quality of tbe borehole televiewer logs decreased as further coring and microfrac tests were done. Consecutive coring and logging runs increased tbe roughness of Ihe hole and made it more difficult to pick out features from the logs.
5 DISCUSSION
This study has shown that hydraulic fractures will most probably propagate in northeast-southwest direction in the Dakota sandstone in northwest New Mexico. Natural fractures appear to have the same direction as the present day maximum horizontal stress. This suggests that the stress field has not rotated since the time (he natural fractures were formed. In addition, we see no change in stress direction with depth. Over the 300 feet of formation studied, fracture direction is constant
We find that by integrating (he results from a combination of hydraulic fracture direction techniques, we can accurately and confidently determine tbe direction of hydraulic fractures and utilize this information for mote effective reservoir management. Tbe data in Table 1 show that by utilizing these various methods, we can determine (be maximum in-situ stress direction and thus the hydraulic fracture direction accurately enough to discern a 10° difference in fracture direction between wells. Tbe study also suggests that in environments similar to that found in the study area, certain
stress/fracture direction techniques are more reliable than others.
We conclude that the shear acoustic anisotropy, borehole microseismic, and overcoring of microfrac methods are (be most reliable and accurate techniques. The strain recovery tests in this study were heavily biased by natural fractures/microfractures. Even after accounting for tbe rotation in apparent stress direction, tbe strain relax tion data were 10" to 15s further east than (he olher measurements. One possible explanation is that there was a paleo-stress imprint in the rocks that affected the strain relaxation data.
The borehole televiewer data also showed a bias (10-15° counterclockwise) as compared with the other measurements. Because tbe orientation of core fractures in die same well was similar to the other measurements, it is possible tbat a small error in tbe magnetometer orienation caused (he bias. Although tbe core fracture orientation data were similar to tbe other data, (heir use in fields where natural fractures have different trends from the present day maximum stress direction is a potential problem.
5.1 Costs and Reliabilities of Different Techniques We find that different techniques have significantly different cost/benefit and risk/benefit relationships. Tbe borehole seismic technique shows excellent data quality and accuracy, and the costs are moderate. However, since the technique works best utilizing data from (be main fracture treatment it is tbe one technique among those utilized which is not predictive. Tne overcoring of microfracs method has high accuracy and is tbe only technique which is close to giving tbe actual maximum horizontal stress r>'rection. However, it has a high risk since only a few microfrac tests can generally be performed and the microfrac induced fracture is not always recovered. The overcore of microfrac technique requires expensive microfrac tests to be conducted, but these tests also give important fracture gradient data and thus the cost/benefit ratio is lower.
The shear acoustic anisotropy technique probably has the best cost/benefit and risk/benefit relationships. The measurements are fairly simple, inexpensive, and laboratory based (as compared with the field based strain recovery tests). They do require oriented core which is an additional expense. However, because they arc simple and non-dcstruciive, the tests can be done on a large number of core samples to increase the statistical quality ofthe results.
The cost/benefit relationship for strain recovery, although higher than shear acoustic anisotropy or core fracture methods, is lower than borehole microseismic. It does have the problem, in some areas, of suggesting hydraulic fracture directions which arc 90" from the true direction4,7. It is still unclear from this study whether the 10-15° shift in the strain recovery data from the other data is due to the effects of tbe natural fractures or some other paleo-imprint on the rock.
547
fi. DETERMINATION OF HYDRAULIC FRACTURE DIRECTION i£E_25Jfifi
Although natural fractures may often not coincide with tbe hydraulic fracture direction, drilling or coring induced fractures (as seen in core fracture mapping and borehole televiewer logs) do trend well with the hydraulic fracture direction in this area. Tbe costfbenefit relationship of both the core fracture and borehole televiewer techniques is low to moderate but tbe risk/benefit relationship is high because coring or drilling induced fractures are not always seen, especially in large enough numbers to give a good statistical base.
53, Effect of regional tectonics and data integration on fracture direction results Examing tbe results of this study and other fracture direction studies2'13-17'18 show tbe effects of integration of data and regional tectonics on the quality of fracture direction results. Our analysis suggests that horizon tal stress contrast, local geologic structure and imprints due to paleo-tectonics impact the ability of various techniques to determine fracture direction.
Saltier8 and Teufel17-18 give overviews of much of tbe data collected for the three MWX wells in Colorado for the deusininaiion of hydraulic fracture direction. Like our study, tbe MWX project showed tbat an integration of several techniques over multiple wells allowed hydraulic fracture direction to be predicted accurately. As summarized by Saltier8, tbe MWX project utilized anelastic strain recovery, differential strain curve analysis, wellbore breakouts, core fracture mapping, and passive borehole microseismic to predict the direction of hydraulic fractures. The integration of data from different techniques in multiple wells shows no significant variation between tbe three closely spaced wells but a gradual rotation of tbe stress field from near east-west at 4500-5000 feet to southeast-northwest at 7000-7500 feet.
Ramos and Rathmell7, Lacy3, Laubach and Monson5 and Owen and Peterson6 also find that tbe integration of data from various techniques can overcome ambiguities or high degrees of scatter in any one technique. Bell and Babcock26, Klein and Bar27, and Yale et al. 1 1 find that utilization of one or two fracture direction techniques can be effective when utilized in a large number of wells in a given region.
Net all fracture direction studies have been as successful. Griffin2, Avasthi et. al.9, and Laubach ct. al. 1 2 all report a high degree of variability in apparent stress direction. Griffin2 finds that apparent stress direction is highly variable across the Kuparuk reservoir in Alaska. He suggests that this may be due to stress relief from the extensive faulting in the area. Laubach et. al. 1 2 suggest that the variability in apparent stress/fracture direction in western Wyoming is due to low horizontal stress contrast and the fact that tbe area sits on the boundary between two stress provinces1.
The idea that low horizontal stress contrast makes it more difficult to determine stress direction is supported by examining the regional tectonics in the areas covered by the more successful studies. Bell and Babcock's26, Sattler's8,
Teufel's 1 8' 1 9 and this paper's study all investigate tectonically active areas surrounding the Rocky Mountains and tbe Rio Grande Rift1. Klein and Bar's27 and Yale et al's11 studies are from the tectonically active North Sea.
Yale 1 0 showed tbat the magnitude of acoustic anisotropy roughly paralleled the degree of horizontal stress as gauged from the tectonic regime. He found tbat acoustic anisotropy on cores from tectonically relaxed areas was low (1% lo 1.5% acoustic anisotropy) as compared with tectonically active areas of high horizontal stress contrast (2.5% to 5% acoustic anisotropy). Yale1 0 and Yale and Sprunt14 find that the quality of acoustic anisotropy measurements is enhanced by higher anisotropics. Similarly, the quality of anelastic strain recovery measurements is enhanced by larger recovery strains. Blanton and Teufel19 and Teufel and Warpinski18 show that tbe magnitude of strain relief is directly related to the magnitude of the in-situ stress.
Laubacb et al. 1 2 suggests that low horizontal stress contrast may cause a higher degree of scatter and variability in the apparent stress direction by allowing heterogeneities and non-stress related anisotropics in the fonnation to influence tbe various types of measurement of stress direction. This suggests that not only stress regime but imprints on the rock from paleo-tectonics and/or rock fabric affect the ability to determine stress direction.
For example, GRI's SFE project in East Texas5 • 6
successfully determined stress direction, even though the horizontal stress contrast probably is not that large1. However, one difference between the GRI's East Texas and Western Wyoming projects is that the rocks of Travis Peak formation in East Texas were probably less influenced by paleo-stress and local structure than those of the Frontier formation of Western Wyoming. Laubach and Monson3
show that indicators of paleo-stress direction in the Travis Peak fonnation agree with the present day stress direction. By comparison, the complex paleo-tectonics of western Wyoming give rise to a host of "paleo-imprints" on the rocks which could influence fracture direction measurements in a low stress contrast environment.
In addition, local structure can also affect stress direction measurements. Griffin's2 study suggests that local faulting may have rotated the local stress pattern away from the regional trend accounting for the variability in stress direction across the field. Yale ct. al. 1 1 find that although stress direction was consistent across most of the southern North Sea field studied, a couple of wells show an apparent rotation of the local stress field due to local faulting. Aleksandrowski ct al. 1 3 show significant effects of tectonic structures on local stress fields.
548
In cases where the local structure may affect fracture direction measurements, it is important to determine whether tbe local structure has simply biased the measurements or whether the local structure has truly altered the local stress field direction. In Aleksandrowski et. al's13 study, the breakouts from any given well generally showed low scatter suggesting that local structure did rotate tbe local stress field direction.
6 CONCLUSIONS
• Tbe direction of maximum horizontal stress and therefore of bydraulically induced fractures is 41° azimuth in (he Dakota formation of northwest New Mexico.
• Tbe integration of data from several stress direction determination techniques is very helpful in increasing the reliability and accuracy of in-situ stress direction.
• Costs and risks associated with any given stress direction determination technique must be weighed when putting together a program to determine or predict hydraulic fracture direction.
• Horizontal stress contrast, paleo-imprints, and local structure can all affect the quality of fracture direction determination. Care must be taken in determining whether variability in apparent stress direction is due to low stress contrast and paleo-imprints or to a true variability in the direction of the local stress field.
7 ACKNOWLEDGMENTS
Wc would like to thank the management of Mobil Research and Development Corporation and Mobil Exploration and Producing - U.S. for permission to publish this paper. We would also like to thank Joe Jensen for his valuable assistance in coordinating the field aspects of this project, Mike Rodriguez for his help in the field and Ihe laboratory, and Steve Manzi and Louis Medlin for their help with the borehole televiewer measurements.
8 REFERENCES
1. Zoback. M. L. and Zoback, M. A. (1980) "State "f Stress in (he Coterminous United States", J. Geophys. Res., vol. 85, pp. 6113-6156.
2. Griffin, K. W. (1985) "Induced fracture orientation determination in the Kuparuk Reservoir". SPE 14261, presented at the 60th Annual Tech. Conf. of Soc, Pet. Eng., Las Vegas, September.
3. Lacy, L. L. (1987) "Comparison of Hydraulic Fracture Orientation Techniques", SPE Formation Evaluation, March 1987. pp. 66-76.
4. El Rabaa, A. W. and Meadows, D. L. (1986) "Laboratory and Held application of the strain relaxation method".
SPE 15072, presented at the 56th California Regional SPE Meeting, Oakland, California, March.
5. Laubach, S. E. and Monson, E. R. (1988) "Coring-induced fractures: Indicators of hydraulic fracture propagation in a naturally fractured reservoir", SPE 18164, presented at 63rd Annual Tech. Conf. of Soc. Pet. Eng., Houston, October.
6. Owen, L. B. and Peterson, R. E. (1988) "Reliability of anelastic strain recovery estimates for stress orientation in the Travis Peak Fonnation, Harrison County, Texas", SPE 18165, presented at 63rd Annual Tech. Conf. of Soc. Pet. Eng., Houston, October.
7. Ramos. G. G. and Rathmell, J. J. (1989) "Effects of mechanical anisotropy oi. core strain measurements for in-situ stress determination", presented al 3rd Annual Soc. Core Analysts Tech. Conf., San Antonio.
8. Saltier, A. R. (1990) "Comparison of in situ stress information from core and log analyses", presented at the 4th Annual. Soc. Core Analysts Tech, Conf., Houston.
9. Avasthi, J. M., Nolen-Hoeksema, R. C , and El Rabaa, A. W. M. (1991) "In-situ stress evaluation in the McElroy field, West Texas", SPE Formation Evaluation Jour., September, pp. 301-309.
10. Yale, D. P. (1989) "Laboratory sbear acoustic anisotropy measurements and (heir relationship (o fracture direction", presented at Soc. Expl. Geophys. Res. Symp. on Vector Wavefield Analysis, August, Snowbird, Utah.
11. Yale, D. P., Nieto, J. A., Rodriguez, J. M. R., and Moore, R. D. (1991) "In-situ Stress Direction from Shear Acoustic Anisotropy - A Case History from (he Southern North Sea", presented at 14th Annual European SPWLA Conference, London, England, December.
12. Laubach, S. E., Clift, S. J., Hill. R. E„ and Fix, J. (1992) "Stress directions in Cretaleous Frontier Formation, Green River Basin, Wyoming", in Wyoming Geological Association Forty-Third Field Conference Guidebook, ed. Mullen, Pioneer Printing, Cheyenne, pp. 75-86.
13. Aleksandrowski, P., Inderhaug, O. H., and Knapstad, B. (1992) "Tectonic structures and wellbore breakout orientation", in Proceedings of the 33rd U. S. Symposium on Rock Mechanics, ed. Tillcrson and Wawersik, Balkema, Rotterdam.
14. Yale, D. P. and Sprunt, E. S. (1989) "Prediction of Fracture Direction using Shear Acoustic Anisotropy", The Log Analyst, March-April 1989, pp.65-70.
15. Yale, D. P. (1987) "Method and Apparatus for Measuring the Mechanical Anisotropy of a Material", U.S. Patent #4,713,968.
16. Rasolofosan, P. N. J., and Zinzner, B. (1989) "EITcct of in-situ relaxation on velocity anisotropy of ultrasonic P and S waves in rock core samples", in Rock at Great Depth, ed. Maury and Fournointraux, Balkema, Rotterdam.
549
8 DETERMINATION OF HYDRAULIC FRACTURE DIRECTION SPE 25466
17. Teufel, L. W. (1983) "Deunrninauon of In-situ Stress from Anelastic Strain Recovery Measurements of Oriented Core", SPE 11649, presented at the SPE/DOE Joint Symposium on Low Permeability Gas Reservoirs, Denver.
18. Teufel, L. W. (1984) "Determination of the In-situ Stress from Anelastic Strain Recovery Measurements of Oriented Cores: Comparison to Hydraulic Fracture Stress Measurements in the Rollins Sandstone, Piceance Basin, Colorado", presented at 25tb U.S. Symp. on Rock Mecb., Evan ton, Illinois, June.
19. Blanton, T. L. and Teufel, L. W. (1983) "A Field Test of the Strain Recovery Method of Stress Determination in Devonian Shale", SPE 12304. presented at Eastern Regional SPE Meeting, Champion, Pennsylvania.
20. Daneshy, A. A., Slusner, G. L., Chisholm, P. T., and Magee, D. A. (1986) "In-situ Stress Measurements during Drilling", Jour. Pet. Tech., August 1986, pp.891-898.
21. Schuster, C. L. (1978) "Detection within tbe Wellbore of Seismic Signals created by Hydraulic Fracturing", SPE 7448, presented at 53rd Annual SPE Meeting, Houston.
22. Sorrels, G. G. and Mulcahy, C. C. (1986) "Advances in the Microseismic Method of Hydraulic Fracture Azimuth Estimation", SPE 15216, presented at the SPE Unconventional Gas Technology Symposium, Louisville, Kentucky.
23. Zemanek, J., Caldwell, R. L., Glenn, E. E., Holcomb, S. V.. Norton, L. J. and Straus, A. J. D. "The Borehole Televiewer - A New Logging Concept for Fracture Location and other Types of Borehole Inspection", Jour. Pel Tech., June 1969, pp.762-774.
24. Nelson, R. A., Lenor. L. C , and Ward, B. J. Jr. (1987) "Oriented Core: Its use, Error, and Uncertainty", Amer. Assoc. Petr. Geol. Bull., vol. 71, pp.357-367.
25. Crampin, S. (1984) "Effective Anisotropic Elastic Constants for Wave Propagation through Cracked Solids", Geophy. Jour. Royal Astr. Soc, vol 76, p. 135.
26. Bell, J. S. and Babcock, E. A. (1986) "The stress regime of the Western Canadian Basin and implications for hydrocarbon production", Bull. Can. Pet. Geol., vol. 34. pp. 364-378.
27. Klein, R. J. and Barr, M. V. (1986) "Regional state of stress in Western Europe", presented al Int. Symp. on Rock Stress and Rock Stress Measurement, Stockholm, pp. 33-44.
550
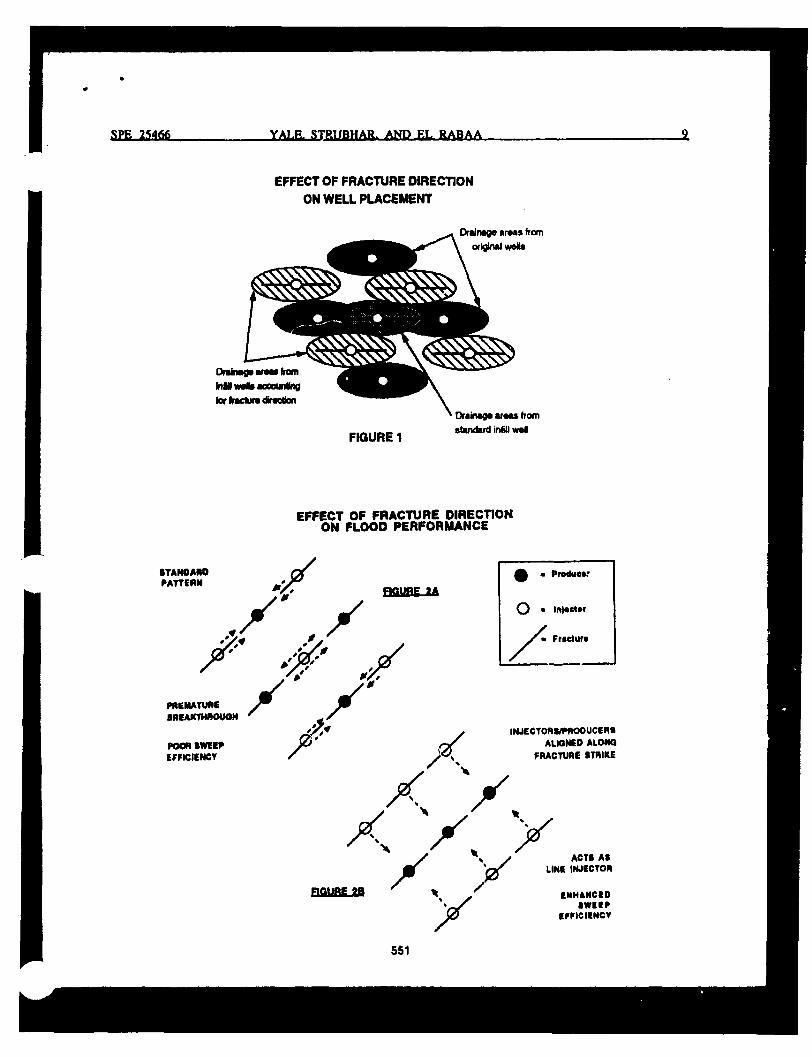
SPE 25466 YALE. STRWBHAR. AND E L RABAA 1
EFFECT OF FRACTURE DIRECTION ON WELL PLACEMENT
EFFECT OF FRACTURE DIRECTION ON FLOOD PERFORMANCE
STANDARD PATTERN
/ . /
> " # . /
SfiUB£_2A
PREMATURE BREAKTHROUGH
POOH SWEEP EFFICIENCY
• » Product,,1
o • ln|*ctor
/
^ Friclurt
X INJECTORS/PRODUCERS
ALIO NED ALONG FRACTURE STRIKE
V ACTS AS
LINE INJECTOR
ENHANCED SWEEP
EFFICIENCY
551
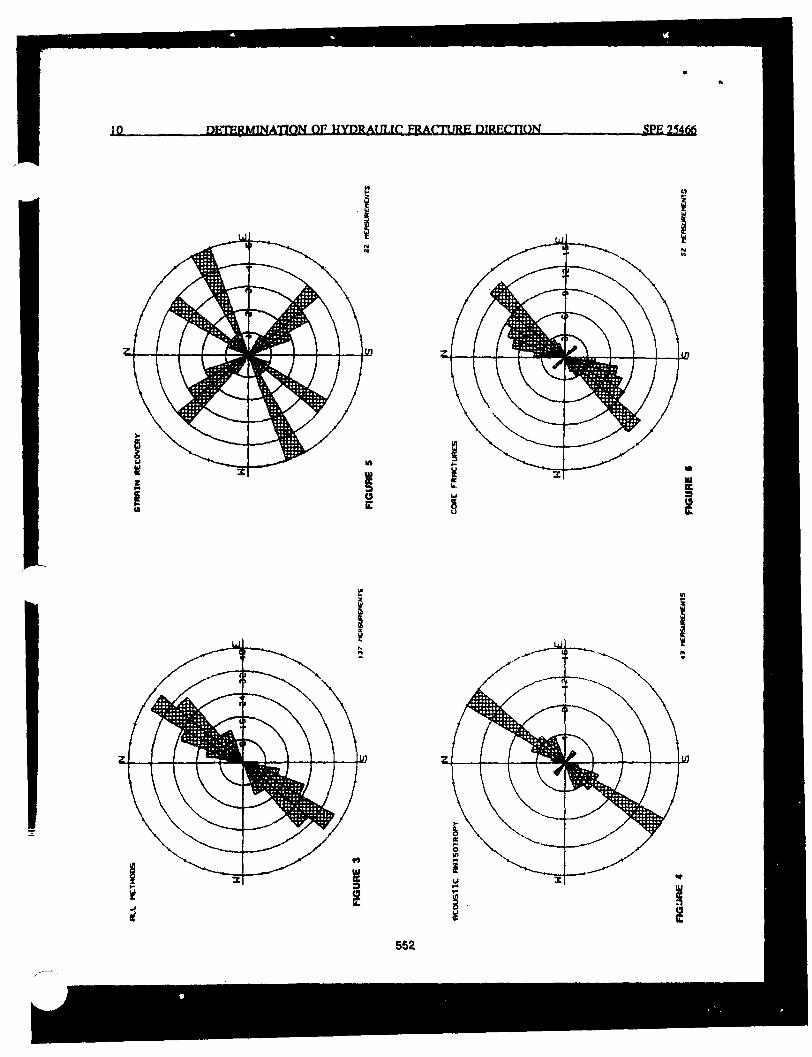
1SL DETERMINATION OF HYDRAULIC FRACTURE DIRECTION SPfi2?4fli
552