residential market activity - lstar.ca · residential market activity october 2018 prepared for the...
TRANSCRIPT

Residential Market Activity
October 2018
Prepared for the London & St. Thomas Association of REALTORS® by the Canadian Real Estate Association

London and St. ThomasResidential Market Activity
679
572
598 634
645 71
3
709 84
9
810 90
60
200
400
600
800
1,000
2009
2010
2011
2012
2013
2014
2015
2016
2017
2018
Sales activity (October only)
1,09
0
1,14
5
1,16
3
1,27
9
1,24
4
1,31
9
1,17
6
1,01
7
848
1,17
1
0200400600800
1,0001,2001,400
2009
2010
2011
2012
2013
2014
2015
2016
2017
2018
New listings (October only)
2,86
6 3,38
5
3,63
5
3,44
5
3,49
0
3,47
0
3,17
4
2,12
7
1,50
8
1,55
3
0500
1,0001,5002,0002,5003,0003,5004,000
2009
2010
2011
2012
2013
2014
2015
2016
2017
2018
Active listings (October only)
4.2
5.9 6.1
5.4
5.4
4.9
4.5
2.5
1.9
1.7
0.01.02.03.04.05.06.07.0
2009
2010
2011
2012
2013
2014
2015
2016
2017
2018
Months of inventory (October only)
$0
$100,000
$200,000
$300,000
$400,000
$500,000
Jan
2009
Jan
2010
Jan
2011
Jan
2012
Jan
2013
Jan
2014
Jan
2015
Jan
2016
Jan
2017
Jan
2018
Average Price
Source: Canadian MLS® Systems, CREA

London and St. ThomasResidential Market Activity
7,13
8
7,22
2
7,08
1
7,27
3
7,06
5
7,60
7
8,36
2
9,19
4
10,1
71
8,62
30
2,000
4,000
6,000
8,000
10,000
12,000
2009
2010
2011
2012
2013
2014
2015
2016
2017
2018
Sales activity (October YTD)
12,5
63
13,7
52
14,3
89
14,1
39
14,1
90
14,6
36
14,7
00
13,3
48
13,1
81
11,6
92
02,0004,0006,0008,000
10,00012,00014,00016,000
2009
2010
2011
2012
2013
2014
2015
2016
2017
2018
New listings (October YTD)
3,25
3
3,32
1
3,66
8
3,55
2
3,51
8
3,57
0
3,44
8
2,61
8
1,69
1
1,48
5
0500
1,0001,5002,0002,5003,0003,5004,000
2009
2010
2011
2012
2013
2014
2015
2016
2017
2018
Active listings (October YTD)
4.6
4.6 5.
2
4.9 5.0
4.7
4.1
2.8
1.7 1.7
0.0
1.0
2.0
3.0
4.0
5.0
6.0
2009
2010
2011
2012
2013
2014
2015
2016
2017
2018
Months of inventory (October YTD)
Source: Canadian MLS® Systems, CREA

London and St. Thomas
1 year ago 2 years ago
3 years ago
5 years ago
7 years ago
10 years ago
October 2017
October 2016
October 2015
October 2013
October 2011
October 2008
Sales Activity 906 11.9 6.7 27.8 40.5 51.5 52.3Dollar Volume $343,966,446 30.9 43.2 82.8 121.5 143.6 177.9New Listings 1,171 38.1 15.1 -0.4 -5.9 0.7 -16.8Active Listings 1,553 3.0 -27.0 -51.1 -55.5 -57.3 -57.3Sales to New Listings Ratio1 77.4 95.5 83.5 60.3 51.8 51.4 42.3Months of Inventory2 1.7 1.9 2.5 4.5 5.4 6.1 6.1Average Price $379,654 17.1 34.2 43.0 57.7 60.8 82.5
1 year ago 2 years ago
3 years ago
5 years ago
7 years ago
10 years ago
October 2017 YTD
October 2016 YTD
October 2015 YTD
October 2013 YTD
October 2011 YTD
October 2008 YTD
Sales Activity 8,623 -15.2 -6.2 3.1 22.1 21.8 10.6Dollar Volume $3,172,774,595 -5.4 24.0 43.5 82.1 91.3 90.9New Listings 11,692 -11.3 -12.4 -20.5 -17.6 -18.7 -20.5Active Listings3 1,485 -12.2 -43.3 -56.9 -57.8 -59.5 -55.8Sales to New Listings Ratio4 73.8 77.2 68.9 56.9 49.8 49.2 53.0Months of Inventory5 1.7 1.7 2.8 4.1 5.0 5.2 4.3Average Price $367,943 11.6 32.2 39.2 49.2 57.1 72.6
1 Sales / new listings * 1002 Active listings at month end / monthly sales3 The year-to-date active listings figure is a monthly average of the number of homes on the market at the end of each month so far this year4 Sum of sales from January to current month / sum of new listings from January to current month5 Average active listings from January to current month / average sales from January to current month6 Sales to new listings ratio and months of inventory shown as levels; all others calculated as percentage changes
Residential Market Activity
Actual October 2018
Compared to6
Year-to-date October 2018
Compared to6
Source: Canadian MLS® Systems, CREA

Elgin CountyResidential Market Activity
59
31
48 49
37
54
43
49
59
540
10203040506070
2009
2010
2011
2012
2013
2014
2015
2016
2017
2018
Sales activity (October only)
100
80
102 11
1
100 12
0
88 81
59
68
020406080
100120140
2009
2010
2011
2012
2013
2014
2015
2016
2017
2018
New listings (October only)
409
390 41
7
405
418
429
373
228
149
133
0
100
200
300
400
500
2009
2010
2011
2012
2013
2014
2015
2016
2017
2018
Active listings (October only)
6.9
12.6
8.7
8.3
11.3
7.9 8.
7
4.7
2.5
2.5
0.02.04.06.08.0
10.012.014.0
2009
2010
2011
2012
2013
2014
2015
2016
2017
2018
Months of inventory (October only)
$0$50,000
$100,000$150,000$200,000$250,000$300,000$350,000$400,000
Jan
2009
Jan
2010
Jan
2011
Jan
2012
Jan
2013
Jan
2014
Jan
2015
Jan
2016
Jan
2017
Jan
2018
Average Price
Source: Canadian MLS® Systems, CREA

Elgin CountyResidential Market Activity
485
470
455 482
441 50
0 552
730
659
529
0100200300400500600700800
2009
2010
2011
2012
2013
2014
2015
2016
2017
2018
Sales activity (October YTD)
1,19
1
1,15
0
1,11
2
1,11
3
1,18
6
1,20
6
1,07
2
1,00
9
875
721
0200400600800
1,0001,2001,400
2009
2010
2011
2012
2013
2014
2015
2016
2017
2018
New listings (October YTD)
468
441
431
422 442
430
392
284
176
130
0
100
200
300
400
500
2009
2010
2011
2012
2013
2014
2015
2016
2017
2018
Active listings (October YTD)
9.6
9.4 9.5
8.8 10
.0
8.6
7.1
3.9
2.7
2.5
0.0
2.0
4.0
6.0
8.0
10.0
12.0
2009
2010
2011
2012
2013
2014
2015
2016
2017
2018
Months of inventory (October YTD)
Source: Canadian MLS® Systems, CREA

Elgin County
1 year ago 2 years ago
3 years ago
5 years ago
7 years ago
10 years ago
October 2017
October 2016
October 2015
October 2013
October 2011
October 2008
Sales Activity 54 -8.5 10.2 25.6 45.9 12.5 35.0Dollar Volume $19,589,391 13.6 47.1 132.7 174.2 97.0 215.1New Listings 68 15.3 -16.0 -22.7 -32.0 -33.3 -43.8Active Listings 133 -10.7 -41.7 -64.3 -68.2 -68.1 -71.4Sales to New Listings Ratio1 79.4 100.0 60.5 48.9 37.0 47.1 33.1Months of Inventory2 2.5 2.5 4.7 8.7 11.3 8.7 11.6Average Price $362,767 24.1 33.5 85.3 87.9 75.1 133.4
1 year ago 2 years ago
3 years ago
5 years ago
7 years ago
10 years ago
October 2017 YTD
October 2016 YTD
October 2015 YTD
October 2013 YTD
October 2011 YTD
October 2008 YTD
Sales Activity 529 -19.7 -27.5 -4.2 20.0 16.3 5.6Dollar Volume $171,413,772 -8.1 -4.7 32.4 74.8 83.0 86.2New Listings 721 -17.6 -28.5 -32.7 -39.2 -35.2 -43.4Active Listings3 130 -26.1 -54.2 -66.8 -70.6 -69.8 -68.5Sales to New Listings Ratio4 73.4 75.3 72.3 51.5 37.2 40.9 39.3Months of Inventory5 2.5 2.7 3.9 7.1 10.0 9.5 8.3Average Price $324,034 14.5 31.6 38.2 45.7 57.4 76.3
1 Sales / new listings * 1002 Active listings at month end / monthly sales3 The year-to-date active listings figure is a monthly average of the number of homes on the market at the end of each month so far this year4 Sum of sales from January to current month / sum of new listings from January to current month5 Average active listings from January to current month / average sales from January to current month6 Sales to new listings ratio and months of inventory shown as levels; all others calculated as percentage changes
Residential Market Activity
Actual October 2018
Compared to6
Year-to-date October 2018
Compared to6
Source: Canadian MLS® Systems, CREA

LondonResidential Market Activity
454
393
396 43
4
431 48
9
477 55
7
555 61
50
100200300400500600700
2009
2010
2011
2012
2013
2014
2015
2016
2017
2018
Sales activity (October only)
718 79
1
762 84
9
799 85
8
758
654
558
794
0
200
400
600
800
1,000
2009
2010
2011
2012
2013
2014
2015
2016
2017
2018
New listings (October only)
1,45
0 1,93
0
2,08
1
1,87
6
1,80
3
1,81
0
1,61
0
1,11
7
805
854
0
500
1,000
1,500
2,000
2,500
2009
2010
2011
2012
2013
2014
2015
2016
2017
2018
Active listings (October only)
3.2
4.9 5.
3
4.3
4.2
3.7
3.4
2.0
1.5
1.4
0.0
1.0
2.0
3.0
4.0
5.0
6.0
2009
2010
2011
2012
2013
2014
2015
2016
2017
2018
Months of inventory (October only)
$0
$100,000
$200,000
$300,000
$400,000
$500,000
Jan
2009
Jan
2010
Jan
2011
Jan
2012
Jan
2013
Jan
2014
Jan
2015
Jan
2016
Jan
2017
Jan
2018
Average Price
Source: Canadian MLS® Systems, CREA

LondonResidential Market Activity
5,02
2
5,01
5
4,91
8
5,06
5
4,87
1
5,18
7
5,67
3
6,09
1 6,94
9
5,81
10
1,0002,0003,0004,0005,0006,0007,0008,000
2009
2010
2011
2012
2013
2014
2015
2016
2017
2018
Sales activity (October YTD)
8,13
8
9,16
1
9,59
8
9,39
6
9,15
3
9,54
1
9,57
2
8,78
9
8,90
6
7,82
5
0
2,000
4,000
6,000
8,000
10,000
12,000
2009
2010
2011
2012
2013
2014
2015
2016
2017
2018
New listings (October YTD)
1,64
5
1,78
7
2,03
3
1,93
6
1,82
6
1,86
5
1,81
0
1,39
8
897
827
0
500
1,000
1,500
2,000
2,500
2009
2010
2011
2012
2013
2014
2015
2016
2017
2018
Active listings (October YTD)
3.3 3.
6 4.1
3.8
3.7
3.6
3.2
2.3
1.3 1.4
0.0
1.0
2.0
3.0
4.0
5.0
2009
2010
2011
2012
2013
2014
2015
2016
2017
2018
Months of inventory (October YTD)
Source: Canadian MLS® Systems, CREA

London
1 year ago 2 years ago
3 years ago
5 years ago
7 years ago
10 years ago
October 2017
October 2016
October 2015
October 2013
October 2011
October 2008
Sales Activity 615 10.8 10.4 28.9 42.7 55.3 48.6Dollar Volume $236,020,932 30.2 49.6 88.1 122.2 140.1 169.3New Listings 794 42.3 21.4 4.7 -0.6 4.2 -11.0Active Listings 854 6.1 -23.5 -47.0 -52.6 -59.0 -56.4Sales to New Listings Ratio1 77.5 99.5 85.2 62.9 53.9 52.0 46.4Months of Inventory2 1.4 1.5 2.0 3.4 4.2 5.3 4.7Average Price $383,774 17.5 35.5 45.9 55.7 54.6 81.3
1 year ago 2 years ago
3 years ago
5 years ago
7 years ago
10 years ago
October 2017 YTD
October 2016 YTD
October 2015 YTD
October 2013 YTD
October 2011 YTD
October 2008 YTD
Sales Activity 5,811 -16.4 -4.6 2.4 19.3 18.2 4.4Dollar Volume $2,180,341,021 -7.0 25.8 43.8 80.5 84.7 83.4New Listings 7,825 -12.1 -11.0 -18.3 -14.5 -18.5 -19.9Active Listings3 827 -7.8 -40.8 -54.3 -54.7 -59.3 -55.6Sales to New Listings Ratio4 74.3 78.0 69.3 59.3 53.2 51.2 57.0Months of Inventory5 1.4 1.3 2.3 3.2 3.7 4.1 3.4Average Price $375,209 11.2 31.9 40.4 51.3 56.3 75.6
1 Sales / new listings * 1002 Active listings at month end / monthly sales3 The year-to-date active listings figure is a monthly average of the number of homes on the market at the end of each month so far this year4 Sum of sales from January to current month / sum of new listings from January to current month5 Average active listings from January to current month / average sales from January to current month6 Sales to new listings ratio and months of inventory shown as levels; all others calculated as percentage changes
Residential Market Activity
Actual October 2018
Compared to6
Year-to-date October 2018
Compared to6
Source: Canadian MLS® Systems, CREA

London EastResidential Market Activity
132
111 12
3
125
127 14
3
144 17
2 182 19
70
50
100
150
200
250
2009
2010
2011
2012
2013
2014
2015
2016
2017
2018
Sales activity (October only)
222
223
225 25
6
247
253
232
199
168
242
0
50
100
150
200
250
300
2009
2010
2011
2012
2013
2014
2015
2016
2017
2018
New listings (October only)
438 52
8 584
551
497 523
447
371
268
215
0100200300400500600700
2009
2010
2011
2012
2013
2014
2015
2016
2017
2018
Active listings (October only)
3.3
4.8
4.7
4.4
3.9
3.7
3.1
2.2
1.5
1.1
0.0
1.0
2.0
3.0
4.0
5.0
2009
2010
2011
2012
2013
2014
2015
2016
2017
2018
Months of inventory (October only)
$0$50,000
$100,000$150,000$200,000$250,000$300,000$350,000
Jan
2009
Jan
2010
Jan
2011
Jan
2012
Jan
2013
Jan
2014
Jan
2015
Jan
2016
Jan
2017
Jan
2018
Average Price
Source: Canadian MLS® Systems, CREA

London EastResidential Market Activity
1,59
7
1,51
8
1,51
6
1,50
9
1,48
2
1,59
0
1,63
2
1,72
0 2,11
0
1,79
30
500
1,000
1,500
2,000
2,500
2009
2010
2011
2012
2013
2014
2015
2016
2017
2018
Sales activity (October YTD)
2,44
2
2,69
4
2,80
2
2,75
4
2,65
2
2,84
1
2,65
4
2,53
1
2,71
9
2,29
8
0
500
1,000
1,500
2,000
2,500
3,000
2009
2010
2011
2012
2013
2014
2015
2016
2017
2018
New listings (October YTD)
458 49
8 572
552
508 54
5
500
395
302
215
0100200300400500600700
2009
2010
2011
2012
2013
2014
2015
2016
2017
2018
Active listings (October YTD)
2.9 3.
3 3.8
3.7
3.4
3.4
3.1
2.3
1.4
1.2
0.00.51.01.52.02.53.03.54.0
2009
2010
2011
2012
2013
2014
2015
2016
2017
2018
Months of inventory (October YTD)
Source: Canadian MLS® Systems, CREA

London East
1 year ago 2 years ago
3 years ago
5 years ago
7 years ago
10 years ago
October 2017
October 2016
October 2015
October 2013
October 2011
October 2008
Sales Activity 197 8.2 14.5 36.8 55.1 60.2 32.2Dollar Volume $61,454,943 35.8 65.6 110.5 152.4 144.4 128.2New Listings 242 44.0 21.6 4.3 -2.0 7.6 -8.7Active Listings 215 -19.8 -42.0 -51.9 -56.7 -63.2 -60.0Sales to New Listings Ratio1 81.4 108.3 86.4 62.1 51.4 54.7 56.2Months of Inventory2 1.1 1.5 2.2 3.1 3.9 4.7 3.6Average Price $311,954 25.5 44.6 53.9 62.7 52.6 72.6
1 year ago 2 years ago
3 years ago
5 years ago
7 years ago
10 years ago
October 2017 YTD
October 2016 YTD
October 2015 YTD
October 2013 YTD
October 2011 YTD
October 2008 YTD
Sales Activity 1,793 -15.0 4.2 9.9 21.0 18.3 -1.0Dollar Volume $530,415,966 -2.6 40.2 51.4 80.5 74.4 62.9New Listings 2,298 -15.5 -9.2 -13.4 -13.3 -18.0 -22.7Active Listings3 215 -28.8 -45.6 -57.0 -57.7 -62.4 -60.7Sales to New Listings Ratio4 78.0 77.6 68.0 61.5 55.9 54.1 61.0Months of Inventory5 1.2 1.4 2.3 3.1 3.4 3.8 3.0Average Price $295,826 14.7 34.5 37.9 49.2 47.5 64.5
1 Sales / new listings * 1002 Active listings at month end / monthly sales3 The year-to-date active listings figure is a monthly average of the number of homes on the market at the end of each month so far this year4 Sum of sales from January to current month / sum of new listings from January to current month5 Average active listings from January to current month / average sales from January to current month6 Sales to new listings ratio and months of inventory shown as levels; all others calculated as percentage changes
Residential Market Activity
Actual October 2018
Compared to6
Year-to-date October 2018
Compared to6
Source: Canadian MLS® Systems, CREA

London NorthResidential Market Activity
128
128
114 120 128 15
2 159 167 175
177
0
50
100
150
200
2009
2010
2011
2012
2013
2014
2015
2016
2017
2018
Sales activity (October only)
182
236
225 26
7
248 27
5
254
217
174
246
0
50
100
150
200
250
300
2009
2010
2011
2012
2013
2014
2015
2016
2017
2018
New listings (October only)
384
614 64
8
580 61
1
579
576
326
204 30
5
0100200300400500600700
2009
2010
2011
2012
2013
2014
2015
2016
2017
2018
Active listings (October only)
3.0
4.8
5.7
4.8
4.8
3.8
3.6
2.0
1.2 1.
7
0.0
1.0
2.0
3.0
4.0
5.0
6.0
2009
2010
2011
2012
2013
2014
2015
2016
2017
2018
Months of inventory (October only)
$0$100,000$200,000$300,000$400,000$500,000$600,000
Jan
2009
Jan
2010
Jan
2011
Jan
2012
Jan
2013
Jan
2014
Jan
2015
Jan
2016
Jan
2017
Jan
2018
Average Price
Source: Canadian MLS® Systems, CREA

London NorthResidential Market Activity
1,48
2
1,51
9
1,52
7
1,63
5
1,56
1
1,62
4
1,84
4 2,08
9
2,23
2
1,81
40
500
1,000
1,500
2,000
2,500
2009
2010
2011
2012
2013
2014
2015
2016
2017
2018
Sales activity (October YTD)
2,41
0 2,85
2
3,03
4
3,03
2
2,99
1
3,01
5
3,26
8
2,98
6
2,83
6
2,59
9
0500
1,0001,5002,0002,5003,0003,500
2009
2010
2011
2012
2013
2014
2015
2016
2017
2018
New listings (October YTD)
477 55
8 633
621
623
620
637
499
248 28
4
0100200300400500600700
2009
2010
2011
2012
2013
2014
2015
2016
2017
2018
Active listings (October YTD)
3.2 3.
7 4.1
3.8 4.0
3.8
3.5
2.4
1.1 1.
6
0.0
1.0
2.0
3.0
4.0
5.0
2009
2010
2011
2012
2013
2014
2015
2016
2017
2018
Months of inventory (October YTD)
Source: Canadian MLS® Systems, CREA

London North
1 year ago 2 years ago
3 years ago
5 years ago
7 years ago
10 years ago
October 2017
October 2016
October 2015
October 2013
October 2011
October 2008
Sales Activity 177 1.1 6.0 11.3 38.3 55.3 70.2Dollar Volume $79,125,449 12.0 28.6 54.2 101.9 134.4 186.3New Listings 246 41.4 13.4 -3.1 -0.8 9.3 0.4Active Listings 305 49.5 -6.4 -47.0 -50.1 -52.9 -43.9Sales to New Listings Ratio1 72.0 100.6 77.0 62.6 51.6 50.7 42.4Months of Inventory2 1.7 1.2 2.0 3.6 4.8 5.7 5.2Average Price $447,036 10.7 21.3 38.5 46.0 50.9 68.2
1 year ago 2 years ago
3 years ago
5 years ago
7 years ago
10 years ago
October 2017 YTD
October 2016 YTD
October 2015 YTD
October 2013 YTD
October 2011 YTD
October 2008 YTD
Sales Activity 1,814 -18.7 -13.2 -1.6 16.2 18.8 14.2Dollar Volume $822,966,078 -10.2 14.6 41.4 78.0 91.9 103.8New Listings 2,599 -8.4 -13.0 -20.5 -13.1 -14.3 -8.0Active Listings3 284 14.5 -43.1 -55.4 -54.4 -55.1 -47.4Sales to New Listings Ratio4 69.8 78.7 70.0 56.4 52.2 50.3 56.3Months of Inventory5 1.6 1.1 2.4 3.5 4.0 4.1 3.4Average Price $453,675 10.5 32.0 43.7 53.2 61.5 78.5
1 Sales / new listings * 1002 Active listings at month end / monthly sales3 The year-to-date active listings figure is a monthly average of the number of homes on the market at the end of each month so far this year4 Sum of sales from January to current month / sum of new listings from January to current month5 Average active listings from January to current month / average sales from January to current month6 Sales to new listings ratio and months of inventory shown as levels; all others calculated as percentage changes
Residential Market Activity
Actual October 2018
Compared to6
Year-to-date October 2018
Compared to6
Source: Canadian MLS® Systems, CREA

London SouthResidential Market Activity
194
154
159 18
9
176 19
4
174 21
8
198 24
10
50
100
150
200
250
300
2009
2010
2011
2012
2013
2014
2015
2016
2017
2018
Sales activity (October only)
314 33
2
312 326
304 33
0
272
238
216
306
050
100150200250300350
2009
2010
2011
2012
2013
2014
2015
2016
2017
2018
New listings (October only)
628
788 84
9
745
695
708
587
420
333
334
0
200
400
600
800
1,000
2009
2010
2011
2012
2013
2014
2015
2016
2017
2018
Active listings (October only)
3.2
5.1 5.3
3.9
3.9
3.6
3.4
1.9
1.7
1.4
0.0
1.0
2.0
3.0
4.0
5.0
6.0
2009
2010
2011
2012
2013
2014
2015
2016
2017
2018
Months of inventory (October only)
$0
$100,000
$200,000
$300,000
$400,000
$500,000
Jan
2009
Jan
2010
Jan
2011
Jan
2012
Jan
2013
Jan
2014
Jan
2015
Jan
2016
Jan
2017
Jan
2018
Average Price
Source: Canadian MLS® Systems, CREA

London SouthResidential Market Activity
1,94
3
1,97
8
1,87
5
1,92
1
1,82
8
1,97
3
2,19
7
2,28
2 2,60
7
2,20
40
500
1,000
1,500
2,000
2,500
3,000
2009
2010
2011
2012
2013
2014
2015
2016
2017
2018
Sales activity (October YTD)
3,28
6
3,61
5
3,76
2
3,61
0
3,51
0
3,68
5
3,65
0
3,27
2
3,35
1
2,92
8
0500
1,0001,5002,0002,5003,0003,5004,000
2009
2010
2011
2012
2013
2014
2015
2016
2017
2018
New listings (October YTD)
710
732 82
8
763
695
700
674
505
347
328
0
200
400
600
800
1,000
2009
2010
2011
2012
2013
2014
2015
2016
2017
2018
Active listings (October YTD)
3.7 3.7
4.4
4.0
3.8
3.5
3.1
2.2
1.3 1.5
0.0
1.0
2.0
3.0
4.0
5.0
2009
2010
2011
2012
2013
2014
2015
2016
2017
2018
Months of inventory (October YTD)
Source: Canadian MLS® Systems, CREA

London South
1 year ago 2 years ago
3 years ago
5 years ago
7 years ago
10 years ago
October 2017
October 2016
October 2015
October 2013
October 2011
October 2008
Sales Activity 241 21.7 10.6 38.5 36.9 51.6 49.7Dollar Volume $95,440,540 45.9 61.3 112.3 123.7 142.2 188.6New Listings 306 41.7 28.6 12.5 0.7 -1.9 -19.9Active Listings 334 0.3 -20.5 -43.1 -51.9 -60.7 -61.8Sales to New Listings Ratio1 78.8 91.7 91.6 64.0 57.9 51.0 42.1Months of Inventory2 1.4 1.7 1.9 3.4 3.9 5.3 5.4Average Price $396,019 19.9 45.9 53.3 63.4 59.8 92.8
1 year ago 2 years ago
3 years ago
5 years ago
7 years ago
10 years ago
October 2017 YTD
October 2016 YTD
October 2015 YTD
October 2013 YTD
October 2011 YTD
October 2008 YTD
Sales Activity 2,204 -15.5 -3.4 0.3 20.6 17.5 1.8Dollar Volume $826,958,977 -6.5 29.9 41.6 83.0 84.8 80.1New Listings 2,928 -12.6 -10.5 -19.8 -16.6 -22.2 -26.3Active Listings3 328 -5.5 -35.0 -51.3 -52.8 -60.4 -57.8Sales to New Listings Ratio4 75.3 77.8 69.7 60.2 52.1 49.8 54.5Months of Inventory5 1.5 1.3 2.2 3.1 3.8 4.4 3.6Average Price $375,208 10.6 34.5 41.2 51.8 57.2 76.9
1 Sales / new listings * 1002 Active listings at month end / monthly sales3 The year-to-date active listings figure is a monthly average of the number of homes on the market at the end of each month so far this year4 Sum of sales from January to current month / sum of new listings from January to current month5 Average active listings from January to current month / average sales from January to current month6 Sales to new listings ratio and months of inventory shown as levels; all others calculated as percentage changes
Residential Market Activity
Actual October 2018
Compared to6
Year-to-date October 2018
Compared to6
Source: Canadian MLS® Systems, CREA

Middlesex CountyResidential Market Activity
45
35
45 45
58
51 53
72
58 590
1020304050607080
2009
2010
2011
2012
2013
2014
2015
2016
2017
2018
Sales activity (October only)
101
76
97
127
126 14
7
122
85 77 84
020406080
100120140160
2009
2010
2011
2012
2013
2014
2015
2016
2017
2018
New listings (October only)
345
314 34
2 358 39
9
405
388
232
207
193
0
100
200
300
400
500
2009
2010
2011
2012
2013
2014
2015
2016
2017
2018
Active listings (October only)
7.7 9.
0
7.6 8.0
6.9 7.
9
7.3
3.2 3.6
3.3
0.0
2.0
4.0
6.0
8.0
10.0
2009
2010
2011
2012
2013
2014
2015
2016
2017
2018
Months of inventory (October only)
$0$100,000$200,000$300,000$400,000$500,000$600,000
Jan
2009
Jan
2010
Jan
2011
Jan
2012
Jan
2013
Jan
2014
Jan
2015
Jan
2016
Jan
2017
Jan
2018
Average Price
Source: Canadian MLS® Systems, CREA

Middlesex CountyResidential Market Activity
446 49
1
458 49
4 517 57
8 616 67
0 728
637
0100200300400500600700800
2009
2010
2011
2012
2013
2014
2015
2016
2017
2018
Sales activity (October YTD)
1,04
0
1,05
4
1,12
5
1,16
4 1,34
6
1,36
5
1,40
1
1,17
1
1,12
9
970
0200400600800
1,0001,2001,4001,600
2009
2010
2011
2012
2013
2014
2015
2016
2017
2018
New listings (October YTD)
349
317
327 35
0 403
415
389
298
206
185
0
100
200
300
400
500
2009
2010
2011
2012
2013
2014
2015
2016
2017
2018
Active listings (October YTD)
7.8
6.5 7.
1
7.1 7.
8
7.2
6.3
4.4
2.8 2.9
0.0
2.0
4.0
6.0
8.0
10.0
2009
2010
2011
2012
2013
2014
2015
2016
2017
2018
Months of inventory (October YTD)
Source: Canadian MLS® Systems, CREA

Middlesex County
1 year ago 2 years ago
3 years ago
5 years ago
7 years ago
10 years ago
October 2017
October 2016
October 2015
October 2013
October 2011
October 2008
Sales Activity 59 1.7 -18.1 11.3 1.7 31.1 9.3Dollar Volume $27,279,300 16.6 13.3 67.4 70.4 101.7 104.3New Listings 84 9.1 -1.2 -31.1 -33.3 -13.4 -25.7Active Listings 193 -6.8 -16.8 -50.3 -51.6 -43.6 -42.0Sales to New Listings Ratio1 70.2 75.3 84.7 43.4 46.0 46.4 47.8Months of Inventory2 3.3 3.6 3.2 7.3 6.9 7.6 6.2Average Price $462,361 14.6 38.3 50.4 67.5 53.9 87.0
1 year ago 2 years ago
3 years ago
5 years ago
7 years ago
10 years ago
October 2017 YTD
October 2016 YTD
October 2015 YTD
October 2013 YTD
October 2011 YTD
October 2008 YTD
Sales Activity 637 -12.5 -4.9 3.4 23.2 39.1 20.4Dollar Volume $289,044,034 0.5 28.0 45.4 87.5 119.1 108.2New Listings 970 -14.1 -17.2 -30.8 -27.9 -13.8 -18.4Active Listings3 185 -10.2 -37.9 -52.4 -54.1 -43.4 -44.1Sales to New Listings Ratio4 65.7 64.5 57.2 44.0 38.4 40.7 44.5Months of Inventory5 2.9 2.8 4.4 6.3 7.8 7.1 6.3Average Price $453,758 14.9 34.7 40.6 52.2 57.5 72.9
1 Sales / new listings * 1002 Active listings at month end / monthly sales3 The year-to-date active listings figure is a monthly average of the number of homes on the market at the end of each month so far this year4 Sum of sales from January to current month / sum of new listings from January to current month5 Average active listings from January to current month / average sales from January to current month6 Sales to new listings ratio and months of inventory shown as levels; all others calculated as percentage changes
Residential Market Activity
Actual October 2018
Compared to6
Year-to-date October 2018
Compared to6
Source: Canadian MLS® Systems, CREA
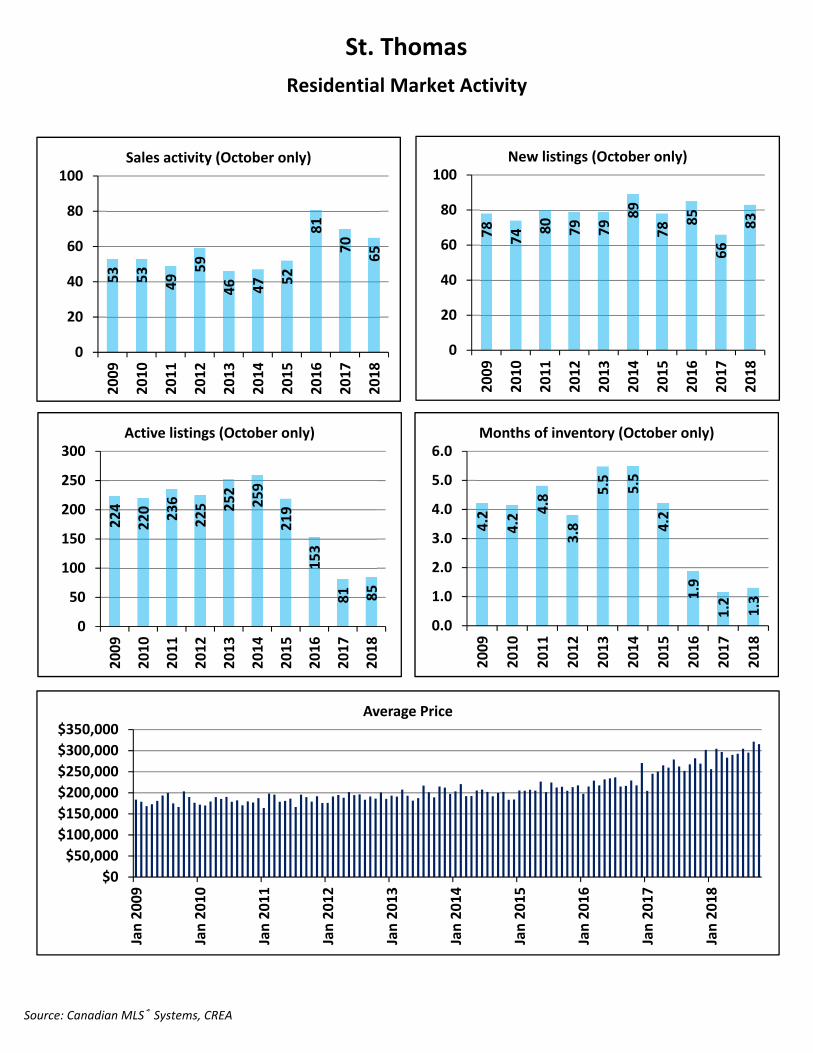
St. ThomasResidential Market Activity
53 53 49
59
46 47 52
81
70 650
20
40
60
80
100
2009
2010
2011
2012
2013
2014
2015
2016
2017
2018
Sales activity (October only)
78 74 80 79 79
89
78
85
66
83
0
20
40
60
80
100
2009
2010
2011
2012
2013
2014
2015
2016
2017
2018
New listings (October only)
224
220 23
6
225 25
2
259
219
153
81 85
0
50
100
150
200
250
300
2009
2010
2011
2012
2013
2014
2015
2016
2017
2018
Active listings (October only)
4.2
4.2 4.
8
3.8
5.5
5.5
4.2
1.9
1.2 1.3
0.0
1.0
2.0
3.0
4.0
5.0
6.0
2009
2010
2011
2012
2013
2014
2015
2016
2017
2018
Months of inventory (October only)
$0$50,000
$100,000$150,000$200,000$250,000$300,000$350,000
Jan
2009
Jan
2010
Jan
2011
Jan
2012
Jan
2013
Jan
2014
Jan
2015
Jan
2016
Jan
2017
Jan
2018
Average Price
Source: Canadian MLS® Systems, CREA
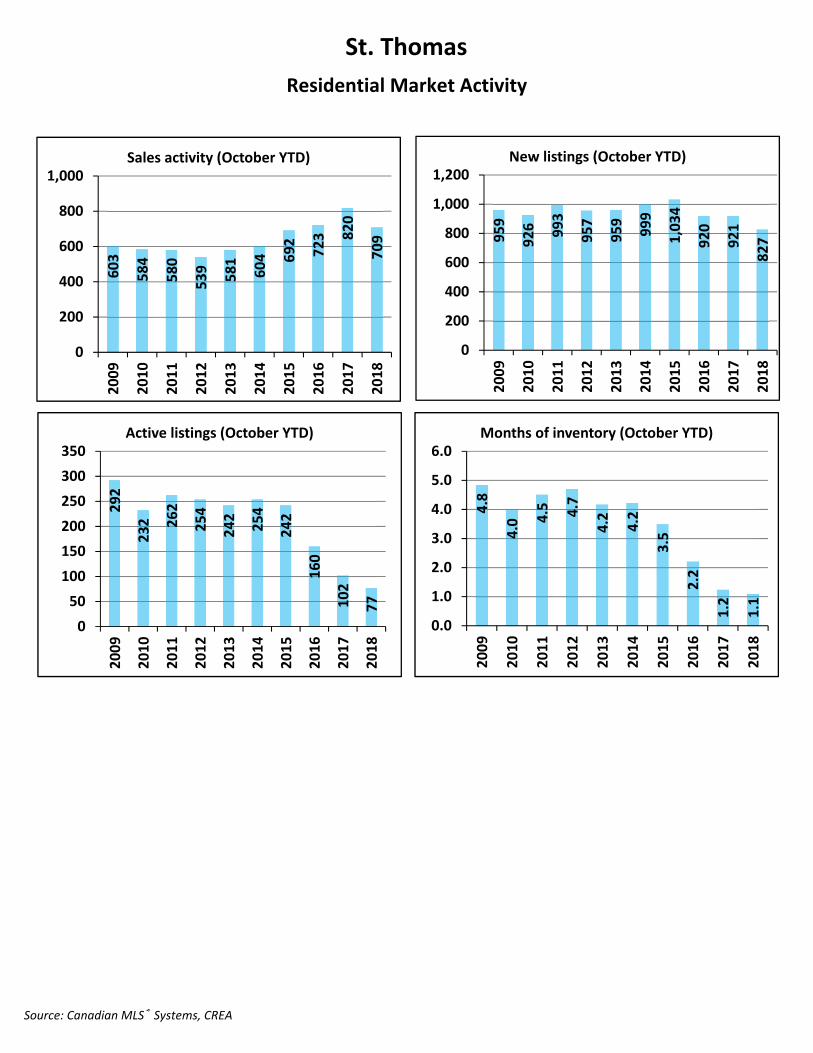
St. ThomasResidential Market Activity
603
584
580
539 58
1
604 69
2 723 82
0
709
0
200
400
600
800
1,000
2009
2010
2011
2012
2013
2014
2015
2016
2017
2018
Sales activity (October YTD)
959
926 99
3
957
959 999
1,03
4
920
921
827
0
200
400
600
800
1,000
1,200
2009
2010
2011
2012
2013
2014
2015
2016
2017
2018
New listings (October YTD)
292
232 26
2
254
242 254
242
160
102
77
050
100150200250300350
2009
2010
2011
2012
2013
2014
2015
2016
2017
2018
Active listings (October YTD)
4.8
4.0 4.
5 4.7
4.2
4.2
3.5
2.2
1.2
1.1
0.0
1.0
2.0
3.0
4.0
5.0
6.0
2009
2010
2011
2012
2013
2014
2015
2016
2017
2018
Months of inventory (October YTD)
Source: Canadian MLS® Systems, CREA

St. Thomas
1 year ago 2 years ago
3 years ago
5 years ago
7 years ago
10 years ago
October 2017
October 2016
October 2015
October 2013
October 2011
October 2008
Sales Activity 65 -7.1 -19.8 25.0 41.3 32.7 44.4Dollar Volume $20,505,133 3.8 10.5 92.6 107.5 133.8 151.9New Listings 83 25.8 -2.4 6.4 5.1 3.8 -38.1Active Listings 85 4.9 -44.4 -61.2 -66.3 -64.0 -76.9Sales to New Listings Ratio1 78.3 106.1 95.3 66.7 58.2 61.3 33.6Months of Inventory2 1.3 1.2 1.9 4.2 5.5 4.8 8.2Average Price $315,464 11.8 37.7 54.0 46.8 76.2 74.4
1 year ago 2 years ago
3 years ago
5 years ago
7 years ago
10 years ago
October 2017 YTD
October 2016 YTD
October 2015 YTD
October 2013 YTD
October 2011 YTD
October 2008 YTD
Sales Activity 709 -13.5 -1.9 2.5 22.0 22.2 23.7Dollar Volume $210,947,125 -0.8 29.5 43.8 84.1 98.0 96.7New Listings 827 -10.2 -10.1 -20.0 -13.8 -16.7 -24.5Active Listings3 77 -24.5 -51.9 -68.2 -68.2 -70.6 -71.6Sales to New Listings Ratio4 85.7 89.0 78.6 66.9 60.6 58.4 52.3Months of Inventory5 1.1 1.2 2.2 3.5 4.2 4.5 4.7Average Price $297,528 14.7 32.1 40.4 50.9 62.0 58.9
1 Sales / new listings * 1002 Active listings at month end / monthly sales3 The year-to-date active listings figure is a monthly average of the number of homes on the market at the end of each month so far this year4 Sum of sales from January to current month / sum of new listings from January to current month5 Average active listings from January to current month / average sales from January to current month6 Sales to new listings ratio and months of inventory shown as levels; all others calculated as percentage changes
Residential Market Activity
Actual October 2018
Compared to6
Year-to-date October 2018
Compared to6
Source: Canadian MLS® Systems, CREA

StrathroyResidential Market Activity
19 17
12
17
21
16
20 19
28 3005
101520253035
2009
2010
2011
2012
2013
2014
2015
2016
2017
2018
Sales activity (October only)
22
29
21
29
38
29
38
32 32
35
05
10152025303540
2009
2010
2011
2012
2013
2014
2015
2016
2017
2018
New listings (October only)
92 99 92 98
127
97 103
64 68 64
020406080
100120140
2009
2010
2011
2012
2013
2014
2015
2016
2017
2018
Active listings (October only)
4.8 5.
8
7.7
5.8 6.0
6.1
5.2
3.4
2.4
2.1
0.0
2.0
4.0
6.0
8.0
10.0
2009
2010
2011
2012
2013
2014
2015
2016
2017
2018
Months of inventory (October only)
$0
$100,000
$200,000
$300,000
$400,000
$500,000
Jan
2009
Jan
2010
Jan
2011
Jan
2012
Jan
2013
Jan
2014
Jan
2015
Jan
2016
Jan
2017
Jan
2018
Average Price
Source: Canadian MLS® Systems, CREA

StrathroyResidential Market Activity
201
196
192
183 197 22
0 239 27
9 297
246
050
100150200250300350
2009
2010
2011
2012
2013
2014
2015
2016
2017
2018
Sales activity (October YTD)
325
330 35
5
327
414
371
372 388
378
349
0
100
200
300
400
500
2009
2010
2011
2012
2013
2014
2015
2016
2017
2018
New listings (October YTD)
112
90 105
95
118
110
92
81
65 58
020406080
100120140
2009
2010
2011
2012
2013
2014
2015
2016
2017
2018
Active listings (October YTD)
5.6
4.6 5.
5
5.2 6.
0
5.0
3.8
2.9
2.2 2.4
0.01.02.03.04.05.06.07.0
2009
2010
2011
2012
2013
2014
2015
2016
2017
2018
Months of inventory (October YTD)
Source: Canadian MLS® Systems, CREA

Strathroy
1 year ago 2 years ago
3 years ago
5 years ago
7 years ago
10 years ago
October 2017
October 2016
October 2015
October 2013
October 2011
October 2008
Sales Activity 30 7.1 57.9 50.0 42.9 150.0 87.5Dollar Volume $10,645,623 31.3 110.3 128.9 129.3 358.1 268.6New Listings 35 9.4 9.4 -7.9 -7.9 66.7 -7.9Active Listings 64 -5.9 0.0 -37.9 -49.6 -30.4 -48.4Sales to New Listings Ratio1 85.7 87.5 59.4 52.6 55.3 57.1 42.1Months of Inventory2 2.1 2.4 3.4 5.2 6.0 7.7 7.8Average Price $354,854 22.6 33.2 52.6 60.5 83.2 96.6
1 year ago 2 years ago
3 years ago
5 years ago
7 years ago
10 years ago
October 2017 YTD
October 2016 YTD
October 2015 YTD
October 2013 YTD
October 2011 YTD
October 2008 YTD
Sales Activity 246 -17.2 -11.8 2.9 24.9 28.1 6.0Dollar Volume $81,513,128 -9.6 19.1 40.8 91.7 104.5 87.0New Listings 349 -7.7 -10.1 -6.2 -15.7 -1.7 -15.1Active Listings3 58 -10.8 -28.4 -37.0 -50.8 -44.8 -47.7Sales to New Listings Ratio4 70.5 78.6 71.9 64.2 47.6 54.1 56.4Months of Inventory5 2.4 2.2 2.9 3.8 6.0 5.5 4.8Average Price $331,354 9.1 35.1 36.8 53.5 59.6 76.3
1 Sales / new listings * 1002 Active listings at month end / monthly sales3 The year-to-date active listings figure is a monthly average of the number of homes on the market at the end of each month so far this year4 Sum of sales from January to current month / sum of new listings from January to current month5 Average active listings from January to current month / average sales from January to current month6 Sales to new listings ratio and months of inventory shown as levels; all others calculated as percentage changes
Residential Market Activity
Actual October 2018
Compared to6
Year-to-date October 2018
Compared to6
Source: Canadian MLS® Systems, CREA