the association between physical activity, sedentary time
TRANSCRIPT

Yan et al. Health Qual Life Outcomes (2021) 19:213 https://doi.org/10.1186/s12955-020-01575-x
RESEARCH
The association between physical activity, sedentary time and health-related quality of life in cancer survivorsRui Yan1,2†, Beibei Che1†, Binghui Lv1, Peng Wu1, Xinyuan Lu1, Yaxuan Zhang1, Jiwei Wang1* and Jinming Yu1*
Abstract
Background: Although physical activity (PA) and sedentary time in cancer survivors (CSs) were associated with health-related quality of life (HRQOL), it was not clear whether their associations were similar among CSs with dif-ferent number of comorbid chronic diseases (CCDs). This study aimed to investigate the associations between PA, sedentary time and HRQOL in CSs with different number of CCDs.
Methods: A cross-sectional study was conducted among 1546 CSs between June and September 2018 in Shanghai, China. Data were collected with a self-reported questionnaire including sociodemographic characteristics, CCDs, PA, sedentary time and HRQOL. International Physical Activity Questionnaire and Cancer Quality of Life Questionnaire-Core30 were respectively used to measure PA and HRQOL of CSs. Associations of PA and sedentary time with HRQOL among CSs with different number of CCDs were evaluated by using logistic regression, adjusted for confounding factors.
Results: About seventy-five percent CSs had at least one CCD. Approximately three fifths CSs had high PA level and < 4 h/day sedentary time. Moderate PA level and high PA level were shown to be associated with better HRQOL among all participants. In CSs with ≤ 2 CCDs, high PA level was significantly associated with higher scores of physical function and lower scores of nausea and vomiting, appetite loss. However, there was a positive association between high PA level and constipation score among CSs with ≥ 3 CCDs. CSs with shorter sedentary time had better HRQOL in those with CCDs.
Conclusions: High PA level and long sedentary time have significant association with worse HRQOL of CSs with ≥ 3 CCDs, while high PA level is positively associated with HRQOL in CSs with ≤ 2 CCDs. Our findings may support further studies of the causal association between PA, sedentary times and HRQOL to provide targeted proposal to improve the HRQOL of CSs according to their number of CCDs.
Keywords: Cancer survivor, Health-related quality of life, Physical activity, Sedentary time, Comorbid chronic disease
© The Author(s) 2020. Open Access This article is licensed under a Creative Commons Attribution 4.0 International License, which permits use, sharing, adaptation, distribution and reproduction in any medium or format, as long as you give appropriate credit to the original author(s) and the source, provide a link to the Creative Commons licence, and indicate if changes were made. The images or other third party material in this article are included in the article’s Creative Commons licence, unless indicated otherwise in a credit line to the material. If material is not included in the article’s Creative Commons licence and your intended use is not permitted by statutory regulation or exceeds the permitted use, you will need to obtain permission directly from the copyright holder. To view a copy of this licence, visit http://creativecommons.org/licenses/by/4.0/. The Creative Commons Public Domain Dedication waiver (http://creativecom-mons.org/publicdomain/zero/1.0/) applies to the data made available in this article, unless otherwise stated in a credit line to the data.
BackgroundA person is identified as a cancer survivor (CS) from the moment of the diagnosis of cancer to the ultimate of his or her life regardless of any death cause [1]. A report estimated that there would occur 4.30 million new can-cer cases in China in 2018 [2]. There was a significant improvement in cancer survival in Chinese people from a statistical data gathered from 17 cancer registries, pos-sibly indicating dramatic advance in quality of cancer
Open Access
*Correspondence: [email protected]; [email protected]†Rui Yan and Beibei Che have contributed equally to this work1 Institute of Clinical Epidemiology, Key Laboratory of Public Health Safety, Ministry of Education, Key Lab of Health Technology Assessment of Ministry of Health, School of Public Health, Fudan University, 130 Dong-An Road, Shanghai 200032, ChinaFull list of author information is available at the end of the article
Page 2 of 12Yan et al. Health Qual Life Outcomes (2021) 19:213
care in China [3]. Despite the increasingly improved sur-vival, CSs still face tremendous physical and psychologi-cal pressure [4, 5]. Therefore, it is of great significance to pay more attention to the health-related quality of life (HRQOL) of CSs, not to merely focus on the survival of tumor recurrence and metastasis.
Quality of life refers to a person’s understanding of his or her status in life based on the culture and value sys-tem of their own, and it is an evaluation measurement to assess the results of anticancer treatments [6, 7]. Quality of life includes all the factors impacting one’s life, while HRQOL includes those factors that are related to an indi-vidual’s health [8]. HRQOL, an undoubtedly important variable in health measurement, refers to those aspects of self-perceived well-being that are associated with or affected by the disease or treatment [9]. HRQOL of CSs have been indicated to be associated with socio, demo-graphic and disease related factors such as age, gender, financial status, type of cancer and therapeutic method [10]. A previous study demonstrated that the vast major-ity of HRQOL data were significant independent pre-dictors of survival time [11], thus more attention should be paid to find appropriate intervention to improve the HRQOL of CSs.
The associations between physical activity (PA), sed-entary time and HRQOL in CSs has received continued interest as PA and sedentary time are modifiable lifestyle behaviors. Active PA has been indicated to be associated with decreased risk of cancer mortality and recurrence, worse comorbid chronic conditions and better men-tal health [12–14]. Previous studies demonstrated that CSs spent more than 9 h in sedentary behavior per day [15], and the sedentary time of CSs was longer than that observed in national data [16] and age-matched healthy controls [17]. High level of sedentary time had several deleterious health effects for CSs, such as increased all-cause mortality, high risk of other chronic diseases containing diabetes and cardiovascular diseases [15], decreased physical functioning and diminished HRQOL [15, 18]. However, whether PA and sedentary time have similar influence on HRQOL is unclear in CSs with dif-ferent number of comorbid chronic diseases (CCDs).
In the setting of cancer, CCD, is a concept related to the existence, nature, and severity of health-related conditions that coexist with cancer [19]. It was reported that the rate of cancer patients having CCDs ranging from 0.40 to 90.00% [20]. CCDs has shown to be responsible for high rates of complica-tions and reducing cancer-specific survival rates in CSs [19, 21]. Both PA and HRQOL were associated with CCD according to previous studies. Findings from a cross-sectional study showed that physical inactivity in leisure time increased the risk of chronic disease in
older adults [22]. Moreover, lower risks of comorbidi-ties have significant association with aerobic physical activity or outdoor activity in CSs [23, 24]. In addition, CSs with CCDs have worse HRQOL, especially those who reported worsening conditions and those with two or more chronic conditions [21, 25, 26]. As men-tioned above, sedentary time is positively associated with the risk of chronic diseases among CSs. There-fore, CCD may serve as a confounding factor between the association of PA with HRQOL, and sedentary time with HRQOL. It is of great importance to find the real separate association between PA, sedentary time and HRQOL by stratifying CSs into three groups according to the number of CCDs. Our hypothesis was that the associations between PA, sedentary time and HRQOL vary in CSs with different number of CCDs. The inves-tigation would be helpful to put forward the targeted proposals to improve the HRQOL in CSs with different number of CCDs.
MethodsPurposeThe specific objectives of this cross-sectional study were to investigate the association of PA, sedentary time and HRQOL in Chinese CSs, and whether dispa-rate levels of PA and sedentary behavior would have different association with HRQOL in different comor-bidity classified groups (0, 1–2, ≥ 3). This investigation provided targeted behavioral guidance that different level of PA and sedentary time should be recommended for CSs with different number of CCDs to improve their HRQOL.
ParticipantsA cross-sectional study was conducted in Shanghai Can-cer Rehabilitation Club (SCRC) during June and Sep-tember 2018. The current study was restricted to 1674 individuals with: (a) pathologic diagnosed; (b) have fin-ished initial treatments; (c) could independently partici-pate in the activities; (d) without cognitive impairment; (e) without cancer treatment at present: surgery, chem-otherapy, radiotherapy, traditional Chinese medicine treatment, biotherapy or other cancer therapies. We further excluded individuals who refused to participate in (n = 52) and participants with large missing data of their questionnaire (n = 76). After these exclusions, the final analyses included 1546 CSs. All participants pro-vided written informed consent. Ethical approval to conduct this study was granted by the Medical Research Ethics Committee of the School of Public Health, Fudan University.

Page 3 of 12Yan et al. Health Qual Life Outcomes (2021) 19:213
InstrumentsSocio‑demographic characteristics and health‑related conditionsThe demographic characteristics included age, gender, marital status, income and education level. We collected information about health conditions about body mass index (BMI), number of CCDs, time since cancer diagno-sis, recurrence and metastasis.
Physical activityPA was assessed using the International Physical Activ-ity Questionnaire (IPAQ) [27]. The IPAQ demonstrated adequate validity and reliability in assessing overall lev-els of PA of Chinese adult population [28, 29]. We asked participants about the type, duration (minutes/day) and frequency (days/week) of each PA during the past 7 days. The met-minutes score for each PA is obtained by multi-plying the duration (minutes/day), frequency (days/week) and energy requirements (metabolic equivalent). Indi-viduals’ PA level were then categorized into three groups: high PA level (HPAL), moderate PA level (MPAL), and low PA level (LPAL) according to the IPAQ scoring guide-line (https ://www.ipaq.ki.se). Individuals are defined as HPAL if they reported: (a) 7 or more days of any com-bination of walking, moderate- or vigorous-intensity PA accumulating ≥ 3000 MET-min/week, or (b) ≥ 3 days of vigorous-intensity PA and accumulating ≥ 1500 MET-min/week. MPAL refers to: (a) ≥ 3 days of vigorous-intensity PA with ≥ 20 min per day, or (b) ≥ 5 days of moderate-intensity PA and/or walk ≥ 30 min per day, or (c) ≥ 5 days of any combination of walking, moderate or vigorous-intensity PA accumulating a total of ≥ 600 MET-min/week. Individuals that reported no activity or those didn’t meet the criteria for MPAL or HPAL are defined as LPAL.
Sedentary timeSitting time was an additional variable of IPAQ. Minutes were used to reflect the time of sitting (sedentary) behav-iors rather than MET-minutes. The average sitting min-utes/day was calculated according to the formula:
Comorbid chronic diseaseCSs were asked to indicate either “yes” or “no” on a list of CCDs including hyperlipidemia, hyperuricemia, hyper-tension, diabetes mellitus, heart and cardiovascular diseases, stroke, musculoskeletal diseases, digestive dis-eases, and respiratory diseases. Participants were classi-fied into three groups according to the number of CCDs (0, 1–2, ≥ 3).
Average sitting minutes/day =(
weekday sitting minutes per day× 5+ weekend day sitting minutes per day× 2)
/7.
HRQOLHRQOL was evaluated using the European Organization for Research and Treatment of Cancer Quality of Life Questionnaire-Core30 (EORTC QLQ-C30) (simplified Chinese version3.0) [30]. EORTC QLQ-C30 was proved to be reliable, effective and sensitive in assessing the physical, psychological and social function state among CSs in Chinese mainland, with the test–retest reliability coefficient for multi-item scales > 0.80 and the Cronbach’ α coefficient for most domains > 0.70 [31, 32]. EORTC QLQ-C30 is a 30-item self-reporting questionnaire including five functional scales (physical, role, cognitive, emotional, social), three symptom scales (fatigue, nau-sea and vomiting, pain), one global health scale and six single items (dyspnoea, insomnia, appetite loss, constipa-tion, diarrhea, and financial difficulties). According to the EORTC QLQ-C30 scoring guidelines, all crude subscale scores are transformed to standard scores that ranged from 0 to 100. Higher score of functional and global health scale indicated a better level of functioning and global health status. Higher score of symptom and finan-cial scales represent more severe symptoms or problems.
Statistical analysisChi-square test was used to compare the distribution of PA and sedentary time among various socio-demo-graphic factors and health conditions. Multiple linear regression were used to compute regression coefficients (β) and 95% confidence interval (CI) as estimates of the mean differences of HRQOL scores, adjusting for poten-tial confounding factors. Tests for trend were conducted by including the PA levels as continuous parameter in regression models. Analyses were conducted with Sta-tistical Analysis Software (SAS) version 9.4, with a two-sided P value < 0.05 indicating statistical significance.
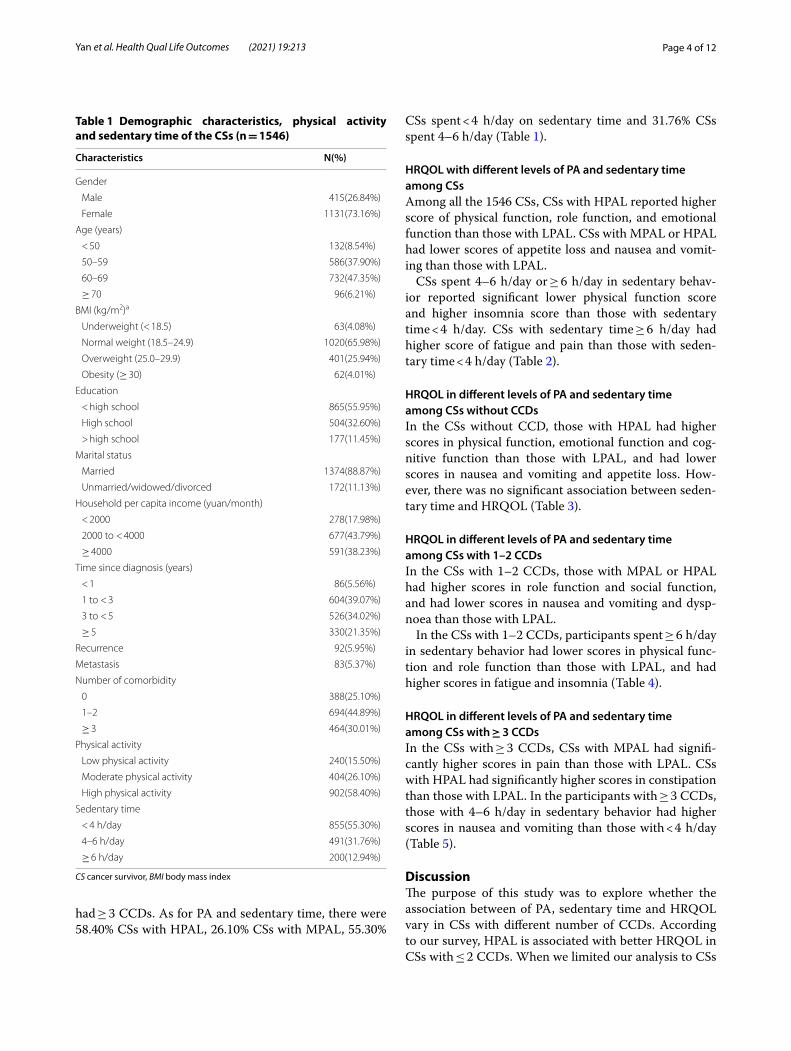
ResultsParticipant characteristicsA total of 1546 survivors with all types of cancers were included in our study. The characteristics of the partici-pants was shown in Table 1. In our participants, 73.16%
were female, 53.56% were 60 years old and above, and 88.87% were married. Many CSs had survived for more than 3 years since the diagnosis of cancer (55.37%). About 6.00% participants had recurrence and 5.37% had metastasis. In terms of the number of CCDs, 74.90% CSs had at least one CCDs, 44.89% had 1–2 CCDs and 30.01%
Page 4 of 12Yan et al. Health Qual Life Outcomes (2021) 19:213
had ≥ 3 CCDs. As for PA and sedentary time, there were 58.40% CSs with HPAL, 26.10% CSs with MPAL, 55.30%
CSs spent < 4 h/day on sedentary time and 31.76% CSs spent 4–6 h/day (Table 1).
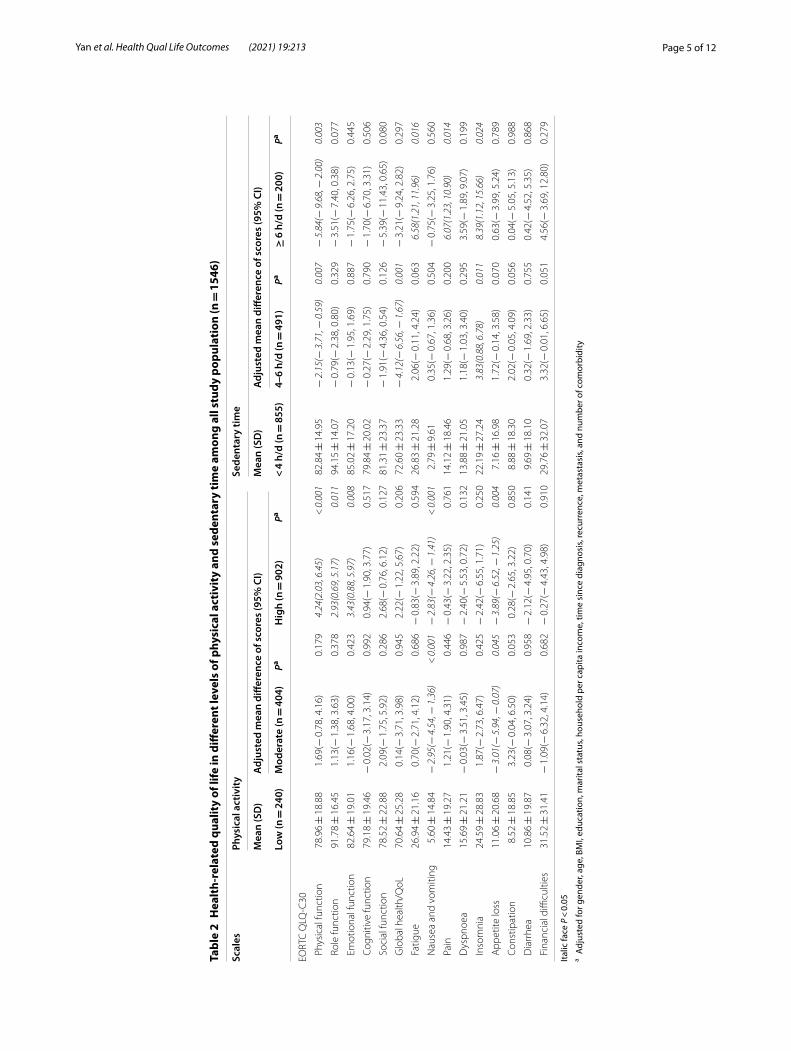
HRQOL with different levels of PA and sedentary time among CSsAmong all the 1546 CSs, CSs with HPAL reported higher score of physical function, role function, and emotional function than those with LPAL. CSs with MPAL or HPAL had lower scores of appetite loss and nausea and vomit-ing than those with LPAL.
CSs spent 4–6 h/day or ≥ 6 h/day in sedentary behav-ior reported significant lower physical function score and higher insomnia score than those with sedentary time < 4 h/day. CSs with sedentary time ≥ 6 h/day had higher score of fatigue and pain than those with seden-tary time < 4 h/day (Table 2).
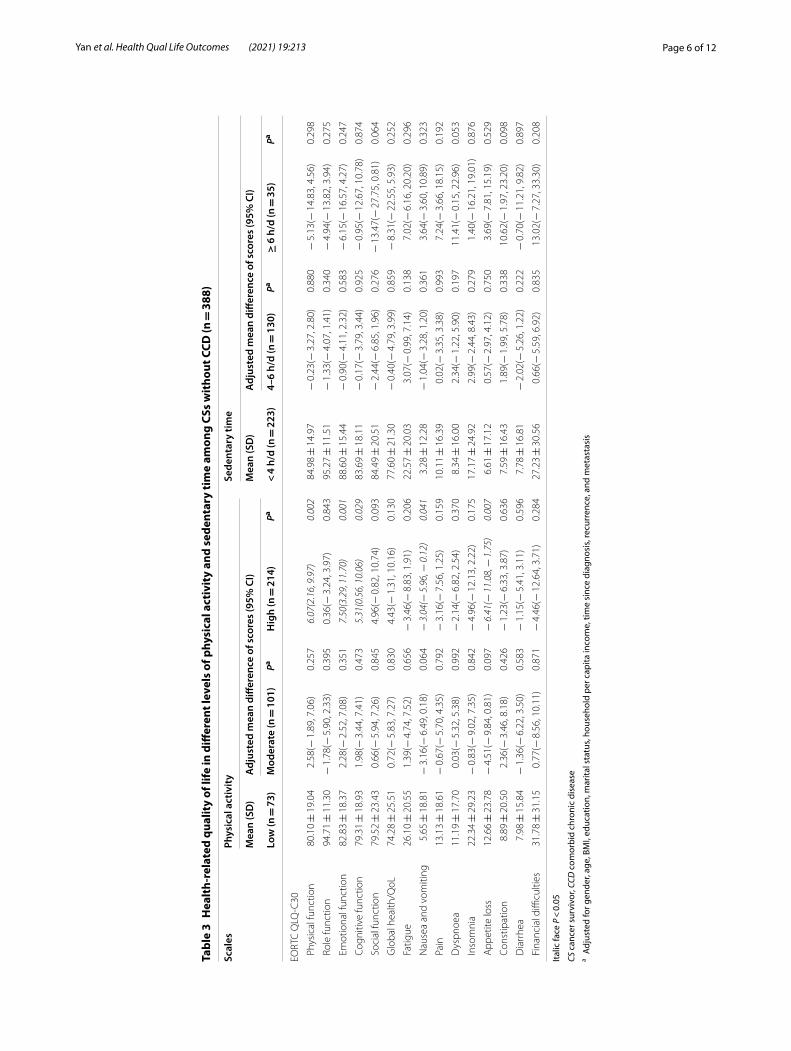
HRQOL in different levels of PA and sedentary time among CSs without CCDsIn the CSs without CCD, those with HPAL had higher scores in physical function, emotional function and cog-nitive function than those with LPAL, and had lower scores in nausea and vomiting and appetite loss. How-ever, there was no significant association between seden-tary time and HRQOL (Table 3).
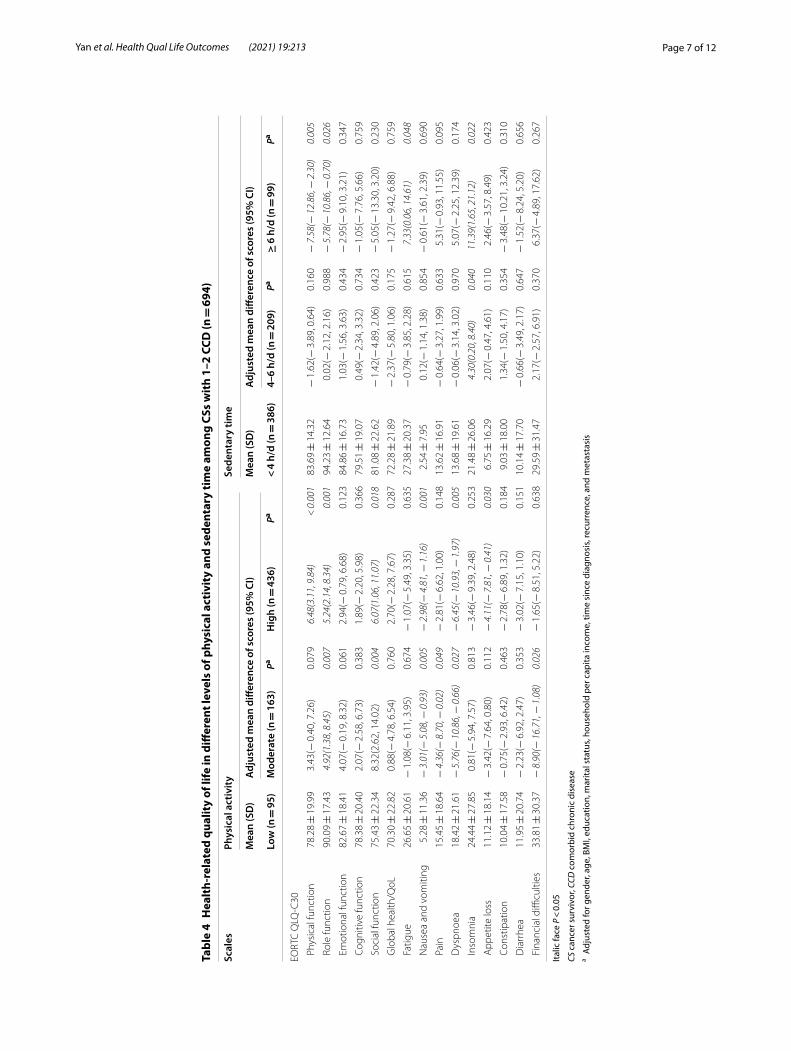
HRQOL in different levels of PA and sedentary time among CSs with 1–2 CCDsIn the CSs with 1–2 CCDs, those with MPAL or HPAL had higher scores in role function and social function, and had lower scores in nausea and vomiting and dysp-noea than those with LPAL.
In the CSs with 1–2 CCDs, participants spent ≥ 6 h/day in sedentary behavior had lower scores in physical func-tion and role function than those with LPAL, and had higher scores in fatigue and insomnia (Table 4).
HRQOL in different levels of PA and sedentary time among CSs with ≥ 3 CCDsIn the CSs with ≥ 3 CCDs, CSs with MPAL had signifi-cantly higher scores in pain than those with LPAL. CSs with HPAL had significantly higher scores in constipation than those with LPAL. In the participants with ≥ 3 CCDs, those with 4–6 h/day in sedentary behavior had higher scores in nausea and vomiting than those with < 4 h/day (Table 5).
DiscussionThe purpose of this study was to explore whether the association between of PA, sedentary time and HRQOL vary in CSs with different number of CCDs. According to our survey, HPAL is associated with better HRQOL in CSs with ≤ 2 CCDs. When we limited our analysis to CSs
Table 1 Demographic characteristics, physical activity and sedentary time of the CSs (n = 1546)
CS cancer survivor, BMI body mass index
Characteristics N(%)
Gender
Male 415(26.84%)
Female 1131(73.16%)
Age (years)
< 50 132(8.54%)
50–59 586(37.90%)
60–69 732(47.35%)
≥ 70 96(6.21%)
BMI (kg/m2)a
Underweight (< 18.5) 63(4.08%)
Normal weight (18.5–24.9) 1020(65.98%)
Overweight (25.0–29.9) 401(25.94%)
Obesity (≥ 30) 62(4.01%)
Education
< high school 865(55.95%)
High school 504(32.60%)
> high school 177(11.45%)
Marital status
Married 1374(88.87%)
Unmarried/widowed/divorced 172(11.13%)
Household per capita income (yuan/month)
< 2000 278(17.98%)
2000 to < 4000 677(43.79%)
≥ 4000 591(38.23%)
Time since diagnosis (years)
< 1 86(5.56%)
1 to < 3 604(39.07%)
3 to < 5 526(34.02%)
≥ 5 330(21.35%)
Recurrence 92(5.95%)
Metastasis 83(5.37%)
Number of comorbidity
0 388(25.10%)
1–2 694(44.89%)
≥ 3 464(30.01%)
Physical activity
Low physical activity 240(15.50%)
Moderate physical activity 404(26.10%)
High physical activity 902(58.40%)
Sedentary time
< 4 h/day 855(55.30%)
4–6 h/day 491(31.76%)
≥ 6 h/day 200(12.94%)
Page 5 of 12Yan et al. Health Qual Life Outcomes (2021) 19:213
Tabl
e 2
Hea
lth-
rela
ted
qual
ity
of li
fe in
diff
eren
t lev
els
of p
hysi
cal a
ctiv
ity
and
sede
ntar
y ti
me
amon
g al
l stu
dy p
opul
atio
n (n
= 1
546)
Italic
face
P <
0.0
5a A
djus
ted
for g
ende
r, ag
e, B
MI,
educ
atio
n, m
arita
l sta
tus,
hous
ehol
d pe
r cap
ita in
com
e, ti
me
sinc
e di
agno
sis,
recu
rren
ce, m
etas
tasi
s, an
d nu
mbe
r of c
omor
bidi
ty
Scal
esPh
ysic
al a
ctiv
ity
Sede
ntar
y tim
e
Mea
n (S
D)
Adj
uste
d m
ean
diffe
renc
e of
sco
res
(95%
CI)
Mea
n (S
D)
Adj
uste
d m
ean
diffe
renc
e of
sco
res
(95%
CI)
Low
(n =
240
)M
oder
ate
(n =
404
)Pa
Hig
h (n
= 9
02)
Pa<
4 h/
d (n
= 8
55)
4–6
h/d
(n =
491
)Pa
≥ 6
h/d
(n =
200
)Pa
EORT
C Q
LQ-C
30
Phy
sica
l fun
ctio
n78
.96 ±
18.
881.
69(−
0.7
8, 4
.16)
0.17
94.
24(2
.03,
6.4
5) <
0.0
0182
.84 ±
14.
95−
2.1
5(−
3.7
1, −
0.5
9)0.
007
− 5
.84(−
9.6
8, −
2.0
0)0.
003
Rol
e fu
nctio
n91
.78 ±
16.
451.
13(−
1.3
8, 3
.63)
0.37
82.
93(0
.69,
5.1
7)0.
011
94.1
5 ±
14.
07−
0.7
9(−
2.3
8, 0
.80)
0.32
9−
3.5
1(−
7.4
0, 0
.38)
0.07
7
Em
otio
nal f
unct
ion
82.6
4 ±
19.
011.
16(−
1.6
8, 4
.00)
0.42
33.
43(0
.88,
5.9
7)0.
008
85.0
2 ±
17.
20−
0.1
3(−
1.9
5, 1
.69)
0.88
7−
1.7
5(−
6.2
6, 2
.75)
0.44
5
Cog
nitiv
e fu
nctio
n79
.18 ±
19.
46−
0.0
2(−
3.1
7, 3
.14)
0.99
20.
94(−
1.9
0, 3
.77)
0.51
779
.84 ±
20.
02−
0.2
7(−
2.2
9, 1
.75)
0.79
0−
1.7
0(−
6.7
0, 3
.31)
0.50
6
Soc
ial f
unct
ion
78.5
2 ±
22.
882.
09(−
1.7
5, 5
.92)
0.28
62.
68(−
0.7
6, 6
.12)
0.12
781
.31 ±
23.
37−
1.9
1(−
4.3
6, 0
.54)
0.12
6−
5.3
9(−
11.
43, 0
.65)
0.08
0
Glo
bal h
ealth
/QoL
70.6
4 ±
25.
280.
14(−
3.7
1, 3
.98)
0.94
52.
22(−
1.2
2, 5
.67)
0.20
672
.60 ±
23.
33−
4.1
2(−
6.5
6, −
1.6
7)0.
001
− 3
.21(−
9.2
4, 2
.82)
0.29
7
Fat
igue
26.9
4 ±
21.
160.
70(−
2.7
1, 4
.12)
0.68
6−
0.8
3(−
3.8
9, 2
.22)
0.59
426
.83 ±
21.
282.
06(−
0.1
1, 4
.24)
0.06
36.
58(1
.21,
11.
96)
0.01
6
Nau
sea
and
vom
iting
5.60
± 1
4.84
− 2
.95(−
4.5
4, −
1.3
6) <
0.0
01−
2.8
3(−
4.2
6, −
1.4
1) <
0.0
012.
79 ±
9.6
10.
35(−
0.6
7, 1
.36)
0.50
4−
0.7
5(−
3.2
5, 1
.76)
0.56
0
Pai
n14
.43 ±
19.
271.
21(−
1.9
0, 4
.31)
0.44
6−
0.4
3(−
3.2
2, 2
.35)
0.76
114
.12 ±
18.
461.
29(−
0.6
8, 3
.26)
0.20
06.
07(1
.23,
10.
90)
0.01
4
Dys
pnoe
a15
.69 ±
21.
21−
0.0
3(−
3.5
1, 3
.45)
0.98
7−
2.4
0(−
5.5
3, 0
.72)
0.13
213
.88 ±
21.
051.
18(−
1.0
3, 3
.40)
0.29
53.
59(−
1.8
9, 9
.07)
0.19
9
Inso
mni
a24
.59 ±
28.
831.
87(−
2.7
3, 6
.47)
0.42
5−
2.4
2(−
6.5
5, 1
.71)
0.25
022
.19 ±
27.
243.
83(0
.88,
6.7
8)0.
011
8.39
(1.1
2, 1
5.66
)0.
024
App
etite
loss
11.0
6 ±
20.
68−
3.0
1(−
5.9
4, −
0.0
7)0.
045
− 3
.89(−
6.5
2, −
1.2
5)0.
004
7.16
± 1
6.98
1.72
(− 0
.14,
3.5
8)0.
070
0.63
(− 3
.99,
5.2
4)0.
789
Con
stip
atio
n8.
52 ±
18.
853.
23(−
0.0
4, 6
.50)
0.05
30.
28(−
2.6
5, 3
.22)
0.85
08.
88 ±
18.
302.
02(−
0.0
5, 4
.09)
0.05
60.
04(−
5.0
5, 5
.13)
0.98
8
Dia
rrhe
a10
.86 ±
19.
870.
08(−
3.0
7, 3
.24)
0.95
8−
2.1
2(−
4.9
5, 0
.70)
0.14
19.
69 ±
18.
100.
32(−
1.6
9, 2
.33)
0.75
50.
42(−
4.5
2, 5
.35)
0.86
8
Fin
anci
al d
ifficu
lties
31.5
2 ±
31.
41−
1.0
9(−
6.3
2, 4
.14)
0.68
2−
0.2
7(−
4.4
3, 4
.98)
0.91
029
.76 ±
32.
073.
32(−
0.0
1, 6
.65)
0.05
14.
56(−
3.6
9, 1
2.80
)0.
279
Page 6 of 12Yan et al. Health Qual Life Outcomes (2021) 19:213
Tabl
e 3
Hea
lth-
rela
ted
qual
ity
of li
fe in
diff
eren
t lev
els
of p
hysi
cal a
ctiv
ity
and
sede
ntar
y ti
me
amon
g CS
s w
itho
ut C
CD (n
= 3
88)
Italic
face
P <
0.0
5
CS c
ance
r sur
vivo
r, CC
D c
omor
bid
chro
nic
dise
ase
a Adj
uste
d fo
r gen
der,
age,
BM
I, ed
ucat
ion,
mar
ital s
tatu
s, ho
useh
old
per c
apita
inco
me,
tim
e si
nce
diag
nosi
s, re
curr
ence
, and
met
asta
sis
Scal
esPh
ysic
al a
ctiv
ity
Sede
ntar
y tim
e
Mea
n (S
D)
Adj
uste
d m
ean
diffe
renc
e of
sco
res
(95%
CI)
Mea
n (S
D)
Adj
uste
d m
ean
diffe
renc
e of
sco
res
(95%
CI)
Low
(n =
73)
Mod
erat
e (n
= 1
01)
PaH
igh
(n =
214
)Pa
< 4
h/d
(n =
223
)4–
6 h/
d (n
= 1
30)
Pa≥
6 h
/d (n
= 3
5)Pa
EORT
C Q
LQ-C
30
Phy
sica
l fun
ctio
n80
.10 ±
19.
042.
58(−
1.8
9, 7
.06)
0.25
76.
07(2
.16,
9.9
7)0.
002
84.9
8 ±
14.
97−
0.2
3(−
3.2
7, 2
.80)
0.88
0−
5.1
3(−
14.
83, 4
.56)
0.29
8
Rol
e fu
nctio
n94
.71 ±
11.
30−
1.7
8(−
5.9
0, 2
.33)
0.39
50.
36(−
3.2
4, 3
.97)
0.84
395
.27 ±
11.
51−
1.3
3(−
4.0
7, 1
.41)
0.34
0−
4.9
4(−
13.
82, 3
.94)
0.27
5
Em
otio
nal f
unct
ion
82.8
3 ±
18.
372.
28(−
2.5
2, 7
.08)
0.35
17.
50(3
.29,
11.
70)
0.00
188
.60 ±
15.
44−
0.9
0(−
4.1
1, 2
.32)
0.58
3−
6.1
5(−
16.
57, 4
.27)
0.24
7
Cog
nitiv
e fu
nctio
n79
.31 ±
18.
931.
98(−
3.4
4, 7
.41)
0.47
35.
31(0
.56,
10.
06)
0.02
983
.69 ±
18.
11−
0.1
7(−
3.7
9, 3
.44)
0.92
5−
0.9
5(−
12.
67, 1
0.78
)0.
874
Soc
ial f
unct
ion
79.5
2 ±
23.
430.
66(−
5.9
4, 7
.26)
0.84
54.
96(−
0.8
2, 1
0.74
)0.
093
84.4
9 ±
20.
51−
2.4
4(−
6.8
5, 1
.96)
0.27
6−
13.
47(−
27.
75, 0
.81)
0.06
4
Glo
bal h
ealth
/QoL
74.2
8 ±
25.
510.
72(−
5.8
3, 7
.27)
0.83
04.
43(−
1.3
1, 1
0.16
)0.
130
77.6
0 ±
21.
30−
0.4
0(−
4.7
9, 3
.99)
0.85
9−
8.3
1(−
22.
55, 5
.93)
0.25
2
Fat
igue
26.1
0 ±
20.
551.
39(−
4.7
4, 7
.52)
0.65
6−
3.4
6(−
8.8
3, 1
.91)
0.20
622
.57 ±
20.
033.
07(−
0.9
9, 7
.14)
0.13
87.
02(−
6.1
6, 2
0.20
)0.
296
Nau
sea
and
vom
iting
5.65
± 1
8.81
− 3
.16(−
6.4
9, 0
.18)
0.06
4−
3.0
4(−
5.9
6, −
0.1
2)0.
041
3.28
± 1
2.28
− 1
.04(−
3.2
8, 1
.20)
0.36
13.
64(−
3.6
0, 1
0.89
)0.
323
Pai
n13
.13 ±
18.
61−
0.6
7(−
5.7
0, 4
.35)
0.79
2−
3.1
6(−
7.5
6, 1
.25)
0.15
910
.11 ±
16.
390.
02(−
3.3
5, 3
.38)
0.99
37.
24(−
3.6
6, 1
8.15
)0.
192
Dys
pnoe
a11
.19 ±
17.
700.
03(−
5.3
2, 5
.38)
0.99
2−
2.1
4(−
6.8
2, 2
.54)
0.37
08.
34 ±
16.
002.
34(−
1.2
2, 5
.90)
0.19
711
.41(−
0.1
5, 2
2.96
)0.
053
Inso
mni
a22
.34 ±
29.
23−
0.8
3(−
9.0
2, 7
.35)
0.84
2−
4.9
6(−
12.
13, 2
.22)
0.17
517
.17 ±
24.
922.
99(−
2.4
4, 8
.43)
0.27
91.
40(−
16.
21, 1
9.01
)0.
876
App
etite
loss
12.6
6 ±
23.
78−
4.5
1(−
9.8
4, 0
.81)
0.09
7−
6.4
1(−
11.
08, −
1.7
5)0.
007
6.61
± 1
7.12
0.57
(− 2
.97,
4.1
2)0.
750
3.69
(− 7
.81,
15.
19)
0.52
9
Con
stip
atio
n8.
89 ±
20.
502.
36(−
3.4
6, 8
.18)
0.42
6−
1.2
3(−
6.3
3, 3
.87)
0.63
67.
59 ±
16.
431.
89(−
1.9
9, 5
.78)
0.33
810
.62(−
1.9
7, 2
3.20
)0.
098
Dia
rrhe
a7.
98 ±
15.
84−
1.3
6(−
6.2
2, 3
.50)
0.58
3−
1.1
5(−
5.4
1, 3
.11)
0.59
67.
78 ±
16.
81−
2.0
2(−
5.2
6, 1
.22)
0.22
2−
0.7
0(−
11.
21, 9
.82)
0.89
7
Fin
anci
al d
ifficu
lties
31.7
8 ±
31.
150.
77(−
8.5
6, 1
0.11
)0.
871
− 4
.46(−
12.
64, 3
.71)
0.28
427
.23 ±
30.
560.
66(−
5.5
9, 6
.92)
0.83
513
.02(−
7.2
7, 3
3.30
)0.
208
Page 7 of 12Yan et al. Health Qual Life Outcomes (2021) 19:213
Tabl
e 4
Hea
lth-
rela
ted
qual
ity
of li
fe in
diff
eren
t lev
els
of p
hysi
cal a
ctiv
ity
and
sede
ntar
y ti
me
amon
g CS
s w
ith
1–2
CCD
(n =
694
)
Italic
face
P <
0.0
5
CS c
ance
r sur
vivo
r, CC
D c
omor
bid
chro
nic
dise
ase
a Adj
uste
d fo
r gen
der,
age,
BM
I, ed
ucat
ion,
mar
ital s
tatu
s, ho
useh
old
per c
apita
inco
me,
tim
e si
nce
diag
nosi
s, re
curr
ence
, and
met
asta
sis
Scal
esPh
ysic
al a
ctiv
ity
Sede
ntar
y tim
e
Mea
n (S
D)
Adj
uste
d m
ean
diffe
renc
e of
sco
res
(95%
CI)
Mea
n (S
D)
Adj
uste
d m
ean
diffe
renc
e of
sco
res
(95%
CI)
Low
(n =
95)
Mod
erat
e (n
= 1
63)
PaH
igh
(n =
436
)Pa
< 4
h/d
(n =
386
)4–
6 h/
d (n
= 2
09)
Pa≥
6 h
/d (n
= 9
9)Pa
EORT
C Q
LQ-C
30
Phy
sica
l fun
ctio
n78
.28 ±
19.
993.
43(−
0.4
0, 7
.26)
0.07
96.
48(3
.11,
9.8
4) <
0.0
0183
.69 ±
14.
32−
1.6
2(−
3.8
9, 0
.64)
0.16
0−
7.5
8(−
12.
86, −
2.3
0)0.
005
Rol
e fu
nctio
n90
.09 ±
17.
434.
92(1
.38,
8.4
5)0.
007
5.24
(2.1
4, 8
.34)
0.00
194
.23 ±
12.
640.
02(−
2.1
2, 2
.16)
0.98
8−
5.7
8(−
10.
86, −
0.7
0)0.
026
Em
otio
nal f
unct
ion
82.6
7 ±
18.
414.
07(−
0.1
9, 8
.32)
0.06
12.
94(−
0.7
9, 6
.68)
0.12
384
.86 ±
16.
731.
03(−
1.5
6, 3
.63)
0.43
4−
2.9
5(−
9.1
0, 3
.21)
0.34
7
Cog
nitiv
e fu
nctio
n78
.38 ±
20.
402.
07(−
2.5
8, 6
.73)
0.38
31.
89(−
2.2
0, 5
.98)
0.36
679
.51 ±
19.
070.
49(−
2.3
4, 3
.32)
0.73
4−
1.0
5(−
7.7
6, 5
.66)
0.75
9
Soc
ial f
unct
ion
75.4
3 ±
22.
348.
32(2
.62,
14.
02)
0.00
46.
07(1
.06,
11.
07)
0.01
881
.08 ±
22.
62−
1.4
2(−
4.8
9, 2
.06)
0.42
3−
5.0
5(−
13.
30, 3
.20)
0.23
0
Glo
bal h
ealth
/QoL
70.3
0 ±
22.
820.
88(−
4.7
8, 6
.54)
0.76
02.
70(−
2.2
8, 7
.67)
0.28
772
.28 ±
21.
89−
2.3
7(−
5.8
0, 1
.06)
0.17
5−
1.2
7(−
9.4
2, 6
.88)
0.75
9
Fat
igue
26.6
5 ±
20.
61−
1.0
8(−
6.1
1, 3
.95)
0.67
4−
1.0
7(−
5.4
9, 3
.35)
0.63
527
.38 ±
20.
37−
0.7
9(−
3.8
5, 2
.28)
0.61
57.
33(0
.06,
14.
61)
0.04
8
Nau
sea
and
vom
iting
5.28
± 1
1.36
− 3
.01(−
5.0
8, −
0.9
3)0.
005
− 2
.98(−
4.8
1, −
1.1
6)0.
001
2.54
± 7
.95
0.12
(− 1
.14,
1.3
8)0.
854
− 0
.61(−
3.6
1, 2
.39)
0.69
0
Pai
n15
.45 ±
18.
64−
4.3
6(−
8.7
0, −
0.0
2)0.
049
− 2
.81(−
6.6
2, 1
.00)
0.14
813
.62 ±
16.
91−
0.6
4(−
3.2
7, 1
.99)
0.63
35.
31(−
0.9
3, 1
1.55
)0.
095
Dys
pnoe
a18
.42 ±
21.
61−
5.7
6(−
10.
86, −
0.6
6)0.
027
− 6
.45(−
10.
93, −
1.9
7)0.
005
13.6
8 ±
19.
61−
0.0
6(−
3.1
4, 3
.02)
0.97
05.
07(−
2.2
5, 1
2.39
)0.
174
Inso
mni
a24
.44 ±
27.
850.
81(−
5.9
4, 7
.57)
0.81
3−
3.4
6(−
9.3
9, 2
.48)
0.25
321
.48 ±
26.
064.
30(0
.20,
8.4
0)0.
040
11.3
9(1.
65, 2
1.12
)0.
022
App
etite
loss
11.1
2 ±
18.
14−
3.4
2(−
7.6
4, 0
.80)
0.11
2−
4.1
1(−
7.8
1, −
0.4
1)0.
030
6.75
± 1
6.29
2.07
(− 0
.47,
4.6
1)0.
110
2.46
(− 3
.57,
8.4
9)0.
423
Con
stip
atio
n10
.04 ±
17.
58−
0.7
5(−
2.9
3, 6
.42)
0.46
3−
2.7
8(−
6.8
9, 1
.32)
0.18
49.
03 ±
18.
001.
34(−
1.5
0, 4
.17)
0.35
4−
3.4
8(−
10.
21, 3
.24)
0.31
0
Dia
rrhe
a11
.95 ±
20.
74−
2.2
3(−
6.9
2, 2
.47)
0.35
3−
3.0
2(−
7.1
5, 1
.10)
0.15
110
.14 ±
17.
70−
0.6
6(−
3.4
9, 2
.17)
0.64
7−
1.5
2(−
8.2
4, 5
.20)
0.65
6
Fin
anci
al d
ifficu
lties
33.8
1 ±
30.
37−
8.9
0(−
16.
71, −
1.0
8)0.
026
− 1
.65(−
8.5
1, 5
.22)
0.63
829
.59 ±
31.
472.
17(−
2.5
7, 6
.91)
0.37
06.
37(−
4.8
9, 1
7.62
)0.
267

Page 8 of 12Yan et al. Health Qual Life Outcomes (2021) 19:213
Tabl
e 5
Hea
lth-
rela
ted
qual
ity
of li
fe in
diff
eren
t lev
els
of p
hysi
cal a
ctiv
ity
and
sede
ntar
y ti
me
amon
g CS
s w
ith ≥
3 C
CD (n
= 4
64)
Italic
face
P <
0.0
5
CS c
ance
r sur
vivo
r, CC
D c
omor
bid
chro
nic
dise
ase
a Adj
uste
d fo
r gen
der,
age,
BM
I, ed
ucat
ion,
mar
ital s
tatu
s, ho
useh
old
per c
apita
inco
me,
tim
e si
nce
diag
nosi
s, re
curr
ence
, and
met
asta
sis
Scal
esPh
ysic
al a
ctiv
ity
Sede
ntar
y tim
e
Mea
n (S
D)
Adj
uste
d m
ean
diffe
renc
e of
sco
res
(95%
CI)
Mea
n (S
D)
Adj
uste
d m
ean
diffe
renc
e of
sco
res
(95%
CI)
Low
(n =
72)
Mod
erat
e (n
= 1
40)
PaH
igh
(n =
252
)Pa
< 4
h/d
(n =
246
)4–
6 h/
d (n
= 1
52)
Pa≥
6 h
/d (n
= 6
6)Pa
EORT
C Q
LQ-C
30
Phy
sica
l fun
ctio
n78
.63 ±
17.
430.
11(−
4.7
7, 4
.56)
0.96
50.
05(−
4.3
3, 4
.43)
0.98
379
.51 ±
15.
40−
1.8
2(−
4.8
5, 1
.22)
0.24
1−
3.7
5(−
10.
64, 3
.14)
0.28
5
Rol
e fu
nctio
n91
.40 ±
17.
610.
90(−
5.9
1, 4
.12)
0.72
61.
43(−
3.2
8, 6
.13)
0.55
292
.92 ±
16.
93−
1.8
3(−
5.1
2, 1
.46)
0.27
5−
1.8
9(−
9.4
5, 5
.67)
0.62
3
Em
otio
nal f
unct
ion
82.7
6 ±
19.
230.
31(−
7.5
6, 2
.94)
0.38
70.
67(−
4.2
5, 5
.60)
0.78
882
.00 ±
17.
71−
0.1
2(−
3.6
0, 3
.35)
0.94
40.
48(−
7.5
1, 8
.47)
0.90
6
Cog
nitiv
e fu
nctio
n80
.23 ±
17.
31−
2.9
9(−
8.9
4, 2
.97)
0.32
5−
3.8
7(−
9.4
6, 1
.72)
0.17
476
.88 ±
21.
420.
28(−
3.6
3, 4
.19)
0.88
8−
3.5
6(−
12.
55, 5
.42)
0.43
6
Soc
ial f
unct
ion
81.9
7 ±
20.
24−
4.5
3(−
11.
51, 2
.46)
0.20
3−
4.0
6(−
10.
62, 2
.49)
0.22
478
.66 ±
24.
82−
1.4
5(−
6.0
6, 3
.17)
0.53
8−
3.1
4(−
13.
74, 7
.47)
0.56
2
Glo
bal h
ealth
/QoL
67.5
7 ±
24.
09−
1.1
5(−
7.9
1, 5
.62)
0.73
9−
0.3
2(−
6.6
7, 6
.03)
0.92
068
.28 ±
24.
09−
3.0
2(−
7.4
8, 1
.44)
0.18
3−
2.0
4(−
12.
29, 8
.21)
0.69
6
Fat
igue
28.3
1 ±
20.
640.
79(−
5.3
5, 6
.92)
0.80
10.
92(−
4.8
4, 6
.68)
0.75
329
.94 ±
21.
680.
46(−
3.5
6, 4
.48)
0.82
37.
97(−
1.2
7, 1
7.21
)0.
091
Nau
sea
and
vom
iting
5.49
± 1
3.02
− 2
.51(−
5.4
6, 0
.44)
0.09
6−
1.9
6(−
4.7
3, 0
.81)
0.16
42.
77 ±
8.5
02.
27(0
.34,
4.2
1)0.
021
0.25
(− 4
.20,
4.6
9)0.
913
Pai
n14
.47 ±
18.
747.
18(1
.12,
13.
25)
0.02
04.
31(−
1.3
9, 1
0.00
)0.
138
18.6
0 ±
20.
392.
64(−
1.3
7, 6
.65)
0.19
76.
44(−
2.7
8, 1
5.65
)0.
171
Dys
pnoe
a16
.35 ±
20.
654.
78(−
1.8
0, 1
1.35
)0.
154
1.91
(− 4
.26,
8.0
8)0.
544
19.3
2 ±
23.
930.
81(−
3.5
0, 5
.13)
0.71
2−
1.4
5(−
11.
37, 8
.46)
0.77
4
Inso
mni
a27
.03 ±
26.
792.
96(−
5.5
3, 1
1.44
)0.
494
0.86
(− 7
.11,
8.8
2)0.
833
28.2
4 ±
27.
812.
30(−
3.2
3, 7
.84)
0.41
43.
25(−
9.4
7, 1
5.98
)0.
615
App
etite
loss
8.66
± 1
7.94
0.83
(− 4
.59,
6.2
5)0.
763
0.47
(− 4
.62,
5.5
6)0.
856
8.45
± 1
6.67
2.22
(− 1
.32,
5.7
6)0.
218
− 0
.27(−
8.4
0, 7
.86)
0.94
8
Con
stip
atio
n6.
50 ±
15.
756.
01(0
.01,
12.
02)
0.05
06.
45(0
.81,
12.
08)
0.02
59.
94 ±
18.
862.
26(−
1.6
6, 6
.18)
0.25
74.
16(−
4.8
5, 1
3.16
)0.
365
Dia
rrhe
a12
.12 ±
20.
112.
89(−
3.1
5, 8
.93)
0.34
8−
2.0
7(−
7.7
4, 3
.60)
0.47
310
.74 ±
18.
322.
75(−
1.2
1, 6
.72)
0.17
32.
20(−
6.9
1, 1
1.30
)0.
636
Fin
anci
al d
ifficu
lties
28.0
1 ±
28.
864.
22(−
4.7
9, 1
3.23
)0.
358
3.33
(− 5
.13,
11.
00)
0.43
932
.47 ±
31.
375.
64(−
0.3
0, 1
1.59
)0.
063
− 2
.74(−
16.
41, 1
0.92
)0.
693

Page 9 of 12Yan et al. Health Qual Life Outcomes (2021) 19:213
with ≥ 3 CCDs, however, an inverse association between PA and HRQOL appeared. In addition, less sedentary time was associated with a better experience of HRQOL in CSs with CCDs.
In our study, there was a very high percentage of higher PA level and shorter sedentary time, approximately three fifths CSs with HPAL and < 4 h/day sedentary time, prob-ably because a cancer diagnosis may provide a ’teachable moment’ for CSs to change their behaviors to promote their overall health [33]. Furthermore, it may be due to a variety of activities regularly organized by the SCRC offering numerous opportunities for outdoor activities. MPAL and HPAL are shown to be associated with lower appetite loss, nausea and vomiting score, and mean-while, HPAL is positively associated with higher scores of physical function, role function and emotional function, which means appropriate PA may help improve clinical symptoms of CSs. Consistent with our findings, previ-ous cross-sectional studies showed that higher intensity PA was related to better HRQOL among CSs [34, 35]. It was demonstrated that physical activity can promote positive physiological benefits such as improving physi-cal function among CSs after treatment [36, 37]. As for sedentary behavior, similar to the results of this study, other studies supported the inverse association between sedentary time and HRQOL in CSs [38, 39]. Therefore, ACSM guidelines state that inactivity should be avoided and sedentary habits should be limited such as watching television [40]. Although no public health threshold is set as reference values for daily sedentary time at present, CSs should probably reduce the time spent in sedentary behavior not only because of the adverse effect of seden-tary behavior, but also due to the fact that the long sed-entary time might displace the time otherwise engage in PA [41]. However, few studies focused on the association between sedentary time and HRQOL in CSs with differ-ent number of CCDs, so it is not clear whether the same influence of sedentary time on HRQOL exists under dif-ferent number of CCDs.
There was significant association between HPAL and better HRQOL in CSs with ≤ 2 CCDs, however, unex-pectedly inverse results appeared in those with ≥ 3 CCDs. Among CSs with ≥ 3 CCDs, MPAL was related to higher pain score, which was probably because CSs with multiple CCDs already exhibited worse symptoms so that any activity of a slightly higher intensity will lead to more pain. At the same time, HPAL was associated with higher constipation score in those with ≥ 3 CCDs. The results of this investigation supported our hypoth-esis that PA has different association with HRQOL of CSs in three groups of CCDs. Previous studies showed that exercise can reduce the symptoms of nausea and vomit-ing after clinical treatment [42, 43]. There would be some
reasons that lead to different associations under three groups of CCDs including worse health condition of mul-tiple comorbid cancer patients, different medications and various types of cancer. Some studies have shown that PA appears to be unrelated to the risk of constipation in adults [44–46], while others indicated that exercise can help improve constipation [47, 48], which are differ-ent from our findings. This may be due to differences in socio-demographic characteristics such as ethnicity and ages, varying measures for physical activity and consti-pation, and various kinds of diseases in the study. Our results about constipation could be that CSs with HPAL did not hydrate in time or have diverse dietary habits from those with LPAL, confounding the real association. Besides, unlike studies above, this research applied strati-fication analysis to find the association between different level of PA and constipation through EORTC QLQ-C30. Further intervention experiments are needed to indicate the real association between high level of PA and con-stipation in CSs. Also, further intervention trials should follow to determine whether higher levels of PA lead to poorer HRQOL in CSs with ≥ 3 CCDs to take appropri-ate interventions to promote health of CSs. Moreover, it is necessary for physicians and health care professions to provide periodic review, reasonable treatment, and long-term surveillance and management of complications to take effective measures to reduce or control the negative health effect of CCDs on CSs.
Our results showed that self-reported sedentary time was inversely associated with physical function and role function, and positively associated with fatigue, insom-nia, nausea and vomiting in CSs with 1–2 CCDs. How-ever, there was no statistically significant difference in the HRQOL among the patients without CCDs. Previ-ous studies showed that CCDs have significantly negative influence on HRQOL in CSs [49, 50], thus a phenomenon that the sedentary time has little effect on the HRQOL in CSs without CCDs may be because they originally have better HRQOL than those with CCDs. Therefore, more attention should be focused on integrating reducing sed-entary time intervention into routine care of CSs with CCDs. We suggest that CSs, especially those with CCDs, should reduce the time spent on sedentary behavior not only because of the adverse effect of sedentary behavior, but also because long sedentary time might displace the time otherwise engaged in PA.
With increasingly raised concern about the HRQOL of CSs, it is of great significance to find effective pub-lic health interventions to improve the HRQOL of CSs, especially those with CCDs. However, in China, the treatment of cancer, the management of CCDs and the behavioral interventions during cancer rehabilitation are frequently divided. We concluded that comprehensive

Page 10 of 12Yan et al. Health Qual Life Outcomes (2021) 19:213
cancer care must provide continuous management for the CCDs of CSs in order to provide effective public health interventions. For CSs with ≤ 2 CCDs, higher level of PA should be suggested to improve overall HRQOL within the acceptable range of the body. On the contrary, CSs with ≥ 3 CCDs engaging in HPAL had more severe symptoms and worse HRQOL. Reducing sedentary time especially in CSs with CCDs may help promote their overall health. Additionally, it is essential that healthcare professionals should pay more attention to promotion and education of health knowledge of CSs, and to give different degrees of CCDs of CSs targeted care and health advice to promote their health through the management of complications.
There are also a number of important limitations that should be mentioned. First, the members of SCRC who did not attended in this investigation due to various of reasons were not included, which may cause selection bias to some extent. CSs who have severe illness, a rap-idly progressing cancer or have short survival time may be excluded from this investigation, resulting in selection bias. Second, as an observational study, our study can only describe the association between PA, sedentary time and HRQOL rather than the effect of the two study fac-tors on HRQOL of CSs. Third, the classification of CCDs includes a range of diseases, and we just collected the information about whether the participants had at least one disease of each CCDs based on existing clinical diag-nosis. However, we don’t know the specific number and name of comorbidity. Therefore, the real association of PA and sedentary time with HRQOL with exact number of CCDs is unclear. Future study and survey are needed to explore the exact associations between factors above.
ConclusionIn summary, our study suggests that CSs with CCDs, especially those with ≥ 3 CCDs, deserve more atten-tion during rehabilitating. HPAL and long sedentary time have negative influence on HRQOL of CSs with ≥ 3 CCDs, while HPAL is positively associated with HRQOL in CSs with ≤ 2 CCDs. Therefore, comprehensive man-agement of CCDs and targeted behavioral interven-tion seem to be of great significance to provide cancer patients with better health care service. Appropriate adjustment of PA level and sedentary behavior according to the number of CCDs may be an effective public health intervention to improve the HRQOL of CSs. Further-more, our results offer a reference for further studies of the causal association between PA, sedentary times and HRQOL in CSs with different number of CCDs.
AbbreviationsCS: Cancer survivor; HRQOL: Health-related quality of life; PA: Physical activity; CCD: Comorbid chronic disease; SCRC : Shanghai Cancer Rehabilitation Club; BMI: Body mass index; IPAQ: Physical activity questionnaire; HPAL: High physi-cal activity level; MPAL: Moderate physical activity level; LPAL: Low physical activity level; EORTC QLQ-C30: European Organization for Research and Treat-ment of Cancer Quality of Life Questionnaire-Core30.
AcknowledgementsWe are grateful to all involved CSs to participate in this study. We also thank all workers and volunteers involved in the acquisition of data.
Authors’ contributionsJMY, JWW and RY took part in the questionnaire design and data curation. JMY, JWW, RY and CBB participated in statistical analysis and original draft writing. All authors participated in the investigation and questionnaire entry. All authors read and approved the final manuscript.
FundingThis study was supported by the Shanghai Public Health Key Discipline Plan (Nos.12GWZX0901, 15GWZK1001).
Availability of data and materialsThe datasets used and/or analysed during the current study are available from the corresponding author on reasonable request.
Ethics approval and consent to participateEthical approval to conduct this study was granted by the Medical Research Ethics Committee of the School of Public Health, Fudan University (The inter-national registry Nos. IRB00002408, FWA00002399). All participants provided written informed consent.
Consent for publicationNot applicable.
Competing interestsThe authors declare that they have no competing interests.
Author details1 Institute of Clinical Epidemiology, Key Laboratory of Public Health Safety, Ministry of Education, Key Lab of Health Technology Assessment of Ministry of Health, School of Public Health, Fudan University, 130 Dong-An Road, Shanghai 200032, China. 2 The First Affiliated Hospital of Zhengzhou Univer-sity, Zhengzhou 450052, Henan, China.
Received: 2 December 2019 Accepted: 23 September 2020
References 1. Marzorati C, Riva S, Pravettoni G. Who is a cancer survivor? A systematic
review of published definitions. J Cancer Educ. 2017;32(2):228–37. 2. Feng RM, Zong YN, Cao SM, Xu RH. Current cancer situation in China:
good or bad news from the 2018 Global Cancer Statistics? Cancer Com-mun (Lond). 2019;39(1):22.
3. Zeng H, Chen W, Zheng R, Zhang S, Ji JS, Zou X, Xia C, Sun K, Yang Z, Li H, et al. Changing cancer survival in China during 2003–15: a pooled analysis of 17 population-based cancer registries. Lancet Glob Health. 2018;6(5):e555–67.
4. Kim KH, Cho YY, Shin DW, Lee JH, Ko YJ, Park SM. Comparison of physical and mental health status between cancer survivors and the general population: a Korean population-based survey (KNHANES II–IV). Support Care Cancer. 2013;21(12):3471–81.
5. Miller KD, Nogueira L, Mariotto AB, Rowland JH, Yabroff KR, Alfano CM, Jemal A, Kramer JL, Siegel RL. Cancer treatment and survivorship statis-tics, 2019. CA Cancer J Clin. 2019;69(5):363–85.
6. Panzini RG, Mosqueiro BP, Zimpel RR, Bandeira DR, Rocha NS, Fleck MP. Quality-of-life and spirituality. Int Rev Psychiatry. 2017;29(3):263–82.
Page 11 of 12Yan et al. Health Qual Life Outcomes (2021) 19:213
7. Di Maio M. Quality of life: an important element of treatment value. Lancet Oncol. 2017;18(12):1557–8.
8. Karimi M, Brazier J. Health, health-related quality of life, and quality of life: What is the difference? Pharmacoeconomics. 2016;34(7):645–9.
9. Ebrahim S. Clinical and public health perspectives and applica-tions of health-related quality of life measurement. Soc Sci Med. 1995;41(10):1383–94.
10. Peters E, Mendoza SL, Reuss-Borst M. Quality of life after cancer—how the extent of impairment is influenced by patient characteristics. BMC Cancer. 2016;16(1):787.
11. Montazeri A. Quality of life data as prognostic indicators of survival in cancer patients: an overview of the literature from 1982 to 2008. Health Qual Life Outcomes. 2009;7:102.
12. Jones LW, Demark-Wahnefried W. Diet, exercise, and complemen-tary therapies after primary treatment for cancer. Lancet Oncol. 2006;7(12):1017–26.
13. Davies NJ, Batehup L, Thomas R. The role of diet and physical activity in breast, colorectal, and prostate cancer survivorship: a review of the literature. Br J Cancer. 2011;105(Suppl 1):S52–73.
14. Craft LL, Vaniterson EH, Helenowski IB, Rademaker AW, Courneya KS. Exercise effects on depressive symptoms in cancer survivors: a sys-tematic review and meta-analysis. Cancer Epidemiol Biomarkers Prev. 2012;21(1):3–19.
15. Lynch BM, Dunstan DW, Vallance JK, Owen N. Don’t take cancer sitting down: a new survivorship research agenda. Cancer Am Cancer Soc. 2013;119(11):1928–35.
16. Matthews CE, Chen KY, Freedson PS, Buchowski MS, Beech BM, Pate RR, Troiano RP. Amount of time spent in sedentary behaviors in the United States, 2003–2004. Am J Epidemiol. 2008;167(7):875–81.
17. Kim RB, Phillips A, Herrick K, Helou M, Rafie C, Anscher MS, Mikkelsen RB, Ning Y. Physical activity and sedentary behavior of cancer survivors and non-cancer individuals: results from a national survey. PLoS ONE. 2013;8(3):e57598.
18. Lynch BM, Cerin E, Owen N, Hawkes AL, Aitken JF. Television viewing time of colorectal cancer survivors is associated prospectively with quality of life. Cancer Causes Control. 2011;22(8):1111–20.
19. Sarfati D, Koczwara B, Jackson C. The impact of comorbidity on cancer and its treatment. CA Cancer J Clin. 2016;66(4):337–50.
20. Lee L, Cheung WY, Atkinson E, Krzyzanowska MK. Impact of comorbidity on chemotherapy use and outcomes in solid tumors: a systematic review. J Clin Oncol. 2011;29(1):106–17.
21. Rizzuto D, Melis R, Angleman S, Qiu C, Marengoni A. Effect of chronic diseases and multimorbidity on survival and functioning in elderly adults. J Am Geriatr Soc. 2017;65(5):1056–60.
22. Christofoletti M, Del DG, Da SK, Meneghini V, Malta DC. Physical inactivity, television time and chronic diseases in Brazilian adults and older adults. Health Promot Int. 2020;35(2):352–61.
23. Kang DW, Lee EY, An KY, Min J, Jeon JY, Courneya KS. Associations between physical activity and comorbidities in Korean cancer survivors. J Cancer Surv. 2018;12(4):441–9.
24. Beyer K, Szabo A, Hoormann K, Stolley M. Time spent outdoors, activ-ity levels, and chronic disease among American adults. J Behav Med. 2018;41(4):494–503.
25. Rothrock NE, Hays RD, Spritzer K, Yount SE, Riley W, Cella D. Relative to the general US population, chronic diseases are associated with poorer health-related quality of life as measured by the Patient-Reported Outcomes Measurement Information System (PROMIS). J Clin Epidemiol. 2010;63(11):1195–204.
26. McDaid O, Hanly MJ, Richardson K, Kee F, Kenny RA, Savva GM. The effect of multiple chronic conditions on self-rated health, disability and quality of life among the older populations of Northern Ireland and the Republic of Ireland: a comparison of two nationally representative cross-sectional surveys. BMJ Open. 2013;3(6):1.
27. Hagströmer M, Oja P, Sjöström M. The International Physical Activity Questionnaire (IPAQ): a study of concurrent and construct validity. Public Health Nutr. 2006;9(6):755–62.
28. Macfarlane D, Chan A, Cerin E. Examining the validity and reliability of the Chinese version of the International Physical Activity Questionnaire, long form (IPAQ-LC). Public Health Nutr. 2011;14(3):443–50.
29. Ren YJ, Su M, Liu QM, Tan YY, Du YK, Li LM, Lyu J. Validation of the simplified Chinese-character version of the international physical
activity questionnaire-long form in urban community-dwelling adults: a cross-sectional study in Hangzhou, China. Biomed Environ Sci. 2017;30(4):255–63.
30. Aaronson NK, Ahmedzai S, Bergman B, Bullinger M, Cull A, Duez NJ, Filiberti A, Flechtner H, Fleishman SB, de Haes JC, et al. The European Organization for Research and Treatment of Cancer QLQ-C30: a quality-of-life instrument for use in international clinical trials in oncology. J Natl Cancer Inst. 1993;85(5):365–76.
31. Wan C, Meng Q, Yang Z, Tu X, Feng C, Tang X, Zhang C. Validation of the simplified Chinese version of EORTC QLQ-C30 from the measurements of five types of inpatients with cancer. Ann Oncol. 2008;19(12):2053–60.
32. Zhao H, Kanda K. Testing psychometric properties of the standard Chinese version of the European Organization for Research and Treat-ment of Cancer Quality of Life Core Questionnaire 30 (EORTC QLQ-C30). J Epidemiol. 2004;14(6):193–203.
33. Demark-Wahnefried W, Aziz NM, Rowland JH, Pinto BM. Riding the crest of the teachable moment: promoting long-term health after the diagno-sis of cancer. J Clin Oncol. 2005;23(24):5814–30.
34. Shin WK, Song S, Jung SY, Lee E, Kim Z, Moon HG, Noh DY, Lee JE. The association between physical activity and health-related qual-ity of life among breast cancer survivors. Health Qual Life Outcomes. 2017;15(1):132.
35. Gopalakrishna A, Longo TA, Fantony JJ, Harrison MR, Inman BA. Physical activity patterns and associations with health-related quality of life in bladder cancer survivors. Urol Oncol. 2017;35(9):540–1.
36. Sweegers MG, Altenburg TM, Chinapaw MJ, Kalter J, Verdonck-de LI, Courneya KS, Newton RU, Aaronson NK, Jacobsen PB, Brug J, et al. Which exercise prescriptions improve quality of life and physical function in patients with cancer during and following treatment? A systematic review and meta-analysis of randomised controlled trials. Br J Sports Med. 2018;52(8):505–13.
37. Brown JC, Damjanov N, Courneya KS, Troxel AB, Zemel BS, Rickels MR, Ky B, Rhim AD, Rustgi AK, Schmitz KH. A randomized dose–response trial of aerobic exercise and health-related quality of life in colon cancer survivors. Psychooncology. 2018;27(4):1221–8.
38. D’Silva A, Gardiner PA, Boyle T, Bebb DG, Johnson ST, Vallance JK. Associa-tions of objectively assessed physical activity and sedentary time with health-related quality of life among lung cancer survivors: a quantile regression approach. Lung Cancer. 2018;119:78–84.
39. George SM, Alfano CM, Groves J, Karabulut Z, Haman KL, Murphy BA, Mat-thews CE. Objectively measured sedentary time is related to quality of life among cancer survivors. PLoS ONE. 2014;9(2):e87937.
40. Schmitz KH, Courneya KS, Matthews C, Demark-Wahnefried W, Galvão DA, Pinto BM, Irwin ML, Wolin KY, Segal RJ, Lucia A, et al. American Col-lege of Sports Medicine roundtable on exercise guidelines for cancer survivors. Med Sci Sports Exerc. 2010;42(7):1409–26.
41. Yasunaga A, Shibata A, Ishii K, Inoue S, Sugiyama T, Owen N, Oka K. Replacing sedentary time with physical activity: effects on health-related quality of life in older Japanese adults. Health Qual Life Outcomes. 2018;16(1):240.
42. Chang YL, Tsai YF, Hsu CL, Chao YK, Hsu CC, Lin KC. The effectiveness of a nurse-led exercise and health education informatics program on exercise capacity and quality of life among cancer survivors after esophagectomy: a randomized controlled trial. Int J Nurs Stud. 2020;101:103418.
43. Uster A, Ruehlin M, Mey S, Gisi D, Knols R, Imoberdorf R, Pless M, Ballmer PE. Effects of nutrition and physical exercise intervention in palliative can-cer patients: a randomized controlled trial. Clin Nutr. 2018;37(4):1202–9.
44. Tuteja AK, Talley NJ, Joos SK, Woehl JV, Hickam DH. Is constipation associ-ated with decreased physical activity in normally active subjects? Am J Gastroenterol. 2005;100(1):124–9.
45. Adamsen L, Quist M, Andersen C, Møller T, Herrstedt J, Kronborg D, Baadsgaard MT, Vistisen K, Midtgaard J, Christiansen B, et al. Effect of a multimodal high intensity exercise intervention in cancer patients under-going chemotherapy: randomised controlled trial. BMJ. 2009;339:b3410.
46. Wilson PB. Associations between physical activity and constipation in adult Americans: results from the National Health and Nutrition Examina-tion Survey. Neurogastroenterol Motil. 2020;32(5):e13789.
47. Emmanuel A, Mattace-Raso F, Neri MC, Petersen KU, Rey E, Rogers J. Constipation in older people: a consensus statement. Int J Clin Pract. 2017;71(1):e12920.

Page 12 of 12Yan et al. Health Qual Life Outcomes (2021) 19:213
• fast, convenient online submission
•
thorough peer review by experienced researchers in your field
• rapid publication on acceptance
• support for research data, including large and complex data types
•
gold Open Access which fosters wider collaboration and increased citations
maximum visibility for your research: over 100M website views per year •
At BMC, research is always in progress.
Learn more biomedcentral.com/submissions
Ready to submit your researchReady to submit your research ? Choose BMC and benefit from: ? Choose BMC and benefit from:
48. Nakano J, Hashizume K, Fukushima T, Ueno K, Matsuura E, Ikio Y, Ishii S, Morishita S, Tanaka K, Kusuba Y. Effects of aerobic and resistance exercises on physical symptoms in cancer patients: a meta-analysis. Integr Cancer Ther. 2018;17(4):1048–58.
49. Wang JW, Gong XH, Ding N, Chen XF, Sun L, Tang Z, Yu DH, Yuan ZP, Wang XD, Yu JM. The influence of comorbid chronic diseases and physical activ-ity on quality of life in lung cancer survivors. SUPPORT CARE CANCER. 2015;23(5):1383–9.
50. Wang JW, Sun L, Li J, Cong XH, Chen XF, Tang Z, Yu DH, Zhang TR, Luo ZN, Yuan ZP, et al. Comorbid chronic diseases and their associations with
quality of life among gynecological cancer survivors. BMC Public Health. 2015;15:965.
Publisher’s NoteSpringer Nature remains neutral with regard to jurisdictional claims in pub-lished maps and institutional affiliations.