reservoir simulation study for co2 sequestration in · pdf fileinternational journal of...
TRANSCRIPT

International Journal of Applied Science and Technology Vol. 5, No. 4; August 2015
30
Reservoir Simulation Study for CO2 Sequestration in Saline Aquifers
Chawarwan Khan
Lei Ge
Victor Rudolph
School of Chemical Engineering University of Queensland
Australia Abstract
Sequestration of carbon dioxide in geological formations has been recognised as one of the most promising ways to cope with greenhouse gas emissions, and saline aquifers are one of the potential storage target. This study evaluates feasibility of CO2storage in saline aquifers under different conditions. Simulation studies are carried out based on a homogeneous aquifer model. Compositional reservoir simulator (CMG-GEM) was used to simulate 10 years of CO2 injection phase and simulate the fate of CO2 post injection from hundreds to thousands of years. Different subsets of sensitive parameters are independently investigated to understand the impact of various parameter son different trapping mechanisms. Simulation results are also compared with other published research studies to provide additional insight of factors affecting CO2sequestration process.
Keywords: CO2 injection, solubility trapping, residual trapping, mineral trapping
1. Introduction
1.1 Theory Background
The permanent sequestration of CO2 captured from power stations and industrial sources is one of the major options for reducing greenhouse gas emissions. Injection into petroleum reservoirs is widely considered the most promising method, since it is an established practice for enhancing oil recovery, and the storage site is well characterised and known to be secure against gas leakage (Condor et al. 2010). The process has provided confidence that long term storage is possible in appropriate selected geological storage reservoirs (Benson 2006). Another candidate system for CO2 injection is into saline aquifers. These have the advantages of having very large capacity, are broadly distributed and most importantly they underlie most CO2 emission sources (Hitchon et al. 1996). Estimates of worldwide sequestration capacity is large, with saline aquifers having he biggest potential capacity, followed by oil and gas reservoirs and then coal bed methane reservoirs (IPCC 2005). Furthermore, CO2 is a promising candidate for geo-sequestration since it has high solubility in water and a high density as a supercritical fluid at reasonable depths (>800m) where pressures are relatively high (Bachu and Adams 2003; Bachu 2008).
1.2 Storage Mechanisms
CO2 injection into aquifers for sequestration purposes is trapped through different mechanisms namely, structural, residual, solubility and mineral trapping (IPCC 2005; Bachu 2003). These processes may be tracked through numerical models that have been developed to predict the extent of each trapping mechanism under different conditions of interest (Prevost et al. 2005). In almost all cases the CO2 would be injected as a supercritical fluid (scCO2). As injection of CO2 proceeds, at the start, the CO2 saturates the interstitial space in the zone around the well as it displaces brine. Generally, the CO2 injection is into the lowest layers of reservoir, since this provides a number of advantages, mainly more effective brine ‘drainage’ (through buoyant displacement). The scCO2 density is much less than the brine, so it rises under buoyancy until a geological seal layer is reached (Bachu 2008). The CO2 pools under the seal layer and is retained by way of the structure trapping mechanism (Bachu et al. 2007). In addition, some dissolution of CO2 occurs into formation water whenever the phases are in contact. This CO2 is stored through the solubility trapping mechanism (Bachu et al. 1994).
ISSN 2221-0997 (Print), 2221-1004 (Online) © Center for Promoting Ideas, USA www.ijastnet.com
31
As CO2dissolves into the brine according to local pressure, temperature and salinity conditions (Nghiem et al. 2004), the brine density increases, and the CO2 heavy saturated brine moves downwards under gravity, causing some mixing and potentially exposing additional unsaturated brine to scCO2. This enhances solubility trapping and changes the extent of the CO2 plume. The higher density fluids re-imbibe into the lower parts of the scCO2 plume where there are layers of higher permeability trapping and immobilising CO2 pockets within a continuous brine (liquid) phase (Bachu 2008; Juanes et al. 2006). This CO2 is trapped under the residual mechanism, an important process when considering the long term fate of the CO2 (Bachu et al. 2007). Some dissolved CO2 dissociates into bicarbonate in the aqueous brine and these react species present in the fluid and rock resulting in dissolution and precipitation of different minerals (Gunter et al.1993). These geo-chemical reactions of CO2_Brine_Rock result in carbonate precipitates, designated mineral trapping (Bachu and Adams 2003). The mineral trapping reactions may be very slow, even hundreds of years, but is considered to be the safest mechanism for CO2 storage because of the stability of the precipitates. The scCO2 directly under the cap rock probably remains as fluid pool in the reservoir and due to its buoyancy seeks to rise, where opportunity presents. This poses a risk of leakage of this fluid depending on the cap rock properties of the reservoir. In a suitable sequestration site, cap rock should have very low permeability and very high water retention by capillarity. Even so, it may be expected that a fraction of the CO2 will diffuse into the cap rock (Bildstein 2010). The security of the storage depends entirely on the integrity of the seal over long period of time (Kumar et al. 2005), including that there are no natural fractures fissures or high permeability gaps in the cap.
1.3 Literature Review of Relevant Simulation Studies
Simulation of CO2 geo-sequestration into saline reservoirs, has received considerable research attention and there are a variety of studies reported in the literature, examining different aspects and perspective. In general, while there may be some differences in detail (e.g., different reservoir characteristics, rock or/and fluid models) the outcomes are broadly consistent. This section presents a brief summary of some of the published studies that cover topics related to the objectives of this study. These also provide a basis for comparing the case studies conducted here to provide insights regarding CO2 injection and long term geological storage. Ghanbari et al. (2006) simulated an example aquifer for CO2 injection. The objective of the study was to investigate key parameters that affect the solubility trapping mechanism, in particular the effect of convective flow patterns. The study concluded which cases potentially maximise solubility trapping and also noted that the buoyancy drive caused by density differences enhances the CO2 dissolution process. Ukaegbu et al. (2009) also presents an aquifer simulation model for CO2 injection. The study examined effects of different parameters on CO2 storage and the hysteresis effect on solubility trapping mechanisms. The primary focus of this study was to illustrate the distribution of CO2 between the gaseous and aqueous phases under different aquifer conditions. The results suggested that hysteresis effects decrease CO2 dissolution. Heterogeneity is important in simulation models, since permeability changes lateral migration behaviour of the CO2 plume, especially where shales or mudstones layers create baffles above the layers where CO2 is injected.
Both simulation studies (Ghanbari et al. 2006) and (Ukaegbu et al. 2009) used the generalized equation-of-state model–greenhouse gas (GEM-GHG) software package from Computer Modelling Group (CMG). Neither attempted to simulate mineral trapping Nghiem et al. (2004) describe a fully coupled geochemical process for simulating CO2 sequestration in saline aquifers also using GEM-CMG. The primary objective of their study focused on mineral dissolution and precipitation kinetics. The study also considered convection of high density plumes of brine saturated with CO2 and CO2 mineralisation in the formation around the plumes. Nghiem et al. (2004) showed that CO2 trapped by mineral trapping is less than soluble trapping at early stage of evaluation and mineralisation takes thousands of years to be fully realised. Pruess et al. (2003) simulated aquifer disposal of CO2 using the TOUGHREACT simulator. The study investigated both mineral and solubility trapping mechanisms, and illuminated porosity and permeability changes that occur during trapping processes. The results suggested that under favourable conditions the amount of CO2 that could be sequestrated by mineralisation is comparable and can even be bigger to the amount of CO2 that could be dissolved and held through solubility trapping. This conclusion was supported in a study conducted by (Xu et al. 2003). The studies of (Pruess et al. 2003) and (Xu et al. 2003) did not consider the effects of buoyancy as pointed out by (Ghanbari et al. 2006). Izgec et al. (2008) used CMG-STARS, a compositional and thermal reservoir simulator to model an aquifer for CO2 injection coupled with geochemical changes. The results suggested that the CO2 solubility trapping is larger than mineral trapping.

International Journal of Applied Science and Technology Vol. 5, No. 4; August 2015
32
Law et al. (1995) simulated carbonate Nisku and Glauconitic sandstone aquifers by using the CMG-STARS simulator. The objective of their study was to investigate the capacity of these two aquifers to accept large quantities of CO2 and retain the injected CO2 for long periods of time. Since their study mainly was investigating injectivity, residual and mineral trapping mechanisms were ignored. Ide et al. (2007) simulated an aquifer to investigate residual trapping (including hysteresis effects) using the Eclipse simulator. The results indicated that significant amounts of the injected CO2 will be trapped and that this trapping mechanism operates relatively quickly. In addition, the authors illustrated that aquifer inclination leads to enhance residual trapping mechanism. Flett et al. (2007) compared homogeneous and heterogeneous aquifer effects on residual trapping using the CHEARS black oil simulator. The reported results from this study showed that an increase in heterogeneity could delay residual trapping of CO2, as plume migration through such formations might be severely inhibited. Flett et al. (2007) also stated that the impact of heterogeneity needs be considered in CO2 storage modelling for more accurate results and this applies also to the formation seal., Hovorka et al. (2004) using TOUGH2 simulator on a heterogeneous sandstone aquifer (Frio Framtion/Texas) supported this conclusion by stating the heterogeneity dominates the CO2 plume behaviour since its migration is overwhelmingly permeability dependant.
Mo and Akervoll (2005) simulated geo-sequestration in an aquifer using Eclipse for both solubility and residual trapping mechanisms. The simulation results suggested that solubility trapping dominates CO2 storage. In addition, Mo and Akervoll (2005) noted that an increase in anisotropy permeability ratio (Kv/Kh) leads to a decrease in the amount of CO2 trapped by residual trapping. Doughty (2006) conducted simulation studies to investigate residual trapping by using TOUGH2. He concluded that a hysteresis model should be used for aquifer simulations, since it more accurately captures the behaviour of the CO2 plume and potentially also provides support for applications in geological settings where structural traps are absent or uncertain. Ozah et al. (2005) used the GEM-GHG simulator to study the sensitivity of CO2 storage by considering three trapping mechanisms (residual, solubility and mineral trapping). The study concluded that the amount of CO2 sequestered by mineral trapping is smaller than the other mechanisms, even over long timescales. In addition, horizontal wells could be effective in minimising gas loss from the aquifer and benefit trapping. Kumar et al. (2005) studied CO2 storage in deep saline aquifers using GEM-CMG for three tapping mechanisms. They suggested that residual gas saturation contributes an important role in solubility trapping. Further, under some circumstances CO2 storage by residual trapping (hysteresis included) can be larger than that due to solubility and mineral trapping. Pruess and Xu (2007) used TOUGHREACT to investigate residual gas saturation effects on CO2 dissolution. The result accorded with the study by Kumar et al. (2005). In addition,
Audigane et al. (2007) reported that Ennis-King et al., (2002) investigated effects of residual water saturation on CO2 dissolution, and concluded that solubility trapping was more important than the residual gas. Nghiem et al. (2010) also investigated the relationship between solubility and residual trapping based on various isotropic horizontal and vertical permeability values. The results suggested that these two mechanisms are competing storage processes (Nghiem et al. 2010). For example, increase in CO2 storage under residual trapping leads to have less CO2 available in the formation as a free phase and result in CO2 solubility reduction. Kumar and Bryan (2008) conducted simulation studies particularly to investigate the plume behaviour and CO2 trapping under different injection strategies. They reported that, for horizontal wells, residual trapping occurs along the well length direction. With a horizontally elongated plume which migrates vertically. This arrangement reduces trapping in lateral direction, unless the well length is very long. Sifuentes et al, 2009 simulated aquifers using ECLIPSE to assess the factors contributing to uncertainty during CO2 injection and storage. They show that dissolution trapping is dominated by horizontal permeability and that residual trapping is affected by the controls on residual gas saturation. Juanes et al. (2006) simulated a saline aquifer for CO2 injection using ECLIPSE. The purpose of the study was investigating the impact of relative permeability hysteresis on CO2 storage. The simulation results suggested that accounting for hysteresis effects is necessary since it attempts to reduce CO2 migration and accumulated CO2 along the seal layer.
2. Aquifer Model Development
2.1 Simulation of Geological Model
The GEM simulation package Computer Modelling Group (CMG-GEM 2012) is used here for the simulation. The built in grid building module “Builder” generates the geological model of the reservoir, in this case a simple three-dimensional Cartesian geometry.
ISSN 2221-0997 (Print), 2221-1004 (Online) © Center for Promoting Ideas, USA www.ijastnet.com
33
A limited size (9000 grid blocks) though not descriptive of any ‘real’ reservoir, is sufficient for our purpose which is to provide insight into the sensitivities of the different trapping mechanisms to changes in the system inputs which are varied individually and systematically. The grid has 30 blocks in the ‘I’ direction, 30 blocks in ‘J’ direction and 10 blocks in ‘K’ “vertical” direction, making up the 9000 grid blocks. The size of the blocks is arbitrary, but is assigned length and width of 70 m each, and 30m vertically. The fluid flow comprises two fluid phases, namely CO2 and saline water. The reservoir is isothermal at 45 0C. The depth of the top layer of the reservoir is taken to be 1265 m with the pressure of 12400 kPag which keeps CO2 condition as supercritical (Table 1).
Table 1: Aquifer Properties for the Initial Condition
Aquifer Property Value Reservoir depth 1265 m Aquifer Thickness (z direction) 300 m (10×30) Width “m” 1050 m (30×70) Length “m” 1050 Rock Compressibility 4.5×10⁻⁷ kPa-1 Initial reservoir temperature 45 0C Initial reservoir pressure 12400 kPa Diffusion coefficient for CO2 0.000028 cm2/s Salinity 10000 ppm Dip angle 0 degrees
2.1.1 Rock Property
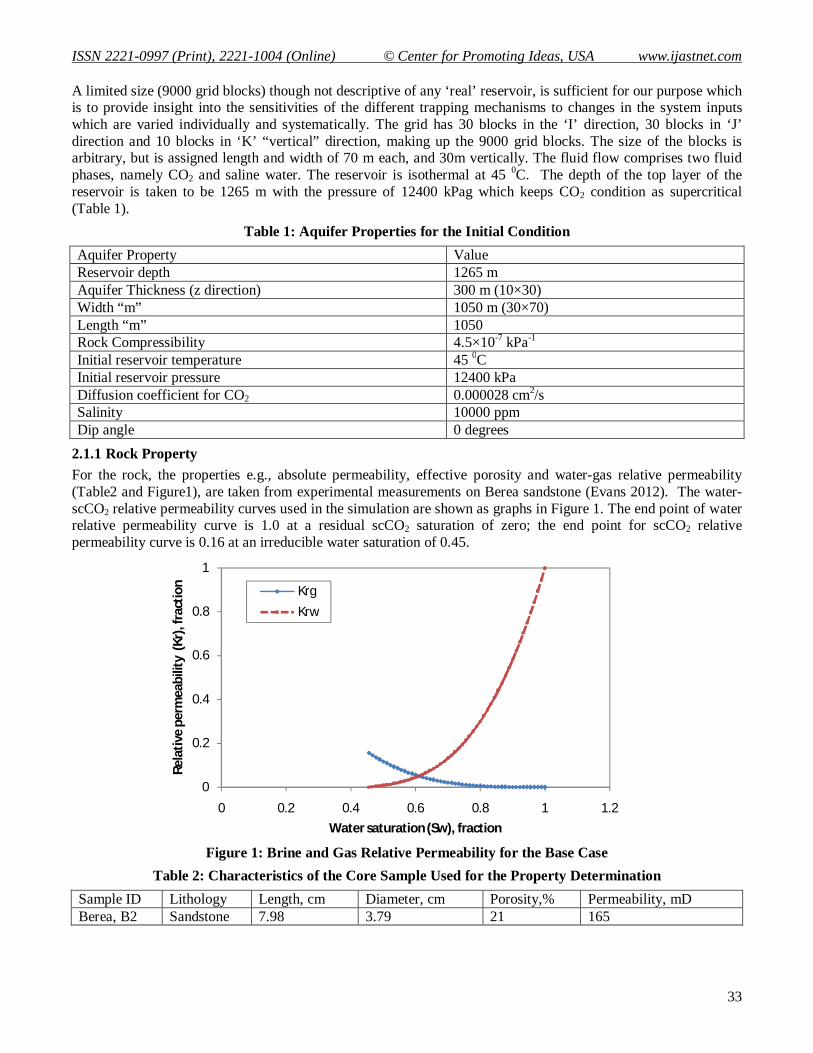
For the rock, the properties e.g., absolute permeability, effective porosity and water-gas relative permeability (Table2 and Figure1), are taken from experimental measurements on Berea sandstone (Evans 2012). The water-scCO2 relative permeability curves used in the simulation are shown as graphs in Figure 1. The end point of water relative permeability curve is 1.0 at a residual scCO2 saturation of zero; the end point for scCO2 relative permeability curve is 0.16 at an irreducible water saturation of 0.45.
Figure 1: Brine and Gas Relative Permeability for the Base Case
Table 2: Characteristics of the Core Sample Used for the Property Determination
Sample ID Lithology Length, cm Diameter, cm Porosity,% Permeability, mD Berea, B2 Sandstone 7.98 3.79 21 165
0
0.2
0.4
0.6
0.8
1
0 0.2 0.4 0.6 0.8 1 1.2
Rela
tive
perm
eabi
lity
(Kr)
, fra
ctio
n
Water saturation (Sw), fraction
KrgKrw
International Journal of Applied Science and Technology Vol. 5, No. 4; August 2015
34
2.1.2 Fluid Property
CMG-WinProp provides the phase behaviour and the properties of reservoir fluids (CMG-WinProp 2012). The formation is initially saturated with brine which includes a minimal trace of methane (C1) to facilitate convergence or computational stability (Ukaegbu et al., (2009); Ofori and Engler 2011; CMG-WinProp 2012). Under Winporp-GHG, For the CO2-Brine-C1 mixture the pure component C1 and CO2 properties and scCO2 phase density are estimated using Peng-Robinson Equation of State (Peng and Robinson 1976). CO2 solubility is modelled with Henry’s law (Li and Nghiem 1986) for brine at a salinity of 10000 ppm. The brine phase viscosity and density are estimated by using Rowe and Chou (1970) correlation and Kestin et al. (1981) correlation, respectively. The scCO2 viscosity is predicted from the Jossi, Stiel and Thodos correlation (Reid et al. 1977).
2.1.3 Well Recurrent
A single injector in the middle of the aquifer is used and completed in the bottom layers (layers 8, 9 and10). The injection well works under two constraints: the primary constraint is a maximum injection rate of (89200 m3/day) at standard condition (SC); the secondary constraint is maximum bottom-hole pressure (28300 kPa -g), (Table 3).
Table 3: Parameters of the Injection well
Grids well completion (I, J; K) 15, 15, 8-10 Injection duration 10 years Well radius 0.0762 m Skin 0 CO2 mole fraction 1 Maximum Bottom-hole Pressure 28300 kPag Maximum injection rate (SC) 89200 m3/day
3. Simulation Strategy
The numerical simulation model is developed in two main categories, (1) hydrodynamic cases which correspond to structural, residual and dissolution trapping mechanisms, (2) geo-chemical cases, which correspond to the mineral trapping and coupled with the hydrodynamic trapping mechanisms. Different variables are then systematically altered to determine the effect of the parameter on various trapping mechanisms. The parameters are changed one at a time with the others held constant to isolate the different effects, although this loses interactions if two or more changes are made simultaneously.
3.1 Hydrodynamic Case Studies
3.1.1 Base Case
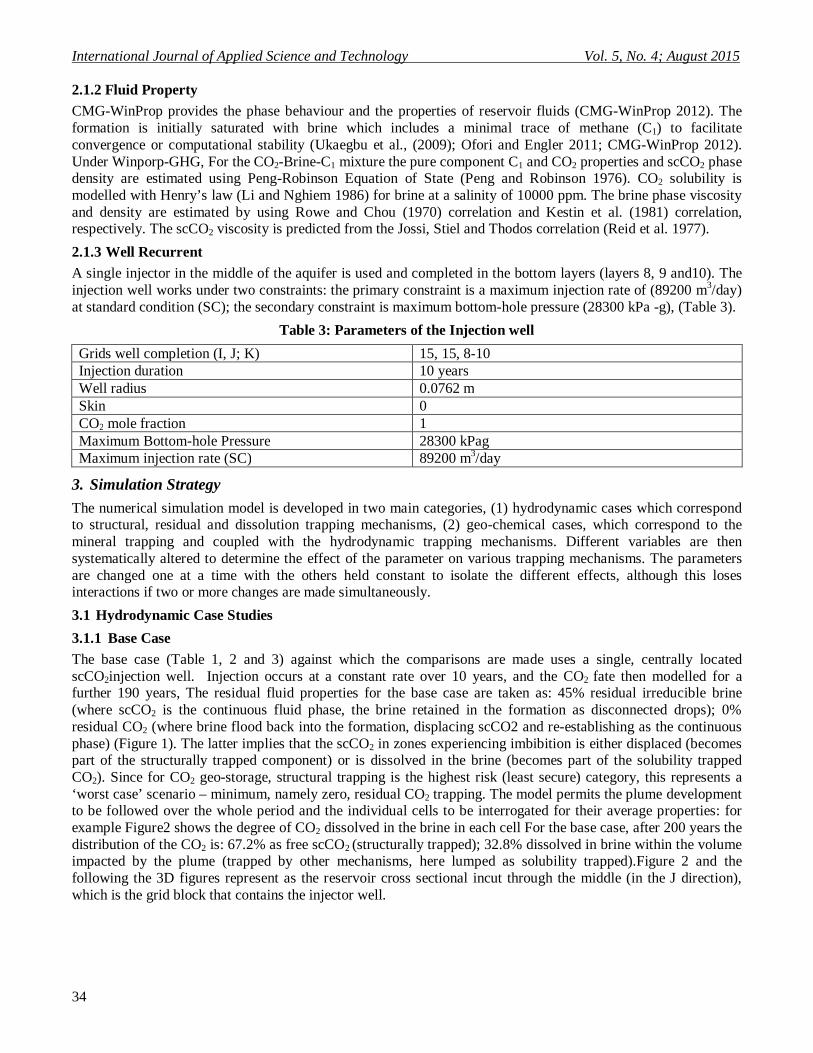
The base case (Table 1, 2 and 3) against which the comparisons are made uses a single, centrally located scCO2injection well. Injection occurs at a constant rate over 10 years, and the CO2 fate then modelled for a further 190 years, The residual fluid properties for the base case are taken as: 45% residual irreducible brine (where scCO2 is the continuous fluid phase, the brine retained in the formation as disconnected drops); 0% residual CO2 (where brine flood back into the formation, displacing scCO2 and re-establishing as the continuous phase) (Figure 1). The latter implies that the scCO2 in zones experiencing imbibition is either displaced (becomes part of the structurally trapped component) or is dissolved in the brine (becomes part of the solubility trapped CO2). Since for CO2 geo-storage, structural trapping is the highest risk (least secure) category, this represents a ‘worst case’ scenario – minimum, namely zero, residual CO2 trapping. The model permits the plume development to be followed over the whole period and the individual cells to be interrogated for their average properties: for example Figure2 shows the degree of CO2 dissolved in the brine in each cell For the base case, after 200 years the distribution of the CO2 is: 67.2% as free scCO2 (structurally trapped); 32.8% dissolved in brine within the volume impacted by the plume (trapped by other mechanisms, here lumped as solubility trapped).Figure 2 and the following the 3D figures represent as the reservoir cross sectional incut through the middle (in the J direction), which is the grid block that contains the injector well.
ISSN 2221-0997 (Print), 2221-1004 (Online) © Center for Promoting Ideas, USA www.ijastnet.com
35
(a) CO2 mole fraction during injection phase (b) CO2 mole fraction during post phase
Figure 2: Base-Case Profiles Showing CO2 Mole Fraction in Aqueous Phase
3.1.2 Effect of Changing System Properties
Injection is controlled at a constant rate, so the total quantity of CO2 placed into the reservoir is the same for all the cases examined. What changes is the extent to which each trapping mechanism contributes to the CO2 storage. This is important because structural trapping is less secure than solubility trapping in regards to long term storage security.
Horizontal permeability effects: For higher horizontal permeability (illustrated here using Kh = 350 mD) the plume spreads out more readily and contacts a larger volume of brine, resulting in more solution trapping (an increase of ~6% over the base case). The result is in agreement with the findings of Kumar et al. (2005) and Ofori and Engler (2011).
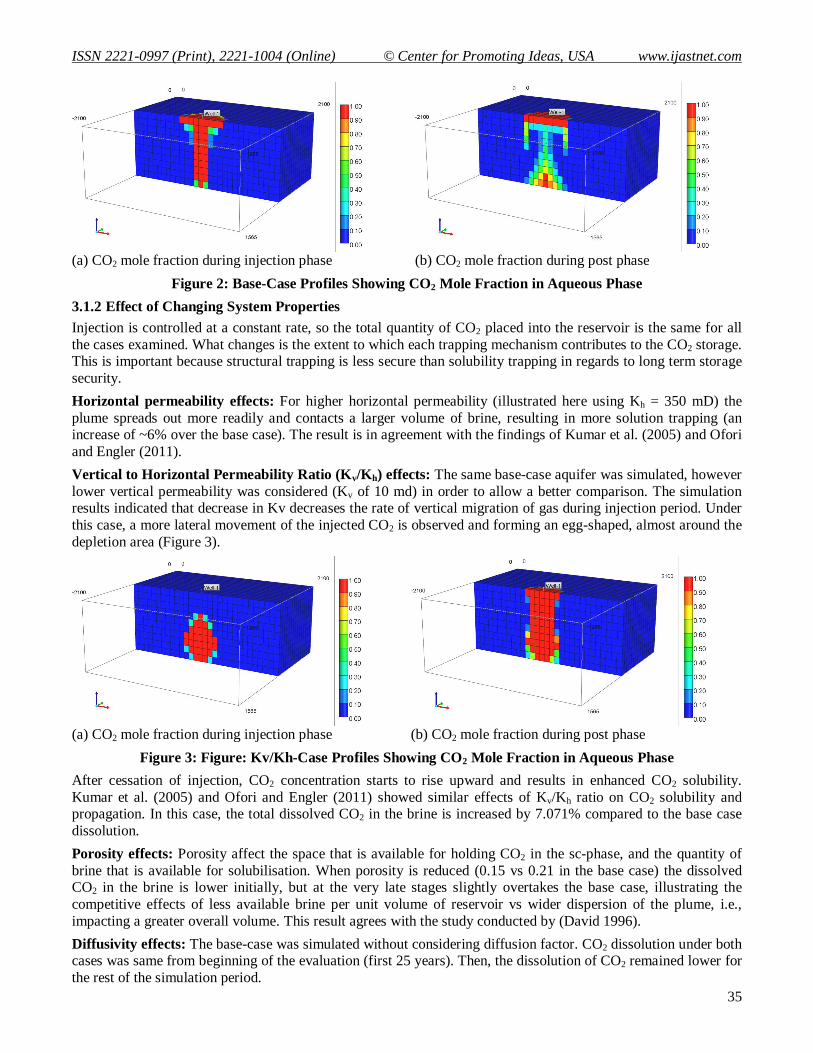
Vertical to Horizontal Permeability Ratio (Kv/Kh) effects: The same base-case aquifer was simulated, however lower vertical permeability was considered (Kv of 10 md) in order to allow a better comparison. The simulation results indicated that decrease in Kv decreases the rate of vertical migration of gas during injection period. Under this case, a more lateral movement of the injected CO2 is observed and forming an egg-shaped, almost around the depletion area (Figure 3).
(a) CO2 mole fraction during injection phase (b) CO2 mole fraction during post phase
Figure 3: Figure: Kv/Kh-Case Profiles Showing CO2 Mole Fraction in Aqueous Phase
After cessation of injection, CO2 concentration starts to rise upward and results in enhanced CO2 solubility. Kumar et al. (2005) and Ofori and Engler (2011) showed similar effects of Kv/Kh ratio on CO2 solubility and propagation. In this case, the total dissolved CO2 in the brine is increased by 7.071% compared to the base case dissolution.
Porosity effects: Porosity affect the space that is available for holding CO2 in the sc-phase, and the quantity of brine that is available for solubilisation. When porosity is reduced (0.15 vs 0.21 in the base case) the dissolved CO2 in the brine is lower initially, but at the very late stages slightly overtakes the base case, illustrating the competitive effects of less available brine per unit volume of reservoir vs wider dispersion of the plume, i.e., impacting a greater overall volume. This result agrees with the study conducted by (David 1996).
Diffusivity effects: The base-case was simulated without considering diffusion factor. CO2 dissolution under both cases was same from beginning of the evaluation (first 25 years). Then, the dissolution of CO2 remained lower for the rest of the simulation period.
International Journal of Applied Science and Technology Vol. 5, No. 4; August 2015
36
Overall, the dissolved CO2 in the formation is decreased by 0.621% compared to the base case at the end of post injection. That is, the dissolved CO2induceCO2concentration gradientsand causes CO2 to diffuse within the aquifer and observing more CO2concentration in the grid blocks. Similarly, a simulation study was performed by Ghanbari et al. (2006) and the result was consistent with this case study.
Salinity effects: Under a case where higher salinity (250,000 ppm) is considered, the base case was used to predict CO2 solubility in the aquifer and illustrate CO2 profiles during and after injection process. The results showed that higher salt loads lead to increase the density of the brine, which increases plume buoyancy and causes the scCO2 phase to rise more quickly; and it reduces the solubility of CO2 in the water phase (Alkan et al. 2010;Ofori and Engler 2011). The end result is a significant increase in structural trapping below the seal (a high risk trap) and a reduction in solubility trapping (a low risk mechanism).Accordingly, the dissolved CO2 in the brine is less than the base case by 20.21% at the end of post injection.
Temperature effects: The same mechanisms apply as for salinity, lower temperature increases the density of the water phase and reduces the solubility of the CO2 in it. A 10C reduction in reservoir temperature compared to the base case reduces the solubility trapped CO2 by about 1%.
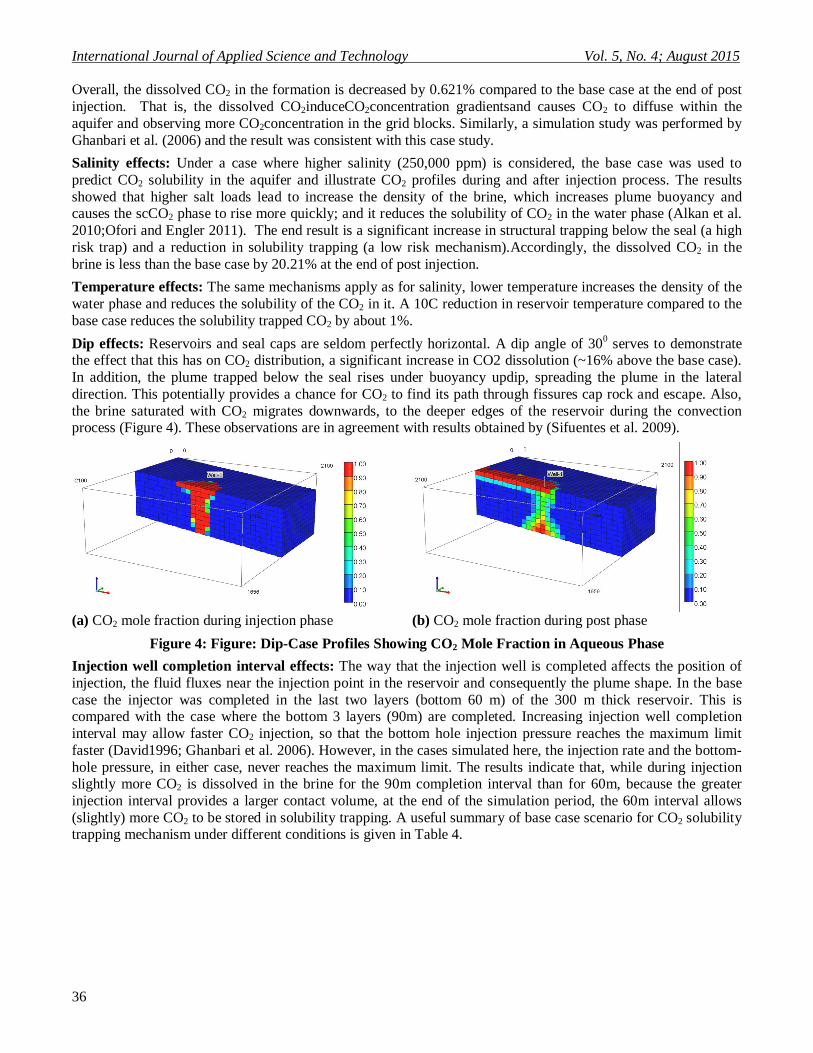
Dip effects: Reservoirs and seal caps are seldom perfectly horizontal. A dip angle of 300 serves to demonstrate the effect that this has on CO2 distribution, a significant increase in CO2 dissolution (~16% above the base case). In addition, the plume trapped below the seal rises under buoyancy updip, spreading the plume in the lateral direction. This potentially provides a chance for CO2 to find its path through fissures cap rock and escape. Also, the brine saturated with CO2 migrates downwards, to the deeper edges of the reservoir during the convection process (Figure 4). These observations are in agreement with results obtained by (Sifuentes et al. 2009).
(a) CO2 mole fraction during injection phase (b) CO2 mole fraction during post phase
Figure 4: Figure: Dip-Case Profiles Showing CO2 Mole Fraction in Aqueous Phase
Injection well completion interval effects: The way that the injection well is completed affects the position of injection, the fluid fluxes near the injection point in the reservoir and consequently the plume shape. In the base case the injector was completed in the last two layers (bottom 60 m) of the 300 m thick reservoir. This is compared with the case where the bottom 3 layers (90m) are completed. Increasing injection well completion interval may allow faster CO2 injection, so that the bottom hole injection pressure reaches the maximum limit faster (David1996; Ghanbari et al. 2006). However, in the cases simulated here, the injection rate and the bottom-hole pressure, in either case, never reaches the maximum limit. The results indicate that, while during injection slightly more CO2 is dissolved in the brine for the 90m completion interval than for 60m, because the greater injection interval provides a larger contact volume, at the end of the simulation period, the 60m interval allows (slightly) more CO2 to be stored in solubility trapping. A useful summary of base case scenario for CO2 solubility trapping mechanism under different conditions is given in Table 4.
ISSN 2221-0997 (Print), 2221-1004 (Online) © Center for Promoting Ideas, USA www.ijastnet.com
37
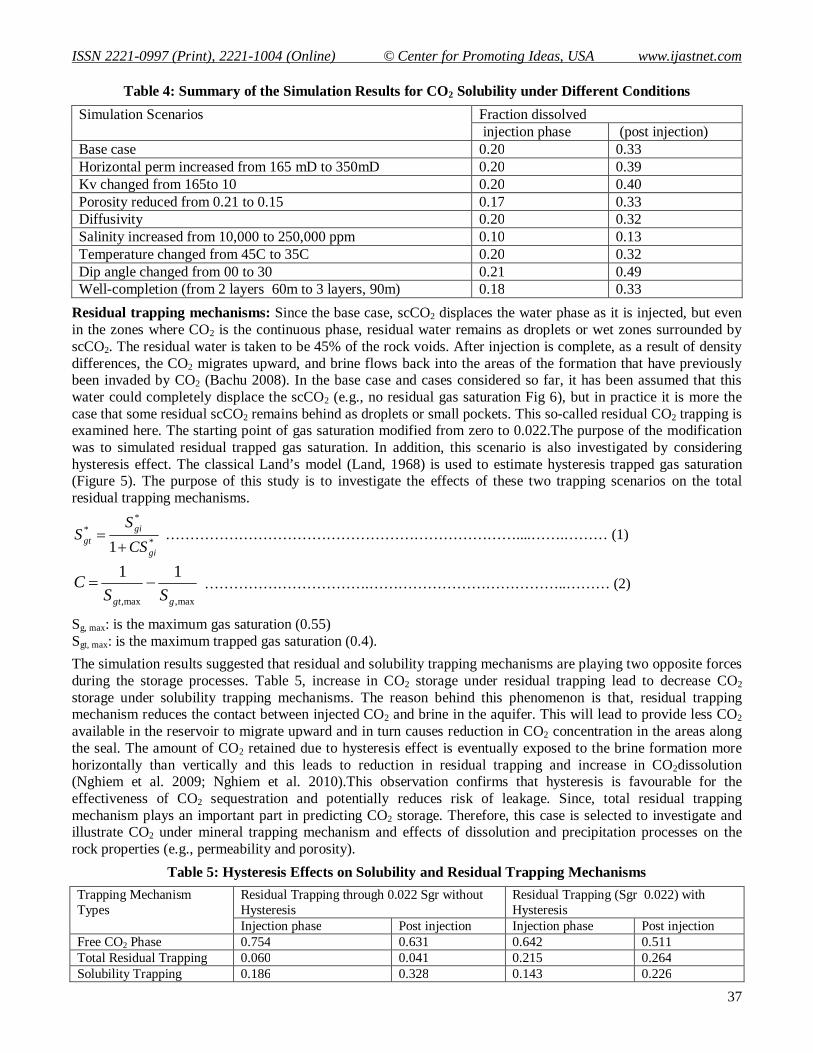
Table 4: Summary of the Simulation Results for CO2 Solubility under Different Conditions
Simulation Scenarios Fraction dissolved injection phase (post injection)
Base case 0.20 0.33 Horizontal perm increased from 165 mD to 350mD 0.20 0.39 Kv changed from 165to 10 0.20 0.40 Porosity reduced from 0.21 to 0.15 0.17 0.33 Diffusivity 0.20 0.32 Salinity increased from 10,000 to 250,000 ppm 0.10 0.13 Temperature changed from 45C to 35C 0.20 0.32 Dip angle changed from 00 to 30 0.21 0.49 Well-completion (from 2 layers 60m to 3 layers, 90m) 0.18 0.33
Residual trapping mechanisms: Since the base case, scCO2 displaces the water phase as it is injected, but even in the zones where CO2 is the continuous phase, residual water remains as droplets or wet zones surrounded by scCO2. The residual water is taken to be 45% of the rock voids. After injection is complete, as a result of density differences, the CO2 migrates upward, and brine flows back into the areas of the formation that have previously been invaded by CO2 (Bachu 2008). In the base case and cases considered so far, it has been assumed that this water could completely displace the scCO2 (e.g., no residual gas saturation Fig 6), but in practice it is more the case that some residual scCO2 remains behind as droplets or small pockets. This so-called residual CO2 trapping is examined here. The starting point of gas saturation modified from zero to 0.022.The purpose of the modification was to simulated residual trapped gas saturation. In addition, this scenario is also investigated by considering hysteresis effect. The classical Land’s model (Land, 1968) is used to estimate hysteresis trapped gas saturation (Figure 5). The purpose of this study is to investigate the effects of these two trapping scenarios on the total residual trapping mechanisms.
*
**
1 gi
gigt CS
SS
………………………………………………………………....…….……… (1)
max,max,
11
ggt SSC …………………………….…………………………………..……… (2)
Sg, max: is the maximum gas saturation (0.55) Sgt, max: is the maximum trapped gas saturation (0.4).
The simulation results suggested that residual and solubility trapping mechanisms are playing two opposite forces during the storage processes. Table 5, increase in CO2 storage under residual trapping lead to decrease CO2 storage under solubility trapping mechanisms. The reason behind this phenomenon is that, residual trapping mechanism reduces the contact between injected CO2 and brine in the aquifer. This will lead to provide less CO2 available in the reservoir to migrate upward and in turn causes reduction in CO2 concentration in the areas along the seal. The amount of CO2 retained due to hysteresis effect is eventually exposed to the brine formation more horizontally than vertically and this leads to reduction in residual trapping and increase in CO2dissolution (Nghiem et al. 2009; Nghiem et al. 2010).This observation confirms that hysteresis is favourable for the effectiveness of CO2 sequestration and potentially reduces risk of leakage. Since, total residual trapping mechanism plays an important part in predicting CO2 storage. Therefore, this case is selected to investigate and illustrate CO2 under mineral trapping mechanism and effects of dissolution and precipitation processes on the rock properties (e.g., permeability and porosity).
Table 5: Hysteresis Effects on Solubility and Residual Trapping Mechanisms
Trapping Mechanism Types
Residual Trapping through 0.022 Sgr without Hysteresis
Residual Trapping (Sgr 0.022) with Hysteresis
Injection phase Post injection Injection phase Post injection Free CO2 Phase 0.754 0.631 0.642 0.511 Total Residual Trapping 0.060 0.041 0.215 0.264 Solubility Trapping 0.186 0.328 0.143 0.226
International Journal of Applied Science and Technology Vol. 5, No. 4; August 2015
38
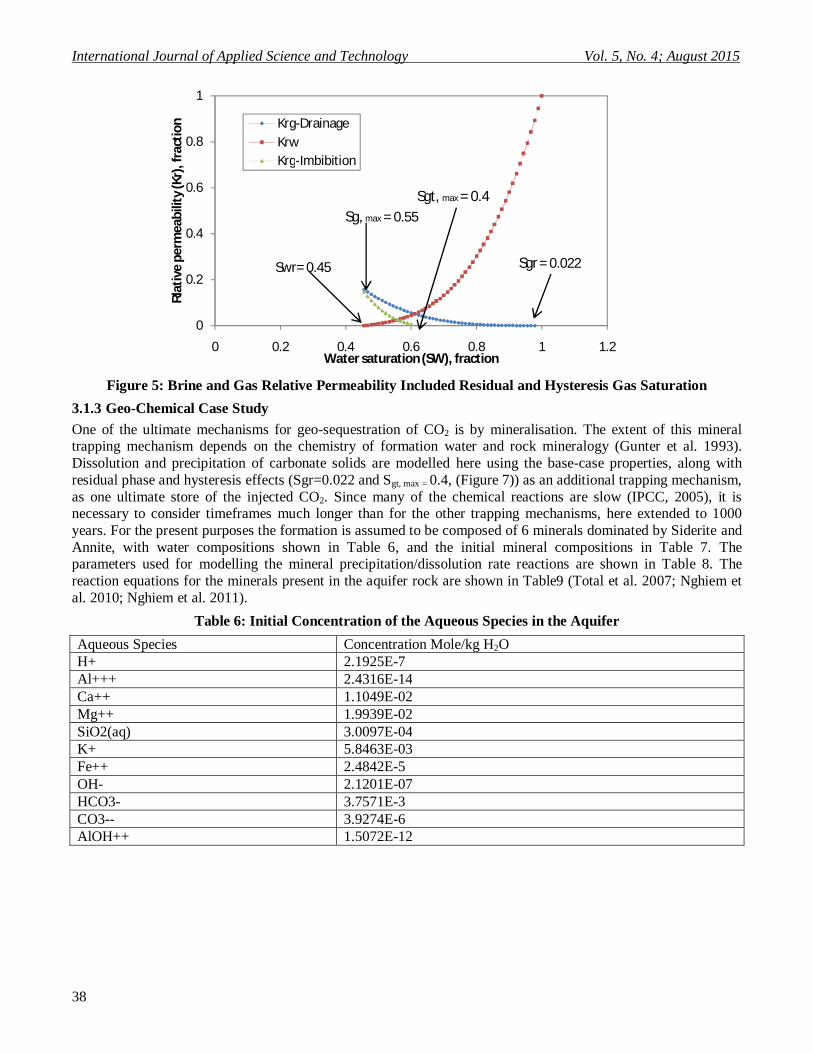
Figure 5: Brine and Gas Relative Permeability Included Residual and Hysteresis Gas Saturation
3.1.3 Geo-Chemical Case Study
One of the ultimate mechanisms for geo-sequestration of CO2 is by mineralisation. The extent of this mineral trapping mechanism depends on the chemistry of formation water and rock mineralogy (Gunter et al. 1993). Dissolution and precipitation of carbonate solids are modelled here using the base-case properties, along with residual phase and hysteresis effects (Sgr=0.022 and Sgt, max = 0.4, (Figure 7)) as an additional trapping mechanism, as one ultimate store of the injected CO2. Since many of the chemical reactions are slow (IPCC, 2005), it is necessary to consider timeframes much longer than for the other trapping mechanisms, here extended to 1000 years. For the present purposes the formation is assumed to be composed of 6 minerals dominated by Siderite and Annite, with water compositions shown in Table 6, and the initial mineral compositions in Table 7. The parameters used for modelling the mineral precipitation/dissolution rate reactions are shown in Table 8. The reaction equations for the minerals present in the aquifer rock are shown in Table9 (Total et al. 2007; Nghiem et al. 2010; Nghiem et al. 2011).
Table 6: Initial Concentration of the Aqueous Species in the Aquifer
Aqueous Species Concentration Mole/kg H2O H+ 2.1925E-7 Al+++ 2.4316E-14 Ca++ 1.1049E-02 Mg++ 1.9939E-02 SiO2(aq) 3.0097E-04 K+ 5.8463E-03 Fe++ 2.4842E-5 OH- 2.1201E-07 HCO3- 3.7571E-3 CO3-- 3.9274E-6 AlOH++ 1.5072E-12
0
0.2
0.4
0.6
0.8
1
0 0.2 0.4 0.6 0.8 1 1.2
Rlat
ive
perm
eabi
lity
(Kr)
, fra
ctio
n
Water saturation (SW), fraction
Krg-DrainageKrwKrg-Imbibition
Sgt, max = 0.4Sg, max = 0.55
Sgr= 0.022Swr= 0.45

ISSN 2221-0997 (Print), 2221-1004 (Online) © Center for Promoting Ideas, USA www.ijastnet.com
39
Table 7: Properties and Initial Volume Fraction of the Minerals
Mineral Names Mineral formulas Molecular Weight g/mol
Density kg/m3
Initial volume fraction
Calcite CaCO3 100 2709.95 0.0088 Dolomite CaMg(CO3)2 184.4034 2864.96 0.0088 Siderite FeCO3 115.8562 4046.67 0.4968 Koalinite Al2Si2O5(OH)4 258.1603 2594.05 0.0176 Illite Mg0.25K0.6Al2.3Si3.5O12H2 383.9006 2763.07 0.0264 Quartz SiO2 60.0843 2648.29 0.0088 Annite ALKFe3Si3O10(OH)2 511.8859 3317.47 0.044 Anorthite CaAL2Si2O8 278 2760.29 0.0088
Table 8: kinetic Rate Parameters for Minerals Considered in the Simulation
Mineral Rate Constant Log10Kβ mol/m2.s
Reactive Surface Area Aβ m2/m3
Activation Energy Eaβ J/mole
Calcite -8.78 88 41870 Koalinite -13 17600 62760 Illite -14 26400 58620 Quartz -13.9 7128 87500 Dolomite -9.22185 88 41870 Annite -14 4400 58620 Anorthite -12 88 67830 Siderite -9.22 88 41870
Table 9: Geochemical Reaction
Intra-aqueous chemical equilibrium reactions 1 32)(2 HCOHOHCO aq 2 3
23 HCOHCO
3 OHHOH 2
4 OHALHALOH 2 Mineral dissolution/precipitation reactions 5 3
2 HCOCaHCalcite 6 322 HCOMgCaHDolomite 7 3HCOHSideraite 8 3
22 2)(256 AlaqSiOOHHKaolinite 9 )(5.33.225.06.058 22 aqSiOALMgKOHHIllite 10 (aq) )(2 aqSiOQuartz 11 OHaqSiOAlKFeHAnnite 22 6)(5.3310 12 OHaqSiOAlCaHAnorthite 22 4)(228
Mineral trapping mechanism: From the beginning of injection, areas around the well are saturated with the injected CO2(e.g., as a free phase) through displacing brine away from the wellbore as a function of given permeability. Dissolution of CO2within water formation occurs through mass transfer from CO2 phase to aqueous phase whenever the two phases are in contact. Figure 6, shows the evolution of the total moles of CO2 in terms scCO2 rich phase (g), and in aqueous phase as dissolved CO2 (aq) and as HCO-3(Gunter et al. 1993). The dissolved CO2 dissociates into ions proton H+ and bicarbonate HCO-3.

International Journal of Applied Science and Technology Vol. 5, No. 4; August 2015
40
The process of CO2 solubility continues as long there is free CO2 phase and results in increasing HCO-3. As a result, the proton will result in acid solutions and the possibility of attack on the initial minerals present in the formation (David 1996). Accordingly, the minerals (except quartz) start to dissolve as long there is enough H+ and generate ions (e.g., Ca++ from Anorthite and Calcite, Mg++ from Illite, Fee++from Annite) in the system. Then, the generated ions from the mineral dissolution process are combined with bicarbonate HCO-3and precipitate Calcite, Dolomite and siderite. Figures7and8 show the total amounts of precipitation/dissolution of minerals in the given system. For instance, in the very beginning of the process, the minerals Calcite, Dolomite, Siderite and Kaolinite are represented by negative values of numbers of moles. The dissolution of these four minerals and the other minerals continue until such a point when the dissolutions of the other minerals (e.g., Illite, Annite and Anorthite) begin to provide excess ions (e.g., Ca++, Mg++, Fee++), then the process reverses from the dissolution to precipitation.
Figure 6: Evolution of CO2 (g), CO2 (aq) and HCO-3 versus Time
Figure 7: Mineral Precipitation/Dissolution in the System after 100 Years of Simulation
0
2000
4000
6000
8000
10000
12000
14000
1/1/2013 6/25/2346 12/16/2679 6/8/3013
Mol
es o
f gas
eous
and
aqu
eous
com
ponn
et
(gm
ole)
1x1
06
Time (date)
CO2(aq)CO2(g)HCO3-
-60-40-20
020406080
100120140160
1/1/2013 6/25/2346 12/16/2679 6/8/3013
Min
eral
mol
es c
hang
es (g
mol
e) x
106
Time (date)
Calcite
Dolomite
Siderite
ISSN 2221-0997 (Print), 2221-1004 (Online) © Center for Promoting Ideas, USA www.ijastnet.com
41
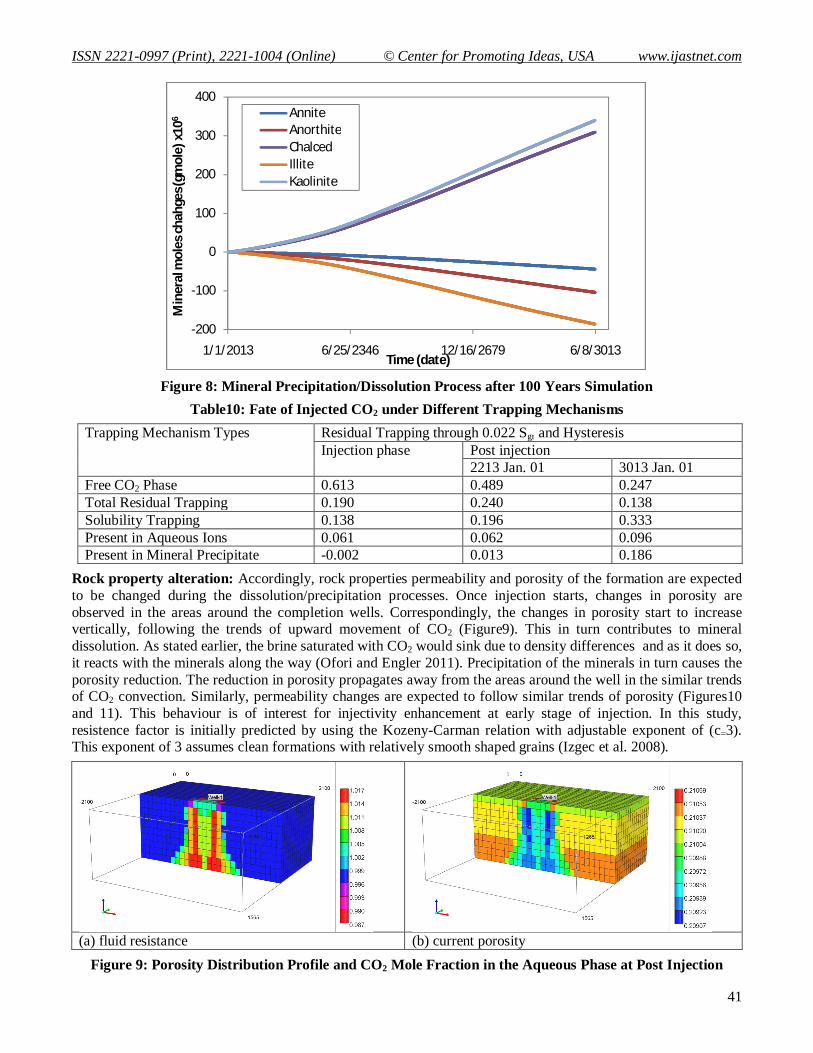
Figure 8: Mineral Precipitation/Dissolution Process after 100 Years Simulation
Table10: Fate of Injected CO2 under Different Trapping Mechanisms
Trapping Mechanism Types Residual Trapping through 0.022 Sgr and Hysteresis Injection phase Post injection
2213 Jan. 01 3013 Jan. 01 Free CO2 Phase 0.613 0.489 0.247 Total Residual Trapping 0.190 0.240 0.138 Solubility Trapping 0.138 0.196 0.333 Present in Aqueous Ions 0.061 0.062 0.096 Present in Mineral Precipitate -0.002 0.013 0.186
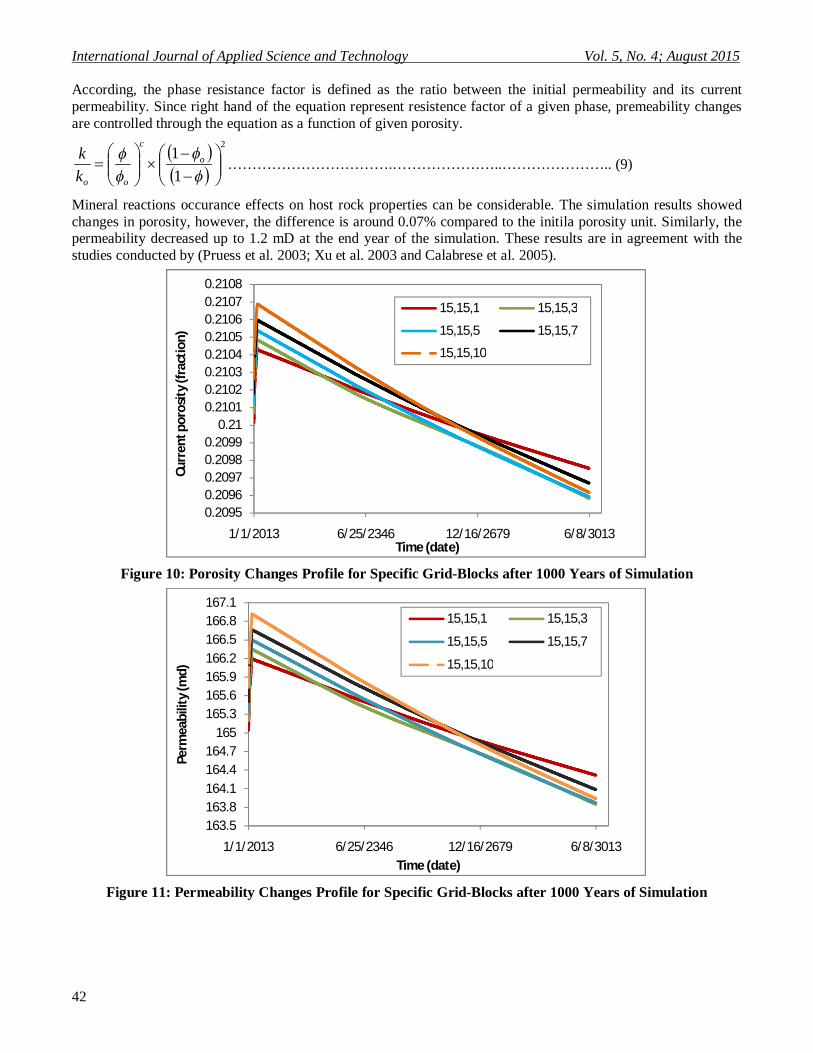
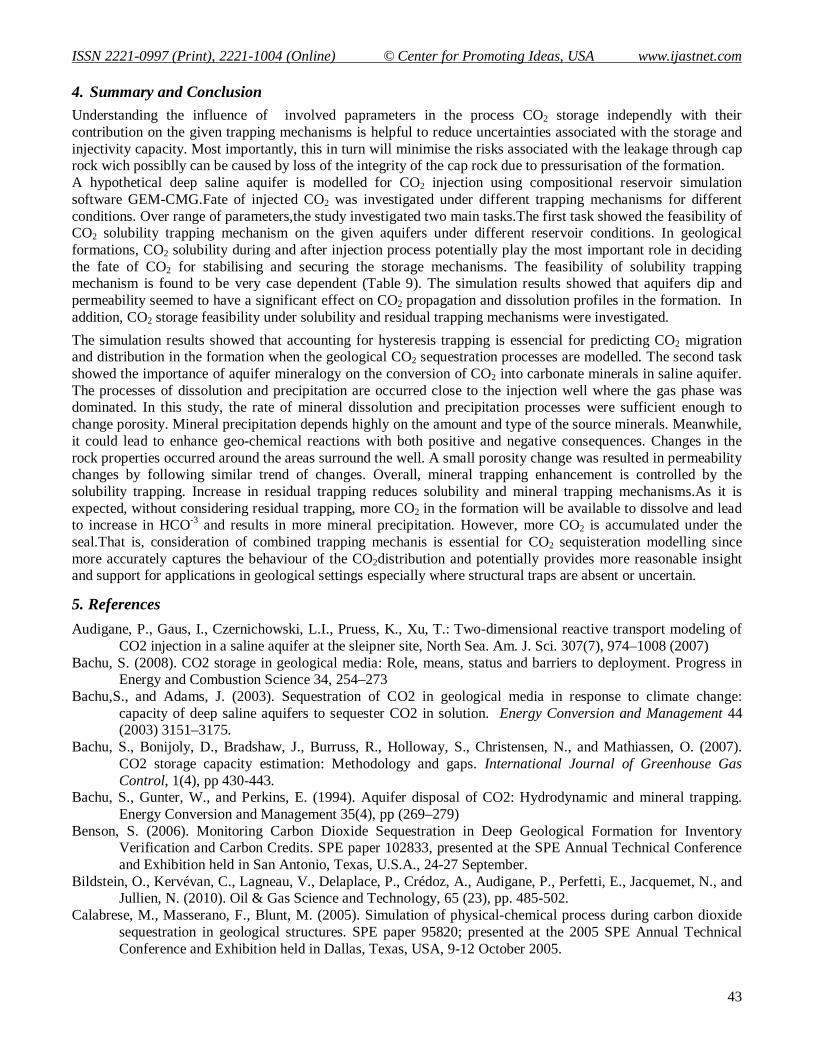
Rock property alteration: Accordingly, rock properties permeability and porosity of the formation are expected to be changed during the dissolution/precipitation processes. Once injection starts, changes in porosity are observed in the areas around the completion wells. Correspondingly, the changes in porosity start to increase vertically, following the trends of upward movement of CO2 (Figure9). This in turn contributes to mineral dissolution. As stated earlier, the brine saturated with CO2 would sink due to density differences and as it does so, it reacts with the minerals along the way (Ofori and Engler 2011). Precipitation of the minerals in turn causes the porosity reduction. The reduction in porosity propagates away from the areas around the well in the similar trends of CO2 convection. Similarly, permeability changes are expected to follow similar trends of porosity (Figures10 and 11). This behaviour is of interest for injectivity enhancement at early stage of injection. In this study, resistence factor is initially predicted by using the Kozeny-Carman relation with adjustable exponent of (c=3). This exponent of 3 assumes clean formations with relatively smooth shaped grains (Izgec et al. 2008).
(a) fluid resistance (b) current porosity
Figure 9: Porosity Distribution Profile and CO2 Mole Fraction in the Aqueous Phase at Post Injection
-200
-100
0
100
200
300
400
1/1/2013 6/25/2346 12/16/2679 6/8/3013
Min
eral
mol
es c
hahg
es (g
mol
e) x
106
Time (date)
AnniteAnorthiteChalcedIlliteKaolinite
International Journal of Applied Science and Technology Vol. 5, No. 4; August 2015
42
According, the phase resistance factor is defined as the ratio between the initial permeability and its current permeability. Since right hand of the equation represent resistence factor of a given phase, premeability changes are controlled through the equation as a function of given porosity.
2
11
o
c
ookk
…………………………….…………………..………………….. (9)
Mineral reactions occurance effects on host rock properties can be considerable. The simulation results showed changes in porosity, however, the difference is around 0.07% compared to the initila porosity unit. Similarly, the permeability decreased up to 1.2 mD at the end year of the simulation. These results are in agreement with the studies conducted by (Pruess et al. 2003; Xu et al. 2003 and Calabrese et al. 2005).
Figure 10: Porosity Changes Profile for Specific Grid-Blocks after 1000 Years of Simulation
Figure 11: Permeability Changes Profile for Specific Grid-Blocks after 1000 Years of Simulation
0.20950.20960.20970.20980.2099
0.210.21010.21020.21030.21040.21050.21060.21070.2108
1/1/2013 6/25/2346 12/16/2679 6/8/3013
Curr
ent p
oros
ity (f
ract
ion)
Time (date)
15,15,1 15,15,3
15,15,5 15,15,7
15,15,10
163.5163.8164.1164.4164.7
165165.3165.6165.9166.2166.5166.8167.1
1/1/2013 6/25/2346 12/16/2679 6/8/3013
Perm
eabi
lity
(md)
Time (date)
15,15,1 15,15,3
15,15,5 15,15,7
15,15,10
ISSN 2221-0997 (Print), 2221-1004 (Online) © Center for Promoting Ideas, USA www.ijastnet.com
43
4. Summary and Conclusion
Understanding the influence of involved paprameters in the process CO2 storage independly with their contribution on the given trapping mechanisms is helpful to reduce uncertainties associated with the storage and injectivity capacity. Most importantly, this in turn will minimise the risks associated with the leakage through cap rock wich possiblly can be caused by loss of the integrity of the cap rock due to pressurisation of the formation. A hypothetical deep saline aquifer is modelled for CO2 injection using compositional reservoir simulation software GEM-CMG.Fate of injected CO2 was investigated under different trapping mechanisms for different conditions. Over range of parameters,the study investigated two main tasks.The first task showed the feasibility of CO2 solubility trapping mechanism on the given aquifers under different reservoir conditions. In geological formations, CO2 solubility during and after injection process potentially play the most important role in deciding the fate of CO2 for stabilising and securing the storage mechanisms. The feasibility of solubility trapping mechanism is found to be very case dependent (Table 9). The simulation results showed that aquifers dip and permeability seemed to have a significant effect on CO2 propagation and dissolution profiles in the formation. In addition, CO2 storage feasibility under solubility and residual trapping mechanisms were investigated.
The simulation results showed that accounting for hysteresis trapping is essencial for predicting CO2 migration and distribution in the formation when the geological CO2 sequestration processes are modelled. The second task showed the importance of aquifer mineralogy on the conversion of CO2 into carbonate minerals in saline aquifer. The processes of dissolution and precipitation are occurred close to the injection well where the gas phase was dominated. In this study, the rate of mineral dissolution and precipitation processes were sufficient enough to change porosity. Mineral precipitation depends highly on the amount and type of the source minerals. Meanwhile, it could lead to enhance geo-chemical reactions with both positive and negative consequences. Changes in the rock properties occurred around the areas surround the well. A small porosity change was resulted in permeability changes by following similar trend of changes. Overall, mineral trapping enhancement is controlled by the solubility trapping. Increase in residual trapping reduces solubility and mineral trapping mechanisms.As it is expected, without considering residual trapping, more CO2 in the formation will be available to dissolve and lead to increase in HCO-3 and results in more mineral precipitation. However, more CO2 is accumulated under the seal.That is, consideration of combined trapping mechanis is essential for CO2 sequisteration modelling since more accurately captures the behaviour of the CO2distribution and potentially provides more reasonable insight and support for applications in geological settings especially where structural traps are absent or uncertain.
5. References
Audigane, P., Gaus, I., Czernichowski, L.I., Pruess, K., Xu, T.: Two-dimensional reactive transport modeling of CO2 injection in a saline aquifer at the sleipner site, North Sea. Am. J. Sci. 307(7), 974–1008 (2007)
Bachu, S. (2008). CO2 storage in geological media: Role, means, status and barriers to deployment. Progress in Energy and Combustion Science 34, 254–273
Bachu,S., and Adams, J. (2003). Sequestration of CO2 in geological media in response to climate change: capacity of deep saline aquifers to sequester CO2 in solution. Energy Conversion and Management 44 (2003) 3151–3175.
Bachu, S., Bonijoly, D., Bradshaw, J., Burruss, R., Holloway, S., Christensen, N., and Mathiassen, O. (2007). CO2 storage capacity estimation: Methodology and gaps. International Journal of Greenhouse Gas Control, 1(4), pp 430-443.
Bachu, S., Gunter, W., and Perkins, E. (1994). Aquifer disposal of CO2: Hydrodynamic and mineral trapping. Energy Conversion and Management 35(4), pp (269–279)
Benson, S. (2006). Monitoring Carbon Dioxide Sequestration in Deep Geological Formation for Inventory Verification and Carbon Credits. SPE paper 102833, presented at the SPE Annual Technical Conference and Exhibition held in San Antonio, Texas, U.S.A., 24-27 September.
Bildstein, O., Kervévan, C., Lagneau, V., Delaplace, P., Crédoz, A., Audigane, P., Perfetti, E., Jacquemet, N., and Jullien, N. (2010). Oil & Gas Science and Technology, 65 (23), pp. 485-502.
Calabrese, M., Masserano, F., Blunt, M. (2005). Simulation of physical-chemical process during carbon dioxide sequestration in geological structures. SPE paper 95820; presented at the 2005 SPE Annual Technical Conference and Exhibition held in Dallas, Texas, USA, 9-12 October 2005.

International Journal of Applied Science and Technology Vol. 5, No. 4; August 2015
44
CMG-GEM. Advanced Compositional and Unconventional Reservoir Simulator. Version 2012 User’s Guide. Computer Modeling Group Ltd., Calgary, Alberta.
CMG-WinProp. Phase-Behaviour and Fluid Property Program. Version 2012 User’s Guide. Computer Modeling Group Ltd., Calgary, Alberta.
Condor, J., Suebsiri, J., Wilson, M., and Asghari, K.(2010). Carbon Footprint and Principle of Additionality in CO2-EOR Projects: The Weyburn Case. SPE paper 138885, presented at the SPE Latin American & Caribbean Petroleum Engineering Conferences held in Lima, Peru, 1-3 December 2010.
David, L. (1996). Aquifer disposal of carbon dioxide: Hydrodynamic and mineral trapping-Proof of concept. Brian Hitchon (Editor), Geoscience Publishing Ltd. Sherwood Park, Alberta, Canada.
Doughty, C. (2006). Modelling geologic storage of carbon dioxide: Comparison of non-hysteretic and hysteretic characteristic curves. In PROCEEDINGS, TOUGH Symposium, Lawrence Berkeley National Laboratory, Berkeley, California, May 15–17, 2006.
Evans, B. (2012). Predicting CO2 injectivity properties for application at CCS sites. Report number 3-1110-0122. Curtin University, published by Global CCS Institute.
Flett, M., Gurton, D., Weir, G.(2007). Heterogeneous saline formations for carbon dioxide disposal: Impact of varying heterogeneity on containment and trapping. Journal of Petroleum Science and Engineering, 57(2), pp 106-118.
Ghanbari, S., Al-Zaabi, Y., Pickup, G., Mackay, E., Gozalpour, F., and Todd, A. (2006). Simulation of CO2 storage in saline aquifer. Chemical Engineering Research and Design, 48(9), pp 764-775.
Gunter, W., Perkins, E., and McCann, T. (1993). Aquifer disposal of CO2-rich gases: Reaction design for added capacity. Energy Conversion and Management, 34(941-948).
Hitchon, B., Gunter, W., and Gentzis, T. (1996). The serendipitous association of sedimentary basins and
greenhouse gases. American Chemical Society, Division of Fuel Chemistry, 41(4), pp 1428-1432. Hovorka, S.D., Doughty, C., and Holtz, M. H., 2004, Testing efficiency of storage in the subsurface: Frio Brine
Pilot Experiment, in 7th International Conference on Greenhouse Gas Control Technologies, Vancouver, Canada, September 5–9, unpaginated [5 p.]. GCCC Digital Publication Series #04-01.
Ide, S., Jessen, K., Franklin, M., and Jr, O. (2007). Storage of CO2 in saline aquifers: Effects of gravity, viscous, and capillary forces on amount and timing of trapping. International Journal of Greenhouse Gas Control, 1(4), pp 481-491.
IPCC. (2005). IPCC Special Report on Carbon Dioxide Capture and Storage. Prepared by Working Group III of the Intergovernmental Panel on Climate Change [Metz, B., O. Davidson, H. C. de Coninck, M. Loos, and L. A. Meyer (eds.)]. Cambridge University Press, Cambridge, United Kingdom and New York, NY, USA, 442 pp.
Izgec, O., Demiral, B., Bertin, H., and Akin, S. (2008). Numerical simulation of CO2 disposal by mineral trapping in deep aquifers. Applied Geochemistry, 19(6), pp 917–936
Juanes, R., Spiteri, E., Orr Jr, F., and Blunt, M. (2006). Impact of relative permeability hysteresis on geological CO2 storage. Water Resources Research, 42(12), 1-13
Kestin, J., Khalifa, E. and Correia, J. (1981). Tables of the Dynamic and Kinematic Viscosity of Aqueous NaCl Solutions in the Temperature Range 20-150°C and Pressure Range 0.1−35 MPa. Journal of Physical and Chemical Reference Data, 10 (1) 71-87.
Kumar, A., Ozah, R., Noh, M., Pope, G.A., Bryant, S., Sephehrnoori, K. and Lake, L.W., 2005, Reservoir simulation of CO2 storage in deep saline aquifers, SPE Journal, 10(3): 336–348.
Kumar, N., and Bryan, S. (2008). Optimizing injection intervals in vertical and horizontal wells for CO2 sequestration. SPE paper: 116661; SPE Annual Technical Conference and Exhibition, Denver, Colorado, USA, 21-24 September 2008.
Law, D., Bachu, S., Gunter, W. (1995). CO2 disposal into Alberta basin aquifers- PhaseIII: Hydrological and numerical analysis of CO2-disposal in deep siliciclastic and carbonate aquifers in the Lake Wabamum area. Alberta Research Council, PO Box 8330, Edmonton, Alberta, Canada, T6H 5X2.
Li, Y.-K. and Nghiem, L. “Phase Equilibria of Oil, Gas and Water/Brine Mixtures from a Cubic Equation of State and Henry's Law,” Can. J. Chem. Eng., Vol. 64, pp. 486-496, June 1986.
Land, C. (1968). Calculation of imbibition relative permeability for two and three phase flow from rock properties. Society of Petroleum Engineers Journal, 8(02), pp 149 – 156.
ISSN 2221-0997 (Print), 2221-1004 (Online) © Center for Promoting Ideas, USA www.ijastnet.com
45
Mo, S., and Akervoll, I. (2005). Modeling long-term CO2 storage in aquifer with a black-oil reservoir simulator. SPE paper 93951; presented at the PE/EPA/DOE Exploration and Production Environmental Conference, Galveston, Texas, 7-9 March 2005.
Nghiem, L., Sammon, P., Grabenstetter, J., and Ohkuma., H. (2004). Modelling CO2 storage in Aquifers with a fully-coupled geochemical EOS compositional simulator. SPE paper 89474; presented at the SPE/DOE Symposium on Improved Oil Recovery, Tulsa, Oklahoma, 17-21 April 2004.
Nghiem, L., Shrivastava, V., and Kohse, B. (2011). Modelling aqueous phase behavior and chemical reactions in compositional simulation. SPE paper 141417; presented at the SPE Reservoir Simulation Symposium held in the Woodlands, Texas, U.S.A., 21-23 February 2011.
Nghiem, L., Shrivastava, V., Kohse, B., Hassam, M., & Yang, C. (2009, January 1). Simulation of Trapping Processes for CO2 Storage in Saline Aquifers. Petroleum Society of Canada. doi:10.2118/2009-156
Nghiem, L., Shrivastava, V., Kohse, B., Hassam, M., & Yang, C. (2010, August 1). Simulation and Optimization of Trapping Processes for CO2 Storage in Saline Aquifers. Society of Petroleum Engineers. doi:10.2118/139429-PA
Ofori, A., and Engler, A. Effects of CO2 sequestration on the petro-physical properties of an aquifer rock. SPE paper 147166; parented at the Canadian Unconventional Resources Conference held in Calgary, Alberta, Canada, 15-17 November 2011.
Ozah, R., Lakshminarasimhan, S., Pope, G., Sepehrnoori, K., Bryant, S. (2005). Numerical simulation of the storage of pure CO2 and CO2-H2S gas mixtures in deep saline aquifers. SPE Paper; presented at the 2005 SPE Annual Technical Conference and Exhibition held in Dallas, Texas, U.S.A., 9 – 12 October 2005.
Peng, Y., and Robinson, B. (1976). A New Two-Constant Equation of State. Industrial &Engineering Chemistry Fundamental, 15(1), pp 59-64.
Prevost, H., Fuller, R., Altevogt, A., Bruant, R., and Scherer, G. (2005). Numerical Modeling of Carbon Dioxide injection and transport in deep saline aquifers. Greenhouse Gas Control Technologies, Volume II, 2189-2193.
Pruess, K., Xu, T., Apps, J., and Garcia, Julio. (2003). Numerical modeling of aquifer disposal of CO2. SPE Journal, 8(1), pp 49-60.
Pruess, K and Xu, T. (2007). Two-diminetional reactive transport modelling of CO2 injection in a saline aquifer at the Sleipner site North Sea. American Journal of science, 307(7) 9744-1008.
Reid, C., Prausnitz, M., and Sherwood, K. (19977). The Properties of Gases and Liquids, 3rd Edition, McGraw-Hill, New York.
Rowe, M. and Chou, S. (1970). Pressure-Volume-Temperature-Concentration Relation of Aqueous NaCl Solutions, Journal of Physical and Chemical Reference Data, 15 (1), 61-66.
Sifuentes, W., Giddins, M., and Blunt, M. (2009). Modeling CO2 storage in aquifers: Assessing the key contributors to uncertainty. SPE paper 123582; SPE Offshore Europe Oil and Gas Conference Exhibition held in Aberdeen, UK, , 8-11 September 2009.
Total, S., and Nghiem, L. (2007). A modelling study of the role of selected minerals in enhancing CO2 mineralization during CO2 aquifer storage. SPE paper 109739; presented at SPE Annual Technical Conference and Exhibition, Anaheim, California, U.S.A, 11-14 November 2007.
Ukaegbu, C., Gundogan, O., Mackay, E., Pickup, G., Todd, A., and Gozalpour, F.(2009). Simulation of CO2 storage in a heterogeneous aquifer. Journal of Power and Energy, 223(3), pp 249-267
Xu, T., Apps, J., and Pruess, K. (2003). Numerical simulation of CO2 disposal by mineral trapping in deep aquifers. Applied Geochemistry 19 (6) 917–93