research results digest - main · national cooperative highway research program research results...
TRANSCRIPT

National Cooperative Highway Research Program
RESEARCH RESULTS DIGEST
September 2006—Number xxx
Subject Area: IIB Pavement Design Responsible Senior Program Officer: E.T. Harrigan Management, and Performance
Changes to the Mechanistic-Empirical Pavement Design Guide
Software Through Version 0.900, July 2006
This digest summarizes key findings from NCHRP Project 1-40D, “Technical Assistance to NCHRP and NCHRP Project 1-40A: Versions 0.9 and 1.0 of the M-E Pavement Design Software,” conducted by Applied Research Associates, Inc. and Arizona State University. The digest was
prepared by Michael M. Darter, Ph.D., Jag Mallela, Leslie Titus-Glover, Chetana Rao, Ph.D., Gregg Larson, Alex Gotlif, Ph.D., and Harold Von Quintus, Applied Research Associates, Inc., Lev Khazanovich, Ph.D, University of Minnesota, and Matthew Witczak, Ph.D., Mohamed El-
Basyouny, Ph.D., Sherif El-Badawy, Ph.D., Aleksander Zborowski, and Claudia Zapata, Ph.D., Arizona State University. INTRODUCTION This digest is a summary of the many changes made to the Mechanistic-Empirical Pavement Design Guide software under NCHRP 1-40D between August 2005 and June 2006. As such, it describes both corrections incorporated in version 0.8 issued in November 2005 and mainly technical improvements and enhancements included in version 0.9 issued in July 2006. Changes in version 0.9 include software changes in general (including changes to traffic and other general topics), changes in the integrated climatic model, changes in flexible pavement design and analysis, and changes in rigid pavement design and analysis. These changes are in response to the recommendations of the NCHRP 1-40A independent review team, the NCHRP 1-40 panel, the general design community, various other researchers, and the Project 1-40D team itself. Most of these changes have been tracked and summarized at www.ara-tracker.com and the parenthetical item # is provided for each of these. Some were more technical including definition changes and were not included in the bug tracker system. Users of the new version 0.9 should recognize two important facts. First, the climatic database used in the latest calibration and available for design is now substantially larger and enhanced. Old databases downloaded with versions 0.7 and 0.8 should be scrapped. Second, design solutions and associated files generated with versions 0.7 and 0.8 require some additional inputs and may experience some difficulty if simply reloaded and run. It is recommended that the user verify each input (clicking ok) prior to re-running an old file. It is especially important to review the inputs for the unbound materials (base, subbase, subgrade) as several are new inputs. If a run still experiences difficulty, it is recommended that the user reenter the project inputs as a “new” file and then rerun. The research team recommends that problems of interest be run again with the new version for comparison with earlier solutions.
2
SOFTWARE IN GENERAL INCLUDING TRAFFIC 1. (#430) Add CRCP and JPCP plots to ACC/PCC outputs: Missing plots for LTE, Punchout,
Crack width, Cracking, and Cracking Damage. Work completed. 2. (#427) Import/Export capability for unbound material grain size distribution, PI, LL: Created
import / expert capability for unbound materials so that a default grain size and LL/PI values for soils of interest can be created and used when needed.
3. (#426) Calculate ESALs for flexible pavement: The desire of the panel was to have ESALs calculated and available to the user but since the procedures is NOT based on ESALs, they would only appear in intermediate files, not on the official output for a project. Calculation of ESALs for JPCP has been included in an intermediate file. A similar calculation for flexible pavements is needed and was completed. These are found in the intermediate files under the project folder.
4. (#414) Include proper default values for grain size distribution and Atterberg limits for unbound materials. Unbound materials data from several hundred LTPP sections were obtained for all available AASHTO soil classifications. Means and standard deviations were computed for the range of grain size distribution and Atterberg limits and other properties and incorporated into the defaults of the Design Guide.
5. (#259) When reducing the number of years model traffic still calculated for longer period. This effects run time negatively. It may cost an extra 20-30 seconds. This problem was resolved.
6. (#252) Change default design period start dates for all analyses. Used September 2006 as the start date for all new analysis.
7. (#244) Create traffic export/import capabilities. Allow the user to import/export all of the data need for the traffic files within the interface. Work completed.
8. (#232) Multiple file select for batch mode. Currently the user has to select each file to add to batch mode individually. Make it possible to use multiple file select to add files to batch mode. Work completed.
9. (#231) Increase the width of batch mode file entry screen. Currently the width of the batch file input screen is not wide enough to fully display files that are stored in long directories. Work completed.
10. (#125) Double clicking on cone file (*.dgp) crashes. The ability to open a ME-PDG project file by clicking on the file has never worked properly. The only current method for opening a ME-PDG project file is to open the program first and then selecting File|Open. This problem was fixed.
11. (#116) Incorporate NCHRP 1-39 TrafLoad files into the ME-PDG. Modify the code to allow the direct use of the outputs of 1=39 software in the ME-PDG. Work completed.
12. (#79) Batch Mode Option of Software. Software does not allow runs in batch mode although this option is provided. The batch mode option must be removed or activated. Work completed.
13. (#78) Inadequate amount of climatic data for given file. If climatic file has less than 12 months of climatic the data program will crash. An improved warning message should be provided. Also, several procedures to estimate missing data were included in software. Work completed.
14. (#77) Base type default values. When the base type is changed some default input values are not changed. Work completed.
3
15. (#76) Problems with Save-As option. On a few occasions, two input files containing the same data can produce different outputs. This occurs when file is changed and then saved using "Save-As" command in the file menu of the software, and then rerun. The changed inputs may not be actually saved. This problem was corrected.
16. (#70) Summation of Axle Load Distribution Factors. The Axle Load Distribution Factors in the traffic analysis does not appear to count in the last load level in the summation column. Examples that have been used in other problem studies, showing 25% in the last 5 columns cause the program to show 100%. This problem was fixed.
17. (#66) Remove single tire configuration for traffic input. The General Traffic Input screen currently shows a Dual and Single tire pressure option. The single tire option should be removed as the software only uses dual tire axles. Work completed.
18. (#65) Special axle configuration problems. Several problems have been uncovered with the Special Axle Configuration portion of Version 1.0. They are:
a. A significant amount of information for the Special Vehicle Help option must be added
b. The asphalt. Td file must be corrected to insure that the correct wheel load coordinate locations are input into the file. The program currently allows the user to input wheel load coordinate locations to entered. Unfortunately, the program will read all coordinates at an x=0; y=0 location for each tire of the special vehicle.
c. The General traffic output summary information should be eliminated when the Special Vehicle Option is selected. This output table should be replaced with the key input traffic wheel load properties of the special vehicle.
d. There is a repetitive error message that should be eliminated by correcting the code. e. There is a problem associated with the frequency input associated with the use of the
Special Vehicle in a Rehabilitation scenario. All of these problems were fixed.
19. (#50) Changing pavement types after completed run. Changing the type of pavement analysis once run has been completed causes the program to hang. (Example-Changing CRCP to HMA Overlay of CRCP. Problem was fixed.
INTEGRATED CLIMATIC MODEL
1. Addition of more climatic data for each weather station. New set of weather station files
with up to 9 years of hourly data provided for 851 stations. It is recommended that any old weather stations be deleted and not used with the new version. The new weather stations should be downloaded and used with the 0.900 version of the software.
2. (#360) Review and correct Hourly Climatic Database. Version 0.800 hourly climatic data base had some errors in the precipitation. This was reviewed and repaired in December 2005. Unfortunately the fixed files were not widely disseminated.
3. (#276) Failure in climatic model building. When trying to build a climatic model from weather stations around Delaware, Iowa, every combination of the six weather stations near the site (42°28' N 91°21'W, elev = 1053') reported missing data for month 200101. However, I was able to use the Dubuque, Iowa station directly. This problem was resolved and fixed.
4. (#253) Update ICM to allow use of the NCHRP 9-23 Models. Created grain size distribution plot. Updated grain size distribution to index property correlation. Updated base moisture model to Thornthwaite Moisture Index (TMI) method.

4
5. Defaults provided for all unbound materials based on measured properties from several hundred LTPP sections across the U.S.
6. (#229) Failed ICM stability check. Other project files created in the past run fine. The current one (an Unbonded PCC Overlay) does not (I uploaded it to you). After pressing Run Analysis, the Traffic module completes, then the Climatic module tries to load but stops with error "Failed ICM stability check". Problem fixed.
7. (#122) ICM crashes with file and directory names of over 80 characters. ICM crashes with file and directory names of over 80 characters. Problem fixed.
8. (#74) The Enhanced Integrated Climatic Model (EICM) has been modified and enhanced based on the results of the NCHRP 9-23 project. See under Flexible Pavements.
FLEXIBLE PAVEMENTS The following changes were made to the software to enhance the design of flexible pavements:
1. (#413) Granular layer placed over stabilized base crashes for flexible pavement. Modulus for granular layer was not being output in _space.dat. Problem fixed. This makes it possible to include for example a lime stabilized layer below an unbound granular base/subbase layer.
2. (#74) The Enhanced Integrated Climatic Model (EICM) has been modified and enhanced based on the results of the NCHRP 9-23 project. Several models have been revised and incorporated into the M-E PDG code. These models include the following:
a. New Suction Models
b. New ASU - TMI Models
c. New SWCC Models
d. Moisture Content Models with p200-w%
e. Revise Compaction Models
f. Revised Specific Gravity Models
g. New Saturated Hydraulic Conductivity (ksat) Model
3. The current program runs in batch mode. This tool is a great for research as well as design as it allows the user to load several DG files and run them in a batch mode.
4. (#124) The analysis period (design life) is increased from 25 to 50 years.
5. The run time of the program is decreased.
6. The calibration models in the settings screens are updated.
7. The national calibration factors of the distress models are updated based on the enhancements done to the models. In addition these calibration factors are based on the most up to date database. Additional information provided under Re-Calibration of Flexible Pavements.
The following changes were made in the software for the design of new and rehabilitated flexible pavements:
5
1. (#56) Reflective Cracking was not reported correctly to the output summary sheet. Problem was corrected and the reflective cracking is now reported correctly under the column with the heading “Reflective Cracking from the Existing Layers”.
2. The methodology used to report area cracking in the HMA rehabilitation design is based on Reflective Cracking reflected from the existing pavement through the overlay to the surface of the pavement in addition to the amount of fatigue cracking occurring in the new layer. The way the results should be interpreted is by looking at the time the cracking reached the surface not by the amount of cracking at the end of the design life.
3. (#57) In the distress summary output sheet, for the Rehab Analysis, the “Alligator Cracking” output column name is changed to “Alligator Cracking in New Overlay”.
4. (#58) A new output column named “Total Cracking at Surface” is added to the output. This column represents the sum of the “Alligator Cracking in New Overlay” and the “Reflective Cracking from the Existing Layers”.
5. (#99) In some cases of AC over AC Rehab analysis the software does not accept more than one AC layer. Problem was corrected and the program now accepts up to three new AC layers over the existing flexible pavement.
6. The software wrongly allows the user to input any material over the existing layers. Problem was corrected and the software is now allowing the user to input either AC materials or base courses (unbound or CTB).
7. (#54) In Level 1 Rehab analysis if the user did not input the FWD modulus the software crashes. Problem was corrected by incorporating a warning message to warn the user to input the FWD modulus or the software will crash.
8. (#64) In Level 1 and 2 Rehab analyses if the user did not input the actual rutting and cracking for the existing pavement the software crashes or yields unreasonable results. Problem was corrected by incorporating a warning message to warn the user to input the actual rutting and cracking for the existing pavement or the software will crash or yield unreasonable results.
9. (#55) The damage function in level 2 rehab yields incompatible with Level 3. Problem was corrected.
10. The input summary worksheet in the output file for the Rehab analyses Levels 1, 2, and 3 is missing a lot of information. Problem was corrected.
11. Use of any new or overlay AC sublayers with thicknesses greater than 9-in may lead to sublayering yielding AC thicknesses greater than the original input thickness of the layer. Problem was corrected.
12. (#158) The program crashes if the user has a limited access account. Problem was corrected.
The following changes and corrections were made in the treatment of E* in the design of flexible pavements: 1. (#67) An error message usually appears when using Level 1 E* characterization in HMA
analysis. Problem was corrected.
6
2. Several Level 1 E* input data for AC mixtures causes program crashes. Problem was corrected. The seed values for the optimization process used for the development of the E* master curve coefficients (Time-Temperature Superposition Optimization) were reviewed and updated based on historical database in order to prevent the program from crashing.
3. (#72) In Level 1 input analysis for HMA, inputting E* values at small range of temperatures may result in incorrect master curve which may cause program to crash or yield very incorrect results. Problem was corrected. Program restricted the E* input values to be at least at three temperatures in a wide range (Temperature > 125 oF, Temperature between 60 and 90 oF, and Temperature < 45 oF).
4. In level 1 input analysis for HMA, limits were imposed on the Temperature for the G* testing to provide a reasonable range of temperatures. The G* temperature is cannot be less than 40 oF and not more than 300 oF.
The following errors that led to discontinuities in the calculation of rutting in the flexible pavement design were corrected: 1. (#68) A discontinuity occurs in the AC rut depth with very small changes in AC layer
thickness due to the sublayering scheme used in the software. This discontinuity error may be as high as 20 to 25%. Problem was corrected and the error was reduced to less than 10%.
2. (# 68) A discontinuity occurs in the subgrade rut depth with small changes in the AC layer thickness. Problem was corrected the error is totally eliminated.
The following improvements and corrections in the treatment of unbound materials were made: 1. The typical default values and ranges for the unbound materials resilient modulus at optimum
moisture condition have some wrong values. Problem was corrected. New guidelines provided with program for flexible pavements.
2. The software mistakenly uses the default values for the unbound materials resilient modulus at optimum moisture condition when the user chooses Representative Value (Design Value). Problem was corrected and a new set of typical default values and ranges for the Representative Value (Design Value) for the unbound materials resilient modulus has been incorporated.
3. (#157) The software crash when running an analysis with unbound materials Level 2 seasonal modulus. Problem was corrected.
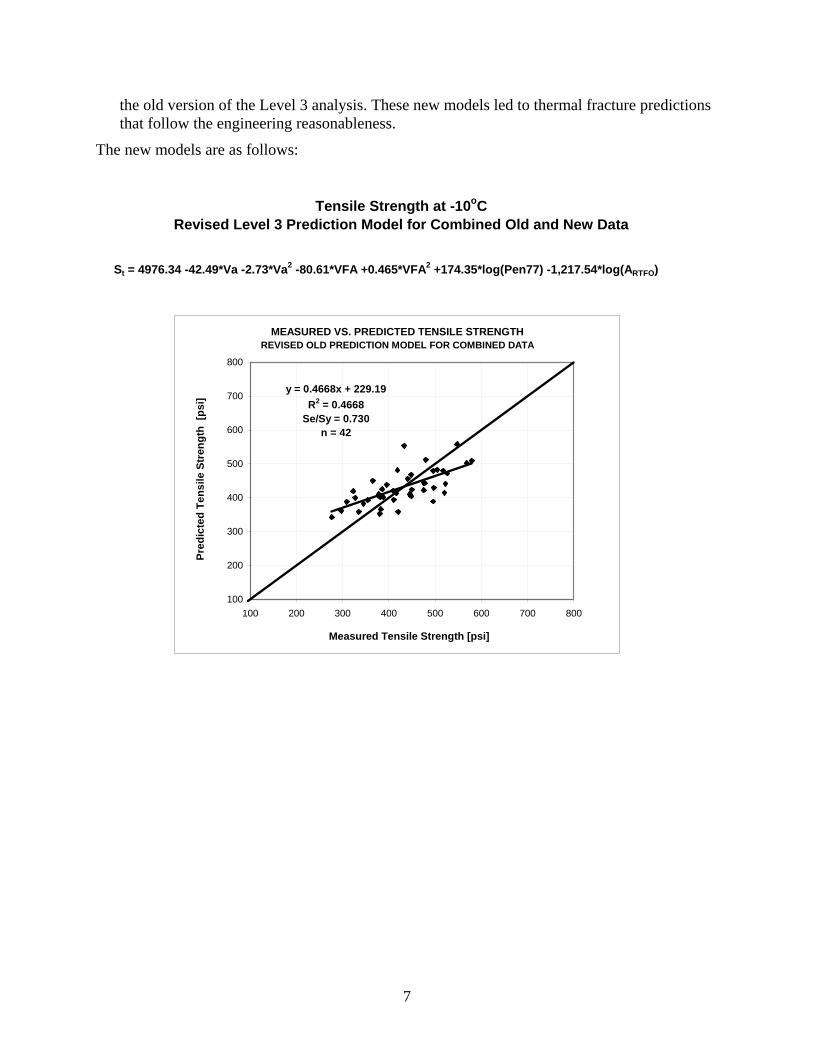
The following improvements and corrections in the treatment of thermal fracture were made: 1. (#71) In Level 3 predictive system for thermal fracture; as Vbeff (effective bitumen content)
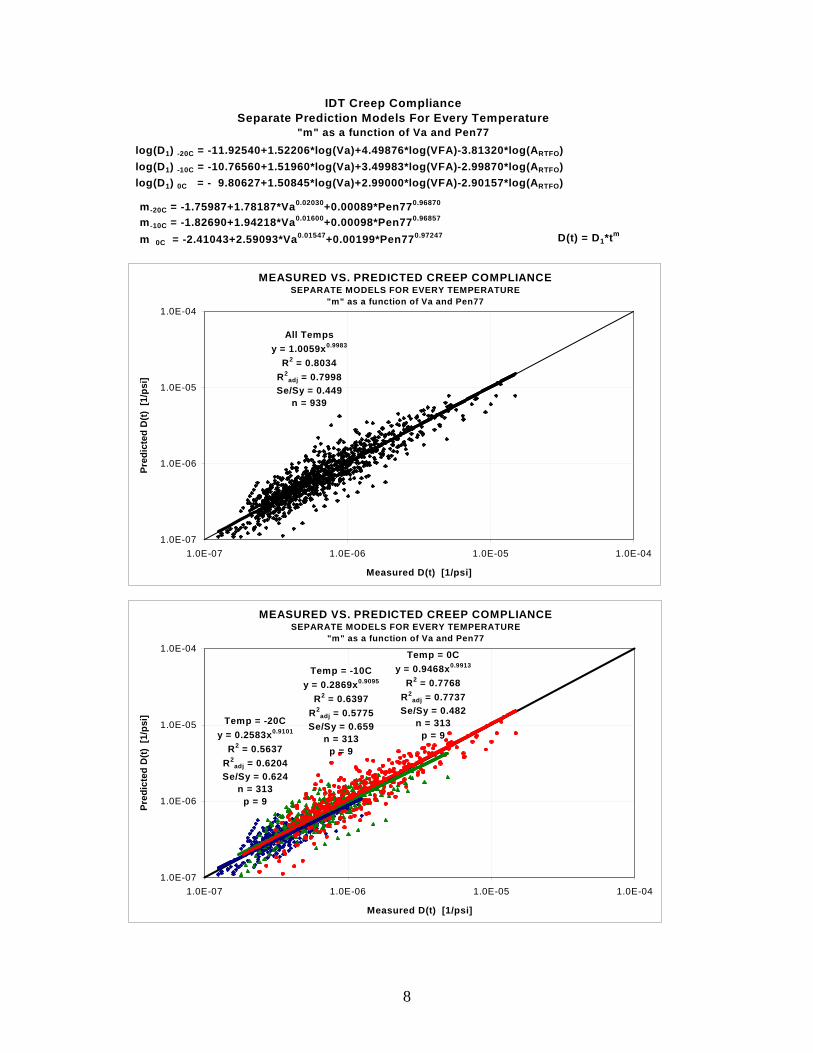
increases, prediction if thermal cracking increases. Problem was corrected and the level 3 models for the creep compliance and the tensile strength prediction were modified based on a larger database. Separate creep compliance predictive equations were developed for every test temperature (0, -10, -20oC) to replace one, universal equation for all temperatures used in
7
the old version of the Level 3 analysis. These new models led to thermal fracture predictions that follow the engineering reasonableness.
The new models are as follows:
Tensile Strength at -10oCRevised Level 3 Prediction Model for Combined Old and New Data
MEASURED VS. PREDICTED TENSILE STRENGTHREVISED OLD PREDICTION MODEL FOR COMBINED DATA
y = 0.4668x + 229.19R2 = 0.4668
Se/Sy = 0.730n = 42
100
200
300
400
500
600
700
800
100 200 300 400 500 600 700 800
Measured Tensile Strength [psi]
Pred
icte
d Te
nsile
Str
engt
h [p
si]
St = 4976.34 -42.49*Va -2.73*Va2 -80.61*VFA +0.465*VFA2 +174.35*log(Pen77) -1,217.54*log(ARTFO)
8
IDT Creep ComplianceSeparate Prediction Models For Every Temperature
"m" as a function of Va and Pen77
MEASURED VS. PREDICTED CREEP COMPLIANCESEPARATE MODELS FOR EVERY TEMPERATURE
"m" as a function of Va and Pen77
All Tempsy = 1.0059x0.9983
R2 = 0.8034R2
adj = 0.7998Se/Sy = 0.449
n = 939
1.0E-07
1.0E-06
1.0E-05
1.0E-04
1.0E-07 1.0E-06 1.0E-05 1.0E-04
Measured D(t) [1/psi]
Pred
icte
d D
(t) [
1/ps
i]
MEASURED VS. PREDICTED CREEP COMPLIANCESEPARATE MODELS FOR EVERY TEMPERATURE
"m" as a function of Va and Pen77
Temp = -20Cy = 0.2583x0.9101
R2 = 0.5637R2
adj = 0.6204Se/Sy = 0.624
n = 313p = 9
Temp = -10Cy = 0.2869x0.9095
R2 = 0.6397R2
adj = 0.5775Se/Sy = 0.659
n = 313p = 9
Temp = 0Cy = 0.9468x0.9913
R2 = 0.7768R2
adj = 0.7737Se/Sy = 0.482
n = 313p = 9
1.0E-07
1.0E-06
1.0E-05
1.0E-04
1.0E-07 1.0E-06 1.0E-05 1.0E-04
Measured D(t) [1/psi]
Pred
icte
d D
(t) [
1/ps
i]log(D1) -20C = -11.92540+1.52206*log(Va)+4.49876*log(VFA)-3.81320*log(ARTFO)
m-20C = -1.75987+1.78187*Va0.02030+0.00089*Pen770.96870
D(t) = D1*tm
log(D1) -10C = -10.76560+1.51960*log(Va)+3.49983*log(VFA)-2.99870*log(ARTFO)log(D1) 0C = - 9.80627+1.50845*log(Va)+2.99000*log(VFA)-2.90157*log(ARTFO)
m-10C = -1.82690+1.94218*Va0.01600+0.00098*Pen770.96857
m 0C = -2.41043+2.59093*Va0.01547+0.00199*Pen770.97247

9
The following issues related to special axle configurations were resolved: 1. (#65-2) Asphalt.td file does not read the wheel load coordinates inputted by the user. Instead
it sets all the coordinates to zeros. Problem was corrected.
2. (#65-3) The output summary for the special axle configuration shows wrong data belongs to the general traffic. Problem was corrected.
3. (#65-4) An error message appears when performing an analysis using the special axle configuration. Problem was corrected.
4. (#65-5) In Rehab analysis, the software requires the user to input the frequency for the cases of AC, granular base and subgrade layers. However the frequency should be a required input only for the AC layers. Problem was corrected.
5. (#65-5) The program does not save the frequency values inputted by the user. In other words, once the user inputs the frequency and clicks “OK”, then comes back to the same screen again, he/she will find that the previously inputted frequency values disappeared. Problem was corrected.
The following traffic related issues in flexible pavement design were addressed: 1. (#60) Potentially significant problem may occur with the use of the current “Representative
Load Analysis Procedure” especially when evaluating overloaded vehicular traffic scenarios. Problem was corrected and a fixed tire load of 4500 lb is used in as a representative load instead of the variable 95 percentile. This new procedure eliminated the potential problems in the distress prediction that might occur with the use of the old procedure.
2. (#70) Axle load distribution factors in traffic analysis does not count in the last load level in summation (Total) column. Problem was corrected.
3. (#66) General traffic input screen shows “Dual and Single” tire pressure options. However, it should only show the Dual tire pressure option. Problem was corrected.
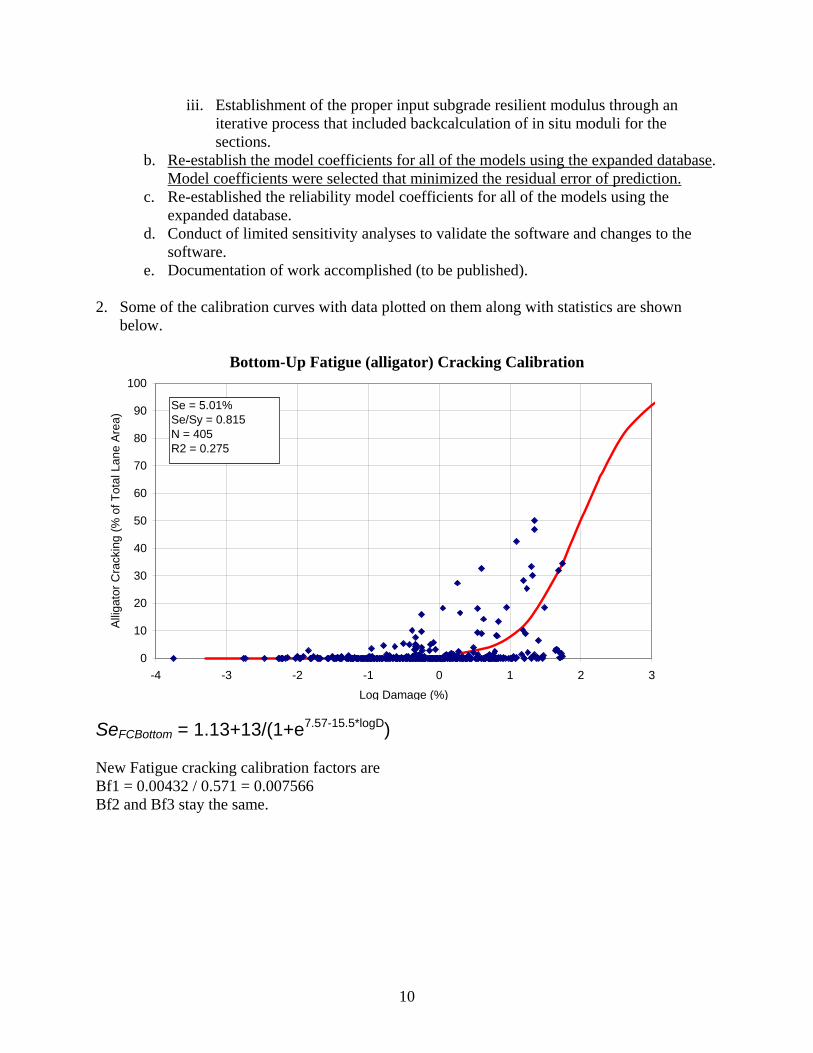
The following items summarize the major recalibration of the flexible pavement distress models that was carried out: 1. A major effort was expended to recalibrate all of the flexible pavement models including:
bottom up fatigue cracking, top down fatigue cracking, permanent deformation, transverse cracking, and IRI. The final newly calibrated models had (1) a lower model error, (2) reasonable sensitivity to changes in inputs, and (3) improved reliability than those originally developed under NCHRP 1-37A. Major steps in this effort included the following.
a. Improvement of the database. i. Updating all existing sections with 4-5 additional years of performance data,
traffic data, materials data, climatic data, and rehabilitation data. ii. Incorporation of the weather stations that included 9 years of historic hourly
data.
10
iii. Establishment of the proper input subgrade resilient modulus through an iterative process that included backcalculation of in situ moduli for the sections.
b. Re-establish the model coefficients for all of the models using the expanded database. Model coefficients were selected that minimized the residual error of prediction.
c. Re-established the reliability model coefficients for all of the models using the expanded database.
d. Conduct of limited sensitivity analyses to validate the software and changes to the software.
e. Documentation of work accomplished (to be published).
2. Some of the calibration curves with data plotted on them along with statistics are shown below.
Bottom-Up Fatigue (alligator) Cracking Calibration
0
10
20
30
40
50
60
70
80
90
100
-4 -3 -2 -1 0 1 2 3
Log Damage (%)
Allig
ator
Cra
ckin
g (%
of T
otal
Lan
e A
rea)
Se = 5.01%Se/Sy = 0.815N = 405R2 = 0.275
SeFCBottom = 1.13+13/(1+e7.57-15.5*logD) New Fatigue cracking calibration factors are Bf1 = 0.00432 / 0.571 = 0.007566 Bf2 and Bf3 stay the same.
11
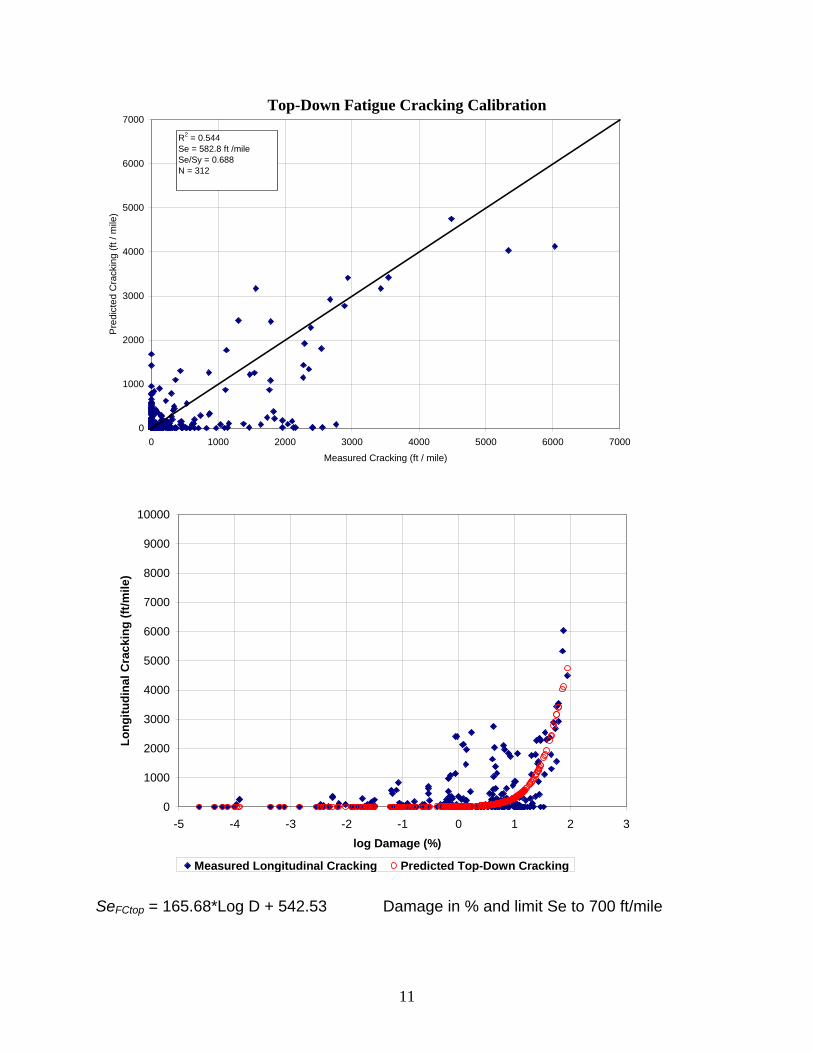
Top-Down Fatigue Cracking Calibration
0
1000
2000
3000
4000
5000
6000
7000
0 1000 2000 3000 4000 5000 6000 7000
Measured Cracking (ft / mile)
Pre
dict
ed C
rack
ing
(ft /
mile
)
R2 = 0.544Se = 582.8 ft /mileSe/Sy = 0.688N = 312
0
1000
2000
3000
4000
5000
6000
7000
8000
9000
10000
-5 -4 -3 -2 -1 0 1 2 3log Damage (%)
Long
itudi
nal C
rack
ing
(ft/m
ile)
Measured Longitudinal Cracking Predicted Top-Down Cracking SeFCtop = 165.68*Log D + 542.53 Damage in % and limit Se to 700 ft/mile
12
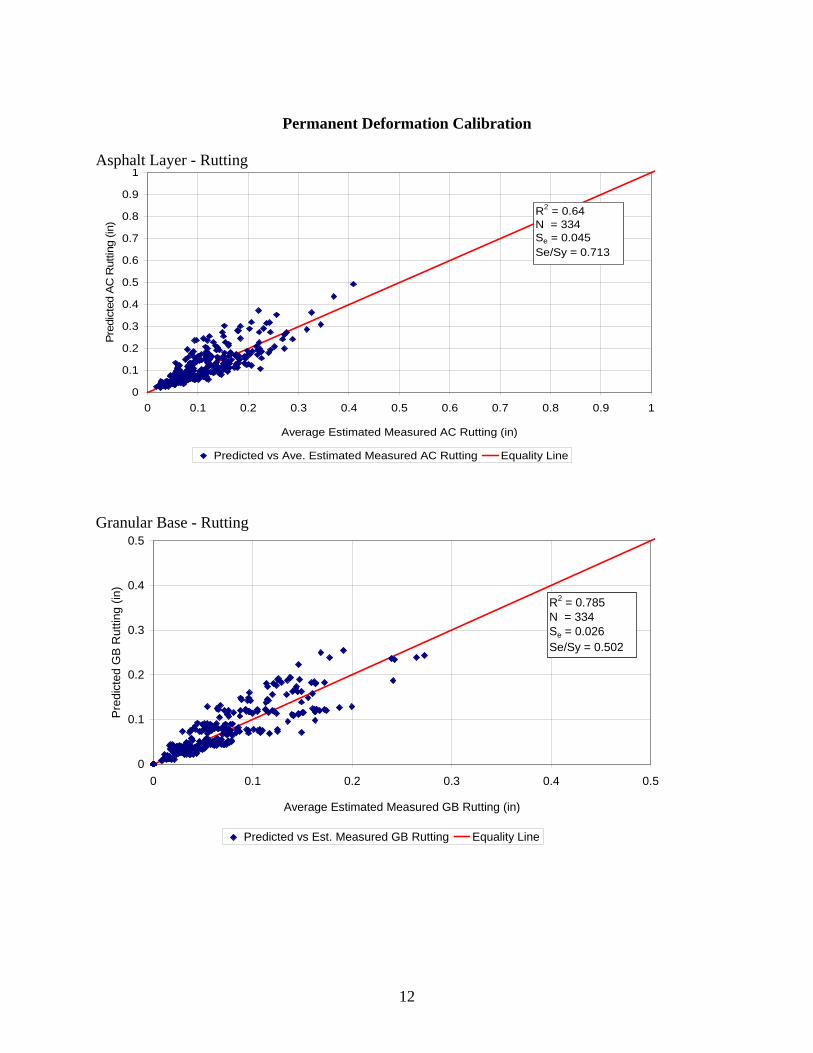
Permanent Deformation Calibration
Asphalt Layer - Rutting
0
0.1
0.2
0.3
0.4
0.5
0.6
0.7
0.8
0.9
1
0 0.1 0.2 0.3 0.4 0.5 0.6 0.7 0.8 0.9 1
Average Estimated Measured AC Rutting (in)
Pred
icte
d A
C R
uttin
g (in
)
Predicted vs Ave. Estimated Measured AC Rutting Equality Line
R2 = 0.64N = 334Se = 0.045Se/Sy = 0.713
Granular Base - Rutting
0
0.1
0.2
0.3
0.4
0.5
0 0.1 0.2 0.3 0.4 0.5
Average Estimated Measured GB Rutting (in)
Pre
dict
ed G
B R
uttin
g (in
)
Predicted vs Est. Measured GB Rutting Equality Line
R2 = 0.785N = 334Se = 0.026Se/Sy = 0.502
13
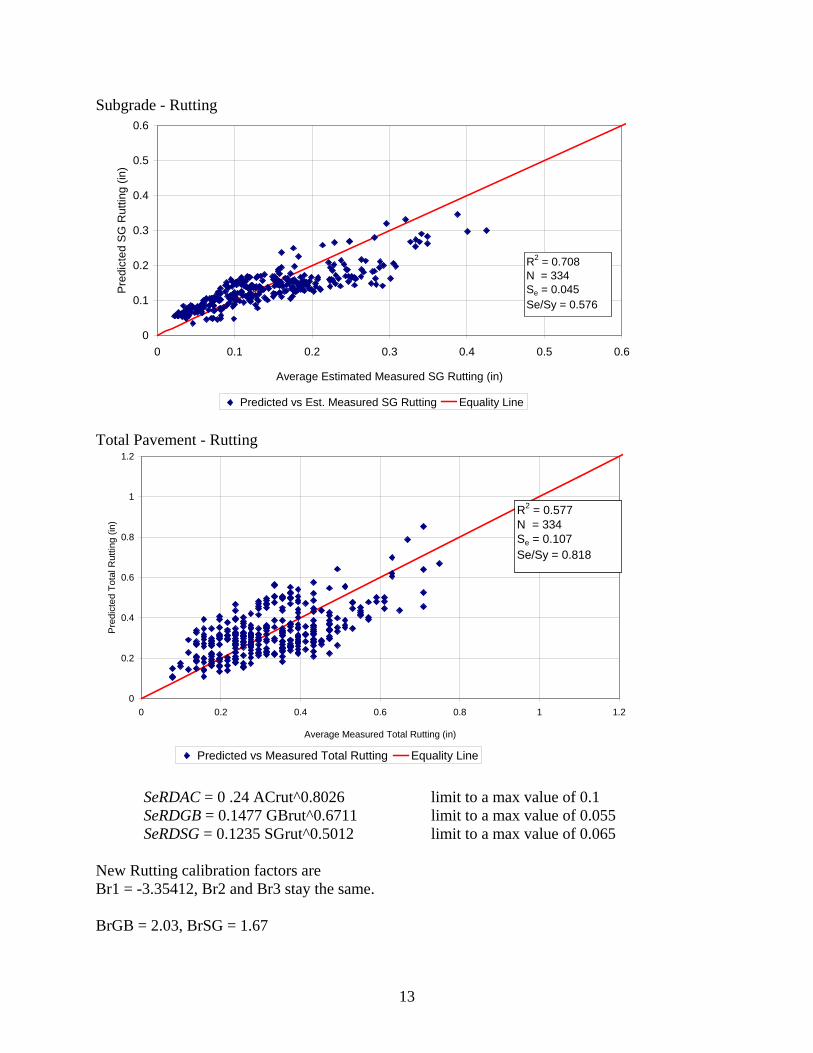
Subgrade - Rutting
0
0.1
0.2
0.3
0.4
0.5
0.6
0 0.1 0.2 0.3 0.4 0.5 0.6
Average Estimated Measured SG Rutting (in)
Pre
dict
ed S
G R
uttin
g (in
)
Predicted vs Est. Measured SG Rutting Equality Line
R2 = 0.708N = 334Se = 0.045Se/Sy = 0.576
Total Pavement - Rutting
0
0.2
0.4
0.6
0.8
1
1.2
0 0.2 0.4 0.6 0.8 1 1.2
Average Measured Total Rutting (in)
Pre
dict
ed T
otal
Rut
ting
(in)
Predicted vs Measured Total Rutting Equality Line
R2 = 0.577N = 334Se = 0.107Se/Sy = 0.818
SeRDAC = 0 .24 ACrut^0.8026 limit to a max value of 0.1 SeRDGB = 0.1477 GBrut^0.6711 limit to a max value of 0.055 SeRDSG = 0.1235 SGrut^0.5012 limit to a max value of 0.065
New Rutting calibration factors are Br1 = -3.35412, Br2 and Br3 stay the same. BrGB = 2.03, BrSG = 1.67
14
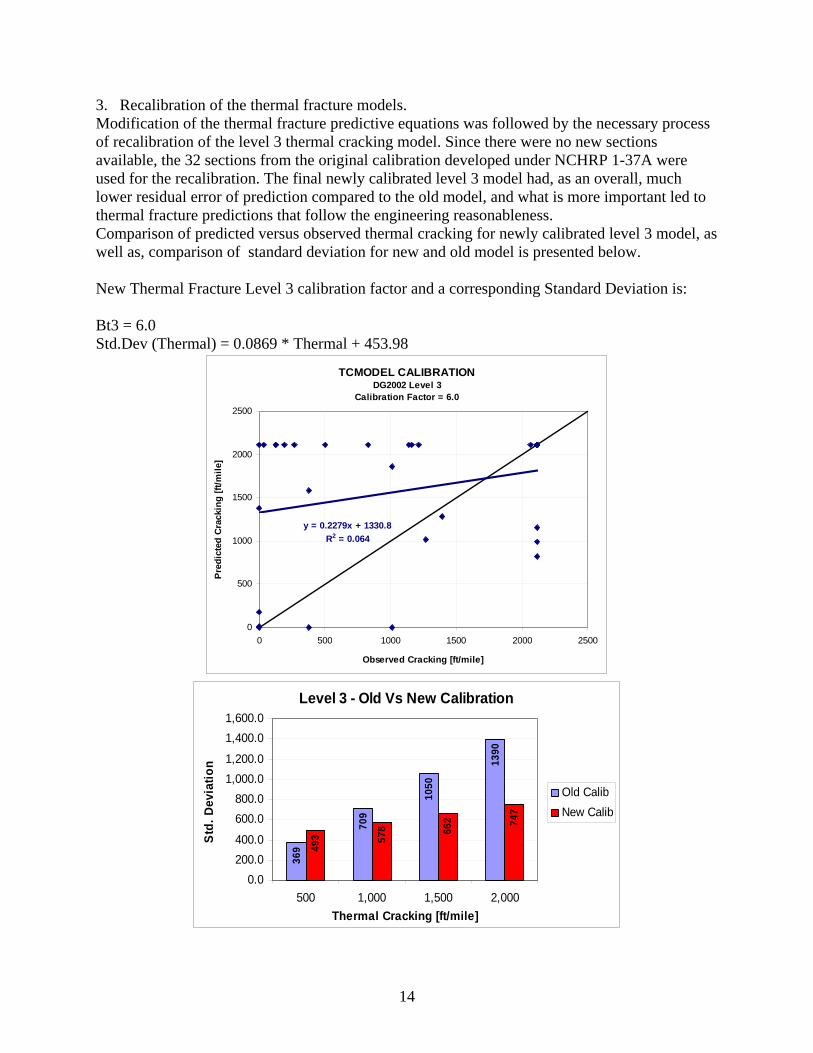
3. Recalibration of the thermal fracture models. Modification of the thermal fracture predictive equations was followed by the necessary process of recalibration of the level 3 thermal cracking model. Since there were no new sections available, the 32 sections from the original calibration developed under NCHRP 1-37A were used for the recalibration. The final newly calibrated level 3 model had, as an overall, much lower residual error of prediction compared to the old model, and what is more important led to thermal fracture predictions that follow the engineering reasonableness. Comparison of predicted versus observed thermal cracking for newly calibrated level 3 model, as well as, comparison of standard deviation for new and old model is presented below. New Thermal Fracture Level 3 calibration factor and a corresponding Standard Deviation is: Bt3 = 6.0 Std.Dev (Thermal) = 0.0869 * Thermal + 453.98
TCMODEL CALIBRATIONDG2002 Level 3
Calibration Factor = 6.0
y = 0.2279x + 1330.8R2 = 0.064
0
500
1000
1500
2000
2500
0 500 1000 1500 2000 2500
Observed Cracking [ft/mile]
Pred
icte
d C
rack
ing
[ft/m
ile]
Level 3 - Old Vs New Calibration
369
709
1050
1390
578 66
2 747
493
0.0200.0400.0
600.0800.0
1,000.01,200.0
1,400.01,600.0
500 1,000 1,500 2,000Thermal Cracking [ft/mile]
Std.
Dev
iatio
n
Old CalibNew Calib
15
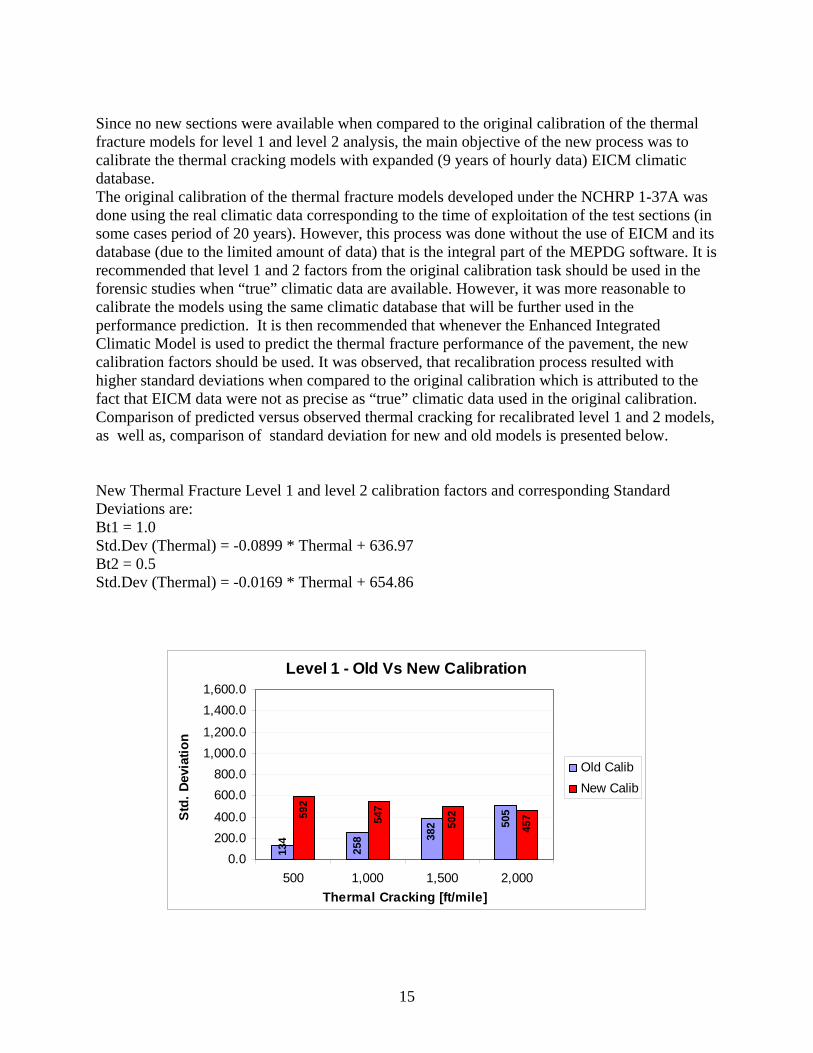
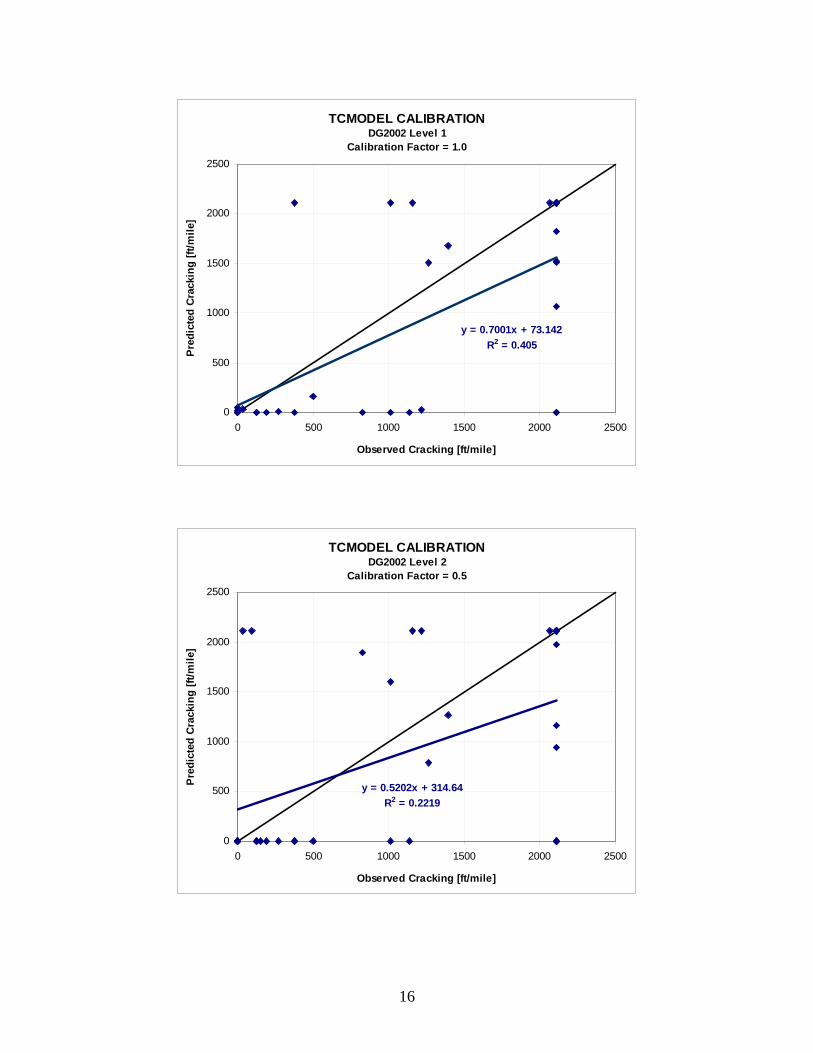
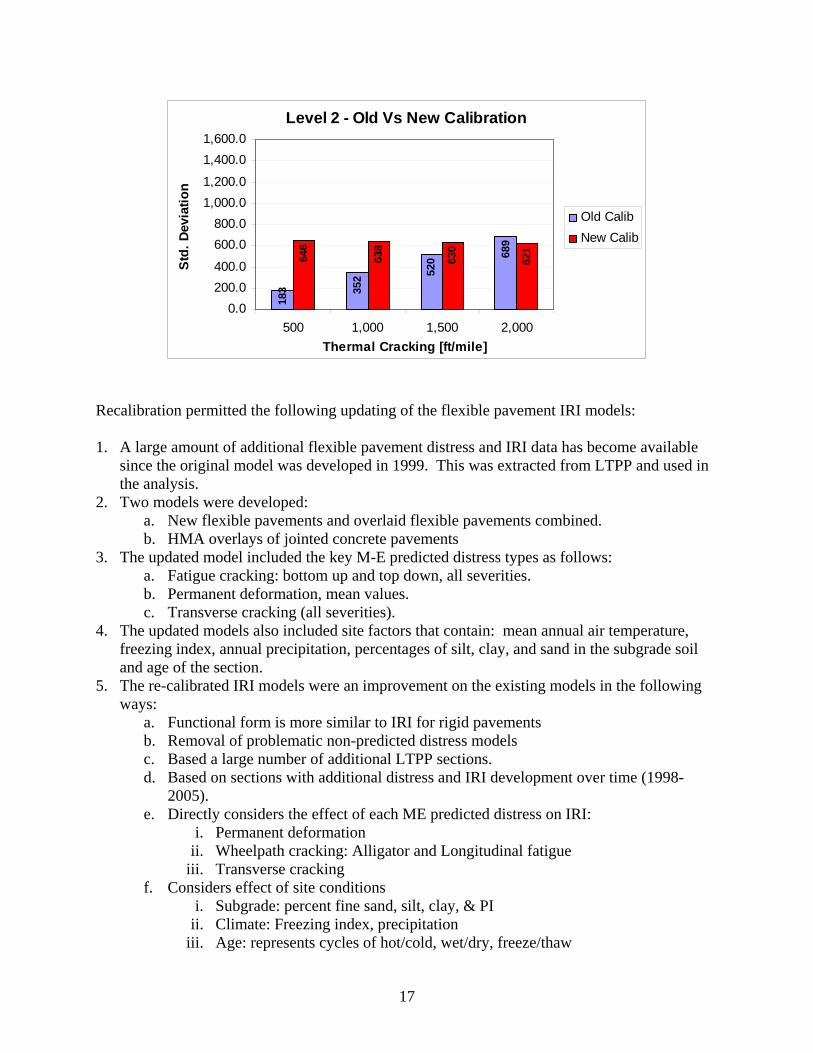
Since no new sections were available when compared to the original calibration of the thermal fracture models for level 1 and level 2 analysis, the main objective of the new process was to calibrate the thermal cracking models with expanded (9 years of hourly data) EICM climatic database. The original calibration of the thermal fracture models developed under the NCHRP 1-37A was done using the real climatic data corresponding to the time of exploitation of the test sections (in some cases period of 20 years). However, this process was done without the use of EICM and its database (due to the limited amount of data) that is the integral part of the MEPDG software. It is recommended that level 1 and 2 factors from the original calibration task should be used in the forensic studies when “true” climatic data are available. However, it was more reasonable to calibrate the models using the same climatic database that will be further used in the performance prediction. It is then recommended that whenever the Enhanced Integrated Climatic Model is used to predict the thermal fracture performance of the pavement, the new calibration factors should be used. It was observed, that recalibration process resulted with higher standard deviations when compared to the original calibration which is attributed to the fact that EICM data were not as precise as “true” climatic data used in the original calibration. Comparison of predicted versus observed thermal cracking for recalibrated level 1 and 2 models, as well as, comparison of standard deviation for new and old models is presented below. New Thermal Fracture Level 1 and level 2 calibration factors and corresponding Standard Deviations are: Bt1 = 1.0 Std.Dev (Thermal) = -0.0899 * Thermal + 636.97 Bt2 = 0.5 Std.Dev (Thermal) = -0.0169 * Thermal + 654.86
Level 1 - Old Vs New Calibration
134
258 38
2 50559
2
547
502
457
0.0200.0400.0
600.0800.0
1,000.01,200.0
1,400.01,600.0
500 1,000 1,500 2,000Thermal Cracking [ft/mile]
Std.
Dev
iatio
n
Old CalibNew Calib
16
TCMODEL CALIBRATIONDG2002 Level 1
Calibration Factor = 1.0
y = 0.7001x + 73.142R2 = 0.405
0
500
1000
1500
2000
2500
0 500 1000 1500 2000 2500
Observed Cracking [ft/mile]
Pred
icte
d Cr
acki
ng [f
t/mile
]
TCMODEL CALIBRATIONDG2002 Level 2
Calibration Factor = 0.5
y = 0.5202x + 314.64R2 = 0.2219
0
500
1000
1500
2000
2500
0 500 1000 1500 2000 2500
Observed Cracking [ft/mile]
Pred
icte
d Cr
acki
ng [f
t/mile
]
17
Level 2 - Old Vs New Calibration
183 35
2 520 68
9
638
630
621
646
0.0200.0400.0
600.0800.0
1,000.01,200.0
1,400.01,600.0
500 1,000 1,500 2,000Thermal Cracking [ft/mile]
Std.
Dev
iatio
n
Old CalibNew Calib
Recalibration permitted the following updating of the flexible pavement IRI models:
1. A large amount of additional flexible pavement distress and IRI data has become available since the original model was developed in 1999. This was extracted from LTPP and used in the analysis.
2. Two models were developed: a. New flexible pavements and overlaid flexible pavements combined. b. HMA overlays of jointed concrete pavements
3. The updated model included the key M-E predicted distress types as follows: a. Fatigue cracking: bottom up and top down, all severities. b. Permanent deformation, mean values. c. Transverse cracking (all severities).
4. The updated models also included site factors that contain: mean annual air temperature, freezing index, annual precipitation, percentages of silt, clay, and sand in the subgrade soil and age of the section.
5. The re-calibrated IRI models were an improvement on the existing models in the following ways:
a. Functional form is more similar to IRI for rigid pavements b. Removal of problematic non-predicted distress models c. Based a large number of additional LTPP sections. d. Based on sections with additional distress and IRI development over time (1998-
2005). e. Directly considers the effect of each ME predicted distress on IRI:
i. Permanent deformation ii. Wheelpath cracking: Alligator and Longitudinal fatigue
iii. Transverse cracking f. Considers effect of site conditions
i. Subgrade: percent fine sand, silt, clay, & PI ii. Climate: Freezing index, precipitation
iii. Age: represents cycles of hot/cold, wet/dry, freeze/thaw
18
g. Sensitivity shows reasonableness of effects of distress on IRI. h. Far larger database of sections
i. Flexible pavement IRI: 1950 vs 1578 ii. Five years of additional distress development (better determine effect on IRI)
iii. Standard error of prediction slightly lower iv. 18.9 vs 24.5 in/mi
6. Variance models were developed for use in reliability design with IRI. They produce realistic results and are similar to those developed for IRI of rigid pavements.
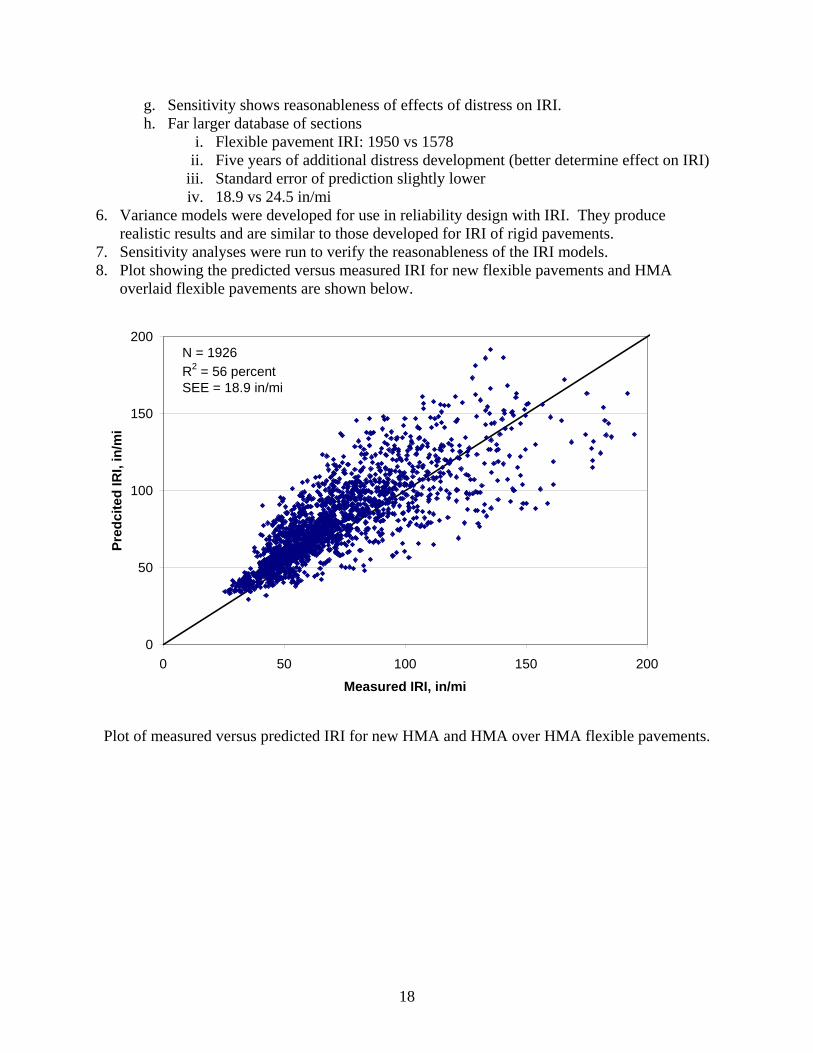
7. Sensitivity analyses were run to verify the reasonableness of the IRI models. 8. Plot showing the predicted versus measured IRI for new flexible pavements and HMA
overlaid flexible pavements are shown below.
0
50
100
150
200
0 50 100 150 200
Measured IRI, in/mi
Pred
cite
d IR
I, in
/mi
N = 1926R2 = 56 percentSEE = 18.9 in/mi
Plot of measured versus predicted IRI for new HMA and HMA over HMA flexible pavements.
19
0
25
50
75
100
125
150
0 25 50 75 100 125 150
Measured IRI, in/mi
Pred
icte
d IR
I, in
/mi
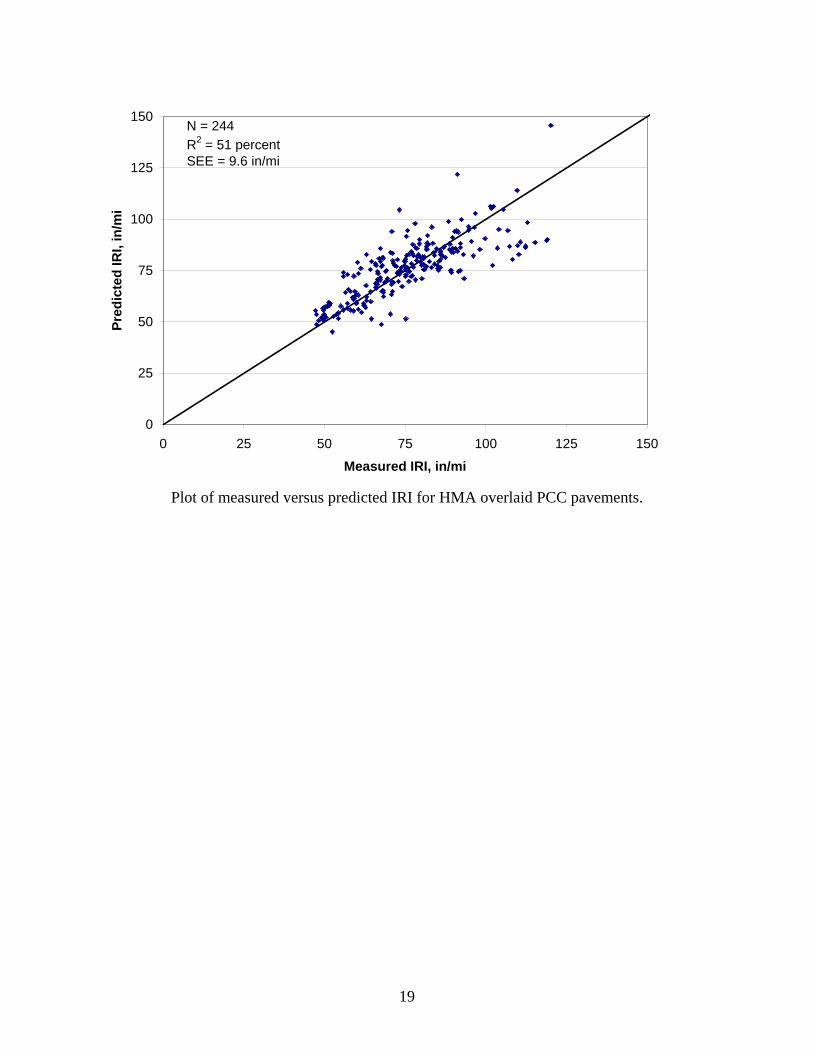
N = 244R2 = 51 percentSEE = 9.6 in/mi
Plot of measured versus predicted IRI for HMA overlaid PCC pavements.
20
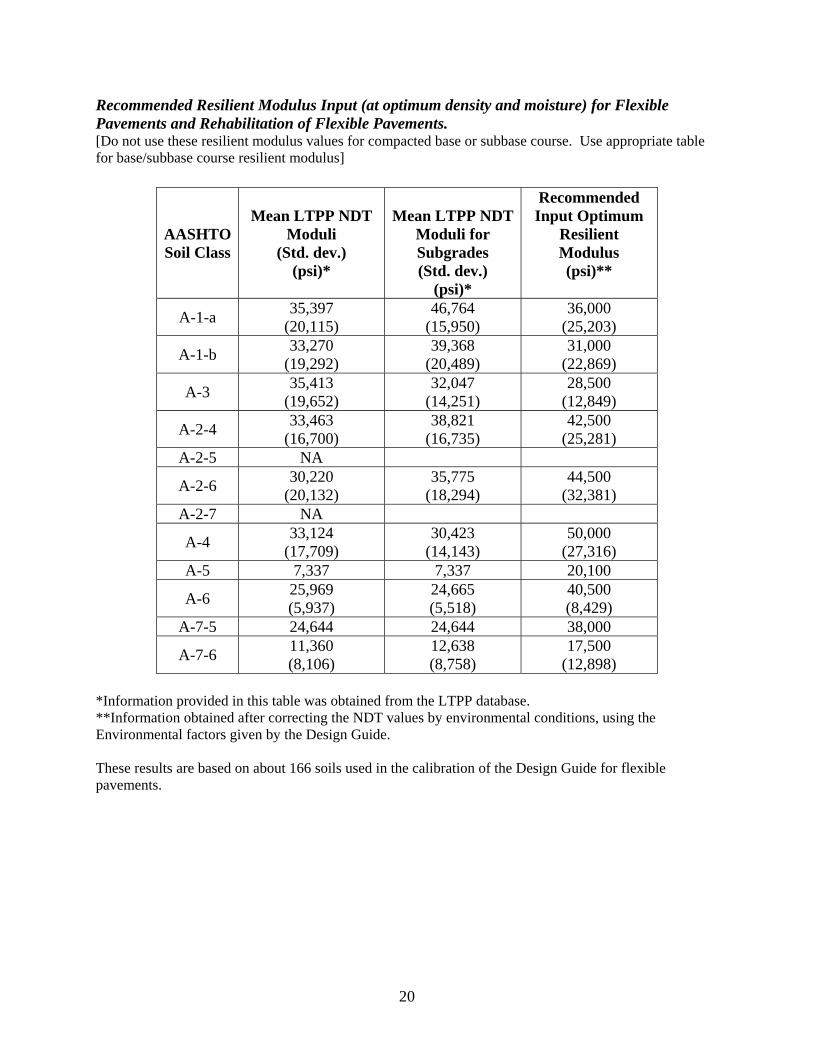
Recommended Resilient Modulus Input (at optimum density and moisture) for Flexible Pavements and Rehabilitation of Flexible Pavements. [Do not use these resilient modulus values for compacted base or subbase course. Use appropriate table for base/subbase course resilient modulus]
AASHTO Soil Class
Mean LTPP NDT Moduli
(Std. dev.) (psi)*
Mean LTPP NDT
Moduli for Subgrades (Std. dev.)
(psi)*
Recommended Input Optimum
Resilient Modulus (psi)**
A-1-a 35,397 (20,115)
46,764 (15,950)
36,000 (25,203)
A-1-b 33,270 (19,292)
39,368 (20,489)
31,000 (22,869)
A-3 35,413 (19,652)
32,047 (14,251)
28,500 (12,849)
A-2-4 33,463 (16,700)
38,821 (16,735)
42,500 (25,281)
A-2-5 NA
A-2-6 30,220 (20,132)
35,775 (18,294)
44,500 (32,381)
A-2-7 NA
A-4 33,124 (17,709)
30,423 (14,143)
50,000 (27,316)
A-5 7,337 7,337 20,100
A-6 25,969 (5,937)
24,665 (5,518)
40,500 (8,429)
A-7-5 24,644 24,644 38,000
A-7-6 11,360 (8,106)
12,638 (8,758)
17,500 (12,898)
*Information provided in this table was obtained from the LTPP database. **Information obtained after correcting the NDT values by environmental conditions, using the Environmental factors given by the Design Guide. These results are based on about 166 soils used in the calibration of the Design Guide for flexible pavements.
21
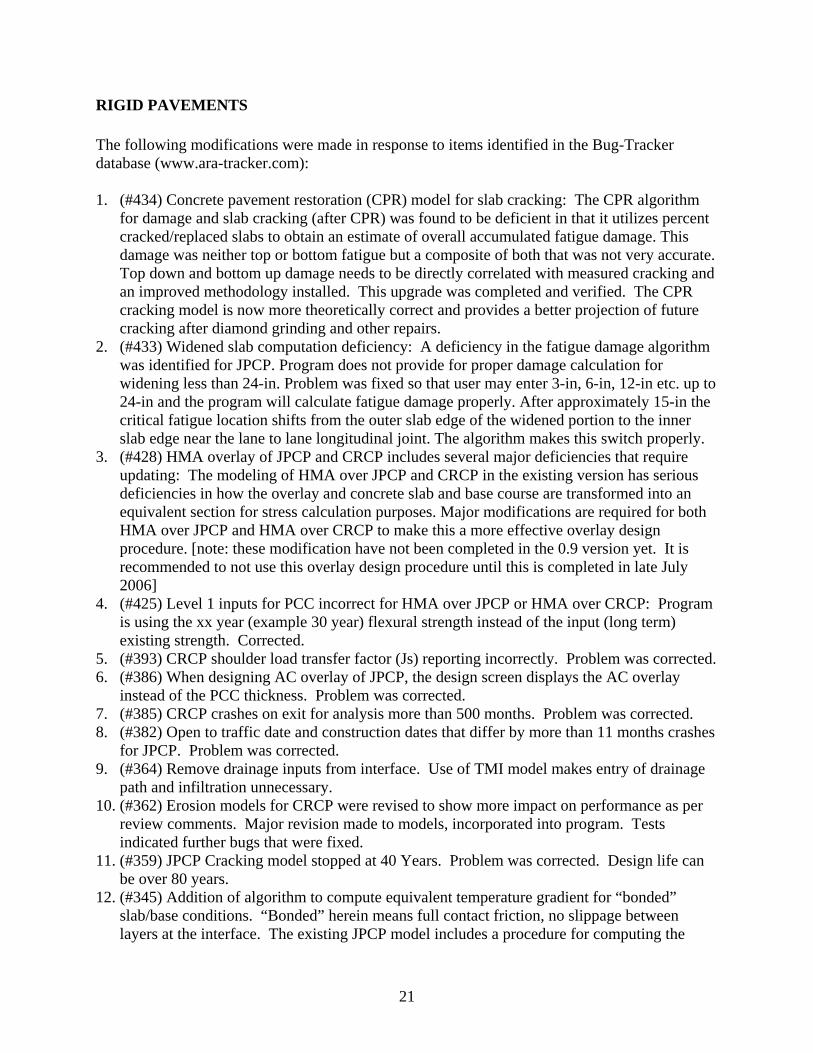
RIGID PAVEMENTS The following modifications were made in response to items identified in the Bug-Tracker database (www.ara-tracker.com): 1. (#434) Concrete pavement restoration (CPR) model for slab cracking: The CPR algorithm
for damage and slab cracking (after CPR) was found to be deficient in that it utilizes percent cracked/replaced slabs to obtain an estimate of overall accumulated fatigue damage. This damage was neither top or bottom fatigue but a composite of both that was not very accurate. Top down and bottom up damage needs to be directly correlated with measured cracking and an improved methodology installed. This upgrade was completed and verified. The CPR cracking model is now more theoretically correct and provides a better projection of future cracking after diamond grinding and other repairs.
2. (#433) Widened slab computation deficiency: A deficiency in the fatigue damage algorithm was identified for JPCP. Program does not provide for proper damage calculation for widening less than 24-in. Problem was fixed so that user may enter 3-in, 6-in, 12-in etc. up to 24-in and the program will calculate fatigue damage properly. After approximately 15-in the critical fatigue location shifts from the outer slab edge of the widened portion to the inner slab edge near the lane to lane longitudinal joint. The algorithm makes this switch properly.
3. (#428) HMA overlay of JPCP and CRCP includes several major deficiencies that require updating: The modeling of HMA over JPCP and CRCP in the existing version has serious deficiencies in how the overlay and concrete slab and base course are transformed into an equivalent section for stress calculation purposes. Major modifications are required for both HMA over JPCP and HMA over CRCP to make this a more effective overlay design procedure. [note: these modification have not been completed in the 0.9 version yet. It is recommended to not use this overlay design procedure until this is completed in late July 2006]
4. (#425) Level 1 inputs for PCC incorrect for HMA over JPCP or HMA over CRCP: Program is using the xx year (example 30 year) flexural strength instead of the input (long term) existing strength. Corrected.
5. (#393) CRCP shoulder load transfer factor (Js) reporting incorrectly. Problem was corrected. 6. (#386) When designing AC overlay of JPCP, the design screen displays the AC overlay
instead of the PCC thickness. Problem was corrected. 7. (#385) CRCP crashes on exit for analysis more than 500 months. Problem was corrected. 8. (#382) Open to traffic date and construction dates that differ by more than 11 months crashes
for JPCP. Problem was corrected. 9. (#364) Remove drainage inputs from interface. Use of TMI model makes entry of drainage
path and infiltration unnecessary. 10. (#362) Erosion models for CRCP were revised to show more impact on performance as per
review comments. Major revision made to models, incorporated into program. Tests indicated further bugs that were fixed.
11. (#359) JPCP Cracking model stopped at 40 Years. Problem was corrected. Design life can be over 80 years.
12. (#345) Addition of algorithm to compute equivalent temperature gradient for “bonded” slab/base conditions. “Bonded” herein means full contact friction, no slippage between layers at the interface. The existing JPCP model includes a procedure for computing the
22
equivalent linear temperature gradient through the concrete slab given a non-linear gradient. The procedure assumes that the slab and base are unbonded. A similar procedure is needed to compute an equivalent linear temperature gradient through the concrete slab for bonded (no slippage, full contact friction) conditions. The significance of the bonding condition has been determined to be very high. This change required a change to the linearization and damage calculation algorithms of the M-E PDG cracking model. Note: it was discovered that an error existed in the 2004 Version 0.700 of the Design Guide wherein bonding of slab and base only lasted for 12 months, regardless of the input by the user. This was fixed under #343 and contact friction or bonding now works properly.
13. (#344) Modification of JPCP computational algorithm that includes "design periods" due to various problems. JPCP computational algorithm includes periods of time (1 yr, 1 yr, 1 yr, 2 yrs, 3 yrs, 5 yrs, etc.) over which fatigue damage is being computed throughout the design analysis period. These were introduced to reduce the run time. An error has recently been identified in conjunction with the "bonding" slab/base algorithm and extrapolation procedures over the design periods that is not easily solved. The design period procedure may not have as much effect on computer run time as previously thought and it was modified so that the damage accumulation will be done month by month and year by year using exact strength, modulus, contact friction, k-values etc. This approach will also help the implementation of other features into the JPCP design procedure. CRCP already works in this way.
14. (#343) Contact friction between concrete slab and base course (commonly called “bonding”) has an error in computational algorithm. User has option of selecting the number of months over which the slab and base will remained "bonded" (this is really contact friction). Some sensitivity analysis indicated this input to have small effect. Investigation showed that there is an error in the coding that is causing this result. Subsequent runs and the calibration process indicated that most slabs and base courses show full contract friction over their lives than previously believed. Design input recommendations were revised.
15. (#241) Difference in CRCP results between program estimated crack spacing and user input crack spacing. There was a difference in CRCP output results when the program uses the internal model to predict crack spacing and when the user inputs the exact same crack spacing. For example, if the program model predicts 31.7 in, and this is input and the program re-run, a different output may result. Problem fixed.
16. (#240) Permanent curl/warp input needs further examination to determine improved estimation procedures. Currently, a -10F is recommended for design. This is inadequate as the permanent curl/warp is known to depend on several key factors. Develop procedures to estimate the permanent curl/warp input for JPCP and CRCP separately. Through the calibration process, attempt to identify values or relationships that will minimize error of prediction for all JPCP and CRCP distress models. There was not sufficient time and resources to solve this problem at this time. It is recommended that it be addressed in the next program version.
17. (#239) Base erosion index does not appear to have adequate sensitivity to performance. Evaluated the impact of the base erosion index on performance of CRCP and JPCP and determined that it needed improvement. New erosion models were derived for each type of base course and subgrade type to that the loss of support along the edge is computed automatically, not dependent on user input of erosion factor.
23
18. (#238) Add CRCP design criteria to Output Reliability Screen: Crack Width, Crack LTE, Crack Spacing. CRCP design criteria include crack width, crack spacing, and crack LTE in addition to punchouts. These were added to the Reliability output screen to emphasize that they are just as important as punchouts and IRI (even though there is not a reliability level associated with them).
a. Crack Width < 0.02 in b. Crack LTE > 95% c. Crack spacing 3 to 6 ft
The following modifications were completed, but were not included in the Bug Tracker database: 1. The definition of a CRCP punchout was revised based on review comments to include only
medium and high severity punchouts and y-cracks. Distress maps for all CRCP sections were reviewed and the correct number of punchouts (including y-cracks) was included for each time frame. This change is reflected in the design input recommendations for critical levels for design.
2. The AC/JPCP or AC/CRCP overlay design procedure was found to contain various technical deficiencies. One problem was that the 2004 version did not fully consider the width of transverse crack (after many years of aging), their load transfer efficiency (which may have deteriorated), and the extent of erosion along the slab edge that exists in the field at the time of placement of a new overlay. In addition, procedures to calculate the equivalent slab thickness (where the overlay is combined with the CRCP slab) with proper full friction included errors. These are being fixed in the software and this type of overlay tested to ensure reasonableness. This fix is not yet in 0.900 version but will be in the next version.
3. A major effort was expended to recalibrate all of the JPCP, CRCP, and rehabilitation distress models including: joint faulting (new and rehab), slab top down and bottom up cracking (new and rehab), punchout (new and rehab), and crack spacing. The final newly calibrated models had (1) a lower model error even with an expanded data set, (2) reasonable sensitivity to changes in inputs, (3) more robust due to an expanded data set, and (4) improved reliability than those originally developed under NCHRP 1-37A. Major steps in this effort included the following.
a. Improvement of the database. i. Updating all existing sections with 4-5 additional years of performance data,
traffic data, materials data, climatic data, and rehabilitation data. ii. Identification of additional LTPP and other sections for inclusion in the
calibration. iii. Incorporation of the weather stations that included 9 years of historic hourly
data. iv. Establishment of the proper input subgrade resilient modulus through an
iterative process that included backcalculation of in situ moduli for the sections.
b. Re-established the model coefficients for all of the models using the expanded database.
c. Re-established the reliability model coefficients for all of the models using the expanded database.
24
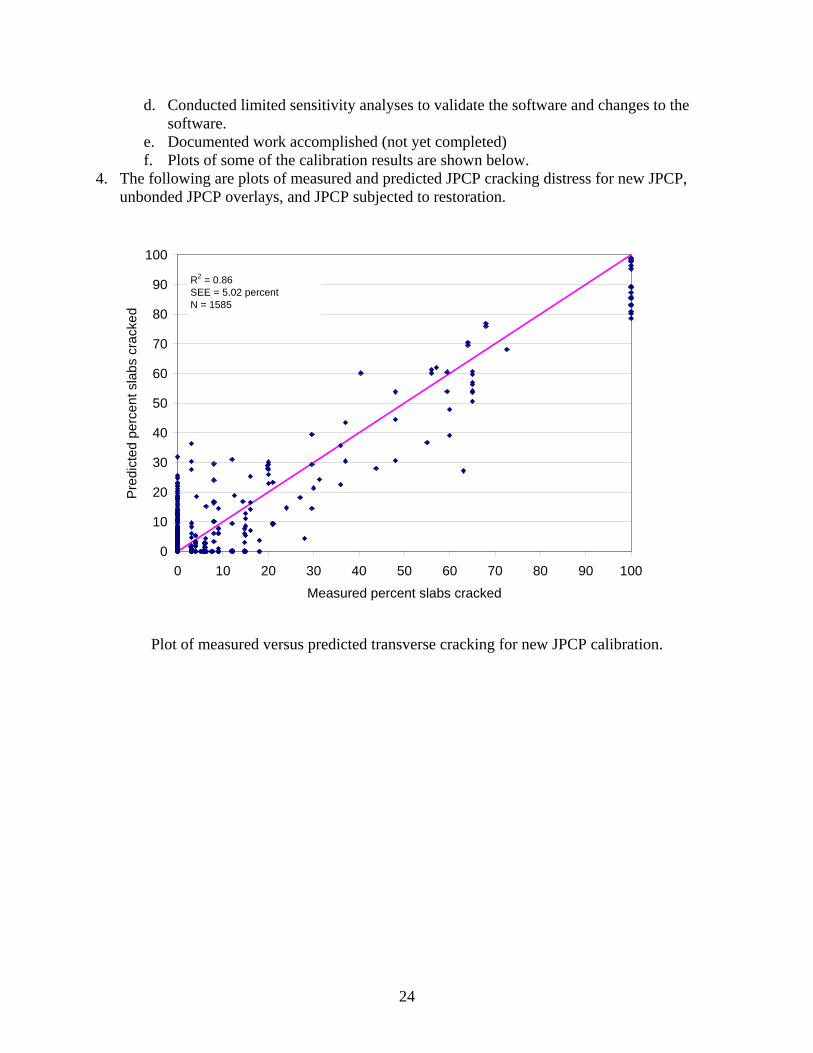
d. Conducted limited sensitivity analyses to validate the software and changes to the software.
e. Documented work accomplished (not yet completed) f. Plots of some of the calibration results are shown below.
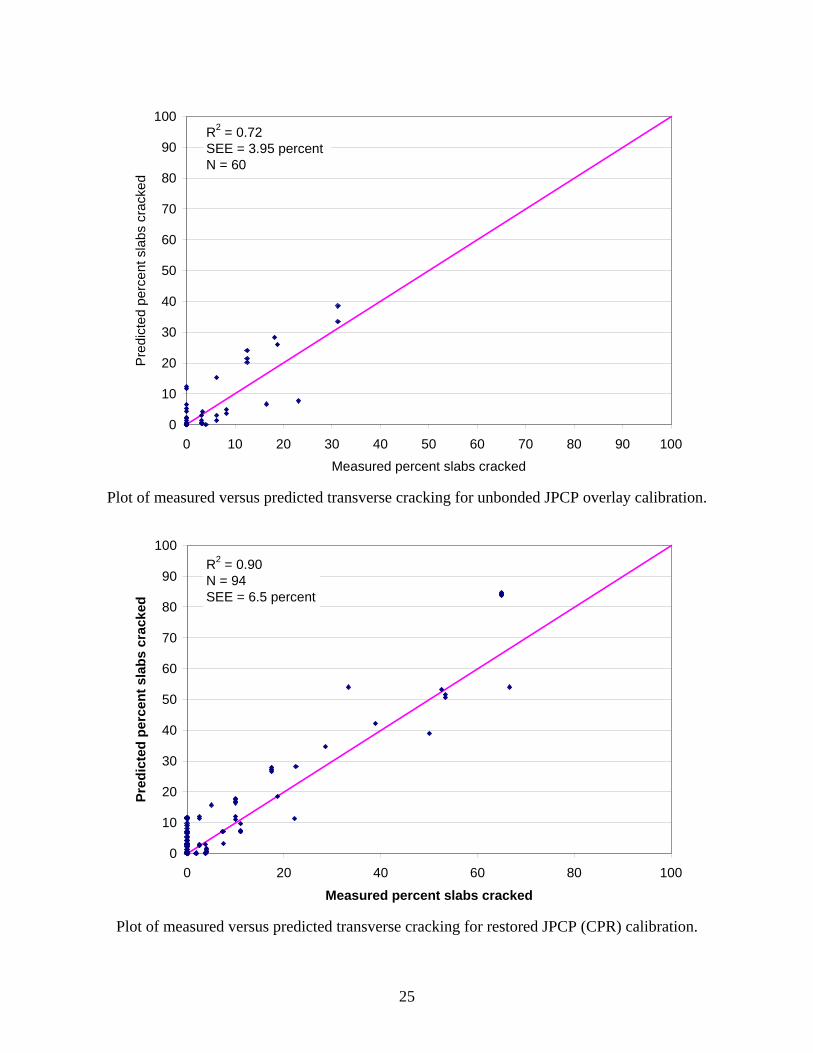
4. The following are plots of measured and predicted JPCP cracking distress for new JPCP, unbonded JPCP overlays, and JPCP subjected to restoration.
0
10
20
30
40
50
60
70
80
90
100
0 10 20 30 40 50 60 70 80 90 100Measured percent slabs cracked
Pre
dict
ed p
erce
nt s
labs
cra
cked
R2 = 0.86SEE = 5.02 percentN = 1585
Plot of measured versus predicted transverse cracking for new JPCP calibration.
25
0
10
20
30
40
50
60
70
80
90
100
0 10 20 30 40 50 60 70 80 90 100Measured percent slabs cracked
Pre
dict
ed p
erce
nt s
labs
cra
cked
R2 = 0.72SEE = 3.95 percentN = 60
Plot of measured versus predicted transverse cracking for unbonded JPCP overlay calibration.
0
10
20
30
40
50
60
70
80
90
100
0 20 40 60 80 100
Measured percent slabs cracked
Pred
icte
d pe
rcen
t sla
bs c
rack
ed
R2 = 0.90N = 94SEE = 6.5 percent
Plot of measured versus predicted transverse cracking for restored JPCP (CPR) calibration.
26
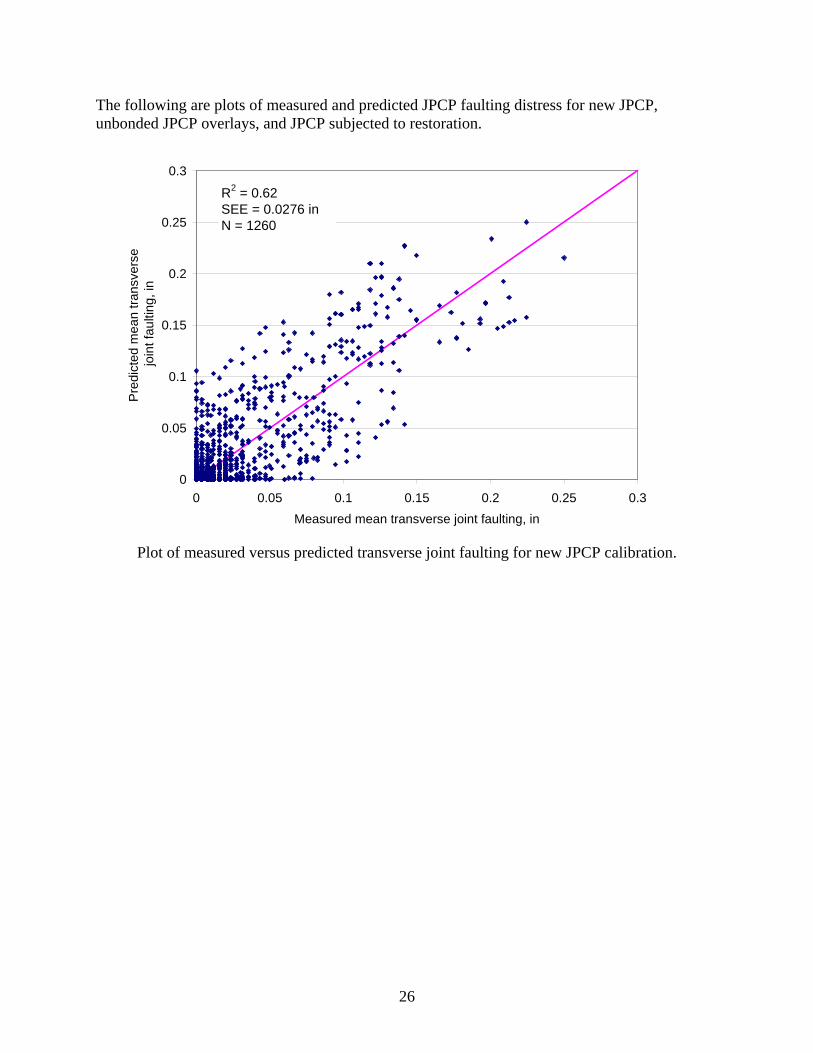
The following are plots of measured and predicted JPCP faulting distress for new JPCP, unbonded JPCP overlays, and JPCP subjected to restoration.
0
0.05
0.1
0.15
0.2
0.25
0.3
0 0.05 0.1 0.15 0.2 0.25 0.3Measured mean transverse joint faulting, in
Pre
dict
ed m
ean
trans
vers
e jo
int f
aulti
ng, i
n
R2 = 0.62SEE = 0.0276 inN = 1260
Plot of measured versus predicted transverse joint faulting for new JPCP calibration.
27
0.00
0.05
0.10
0.15
0.20
0.25
0.30
0.00 0.05 0.10 0.15 0.20 0.25 0.30Measured mean transverse joint faulting, in
Pre
dict
ed m
ean
trans
vers
ejo
int f
aulti
ng, i
nR2 = 0.74SEE = 0.025 inN = 43
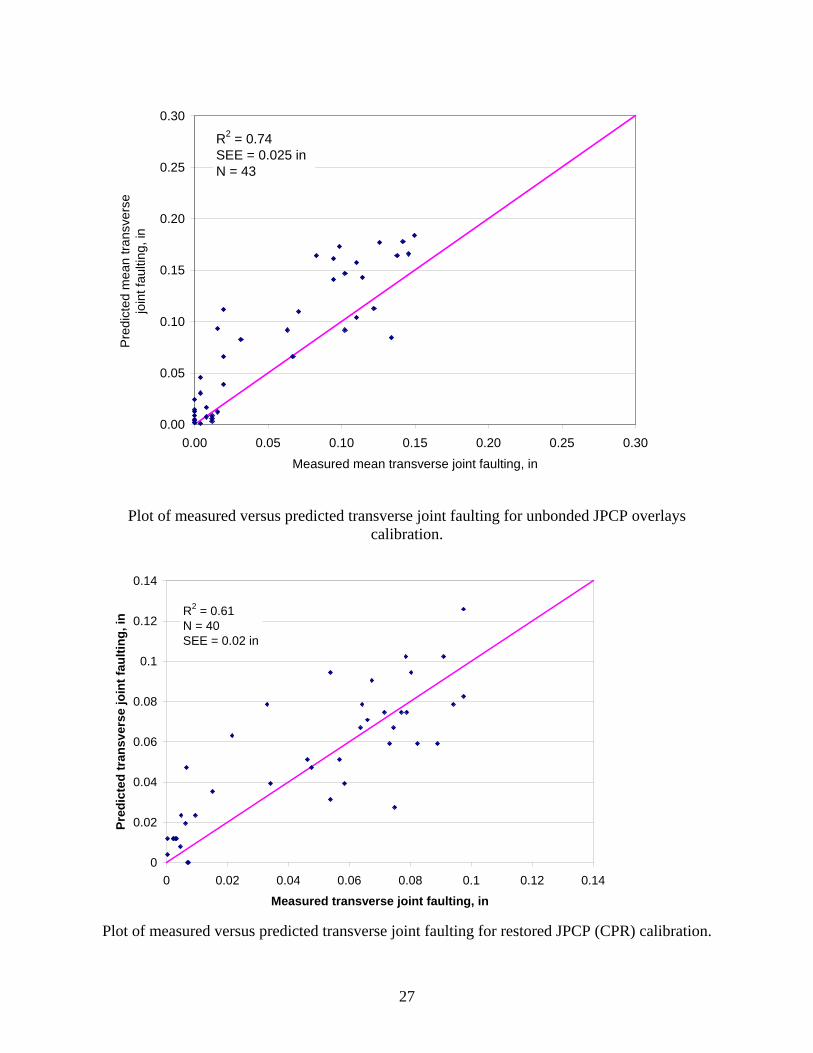
Plot of measured versus predicted transverse joint faulting for unbonded JPCP overlays calibration.
0
0.02
0.04
0.06
0.08
0.1
0.12
0.14
0 0.02 0.04 0.06 0.08 0.1 0.12 0.14
Measured transverse joint faulting, in
Pred
icte
d tr
ansv
erse
join
t fau
lting
, in R2 = 0.61
N = 40SEE = 0.02 in
Plot of measured versus predicted transverse joint faulting for restored JPCP (CPR) calibration.
28
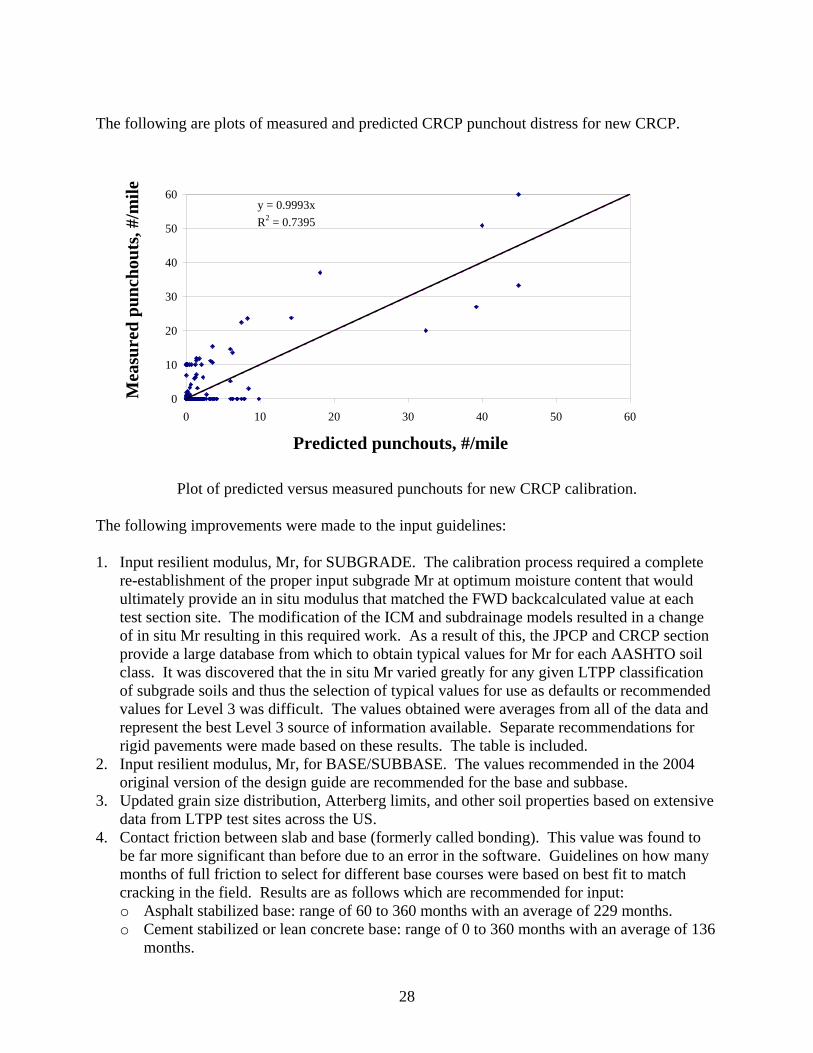
The following are plots of measured and predicted CRCP punchout distress for new CRCP.
y = 0.9993xR2 = 0.7395
0
10
20
30
40
50
60
0 10 20 30 40 50 60
Predicted punchouts, #/mile
Mea
sure
d pu
ncho
uts,
#/m
ile
Plot of predicted versus measured punchouts for new CRCP calibration. The following improvements were made to the input guidelines: 1. Input resilient modulus, Mr, for SUBGRADE. The calibration process required a complete
re-establishment of the proper input subgrade Mr at optimum moisture content that would ultimately provide an in situ modulus that matched the FWD backcalculated value at each test section site. The modification of the ICM and subdrainage models resulted in a change of in situ Mr resulting in this required work. As a result of this, the JPCP and CRCP section provide a large database from which to obtain typical values for Mr for each AASHTO soil class. It was discovered that the in situ Mr varied greatly for any given LTPP classification of subgrade soils and thus the selection of typical values for use as defaults or recommended values for Level 3 was difficult. The values obtained were averages from all of the data and represent the best Level 3 source of information available. Separate recommendations for rigid pavements were made based on these results. The table is included.
2. Input resilient modulus, Mr, for BASE/SUBBASE. The values recommended in the 2004 original version of the design guide are recommended for the base and subbase.
3. Updated grain size distribution, Atterberg limits, and other soil properties based on extensive data from LTPP test sites across the US.
4. Contact friction between slab and base (formerly called bonding). This value was found to be far more significant than before due to an error in the software. Guidelines on how many months of full friction to select for different base courses were based on best fit to match cracking in the field. Results are as follows which are recommended for input: o Asphalt stabilized base: range of 60 to 360 months with an average of 229 months. o Cement stabilized or lean concrete base: range of 0 to 360 months with an average of 136
months.
29
o Unbound material base: range of 0 to 360 months with an average of 245 months. o Lime stabilized base: range of 0 to 360 months with an average of 176 months. o Unbonded overlay (with HMA separation layer): zero months of full friction (bond) to
match cracking. o These values were used in the calibration and are recommended for design unless specific
efforts are made for full or reduced friction at the interface. 5. Recommendations for the modulus of existing PCC slabs for use in unbonded overlay design
were updated. 6. Permanent curl/warp gradient through slab. A value of -10 F was found in the original
calibration in 2002-2004 to provide the lowest error in slab cracking prediction. This value was used for nearly all projects of JPCP and CRCP in the 2006 calibration. However, those projects cured with water or constructed at night required a lower value (-3 F) and those built under harsh curing conditions (morning paving, sunshine, windy) often required greater than -10 F, even up to -25 F. Obviously, additional research is greatly needed to more clearly quantify this important input.
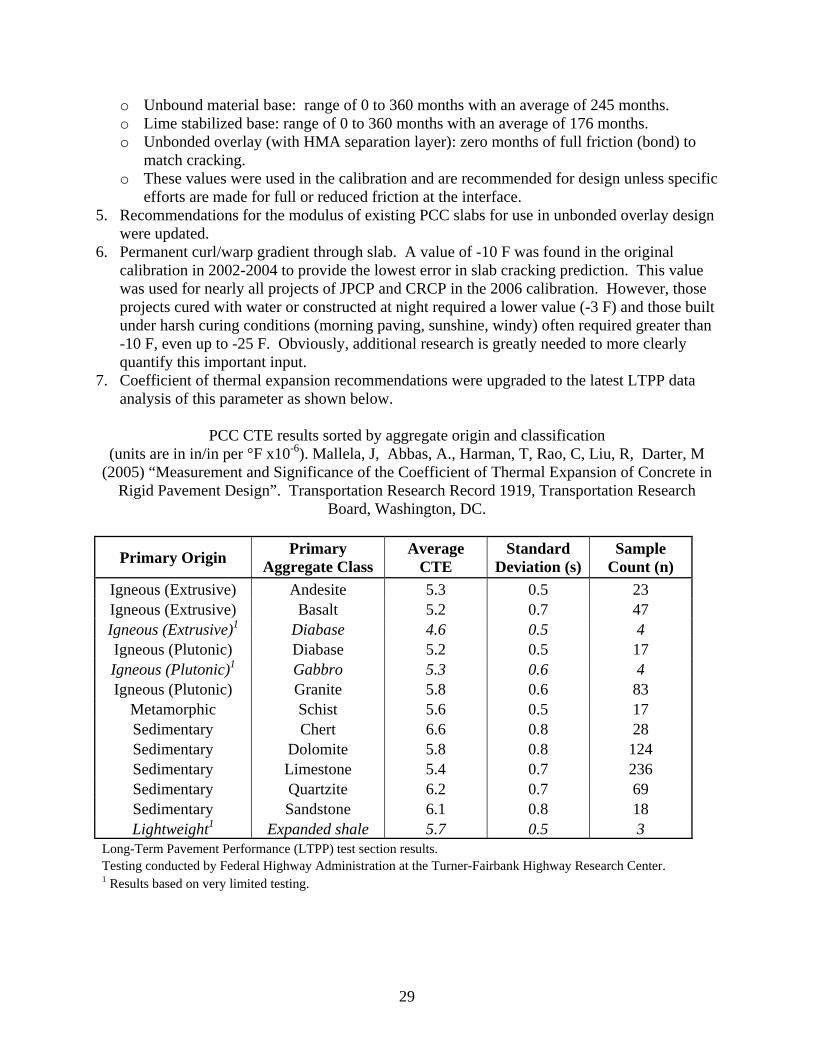
7. Coefficient of thermal expansion recommendations were upgraded to the latest LTPP data analysis of this parameter as shown below.
PCC CTE results sorted by aggregate origin and classification
(units are in in/in per °F x10-6). Mallela, J, Abbas, A., Harman, T, Rao, C, Liu, R, Darter, M (2005) “Measurement and Significance of the Coefficient of Thermal Expansion of Concrete in
Rigid Pavement Design”. Transportation Research Record 1919, Transportation Research Board, Washington, DC.
Primary Origin Primary Aggregate Class
Average CTE
Standard Deviation (s)
Sample Count (n)
Igneous (Extrusive) Andesite 5.3 0.5 23 Igneous (Extrusive) Basalt 5.2 0.7 47 Igneous (Extrusive)1 Diabase 4.6 0.5 4 Igneous (Plutonic) Diabase 5.2 0.5 17 Igneous (Plutonic)1 Gabbro 5.3 0.6 4 Igneous (Plutonic) Granite 5.8 0.6 83
Metamorphic Schist 5.6 0.5 17 Sedimentary Chert 6.6 0.8 28 Sedimentary Dolomite 5.8 0.8 124 Sedimentary Limestone 5.4 0.7 236 Sedimentary Quartzite 6.2 0.7 69 Sedimentary Sandstone 6.1 0.8 18 Lightweight1 Expanded shale 5.7 0.5 3
Long-Term Pavement Performance (LTPP) test section results. Testing conducted by Federal Highway Administration at the Turner-Fairbank Highway Research Center. 1 Results based on very limited testing.

30
8. Improved estimates of wheel base percentages were obtained from two states. They were
somewhat different than the 33, 33, and 34% assumed for short, medium, and long used in the original design guide calibration. Further study is needed to more firmly establish the wheel base percentages and then they will be used in a JPCP calibration.
Summary of major technical improvements in 0.9 version for rigid pavements:
1. Addition of algorithm to compute equivalent temperature gradient for “bonded” slab/base
conditions (unbonded only was available). This was used in calibration whenever full contact friction was specified.
2. Modification of JPCP computational algorithm so that it now includes month by month damage accumulation rather than accumulating over a multiyear period.
3. Fixed a bug in the algorithm for contact friction between concrete slab and base (“time to de-bond”). The full contact friction was only working for 12 month period in the 2004 version. The term “bond or bonding” was changed to “contact friction” to better describe the amount of slippage between the PCC slab and the base coarse. Recommendations were provided.
4. Erosion prediction for CRCP was improved. a. Calculates loss of support along edge over time as a function of:
i. Base type and quality ii. HMA: asphalt content
iii. CTB: Ec iv. Granular: fines content v. Annual precipitation
vi. Type and quality of subbase/subgrade (strength, fines) b. Erosion calculated for 10 years but uniformly accumulated year by year with practical
cap. 5. Re-calibrations of all JPCP and CRCP models were successful. Partial sensitivity indicates
the calibrated models are reasonable. Further sensitivity analyses are needed. 6. Re-calibration of all rehabilitation models for JPCP and CRCP were successful. 7. Results confirm that original 2004 models were valid over a much wider range of design
parameters and larger number of additional sections throughout the U.S. 8. Joint spacing for skewed joints was increased by the amount of skew in a 12-ft wide slab
(normally 2-ft) to account for increased curl/warp stresses over that of a perpendicular joint. 9. Improved recommendations for subgrade resilient modulus inputs are provided. 10. Slab widening algorithm for JPCP was improved to allow smaller widening values (e.g., 3 to
24-in) with proper calculation of fatigue damage at each edge of slab. 11. Concrete pavement restoration algorithm for cracking was upgraded to more accurately
predict top down and bottom up damage and cracking.
31
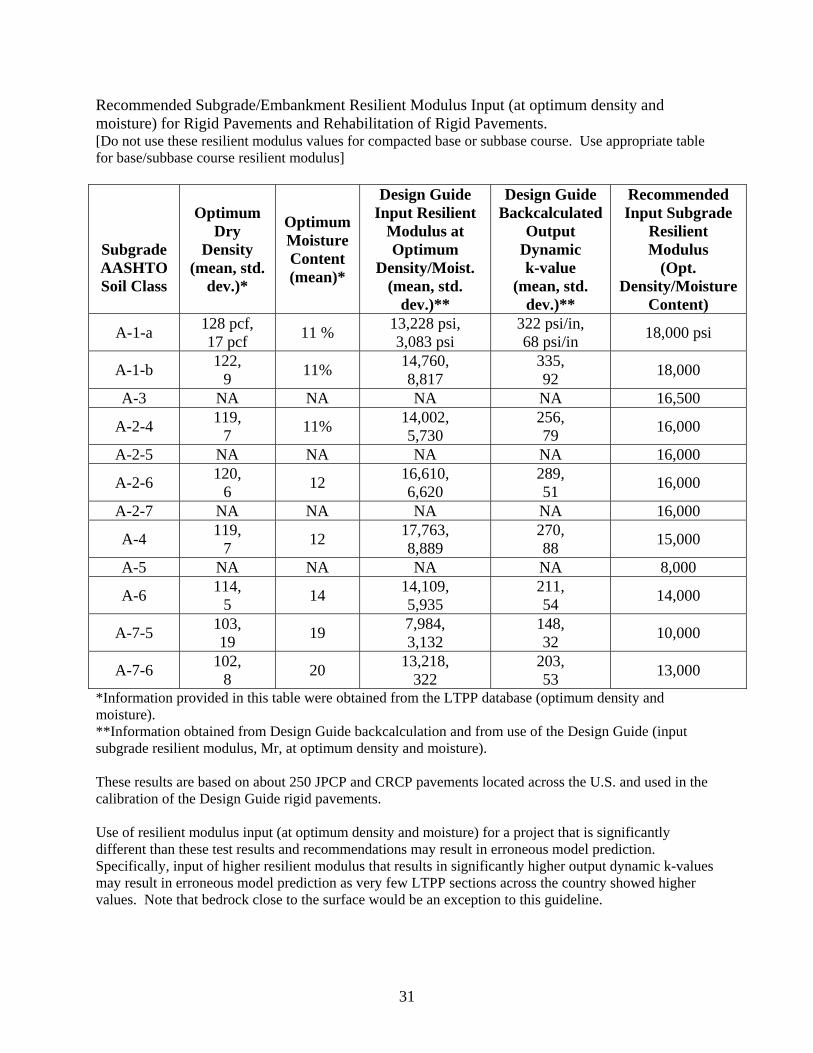
Recommended Subgrade/Embankment Resilient Modulus Input (at optimum density and moisture) for Rigid Pavements and Rehabilitation of Rigid Pavements. [Do not use these resilient modulus values for compacted base or subbase course. Use appropriate table for base/subbase course resilient modulus]
Subgrade AASHTO Soil Class
Optimum Dry
Density (mean, std.
dev.)*
Optimum Moisture Content (mean)*
Design Guide Input Resilient
Modulus at Optimum
Density/Moist. (mean, std.
dev.)**
Design Guide Backcalculated
Output Dynamic k-value
(mean, std. dev.)**
Recommended Input Subgrade
Resilient Modulus
(Opt. Density/Moisture
Content)
A-1-a 128 pcf, 17 pcf 11 % 13,228 psi,
3,083 psi 322 psi/in, 68 psi/in 18,000 psi
A-1-b 122, 9 11% 14,760,
8,817 335, 92 18,000
A-3 NA NA NA NA 16,500
A-2-4 119, 7 11% 14,002,
5,730 256, 79 16,000
A-2-5 NA NA NA NA 16,000
A-2-6 120, 6 12 16,610,
6,620 289, 51 16,000
A-2-7 NA NA NA NA 16,000
A-4 119, 7 12 17,763,
8,889 270, 88 15,000
A-5 NA NA NA NA 8,000
A-6 114, 5 14 14,109,
5,935 211, 54 14,000
A-7-5 103, 19 19 7,984,
3,132 148, 32 10,000
A-7-6 102, 8 20 13,218,
322 203, 53 13,000
*Information provided in this table were obtained from the LTPP database (optimum density and moisture). **Information obtained from Design Guide backcalculation and from use of the Design Guide (input subgrade resilient modulus, Mr, at optimum density and moisture). These results are based on about 250 JPCP and CRCP pavements located across the U.S. and used in the calibration of the Design Guide rigid pavements. Use of resilient modulus input (at optimum density and moisture) for a project that is significantly different than these test results and recommendations may result in erroneous model prediction. Specifically, input of higher resilient modulus that results in significantly higher output dynamic k-values may result in erroneous model prediction as very few LTPP sections across the country showed higher values. Note that bedrock close to the surface would be an exception to this guideline.