research report 070 - hse: information about health … · and injury-related) compensation claims...
TRANSCRIPT

HSE Health & Safety
Executive
Analysis of compensation claims related to health and safety issues
Prepared by System Concepts for the Health and Safety Executive 2003
RESEARCH REPORT 070

HSE Health & Safety
Executive
Analysis of compensation claims related to health and safety issues
Laura Peebles, Tanya Heasman and Vivienne Robertson
System Concepts 2 Savoy Court
London WC2R 0EZ
United Kingdom
This report details the findings of a research project to collect and analyse health and safety (accident and injury-related) compensation claims conducted via trade unions and law firms. Specific objectives of the study were to answer the following questions:
● What are the main types of claim?
● What are the main injuries sustained?
● What are the industry sectors which attract the highest proportion of claims?
● What are the work activities which give rise to the most claims?
● What breaches of the Regulations are most likely to attract claims?
● How long does it take for claims to be settled?
● What are the average costs of claims?
This report and the work it describes were funded by the HSE. Its contents, including any opinions and/or conclusions expressed, are those of the authors alone and do not necessarily reflect HSE policy.
HSE BOOKS

© Crown copyright 2003
First published 2003
ISBN 0 7176 2612 1
All rights reserved. No part of this publication may bereproduced, stored in a retrieval system, or transmitted inany form or by any means (electronic, mechanical,photocopying, recording or otherwise) without the priorwritten permission of the copyright owner.
Applications for reproduction should be made in writing to: Licensing Division, Her Majesty's Stationery Office, St Clements House, 2-16 Colegate, Norwich NR3 1BQ or by e-mail to [email protected]
ii

CONTENTS
EXECUTIVE SUMMARY VII
1. INTRODUCTION 1
2. METHODS OF INVESTIGATION 3
3. PARTICIPATING ORGANISATIONS 5
4.
4.1 THE DATE OF THE CLAIM 8
4.2 WHO MADE THE CLAIM 9
4.3 THE INDUSTRY SECTOR 10
4.4 THE ACCIDENT CAUSE 11
4.5 THE WORK ACTIVITY BEING CONDUCTED 12
4.6 THE INJURY CAUSE 13
4.7 THE INJURY TYPE 14
4.8 THE INJURY SITE 15
OVERALL ANALYSIS OF COMPENSATION CLAIMSFDA, ISTC, MU AND NGSU)
(FROM ASLEF, 7
4.9 THE CASE OUTCOME (SUCCESS, TIME TO SETTLE, DAMAGES PAID) 16
5. SPECIFIC ACCIDENT DETAILS OF COMPENSATION CLAIMS(FROM ASLEF, FDA, ISTC, MU AND NGSU) 19
5.1 SLIPS/TRIPS/FALLS 19
5.2 MANUAL HANDLING 22
5.3 EXPOSURE TO NOISE 25
5.4 POORLY MAINTAINED MACHINERY/EQUIPMENT/WORKSTATION 26
5.5 POOR MACHINE/WORKSTATION DESIGN 29
5.6 ASSAULT 32
5.7 NEGLIGENCE 35
5.8 REPETITIVE TASK 35
5.9 UNEVEN/UNSTABLE SURFACE 35
5.10 VEHICLE COLLISION 39
iii

5.11 STANDING SURFACE COLLAPSED 40
5.12 STRIKE BY MOVING OBJECT 41
5.13 WORKING WITH COILS 44
5.14 TOOL SLIPPED 44
5.15 ASBESTOS INHALATION 44
5.16 SHARP OBJECT ON FLOOR 45
5.17 EXCESSIVE WORKLOAD 45
5.18 STRIKE STATIONARY OBJECT 46
5.19 SEAT COLLAPSED 46
5.20 INADEQUATE PPE 46
5.21 EXPOSURE TO VIBRATION 47
5.22 EQUIPMENT BROKE DURING USE 47
5.23 BULLYING/DISCRIMINATION 48
5.24 VANDALISM 48
5.25 POOR VISIBILITY 48
5.26 UNSAFE/UNSECURE LADDER 49
5.27 SUDDEN BRAKING 49
5.28 INADEQUATE GUARDING 49
5.29 EXPOSURE TO FUMES AND DUST 50
5.30 ILLNESS 50
5.31 LOSS OF POWER 50
5.32 INSECT BITE 50
5.33 EXPOSURE TO WELDING 51
5.34 EXPOSURE TO RADIATION 51
5.35 EXPOSURE TO CHEMICALS 51
6. ANALYSIS OF COMPENSATION CLAIMS FROM TGWU 53
7. ANALYSIS OF COMPENSATION CLAIMS FROM UNISON 61
8. ANALYSIS OF COMPENSATION CLAIMS FROM USDAW 63
iv

9. CONCLUSION 67
9.1 WHAT ARE THE MAIN TYPES OF CLAIM? 67
9.2 WHAT ARE THE MAIN INJURIES SUSTAINED? 67
9.3 WHAT ARE THE INDUSTRY SECTORS WHICH ATTRACT THE HIGHEST PROPORTION OF CLAIMS? 68
9.4 WHAT ARE THE WORK ACTIVITIES WHICH GIVE RISE TO THE MOST CLAIMS? 68
9.5 WHAT BREACHES OF THE REGULATIONS ARE MOST LIKELY TO ATTRACT CLAIMS? 69
9.6 HOW LONG DOES IT TAKE FOR CLAIMS TO BE SETTLED? 69
9.7 WHAT ARE THE AVERAGE COSTS OF SUCH CLAIMS? 70
9.8 CLAIMS FROM EMPLOYEES OF SMALL COMPANIES 70
9.9 PUBLIC LIABILITY/THIRD PARTY CLAIMS 70
10.RECOMMENDATIONS AND SUGGESTIONS FOR FURTHER WORK 71
10.1 RECOMMENDATIONS 71
10.2 FURTHER RESEARCH 72
APPENDIX 1 75
APPENDIX 2 77
v

vi

EXECUTIVE SUMMARY
This report details the findings of a research project to collect and analyse health and safety (accident and injury-related) compensation claims conducted via trade unions and law firms.
Our results are based on three main sources of data:
· Raw data on 488 claims from five trade unions (ASLEF, FDA, ISTC, MU and NGSU)
· Summary data on 75,000 claims received from the TGWU · Summary data on 11,200 claims received from UNISON. · Summary data on 34,917 claims received from USDAW.
ASLEF is the principal trade union for train drivers. It has 17,000 members employed in all train operating companies in the country, both passenger and freight.
The FDA is the trade union for Britain’s senior public servants. Its 11,000 members include Whitehall policy advisors and senior managers, tax inspectors, economists and statisticians, government lawyers, crown prosecutors, school inspectors, accountants and NHS managers.
MU is a trade union for musicians and music industry workers, with 30,000 members.
The ISTC has over 50,000 members in the steel and metal industries.
NGSU is the trade union for staff of the Nationwide Building Society, with over 11,500 members.
The TGWU has over 900,000 members in different workplaces across the UK. The four sectors covered by the union are food and agriculture, manufacturing, services and transport.
UNISON is Britain’s largest trade union with over 1.3 million members working in the public services. Its members include frontline staff and managers working in local authority, the NHS, the police service, colleges and schools, the electricity, gas and water industries, transport and the voluntary sector.
USDAW is one of Britain’s largest trade unions with 310,000 members nationwide. USDAW members work in a variety of occupations and industry sectors including shop workers, call centre workers, factories and warehouse workers and clerical workers.
Specific aims of the investigation were to answer the following questions:
WHAT ARE THE MAIN TYPES OF CLAIM?
Our analysis of the claims data received from ASLEF, FDA, ISTC, MU and NGSU revealed that the main types of claims received were as a result of accidents from:
· Slips, trips and falls (16%) · manual handling (10%) · exposure to noise (7.6%).
The cause of the accident was unknown for 120 (24.6%) of the cases.
Data from UNISON showed that trips, slips and falls (19%), stress (16%) and manual handling (13%) were the main types of claim. These results are consistent with the findings
vii

of the other trade unions above, with the exception of noise, which accounted for only 1% of UNISON claims (as opposed to 7.6% as above). In addition, stress was the second most common type of UNISON claim, accounting for 16% of cases, whilst only 1.6% of ASLEF, FDA, ISTC, MU and NGSU cases were stress related.
The TGWU data revealed that injuries at work were the main claim received (67.1%) but no further information was available surrounding the types of claims in this category. No details surrounding the types of claims were available from the USDAW data.
WHAT ARE THE MAIN INJURIES SUSTAINED?
The ASLEF, FDA, ISTC, MU and NGSU data revealed that the main injury types sustained were:
· (unspecified) pain (9.6%) · strain/sprains (9%) · deafness/hearing loss (8%) · cut/laceration (8%).
26% of injury types were unknown.
Data from USDAW supported these findings, as the main injuries sustained by members of this trade union were strains and sprains (27%), lacerations and open wounds (13%) and bruising (8.9%).
No details surrounding the main injuries sustained were available from the USDAW or TGWU data.
WHAT ARE THE INDUSTRY SECTORS WHICH ATTRACT THE HIGHEST PROPORTION OF CLAIMS?
The ASLEF, FDA, ISTC, MU and NGSU data revealed that the industry sectors which attracted the highest proportion of claims were:
· railway sector (29.7%) · metal work sectors (21.1%) · legal profession (7%)
However, this is not unexpected given that these are the primary sectors associated with the three largest trade unions who participated in the study, namely FDA, ASLEF and ISTC.
Data from UNISON showed that the majority of compensation claims were received from individuals with the local government sector (52%), the health sector (32%) and the education sector (3%). The industry sector was unknown for 9% of claims.
Data from TGWU showed that the majority of compensation claims were received from individuals within the vehicle building and automotive industry (15.8%), the power and engineering industry (12.3%), the food, drink and tobacco industry (7.3%) and chemical, oil and rubber refining industry (7.3%). The industry sector was unknown for 24.7% of claims.
No details regarding the industry sector were available for the USDAW data.
viii

WHAT ARE THE WORK ACTIVITIES WHICH GIVE RISE TO THE MOST CLAIMS?
The ASLEF, FDA, ISTC, MU and NGSU data revealed that the work activities which gave rise to the most claims were:
· driving a train (16.6%) · walking on the same level (14.8%) · manual handling (9.4%)
The work activity being conducted at the time of the accident/injury was unknown for 32.8% of cases.
No details surrounding work activities were available for the UNISON, USDAW or TGWU data.
WHAT BREACHES OF THE REGULATIONS ARE MOST LIKELY TO ATTRACT CLAIMS?
The data received from ASLEF, FDA, ISTC, MU and NGSU revealed that the main types of claims received were as a result of accidents from slips, trips and falls, manual handling, and exposure to noise. There was little detailed information available on the circumstances surrounding cases and, with the exception of the manual handling cases, there was no information available on breaches of regulations.
For five of the 49 manual handling cases examined, the Manual Handling Operations Regulations 1992 were breached as no manual handling training was provided. This is a breach of the Manual Handling Operations Regulations 1992 (Regulation 4) which requires employers to provide information and training on manual handling risks and prevention. Additionally, for two of these cases, it is known that no risk assessment was conducted. This is a further breach of the Regulations.
For the claims cases involving slips, trips and falls, and exposure to noise we can only speculate from the information provided what breach of the Regulations had occurred.
Claims cases involving slips, trips and falls may have involved a breach of the Workplace Health, Safety and Welfare Regulations 1992, specifically Regulation 12 which is concerned with the condition of floors and traffic routes, as individuals referred to slipping on water (5), grease (2) or an oil spillage (1).
For claims involving exposure to noise very little information was available on the circumstances surrounding the cases. No details were given of the noise exposure levels of individuals, however, it is known that for 6 of the 37 cases (16.2%), no hearing protection or faulty protection was provided and of the remainder of the cases only five (13.5%) reported that foam plugs or muffs were issued.
Without details of noise levels it is difficult to determine if there was a breach of the Noise at Work Regulations 1989. These Regulations state that noise levels should be reduced so far as is reasonably practicable. If noise levels are above the first action level (85 db(A)) hearing protection should be freely available to those who want it. Above the second action level (90 db(A)) it is mandatory for employers to provide protection to all individuals exposed to the noise and mandatory for individuals to wear it. Above 90 dB(A) employers also have a duty, so far as is reasonably practicable, to reduce noise levels by engineering means.
ix

The UNISON data revealed that the most common claim types were trips, slips and falls, stress and manual handling. No further information was available on any of these cases and as a result we were unable to speculate on possible breaches of the Regulations.
No details surrounding breaches of the Regulations were available for the USDAW or TGWU data.
HOW LONG DOES IT TAKE FOR CLAIMS TO BE SETTLED?
The ASLEF, FDA, MU and NGSU data revealed that the time period for cases to be settled ranged from 1 to 108 months, with a mean of 24 months.
The mean time the main types of claims took to be settled was:
· slips, trips and falls – 27 months · manual handling – 34 months · exposure to noise – 42 months.
These settlement dates are based on the time difference between the injury date and the date when the case was settled. For the majority of successful cases, the date when the case was actually opened was unknown. For 69.5% of cases the settlement date was unknown.
The TGWU data revealed that the time period for industrial disease cases to be settled ranged from 1 to 133 months, with a mean of 35 months. The mean and minimum amount of time for a case to be settled are consistent with the findings of the other trade unions above.
No details surrounding the time taken for a claim to be settled were available from the ISTC, UNISON and USDAW data.
WHAT ARE THE AVERAGE COSTS OF SUCH CLAIMS?
The ASLEF, FDA, MU and NGSU data revealed that the smallest amount of damages paid was £75 and the largest amount of damages paid was £250,000.
The average cost of the main types of claims was:
· slips, trips and falls - £4,222 · manual handling - £4,325 · exposure to noise - £1,782.
The TGWU data revealed that the cost for cases to be settled ranged from £1 to £1,133,462 for injury at work claims and £1 to £500,000 for industrial disease claims. These amounts are higher and lower than those for the trade unions above.
No details surrounding the average cost of a claim were available from the ISTC, UNISON and USDAW data.
CLAIMS FROM EMPLOYEES OF SMALL COMPANIES
We hoped to gather information on claims from employees of small companies. Whilst for a large number of claims the company name was known, no other details were available (e.g. company size) and as a result we were unable to further investigate the issue of claims from small companies.
x
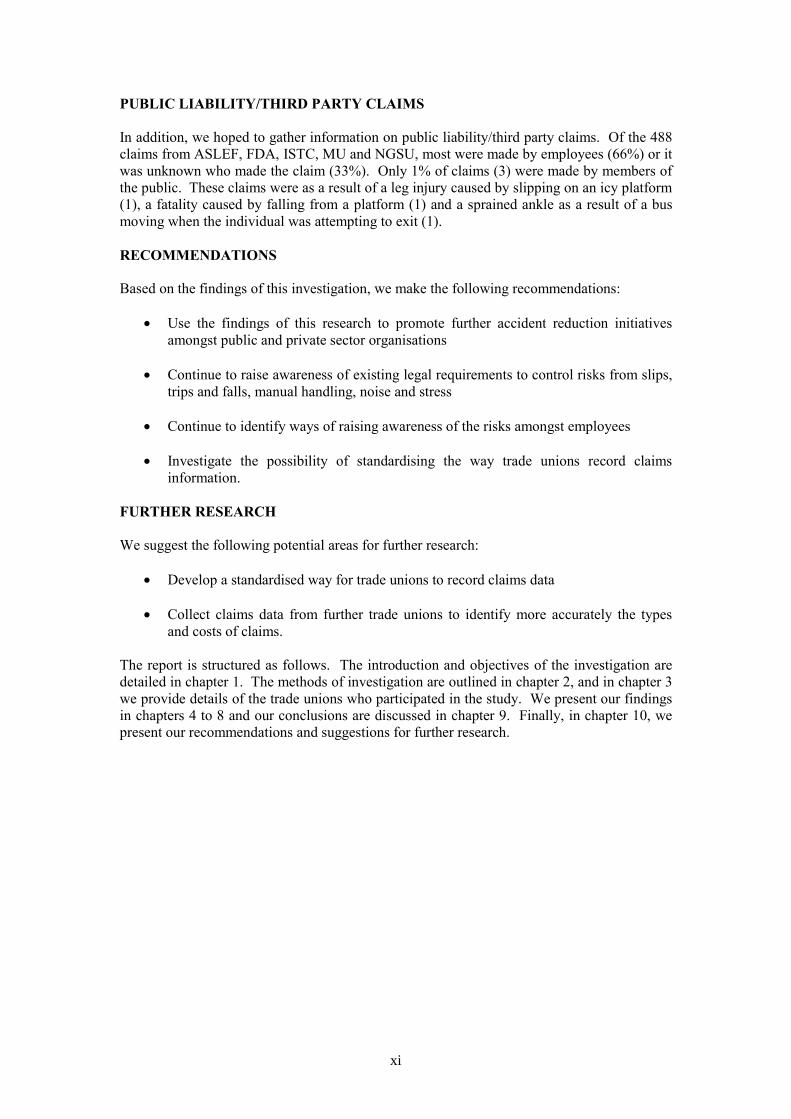
PUBLIC LIABILITY/THIRD PARTY CLAIMS
In addition, we hoped to gather information on public liability/third party claims. Of the 488 claims from ASLEF, FDA, ISTC, MU and NGSU, most were made by employees (66%) or it was unknown who made the claim (33%). Only 1% of claims (3) were made by members of the public. These claims were as a result of a leg injury caused by slipping on an icy platform (1), a fatality caused by falling from a platform (1) and a sprained ankle as a result of a bus moving when the individual was attempting to exit (1).
RECOMMENDATIONS
Based on the findings of this investigation, we make the following recommendations:
· Use the findings of this research to promote further accident reduction initiatives amongst public and private sector organisations
· Continue to raise awareness of existing legal requirements to control risks from slips, trips and falls, manual handling, noise and stress
· Continue to identify ways of raising awareness of the risks amongst employees
· Investigate the possibility of standardising the way trade unions record claims information.
FURTHER RESEARCH
We suggest the following potential areas for further research:
· Develop a standardised way for trade unions to record claims data
· Collect claims data from further trade unions to identify more accurately the types and costs of claims.
The report is structured as follows. The introduction and objectives of the investigation are detailed in chapter 1. The methods of investigation are outlined in chapter 2, and in chapter 3 we provide details of the trade unions who participated in the study. We present our findings in chapters 4 to 8 and our conclusions are discussed in chapter 9. Finally, in chapter 10, we present our recommendations and suggestions for further research.
xi

xii

1. INTRODUCTION
This report details the findings of a research project to collect and analyse health and safety (accident and injury-related) compensation claims conducted via trade unions and law firms.
At present, very little information on health and safety related compensation claims is available. However, compensation claims can be a valuable source of information about health and safety at work, highlighting where there are problems, and pointing the way towards preventative strategies and remedial action by both companies and regulators alike, including the Health and Safety Executive (HSE).
To improve HSE’s understanding of companies’ exposure to compensation claims System Concepts Limited were contracted to collect and analyse information from trade unions and law firms on the costs and types of health and safety-related claims that they had dealt with.
Specific objectives of the study were to answer the following questions:
· What are the main types of claim? · What are the main injuries sustained? · What are the industry sectors which attract the highest proportion of claims? · What are the work activities which give rise to the most claims? · What breaches of the Regulations are most likely to attract claims? · How long does it take for claims to be settled? · What are the average costs of claims?
In addition we hoped to gather information on:
· Claims from employees of small companies · Public liability/third party claims.
In this report, we present the findings from our investigation.
1

2

2. METHODS OF INVESTIGATION
To collect information on the number and types of health and safety related compensation claims conducted via trade unions, we contacted a total of 79 Trade Unions Congress (TUC) affiliated unions. Given that many trade unions pass all claims for compensation directly to their solicitors, and do not pursue the claim themselves, we also contacted a total of four law firms (who deal with over 80% of all UK trade union legal matters). Details of all trade unions and law firms contacted are detailed in Appendix 1.
An initial brief from Owen Tudor, from the TUC, was sent to trade unions and law firms on our behalf (as shown in Appendix 2). The brief introduced the study, described what was being done, and asked respondents for their assistance. A reminder brief was also sent to those organizations that did not respond to the initial briefing document.
Representatives from those organizations who agreed to participate in the study and provide us with claims information were contacted by telephone and we established how best we could obtain the information we needed. For each claim that they had dealt with (since 1992), we wanted to know:
· the date of the claim · who the claim was made by (e.g. employee, contractor, member of public etc) · who the claim was made against · the date of the accident/injury · the cause of the accident/injury (including information on any breaches of
Regulations) · details of the injury sustained (injury type and site) · whether the case was successfully settled, and if so:
- when it was settled - what damages were paid.
We requested information on closed (settled) and ongoing cases for all health and safety related issues, including for example musculoskeletal injuries, vibration, noise etc. It should be noted, however that we were not interested in recording road traffic accidents or accidents which occurred away from the workplace (unless the accident was work-related). For example, we did not wish to collect information on claims involving a car accident whilst driving to or from work, however, we were interested in, for example, manual handling injuries when carrying and lifting items to/from the car to attend a meeting at a client’s premises.
Respondents were able to send us information in a variety of formats, including databases, spreadsheets and paper files, depending on the way the organisation recorded their claims information. Additionally, we offered to visit the premises of all respondents in order to retrieve the necessary information ourselves.
3

4

3. PARTICIPATING ORGANISATIONS
Of the 83 organisations contacted, 15 trade unions and one law firm agreed to participate and provide us with information on the claims that they had dealt with. However, following a detailed discussion with representatives from these organisations, it was found that several organisations did not record the information we needed, or that the data was not easily accessible, and therefore felt that they would be unable to assist with our study. As a result, we obtained information from a total of eight trade unions. These were:
· Associated Society of Locomotive Engineers and Firemen (ASLEF) · Association of First Division Civil Servants (FDA) · Iron and Steel Trades Confederation (ISTC) · Musicians Union (MU) · Nationwide Group Staff Union (NGSU) · Transport and General Workers Union (TGWU) · Union of Shop, Distributive and Allied Workers (USDAW) · UNISON.
Information was received in a variety of formats from each trade union, and for varying numbers and types of claims, as detailed in Table 1.
Information was sent to us via email by four of the participants, namely MU, NGSU, UNISON and USDAW. We visited the premises of the three participants (ASLEF, FDA and TGWU) to retrieve the necessary information ourselves from their paper files and databases. ISTC sent us reels of microfilm, which we analysed to retrieve the relevant information.
Table 1 - Trade unions participating in the study
Trade Data obtained by …. No. of Type of Date of union claims claims claims
ASLEF Visiting TU and retrieving info from paper files
160 Closed only 1992 to 2001
FDA Visiting TU and retrieving info 49 Closed and 1992 to from paper files ongoing 2001
ISTC Retrieving info from reels of 1224 Closed and 1998 to microfilm ongoing 1999
MU Information sent via email 40 Closed and 1995 to ongoing 2002
NGSU Information sent via email 166 Closed only 1991 to 2001
TGWU Visiting TU and retrieving info 75,333 Closed and 1988 to from their database ongoing 2001
UNISON Information sent via email 11,200 Closed only 2001 USDAW Information sent via email 35,022 Closed only 1995 to
2002
It was hoped that we could collate all information received into a spreadsheet and analyse the information accordingly. However, due to the different recording techniques and the level of information recorded by each of the trade unions, we were able to collate the information received from only five of the eight participants (ASLEF, FDA, ISTC, MU and NGSU), and details of the analyses performed can be found in Sections 4 and 5. Summary information only was available for TGWU, UNISON and USDAW,and as a result, information from these trade unions was analysed separately, the results of which can be found in Sections 6, 7 and 8.
5

6

4. OVERALL ANALYSIS OF COMPENSATION CLAIMS (FROM ASLEF, FDA, ISTC, MU AND NGSU)
Full information was received for a total of 488 compensation claims from five trade unions (ASLEF, FDA, MU, ISTC and NGSU).
ASLEF is the principal trade union for train drivers. It has 17,000 members employed in all train operating companies in the country, both passenger and freight.
The FDA is the trade union for Britain’s senior public servants. Its 11,000 members include Whitehall policy advisors and senior managers, tax inspectors, economists and statisticians, government lawyers, crown prosecutors, school inspectors, accountants and NHS managers.
MU is a trade union for musicians and music industry workers, with 30,000 members.
The ISTC has over 50,000 members in the steel and metal industries.
NGSU is the trade union for staff of the Nationwide Building Society, with over 11,500 members.
In order to produce a profile of the claims from these trade unions, we classified the information according to:
· the date of the claim· who made the claim (e.g. employee, contractor, member of public etc) · the industry sector involved · the accident cause (including information on any breaches of Regulations) · the work activity being conducted at the time of the accident/injury· the injury cause· the injury type sustained · the injury site (i.e. body part affected) · the case outcome (successful/unsuccessful) · the settlement time period · the amount of damages paid.
Each of these issues will now be discussed in turn in the following sections. Additionally, each of the accident causes identified will be further discussed in Section 5, in order to provide specific profiles of the cases examined.
7

4.1 THE DATE OF THE CLAIM
The number of claims received by trade unions in the ten-year period from 1991 to 2001 is shown in Figure 1.
0
5
10
15
20
25
30
35
40
Claims received (n=488)
1990 1991 1992 1993 1994 1995 1996 1997 1998 1999 2000 2001
Num
ber
Figure 1 – Date of claims received
It should be noted that this information is based on the claims received by ASLEF, FDA, MU and NGSU only. Claims received from ISTC were not included as information was available for 1999 only.
As can be seen the number of claims received by trade unions has increased steadily from 1993, with an overall high in 2000 (when 37 claims were received). Following this peak, the number of claims received appears to be decreasing, as only 17 claims were received in 2001. However, this reduction is likely to be due to the fact that for several trade unions, information was received for the first six months of 2001 only.
8

4.2 WHO MADE THE CLAIM
Of the 488 claims analysed, 325 (66%) were made by employees of the company involved (including 2 retired employees), and 3 (1%) were made by members of the public, as shown in Figure 2. For the remaining 160 cases (33%) it was unknown who made the claim.
1%
33%
66%
Member of public
Unknown
Employee
Figure 2 – Who made the claim
9

4.3 THE INDUSTRY SECTOR
We categorised each claim according to the industry of the company involved, and the results are presented in Figure 3.
32%
30%
21%
7%
1%
3%
3%
2%
Unknown
Railway
Metal works
Legal
Council/local authority
Manufacturing/ engineering
Leisure & entertainment
Government department
Transport 0.5%
Publishing & media 0.5%
Figure 3 – Industry sector
As can be seen the industry involved (where known) in the majority of cases analysed was the railway sector, accounting for 30%. The metal work sectors (21%) and the legal profession (7%) also attracted a large amount of claims. This is not unexpected, however, given that these are the primary sectors associated with the three largest trade unions who participated in the study, namely FDA (First Division Association), ASLEF (Associated Society of Locomotive Engineers and Firemen) and ISTC (Iron and Steel Trades Confederation).
10

4.4 THE ACCIDENT CAUSE
The accident cause of the 488 claims analysed are presented in Figure 4. As can be seen, information on the cause of the accident was known for only 368 (76.4%) of the 488 cases analysed. For the remaining 120 (24.6%) cases, very few (if any) details surrounding the cause of the accident were known.
0 5 15 25 30
/
j
j
j
/
/
0.2 0.2 0.2 0.2 0.2 0.2 0.4 0.4 0.4 0.4 0.6 0.6 0.8 0.8 0.8 0.8 0.8 0.8 1.0 1.0 1.2 1.2 1.2 1.4 1.6 1.6 2.0
2.9 3.3 3.5
4.1 6.6
7.6 10.0
16.0 24.6
10 20
Exposure t o chemicals Exposure t o radiat ion
Exposure t o welding Insect bit e
Loss of power Illness
Exposure t o fumes/dust Inadequate guarding
Sudden braking Unsafe unsecured ladder
Poor visibility Vandalism
Bullying/discriminat ion Equipment broke during use
Exposure t o vibrat ion Inadequat e P P E
Seat collapsed St rike st at ionary ob ect
Excessive workload Sharp ob ect on floor
Asbest os inhalat ion T ool slipped
Working wit h coils St rike by moving ob ect
St anding surface collapsed Vehicle collision
Uneven unstable surface Repetitive task
Negligence Assault
Poor machine/workstation design P oorly maint ained Exposure t o noise
Manual handling Slip/t rip fall
Unknown
Percentage
Figure 4 – Accident cause
The largest known accident cause was a slip/trip/fall, accounting for 16% of the cases analysed. The second most common cause of accidents was manual handling, accounting for 10% of claims. Noise (7.6%) was also a common cause of claim, as was poorly maintained machinery, equipment or workstations (6.6%).
In order to provide a detailed profile of the claims received, each of the accident causes identified are discussed in more detail in Sections 5.1 to 5.35.
11
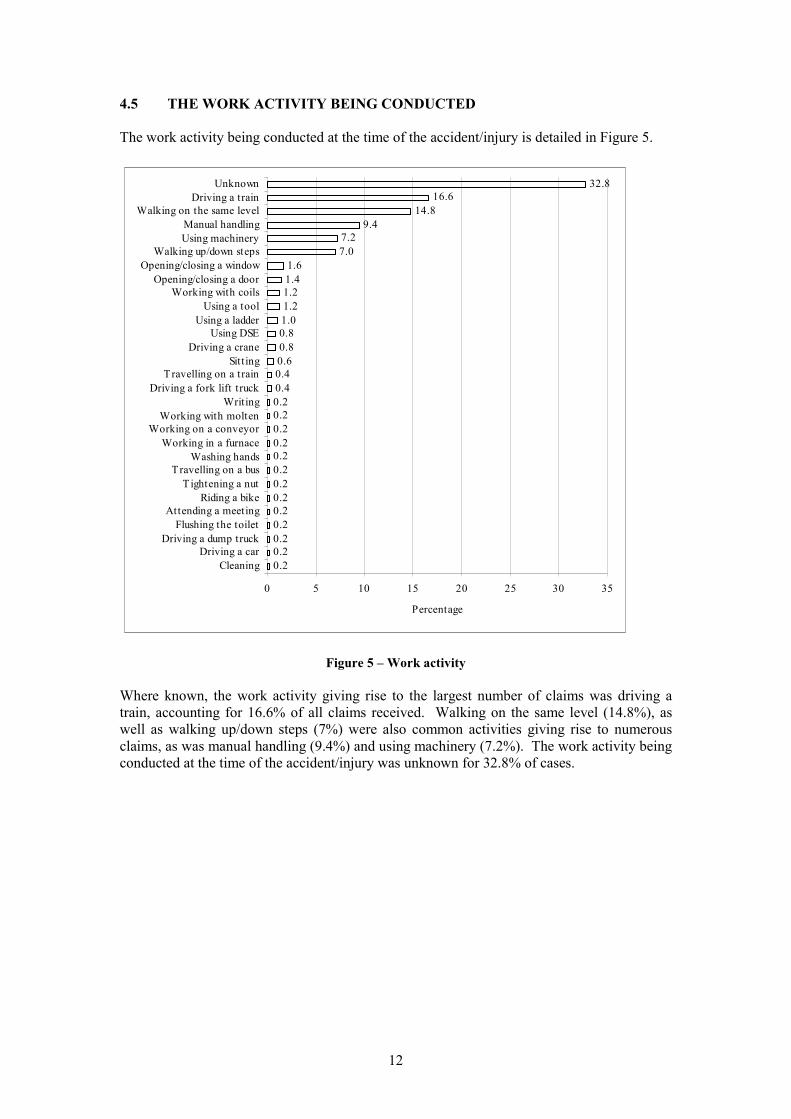
4.5 THE WORK ACTIVITY BEING CONDUCTED
The work activity being conducted at the time of the accident/injury is detailed in Figure 5.
0 5 20 25 30
//
/
0.2 0.2 0.2 0.2 0.2 0.2 0.2 0.2 0.2 0.2 0.2 0.2 0.2 0.4 0.4 0.6 0.8 0.8 1.0 1.2 1.2 1.4 1.6
7.0 7.2
9.4 14.8
16.6 32.8
10 15 35
Cleaning Driving a car
Driving a dump t ruck Flushing t he t oilet
Attending a meeting Riding a bike
T ight ening a nut T ravelling on a bus
Washing hands Working in a furnace
Working on a conveyor Working wit h molt en
Writ ing Driving a fork lift t ruck
T ravelling on a t rain Sitting
Driving a crane Using DSE
Using a ladder Using a tool
Working wit h coils Opening closing a door
Opening closing a window Walking up down st eps
Using machinery Manual handling
Walking on t he same level Driving a t rain
Unknown
Percentage
Figure 5 – Work activity
Where known, the work activity giving rise to the largest number of claims was driving a train, accounting for 16.6% of all claims received. Walking on the same level (14.8%), as well as walking up/down steps (7%) were also common activities giving rise to numerous claims, as was manual handling (9.4%) and using machinery (7.2%). The work activity being conducted at the time of the accident/injury was unknown for 32.8% of cases.
12

4.6 THE INJURY CAUSE
In addition to assigning each claim and accident cause, we also assigned an injury cause, as detailed in Figure 6.
0 5 10 20 25
/
j
j/
j
0.2 0.2 0.2 0.2 0.2 0.2 0.2 0.2 0.2 0.2 0.2 0.4 0.4 0.4 0.6 0.6 0.6 0.8 0.8 0.8 1.2 1.2 1.4 1.6
2.9 3.5
4.9 5.1
6.1 7.8
10.5 11.3
12.9 21.7
15
Bullying discriminat ion Derailment
Excessive workload Chemicals
Foreign body Insect bit e
Lost grip Radiant heat
Radiat ion Sudden braking Welding flash
Collision wit h object Fumes and dust
T rip over ob ect Electric shock
Excessive force Hot surface
Loss of balance Musculoskelet al
Vibrat ion Asbest os inhalat ion
Puncture Vehicle collision
St ress Repetitive task
Poor St rike st at ionary ob ect
Pinch crush Heavy load
Noise Fall on same level
Fall from height St rike by moving ob ect
Unknown
Percentage
Figure 6 – Injury cause
For 21.7% of cases, the actual cause of injury was unknown. However, the largest known cause of injury was a strike by a moving object, accounting for 12.9% of the cases examined. Falling from a height (11.3%), and falling on the same level (10.5%) were also very common causes of injury. 1% of injuries resulted in a fatality.
13
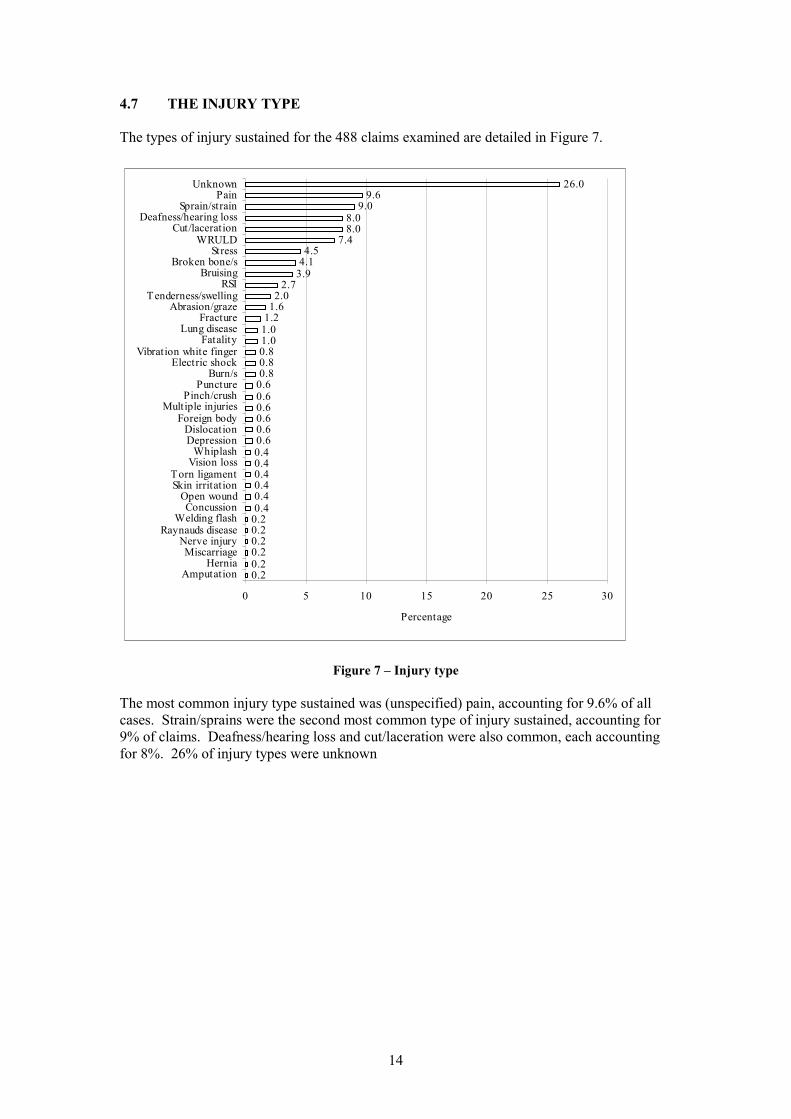
4.7 THE INJURY TYPE
The types of injury sustained for the 488 claims examined are detailed in Figure 7.
0 5 10 15 20
/
/s
//
/s
/
0.2 0.2 0.2 0.2 0.2 0.2 0.4 0.4 0.4 0.4 0.4 0.4 0.6 0.6 0.6 0.6 0.6 0.6 0.8 0.8 0.8 1.0 1.0 1.2 1.6 2.0
2.7 3.9 4.1 4.5
7.4 8.0 8.0
9.0 9.6
26.0
25 30
Amputation Hernia
Miscarriage Nerve injury
Raynauds disease Welding flash
Concussion Open wound
Skin irritation Torn ligament
Vision loss Whiplash
Depression Dislocat ion
Foreign body Mult iple injuries
Pinch crush Puncture
BurnElectric shock
Vibration white finger Fat alit y
Lung disease Fract ure
Abrasion graze T enderness swelling
RSI Bruising
Broken boneSt ress
WRULD Cut laceration
Deafness/hearing loss Sprain/st rain
Pain Unknown
Percentage
Figure 7 – Injury type
The most common injury type sustained was (unspecified) pain, accounting for 9.6% of all cases. Strain/sprains were the second most common type of injury sustained, accounting for 9% of claims. Deafness/hearing loss and cut/laceration were also common, each accounting for 8%. 26% of injury types were unknown
14

4.8 THE INJURY SITE
The body areas injured are detailed in Figure 8.
Whilst the exact injury sites were unknown for those cases involving depression, stress or a fatality, they have been included in Figure 8 to show the numbers of individuals affected, as opposed to classifying the injury site as ‘unknown’.
0 5 10 15
)
( )
/s
(
0.4 0.4 0.6
1.0 1.0 1.0 1.2 1.2 1.4 1.4 1.4 1.4 1.4 1.6
2.3 2.3
2.7 2.9
3.3 3.5 3.5 3.7
4.1 5.5
7.4 8.0
12.7 22.5
20 25
Groin (Depression
Neck and shoulders Elbow Lungs
FatalityBack and neck
Thumb Back and leg
Chest Neck
Whole body Wrist Knee EyeHand
Shoulder Face Head Foot
St ress) Ankle
Arm Leg
Finger/s Ear/s Back
Unknown
Percentage
Figure 8 – Injury site
The most common injury site was the back, accounting for 12.7% of the cases examined. The ear/s and finger/s also commonly sustained injuries, accounting for 8% and 7.4% respectively. The injury site was unknown for 22.5% of all cases examined.
15

4.9 THE CASE OUTCOME (SUCCESS, TIME TO SETTLE, DAMAGES PAID)
Table 2 details the outcome of the 488 cases examined. Details on the success rate, the time to settle and the amount of damages paid are presented for each accident cause identified.
The time period for cases to be settled ranged from 1 to 108 months, with a mean of 24 months. These figures are derived from a total of 138 cases. For the remaining 350 cases (488 – 138 = 350) the case settlement date was unknown. It should be noted, however, that these settlement figures are based on the time difference between the injury date and the date when the case was settled. For the majority of successful cases, the date when the case was actually opened was unknown.
The case that took the least amount of time to be settled (1 month) involved an insect bite, which caused tenderness/swelling to the elbow. The amount of damages paid was £250. The case that took the longest amount of time to be settled (108 months), involved manual handling. The amount of damages paid was £5000.
The smallest amount of damages paid was £75 following an exposure to fumes and dust. The largest amount of damages paid was £250,000 for a vehicle collision.
16

Accident cause No. of cases
No. successfully
settled
% successfully
settled
Mean time to settle
(months)
Minimum time to settle
(months)
Maximum time to settle
(months)
Mean amount paid (£)
Minimum amount paid (£)
Maximum amount paid £)
Slip/trip/fall 78 47 60 27 4 56 4,222 450 30,000 Manual handling 49 16 33 34 12 105 4,325 750 15,000 Exposure to noise 37 25 68 42 12 94 1,782 586 5,458
Poorly maintained machinery/eqpt/ws 32 22 69 25 7 74 2,942 200 20,000 Poor machine/workstation design 20 16 80 37 16 83 9,448 430 67,500
Assault 17 14 80 28 7 69 7,265 1,000 78,645 Negligence 16 2 12.5 Unknown Unknown Unknown 4,500 4,000 5,000
Repetitive task 14 4 29 Unknown Unknown Unknown 2,500 2,500 2,500 Uneven/unstable surface 10 2 20 15.5 15 16 1,775 1,300 2,250
Vehicle collision 8 8 100 18 11 26 27,024 1,000 250,000 Standing surface collapsed 8 6 75 17 12 26 28,250 1,500 150,000
Strike by moving object 7 1 14 9 9 9 1,000 1,000 1,000 Working with coils 6 Unknown Unknown Unknown Unknown Unknown Unknown Unknown Unknown
Tool slipped 6 Unknown Unknown Unknown Unknown Unknown Unknown Unknown Unknown Asbestos inhalation 6 4 67 27 8 44 27,400 1,000 77,000
Sharp object on floor 5 3 60 25 12 37 1,250 500 1,250 Excessive workload 5 Unknown Unknown Unknown Unknown Unknown Unknown Unknown Unknown
Strike stationary object 4 2 50 17 Unknown Unknown 875 750 1,000 Seat collapsed 4 4 100 13 10 17 8,077 1,250 25,000
Inadequate PPE 4 1 25 20 20 20 250 250 250 Exposure to vibration 4 Unknown Unknown Unknown Unknown Unknown Unknown Unknown Unknown
Equipment broke during use 4 2 50 22 19 25 2,197 893 3,500 Bullying/discrimination 4 1 25 Unknown Unknown Unknown 5,000 5,000 5,000
Vandalism 3 3 100 38 9 67 8,107 1,000 22,323 Poor visibility 3 2 67 15 12 18 1,750 1,500 2,000
Unsafe/unsecure ladder 2 Unknown Unknown Unknown Unknown Unknown Unknown Unknown Unknown Sudden braking 2 2 100 22 6 38 1,500 1,000 2,000
Inadequate guarding 2 Unknown Unknown Unknown Unknown Unknown Unknown Unknown Unknown Exposure to fumes and dust 2 1 50 Unknown Unknown Unknown 75 75 75
Illness 1 Unknown Unknown Unknown Unknown Unknown Unknown Unknown Unknown Loss of power 1 Unknown Unknown Unknown Unknown Unknown Unknown Unknown Unknown
Insect bite 1 1 100 1 1 1 250 250 250 Exposure to welding 1 Unknown Unknown Unknown Unknown Unknown Unknown Unknown Unknown Exposure to radiation 1 Unknown Unknown Unknown Unknown Unknown Unknown Unknown Unknown Exposure to chemicals 1 Unknown Unknown Unknown Unknown Unknown Unknown Unknown Unknown
Table 2 – Case outcomes
17

18

5. SPECIFIC ACCIDENT DETAILS OF COMPENSATION CLAIMS (FROM ASLEF, FDA, ISTC, MU AND NGSU)
In order to provide a detailed profile of the 488 claims examined, each accident cause will now be discussed in more detail. The actual cause of injury for each accident cause classification, as well as the typical injuries sustained, and the success rate of claims will also be discussed.
5.1 SLIPS/TRIPS/FALLS
Of the 488 compensation claims examined, 78 (16%) cases involved a slip, trip or fall.
Injury cause
The causes of injury for these slip/trip/fall cases are detailed in Figure 9.
21%
22%
55%
1%1%
Unknown
Fall from height
Fall on same level
Lost grip
Strike by moving object
Figure 9 – Causes of slip/trip/fall injuries
As can be seen from the figure above, the most common cause of injury was a fall on the same level, which accounted for 55% of cases. Examples of such injury include slipping and falling on an icy platform, slipping on water or on an oil spillage on the floor, tripping and falling over a pallet box, telephone wire, and paving stone. Individuals fell onto the standing surface as a result of their slip, trip or fall.
The second most common cause of injury was falling from a height (22%). Examples of such injury causes include slipping and falling on oily or icy steps, and tripping and falling over a worn stair carpet. As a result of these slips, trips and falls, individuals fell further than the standing surface e.g. down steps, from the train cab floor to the platform/track.
19

These cases may involve a possible breach of the Workplace Health, Safety and Welfare Regulations 1992 – Regulation 12 - Condition of floors and traffic routes.
Injury type
The types of slip/trip/fall injuries sustained are detailed in Figure 10.
1% /3%
/
3%
(s) 3%
/6%
6%
1%
(s) 8%
9%
Miscarriage Cut laceration
Tendernesss welling
Torn ligament
Abrasion graze
Pain
Concussion
Broken bone
Bruising
Sprain/strain 15%
Unknown 45%
Figure 10 – Slip/trip/fall injury types sustained
As shown above, the most common injury types sustained were sprains and strains (15%) and bruising (9%). Broken bones (8%), unspecified pain (6%) and abrasion/grazes (6%) were also common. 45% of injury types were unknown.
20

Injury site
The body parts typically affected by such injuries are detailed in Figure 11.
3%1% 3%
3%
1%1%
4%
4%
/s 1%
/s 5%
5%
6%
6%
Ches t Face Foot
Wrist
Thumb Neck
Hand
Knee
Eye
Finger
Shoulder
Arm
Leg
Ankle 14%
Back 18%
Unknown 25%
Figure 11 – Slip/trip/fall injury sites
The most common area of the body to be injured as a result of a slip/trip/fall is the back (18%). The ankle (14%), leg (6%), arm (6%) and shoulder (5%) were also common injury sites.
Success rate
Of the 78 cases examined, 47 (60%) are known to have been successfully settled. The amount of compensation paid ranged from £450 to £130,000, with a mean amount of £4,222. The mean time for cases to be settled was 27 months.
21

5.2 MANUAL HANDLING
Of the 488 compensation claims examined, 49 (10%) cases involved manual handling.
Injury cause
The causes of injury for these manual handling cases are detailed in Figure 12.
2%
6%
6%
62% 18%
6%
Fall from height
Large force
Pinch/crush
Heavy load Strike by moving
object
Unknown
Figure 12 – Causes of manual handling injuries
As can be seen from the figure above, the most common cause of injury was handling a heavy load, which accounted for 62% of cases. Very little information was available on the nature of the load being handled or the circumstances surrounding the case, however, it is known that for 5 of the 49 cases (10%), no manual handling training was provided. This is a breach of the Manual Handling Operations Regulations 1992 (Regulation 4) which requires employers to provide information and training on manual handling risks and prevention. Additionally, for 2 of these cases, it is known that no risk assessment was conducted. This is a further breach of the Manual Handling Operations Regulations 1992.
The second most common cause of injury was being struck by a moving object (18%). Examples of such an injury cause include equipment falling/becoming dislodged during handling and striking the handler, or being struck by a door which slammed shut when passing (with a load) nearby.
22

Injury type
The types of manual handling-related injuries sustained are detailed in Figure 13.
27%
22%
12%
29%
/s 2%
/
2%
4%
2%
Sprain/strain
Unknown
Cut/laceration
Pain
Broken bone Tendernessswelling
Fracture
Hernia
Figure 13 – Manual handling injury types sustained
As shown above, the most common injury type sustained was (unspecified) pain, accounting for 29% of the cases examined. The second most common injury type sustained was a sprain/strain, which accounted for 27% of cases. 22% of injury types were unknown.
23

Injury site
The body parts typically affected by such injuries are detailed in Figure 14.
/foot 4%
/s 4%
4%
12% 12%
Leg 8%
/8%
/6%
2% 4%
36%
Ankle
Finger
Torso
Unknown Arm
Neck shoulders
Hand wrist
Face Groin
Back
Figure 14 – Manual handling injury sites
As expected, the most common area of the body to be injured as a result of manual handling is the back (36%). Arms (12%), legs (8%) and neck/shoulders (8%) were also common injury sites.
Success rate
Of the 49 cases examined, 16 (33%) were successfully settled. The amount of compensation paid ranged from £750 to £15,000, with a mean amount of £4325. The mean time for cases to be settled was 34 months.
24

5.3 EXPOSURE TO NOISE
Of the 488 compensation claims examined, 37 (7.6%) cases involved exposure to noise.
Injury cause
As expected, in all cases the cause of the injury was exposure to noise, for example noise from diesel engines, grinding machines, generators or mill machines. Very little information was available on the circumstances surrounding the cases. No details were given of the noise exposure levels of individuals, however, it is known that for 6 of the 37 cases (16.2%), no hearing protection or faulty protection was provided and of the remainder of the cases only 5 (13.5%) reported that foam plugs or muffs were issued.
Without details of noise levels it is difficult to determine if there was a breach of the Noise at Work Regulations 1989. These Regulations state that noise levels should be reduced so far as is reasonably practicable. If noise levels are above the first action level (85 db(A)) hearing protection should be freely available to those who want it. Above the second action level (90 db(A)) it is mandatory for employers to provide protection to all individuals exposed to the noise and mandatory for individuals to wear it. Above 90 dB(A) employers also have a duty, so far as is reasonably practicable, to reduce noise levels by engineering means.
Injury type
The injury type sustained in all cases was deafness/hearing loss.
Injury site
The body part affected by this injury was the ear (100%).
Success rate
Of the 37 cases examined, 25 (68%) are known to have been successfully settled. The amount of compensation paid ranged from £586 to £5,458, with a mean amount value of £1,782. The mean time for cases to be settled was 42 months.
25

5.4 POORLY MAINTAINED MACHINERY/EQUIPMENT/WORKSTATION
Of the 488 compensation claims examined, 32 (6.6%) cases involved a poorly maintained machine, equipment or workstation.
Injury cause
The causes of injury for these poorly maintained machine, equipment or workstation cases are detailed in Figure 15.
3% 3%
6%
51%
22%
9%
6%
Stress Electric shock
Fall on same level
Strike by moving object
Strike stationary object
Pinch/crush
Musculoskeletal
Figure 15 – Causes of poorly maintained machine, equipment or workstation injuries
As can be seen from the figure above, the most common cause of injury was a strike by a moving object, which accounted for 51% of cases. Examples of such injury include a strike by: a faulty roller blind, a fluorescent light which fell out of its casing, a valve lid when the hinges snapped off, faulty furniture or an overhead cistern falling off the wall whilst flushing the toilet.
The second most common cause of injury was strike by a stationary object (22%). Examples of such injury causes include striking head on cracked scaffold, striking head against a buffer as safety helmet did not have a strap, striking another train because of faulty brakes or striking the buffers as poor tracks had not been cleaned.
These cases may involve a possible breach of the Workplace Health, Safety and Welfare Regulations 1992 – Regulation 5 - Maintenance of workplace, and of equipment, devices and systems.
26

Injury type
The types of poor maintenance-related injuries sustained are detailed in Figure 16.
3%
j3%
3% /s
3%
/
3%
6%
6%
9%
/
Open wound
Multiple in uries
Electric shock
Broken bone
Tendernessswelling
Pinch/crush
Stres s
Pain
Sprain/strain 13%
Unknown 29%
Cut laceration 22%
Figure 16 – Poorly maintained machine, equipment or workstation injury types sustained
As shown above, the most common injury type sustained was a cut/laceration in 22% of the cases examined. The second most common injury type sustained was a sprain/strain, which accounted for 13% of cases. 29% of injury types were unknown.
27

Injury site
The body parts typically affected by such injuries are detailed in Figure 17.
3%
3%
3%
3%
3%
3%
3%3%
6%
6%
/s
Shoulder
Neck
Knee
Foot
Elbow
Face
Back and leg Arm
Back 19%
Leg
Thumb
Hand 13%
Finger16%
Unknown 16%
Figure 17 – Poorly maintained machine, equipment or workstation injury sites
The most common area of the body to be injured as a result of poor maintenance was the back (19%). The finger/s (16%), hand (13%) and thumb (6%) were also common injury sites.
Success rate
Of the 32 cases examined, 22 (69%) are known to have been successfully settled. The amount of compensation paid ranged from £200 to £20,000, with a mean amount of £2,942. The mean time for cases to be settled was 25 months.
28

5.5 POOR MACHINE/WORKSTATION DESIGN
Of the 488 compensation claims examined, 20 (4.1%) cases involved a poor machine or workstation design. The accident type poor machine/workstation design is used to refer to an item of work equipment or workstation, that, due it its inherent design, makes the machine/workstation difficult or uncomfortable to use, or causes the user to adopt an awkward, un-neutral posture.
Injury cause
The causes of injury for these poor machine or workstation design cases are detailed in Figure 18.
5%
5%
5%
/
85%
Musculoskeletal
Pinch/crush
Hot surface
Poor machineworkstation design
Figure 18 – Causes of poor machine/workstation design injuries
As can be seen from the figure above, the most common cause of injury was the poor design of the machine/workstation itself, accounting for 85% of the cases examined. Examples include working in cramped areas, working at un-ergonomic display screen equipment workstations, working in uncomfortable postures when driving a train.
Hot surfaces (burning hand on a hot tap as a result of there being no indication of which tap was hot), a pinch/crush (when using machinery) and a musculoskeletal incident, all accounted for 1 of the 20 cases examined (5%).
29

Injury type
The types of poor machine/workstation design injuries sustained are detailed in Figure 19.
5%
5%
5%
Bruising
Sprain/strain
Burn/s
Pain 85%
Figure 19 – Poor machine/workstation design injury types sustained
As shown above, the most common injury type sustained was unspecified pain, accounting for 85% of the cases examined. A sprain/strain, burn/s and bruising were also sustained, each accounting for 5%.
30

Injury site
The body parts typically affected by such injuries are detailed in Figure 20.
/s 5%
5%
Back 70%
Back and neck 20%
Finger
Head
Figure 20 – Poor machine/workstation design injury sites
The most common area of the body to be injured as a result of a poor machine/workstation design was the back (70%). The back and neck (20%) was also a common injury site, as was the finger/s and head (5%).
Success rate
Of the 20 cases examined, 16 (80%) are known to have been successfully settled. The amount of compensation paid ranged from £430 to £67,500, with a mean amount of £9,448. The mean time for cases to be settled was 37 months.
31

5.6 ASSAULT
Of the 488 compensation claims examined, 17 (3.5%) cases involved a physical assault.
Injury cause
The causes of injury for these assault cases are detailed in Figure 21.
6%
obj6%
6% Stres s
Strike s tationary ect
Noise
Unknown 18%
Strike by moving object 64%
Figure 21 – Causes of assault injuries
As can be seen from the figure above, the most common cause of injury was being struck by a moving object, accounting for 64% of the cases examined. By far the majority of cases involved being struck by stones or a brick.
Striking a stationary object (moving to avoid being struck by a brick and banged into workstation), stress (following an attempted shooting) and noise (being verbally assaulted), all accounted for 1 of the 17 cases examined (6%).
32

Injury type
The types of assault injuries sustained are detailed in Figure 22.
6%
/
6%
6%
6%
6%
6%
/
Depression
Deafnes s hearing los s
Abrasion/graze
Nerve injury
Pain
Puncture
Cut laceration 12%
Stres s 18%
Unknown 34%
Figure 22 – Assault injury types sustained
As shown above, the most common (known) injury type sustained was stress, accounting for 18% of the cases examined. A cut/laceration (12%) was the second most common injury type sustained.
33

Injury site
The body parts typically affected by such injuries are detailed in Figure 23.
6%
/s
/s 6%
6% Ches t
Head 24%
Eye18%
Face 12%
Ear
Arm
Unknown 28%
Figure 23 – Assault injury sites
The most common (known) area of the body to be injured as a result of assault was the head (24%). The eye/s (18%) and face (12%) were also common injury sites.
Success rate
Of the 17 cases examined, 14 (82%) are known to have been successfully settled. The amount of compensation paid ranged from £1000 to £78,645, with a mean amount of £7,265. The mean time for cases to be settled was 28 months.
34

5.7 NEGLIGENCE
Of the 488 compensation claims examined, 16 (3.3%) cases involved negligence.
Injury cause
Unfortunately, no information was available on the circumstances surrounding these cases of negligence, and as a result the actual cause of injury is unknown.
Injury type
The injury sustained, however, is known for 2 of the 16 cases. One case involved deafness/hearing loss, and one involved a broken leg bone.
Success rate
Of the 16 cases examined, 2 (13%) are known to have been successfully settled. The amount of compensation paid was £4,000 and £5,000 respectively. It was unknown how long the cases took to be settled.
5.8 REPETITIVE TASK
Of the 488 compensation claims examined, 14 (2.9%) cases involved a repetitive task.
Injury cause
Unfortunately, no information was available on the details of the repetitive tasks undertaken, and as a result the actual cause of injury is unknown.
Injury type
An (unspecified) repetitive strain Injury (RSI) was sustained in 12 of the 14 cases examined. One case involved vision loss, and one involved a sprain/strain in the wrist.
Success rate
Of the 14 cases examined, 4 (29%) are known to have been successfully settled. The amount of compensation paid for all 4 cases was £2,500. It was unknown how long the cases took to be settled.
5.9 UNEVEN/UNSTABLE SURFACE
Of the 488 compensation claims examined, 10 (2%) cases involved an uneven or unstable surface. The accident type uneven/unstable surface is used to refer to a standing surface that moves unpredictably or is irregular. The term uneven surface is different from the accident type ‘trip’, as individuals do not fall as a result of contact with an object, but rather because the object is not present i.e. a hole in the paving stone rather than a raised paving stone.
35

Injury cause
The causes of injury for these uneven/unstable surface cases are detailed in Figure 24.
Pinch/crush 20%
Fall from height 40%
Loss of balance 40%
Figure 24 – Causes of uneven/unstable surface injuries
As can be seen from the figure above, the most common causes of injury were a fall from height or loss of balance, which each accounted for 40% of cases. Examples of falls from height include falling on a worn and uneven step, falling from a bus as it moved off while the individual got off or falling between a conveyor as a result of a missing floor plate.
The injury cause ‘loss of balance’ does not involve a fall. Individuals who lose their balance as a result of stepping on an uneven/unstable surface, e.g. a rocking standing platform, a loose load bearer bar or a rolling timber, regain their balance again but end up injuring themselves in the process.
These cases may involve a possible breach of the Workplace Health, Safety and Welfare Regulations 1992 – Regulation 12 - Condition of floors and traffic routes.
36

Injury type
The types of uneven/unstable surface-related injuries sustained are detailed in Figure 25.
50%
/10%
/s 10%
10%
10%
10%
Sprain/strain
Abrasion graze
Broken bone
Dislocation
Pain
Unknown
Figure 25 – Uneven/unstable surface injury types sustained
As shown above, the most common injury type sustained was sprain/strain, accounting for 50% of the cases examined. Pain, dislocation, broken bone/s and abrasion/grazes were also common, each accounting for 10% respectively. 10% of injury types were unknown.
37

Injury site
The body parts typically affected by such injuries are detailed in Figure 26.
/s
Leg 20%
Knee 10%
Finger10%
Foot 10%
Ankle 30%
Back 20%
Figure 26 – Uneven/unstable surface injury sites
The most common area of the body to be injured as a result of an uneven/unstable surface was the ankle (30%). The back (20%) was also a common injury site, as were the legs (10%).
Success rate
Of the 10 cases examined, 2 (20%) are known to have been successfully settled. The amount of compensation paid ranged from £1,300 to £2,250, with a mean amount of £1,775. The mean time for cases to be settled was 15 months.
38

5.10 VEHICLE COLLISION
Of the 488 compensation claims examined, 8 (1.6%) cases involved a collision with a vehicle.
Injury cause
By far the majority (6) of the (8) collision cases examined involved a train. Examples include, a train colliding with another train, a train colliding with a lorry (at a level crossing), and a train being shunted from behind by another train.
The remaining two collision cases involved a forklift truck and a dumper truck. The exact cause of injury for these cases was unknown. The types of vehicle collision injury sustained are detailed in Figure 27.
Injury type
Whiplas h 25%
Multiple injuries 24%
Fatality 13%
Sprain/strain 13% Unknown
25%
Figure 27 – Vehicle collision injury types sustained
The most common (known) injury type was whiplash, accounting for 25% of the cases examined. Multiple injuries (24%) were also commonly sustained. One vehicle collision case resulted in a fatality.
Success rate
Of the 8 cases examined, all (100%) were successfully settled. The amount of compensation paid ranged from £1,000 to £250,000, with a mean amount of £27,024. The mean time for cases to be settled was 18 months.
39

5.11 STANDING SURFACE COLLAPSED
Of the 488 compensation claims examined, 8 (1.6%) cases involved a standing surface collapsing.
Injury cause
The actual causes of injury for all 8 cases was a fall from a height, Examples include steps/stairs giving way, a platform edge collapsing, a manhole covercollapsing, as well as a machinery footplate collapsing.
Injury type
The injury type sustained was unknown for 5 of the 8 cases examined. Of the remaining three cases; one involved back pain, one involved concussion, and one involved tenderness/swelling of the whole body.
Success rate
Of the 8 cases examined, 6 were known to have been successfully settled. The amount of compensation paid ranged from £1500 to £150,000, with a mean amount of £28,250. The mean time for cases to be settled was 17 months.
40

5.12 STRIKE BY MOVING OBJECT
Of the 488 compensation claims examined, 7 (1.4%) cases involved a strike by a moving object.
Injury cause
The causes of injury for these cases are detailed in Figure 28.
objStrike by moving
ect 57%
Pinch/crush 29%
Fall on same level 14%
Figure 28 – Causes of strike by moving object injuries
The cause of injury for the majority of cases was the actual strike by the moving object itself. Examples include a metal bar or pipe which swivelled or moved, striking the operator.
A pinch/crush was the cause of injury for 2 of the cases examined. One involved an individual trapping his hand in a window, and one involved a door.
41

Injury type
The types of injuries sustained as a result of being struck by a moving object are detailed in Figure 29.
/
/s
Cut laceration 43%
Brus ing 43%
Broken bone14%
Figure 29 – Strike by moving object injury types sustained
As shown above, the most common injury types sustained were a cut/laceration and bruising, each accounting for 43% of the cases examined.
42

Injury site
The body parts typically affected by such injuries are detailed in Figure 30.
/s
Thumb 14%
Back and leg 14%
Ches t 14%
Foot 14%
Face 30%
Finger14%
Figure 30 – Strike by moving object injury sites
Two of the seven cases examined involved an injury to the face. The foot, chest, back and leg, thumb and finger/s each accounted for 1 case.
Success rate
Of the 7 cases examined, 1 is known to have been successfully settled. The amount of compensation paid was £1,000. The case took 9 months to be settled.
43

5.13 WORKING WITH COILS
Of the 488 compensation claims examined, 6 (1.2%) cases involved working with coils.
Injury cause
In all cases, the actual cause of injury was striking against an object. In most cases this object was the coil. Examples include pulling on a trapped coil causing it to spring back, cutting a coil and one end sprung back and feeding a coil through a slitter which caused it to curl upwards.
Injury type
Five of the six cases resulted in a cut/laceration (to the face, arm, eye/s, face, finger/s or hand). The other case resulted in a broken bone (face - nose).
Success rate Of the 6 cases examined all are still on-going.
5.14 TOOL SLIPPED
Of the 488 compensation claims examined, 6 (1.2%) cases involved a tool slipping.
Injury cause
In 3 cases, the actual cause of injury was striking against a moving object. Examples include a hammer slipping and striking the user’s fingers and a Stanley knife slipping and cutting the user’s hand. In 2 cases the cause of injury was a pinch/crush and in 1 case the injury was caused by a strike against a stationary object.
Injury type
Broken bone/s (thumb and finger/s) was the most common injury sustained (2 out of 6 cases). A cut/laceration (to the hand), sprain/strain (in the wrist), tenderness/swelling (in the arm) and bruising (in the hand) was the injury type sustained the 4 other cases examined.
Success rate
Of the 6 cases examined all are still on-going.
5.15 ASBESTOS INHALATION
Of the 488 compensation claims examined, 6 (1.2%) cases involved exposure to asbestos.
Injury cause
As expected the cause of injury was asbestos inhalation, most commonly from working in a furnace or with locomotives.
Injury type
Three of the six asbestos cases resulted in a fatality. The remaining 3 resulted in lung disease.
44

Success rate
Of the 6 cases examined, 4 (67%) are known to have been successfully settled. The amount of compensation paid ranged from £1,000 to £77,000, with a mean amount of £27,400. The mean time for cases to be settled was 27 months.
5.16 SHARP OBJECT ON FLOOR
Of the 488 compensation claims examined, 5 (1%) cases involved a sharp object on the floor.
Injury cause
In all five cases, the actual cause of injury was a puncture. Examples include stepping on a piece of glass, welded mesh wire or a protruding screw.
Injury type
Cut/laceration (to the foot) and puncture (to the foot) were the most common injuries sustained and each occurred twice. Intrusion by a foreign body was the injury type sustained the other case examined.
Success rate
Of the 5 cases examined, 3 are known to have been successfully settled. The amount of compensation paid ranged from £500 to £1,250. The mean time for cases to be settled was 25 months.
5.17 EXCESSIVE WORKLOAD
Of the 488 compensation claims examined, 5 (1%) cases involved excessive workload.
Injury cause
The cause of injury was excessive workload. No further details were available.
Injury type
Not surprisingly, the most common injury type sustained as a result of excessive workload was stress, accounting for 3 of the 5 cases examined. One case involved a fall as a result of fatigue (due to the excessive amount of work to be done). The cause of injury for the remaining case was unknown.
Success rate
Of the 5 cases examined, all are still on-going.
45

5.18 STRIKE STATIONARY OBJECT
Of the 488 compensation claims examined, 4 (0.8%) cases involved a strike against a stationary object.
Injury cause
In all four cases, the actual cause of injury was striking against an object. Examples include walking into a filing cabinet drawer, banging head on a metal box, walking into a protruding platform.
Injury type
A cut/laceration (to the head, leg or elbow) was the injury type sustained in 3 of the 4 cases examined. The remaining injury type was unknown.
Success rate
Of the 4 cases examined, 2 (50%) are known to have been successfully settled. The amount of compensation paid was £750 and £1,000. The mean time for cases to be settled was 17 months.
5.19 SEAT COLLAPSED
Of the 488 compensation claims examined, 4 (0.8%) cases involved a seat collapsing.
Injury cause
In two of the cases, the actual cause of injury was a fall from height. An example of which includes the seat in a cab collapsing under the driver. In the remaining two cases the cause of injury was a pinch/crush and strike against a stationary object.
Injury type
Bruising (whole body) and fracture (finger/s) were the causes of injury for two of the four cases. The injury cause for the remaining two cases is unknown.
Success rate
Of the four cases examined all are known to have been successfully settled. The amount of compensation paid ranged from £1,250 to £25,000, with a mean amount of £8,077. The mean time for cases to be settled was 13 months.
5.20 INADEQUATE PPE
Of the 488 compensation claims examined, 4 (0.8%) cases involved inadequate Personal Protective Equipment (PPE).
Injury cause
There were four different causes of injury for the four cases examined: exposure to radiant heat, coming into contact with a hot surface, being struck by a moving object and receiving a puncture wound.
46

Injury type
Burn/s (foot and leg) were sustained in 2 of the cases examined. A cut/laceration (leg) and intrusion by a foreign body (eye/s) were the injuries sustained in the remaining two cases.
Success rate
Of the 4 cases examined, 1 (25%) is known to have been successfully settled. The amount of compensation paid was £250. The case took 20 months to be settled.
5.21 EXPOSURE TO VIBRATION
Of the 488 compensation claims examined, 4 (0.8%) cases involved an individual being exposed to vibration.
Injury cause
As expected in all cases the cause of the injury was exposure to a vibrating object/surface. No further details of how the injuries were sustained were available.
Injury type
Vibration white finger was the injury sustained in all cases.
Success rate
Of the 4 cases examined, all cases are on-going.
5.22 EQUIPMENT BROKE DURING USE
Of the 488 compensation claims examined, 4 (0.8%) cases involved equipment breaking while an individual was using it.
Injury cause
The most common cause of injury was a strike by a stationary object. Examples include a coil highlighting stick breaking causing the user to come in contact with a sharp coil or the metal plate on the chair collapsing causing the user to hit their head on the worksurface. The remaining two cases involved a strike by a moving object and contact with a hot surface.
Injury type
A cut/laceration (finger/s and foot) was sustained in two of the cases examined. Bruising and burn/s were the injuries sustained in the remaining two cases.
Success rate
Of the 4 cases examined, 2 are known to have been successfully settled. The amount of compensation paid was £893 and £3,500. The mean time for cases to be settled was 22 months.
47

5.23 BULLYING/DISCRIMINATION
Of the 488 compensation claims examined, 4 (0.8%) cases involved bullying or discrimination.
Injury cause
As expected, the cause of injury in these cases was the act of bullying/discrimination itself. No further details were available.
Injury type
The injury sustained in all cases examined was stress (100%).
Success rate
Of the 4 cases examined, 1 is known to have been successfully settled. The amount of compensation paid was £5,000. It is not known how long the case took to be settled.
5.24 VANDALISM
Of the 488 compensation claims examined, 3 (0.6%) cases involved an act of vandalism.
Injury cause
In all three cases, vandals had placed wood, bricks etc on a train track, which a train then collided with.
Injury type
Stress was the injury type sustained in two of the three cases examined. The remaining case involved back/neck pain.
Success rate
Of the 3 cases examined, all were successfully settled. The amount of compensation paid ranged from £1,000 to £22,323, with a mean amount of £8,107. The mean time for the cases to be settled was 38 months.
5.25 POOR VISIBILITY
Of the 488 compensation claims examined, 3 (0.6%) cases involved poor visibility.
Injury cause
In two of the cases examined, the cause of injury was a trip over an object (which was not seen as a result of faulty/inadequate lighting levels). The remaining case involved a fall.
Injury type
The injury types sustained were a dislocated shoulder, a bruised ankle and an unknown back/neck injury.
48

Success rate
Of the 3 cases examined, 2 were known to have been successfully settled. The amount of compensation paid was £1,500 and £2,000. The cases took 12 and 18 months respectively to be settled.
5.26 UNSAFE/UNSECURE LADDER
Of the 488 compensation claims examined, 2 (0.4%) cases involved an unsafe or unsecured ladder.
Injury cause
As expected, the cause of injury in these cases was a fall from height.
Injury type
The injury sustained in one case examined was a fracture (to leg). The injury sustained in the other case is unknown.
Success rate
Of the two cases examined, both are still on-going.
5.27 SUDDEN BRAKING
Of the 488 compensation claims examined, 2 (0.4%) cases involved a train suddenly braking as a result of an emergency stop.
Injury cause
No further details surrounding the emergency stop were available.
Injury type
One driver sustained back pain, and the other sustained tenderness/swelling to his knee.
Success rate
Both cases were known to have been successfully settled. The amount of compensation paid was £1,000 and £2,000. The time for the cases to be settled was 6 and 38 months.
5.28 INADEQUATE GUARDING
Of the 488 compensation claims examined, 2 (0.4%) cases involved inadequate guarding on machinery.
Injury cause
The cause of injury in these cases was a strike by a moving object. Both cases involved swarf or fragments flying into an individual’s eye due to lack of guarding on a machine.
49

Injury type
The injuries sustained in one of the cases examined were a cut/laceration (to face). The injury sustained in the other case involved intrusion by a foreign body (in the eye/s).
Success rate
Of the 2 cases examined, both are still on-going.
5.29 EXPOSURE TO FUMES AND DUST
Of the 488 compensation claims examined, 2 (0.4%) cases involved exposure to fumes and dust.
Injury cause
As expected, the cause of injury in these cases was exposure to fumes and dust as a result of sitting in the driver’s cab of a crane or train.
Injury type
The injury sustained in one case was lung disease. The injury sustained in the remaining case was chest discomfort.
Success rate
Of the 2 cases examined, 1 is known to have been successfully settled. The amount of compensation paid was £75. The time the claim took to settle is unknown.
5.30 ILLNESS
Of the 488 compensation claims examined, 1 (0.2%) cases involved an illness.
The individual involved fell as a result of dizziness (a side effect of an illness). No further details regarding the exact illness were available. A broken leg was sustained as a result of the fall.
It is unknown if the case was successfully settled.
5.31 LOSS OF POWER
Of the 488 compensation claims examined, 1 (0.2%) case involved a loss of power to a crane.
As a result, the crane free-wheeled and struck some slabs, which crashed into the cab of thecrane, trapping the driver. He sustained bruising.
It is unknown if the case was successfully settled.
5.32 INSECT BITE
Of the 488 compensation claims examined, 1 (0.2%) cases involved an insect bite
The individual involved was bitten by a flea on the elbow.
The case was successfully settled after 1 month and damages of £250 were paid.
50

5.33 EXPOSURE TO WELDING
Of the 488 compensation claims examined, 1 (0.2%) case involved exposure to welding
The cause of injury in the case was exposure to a welding flash which caused an injury to theeye/s.
The one case examined is still on-going.
5.34 EXPOSURE TO RADIATION
Of the 488 compensation claims examined, 1 (0.2%) case involved exposure to radiation.
The cause of injury was a radiation leak from an x-ray machine. The x-ray unit was used by three staff members at head height.
The injury sustained was a malignant melanoma in the individual’s right eye. It is unknown if the case was successfully settled.
With regards to the two other staff members using the x-ray machine, it is known that one staff member died from a malignant brain tumour. The second has not been traced.
5.35 EXPOSURE TO CHEMICALS
Of the 488 compensation claims examined, 1 (0.2%) case involved exposure to chemicals.
The individual involved inhaled cleaning fluid. No other details surrounding the case wereavailable.
It is known, however, that the case was not successfully settled.
51

52

6. ANALYSIS OF COMPENSATION CLAIMS FROM TGWU
The TGWU has over 900,000 members in different workplaces across the UK. The four sectors covered by the union are food and agriculture, manufacturing, services and transport. The TGWU’s information on claims is computerised. From their database we were able to collect a considerable amount of information on the 75,333 cases received spanning a thirteen-year period (1988 to 2001). The information received had been categorised by the TGWU according to the 'damage type'.
6.1 DAMAGE TYPE
The different damage types of the 75,333 compensation claims examined are detailed in Figure 31.
0%
j67%
33%
Fatal
In ury at work
Industrial disease
Figure 31 – Division of damage types
As can be seen from the figure above the majority of compensation claims were a result of an injury at work (67.1%). The next most common damage type was an industrial disease (32.6%).
53

6.1.1 Claims received and settled
Table 3 shows the number of cases received from 1988 to 2001 that were successfully settled. It also shows the minimum and maximum amounts of compensation received for each damage type.
Table 3 - TGWU claims information (1988-2001)
Damage type % of cases. successfully
settled
Minimum amount
Maximum amount
Fatal 73% £400 £290,000 Injury at work* 66% £1 £1,133,462
Industrial Disease 64% £1 £500,000
As can be seen from the table, fatalities have the largest percentage of successful cases compared to the other two damage groups, with 73% of cases being successful. Injury at work cases receive the largest amount of compensation (£1,133,462). Both injury at work and industrial disease cases have also received the lowest amount of compensation (£1).
Figure 32 below shows the number of claims received between 1988 – 2001 and the number of these received claims that were successful.
0
1988
1989
1990
1991
1992
1993
1994
1995
1996
1997
1998
1999
2000
2001
inj laii
inj lail
laims i
laims l
lai
laims l
1,000
2,000
3,000
4,000
5,000
6,000
7,000
Year
No.
of c
laim
s
ury at work - c ms rece ved
ury at work - c ms successfu
industrial disease - crece ved
industrial disease - csuccessfu
fatality - c ms received
fatality - csuccessfu
Figure 32 – Number of claims received from 1988 –2001 and the number of these claims that were successful
As can be seen from the figure there was an increase in number of injury at work claims received in 1991 and in 1998. The least number of injury at work claims were received in 1993. The number of industrial disease claims received peaked in 1993 and has been declining since that year. The number of claims involving a fatality appears to have remained constantly low throughout the years (mode number of claims 14), with a small peak in claims received in 1990 (28 claims received).
* Due to a problem with the software it was not possible to access injury at work data for 1990.
54

From the figure it appears that the number of claims received is decreasing and 2001 sees receipt of the lowest number of industrial disease and fatality claims since the records were stored. We must be cautious when interpreting this finding as the apparent reduction in the number of compensation claims received is likely to be due to the fact that recent claims have not yet been entered on the database.
The number of successful claims for all damage types has remained a consistent level below the claims received up until 1998. From this point onwards the separation between the number of claims received and the number of these claims that are successful increases. We must be cautious when interpreting this finding to mean that the percentage of claims that are successfully concluded is decreasing. As can be seen from the table below, the average industrial disease claim takes approximately 3 years (35 months) to reach conclusion. Therefore many of the claims which were received from 1998 onwards may still be on-going and as a result from this year onwards the graph does not give a true indication of the number of claims that will be successful. The trend, therefore, since 1993 is likely to be rising for all types of claim.
Table 4 - Time elapsed from the union receiving the industrial disease claim to obtaining compensation. (based on a sample of claims from 1988 – 2001)
Average time 35 months Mode (most frequently occurring) 31 months
Max. time 133 months Min. time 1 month
The table also shows that the longest time for a claim to be settled was 11 years and one month. The minimum time a claim took to be settled was 1 month.
55

6.1.2 Compensation received
Figure 33 below shows the amount of compensation obtained by successful claims, which were originally received from 1988 to 2001.
0
200000
400000
600000
800000
1000000
1200000
(£)
i
Am
ount
Injury at work m n. Injury at work max. Industrial disease min. Industrial disease max.
988
1989
1990
1991
1992
1993
1994
1995
1996
1997
1998
1999
2000
2001
1Year
Figure 33 – Minimum and maximum amount of compensation for successful claims received from 1988-2001
The Figure shows that the greatest amount of compensation was received for an injury at work claim in 1991 (£1,133,462) and an industrial disease claim in 1992 (£500,000). The graph appears to show that the amount of compensation received for claims is decreasing. However as described above, this may not be an accurate description of the situation as the average industrial disease claim takes 36 months to be settled. As a result many claims from 1998 onwards may not have been settled by 2001 and if claims that take the longest to settle receive the largest amount of compensation, this could be causing the apparent decrease in amount received for compensation claims.
The lowest claim amount for industrial disease was received in 1995 (£1). The lowest amount received for an injury at work claim was £1 received in 1993, 1998 and 1999.
6.2 INJURY TYPE
We collected data for a total of 75,333 cases. The TGWU had categorised the cases according to the 'damage type' as shown above. For the damage types injury at work and fatality, no additional details regarding the accident cause were available. However for the 24,843 industrial disease cases we were able to access information on the injury cause.
As can be seen from Table 5, Deafness was the most common disease type, accounting for 14,492 (58%) of the cases.
Repetitive strain injury was the second most common disease type, accounting for 4,834 (19.5%) cases.
Vibration white finger (1,284 = 5.2%) and dermatitis (1,236 = 5%) were also common disease type.
56

The disease types with the highest success rate (i.e. the percentage of cases successfully settled) were leptospirosis, methyl bromide, streptococcus suis and vitiligo. All the cases relating to these disease types were successfully settled. The disease type with the lowest success rate was stress related condition, with 5% of cases being successful. As mentioned above due to the time that elapses between receiving a claim and gaining a successful outcome, many of the claims which were received from 1998 onwards may still be on-going, so it is likely that the table does not give a true indication of the number of claims that will be successful in the future.
The disease type which received the largest amount of compensation was dermatitis (£175,000). The disease type which received the lowest amount of compensation was injuries resulting from an oxide of nitrogen (£250).
The highest amount received on average for a settled claim is from the disease type lead poisoning (£186,000), the lowest amount received on average is from Legionnaires disease (£9,500).
The disease type which took, on average, the least amount of time to settle was disease of the mucous membrane (14.5 months). The disease type which took, on average, the most amount of time to settle was bone disease/emphysema (111 months).
57

6.3 INDUSTRY SECTOR
The TGWU had categorised each of the industrial disease injury claims according to the industry sector of the company involved, the results from a sample of industrial disease claims received from 1988 – 2001) are presented in Figure 34.
6
0 5 15 20 25 30
0.3
1.3
1.6
2.8
3.8
3.8
4.1
4.4
4.4
7.3
7.3
12.3
15.8
24.7
10
Building craft s
P assenger services
Building, construction & civil engineering
Agricult ural & allied workers
T ext ile workers
Administrit ive, clerical & technical workers
Docks, wat erways & fishing
General workers
Commercial services
P ublic services
Food, drink & t obacco
Chemical, oil & rubber refining
Power & engineering
Vehicle building & automotive
Unknown
Percentage
Figure 34 – Industry Sector from a sample of industrial disease claims received from 1988-2001
As can be seen above the industry involved in the majority of cases analysed was the vehicle building and automotive sector, accounting for 15.8%. The second largest industry sector was the power and engineering sector, which accounted for 12.3% of the claims. The food, drink and tobacco and chemical, oil and rubber refining sectors also attracted a large amount of claims (7.3%).
58

Damage type No. of cases
No. successfully settled
% of successful
claims
Mean time elapsed from receipt of claim
to compensation
Min amount Max amount Mean amount
AIDS 1 0 0 N/A N/A N/A N/A Arsenic poisoning 2 1 50 94 months N/A £2,000.00 £2,000.00 Asbestos poisoning 653 405 62 40 months £1,000.00 £173,000.00 £35,627.33 Asbestos-pleural plaque 189 117 62 45 months £3,000.00 £175,000.00 £51,558.93 Asthma 861 434 50 34 months £850.00 £73,480.47 £13,039.38 Beat hand 2 0 0 N/A N/A N/A N/A Benzene poisoning 17 3 18 65 months £2,500.00 £7,500.00 £5,000.00 Berryllium poisoning 1 0 0 N/A N/A N/A N/A Bladder cancer 103 20 19 80.5 months £16,000.00 £140,000.00 £63,340.92 Bone disease/emphysema 9 1 11 111 months N/A £15,000.00 £15,000.00 Bronchitis 42 17 40 15.5 months £3593.70 £5738.54 £4,444.08 Brucellosis 1 0 0 N/A N/A N/A N/A Bursitis (Beat elbow) 14 6 43 29 months £664.69 £4,500.00 £2,502.10 Bursitis (Beat knee) 13 5 38 27 months £600.00 £4,500.00 £1,680.00 Byssinosis 3 0 0 N/A N/A N/A N/A Cadmium poisoning 9 5 56 39 months £2,500.00 £36,000.00 £15,000.00 Campylobacter 1 0 0 N/A N/A N/A N/A Chronic fatigue syndrome 2 0 0 N/A N/A N/A N/A Deafness 14,492 10,352 71 25 months £400.00 £17,500.00 £3,438.62 Dermatitis 1,236 808 65 24 months £1,000.00 £175,000.00 £14,053.70 Emphysema 45 16 36 27.5 months £1001.98 £311,90.30 £8,951.63 Extrinsic Allergic Alveolitis
5 4 80 41.5 months £750.00 £8,500.00 £5,187.50
Groundwater 1 0 0 N/A N/A N/A N/A Lead poisoning 12 5 42 45.5 months £5,000.00 £725,000.00 £186,000.00 Legionnaires Disease 2 1 50 13 months N/A £9,500 £9,500 Leptospirosis 2 2 100 35.5 months £3,000.00 £65,320.14 £34,160.07 Liver tumour 3 1 33 12 months N/A £85,000.00 £85,000.00 Lung cancer 71 17 24 35.5 months £1,500.00 £59,865.64 £20,050.47 Mercury poisoning 1 0 0 N/A N/A N/A N/A Mesthelioma 126 73 58 37.5 months £3,000.00 £50,604.00 £29,199.59 Methyl Bromide 1 1 100 67 months N/A £15,000.00 £15,000.00
59

Damage type No. of cases
No. successfully settled
% of successful
claims
Mean time elapsed from receipt of claim
to compensation
Min amount Max amount Mean amount
Mucous Membrane 435 25 6 14.5 months £350.00 £79,875.62 £17,695.12 Myelofibrosis 1 0 0 N/A N/A N/A N/A Nose Cancer 22 4 18 22 months £500.00 £12,236.00 £3,684.00 Oxide of Nitrogen 20 17 85 71.5 months £250.00 £48,500.00 £13,700.00 Peripheral Neuropathy 3 0 0 N/A N/A N/A N/A Pheumoconiosis 94 57 61 31 months £1,500.00 £77,620.22 £20,150.34 Radiation 26 4 15 28.5 months £2,000.00 £35,000.00 £14,250.00 Repetitive Strain Injury 4,834 2,159 45 34 months £750.00 £35,000.00 £5,627.70 Skin Cancer 8 0 0 N/A N/A N/A N/A Spondylitis 2 0 0 N/A N/A N/A N/A Stomach cancer 2 0 0 N/A N/A N/A N/A Streptoccoccus suis 1 1 100 74 months N/A £15,000.00 £15,000.00 Stress related condition 186 9 5 21 months £2,000.00 £100,025.28 £27,086.14 Throat and mouth cancer 4 0 0 N/A N/A N/A N/A Vibration white finger 1,284 729 57 22.5 months £550.00 £40,000.00 £6,825.26 Viral Hepatitis 9 7 78 25 months £500.00 £22,500.00 £5,392.86 Vitiligo 2 2 100 39.5 months £2,500.00 £3,500.00 £3,000.00 TOTAL: 24,843 15,308
Table 5 - TGWU Industrial diseases claims information (1984-2001) (Data on amounts and time elapsed not complete as based on a random sample of cases)
60

7. ANALYSIS OF COMPENSATION CLAIMS FROM UNISON
UNISON is Britain’s largest trade union with over 1.3 million members working in the public services. Its members include frontline staff and managers working in local authority, the NHS, the police service, colleges and schools, the electricity, gas and water industries, transport and the voluntary sector.
Summary data for 11,200 cases was received for a one-year period (2001). The data had been categorised by 'description', and according to industry sector, as shown in Table 6.
As can be seen from the Table, trips, slips and falls (same level) were the most common incident type, accounting for 2164 (19%) of the cases received. Stress (16%) and manual handling (13%) incidents were also common. These findings are consistent with the findings of other trade unions in terms of the accident type, as slips, trips and falls, manual handling, and stress incidents were also common. However, as only summary information was available, no further comparisons could be made.
Within the sectors covered by UNISON, the majority of claims for compensation were received from individuals within the local government sector, closely followed by those in the health sector.
61

62

8. ANALYSIS OF COMPENSATION CLAIMS FROM USDAW
USDAW is one of Britain’s largest trade unions with 310,000 members nationwide. USDAW members work in a variety of occupations and industry sectors including shop workers, call centre workers, factories and warehouse workers and clerical workers.
Data was received for a total of 34,917 cases spanning a seven-year period (1995 to 2001). The information received had been categorised by USDAW according to the 'damage type', as shown in Table 7. No additional details regarding the accident cause were available.
As can be seen from the table, strains and sprains were the most common damage type, accounting for 9489 (27%) of the cases. This is comparable with the injury type information collated from other trade unions (as discussed in the previous section), where strains/sprains were also the most common injury sustained.
Lacerations and open wounds was the second most common damage type, accounting for 4640 (13%) cases. Again, this is consistent with the claims of other trade unions, where cut/lacerations were also the second most common injury type.
Bruising and fractures were also commonly sustained.
The damage type with the highest success rate (i.e. the percentage of cases successfully settled) was 'injury caused by contacting electricity', which had a success rate of 79%. The (known) damage types least likely to be successfully settled were Work Related Upper Limb Disorders (WRULD's) and respiratory disease. It is interesting to note, however, that the mean damages paid for successful respiratory disease cases are one of the highest (with a mean of £10,850). Only for fatalities and amputations were higher damage amounts paid.
63

Description Education Electricity Gas Health Local govern
ment
Police Transport Water Unknown Total
Trips, slips and falls (same level) 98 3 4 692 1185 49 3 28 102 2164 Road traffic accident 46 12 12 419 618 28 6 22 524 1687 Stress 41 6 2 352 1029 51 3 8 118 1610 Manual handling (lifting) 24 2 3 638 640 12 11 11 1341 Accident at work – other causes 31 5 3 455 607 24 2 13 51 1191 Other 21 2 183 347 13 8 99 673 Trips, slips and falls (from height) 16 3 2 64 214 4 2 9 314 Work related upper limb disorder 11 3 3 80 181 8 4 19 309 Assaults (civil) 1 136 146 4 15 302 Contact with sharp objects 12 1 98 126 6 3 8 254 RSI-keyboard 8 1 1 45 109 11 4 4 183 Vibration white finger 4 1 13 104 5 14 141 Needlestick 120 13 1 1 135 Contact with hot substance 6 51 61 4 3 125 Manual handling (other) 5 34 70 1 110 Medical negligence 5 43 36 3 21 108 Noise injury/deafness 1 1 2 22 62 3 1 13 105 Lung disease 1 1 30 52 3 1 14 102 Exposure to chemicals 4 32 42 5 3 86 Bullying 2 3 18 43 5 71 Protection from Harassment Acts 12 36 1 2 51 Asbestosis 6 1 5 27 1 2 5 47 Skin disease 1 16 19 1 7 44 Poisoning 1 12 12 1 26 Infectious diseases 1 9 3 13 Cancer 2 1 4 1 8 Total 348 43 34 3580 5786 237 14 114 1044 11200
Table 6 – UNISON personal injury claims (1st January to 31st December 2001)
64

Damage type No. of cases
No. successfully settled % successfully settled
Damages paid (mean - £)
Minimum amount (£)
Maximum amount (£)
Strains and sprains 9489 5277 56 4,095 32 450,000 Lacerations and open wounds 4640 2924 63 1,629 30 150,000 Bruising 3099 2066 67 1,540 50 67,500 Fracture 2908 1637 56 4,592 100 206,000 Unknown 2787 200 7 4,918 50 599,451 Injuries of more than one type 2590 1691 65 5,335 29 1,200,000 Contusions and crushings 2058 1268 62 2,756 50 250,000 Work related upper limb disorders 1530 261 17 4,138 200 50,000 Burns 1001 705 70 1,728 50 165,427 Superficial injuries 748 423 57 419 30 8,000 Whiplash 674 440 65 3,135 27 38,500 Dislocation 477 218 46 5,757 150 180,000 Mental illness/stress 470 135 29 5,169 350 120,000 Unidentified disease/injury 441 90 20 1,047 35 15,000 Known disease not coded 377 133 35 2,572 20 80,000 Deafness 348 110 32 2,944 348 55,000 Concussion 332 202 61 2,484 100 51,577 Hernia 233 108 46 2,893 150 6,500 Asphyxiations, poisonings and gassings 156 67 43 4,935 250 205,000 Injury caused by contact with chemicals 151 87 58 2,328 100 50,000 Respiratory disease 128 22 17 10,850 350 60,500 Dermatitis 88 30 34 2,852 250 20,000 Injury caused by contacting electricity 85 67 79 1,984 150 16,000 Amputation 77 56 73 16,900 1000 203,726 Zoonoses 20 4 20 1,093 30 2,500 Fatality 6 3 50 62,519 10,000 107,556 Loss of sight 4 0 0 0 0 0
Table 7 – USDAW claims information (1995 to 2001)
65

66

9. CONCLUSION
The objectives of this research were to gather claims-related data from major trade unions where available and to identify information pertaining to the following issues:
· What are the main types of claim? · What are the main injuries sustained? · What are the industry sectors which attract the highest proportion of claims? · What are the work activities which give rise to the most claims? · What breaches of the Regulations are most likely to attract claims? · How long does it take for claims to be settled? · What are the average costs of claims?
In addition we hoped to gather information on:
· Claims from employees of small companies · Public liability/third party claims.
In this section we present our answers to these questions, and provide recommendations associated with each objective, where possible, to help focus remedial action by companies and the regulator.
9.1 WHAT ARE THE MAIN TYPES OF CLAIM?
Our analysis of the claims data received from ASLEF, FDA, ISTC, MU and NGSU revealed that the main types of claims received were as a result of accidents from:
· Slips, trips and falls (16%) · manual handling (10%) · exposure to noise (7.6%).
The cause of the accident was unknown for 120 (24.6%) of the cases.
Data from UNISON showed that trips, slips and falls (19%), stress (16%) and manual handling (13%) were the main types of claim. These results are consistent with the findings of the other trade unions above, with the exception of noise, which accounted for only 1% of UNISON claims (as opposed to 7.6% as above). In addition, stress was the second most common type of UNISON claim, accounting for 16% of cases, whilst only 1.6% of ASLEF, FDA, ISTC, MU and NGSU cases were stress related.
The TGWU data revealed that injuries at work were the main claim received (67.1%) but no further information was available surrounding the types of claims in this category. No details surrounding the types of claims were available from the USDAW data.
9.2 WHAT ARE THE MAIN INJURIES SUSTAINED?
The ASLEF, FDA, ISTC, MU and NGSU data revealed that the main injury types sustained were:
· (unspecified) pain (9.6%) · strain/sprains (9%) · deafness/hearing loss (8%) · cut/laceration (8%).
67

26% of injury types were unknown.
Data from USDAW supported these findings, as the main injuries sustained by members of this trade union were strains and sprains (27%), lacerations and open wounds (13%) and bruising (8.9%).
No details surrounding the main injuries sustained were available from the USDAW or TGWU data.
9.3 WHAT ARE THE INDUSTRY SECTORS WHICH ATTRACT THE HIGHEST PROPORTION OF CLAIMS?
The ASLEF, FDA, ISTC, MU and NGSU data revealed that the industry sectors which attracted the highest proportion of claims were:
· railway sector (29.7%) · metal work sectors (21.1%) · legal profession (7%)
However, this is not unexpected given that these are the primary sectors associated with the three largest trade unions who participated in the study, namely FDA, ASLEF and ISTC.
Data from UNISON showed that the majority of compensation claims were received from individuals with the local government sector (52%), the health sector (32%) and the education sector (3%). The industry sector was unknown for 9% of claims.
Data from TGWU showed that the majority of compensation claims were received from individuals within the vehicle building and automotive industry (15.8%), the power and engineering industry (12.3%), the food, drink and tobacco industry (7.3%) and chemical, oil and rubber refining industry (7.3%). The industry sector was unknown for 24.7% of claims.
No details regarding the industry sector were available for the USDAW data.
9.4 WHAT ARE THE WORK ACTIVITIES WHICH GIVE RISE TO THE MOST CLAIMS?
The ASLEF, FDA, ISTC, MU and NGSU data revealed that the work activities which gave rise to the most claims were:
· driving a train (16.6%) · walking on the same level (14.8%) · manual handling (9.4%)
The work activity being conducted at the time of the accident/injury was unknown for 32.8% of cases.
No details surrounding work activities were available for the UNISON, USDAW or TGWU data.
68

9.5 WHAT BREACHES OF THE REGULATIONS ARE MOST LIKELY TO ATTRACT CLAIMS?
The data received from ASLEF, FDA, ISTC, MU and NGSU revealed that the main types of claims received were as a result of accidents from slips, trips and falls, manual handling, and exposure to noise. There was little detailed information available on the circumstances surrounding cases and, with the exception of the manual handling cases, there was no information available on breaches of regulations.
For five of the 49 manual handling cases examined, the Manual Handling Operations Regulations 1992 were breached as no manual handling training was provided. This is a breach of the Manual Handling Operations Regulations 1992 (Regulation 4) which requires employers to provide information and training on manual handling risks and prevention. Additionally, for two of these cases, it is known that no risk assessment was conducted. This is a further breach of the Regulations.
For the claims cases involving slips, trips and falls, and exposure to noise we can only speculate from the information provided what breach of the Regulations had occurred.
Claims cases involving slips, trips and falls may have involved a breach of the Workplace Health, Safety and Welfare Regulations 1992, specifically Regulation 12 which is concerned with the condition of floors and traffic routes, as individuals referred to slipping on water (5), grease (2) or an oil spillage (1).
For claims involving exposure to noise very little information was available on the circumstances surrounding the cases. No details were given of the noise exposure levels of individuals, however, it is known that for 6 of the 37 cases (16.2%), no hearing protection or faulty protection was provided and of the remainder of the cases only five (13.5%) reported that foam plugs or muffs were issued.
Without details of noise levels it is difficult to determine if there was a breach of the Noise at Work Regulations 1989. These Regulations state that noise levels should be reduced so far as is reasonably practicable. If noise levels are above the first action level (85 db(A)) hearing protection should be freely available to those who want it. Above the second action level (90 db(A)) it is mandatory for employers to provide protection to all individuals exposed to the noise and mandatory for individuals to wear it. Above 90 dB(A) employers also have a duty, so far as is reasonably practicable, to reduce noise levels by engineering means.
The UNISON data revealed that the most common claim types were trips, slips and falls, stress and manual handling. No further information was available on any of these cases and as a result we were unable to speculate on possible breaches of the Regulations.
No details surrounding breaches of the Regulations were available for the USDAW or TGWU data.
9.6 HOW LONG DOES IT TAKE FOR CLAIMS TO BE SETTLED?
The ASLEF, FDA, MU and NGSU data revealed that the time period for cases to be settled ranged from 1 to 108 months, with a mean of 24 months.
The mean time the main types of claims took to be settled was:
· slips, trips and falls – 27 months · manual handling – 34 months
69

· exposure to noise – 42 months.
These settlement dates are based on the time difference between the injury date and the date when the case was settled. For the majority of successful cases, the date when the case was actually opened was unknown. For 69.5% of cases the settlement date was unknown.
The TGWU data revealed that the time period for industrial disease cases to be settled ranged from 1 to 133 months, with a mean of 31 months. The mean and minimum amount of time for a case to be settled are consistent with the findings of the other trade unions above.
No details surrounding the time taken for a claim to be settled were available from the ISTC, UNISON and USDAW data.
9.7 WHAT ARE THE AVERAGE COSTS OF SUCH CLAIMS?
The ASLEF, FDA, MU and NGSU data revealed that the smallest amount of damages paid was £75 and the largest amount of damages paid was £250,000.
The average cost of the main types of claims was:
· slips, trips and falls - £4,222 · manual handling - £4,325 · exposure to noise - £1,782.
The TGWU data revealed that the cost for cases to be settled ranged from £1 to £1,133,462 for injury at work claims and £1 to £500,000 for industrial disease claims. These amounts are higher and lower than those for the trade unions above.
No details surrounding the average cost of a claim were available from the ISTC, UNISON and USDAW data.
9.8 CLAIMS FROM EMPLOYEES OF SMALL COMPANIES
We hoped to gather information on claims from employees of small companies. Whilst for a large number of claims the company name was known, no other details were available (e.g. company size) and as a result we were unable to further investigate the issue of claims from small companies.
9.9 PUBLIC LIABILITY/THIRD PARTY CLAIMS
In addition, we hoped to gather information on public liability/third party claims. Of the 488 claims from ASLEF, FDA, ISTC, MU and NGSU, most were made by employees (66%) or it was unknown who made the claim (33%). Only 1% of claims (3) were made by members of the public. These claims were as a result of a leg injury caused by slipping on an icy platform (1), a fatality caused by falling from a platform (1) and a sprained ankle as a result of a bus moving when the individual was attempting to exit (1).
70

10. RECOMMENDATIONS AND SUGGESTIONS FOR FURTHER WORK
In the following sections we make recommendations based on the findings of this investigation, and make suggestions for further research.
10.1 RECOMMENDATIONS
· Use the findings of this research to promote further accident reduction initiatives amongst public and private sector organisations
Findings from this investigation show that the most common types of claim are: slips, trips and falls, manual handling, exposure to noise and stress. Given that the number of claims received by trade unions has increased considerably since 1993, it is important that remedial action continue to be taken and that it focuses primarily on these areas.
· Continue to raise awareness of existing legal requirements to control risks from manual handling, slips, noise and stress
As previously discussed, claims involving slips, trips and falls, manual handling, and exposure to noise are very common amongst the public and private industry sectors. There are Regulations that govern these issues, and it is important that awareness of the relevant Regulations be emphasised whenever possible, namely:
- The Workplace Health, Safety and Welfare Regulations - 1992The Manual Handling Operations Regulations 1992 - The Noise at Work Regulations 1989.
It is known from this investigation that there were several instances of a breach of the Regulations (namely the Manual Handling Operations Regulations). It is essential therefore that awareness of the need to comply with relevant health and safety Regulations be continually raised with employers.
Stress was also a common type of claim (UNISON). There are no specific Regulations that govern stress, however, it falls under the scope of the Management of Health and Safety at Work Regulations 1999.
· Continue to identify ways of raising awareness of the risks amongst employees
Employees as well as employers have a duty to protect their own health and safety. Having adequate information about the risks, and about the measures employees can take to reduce the risks is a key part in achieving this. We believe that it would be useful for HSE to further identify and promote widely effective methods for raising awareness, for example, ensuring that risks (slips, trips and falls, manual handling, noise and stress) are discussed at regular safety briefings and induction sessions, and that managers and supervisors encourage their staff to become involved in identifying and reducing risks.
71

· Investigate the possibility of standardising the way trade unions record claims information
The type and level of data recorded by trade unions for compensation claims was not found to be consistent. Whilst a small number of trade unions had a comprehensive computerised database containing detailed information for each claim they had dealt with; others recorded very limited information on paper only. As a result, it was very difficult to generate a complete picture of the types and costs of claims conducted via trade unions.
It would be useful therefore, if all trade unions collected and recorded claims information in a consistent, standardised way. Useful information would include:
- the date of the claim - who made the claim (e.g. employee, contractor, member of public etc) - the industry sector involved - the accident cause (including information on any breaches of
Regulations) - the work activity being conducted at the time of the accident/injury - the injury cause - the injury type sustained - the injury site (i.e. body part affected) - the case outcome (successful/unsuccessful) - the settlement time period - the amount of damages paid.
This would provide a valuable source of information and would point the way towards preventative strategies and remedial action.
10.2 FURTHER RESEARCH
We suggest potential areas for further research in the following section.
· Collect claims data from further trade unions to identify more accurately the types and costs of claims
Only eight of the 79 trade unions contacted agreed to participate in the investigation and provide us with information on the claims that they had dealt with. Whilst we gathered valuable information from these eight trade unions, it would be beneficial to collect information from further trade unions, as this would provide a complete picture of the types and costs of claims for compensation pursued. Additionally, collecting further information may provide an insight into claims from employees of small companies, as well as third party/public liability claims.
Many of the other 71 trade unions commented to us that they would be willing to help with our investigation but felt that the information they recorded would not be useful, or that it was not easily accessible. However, they indicated that they would be willing to change the way they record information to make it easier for information to be collated and analysed. If trade unions recorded information in a standardised way they are likely to be willing participants in future research.
72

· Develop a standardised way for trade unions to record claims data
We recommend that a standardised procedure for recording claims information be developed and trialled by trade unions. This standardised procedure could be a paper-based procedure or a computerised version or a web page. It is important, however, that any new procedure be easy to implement and use. Recording information in a standardised way would allow HSE to collate and analyse information from a large number of trade unions, thereby providing a comprehensive picture of claims, and enabling appropriate remedial action to be taken.
73

74

APPENDIX 1
TUC Affiliated Unions contacted:
ALGUS – Alliance and Leicester Group Union of Staff AEEU – Amalgamated Engineering and electrical Union ANSA – The Independent Union for Abbey National Staff AMU – Associated Metalworkers Union ASLEF – Associated Society of Locomotive Engineers and Firemen AEP – Association of Educational Psychologists AFA – Association of Flight Attendants AMO – Association of Magisterial Officers ATL – Association of Teachers and Lecturers AUT – Association of University Teachers BFAWU – Bakers, Food and Allied Workers Union Britannia Staff Union Britannic Field Staff Association EQUITY – British Actors Equity Association BALPA – British Air Line Pilots Association BACM-Team – British Association of Colliery Management, Technical, Energy and Administrative Management BDA – British Dietetic Association BOS – British Orthoptic Society BECTU – Broadcasting, Entertainment, Cinematograph and Theatre Union CSMTS – Card Setting Machine Tenters Society CATU – Ceramic and Allied Trades Union CSP – Chartered Society of Physiotherapy CWU – Communication Workers Union CDNA – Community and District Nursing Association CYWU – The Community and Youth Workers’ Union Connect – The Union for Professionals in Communications EIS – Educational Institute of Scotland EFTU – Engineering and Fastener Trade Union EMA – Engineers’ and Managers Association FBU – Fire Brigades Union FDA – Association of First Division Civil Servants GMB GULO – General Union of Loom Overlookers GPMU – Graphical, Paper and Media Union GSA – Guinness Staff Association HCSA – Hospital Consultants and Specialists Association IUHS – Independent Union of Halifax Staff IPMS – Institution of Professionals, managers and Specialists ISTC – Iron and Steel trades Confederation MPO – Managerial and Professional Officers MSF – Manufacturing science Finance MOMIMTS – Military and Orchestral Musical Instrument Makers Trade Society MU – Musicians Union NACODS – National Association of Colliery Overmen, Deputies and Shotfirers NACO – National Association of Co-operative Officials NAPO – National Association of Probation Officers NASUWT – National Association of Schoolmasters and Women Teachers NATFHE – The University and College Lecturers’ Union NLBD – National League of the Blind and Disabled
75

NUDAGO – National Union of Domestic Appliances and General Operatives NUJ – National Union of Journalists KFAT – National Union of Knitwear, Footwear and Apparel Trades NULMW – National Union of Lock and Metal Workers NUMAST – National Union of Marine, Aviation and Shipping Transport Officers NUM – National Union of Mineworkers RMT – National Union of Rail, Maritime and Transport Workers NUT – National Union of Teachers NGSU – Nationwide Group Staff Union NCTU – Northern Carpet Trades Union PLCWTWU – Power Loom Carpet Weavers and Textile Workers Union POA – Prison Officers Association PFA – Professional Footballers Association PCS – Public and Commercial Services Union SWSWU – Sheffield Wool Shear Workers Union SCP – Society of Chiropodists and Podiatrists SoR – Society of Radiographers TGWU – Transport and General Workers Union The Police Federation TSSA – Transport Salaried Staffs’ Association UCAC – Undeb Cenediaethol Athrawon Cymru UNIFI UBBS – Union for Bradford and Bingley Staff UCATT – Union of Construction, Allied Trades and Technicians USDAW – Union of Shop, Distributive and Allied Workers UTW – Union of Textile Workers UNISON WISA – The Union for Woolwich Staff WGGB – The Writers’ Guild of Great Britain YISA – The Yorkshire Independent Staff Association
Law firms contacted:
Irwin Mitchell Pattison Brewer Thompsons Russell Jones and Walker
76

APPENDIX 2
Briefing document sent to trade unions and law firms.
HSE survey of union compensation claims System Concepts, supported by the TUC Please complete and return by 9 November 2001
Analysis of correlated to health and safety issues
Personal injury compensation claims can be a valuable source of information about health and
safety at work, showing up where there are major problems, and pointing the way towards the
preventative strategies most likely to have an impact.
To investigate how useful such claims information could be, the Health and Safety Executive
(HSE) has contracted System Concepts, an independent health, safety and ergonomics
consultancy with whom the TUC has worked closely for over ten years, to collect and analyse
information from trade unions and law firms on any health and safety-related compensation
claims that they have dealt with.
The aims of the research are to:
· gather claims data from trade unions and/or law firms;· identify trends within the data for types, severity and cost of claims; · identify which breaches of which regulations are most likely to attract claims (where
possible); · identify work activities and industry sectors which give rise to the most claims; and · gather information on claims from employees of small companies.
The TUC wants to see this research project succeed, and we need your help. To create a full picture of health and safety-related compensation claims System Concepts would like to review the details of any claims that you have been, or are currently involved in. If you have data in a form which can simply be handed over to System Concepts, that would be very helpful, but if you don’t hold the data in that form, they will be able to derive it from the information you do keep. Any information you give will be treated in strictest confidence and will be used only in aggregate form for the purpose of this research. In return for your participation, System Concepts will of course provide you with a free copy of the report.
This briefing note is being sent to union legal officers and to union law firms simultaneously so that everyone likely to hold the information we need is involved.
Thank you in advance for your co-operation.
77

Owen Tudor Senior Policy Officer Prevention, Rehabilitation and Compensation
Please complete this initial questionnaire and return it to System Concepts by Friday 9 November 2001. Should you wish to discuss the study further, then please contact either Laura Peebles or Tanya Heasman. You may return the form and contact them by post (System Concepts, 2 Savoy Court, Strand, London WC2R 0EZ), telephone (020 7240 3388), fax (020 7240 5212), or by e-mail ([email protected], [email protected]).
YES, we wish to participate and will be able to provide details of health and safety-related
compensation claims, and await further information.
My name is:
My organisation is:
My contact address is:
My telephone number is:
My e-mail address is:
or
NO, we will not be able to provide details of health and safety-related compensation claims.
My name is:
My organisation is:
My telephone number is:
IF YOU KNOW OF SOMEONE ELSE in your (or another) organisation who may be able
to help, please give us their details in the sections below:
The contact name is:
The contact address is:
The telephone number is:
The e-mail address is:
78

Return this form to Laura Peebles or Tanya Heasman by post (System Concepts, 2 Savoy Court, Strand, London WC2R 0EZ), telephone (020 7240 3388), fax (020 7240 5212), or by e-mail ([email protected], [email protected])
79

Printed and published by the Health and Safety ExecutiveC30 1/98
Printed and published by the Health and Safety Executive C1.25 02/03

ISBN 0-7176-2612-1
RR 070
780717626120£15.00 9

Analysis o
f com
pensa
tion cla
ims
rela
ted
to h
ealth
and
safe
ty issues
HS
E B
OO
KS