research on deformation and a senior thesis presented in
TRANSCRIPT

RESEARCH ON DEFORMATION AND
FAILURE OF EARTHEN DAMS AND EMBANKMENTS
A Senior Thesis
Presented in
Partial Fulfillment of the
Requirement for the Degree of
Bachelor of Science at
The Ohio State University
Department of Geology and Mineralogy
by Dennis M. Anderson
Date: Autumn Quarter 1976

TABLE OF CONTENTS
Acknowledgement
Abstract
Introduction
Foundation Introduction
Foundation Research
Design of Earth and Rockfill Dams
Embankment Engineering
Internal Dam Deformation
Deformation in the Mammoth Pool Dam
Deformation in the Oroville Dam
Case Study of the Waco Dam Failure
Personal Experience on the Chippewa Watershed Involving Dam VII-C
Report of Investigation of Structural Deficiency Site VII-C Chippewa Watershed
Bibliography
Maps and Diagrams
Blueprints
I.
II.
1.
2.
3. - 4.
5.
5. - 6.
7.
7. - 9.
9. - 11.
11. - 12.
13.
14. - 20.
21.
22. - 26.

ACKNOWLEDGEMENT
I would like to thank Dr. Russell Utgard for his helpful suggestions on
the preparing of this paper. I would also like to thank the U.S. Department
of Agriculture for their cooperation and materials for this paper. Finally
I would like to thank Sue Truskot and Beverly Zak for their secretarial aid
in the construction of this paper.

II.
ABSTRACT
Stability of any structure, be it an earth dam, building, bridge or oil
platform depends on the structure's material of composition and the foundation
on which it rests. This thesis shall endeavor to reveal basic structural
deformation in earth dams and earth embankments, as well as research foundation
conditions which lead to either successful or nonsuccessful earth dams. The
employment of both engineering and geology is necessary for such a study.

I.
Introduction
Teton Dam June 5, 1976
The research of earth dam design, deformation and failure is necessitated by
man-made catastrophes as pictured above. The Teton Dam in Idaho failed on June 5th
of 1976 killing nine persons and leaving three-thousand homeless. The cost of clean
up was over one billion dollars The blame for such a catastrophe may only be placed
on society. Yes, the politicians were ignorant and neglectful as were the engineers,
but the people elected the politicians and the institutions taught the engineers .
In this thesis I shall attempt to instill a basic understanding of earth dams.

2.
Foundation Introduction
Often the weak point in earth dam construction is the interface between the
embankment material and the foundation. Preliminary investigations are generally
carried out for proposed dams to ascertain the probability of constructing a safe
structure at selected sites and to furnish sufficient data for design.
Geologic structure often promotes foundation failure. Problems may arise
from outstanding geologic features such as faulting, jointing, slump,or folded rocks ,,
containing weak layers, such as shale or evaporites presenting a potential for
foundation failures. Foundation failure may also be a result of more subtle geologic
phenomena as porosity, permeability, anisotropy*, settling or even extension
fractures in a brittle sandstone bed.
~ I. * Anisotropy - Having physical properties that vary in different directions.
I

3.
Foundation Research
Foundation research may be separated into three phases; reconnaissance,
exploratory investigation and detailed investigation. This separation saves time
and permits data to be compiled progressively for the planning and design of earth
dams.
Reconnaissance work involves researching the geologic nature of the soil and
rock formations and to estimate their structure and composition. These studies may
begin with an examination of maps and reports published by the United States and
State Geological Surveys. Some features to be examined may include '~ature
and boundaries of recent deposits by streams, lakes, wind and ice; the character,
structure, dip and strike of beds, shape and magnitude of folds; location, dip
and flow cleavage; and the directjon, extent and width of crevices; the classification
of rocks as to age and origin, composition of aggregate and cementing material,
and geologic processes which may affect the rock or soil structure; and the relation
of these geologic conditions to the permeability of the basin floor and the future
1 stability and permanence of the dam, spillway and other structures."
Exploratory investigation explores the depth, thickness and composition of
soils and rock strata. Depth of ground water is noted during this state of the
foundation research and estimations for the engineering properties begin. Methods
of subsurface exploration include open test pits, bars, or rods driven down through
shallow soils to rock surfaces, wash boring well drilling may be employed to obtain
data at great depths, core drilling and geophysical prospecting.
1subcommittee on Small Water Storage Projects of the National Resources Committee, Low Dams (Washington, D.C. 1938), p. 11

4.
"Construction of accurate geologic cross-sections across and parallel to
the axis of the dam generally require exploratory drilling and geophysical
measurements. Where it is presumed that the dam will rest on unconsolidated
deposits drive-samples are obtained for testing, and water tests are made to
determine permeability. In situations where all or part of the dam will be
constructed on bedrock, the foundation is explored by core drilling and water
testing. Ordinarily, recovery of drive-samples and rock cores is preceded by
geophysical investigation, the results of which are correlated with drill-hole
data in construction of geologic cross-sections. However, under appropriate
conditions, valuable information may be derived from geophysical logging of the
2 bore holes."
The exploratory or feasibility - state investigations are terminated when
it is concluded that the dam and reservoir site is or is not acceptable for
construction of the dam.
Assuming that the site is acceptable the detailed investigation continues
to secure accurate data on the engineering properties.
"The emphasis is now directed toward obtaining data that will be required
for adequate design and close estimation of quantities and construction costs,
including a detailed assessment of the quality and quantity of available
construction materials 113 •
2 Ernest E. Wahlstrom, Dams, Dam Foundations and Reservoir Sites, (New York 1974) pp. 191, 192.
31bid., p. 192

5.
Design of Earth and Rockfill Darns
In the design of an earth darn "the designer must plan a structure which meets
basic requirements and which at the same time must be economical. There are so
many variables involved that an analytical solution for the best dam exactly
suitable to a given site is impossible. Instead the designer must rely on his
intuition, experience, and iniative, guided by a scientific analysis of the
technical factors where that is possible. 114
Technical design and discussion of variables relevant to design of earth and
rockfill dams may be found extensively covered in the following books:
Earth and Earth Rock Darn by James L. Sherard
Embankment - Darn Engineering by Arthur Casagrande
Earth and Rockfill Darn Engineering by George F. Sowers
Darns, Dam Foundations and Reservoir Sites by Ernest E. Wahlstrom
Embankment Engineering
Materials used in embankments have different compressibility charactistics.
Well compacted and well graded materials containing silty and sandy fines are known
to be materials of poor compressibility. Optimum water content in fine grained
soils will increase the compressibility of that material. As the water content
is increased the compressibility of the fine grained material increases. For
rockfill compressibility the best materials are low quality rocks, such as
weathered rnicaceous schist. Size and uniformity of such materials are also factors
of compressibility. As size and uniformity increases so does the compressibility.
Plastic materials such as clay are poor compressible materials because of their
rebound characteristics.
4 George F. Sowers, Earth and Rockfill Darn Engineering, (New York, N.Y., 1962),
p. 183.

6.
For embankment engineering one should understand that stress strain curves
are not linear, tensil strengths are generally negligible and the compressive
strength of the embankment may be of equal magnitude as in calculations.
Compressive stresses which lie on parallel planes to tensilestresses often rule
out opening of cracks in those locations. If tensik stress is greater than or
equal to the compressive stresses then cracks will occur. "For example vertical
cracks are frequently observed near the surface of many dam embankments. The
maximum depth at which vertical cracks can remain open can be determined from
the equation:
Where"= depth at which the cracks are closed
unit weight of fill
unconfined compressive strength
stress in horizontal direction
Ifl-\~~hen the horizontal stresses are positive and cracks will not
develop unless there is local arching. At the crest itself where the vertical
stress is zero, horizontal extension strains must be resisted by tensile.stresses
5 in the soil or else cracks will open up."
Upon filling an earth dam, deflection occurs to the downstream side because
of the water load.£= A is an expression used by Casagrande to explain maximum
deflection near or at the center of the earth dam.
Where(= maximum deflection
d = downstream deflection
R = radius of curvature
For most earth dams R will approximately equal l, (the length of crest). There
fore E ... ~nd the strain which is developed from the water load is compressive
in nature; thereby reducing the tendency to crack.
5Arthur Casagrande, Embankment Dam Engineering (New York, N.Y., 1973), p.413

7.
Internal Darn Deformation
Internal deformation takes place within darns and embankments from the time
of construction and thereafter throughout the history of each dam. Some causes
for this deformation are "due to changes in total stresses and pore pressures
and due to creep and secondary time effects. 116 Foundation movement along with
settlement also plays a part in deformation. The first filling of a reservoir
may cause significant movement of the crest, but thereafter deformation will
slack off. Some areas of deformation are vertical (settlement), upstream and
downstream (normal to the dam axis) and cross-valley (parallel to the dam axis).
Essential to the detection and computation involved in understanding
deformation of dams and embankments is the instrumentation. Some instruments
and devices used are surface monuments, USBR crossarms, inclinometers, strain
meters and horizonal displacement devices. Placement of such instruments is done
during construction of the dams. By installation of instruments and devices during
construction a complete record of deformation and stress can be utilized for research
in this field of work.
Deformation in the Mammoth Pool Dam
In 1958-59 Mammoth Pool Dam on the San Joaquin River in California was the
first such project to be undertaken. Mammoth Pool Dam is an earthfill dam which
was constructed mainly from a disintegrated granite, medium fine grained and
"essentially nonplastic with 0-20% passing the No. 200 sieve and 90-100% passing
the No. 4 sieve. 117 To minimize the tendency of any seepage along the contact
between the smooth rock abutments and the rolled embankments, concrete cutoff
walls were constructed on the upstream side. The crest length of the dam is
6 Arthur Casagrande, Embankment Dam Engineering (New York, N.Y. 1973), p.366
7ibid., p. 368

8.
about 820 feet and the width from toe to toe is about 1,900 feet. The height of
the dam is approximately 320 feet above the original streambed and another 40 feet
of excavated material was replaced by material more suited for dam construction.
Average settlement and compression measured a total of 5.3 feet during the
construction of Mammoth Pool Dam. Different materials used in the dam show
different rates and degrees of deformation of vertical settlements. The 78 foot
layer of river sands and gravels only compressed 0.7% of their original thickness
(about 6 inches). A relatively large difference from this was the embankment
itself which compressed 3.0% of the 300 foot thick fill used. This compression
of the lower levels is not surprising when it is understood that approximately
20 tons/ft 2 of pressure is located in the lower reaches of the fill. These
kinds of deformation were detected by the crossarms located at various locations
on and penetrating the dam.
Inclinometers were the main devices used to measure horizonal movements in
the dam during construction. An inclinometer consists of a plastic or aluminum
casing which is telescopic. The bottom of the tube is attached into the bedrock
base and as construction goes on the tube is raised. The slope of the tube is
an essential factor which indicates different horizontal movement at the location.
Small valley strains were detected within the Mammoth Pool Dam by the use of
inclinometers. The three directions of stress are of major concern in earth dams
and embankments. The vertical, stresses normal to the axis of the dam and
stresses normal to the axis of the river. "Large extention strains can occur even
when all three principal streses are compressive, ... although large extension
strains may develop in the lower portions of embankments, the high confining
pressure from the weight of the embankment may result in all principal stresses
being compressive, and cracking will not occur unless the effective stresses
across the crack is zero or a tension. 118 Such was the case of the Mammoth Pool Dam,
81bid., p. 371

9.
2 with a compressive stress of about 20 tons/ft . The small strains which were
detected were practically irrelevent with respect to the vertical movement.
Often times a ratio of vertical movement vs. ratio of horizontal movement is
concluded, but in the Mammoth Pool Dam the horizontal movements were too little
to make any reliable ratio.
The large width of the toe was quite a conservative act in the design of
the Mammoth Pool Dam, where the toe width was much greater than the length of
the crest. During and after construction the amounts of upstream-downstream
deformation were so negligible that they were not even reported, and horizontal
movement of the shells were found to be inconsequential.
Small postconstructional movements have been detected and are considered
normal in earth dams. Typical for most dams is the decreasing rate of deformation
as time goes on, as was the case of the Mammoth Pool Dam.
Deformation in the Oroville Dam
In 1972 the undertaking of the world's highest embankment dam, up to that
time was completed on the Feather River in Northern California. The Oroville
Dam towered 770 feet with a crest length of 5,600 feet and a toe width of 3,500
feet and was located on a hard amphibolite. Instrumented extensively the dam
provided a steady and reliable source of information throughout construction.
"Two crossarm devices were installed in the downstream shell and 35 fluid devices
9 were installed at 11 elevations in the core, transition and upstream shell."
Sensitivity of these devices provided a good source in the areas of fluid
pressures and settlement. The greatest amounts of deformation occurred near the
center of the dam and lessened rapidly in the transition zones and shells. Near
the center of the core deformation values were found to be in slight excess of
4.5 feet. The deformation of the assumed ridged concrete core was slightly
greater than they had calculated, but was still negligible with respect to the
9 Anonymous, "Movement in Oroville", Am. Soc. C.E. Proc. SM (Sept. 1972) p. 657.

10.
earthfill material. Settlement of the upstream shell was affected by the
settlement of the upstream transition zone due to the location and
orientation of the core block.
Horizontal movements were measured by installing instruments in the dam
during construction and by surface markers. "These devices consist of
horizontal conduits containing a number of steel aircraft cables, each of which
is attached to an anchor embedded within the embankment. Horizontal displace-
ments are determined by measuring movements of the cables in the instruments
10 housed at the downstream slope." On the upstream side of the embankment the
largest movements occurred. Movements within the transition zone exceeded 1.0
feet downstream, movements of the shell on the upstream were in excess of 1.2
feet towards the upstream side.
Stress meters were also employed in the research of the deformation at
the Oroville Dam. Forty two of the meters were placed at various locations of
the embankment. "The distribution of stresses throughout the dam is shown by
the contours of calculated values of maximum principle stress (IJ'") shown in
Fig. 8. The values within the core are only about two-thirds as large as those
in the downstream transition and shell at the same elevation, indicating an
appreciable degree of low transfer from the relatively softer core to the
stiffer transition and shell. In addition, there is a zone of high values of
crin the transition zone above the core block parapet and a zone of low values
of q-in the soft zone upstream from the core block, from which it may be concluded
that the stiff core block and the adjacent soft zone had a large influence on
the stresses in the neighboring portions of the dam. The calculated values of
minimum principal stress and maximum shear stress were found to vary in a similar
manner.
The severity of the stress conditions may be eva/uated by contours of the
lOlbid., p. 660

11.
type shown in Fig. 9, which indicate computed percentages of strength
mobilized throughout the dam. The zones in which the greatest portion
of the shear strength are mobilized are at the downstream edge of the sloping
core and within the stress concentration above the upstream edge of the core
block. The values of percentage of strength mobilized in these zones are
about 80%, which corresponds to a factor of safety against local failure of
about 1.25. The factor of safety against overall shear failure is considerably
higher. ,)l
Case Study of the Waco Dam Failure
The study of deformation in the Waco Dam was one of necessity. A 1,500
foot section of Pepper shale formation, which is a heavily overconsolidated,
stiff-fissured clay, gave way under the weight of 700 feet of embankment
downstream from the axis of the dam. "The Pepper shale had been geologically
uplifted to the surface and was bounded laterally by two faults crossing the
axis of the embankment. The slide was confined to the length of the embankment
founded on the Pepper shale, and no significant movements were observed beyond
the fault boundaries."12 The conventional unconsolidated undrained triaxial
compression test did not reveal any complication in the preconstructional field
research involving stress analysis. Stress-strain curves were made up from
the data collected in the field. Four curves for Pepper shale were looked at,
a horizontal, a 30°, a 45°, and a vertical. These stress-strain curves reveal some
reduction of shear strength in the horizontal and the vertical but no reduction
of shear strength was detected in the 30° and 45° tests. Therefore, the negligible
significance of results from the tests negated any further studies of failure
during the construction phase of Waco Dam.
111bid., p. 661. 12Anonyrnous, "Analysis of Waco Darn Slide", AM. Soc. C.E. Proc. SM 7
(July 1972) p. 869

12.
After the slide, the Pepper shale was studied in more detail. The Pepper
shale was found to be "a highly plastic, dark gray compaction shale . with
a high degree of closely spaced, horizontal fissuring . . . This investigation
showed that the undrained shear strength of Pepper shale is highly anisotropic.
The strength along a horizontal plane was found to be only about 40% as large
as the strength in conventional unconsolidated-undrained compression tests on
vertical specimens. While total stress analysis based on isotropic strengths
from vertical specimens of Pepper shale indicated stable conditions at the
time of the Waco Dam slide, the use of anisotropic strengths produced results
in agreement with the observed failure and with the development of a pronounced
noncircular failure surface.
The significant influence of the anisotropy of Pepper shale on the
failure of Waco Dam shows the importance of considering anisotropy in analysis
for the stability of embankments founded on heavily overconsolidated, stiff-
fissured clays and clay shales. In addition to anisotropy, several other factors,
including specimens size and rate of loading, are known to influence the strength
of stiff-fissured clays and clay shales, and their effects should also be
considered in investigations of embankment stability on stiff-fissured clays
13 and clay shales." Upon the conclusion of the studies of failure and stress-
strain calculations there was a revision in the building specifications and
the Waco Dam was completed.
131bid., pp. 876, 877.

Personal Experience on the Chippewa Watershed Involving Dam VII-C
In May of 1974, I became employed by the United States Department of
Agriculture, Soil Conservation Service. I held a position as instrument
13.
man on a survey party, working on the Chippewa Watershed Project of Wayne
County, Ohio. The project is part of the Muskingum Watershed and was designed
to control sheet flooding of the source waters. The Chippewa Watershed Project
involved thirty-two miles of channelling on the Chippewa River and eight
earth dams. Five of the earth dams were dry dams and would not sustain a
reservoir unless in flood condition.
Earth Dam VII-C was nearing completion in the early part of August,
1973 when structural failure was observed. The Report of Investigation of
Structural Deficiency Site VII-C Chippewa Watershed, describes the structural
failure as observed and understood by the engineers and geologists of the
United States Department of Agriculture.
The essence of the failure was a slight rotation and downstream movement
of the impact basin and a rise of the end sill.
My job in the summer of 1974 was two-fold. First, I was responsible for
surveying and calculating volumes of earth excavated from Dam VII-C. Second,
revised plans of VII-C called for moving the principal spillway approximately seven
hundred feet along the axis of the old dam. I was responsible for the layout
and inspection of Dam VII-C revised. Also employed on the survey crew at that
time was Bob First, Gary Bennet and Ralph Bullis. Ralph Bullis was Party Chief
and Head Inspector. My employment terminated in late September of 1974 when I
returned to school at the University of Akron to finish a program of surveying
and constructing and to start a program of geology.

....... _.,. .. - ·-·.~
I . t
I
UNITED STATES DEPARTMENT OF AGRICULTURE
Soil Conservation Service
311 Old Federal Building
Columbus, Ohio 43215
August 17, 1973
REPORT OF INVESTIGATION OF STRUCTURAL DEFICIENCY
SITE VII-C CHIPPEWA WATERSHED
WAYNE COUNTY, OHIO
Authority
Robert E. Quilliam, State Conservationist, appointed the investigating committee August 14, 1973, according to the authority of SCS Engineering Memorandum-53 (Rev. 1) dated April 19, 1968.
Committee Members
Kyle L. Moran, Assistant State Conservation Engineer, Columbus, Ohio - Chairman
Leonard L. Myers, Geologist, Columbus, Ohio Clinton W. Liezert, Civil Engineer, Medina, Ohio Robert F. Fonner, Geologist, Upper Darby, Pennsylvania
I~.
Joseph M. Zurlo, Jr., Civil Engineer, Upper Darby, Pennsylvania
Scope of Investigation
The investigating committee assignment is to inspect the structure, examine the deficiency, gather necessary records and physical data, interviews, photographs and other significant information to locate and describe the nature of deficiency failure and damage. The committee's findings are reported to the Director of the Engineering Division, SCS, Washington, D. C.
Deficiency
Foundation movement under principal spillway causing impact basin to move downstream and principal spillway pipe joint separation .
,,-.-......,., .... ,,._ --<· ___ ,_ -. ---
-----,., ........ ...,;-.----------:--.. - ···- -· -·--- ------.:..-· ~----·-----------,------------·--------..-..--·--·--- ·------- - ,,11

I I I
I I I
'
• I
15.
LOCATION AND DESCRIPTION OF STRUCTURE
Site VII-C of Chippewa Watershed is located approximately five miles northeast of Wooster, Ohio. The structure was designed as Class "B" with a maximum fill height of 25 feet. It is approximately 1300 feet in length and contains 41,000 cubic yards of embankment. It is a single purpose, dry flood control structure.
The principal spillway consists of seven 20-foot lengths of 48-inch diameter RC pipe. '
INVESTIGATION OF DEFICIENCY
·Movement of the principal spillway conduit was noticed for the first time on Friday, August 10, 1973. At this time the embankment was nearing completion. A survey on August 9, 1973 indicated normal conditions around the impact basin.
The proper authorities were notified. The investigating committee was appointed by Robert E. Quilliam, State Conservationist, on August 14, 1973.
On August 15, 1973, two members of the committee made the initial investigation.
On August 17, 1973, all five members of the team were present at the site for field observation and the recording of much of the data in this report.
DESCRIPTION OF DEFICIENCY
The foundation has moved in the downstream portion of the embankment in the vicinity of the principal spillway. The impact basin has moved downstream approximately 2.4 feet. Pipe section Number 5, starting with pipe section Number 1 at the upstream end, has separated from the other sections. The upstream end of the pipe section has a 1.0-foot joint separation. The downstream end of the section has a 1.5-foot joint separation. The conduit in the vicinity of pipe section 5 has settled approximately 15 inches below the outlet.
The bottom of the newly constructed channel just below the impact basin has heaved.
- ~ . -·-- - ·-:- - ,.--- -- --------- ------ ---. ·· - .. --

• GENERAL GEOLOGY OF THE SITE
George it. White, ''Geo logy of Wayne County, Ohio," 194 7, 1 describes the geologic history of the Little Chippewa Creek
valley as a series of glacial advances and retreats during the Wisconsin Stage of the Pleistocene Epoch. The original glacial deposits, assumed to be outwash or kame deposits of ~ayeted sand, silt and clay, have been modified by subsequent glacial activity.
A glacial geology map is included as Attachment 2.
The low terraces on the valley abutments contain a mixture of partly stratified silt, sand and clay, with local pockets of sand, gravel and heterogenous glacial tills. The recent alluvium in the flood plain blankets a compl ex variety of glacial deposits ranging from admixtures of silts, sands and gravels to thick deposits of lacustrine silt and clay with some organics.
Evaluation and interpretation of data from bore holes, road , cuts, surface exposures and aerial photography plus thorough
research of other work done in this area leads to the conclusion that correlation of deposits is very difficult over any significant distance, especially in the valley bottoms which are suspected of having been reworked and reformed to an undetermined extent and number of times.
'
The detailed geology is contained in site investigation reports of 12/5/62 by Lester J. Matthes, and 10/8/70 by Henry H. Fisher, SCS geologists. (See Geology Section of Attachment 12.)
CONSTRUCTION HISTORY
The darn is being built under a federally assisted contract by H. B. Lockhart, Construction Company, Akron, Ohio. The contract date was July 31, 1972, for $188,006.03. The contract is for two structures. Structure IV-A has been completed. The original contract price for VII-C, the structure in question, was $112,159.19. The embankment is approximately 1300 feet in length. The maximum fill height is 25 feet from creek bottom. The fill height from creek bank is approximately 18 feet. The embankment contains approximately 41,000 cubic yards of earthfill. The following data was taken from the Inspector's Diary.
"The first equipment was moved on the VII-C site July 21, 1972. Core trench excavation started August 30, 1972. R. C. ~onduit delivered on site September 18, 1972 .
... ... "-- ..... ". - .· .. ~ -.-.~
----~J . """:'" - .. ·- '" ---~ - · ·-
;. ;.
._ I ::'. '

. " •
17.
; t
. i !
"Foundation drain started same day. Impact basin excavation started September 20, 1972. At required depth the material was soft gray silt. Overexcavated 1.0 ft. and placed layer of #46 material (AASHO Coarse Aggregate). Approximately 100 ft. of principal spillway dug September 22, 1972. Silty material on bottom. Seems to firm up when exposed to air and dried somewhat. First pour of concrete on imp~ct basin October 5, 1972.
"First pipe length of principal spillway laid October 10, 1972. Two inches of concrete placed under floor of impact basin for working purposes. Completed laying of pipe October 12, 1972. Twenty-seven yards of concrete poured in impact basin October 18, 1972. Concrete bedding under pipe poured on October 20, 1972. Impact basin completed November 10, 1972. Backfilling along principal spillway November 22, 1972. Placing drain fill around impact basin. Winter shutdown Friday, December 1, 1972.
"Started cleaning up site June 13, 1973. Riprap placed in outlet June 14, 1973. Outlet excavation being carried on. Old channel excavation completed and backfill and embankment started June 29, 1973. Embankment getting a good start July 13, 1973.
"Structural failure discovered August 10, 1973. At this point the fill was being topped out."
The embankment was placed in approximately 28 days using three Terex T-18 twin engine drive earthmovers.
OBSERVATIONS AND FACTS RELATING TO STRUCTURAL DEFICIENCY
The photos included in this report were taken by Robert Dush, 1 District Conservationist at Wooster, on August 15, 1973. The
statements of people on the job were taken at this time. A survey grid was set up on 10 ft. centers starting from fill centerline and extending down below impact basin and to 50 ft. either side of the principal spillway. The purpose is to have survey data available for future use. Sheets 1 through 6 of Attachment 10 are the survey data o~ the area on August 20, 1973.
j
Unless stated otherwise, all observations will be referenced looking downstream. The pipe sections and joints are numbered from the riser (~ee Attachment 7).
·- ';. ...

0
Upon inspecting the site in question, it was observed that the riprap downstream from the impact basin had been disturbed. Photo numbers 1 through 4 and Sheet 8 of the plans show the general nature and location of this disturbance. The riprap has heaved approximately 1 to 1-1/2 feet.
18.
The impact basin has moved downstream, the end sill raised, and the basin rotated slightly to the right. See Attachment 9 for actual measurements along centerline of impact basin. See Project Engineer's statement for rotation of end sill.
There was no observed cracking of the embankment or in the soil surrounding open pipe joints. There are cracks on the slope below the berm and to the right of the impact basin. See Photo No. S and Sheet 8 of Construction Drawings.
There has been no observed settlement of the fill. To check for future movement of the fill a survey has been made of the areas as previously stated.
No separation was noted between impact basin and surrounding soil.
No cracks were observed in the impact basin structure.
No seepage located in of basin. walls. It
was occurring from the 6-inch foundation drain the side walls of the basin 4.1 ft. from bottom Water movement was observed from around the wing was assumed to be coming from the foundation drain.
There is no apparent movement at the riser.
The 48-inch R.C. pipe spillway consisted of 7-20 ft. sections. Attachment 7 shows the movement that has taken place in the conduit. Pipe section S is completely detached. There is a gap of 1.0 ft. at the upper end and 1.5 ft. at the lower end. There is no apparent lateral movement in the conduit.
To date there has been very little loss of embankment material through the open joints. During construction a sheet metal
r ; shield 12 inches wide was placed ~ver each joint prior to backfilling. This is acting as a partial support for the embankment at the open joints. There is some indication that saturated material beside and under the pipe is slowly moving into the conduit through the open joints. Pieces of broken concrete were found under pipe joint 4.
·,,I·.•-,.! -: ·•...... !.. _> .....
; .T ..
-- · · ··--- · -
0
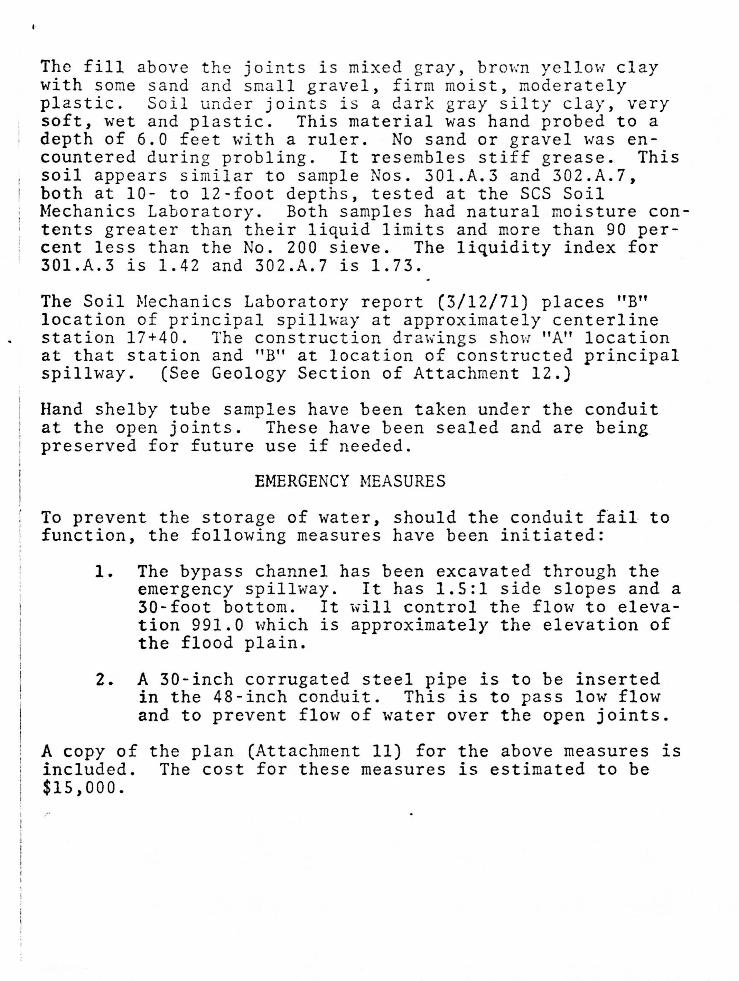
The fill above t he jo ints is mixed gray, bro~n ye llow cl ay with some sand and s mall gravel, firm moist, moderately plastic. Soil unde r joints i s a dark gray silty cl ay, very soft, wet and plastic. This material was hand probed to a depth of 6.0 fe e t with a ruler. No sand or gravel was encountered during probling. It resembles stiff grease. This soil appears similar to sample Nos. 301.A.3 and 302.A.7, both at 10- to 12 - foot depths, tested at the SCS Soil Mechanics Laboratory. Both samples had natural moisture contents greater than their liquid limits and more than 90 percent less than the No. 200 sieve. The liquidity index for 301.A.3 is 1.42 and 302.A.7 is 1.73.
The Soil Mechanics Laboratory report (3/12/71) places "B" location of principa l spillway at approximately centerline station 17+40. The construction dr awings show "A" location at that station and "B" at location of constructed principal spill way. (See Geology Section of Attachment 12.)
Hand shelby tube samples have been taken under the conduit at the open joints. These have been sealed and are being preserved for future use if needed.
EMERGENCY MEASURES
To prevent the storage of water, should the conduit f~il to function, the following measures have been initiated:
1. The bypass channel has been excavated through the emergency spillway. It has 1.5:1 side slopes and a 30-foot bottom. It will control the flow to elevation 991.0 which is approximately the elevation of the flood plain.
2. A 30-inch corrugated steel pipe is to be inserted in the 48-inch conduit. This is to pass low flow and to prevent flow of water over the open joints.
A copy of the plan (Attachment 11) for the above measures is included. The cost for these measures is estimated to be $15,000. ,-
- . .._ _ , ~ ... ·-· ~ ... . ._~
I J
I. I .

.. I
·1 I ! I I
I I I
Kyl~. f.t\oran, Assistant State Conservation Engineer
~ ((---(. c:/ x' » '7,/ <1-;z--Le-6nard L. Myers, Geologist
tk~vU/~-+:-~
Robert F. Fonnar, Geologist
~er-
., -·· ·.-; ·· : ~- · .. - ·~ J ,! - . . ..· ..
J ... ---· - - .
20.
Date
9/!2/r3 Date
Date

21.
BIBLIOGRAPHY
Anonymous, "Analys is of Waco Dam Slide", Am . Soc. C.E. Proc. Sm 7 (July 1972).
Anonymous, "Movement in Oroville Dam", Am. Soc.CE . Proc. Sm 9 (Sept. 1972) .
Anonymous, "Teton Eyewitness to Disaster", Time, June 21, 1976; Jan. 3, 1977
Casagrande, Arthur., Embankment Dam Engineering, New York, New York, 1973.
Parker, Albert D., Planning and Estimating Dam Construction, New York, New York, 1971.
Sherard, James L., Earth and Earth - Rock Dams, New York, New York, 1963
Sowers, George F and Sally, H.L., Earth and Rockfill Dam Engineering, New York, New York, 1962.
Subcommittee on Small Water Storage Projects of the Water Resources Committee of the National Resources Committee, Low Dams, Washington, D.C 1938.
United States Department of Interior, Dams and Control Work, Washington , D.C. Feb. 1938.
United States Department of Interior, Design of Small Dams, Washington, D. C., 1974.
Wahlstrom, Ernest E., Dams, Dam Foundations , and Reservoir Sites, New York, New York, 1974.
Walters, R.C.S., Dam Geology, London, 1971, second edition

370
0 0
" (")
0 0 (") (")
DEFORMATION OF EARTH AND ROCKFILL DAMS
0 0
M
S~!e (It)
0 lQl)
~
0 Ul g
3200
3300
3400
3400
@ Slope indicator
-t USB R crossarm settlt!men t marker
+ Surface monument
- Cutoff wall
Fig. 2. Pla11 of Mammoth Pool Darn showi ng loca tion of instrument;:i tion .
14 Arthur Casagrande, Embankment Dam Engineering (New York, N Y.,1973), p. 370
22 .

3350
3300
3250
3200
- 3150 c .2 ;;; >
.!}!. 3100 UJ
3050
3000
2950
2900
~ c 0 ·~
"' a. E 0 (.)
'
2
3
' ', '1>-....
--<l..._
4 C-5
0 C-4
a--... _c_A c 5 -.:!_o_ 4 -
0---0. ... _04 0
& ---- ----.---.o
Height of embankment (ft) ,
0 ---... 0
0 ...... 0 ..... ........
Fig. 5. Compression of embankment, Mammoth Pool Dam. (After Bechtel, 1960.)
Left abutment
2 + 00
0 5 10 1 ~ ?O
I I I I I M ovenwn1'.t (.nJ
30 in.
3 .. 00 4 + 00 5 + 00
Le\iend
~ Horizontal movemen ts during construct ion
~ Ho riton tal mo vements 2 112 postconstruc t1o n years
III] Vertical move ments dunng construction
~ Vert ical movements 2 1 1: 1 postco ns t ruction years
Fig. 6. Horizontal and vertica l movements, Mammoth Pool Dam.
15 Arthur Casagrande Embankment Dam Engineering (New York, N.Y. 1973), p . 372
23
6 t 00

,_
900 1 ,_ I
"' 1001 z '?
~ 'JO .J ,_ • > i .., .; 300-<
100 J r 0 • CO 9C<l 1200
,., zo":: s,oc':>,')OO rc
1
9 , 50C,OOO vo' 61,1co.ooo vo'
R: -'~A? 4 13.600 vo3
cc~c •E TE 291,000 vo'
SLOS "- t ·'lcu Cct\<ttft)
1600 2000 2600 3200
OISTANC( (FT
lm"'"'ou s (CloJt.Y Sondy G"C'te ) T'ot1s 1t 1ol" (Arrv.".i Ceii tl (;,o-,.e!, f -n., ~r 10Ytion f't'IO"I Zo'4 3)
Per yiou s lA-r-:>r'".l:Cl1 lt Grc .. 1D
.. FIG. 1.- 0ROVILLE DAM MAXIM!}?.! SECTlO'.'<
3600
FIG. 5.-CO~TOURS OF CALCFLATED SETTLD1:2'.\T L'\ OROVILLE DA).1
HOUSE U
. Me oiure: d Po1 n" -F1n1te E1rm1nt So l"t1on ,_ .. 6 4
1 u
z 900 J
IJ.; I ~
900
,_ .. 100 i > .· 800 ...
700' ] ..J
I ... J
700 ,_ z I I .., 600 i 600 2 .. ~
Jl z 30 0 .; .. 300
"' J 2 4 0 0 J "' 300] :1
400
.., ., "' ' I • r-h--r-, r-r---r-r-1 ~ r-+-r-r-i 300 a:; ... 0 06 0 0 .6 0 06 0 06 0 06 0 0 .6 0 06 0 0 4 > .. ..
,.. OR I Z O N TAL OIS PL AC EM E 1'1T I FT) DOWN ST RE AM 1- 1
FlG. 6.- HORIZONTAL D!SfLACBIDiTS AT EL. ,>o o I:\ OROVILLE DAM
24

Oown streo m { -- )
DI S PL.AC (ltil( Ni CO~TOUAS ARE iH FEET
FIG. 7.- COKTOURS OF CALC ULATED HORIZONTAL DISPLACEMENT IN OROVILLE DAI\!
M AX IMUM ., '1 Ai l • ~ 7 rs;
CONTOUll: I A"[ l ftij TSF
FIG. 8.-CONTOL'RS OF CALCULATED i\L.\.."'\I:llUM PR!):CIPAL STRESS D: OROVILLE DAM
PERCENTAGE OF S TRENGTH iri!.091L1Z EO
FIG. 9.-CO~TOVRS OF PERCE:\'T . .\GE OF STRE::\GTH :'.'.iOBILIZED IN ORO\lLL DAM
16Anonymous,"Movement in Oroville Dam", Am. Soc. C.E. Proc. SM 9 (Sept. 1972) p. 654, 657, 658, 659
25.

(/)
3:
-....J
""""'
c...
.......
c --..)
-'<
Es'
0 ....
... :::
i
~~
NO
'-
Jc
Vl
"d .
.
~ ?f
""'"
Pl
I I-'
00
'<
--..)
Vl
U1
,...
V
l
0 I-ti ::;;:
Pl
(') 0 0 ~ (/)
....... ,... 0..
C'O
Sep
tem
ber,
197
2
, O
bser
ved
failu
re S
urf
ace
,/
/
~2
-=~-~-~=
~r -
---0
~~
--
Pep
pe•
-·-
---
·---
----
--
---
-----
--
Cn
t1co
l C
irc:.J
lor
Arc
U
sin
g U
nifo
rm
Jso
lro
p1c
S
lre
ng
lh
Thr
ough
oul
__
__
__
_ /
Dep
lh
of
Pep
per
S
holc
F
'i.3
2
--..__
.=
...;: _
_ ..=--==.=.;:___~-~..=..=:-~
Sca
le •
t"I
Ftt
f
~~
,2~00
FIG
. 5.-
FA
ILl1
lE S
uH
L\
C'I:;
S F
OH
WA
CO
DA
M
__
..-
Cr:
t1co
l C
•rcu
lor
Arc
F
= I
O 7
/
P~~~
-"'=
=o·-===c==
Sco
it .
n f.
~e!
l.:_
:_'Y:
_ ~~YX)
SM 9
FIG
. ti.
-AN
A L
YS
!S t
.:SI~G l
':\!
Fr>
n ~1
A:\
!SO
TH
OP
JC S
TH
niG
Tl!
S T
l!R
OlJ
G!J
OU
T
~
DE
PT
!! O
F P
EP
PE
H S
!!.'\
LE
(/)
0 ~~---···
---~f
,f.06
--'---~
=~::
::·.:..-:::~
---
---
----
--·
--
------
m
PtW
t•
Sha
le
"O
---
·--
---· --
-·-
' --
------
-~-
----
Ii
0 (')
0 .., .c -
Vl
,,.
0 0 ~ £
'
~r
("J
....
;<of
>
: I
40
00
r··---
-... ···-----
-------
·-···------:
:,
I '
' --1
YJ-'
.)0
:--·
--··
-
--~
-
----
-----
-· -_m~
-I
:~ tt~s
~i~~ .. :·-~
:~~ .. ·~
~ F
IG.
7,-
MO
BJU
ZJ-
:D S
HE
AH
ST
HP
:GT
J! A
LO
NG
Sl!
F.A
H S
l!ff
fAC
E
' • ~ J;:: ¥; t' ~:
'
~~:;\
, ~,
_:.
f-·:
;..-1
........
-~;
, ·.
f<:_,
r:.,
~-, - . ·,
s.
r·~·;
'<
· <
. ~ ... l :. ,.
t~.-~
~-:.' " v t·.~
?: r:, L• v ~ ~-~·, ~
. t; [ ) i
''"
SM 9
W
AC
O D
AM
SL
IDE
81
5
ifo
rm
thro
ug
ho
ut
the
dep
th
cf
the
Pep
pe1
· sh
ale,
th
e co
mp
nte
d f
acto
r of
~~et
y fo
r th
e m
ost
cri
t,ica
l cir
cu
lar
a?·c
was
1.
07
Thu
s, c
on
sid
erin
g t
he
:.nis
otro
pic
sh
ear
stre
ng
th o
f th
e P
epp
er s
hal
e, t
he
fact
or o
f sa
lety
was
fo
und
1.2 T
t wl/
I
F
oa)
~L
Peppers;;'?:-
-~:: .. 7
__
-.:'"~--
-·
FIG
. 8
.-IN
FL
UE
NC
E O
F E
XT
EN
SIO
N O
F F
AIL
UR
E S
UR
FA
CE
DO
WN
ST
RE
AM
TO
A
SS
UM
ED
WE
AK
ZO
NE
~~-
'"'"" '
"""'
Pep
per
Sha
le
. 7
•
~'"
'""" ,
,,0
0
==-~-
Pe
pp
er
Sh
ale
........
.....
~
~
Sca
le i
n
Fee
t 0
100
200
3
00
FIG
, ~.-ANALYSIS W
ITH
RE
DU
CE
D S
HE
AR
ST
RE
NG
TH
DO
WN
ST
RE
AM
,.....
-F
,1.9
2 F
,129
• I
~
/ .
'
~-~-~
·-:~/<
, \
Pep
pe;-S
hole-=
---
~~::
::=:
::__
______
_ ;;;
;:.\~"'-==--
----
----
----
----
--
0 10
0
20
0
30
0
---=
Sco
le
in F
ut
FIG
. 1
0,-
AN
AL
YS
ES
OF
RE
CO
l\S
TR
UC
TE
D S
EC
TIO
N O
F W
AC
O D
AM
to b
e co
nsi
dera
bly
lo
wer
, an
d i
n m
uch
bet
ter
agre
em
ent
wit
h th
e o
ccu
ren
ce
of
the
slid
e F
or
pra
cti
cal
pu
rpo
ses,
c
on
sid
erin
g t
he
amo
un
t of
sca
tter
in
the
stre
ngth
dat
a,
a ca
lcu
late
d v
alu
e of
th
e fa
cto
r of
sal
ety
eq
ual
to
1.0
7 is
co
m;i
der
cd
to
be
con
sist
ent
w
ith
the
fact
.th
at f
ailu
re d
id o
ccu
r T
he
cri
tica
l
N
0\