research hub at the university libraries penn state university tour of statistical packages
TRANSCRIPT

RESEARCH HUB AT THE UNIVERSITY LIBRARIES
PENN STATE UNIVERSITY
TOUR OF STATISTICAL PACKAGES

OVERVIEW• Explore six different common statistical software packages
• Overview• Common fields• Pros and cons• General usage• Examples
• Where can we use these on campus?
• Additional resources

PACKAGES• R
• SAS
• Minitab
• JMP
• STATA
• SPSS
• Others not explored: Excel, MATLAB, Stat-Ease, SQL, Nvivo, AMOS, S-plus

WHERE CAN WE USE THESE ON CAMPUS?
• R is free and can be downloaded in both permanent and portable forms online
• All those explored here can be found at all labs on campus
• Find labs at http://clc.its.psu.edu/labs/locations• Nvivo (not explored) is only found in Hammond 317 and Sparks 6
• The following can be found on WebApps:
• Excel• Minitab• SAS• JMP• MATLAB
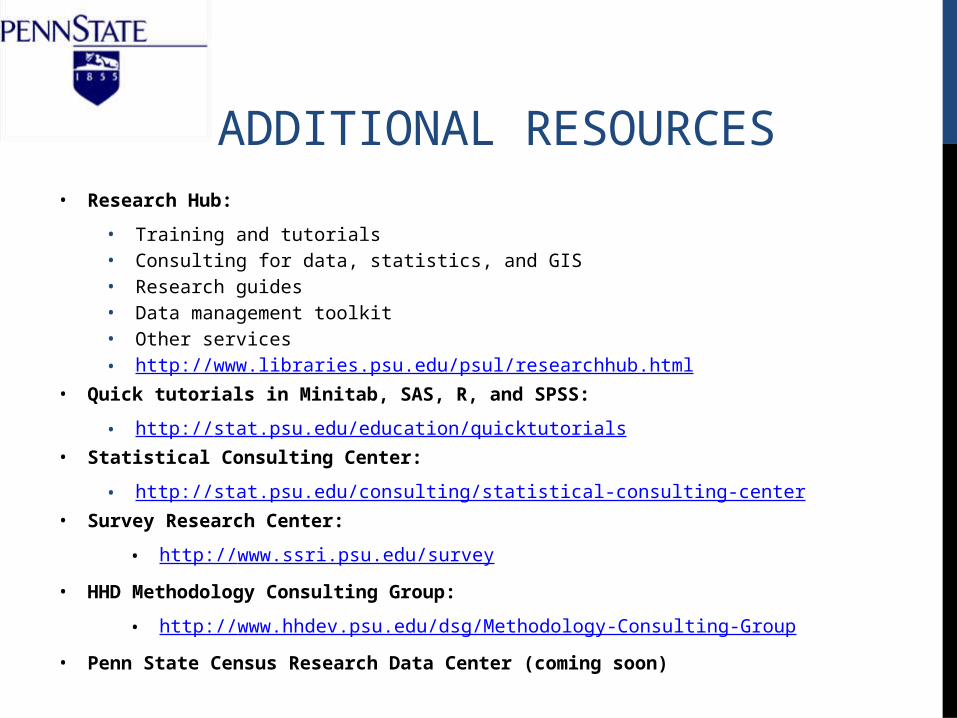
ADDITIONAL RESOURCES• Research Hub:
• Training and tutorials• Consulting for data, statistics, and GIS• Research guides• Data management toolkit• Other services• http://www.libraries.psu.edu/psul/researchhub.html
• Quick tutorials in Minitab, SAS, R, and SPSS:
• http://stat.psu.edu/education/quicktutorials• Statistical Consulting Center:
• http://stat.psu.edu/consulting/statistical-consulting-center• Survey Research Center:
• http://www.ssri.psu.edu/survey
• HHD Methodology Consulting Group:
• http://www.hhdev.psu.edu/dsg/Methodology-Consulting-Group
• Penn State Census Research Data Center (coming soon)

EXPLORING R

R: OVERVIEW• Free, open-source software; similar to S-plus
• Multiple add-ons and extensions available, including integration with LaTeX ( a word processor) via RStudio, and Excel via RExcel
• Extensive online help manuals and forums
• Used by many statisticians and computer scientists for data mining, data analysis, and development of statistical methodology
• Case-sensitive language
• Common fields:
• Statistical science• Computational biology• Computer science• Quantitative finance• Engineering

R: PROS AND CONSPros:
• Widely used in both industry and academia
• Flexible and customizable analyses and graphics
• Great for:
• Data manipulation, editing, and coding• Data mining• Simulations• Survival analysis• Linear and nonlinear modeling• Data warehousing• Multivariate analysis• Nonparametric methods• Hypothesis testing• Categorical analysis• Time series analysis• Sample size calculation/power analysis• Optimization
Cons:
• Scripting programming language
• Mediocre graphics
• Not as useful for:
• Graphical analysis• Data summary• Exploratory analysis• Quality assessment and improvement• Design of experiments

R: USAGE• Data can be read in through code or created
• Variables and functions can be created and renamed
• Multiple data sets can be handled at once
• Editor window is used to write and save commands
• Console window reads commands and displays output, which is best saved by copying and pasting into a word processing document
• Graphs are outputted in separate window, which is overwritten for each new graph unless otherwise indicated in commands
• Workspaces can be saved, meaning data sets and variables do not need to be recreated (especially useful if data creation and manipulation take a long time to run)

R: EXAMPLES• Read in data set from a text file
• Create a variable
• Find online help
• Run a t-test
• Create a histogram

R: EXAMPLES• Read in data set from a text file

R: EXAMPLES• Create a variable

R: EXAMPLES• Find online help

R: EXAMPLES• Run a t-test

R: EXAMPLES• Create a histogram

EXPLORING SAS

SAS: OVERVIEW• Major statistical software in many industries
• Multiple add-ons and extensions available, including integration of SQL programming language and integration with JMP
• Extensive online help manuals and forums
• Used by many statisticians and computer scientists for data mining, data analysis, and development of statistical methodology
• Not case-sensitive language
• Offers various certifications, which many employers value highly
• Common fields:
• Statistical science• Sociology• Manufacturing• Pharmaceutical science• Agriculture• Computer science• Quantitative finance• Engineering

SAS: PROS AND CONSPros:
• Widely used in both industry and academia
• High-performance architecture that supports computationally-intensive algorithms
• Flexible and customizable analyses and graphics
• Great for:
• Data manipulation, editing, and coding• Data mining• Graphical analysis• Data summary• Exploratory analysis• Simulations• Forecasting• Survival analysis• Linear and nonlinear modeling• Quality assessment and improvement• Data warehousing
• Multivariate analysis• Nonparametric methods• Hypothesis testing• Categorical analysis• Time series analysis• Sample size calculation/power analysis• Design of experiments• Optimization
Cons:
• Scripting programming language
• Expensive
• Some versions are not 100% compatible
• Not as useful for:
• Simple analysis and manipulation

SAS: USAGE• Data can be read in through a command or imported through menu-driven prompts
• Variables and functions can be created and renamed
• Multiple data sets can be handled at once and are stored in various workspaces (“libraries”)
• Four types of commands: DATA step (read & edit data); Procedure steps (run built-in functions); macros (create and run own function); ODS statements (set output settings, styles, etc.)
• Editor window is used to write and save commands
• Log window reads commands and displays any errors or comments
• Output window displays some output created by commands
• Results viewer window displays most output, including graphs
• Can save only commands, only data, or whole project
SAS: EXAMPLES• Import data from a text file
• Display data set
• Create new data set and add a variable
• Run a regression with diagnostic plots

SAS: EXAMPLES• Import data from a text file

SAS: EXAMPLES• Import data from a text file

SAS: EXAMPLES• Display data set

SAS: EXAMPLES• Create new data set and add a variable

SAS: EXAMPLES• Run a regression with diagnostic plots

SAS: EXAMPLES• Run a regression with diagnostic plots

EXPLORING MINITAB

MINITAB: OVERVIEW• Menu-driven statistical software, but does have scripting language available for typing
commands or creating macros
• Used in most Six Sigma courses and workshops
• Help documentation located in software as well as online
• Used by many analysts to quantitatively make decisions
• Common fields:
• Social science • Marketing• Education• Sociology• Manufacturing• Agriculture• Pharmaceutical science• Engineering

MINITAB: PROS AND CONSPros:
• Commonly used in industry and some academic settings
• Easy-to-use menu-driven software
• Clear output and graphics with some interactive features
• Has an “Assistant” feature that includes flow-charts and takes users step-by-step to analyze data properly
• Used in most undergraduate statistics courses; there are example data sets included in software
• Great for:
• Data manipulation, editing, and coding• Graphical analysis• Exploratory data analysis• Data summary• Forecasting• Survival analysis• Linear and nonlinear modeling (standard)• Quality assessment and improvement
• Hypothesis testing• Categorical analysis• Time series analysis• Design of experiments• Optimization
Cons:
Limited options for analyses
• Can only analyze one data set at a time
• Does not work as well with large data sets
• Not as much help available as some other packages
• Not as useful for:
• Simulations• Data mining• Data warehousing• Multivariate analysis• Nonparametric methods• Sample size calculation/power analysis• Advanced or complex modeling

MINITAB: USAGE• Data can be typed in, copied and pasted from a text or Excel file, or imported
through menu-driven prompts
• New variables can be added to worksheet or created using formulas
• Worksheets contain raw data and only one worksheet can be active at a time
• Can create and save macros and/or commands
• Session window displays output
• Graphs and other visual charts are shown in individual windows
• Project manager contains outline that helps you to jump to particular output
• Worksheet can be saved separately, but saving whole project will save both worksheet and output

MINITAB: EXAMPLES• Copy data into Minitab from a text file
• Create a new variable using formula
• Use Assistant to do a graphical analysis
• Create a factorial design for an experiment

MINITAB: EXAMPLES• Copy data into Minitab from a text file

MINITAB: EXAMPLES• Create a new variable using formula

MINITAB: EXAMPLES• Use Assistant to do a graphical analysis

MINITAB: EXAMPLES• Use Assistant to do a graphical analysis

MINITAB: EXAMPLES• Use Assistant to do a graphical analysis

MINITAB: EXAMPLES• Create a factorial design for an experiment
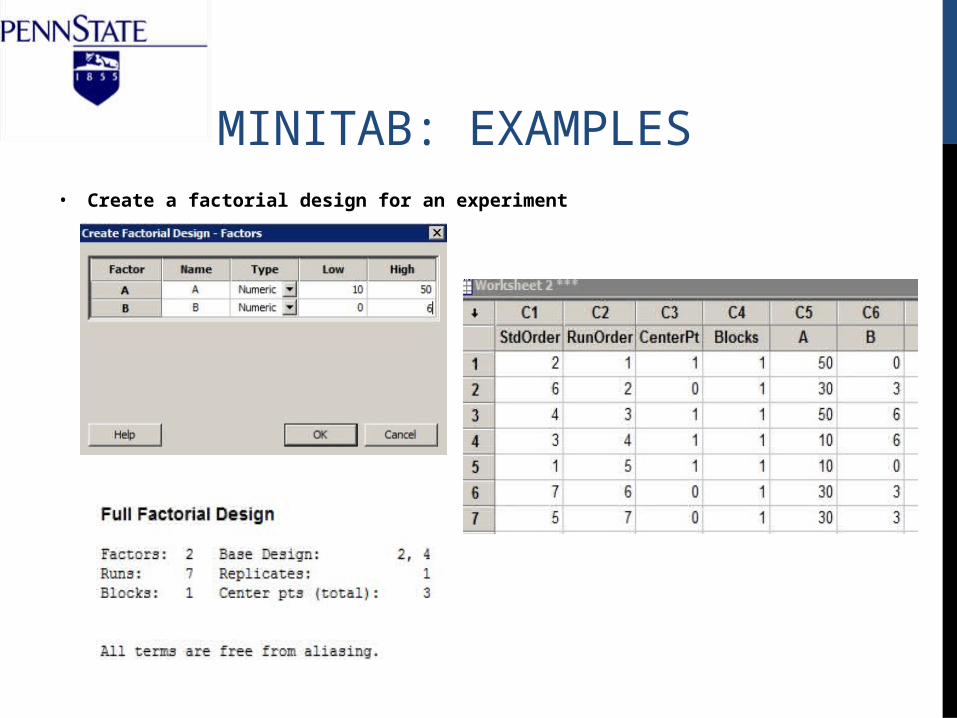
MINITAB: EXAMPLES• Create a factorial design for an experiment

EXPLORING JMP

JMP: OVERVIEW• Menu-driven statistical software, but does have scripting language available for typing
commands or creating macros
• Can integrate with SAS, including running SAS commands, importing or exporting SAS data sets, and opening SAS projects
• Help documentation located in software as well as online
• Common fields:
• Statistical science• Manufacturing• Pharmaceutical science• Engineering

JMP: PROS AND CONSPros:
• Easy-to-use menu-driven software
• Many menu option windows are interactive and intuitive
• Powerful software with more options than other menu-driven software
• Output and graphs are very customizable and interactive, with options even after running the analysis
• Great for:
• Data manipulation, editing, and coding• Graphical analysis• Exploratory data analysis• Data summary• Forecasting• Survival analysis• Linear and nonlinear modeling (standard)• Quality assessment and improvement• Multivariate analysis• Categorical analysis
• Nonparametric methods• Time series analysis• Sample size calculation/power analysis• Design of experiments• Optimization
Cons:
• Not as widely used as some other packages but still very powerful
• Can only analyze one data set at a time
• Does not work as well with large data sets
• Not as much help available as some other packages
• Not as useful for:
• Simulations• Data mining• Data warehousing• Hypothesis testing• Advanced or complex modeling

JMP: USAGE• Data can be typed in, copied and pasted from a text or Excel file, imported from
SAS, or converted from other files (such as a .txt, etc.)
• New variables can be added to worksheet or created using formulas
• Data tables contain raw data and only one data table can be active at a time
• Can create and save macros and/or commands
• Log window allows you to input commands and view output
• Script window contains the commands used to run the same analysis done through the menu-driven prompts
• Each data table will create its own output window for graphs and other output
• Data tables and projects are saved separately
• Graphics and other output can be saved into a Journal, which is saved separately and can be opened in Word, etc., making it convenient to store results

JMP: EXAMPLES• Convert text file into a JMP data table
• Summarize group means
• Change table values from mean values to standard deviation values
• Fit a binary logistic regression model

JMP: EXAMPLES• Convert text file into a JMP data table

JMP: EXAMPLES• Summarize group means

JMP: EXAMPLES• Summarize group means

JMP: EXAMPLES• Change table values from mean values to standard deviation values

JMP: EXAMPLES• Fit a binary logistic regression model

EXPLORING STATA

STATA: OVERVIEW• Utilizes both menu-driven selections and scripting commands
• Multiple versions available depending on needs (commercial, educational, etc.)
• Extensive help documentation and technical support
• Contains both basic and advanced statistical methods
• Not case-sensitive language
• Common fields:
• Economics• Sociology• Political science• Pharmaceutical• Epidemiology

STATA: PROS AND CONSPros:
• Somewhat common in both industry and academia
• Somewhat flexible and customizable
• Contains up-to-date advanced methods
• Quality graphics
• Great for:
• Data manipulation, editing, and coding• Graphical analysis• Data summary• Exploratory analysis• Data mining• Simulations• Survival analysis• Linear and nonlinear modeling• Data warehousing• Multivariate analysis• Nonparametric methods
• Hypothesis testing• Categorical analysis• Time series analysis• Sample size calculation/power analysis
Cons:
• Scripting programming language
• Can only analyze one data set at a time
• Does not work as well with large data sets
• Not as useful for:
• Quality assessment and improvement• Design of experiments• Optimization

STATA: USAGE• Data can be typed in, read in through code, copied and pasted from a text or Excel
file, or imported and converted from other files (such as a .txt, etc.)
• Command window is used to write and run commands
• Review window displays previous analysis, which can be selected to run again
• Project window displays all input and output, including graphs
• Store and edit data in the Data Editor, which can be saved on its own
• Log will copy and automatically save the project for you (must start and close log before and after the analyses you want to save)

STATA: EXAMPLES• Copy data from a text file into STATA
• Recode variable
• Create a frequency table using commands
• Run a Wilcoxon Rank-Sum test using menu options
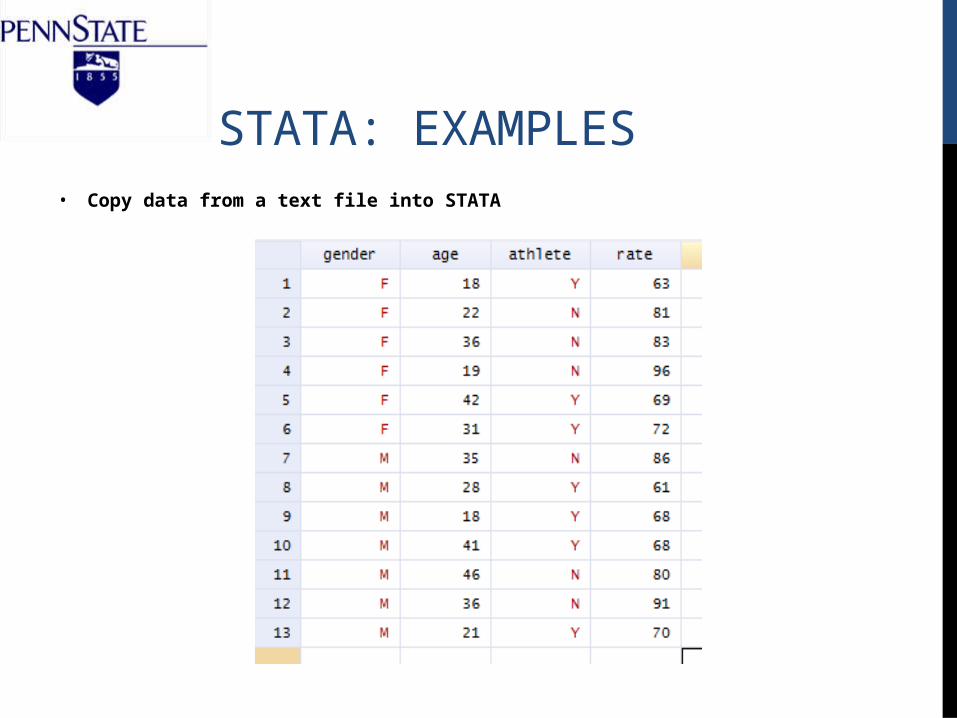
STATA: EXAMPLES• Copy data from a text file into STATA

STATA: EXAMPLES• Recode variable

STATA: EXAMPLES• Create a frequency table using commands

STATA: EXAMPLES• Run a Wilcoxon Rank-Sum test using menu options

STATA: EXAMPLES• Run a Wilcoxon Rank-Sum test using menu options

EXPLORING SPSS

SPSS: OVERVIEW• Menu-driven statistical software, but does have scripting language available for typing
commands or creating macros
• Used in conjunction with many common survey platforms, and is the leading software for analyzing survey data
• Help documentation located in software as well as online
• Plug-ins available for other programming languages, such as JAVA, Python, R, and VB
• Used by many analysts to quantitatively make decisions
• Common fields:
• Social science • Marketing• Education• Sociology• Healthcare• Government
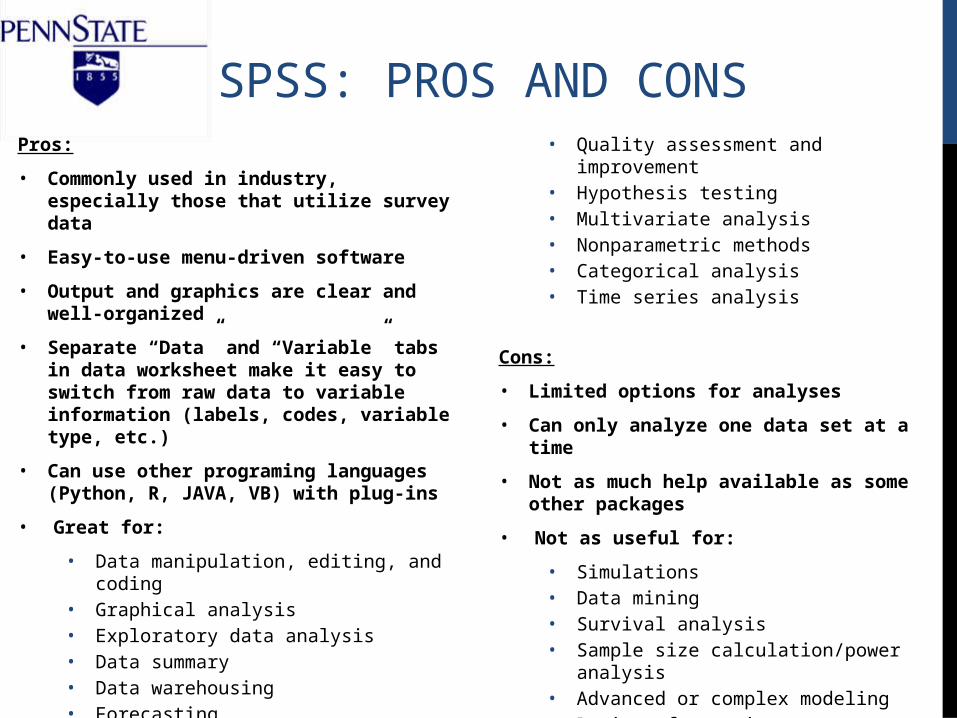
SPSS: PROS AND CONSPros:
• Commonly used in industry, especially those that utilize survey data
• Easy-to-use menu-driven software
• Output and graphics are clear and well-organized
• Separate “Data” and “Variable” tabs in data worksheet make it easy to switch from raw data to variable information (labels, codes, variable type, etc.)
• Can use other programing languages (Python, R, JAVA, VB) with plug-ins
• Great for:
• Data manipulation, editing, and coding• Graphical analysis• Exploratory data analysis• Data summary• Data warehousing• Forecasting• Linear and nonlinear modeling (standard)• Quality assessment and improvement
• Hypothesis testing• Multivariate analysis• Nonparametric methods• Categorical analysis• Time series analysis
Cons:
• Limited options for analyses
• Can only analyze one data set at a time
• Not as much help available as some other packages
• Not as useful for:
• Simulations• Data mining• Survival analysis• Sample size calculation/power analysis• Advanced or complex modeling• Design of experiments• Optimization

SPSS: USAGE• Data can be typed in, copied and pasted from a text or Excel file, imported through
menu-driven prompts, or read in from a ASCII file using Syntax editor
• New variables can be added to worksheet or created using formulas
• Datasets contain raw data and only one dataset can be active at a time
• Can create and save macros and/or commands
• Output window displays output, including graphs
• Output can be copied and pasted into other documents
• Project manager contains outline that helps you to jump to particular output
• Dataset and Outputs are saved separately
• Optional syntax window can read and run commands and can also be saved separately

SPSS: EXAMPLES• Cody data from text file into SPSS spreadsheet
• Edit variable names and information
• Create a contingency table
• Fit a linear model

SPSS: EXAMPLES• Cody data from text file into SPSS spreadsheet

SPSS: EXAMPLES• Edit variable names and information

SPSS: EXAMPLES• Edit variable names and information

SPSS: EXAMPLES• Create a contingency table
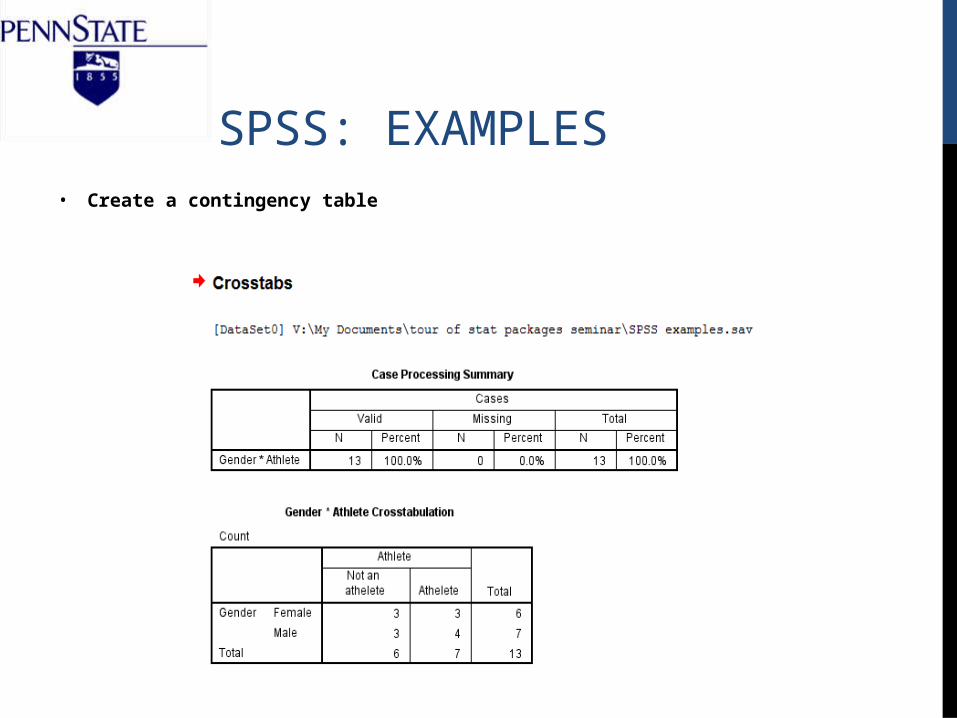
SPSS: EXAMPLES• Create a contingency table

SPSS: EXAMPLES• Fit a linear model

SPSS: EXAMPLES• Fit a linear model