research highlights climate change and future crop
TRANSCRIPT

Climate Change and Future Crop Suitability in RWANDA
RESEARCH HIGHLIGHTS

Research Highlights – Climate Change and Future Crop Suitability in Rwanda
Funded by ‘Adaptation for Smallholder Agriculture Programme’ (ASAP) Phase 2. International Fund for Agricultural Development (IFAD)
Produced by the University of Cape Town
Undertaken in support of the International Fund for Agricultural Development (IFAD) by:African Climate & Development Initiative (www.acdi.uct.ac.za)Climate System Analysis Group (www.csag.uct.ac.za)Environmental Policy Research Unit (www.epru.uct.ac.za)
Recommended citation: Hunter. R., Crespo. O., Coldrey, K, Cronin, K, New, M. 2020. Research
Highlights – Climate Change and Future Crop Suitability in Rwanda. University of Cape Town,
South Africa, undertaken in support of Adaptation for Smallholder Agriculture Programme’
(ASAP) Phase 2. International Fund for Agricultural Development (IFAD), Rome.
The content and presentation of material in this report is the sole responsibility of the Authors
and does not imply the expression of any opinion whatsoever on the part of the International
Fund for Agricultural Development of the United Nations. The project team thanks the various
stakeholders and contributors who have shared their knowledge and time during this study.

CONTENTSBackground and context . . . . . . . . . . . . . . . . . . . . . . . . . . . . . . . . . . . . . . . . . . . . . . . . . . . . . . . . . . . . . . . . . . . . . . . . . 1
Summary results . . . . . . . . . . . . . . . . . . . . . . . . . . . . . . . . . . . . . . . . . . . . . . . . . . . . . . . . . . . . . . . . . . . . . . . . . . . . . . . . 2
Method and Approach . . . . . . . . . . . . . . . . . . . . . . . . . . . . . . . . . . . . . . . . . . . . . . . . . . . . . . . . . . . . . . . . . . . . .3
Impacts. . . . . . . . . . . . . . . . . . . . . . . . . . . . . . . . . . . . . . . . . . . . . . . . . . . . . . . . . . . . . . . . . . . . . . . . . . . . . . . . . . . . . . . . 3
Figure 1. Demonstration example of the distribution of crop suitability index. generated using EcoCrop . . . . . . . . 4
Adaptive Capacity . . . . . . . . . . . . . . . . . . . . . . . . . . . . . . . . . . . . . . . . . . . . . . . . . . . . . . . . . . . . . . . . . . . . . . . . . . . . . . . 5
Table 1. Ranked Adaptive Capacity (AC) indicator scores for all provinces of Rwanda . . . . . . . . . . . . . . . . . . . . . . . . 5
Climate projections . . . . . . . . . . . . . . . . . . . . . . . . . . . . . . . . . . . . . . . . . . . . . . . . . . . . . . . . . . . . . . . . . . . . . . . .6
Projected changes to Temperature in Rwanda by 2050 . . . . . . . . . . . . . . . . . . . . . . . . . . . . . . . . . . . . . . . . . . . . . . . . . 6
Table 2. Projected influence of climate change on mean monthly temperature (°C) in Rwanda at Historical and Mid-Century periods, and monthly anomalies between the two time periods . . . . . . . . . . . . . . . . . . . . . . . . . . . . . . 6
Climate – projected changes to rainfall in Rwanda by 2050 . . . . . . . . . . . . . . . . . . . . . . . . . . . . . . . . . . . . . . . . . . . . . 7
Table 3. Projected influence of climate change on mean monthly precipitation (mm/month) in Rwanda at Historical and Mid-Century periods, and monthly anomalies between the two time periods . . . . . . . . . . . . . . . . . . 7
Climate change and its effect on crops: BEANS . . . . . . . . . . . . . . . . . . . . . . . . . . . . . . . . . . . . . . . . . . . . . . . . . . . . . . . 8
Climate change and its effect on crops: CASSAVA . . . . . . . . . . . . . . . . . . . . . . . . . . . . . . . . . . . . . . . . . . . . . . . . . . . . 10
Climate change and its effect on crops: GROUNDNUTS . . . . . . . . . . . . . . . . . . . . . . . . . . . . . . . . . . . . . . . . . . . . . . . . 12
Climate change and its effect on crops: MAIZE . . . . . . . . . . . . . . . . . . . . . . . . . . . . . . . . . . . . . . . . . . . . . . . . . . . . . . 14
Climate change and its effect on crops: SWEET POTATO . . . . . . . . . . . . . . . . . . . . . . . . . . . . . . . . . . . . . . . . . . . . . . . 16
Summary of findings, recommendations, adaptation strategies and climate-resilient alternative for smallholder farmers . . . . . . . . . . . . . . . . . . . . . . . . . . . . . . . . . . . . . . . . . . . . . . . . . . . . . . . . . . . . . . . . . . . . . . . . . 18
Appendix tables . . . . . . . . . . . . . . . . . . . . . . . . . . . . . . . . . . . . . . . . . . . . . . . . . . . . . . . . . . . . . . . . . . . . . . . . . . . . . . . 18

RESEARCH HIGHLIGHTS
CLIMATE CHANGE AND FUTURE CROP SUITABILITY IN RWANDA

1CLIMATE CHANGE AND FUTURE CROP SUITABILITY IN RWANDA
1 https://www.ifad.org/en/web/operations/country/id/Rwanda2 https://ccafs.cgiar.org/publications/climate-risk-assessment-selected-value-chain-commodities-rwanda#.Xfog3mQzbIU
BACKGROUND AND CONTEXTThe Adaptation for Smallholder
Agriculture Programme (ASAP) is
a flagship programme within the
International Fund for Agricultural
Development’s (IFAD’s) portfolio
of activities aimed at channelling
climate and environmental finance
to smallholder farmers, and which
allows IFAD country programmes
to design projects which integrate
considerations of the impacts of
climate change on smallholder
farmers. To support the integration
of climate information and improved
knowledge of climate related risks
to the smallholder agriculture
sector, IFAD commissioned a
Climate Risk Analysis to assess the
potential impacts of climate change
on several crops and commodities
in Rwanda.
The full Climate Risk Analysis report
(accessible via the IFAD Country
page 1) provides an analysis of
inter alia i) the current and future
climate characteristics of Rwanda;
ii) the potential change in the
suitability of various crops under
projected climate changes; and
iii) potential risks and economic
impacts related to climate change,
as well as potential adaptation
options and opportunities to
increase climate resilience. The
following report provides a brief
summary of highlighted results for
Rwanda, including: i) projected
changes to temperature and
precipitation as a result of climate
change; and ii) impacts of climate
change on the future suitability of
several major crops and resulting
impacts on production across each
of the country’s five provinces.
AGRICULTURE IN RWANDA Rwanda is characterised by a highly
productive agriculture sector, which
benefits from a bimodal rainfall
system. The first rainy season, or
Season A, extends from September
to December, and the second
season, or Season B, starts in March
and ends in May (CIAT, 2019)2.
Rainfed agriculture, practiced by
smallholder farmers, accounts for
the vast majority of the planted
area. Important subsistence crops
include roots and tubers (cassava
and sweet potato), cereals (maize),
legumes such as beans and
groundnuts, and banana. Important
cash crops include coffee and tea.

2 RESEARCH HIGHLIGHTS
The likely effects of climate change are not consistent across the full extent of Rwanda’s five provinces or the crops assessed. However, several general observations can be made. For example, all provinces in the study area are predicted to experience increasing temperatures throughout the year, indicated by increased average monthly ‘Mean Temperature’ as well as average monthly ‘Minimum Temperature’. Furthermore, all provinces are predicted to experience an overall decrease in annual and seasonal precipitation between the present day and the ‘Mid-Century’ future (defined by the period 2040–2069). In addition to the predicted trend of reduced rainfall during the two traditional growing seasons (Season A commencing in September and Season B in March), it is also projected that there will be an increase in monthly rainfall during the months of December and January. These results may be indicative of a delay in the onset of the traditional rainy seasons, or alternatively may indicate that rainy seasons (particularly season A, September-December) may effectively be extended for one to two months. However, despite the latter positive changes, overall the predicted trend is one of decreased annual rainfall on average, with average annual rainfall predicted to decrease from 1,139 mm to 1,066 mm (i.e. a decrease of 73 mm or 6%).
The full study includes analyses of the predicted effect of climate change on various crops, including
inter alia cereals (maize and sorghum), legumes (common bean and groundnuts), and root crops (cassava and sweet potato). The combined effects of reduced precipitation during the traditional growing seasons and increased
temperatures are likely to result in a complex matrix of positive and negative effects on the crops assessed. The annual production of certain crops such as beans, maize and groundnuts is expected to be negatively impacted by increased temperatures and reduced or delayed rainfall, thereby causing a reduction in the extent of suitable production areas as well as reducing the productivity of remaining areas. Conversely, certain crops such as sorghum, cassava and sweet potato are comparatively less affected by the predicted climate changes and may be appropriate alternatives to be promoted in areas where the production of other crops is expected to become marginal.
Production of beans, one of the
most important subsistence crops,
is predicted to undergo a decrease
in annual production ranging from
0.8% in the Western province, up
to 8% in the Eastern province. In
total, it is estimated that the annual
production of beans across all
provinces will be reduced by 30 000
tonnes, resulting in total annual
costs of climate-related impacts
of USD 15.9 million. Production
of maize is predicted to decrease
by 1.2% in Kigali province up to
4.6% in the Western province. At
the household level, the projected
decrease in production ranges from
0 kg to 7 kg in the Kigali and Eastern
provinces, respectively, equivalent
to a total decrease in national
maize production of 10 692 tonnes
and an annual replacement cost of
USD 3.8 million.
In the case of groundnuts,
Northern and Western provinces
are expected to experience positive
effects while the Eastern, Kigali and
Southern provinces are predicted
to experience negative impacts. In
other cases such as sorghum, results
indicate that climate change will result in positive impacts across the country, and sweet potatoes are likely to only experience very minor negative changes (with the Southern province being the only negatively impacted province).
There are also several province-specific effects on climate variables and resultant crop suitability that will necessitate the development of tailored local-level adaptation plans and strategies for agricultural development. The climate-related risks to agricultural households in each province are a function of both the impact of climate change on crop production, as well as the adaptive capacities of each community to manage and respond to climate risks. It is important to note that the following analyses are based on consideration of a narrow range of modelled variables and the resultant effects on crop suitability. Consequently, this study cannot account for local-level factors such as differences in performance, climatic suitability and yield potential between local land races or improved cultivars. In addition, the study cannot consider or predict the effect of different cultivation methods and technologies that may be practiced within the study area. Finally, in terms of predicting the likely effects of climate change and resultant risks to crop production, this study cannot account for indirect effects of climate change on crop production, such as increased vulnerability to pests and disease, soil degradation or flooding/waterlogging. However, the study does find that climate change is likely to result in multiple negative effects on smallholder farmers in the study area, through disruption of familiar seasonal trends, increased water and heat stress and a reduced growing season.
SUMMARY RESULTS

3CLIMATE CHANGE AND FUTURE CROP SUITABILITY IN RWANDA
The analyses presented in this
study are intended to provide
an illustrative comparison of
the potential effects of future
climate change on production of
economically important crops, as
well as the differential impacts
of climate change on agricultural
households in each of Rwanda’s
five provinces. For each of the
crops considered in this study
(including maize, sorghum, beans,
groundnuts, cassava and sweet
potato) the relative Climate Change
Vulnerability (V) of crop production
is considered at the province level
and aims to identify those provinces
which are likely to be most or
least vulnerable to climate change
impacts on the given crop.
The relative vulnerabilities of
each province can be expressed
as a Vulnerability Index (VI) score,
derived by comparison of the
relative scale of:
- Impacts (I) of climate change
on crop production (estimated
through analysis of climate
models and resulting changes to
crop suitability); and
- the Adaptive Capacity (AC)
of agricultural households
to respond and adapt to the
impacts of climate change
(derived through statistical
indicators of socio-economic,
developmental and agronomic
context) in each of Rwanda’s
five provinces.
Vulnerability is considered to be
proportional to the relative size
METHOD AND APPROACHof I, and inversely proportional to
AC . The product of the scores for
AC and I are used to calculate a
standardised score for V, thereby
allowing comparisons between
each province and allowing the
identification of those provinces
and households which are likely
to be most vulnerable to climate
change impacts on each crop.
IMPACTSThe Impacts (I) of climate change
on crops were estimated by
projecting the likely future
changes to Rwanda’s climate,
and then analysing the effects of
those projected climate changes
on economically important
crops. Firstly, the potential future
changes to Rwanda’s climate were
computed through analysis of 29
General Circulation Models (GCMs)
downloaded from the AgMERRA
dataset 3, based on the methods
described by Ramirez-Villegas
et al (2013) 4. Future climate
changes were computed assuming
the scenario of ‘RCP 8.5’ (where
‘RCP 8.5’ refers to one of four
hypothetical scenarios for future
global greenhouse gas emissions
proposed by the Intergovernmental
Panel on Climate Change). This
analysis was used to generate
predictions of the effect of climate
change across Rwanda, comparing
the historical baseline (the average
climate for the period 1980–2010)
to the Mid-Century future (2050,
the average climate for the period
2040–2069). In particular, the
analysis compares the climatic
variables of Mean Monthly
Precipitation (i.e. the average
precipitation for each month),
Monthly Mean Temperature and
Monthly Minimum Temperature.
Analyses of current and future
crop suitability were generated
using the Food and Agriculture
Organisation’s EcoCrop Suitability
model5 combined with the most
recent statistics available for
annual crop production and
demographics. The EcoCrop model
estimates the suitability of a given
crop to the defined environmental
conditions based on the known
preferences of each crop such as: i)
minimum, optimum and maximum
temperature; ii) minimum, optimum
and maximum monthly rainfall;
and iii) minimum and maximum
growing period. Therefore, EcoCrop
defines the area of suitability for a
given crop based on whether there
are adequate climatic conditions
(temperature and precipitation)
within the growing season and
calculates the climatic suitability of
the resulting interaction between
rainfall and temperature. Readers
are referred to the full project
report and the work of Ramirez-
Villegas et al (2013) for detailed
description of methodology.
A suitability index score, ranging
from 0 – 1, indicates the relative
suitability of a given area for each
of the crops assessed (where a
suitability score of 0 is considered
to be totally unsuitable, a score of
1 is considered excellent, with a
continuous spectrum of marginal,
moderate and good suitability
3 https://data.giss.nasa.gov/impacts/agmipcf/agmerra/4 Ramirez-Villegas J, Jarvis A, Laderach P 2013 Empirical approaches for assessing impacts of climate change on agriculture: The EcoCrop model
and a case study with grain sorghum. Agricultural and Forest Meteorology 170(15):67-785 https://ecocrop.fao.org/ecocrop/srv/en/home

4 RESEARCH HIGHLIGHTS
types in between). In this study,
analyses of the distribution of
suitable areas for a given crop
allows for the estimation of the
total suitable production area, as
well as the average suitability index
score, within each of Rwanda’s
five provinces. The EcoCrop
approach also allows for map-based
visualisations of crop suitability
zones across the country. The use
of colour-coded maps to depict the
distribution of various categories
of crop suitability index scores
can be used to demonstrate the
distribution of crop-suitable areas,
as demonstrated in Figure 1.
The comparison of maps of
‘Historical’ and ‘Future’ distribution
of crop suitability can be used to
estimate the potential changes to
the size and relative productivity
of crop-suitable areas. In addition,
this approach allows for the
identification of specific areas
which are likely to undergo positive
or negative changes (anomalies) as
a result of climate change, and may
be used to inform decision-making
such as identification of climate-
vulnerable areas and value chains
to be prioritised for additional
support. The potential impacts of
climate change on each crop were
estimated based on:
• the changes to total suitable area
(km2) and average suitability
index score between the
historical baseline and ‘mid-
century’ future6;
• and estimated historical crop
production in each province,
derived from national agricultural
production statistics 7.
The potential impacts of climate
change on each crop can be
quantified in several ways, for
example, in terms of changes
to “production per capita”,
“production per household”
and “production per Province”.
It should be emphasised that no
further calibration or validation of
EcoCrop analyses was carried out
in support of this study and that
results should be considered as
indicative guidelines only, to inform
additional local-level decision-
making and further research.
6 Total suitable area was calculated as the sum of all areas with a suitability index score higher than 0, and average suitability
index score is calculated as the average score of all areas with a suitability index score higher than 07 Derived from the 2018 figures reported by the National Institute of Statistics Rwanda (NISR, 2018) Seasonal Agricultural Survey,
http://www.statistics.gov.rw/datasource/seasonal-agricultural-survey-2018
FIGURE 1 . DEMONSTRATION EXAMPLE OF THE DISTRIBUTION OF CROP SUITABILITY INDEX .
GENERATED USING ECOCROP
Excellent
Suitable
Very Marginal
Very suitable
Marginal
Not suited

5CLIMATE CHANGE AND FUTURE CROP SUITABILITY IN RWANDA
8 Statistics were derived from 2017 and 2018 census studies produced by Rwanda’s National Institute of Statistics: Agricultural Household Survey,
http://statistics.gov.rw/publication/agricultural-household-survey-2017; and Labour Force Survey Report, http://statistics.gov.rw/publication/
labour-force-survey-report-december-2018
ADAPTIVE CAPACITYIndicators for Adaptive Capacity
(AC) – the relative ability of
agricultural households to respond
and adapt to predicted climate
change impacts – were derived
from the most recent statistics
available at the sub-national level.
Provincial statistics and indicators
were primarily derived from
studies undertaken by the Central
Statistical Organisation (CSO),
technical studies undertaken by the
Indaba Agricultural Policy Research
Institute (IAPRI), and open-source
statistics published on the Rwanda
Data Portal 8. In the case of Rwanda,
the indicators used to estimate AC
in each Province included
• Education: (%literacy rate)
• Access to agricultural
information (% households
owning a radio, % households
that have received extension
services)
• Access to alternative sources of
income: (% employment rate)
• Adoption of improved
agricultural practices: (organic
fertiliser use, pesticide use; use
of improved seeds).
The national statistics collected to
assess AC – which are summarised
in the Appendix (Table A.1) –
were used to calculate an average
AC score for each Province. The
indicator category ‘Adoption of
improved agricultural practices’
was assigned a weighting of 50%
towards the final AC score, and the
remaining 50% was contributed
equally by the remaining indicator
categories. These are presented in
Table 1.
TABLE 1 . RANKED ADAPTIVE CAPACITY (AC) INDICATOR SCORES FOR ALL PROVINCES
OF RWANDA
Adaptive capacity Indicator category
Adoption of
improved
agricultural practices
Access to
agricultural
information
Education
Alternative
sources of
income
Adaptive
capacity
score
Adaptive
capacity
rankContribution
to index 50% 17% 17% 17%
Eastern 16 50 69.4 85.4 42.1 5
Kigali 18.2 50.4 86.6 82.4 45.7 4
Northern 28 53.4 71.4 90.3 49.8 1
Southern 25.2 49.3 68.8 85.9 46.6 3
Western 26.5 50.6 68 85.9 47.3 2
While the AC scores generated are
fairly closely clustered and differences
are relatively small, rankings indicate
that smallholder farmers in the
Northern and Western provinces
have the highest overall capacities to
respond to climate change impacts
(ranking 1st and 2nd, respectively).
Kigali and the Eastern province
have the lowest overall AC scores
(ranking 4th and 5th, respectively)
and therefore are anticipated to be
least able to respond or adapt to
climate change-related impacts. This
is expected of the Eastern province
as it is largely rural, characterised by
subsistence or small-scale agriculture,
whereas the results are surprising
for Kigali province, which is more
developed and with better access to
education and technology (where
they score highly). Reasons for the
low score in Kigali province need
further investigation.

6 RESEARCH HIGHLIGHTS
The predicted changes in Mean
Monthly Temperature (TMean)
during the period from ‘Historical’
to ‘Future 2050’ timepoints indicate
that climate change will result
in consistent increases in Mean
Temperature across spatial and
temporal dimensions in Rwanda. A
common prediction across each of
the country’s five provinces is that
TMean will increase in all provinces
during the period from ‘Historical’
to ‘Mid-Century’ timepoints by at
least 1.7°C. The hottest months
of August and September are
predicted to increase by 2.1°C,
relative to a Historical average of
21°C. Similar increases of 1.7–2.2°C
are predicted for all other months
of the year.
The overall effect of these increases
in TMean and TMin is likely to
result in complex impacts on the
agricultural sector, particularly
when considered in combination
with the predicted decreases in
precipitation. The large increases
in temperature (1.7–2.1°C) in the
months of October–December will
increase crop water demand and
evapotranspiration losses of water
from agricultural soils, coinciding
with the reduced rainfall predicted
for the same months. This effect is
likely to increase the risks of crop
failure as a result of inadequate
or erratic rainfall during the
establishment of rainfed crops,
particularly for climate sensitive
or marginal crops such as maize
and horticultural/vegetable crops
such as tomatoes and peppers.
Furthermore, the increased average
temperatures are likely to include
increased frequency or severity
of heat waves and unusually hot
days, further contributing to
evapotranspirative losses of water
and crop stress.
9 Historical temperature based on the average of the period 1980-2010, and projected Mid-Century temperature for the period 2040-2069.
Anomalies are defined as the total change between Historical and Mid-Century projections
CLIMATE PROJECTIONSPROJECTED CHANGES TO TEMPERATURE IN RWANDA BY 2050
TABLE 2 . PROJECTED INFLUENCE OF CLIMATE CHANGE ON MEAN MONTHLY TEMPERATURE
(°C) IN RWANDA AT HISTORICAL AND MID-CENTURY PERIODS, AND MONTHLY ANOMALIES
BETWEEN THE TWO TIME PERIODS 9
Tmean (°C)MONTH
J F M A M J J A S O N D
Historical 20.1 20.4 20.3 19.9 19.9 19.8 20.0 20.9 21.0 20.5 19.9 20.0
Future 21.9 22.3 22.1 21.7 21.8 21.9 22.2 23.1 23.1 22.5 21.6 21.8
Anomaly 1 .8 1 .9 1 .8 1 .8 1 .9 2 .1 2 .2 2 .1 2 .1 2 .0 1 .7 1 .8

7CLIMATE CHANGE AND FUTURE CROP SUITABILITY IN RWANDA
The predicted changes in mean
monthly precipitation from the
historical baseline to the mid-
century (2050) future indicate
that climate change will result in
complex changes in rainfall across
provinces and months (see Table
3). Province-level summaries of
predicted monthly changes in
precipitation can be found in the
supplementary Appendix.
A common prediction across each
of the country’s five provinces is
that total annual precipitation will
be reduced in all provinces during
the period from baseline to Mid-
Century timepoints. The total
rainfall received during the months
of September to December at the
onset of the first, long rainy season
is predicted to be reduced from
465 to 443 mm (total reduction
of rainfall of 22 mm). Similarly,
total rainfall at the onset of the
shorter second rainy season in the
months of March, April and May
is predicted to be reduced from
400 to 360mm (total reduction of
rainfall of 40mm).
An additional effect of climate
change predicted by these analyses
is the increase in monthly rainfall
during the months of December
and January. These results may be
indicative of a delay in the onset
of the traditional rainy seasons,
or alternatively may indicate that
rainy seasons (particularly season
A, September-December) may
effectively be extended for one to
two months. It should be noted
that these effects are likely to vary
on an interannual basis as well
as spatially within each season,
and the consequent impacts on
agricultural activities cannot be
predicted with certainty. In some
cases, the average reduction in
monthly rainfall, notably during
the months of September-October
may result in inadequate rainfall
to support effective establishment
of crops during the period which
is traditionally associated with
the start of each growing season.
Alternatively, the positive anomalies
(i.e. predicted increases) in monthly
rainfall in the months of December
– January may indicate an extension
in the duration of the rainy season
A, thereby providing farmers with
the option to extend or stagger the
timing of crop establishment.
These analyses indicate that climate
change may delay the onset of
rainfall relative to the traditional
agricultural calendar, in turn
resulting in changes to the timing
of various agricultural activities such
as field preparation and sowing of
seed. Both of the rainfed agricultural
growing seasons are characterised
by monthly rainfall deficits which
may result in fundamental changes
to local crop choices and agricultural
practices by the year 2050. Drought-
sensitive crops such as maize are
likely to be increasingly unreliable or
poor in yield, which will be further
exacerbated by predicted increases
in temperature.
CLIMATE – PROJECTED CHANGES TO RAINFALL IN RWANDA BY 2050
MM/MONTHMONTH
TOTALJ F M A M J J A S O N D
Historical 100.3 100.9 135.0 154.5 110.3 23.0 14.6 36.0 85.6 124.0 148.2 107.0 1139.4
Future 101.9 99.7 128.9 143.9 87.1 17.7 13.0 31.0 75.7 110.1 146.9 110.4 1066.3
Anomaly +1 .7 -1 .1 -6 .1 -10 .5 -23 .2 -5 .3 -1 .7 -5 .0 -9 .9 -14 .0 -1 .3 +3 .4 -73 .0
TABLE 3 . PROJECTED INFLUENCE OF CLIMATE CHANGE ON MEAN MONTHLY PRECIPITATION
(MM/MONTH) IN RWANDA AT HISTORICAL AND MID-CENTURY PERIODS, AND MONTHLY
ANOMALIES BETWEEN THE TWO TIME PERIODS 10 .
10 Historical precipitation based on the average of the period 1980-2010, and projected Mid-Century precipitation for the period 2040-2069. Anomalies are defined as the total change between Historical and Mid-Century projections. Province-level summaries of predicted monthly changes in precipitation can be found in the supplementary Appendix).

8 RESEARCH HIGHLIGHTS
CLIMATE CHANGE AND ITS EFFECT ON BEANS
REGIONPRODUCTION AREA ANNUAL PRODUCTION
TOTAL (HA) % NATIONAL TOTAL TOTAL (TONNES) % NATIONAL TOTAL
Eastern 218,549 40.2 315,999 43.4
Kigali 16,012 2.9 20,816 2.9
Northern 103,622 19.1 191,798 26.4
Southern 135,781 25.0 138,630 19.1
Western 69,779 12.8 60,422 8.3
Total 543,743 727,665
PROJECTED EFFECT OF CLIMATE CHANGE ON DISTRIBUTION OF SUITABILITY FOR BEANS IN RWANDA
11 Derived from the 2018 figures reported by the National Institute of Statistics Rwanda (NISR, 2018), Seasonal Agricultural Survey, http://www.statistics.gov.rw/datasource/seasonal-agricultural-survey-2018
12 Prices obtained from https://fews.net/sites/default/files/documents/reports/MONTHLY%20PRICE%20WATCH%20with%20ANNEX_November2019_FINAL.pdf US Dollar: Rwandan Franc exchange rate was estimated as 0.0011. Average market price for beans is approximately USD 0.52 per kg
PRODUCTION OF BEANS IN RWANDA11.
Beans are widely grown as a staple
subsistence crop across most of
Rwanda’s provinces, where the entire
country is considered to be highly
suitable for bean production, in both
rainy seasons.
Climate change is projected to result
in minor negative impacts on the
suitability for bean production. The
southern parts of the Eastern and
Kigali provinces will experience
decreases in suitability index score
in the first (September) rainy season.
The second rainy season in March
is likely to be affected by relatively
widespread reductions in suitability,
resulting in decreases to productivity
of 1.7 – 14%, with large parts of
the Eastern province becoming
increasingly marginal for beans.
It is predicted that households will experience a decrease in annual production ranging from 0.8 % in the Western province, up to 8% in the Eastern province. In terms of the total impact of climate change on the annual production of agricultural households, the predicted decrease in annual production may range from 1 kg per household in the Western province, up to 38 kg per household in the Eastern province. The costs of reduced production of beans are estimated to range from USD 0.10 to USD 5 per person, or, up to USD 20 per household12.
BROAD CONTEXT
HOUSEHOLD LEVEL IMPACTSANNUAL PRODUCTION
WESTERN WESTERNEASTERN EASTERN
USD 0.10 to USD 5 per personUSD 20per household
-0.8% per household
-1kg per household
-8% per household -38kg
per householdleast affected
least affected
most affected
most affected
Historical Areas of change Mid-Century Future
Mar
ch -
May
Au
g -
Oct
1=highly suitable not suitable=0
9CLIMATE CHANGE AND FUTURE CROP SUITABILITY IN RWANDA
Total loss of annual production
30 605tonnes
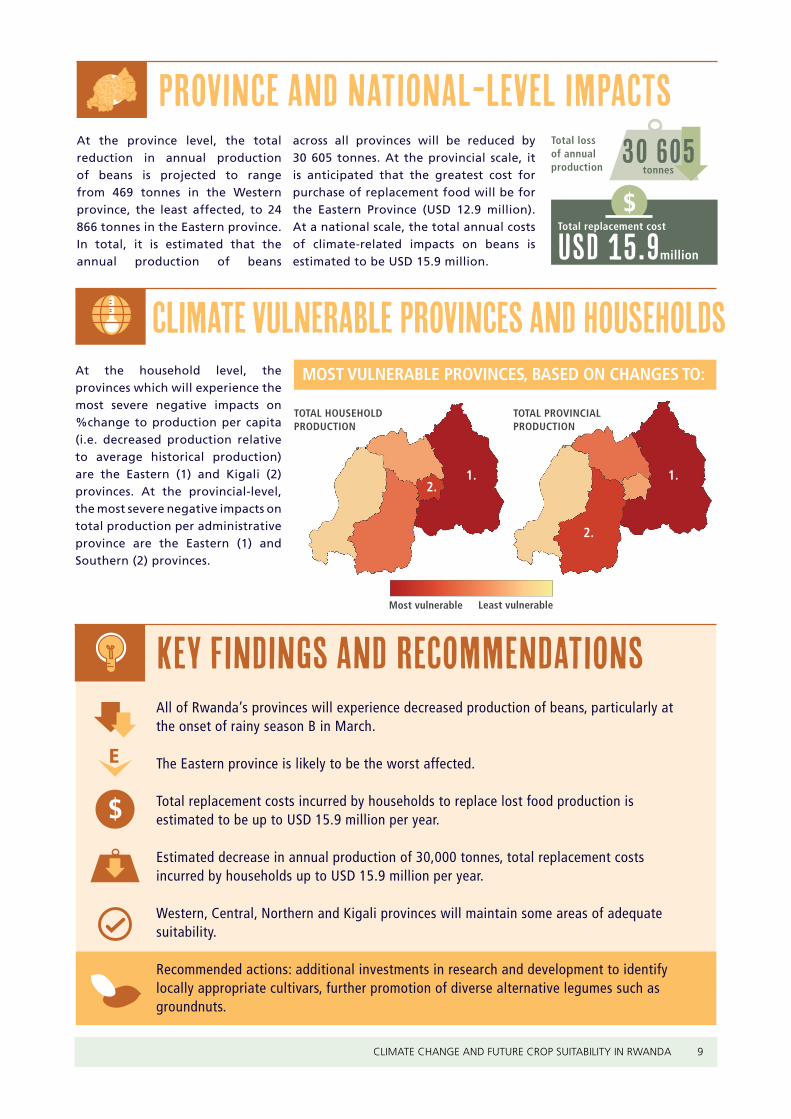
All of Rwanda’s provinces will experience decreased production of beans, particularly at the onset of rainy season B in March.
The Eastern province is likely to be the worst affected.
Total replacement costs incurred by households to replace lost food production is estimated to be up to USD 15.9 million per year.
Estimated decrease in annual production of 30,000 tonnes, total replacement costs incurred by households up to USD 15.9 million per year.
Western, Central, Northern and Kigali provinces will maintain some areas of adequate suitability.
Recommended actions: additional investments in research and development to identify locally appropriate cultivars, further promotion of diverse alternative legumes such as groundnuts.
At the household level, the provinces which will experience the most severe negative impacts on %change to production per capita (i.e. decreased production relative to average historical production) are the Eastern (1) and Kigali (2) provinces. At the provincial-level, the most severe negative impacts on total production per administrative province are the Eastern (1) and Southern (2) provinces.
across all provinces will be reduced by 30 605 tonnes. At the provincial scale, it is anticipated that the greatest cost for purchase of replacement food will be for the Eastern Province (USD 12.9 million). At a national scale, the total annual costs of climate-related impacts on beans is estimated to be USD 15.9 million.
PROVINCE AND NATIONAL-LEVEL IMPACTS
KEY FINDINGS AND RECOMMENDATIONS
CLIMATE VULNERABLE PROVINCES AND HOUSEHOLDS
$
At the province level, the total reduction in annual production of beans is projected to range from 469 tonnes in the Western province, the least affected, to 24 866 tonnes in the Eastern province. In total, it is estimated that the annual production of beans USD 15.9million
Total replacement cost
MOST VULNERABLE PROVINCES, BASED ON CHANGES TO:
Most vulnerable Least vulnerable
TOTAL HOUSEHOLD PRODUCTION
TOTAL PROVINCIAL PRODUCTION
1. 1.2.
2.
E

ANNUAL PRODUCTION
EASTERN & KIGALI NORTHERN REGION
USD 0.60per household
1.5–3% annual production
3–7kg per household
USD 0.20 per person
HOUSEHOLD LEVEL IMPACTS
REGIONPRODUCTION AREA ANNUAL PRODUCTION
TOTAL (HA) % NATIONAL TOTAL TOTAL (TONNES) % NATIONAL TOTAL
Eastern 134,015 17.4 303,674 14.6
Kigali 9,791 1.3 23,761 1.1
Northern 34,322 4.5 77,566 3.7
Southern 112,038 14.6 387,878 18.6
Western 94,062 12.2 247,923 11.9
Total 384,228 1,040,802
PROJECTED EFFECT OF CLIMATE CHANGE ON DISTRIBUTION OF SUITABILITY FOR CASSAVA IN RWANDA
13 Derived from the 2018 figures reported by the National Institute of Statistics Rwanda (NISR, 2018), Seasonal Agricultural Survey, http://www.statistics.gov.rw/datasource/seasonal-agricultural-survey-201814 Prices obtained from https://allafrica.com/stories/201909250360.html. US Dollar: Rwandan Franc exchange rate was estimated as 0.0011. Average market price is approximately USD 0.09 per kg.
PRODUCTION OF CASSAVA IN RWANDA13.
Cassava is widely grown as a subsistence crop across all of Rwanda’s provinces, with widespread areas of good or excellent suitability. The only regions which appear to be less well-suited to cassava production are the eastern borders of the country.
Climate change will likely result in very slight decreases in suitability in the Eastern and Kigali provinces (resulting in decreases in productivity ranging from -0.6 to -3.1%.) and slight increases in the Northern, Western and Southern provinces. This increase in suitability in the Northern and Western parts of the country contributes to a very minor increase in the total spatial extent of area suitable for cassava production. The entire spatial extent of Rwanda is predicted to remain suitable for production of cassava during both rainy seasons.
Eastern and Kigali provinces are the only provinces predicted to experience negative impacts on cassava production, where households are projected to experience a decrease of 1.5-3% in annual production. This change in annual production is equivalent to a deficit of 3-7 kg per household. The cost of reduced production of cassava in the Eastern province, the worst affected of Rwanda’s provinces, is estimated to be USD 0.2 per person, or, up to USD 0.6 per household.
The remaining provinces are predicted to benefit from very small increases to the average suitability index score and resultant productivity. These results must not be interpreted
BROAD CONTEXT
Historical Areas of change Mid-Century Future
Mar
ch -
May
Au
g -
Oct
1=highly suitable not suitable=0
CLIMATE CHANGE AND ITS EFFECT ON CASSAVA
as a strong prediction that annual production will increase as a result of climate change. Rather, these results suggest that those provinces which benefit from increased suitable area
are unlikely to be impacted severely by negative effects of climate change, but may not necessarily be able to benefit fully from the predicted increase of suitability.14

Total loss of annual production 5186
tonnes
Most of Rwanda is unlikely to experience severe negative impacts on cassava production.
Eastern and Kigali provinces are the only provinces that are likely to experience decreased production potential.
The total loss of national production resulting from climate change is estimated to be 5,100 tonnes per annum, equivalent to a replacement cost of USD 485,000 per year.
Cassava is a flexible crop, allowing roots and leaves to be harvested throughout the year according to household needs.
The continued distribution of suitable areas for cassava suggests that this crop is likely to remain a useful option for climate-resilient farming systems.
Recommended actions: increased access to quality, virus-free planting material of improved varieties; increased access to facilities and equipment for processing fresh cassava; improved capacity of farmers to monitor and respond to common pests and diseases.
At the household level, the provinces which will experience the most severe negative impacts on production per capita (i.e. decreased production relative to average historical production) are Kigali (1) and Eastern (2) provinces. At the provincial-level, the most severe negative impacts on total production per administrative province are the Eastern (1) and Kigali (2) provinces. Cassava production in all the remaining provinces (Northern, Southern and Western) is predicted to experience net benefits as a result of increased suitable area.
PROVINCE AND NATIONAL-LEVEL IMPACTS
KEY FINDINGS AND RECOMMENDATIONS
CLIMATE VULNERABLE PROVINCES AND HOUSEHOLDS
$
In terms of the potential impact on total provincial production, estimated impacts on Eastern and Kigali provinces are 4,471 and 715 tonnes, respectively. At a national scale, the total annual costs of climate related impacts on cassava is estimated to be USD 484 895.
USD 484 895Total replacement cost
MOST VULNERABLE PROVINCES, BASED ON CHANGES TO:
TOTAL HOUSEHOLD PRODUCTION
TOTAL PROVINCIAL PRODUCTION
Suitability increase
1. 2.2. 1.
Most vulnerable Least vulnerable

ANNUAL PRODUCTIONEASTERN EASTERNKIGALI KIGALI
REGIONPRODUCTION AREA ANNUAL PRODUCTION
TOTAL (HA) % NATIONAL TOTAL TOTAL (TONNES) % NATIONAL TOTAL
Eastern 33,137 36.5 14,859 36.0
Kigali 940 1.0 415 1.0
Northern 1,026 1.1 881 2.1
Southern 9,494 10.4 3,892 9.4
Western 836 0.9 619 1.5
Total 45,433 20,666
PROJECTED EFFECT OF CLIMATE CHANGE ON DISTRIBUTION OF SUITABILITY FOR GROUNDNUTS IN RWANDA
15 Derived from the 2018 figures reported by the National Institute of Statistics Rwanda (NISR, 2018), Seasonal Agricultural Survey, http://www.statistics.gov.rw/datasource/seasonal-agricultural-survey-2018
16 Prices obtained from https://allafrica.com/stories/201805010029.html. US Dollar: Rwandan Franc exchange rate was estimated as 0.0011. The average market price is approximately USD 1.76 per kg.
PRODUCTION OF GROUNDNUTS IN RWANDA15.
Groundnuts are grown as a
subsistence crop across all of Rwanda’s
provinces with widespread areas of
good or excellent suitability in rainy
season A, and areas of moderate or
good suitability in North, Eastern
and portions of Southern province in
rainy season B.
Climate change may result in complex
impacts on groundnut production,
where analyses indicate that all
provinces will experience decreases
in productivity at the onset of rainy
season B (ranging from -0.7 to –100%)
and increases in productivity at the
onset of the rainy season A (ranging
from 3.6 to 8.9%) and reduced spatial
extent of suitable areas at the onset
of rainy season B. Most of the country
is projected to remain suitable to
highly suitable for groundnuts at the
onset of rainy season A.
The Eastern, Southern and Kigali provinces are predicted to experience small negative impacts on groundnut production, where households are projected to experience a decrease of 22% (Eastern) to 66% (Kigali) of annual production. These changes in annual production are equivalent to an annual deficit of 1-5kg per household. The costs of reduced production of groundnuts are estimated to range from USD 0.40 to USD 2.20 per person, or, up to USD 8.7 per household16.
The Northern and Western provinces are predicted to benefit from minor increases to the average suitability index score and resultant productivity. These results must not be interpreted as a strong prediction that annual
BROAD CONTEXT
USD 8.70per household
HOUSEHOLD LEVEL IMPACTS
-22% -1kg per household
-66% -5kg
per household
least affected least affectedmost affected most affected
Historical Areas of change Mid-Century Future
Mar
ch -
May
Au
g -
Oct
1=highly suitable not suitable=0
production will increase as a result of climate change. Rather, these results suggest that those provinces which benefit from increased suitable area are unlikely to be impacted severely by negative effects of climate change, but may not necessarily be able to benefit fully from the predicted increase of suitability.
CLIMATE CHANGE AND ITS EFFECT ON GROUNDNUT
USD 0.40 - 2.20 per person

Total loss of annual production
4 980tonnes
Rwanda will likely experience minor or moderate decreases in production of groundnut during rainy season B (March), particularly in Eastern, Kigali and Southern provinces.
The Western and Northern provinces are unlikely to experience severe negative impacts to production of groundnuts as a result of climate change.
All provinces continue to be characterised by widespread areas of suitability for groundnuts in season A.
The total loss of national production resulting from climate change is estimated to be 4,980 tonnes per annum, equivalent to a replacement cost of USD 8.8 million per year.
Despite the predicted negative impacts, the continued extensive distribution of suitable areas for groundnut production suggests that this crop is likely to remain a useful option for climate-resilient farming systems.
Recommended actions: promote within diversified, multi-crop and intercrop combinations; research, develop and promote locally-adapted and drought resilient varieties; invest in post-harvest processing facilities.
At the household level, the provinces which will experience the most severe negative impacts on %change to production per capita (i.e. decreased production relative to average historical production) are the Kigali (1) and Southern (2) provinces. At the provincial-level, the most severe negative impacts on total production per administrative province are the Eastern (1) and Southern (2) provinces.
the negatively affected provinces will be reduced by 4,980 tonnes. The greatest cost for purchase of replacement food will be for the Eastern Province (USD 5.6 million). At a national scale, the total annual costs of climate-related impacts on groundnuts is estimated to be USD 8.8 million.
PROVINCE AND NATIONAL-LEVEL IMPACTS
KEY FINDINGS AND RECOMMENDATIONS
In terms of total annual production of groundnuts within each province, it is predicted that the Eastern and Southern provinces, the two worst-affected provinces, will experience a decrease in annual production of 3,204 and 1,503 tonnes respectively. In total, it is estimated that the annual production of groundnuts across
CLIMATE VULNERABLE PROVINCES AND HOUSEHOLDS
USD 8.8million
Total replacement cost
MOST VULNERABLE PROVINCES, BASED ON CHANGES TO:
TOTAL HOUSEHOLD PRODUCTION
TOTAL PROVINCIAL PRODUCTION
Suitability increase
1.
2.2.
1.
Most vulnerable Least vulnerable

PROJECTED EFFECT OF CLIMATE CHANGE ON DISTRIBUTION OF SUITABILITY FOR MAIZE IN RWANDA
17 Derived from the 2018 figures reported by the National Institute of Statistics Rwanda (NISR, 2018), Seasonal Agricultural Survey, http://www.statistics.gov.rw/data-
source/seasonal-agricultural-survey-201818 Prices obtained from https://fews.net/sites/default/files/documents/reports/MONTHLY%20PRICE%20WATCH%20with%20ANNEX_November2019_FINAL.pdf. US Dollar:
Rwandan Franc exchange rate was estimated as 0.0011. Average market price is approximately USD 0.36 per kg.
Maize is the main cereal crop of Rwanda. It is characterised by widespread areas of suitability and is planted in both rainy seasons.
All provinces are predicted to
undergo decreases to average
suitability index score and resultant
negative changes to productivity in
both rainy seasons. The Northern
province is expected to experience
the greatest decreased productivity
in both rainy seasons. However,
despite these negative changes, the
total suitable area for production
of maize is expected to remain
unchanged across all provinces. All
provinces are expected to continue
to be characterised by excellent
suitability on average.
The total % change of annual production of maize per capita is predicted to range from a loss of 1.2% in Kigali province up to 4.6% in the Western province. At the household level, the projected decrease in production ranges from 0 kg to 7 kg in the Kigali and Eastern provinces, respectively. The costs of reduced production of maize are estimated to range from USD 0 to USD 0.60 per person, or, up to USD 2.5 per household18.
BROAD CONTEXT
Historical Areas of change Mid-Century Future
Mar
ch -
May
Au
g -
Oct
1=highly suitable not suitable=0
HOUSEHOLD- AND NATIONAL-LEVEL IMPACTS
CLIMATE CHANGE AND ITS EFFECT ON MAIZE
14 RESEARCH HIGHLIGHTS
REGIONPRODUCTION AREA ANNUAL PRODUCTION
TOTAL (HA) % NATIONAL TOTAL TOTAL (TONNES) % NATIONAL TOTAL
Eastern 166,918 28.6 247,575 31.0
Kigali 7,424 1.3 7,715 1.0
Northern 40,548 6.9 53,460 6.7
Southern 37,391 6.4 42,258 5.3
Western 39,935 6.8 48,614 6.1
Total 292,216 399,622
PRODUCTION OF MAIZE IN RWANDA17.
ANNUAL PRODUCTION
KIGALI KIGALIWESTERN EASTERN
-1.2% per capita
-0kg per household
-4.6% per capita
-7kg per household
least affected
least affected
most affected
most affectedUSD 2.50 per household USD 0 TO 0.60 per person

Total loss of annual production
10 692tonnes
The negative effects of climate change on maize are expected to be minor or moderate across most of Rwanda’s provinces.
Most of Rwanda is likely to remain widely suitable for maize production.
The Eastern and Northern provinces are predicted to experience the greatest decreases in maize production, up to 10,700 tonnes or a replacement cost to households of USD 3.8 million.
Maize is likely to remain well-suited for Rwanda’s climate by the mid-century future.
Results for sorghum (not included in this report) indicate minor increases in suitability - all provinces are expected to be characterised by excellent suitability and therefore this crop is likely to be a useful climate-resilient alternative to maize.
Recommended actions include: i) identify and increase access to the most locally appropriate cultivars to be promoted, notably including fast-maturing varieties; ii) increase technical support and assistance for farmers to adopt new practices for climate resilience and management of climate risks; and iii) promote the adoption of alternative, climate-resilient crops such as sorghum and millet.
At the household level, the provinces which will experience the most severe negative impacts on %change to production per capita (i.e. decreased production relative to average historical production) are the Northern (1) and Western (2) provinces. At the provincial-level, the most severe negative impacts on total production per administrative province are the Eastern (1) and Northern(2) provinces.
USD 1.6 million). At the national level, the total decrease in maize production is equivalent to 10 692 tonnes, resulting in annual replacement costs for lost production of USD 3.8 million.
PROVINCE AND NATIONAL-LEVEL IMPACTS
KEY FINDINGS AND RECOMMENDATIONS
CLIMATE VULNERABLE PROVINCES AND HOUSEHOLDS
At the provincial level, the cumulative deficit in production of maize ranges from 92 tonnes in Kigali province up to 4576 tonnes in the Eastern province (resulting in replacement costs of USD 3.8million
Total replacement cost
MOST VULNERABLE PROVINCES, BASED ON CHANGES TO:
$
TOTAL HOUSEHOLD PRODUCTION
TOTAL PROVINCIAL PRODUCTION
1. 2.
2.
1.
Most vulnerable Least vulnerable

CLIMATE CHANGE AND ITS EFFECT ON SWEET POTATO
19 Derived from the 2018 figures reported by the National Institute of Statistics Rwanda (NISR, 2018), Seasonal Agricultural Survey, http://www.
statistics.gov.rw/datasource/seasonal-agricultural-survey-201820 Prices obtained from https://allafrica.com/stories/201805010029.html. US Dollar: Rwandan Franc exchange rate was estimated as 0.0011. The
average market is approximately USD 0.28 per kg.
Sweet potato is grown as a subsistence crop across most of Rwanda’s provinces with widespread areas of good or excellent suitability in rainy season A, and areas of moderate or good suitability in Northern and Eastern provinces during rainy season B.
Rwanda is likely to experience a mix of positive, neutral and small negative changes to suitability for sweet potato production. At the onset of rainy season A, Kigali and Southern provinces may experience some minor decreases to suitability while the other provinces may benefit from small increases. Rainy season B, which is characterised by comparatively moderate baseline suitability, is predicted to experience decreases in all provinces, to the extent that all provinces except Western province will become completely unsuitable for sweet potato.
The Southern province is the only province that predicted to experience negative impacts on sweet potato production, where households are projected to experience a decrease of 0.6%. The changes in Kigali province are too small to have an impact at the household or provincial levels. These changes in annual production in Southern province are equivalent to a deficit of 2 kg at the household level, resulting in a replacement cost for lost production of USD 0.10 per person, or USD 0.50 per household20.
BROAD CONTEXT
HOUSEHOLD AND PROVINICAL LEVEL IMPACTSANNUAL PRODUCTION
KIGALI KIGALISOUTHERN SOUTHERN
USD 0.50per household
0% per household
0kg per household
-0.6% per household
2kg per household
least affected least affectedmost affected most affected
USD 0.10
REGIONPRODUCTION AREA ANNUAL PRODUCTION
TOTAL (HA) % NATIONAL TOTAL TOTAL (TONNES) % NATIONAL TOTAL
Eastern 14,021 8.0 72,020 11.2
Kigali 1,592 0.9 87,352 13.6
Northern 20,351 11.6 10,461 1.6
Southern 26,666 15.2 7,001 1.1
Western 25,086 14.3 144,233 22.5
Total 87,716 321,067
PROJECTED EFFECT OF CLIMATE CHANGE ON DISTRIBUTION OF SUITABILITY FOR BEANS IN RWANDA
PRODUCTION OF BEANS IN RWANDA19.
Historical Areas of change Mid-Century Future
Mar
ch -
May
Au
g -
Oct
1=highly suitable not suitable=0

Total loss of annual production 1 178
kg
Southern province is expected to undergo decreased production potential for sweet potato.
Western and Northern provinces are unlikely to experience severe negative impacts on the production of sweet potato as a result of climate change, and continue to be characterised by moderate-to-good suitability at the onset of rainy season A (September).
Sweet potato is likely to be a useful option for climate-resilient farming systems, particularly in Western and Northern provinces.
The Southern province is likely to be the only province that experiences negative impacts on sweet potato production in both rainy seasons, and is therefore likely to be the most vulnerable to climate change impacts on sweet potato production, both at the household-level and at the provincial-level.
KEY FINDINGS AND RECOMMENDATIONS
CLIMATE VULNERABLE PROVINCES AND HOUSEHOLDS
USD 323 833Total annual cost
MOST VULNERABLE PROVINCES, BASED ON CHANGES TO:
TOTAL PROVINCIAL AND HOUSEHOLD PRODUCTION
Most vulnerable
Least vulnerable
Suitability increase
S
In total, the predicted decrease of production of sweet potato from Southern province is relatively minor, equivalent to 1,178kg and resulting in total replacement costs of USD 323 833 per year.
17CLIMATE CHANGE AND FUTURE CROP SUITABILITY IN RWANDA

18 RESEARCH HIGHLIGHTS
The summarised findings
above indicate that several
important staple crops –
notably beans, groundnut
and maize – are predicted to
experience moderate decreases
in production. Consequently, it
is strongly recommended that
initiatives related to climate change
adaptation, food security and
enhanced agricultural production
include careful consideration
of strategies to increase the
resilience of these three crops.
Simultaneously, analysis of the
future suitability of sorghum,
cassava and sweet potato indicate
that Rwanda may continue to be
characterised by widespread areas
of good or excellent suitability by
the Mid-Century future.
In the case of maize, the results
support the case for development
and promotion of fast-growing,
early-maturing varieties to be
disseminated as widely as possible.
SUMMARY OF FINDINGS, RECOMMENDATIONS, ADAPTATION STRATEGIES AND CLIMATE-RESILIENT ALTERNATIVES FOR SMALLHOLDER FARMERS
The risk of reduced production of
all maize varieties can be partly
offset by continued promotion
of crop diversification, including
intercropping and multi-crop
approaches that include diverse
legumes and alternative cereals
such as sorghum.
In the case of beans, the results
indicate a moderate reduction of
production between the current
baseline period and the mid-century
future, particularly in Season B.
Despite this predicted negative
trend, beans and other leguminous
crops are still expected to be a useful
component of future strategies
to adapt smallholder agriculture
to climate change in Rwanda. The
crop is already widely grown and
eaten, can be incorporated into
diverse inter-cropping and crop
rotation strategies with other staple
crops, and contributes positively to
soil fertility. The potential risk of
negative impacts of climate change
on beans can partly be offset
by promoting the adoption of a
diversity of bean cultivars as well as
additional legume species such as
groundnuts.
In the case of groundnuts, climate
change is predicted to result in
negative effects on production in
the Eastern, Kigali and Southern
provinces in Season B but with
possible positive effects in the
Northern and Western provinces.
Although these three provinces
are predicted to undergo decreases
in annual production, they
continue to be characterised by
widespread areas of suitability
for groundnuts in season A. As a
result, groundnuts are likely to
be a useful option for climate-
resilient farming systems, either to
be promoted as an alternative or a
complement to other crops which
are poorly adapted to erratic or
irregular rainfall and increased
temperatures.
APPENDIX TABLESAPPENDIX TABLE A .1 .
SUMMARISED ADAPTIVE CAPACITY (AC) INDICATORS COLLECTED FOR ALL PROVINCES OF RWANDA 21
Indicator category Adaptive capacity indicators Eastern Kigali Northern Southern Western
Adoption of improved
agricultural practices
% of plots using organic fertilisers 35.2 45.9 64.7 60.5 55.7
% of plots using pesticides 6.7 4.7 12.4 9.4 15.9
% use of improved seeds 6.1 4.1 6.8 5.6 7.8
Access to agricultural
information
% households that own a radio 73.1 91.5 73.2 67.2 69.5
% households that have received extension services 26.9 9.3 33.6 31.4 31.6
Education % Literacy rate at age 10 69.4 86.6 71.4 68.8 68.0
Education Employment rate 85.4 82.4 90.3 85.9 85.9
21 Derived from Agricultural Household Survey, http://statistics.gov.rw/publication/agricultural-household-survey-2017; and Labour Force Survey Report, http://statistics.gov.rw/publication/labour-force-survey-report-december-2018

19CLIMATE CHANGE AND FUTURE CROP SUITABILITY IN RWANDA
APPENDIX TABLE A .2 .
PROJECTED INFLUENCE OF CLIMATE CHANGE ON MEAN MONTHLY TEMPERATURE (°C) IN THE PROVINCES OF RWANDA AT HISTORICAL AND MID-CENTURY PERIODS, AND MONTHLY ANOMALIES BETWEEN THE TWO TIME PERIODS
MONTH
J F M A M J J A S O N D
NORTHERN
Historical (°C) 19.4 19.8 19.6 19.3 19.1 18.9 19.2 20.0 20.0 19.7 19.2 19.2
Future (°C) 21.2 21.6 21.4 21.1 21.0 21.0 21.3 22.2 22.1 21.6 20.9 21.0
Anomaly (°C) 1.8 1.8 1.8 1.8 1.9 2.1 2.1 2.2 2.1 1.9 1.7 1.8
SOUTHERN
Historical (°C) 19.9 20.2 20.1 19.8 19.7 19.6 19.9 20.9 21.0 20.6 19.8 19.9
Future (°C) 21.7 22.1 21.9 21.6 21.7 21.7 22.0 23.0 23.1 22.5 21.5 21.7
Anomaly (°C) 1.8 1.9 1.8 1.8 1.9 2.1 2.1 2.1 2.1 2.0 1.7 1.8
EASTERN
Historical (°C) 20.8 21.1 20.9 20.5 20.5 20.5 20.9 21.8 21.7 21.2 20.4 20.6
Future (°C) 22.6 23.0 22.7 22.3 22.4 22.6 23.0 23.9 23.8 23.2 22.2 22.4
Anomaly (°C) 1.8 1.9 1.8 1.8 1.9 2.1 2.1 2.1 2.1 2.0 1.7 1.8
WESTERN
Historical (°C) 19.1 19.5 19.4 19.3 19.1 18.9 19.0 19.8 20.0 19.7 19.1 19.1
Future (°C) 21.0 21.4 21.3 21.1 21.1 21.0 21.2 22.0 22.1 21.6 20.8 20.9
Anomaly (°C) 1.9 1.9 1.8 1.8 2.0 2.1 2.2 2.1 2.1 2.0 1.7 1.8
KIGALI
Historical (°C) 20.5 20.9 20.6 20.2 20.0 20.0 20.4 21.4 21.4 20.9 20.1 20.3
Future (°C) 22.4 22.8 22.5 22.0 21.9 22.1 22.5 23.5 23.5 22.9 21.8 22.1
Anomaly (°C) 1.8 1.8 1.8 1.8 1.9 2.1 2.1 2.1 2.1 2.0 1.7 1.8
APPENDIX TABLE A .3 .
PROJECTED INFLUENCE OF CLIMATE CHANGE ON MEAN MONTHLY PRECIPITATION (MM/MONTH) IN THE PROVINCES OF RWANDA AT HISTORICAL AND MID-CENTURY PERIODS, AND MONTHLY ANOMALIES BETWEEN THE TWO TIME PERIODS
mm/monthMONTH
J F M A M J J A S O N D Total
NO
RTH
ERN Historical 92 102 136 155 118 29 19 48 106 137 149 100 1191
Future 97 100 129 143 93 23 18 43 95 123 150 104 1115
Anomaly +5 -3 -6 -12 -25 -6 -2 -5 -12 -15 +0 +4 -75
SOU
THER
N Historical 118 116 150 172 121 22 13 34 85 131 159 118 1240
Future 120 115 144 161 96 17 11 28 74 115 156 122 1158
Anomaly +2 -1 -7 -11 -26 -5 -2 -6 -11 -16 -3 +4 -82
EAST
ERN Historical 83 86 121 149 100 16 12 31 74 107 136 91 1004
Future 85 87 117 138 78 12 10 27 64 95 135 94 941
Anomaly +3 +1 -5 -11 -21 -4 -2 -4 -10 -13 -1 +4 -63
WES
TER
N Historical 121 117 150 156 121 34 20 44 101 144 161 128 1295
Future 120 113 142 146 97 26 18 37 92 129 159 131 1210
Anomaly -1 -4 -8 -10 -25 -7 -2 -6 -9 -15 -2 +3 -86
KIG
ALI
Historical 87 99 130 154 109 19 13 33 81 117 138 91 1072
Future 91 99 125 143 86 14 11 29 70 104 138 95 1005
Anomaly +4 0 -5 -11 -23 -5 -2 -4 -11 -14 0 +4 -67
