research briefing 2016 assembly election results documents/16-30-2016... · research briefing 2016...
TRANSCRIPT

Research Briefing 2016 Assembly Election Results
Authors: Helen Jones and Owen HolzingerDate: June 2016
National Assembly for WalesResearch Service

The National Assembly for Wales is thedemocratically elected body that representsthe interests of Wales and its people,makes laws for Wales and holds the Welsh Government to account.
Contact Us
Research ServiceNational Assembly for WalesTŷ HywelCardiff BayCardiffCF99 1NA
q : 0300 200 6328E : [email protected] : [email protected] : Assembly.Wales/InBriefa : @SeneddResearcha : Assembly.Wales/Research
© National Assembly for Wales Commission Copyright 2016The text of this document may be reproduced free of charge in any format or medium providing that it is reproduced accurately and not used in a misleading or derogatory context. The material must be acknowledged as copyright of the National Assembly for
Authors: Helen Jones and Owen HolzingerDate: June 2016Paper Number: 16-030

National Assembly for WalesResearch Service
This paper summarises the results, votes, shares and turnout at the Assembly election on 5 May 2016.
Research Briefing 2016 Assembly Election Results

Contents
Introduction ..................................................................................................................... 1
The electoral system ................................................................................................................................................................... 1
Data sources used for the 2011 election ........................................................................................................................... 1
Summary of the 2016 Assembly election results ................................................ 2
Key results ....................................................................................................................................................................................... 2
Constituency results.................................................................................................................................................................... 3
Regional results ............................................................................................................................................................................. 9
Seats changing hands ................................................................................................................................................................. 9
Safe and marginal seats .......................................................................................................................................................... 10
Assembly Members – composition .................................................................................................................................... 11
New AMs ........................................................................................................................................................................................ 12
Turnout .......................................................................................................................................................................................... 13
Detailed election results ........................................................................................... 15
Source and Notes ........................................................................................................ 28
Data sources – votes ................................................................................................................................................................ 28
Data sources – electorate and turnout ............................................................................................................................ 28
Key to party codes ..................................................................................................................................................................... 28

1
Introduction
This paper gives a summary of the results, votes, shares and turnout at the fifth Assembly election, on 5 May
2016.
The electoral system
The electoral system in Wales is known as the Additional Member System. The Assembly has 60 elected
members and each voter has two votes. The first vote is used to elect a local or constituency Assembly
Member using the First Past the Post system. Forty Assembly Members are elected on this basis, one from each
constituency.
The second vote is used to elect 20 additional members on a regional basis, to try to ensure that the overall
number of seats for each political party reflects their share of the vote. The d’Hondt formula is used for
deciding which parties win regional list seats. For further details please refer to the National Assembly website -
How the Assembly is elected, which provides an overview of the electoral system.
Data sources used for the 2016 election
The election statistics shown in this paper have been compiled from data provided by the returning officers in
each local authority and data obtained from the Press Association. The electorate figures relate to the
number of people registered and eligible to vote in the Assembly election as at 18 April 2016 and were
provided by local authority returning officers and the Press Association.
This paper includes comparisons of the 2011 results with the previous Assembly election results on 5 May
2011.
During the Fourth Assembly the following changes occurred:
Ieuan Wyn Jones stood down as AM for Ynys Mon on 20/06/2013. The subsequent by-election was won by
Rhun Ap Iorwerth (Plaid hold, 01/08/2013)
Antoinette Sandbach was elected as Member of Parliament at the 2015 General election and subsequently
stood down as an Assembly Member. She was replaced by the next Conservative candidate on the North
Wales regional list, Janet Howarth.
Byron Davies was elected as a Member of Parliament at the 2015 General election and subsequently stood
down as an Assembly Member. He was replaced by the next Conservative candidate on the South Wales West
regional list, Altaf Hussein.
Changes within the fourth Assembly term are not reflected in this paper.

2
Summary of the 2016 Assembly election results
This section provides a high level summary of the results of the 2016 Assembly election. Please note that
comparisons are made to the position following the 2011 Assembly election. Further details can be found in
section 3.
No party won an outright majority at the election. The distribution of seats is detailed in the below graph.
Figure 1 Share of seats 2016
Key results
Table 1. Summary: 2016 and changes 2011-2016
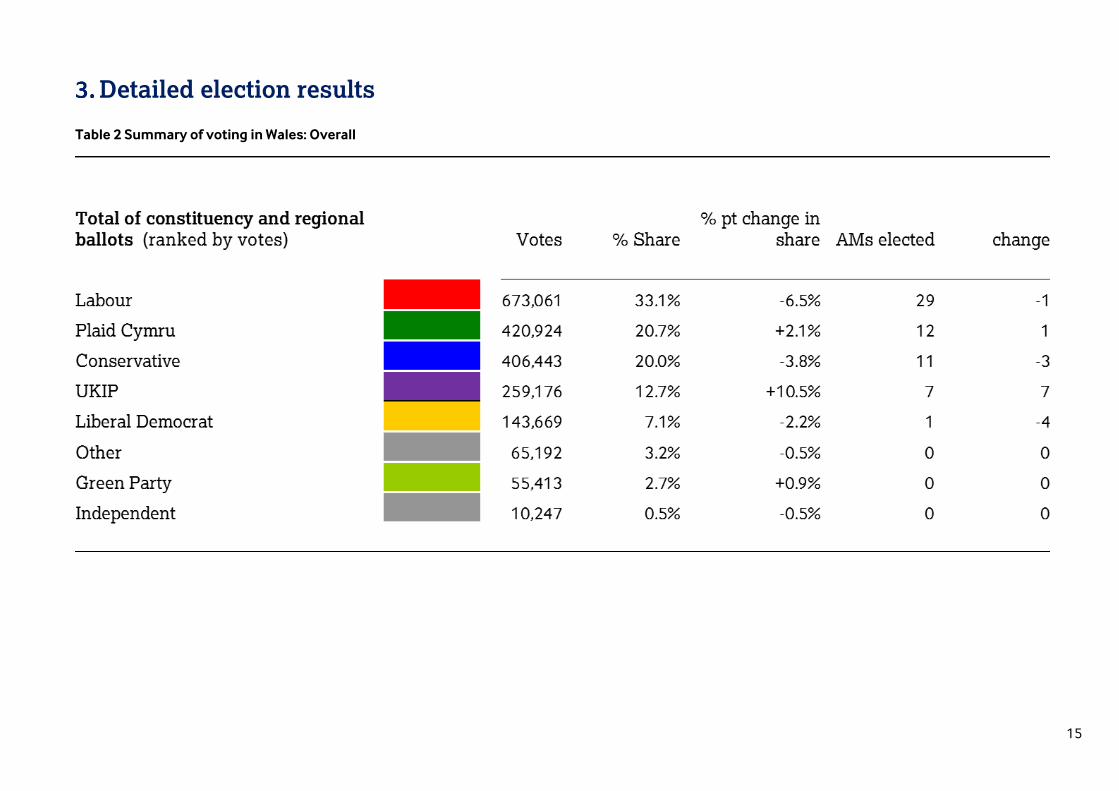
Labour won 29 seats, down 1 from 2011 but up 3 seats compared to 2007. The only constituency seat to
change hands was the Labour seat of Rhondda (now held by Plaid Cymru).
The Conservatives won 11 seats, down 3 from 2011. This means they will not continue in the position of
official opposition going into the Fifth Assembly.
Plaid Cymru won 12 seats, up 1 from 2011 having won the only constituency to change hands (Rhondda).
Plaid Cymru are now the second largest party in the Senedd and become the official opposition.
The Liberal Democrats won 1 seat, losing 4 seats from the regional list compared to 2011. This is the Liberal
Democrat’s worst result in an Assembly election. They now have no regional AMs for the first time.

3
For the first time in an Assembly election, a political party other than the four listed above won seats in the
Senedd. UKIP won 7 seats and are now the fourth largest party.
The distribution of constituency and regional seats by party is outlined in the infographic below.
Figure 2 Seats in Assembly by constituency and region
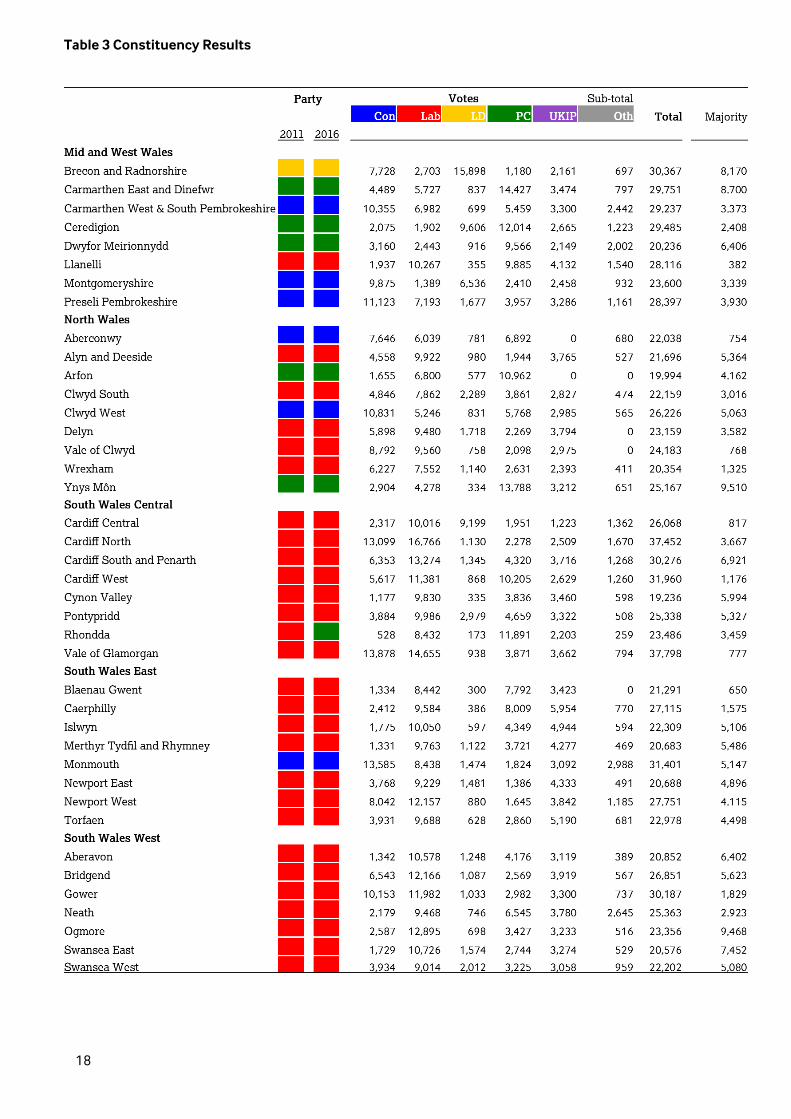
Constituency results
The overall share of the constituency vote and changes since 2011 are detailed in this section.
Labour’s share of the vote fell by 7.6% points compared to 2011, leading to the second lowest share received
by Labour of the constituency vote. Labour’s constituency vote share is 2.5% higher than in 2007.
The Conservatives also saw a decrease in vote share, by 3.8%. They received just over a fifth of the
constituency vote share.
Plaid Cymru were the only incumbent party to increase their constituency vote share, by 1.2%.
UKIP did not field constituency candidates in the 2011 election. They received 12.5% of the vote.
The share each party has of the vote in each constituency is outlined on pages 4-8
Figure 3 Map of Labour vote share

4
Figure 4 Map of Conservative vote share

5
Figure 5 Map of Plaid Cymru vote share

6
Figure 6 Map of Liberal Democrat vote share

7
Figure 7 Map of UKIP vote share

8

9
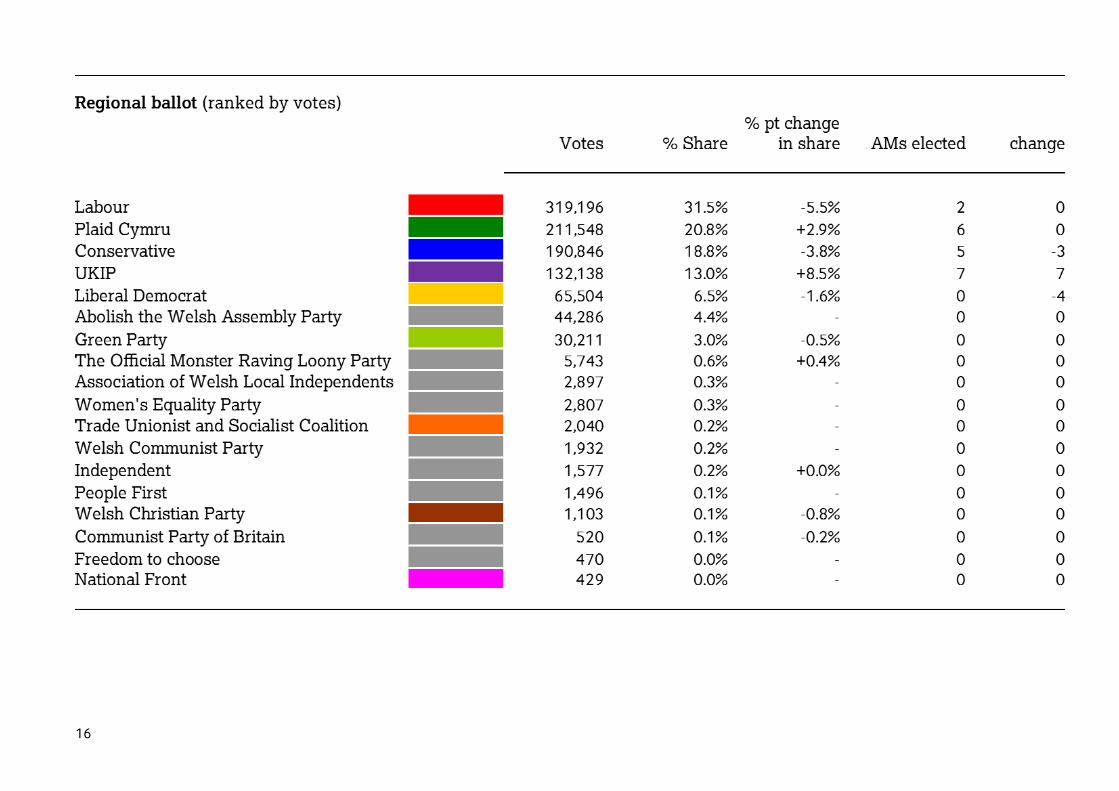
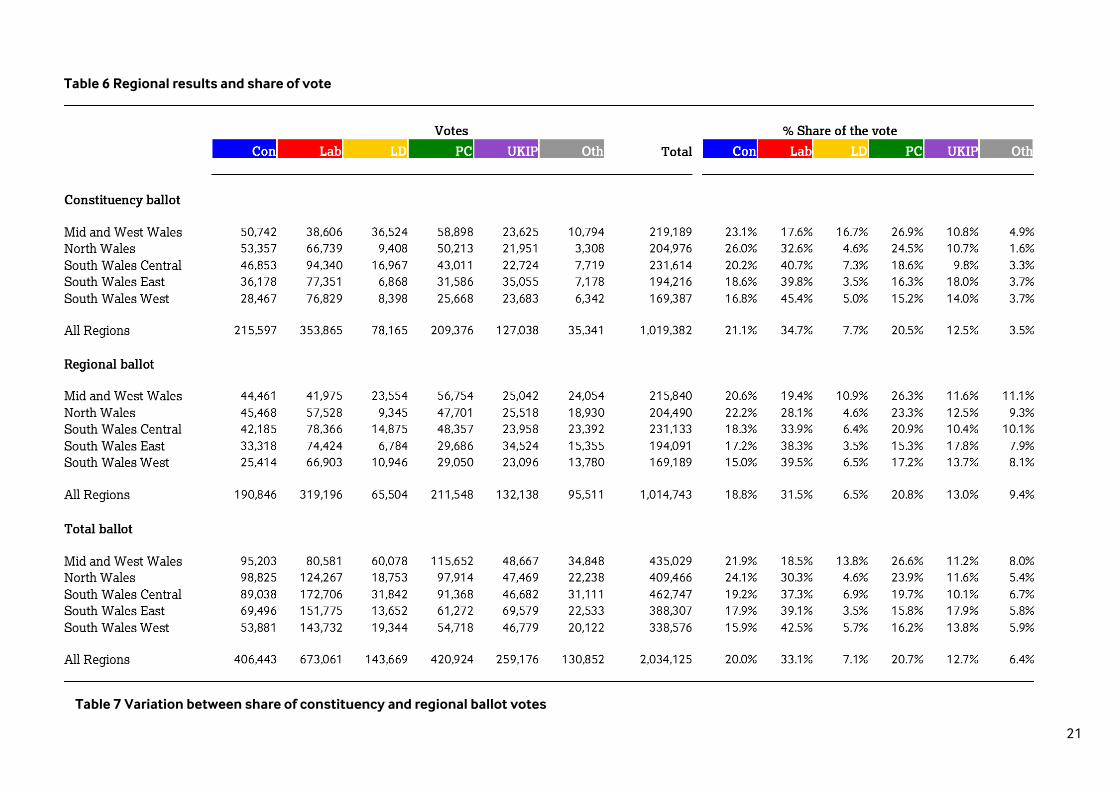
Regional results
The overall share of the regional vote and changes since 2011 are detailed below.
Minor parties and independent candidates account for almost 10% of the regional vote. The candidates
included in the “other” category gain a much greater share of the regional vote compared to the
constituency vote.
Except for other candidates, all parties are within +/-3.3% of the constituency vote, suggesting that the
majority of voters vote for the same party in both ballots.
Whilst Labour receives close to a third of the votes in the regional ballot, the additional member system
(mentioned in section 1) means this does not equate to the equivalent proportion of seats.
The Liberal Democrats saw their vote share decline by 1.5% points resulting in the loss of all four of the
regional seats held in the Fourth Assembly.
All of UKIP’s seats were won at the regional level. A vote share of 13% secured 7 seats.
The infographic below shows the changes in regional seats. It also uses 2011 census data to create a
‘cartogram’, making constituencies of proportional size to their resident population, rather than geographical
area.
Figure 8 Changes in regional seats and ‘cartogram’ of constituency and regional results
Seats changing hands
The only seat to change hands was the Rhondda. The seat had previously been held by a labour candidate
(Leighton Andrews) since 2003. In 1999 the seat was held by Plaid Cymru.

10
The seat was won at the 2016 election by Leanne Wood, leader of Plaid Cymru with 50.6% of the vote and a
majority of 14.7%.
Safe and marginal seats
Majority share is the difference in the number of votes between the winning party and the second placed party.
The highest constituency majority was in Ogmore with a majority of 40.5% (9,468 votes). This seat was a
Labour hold from the 2011 Assembly election. This is a decrease in constituency majority of 6.8% points
compared to the 2011 election.
The lowest constituency majority was in Llanelli. This was 1.4% (382 votes) and was a Labour hold from the
2011 Assembly election. Compared to 2011 this is an increase in constituency majority of 1.1% points.
The largest increase in majority from the 2011 election was in Ynys Mon. The majority here increased from
12.2% in 2011 to 37.8% in 2016 (an increase of 25.6% points. This does not account for the by-election held
01/08/2013, which was also won by Plaid Cymru, with a majority of 42.3%. Details of the by-election can be
found on the Research Service Blog Inbrief.).
Disregarding the only constituency to change from one party to another (Rhondda), the biggest drop in
majority share was Blaenau Gwent. Here, the majority dropped from 45.1% in 2011 to 3.1% in 2016 (a decrease
of 42% points).
The median constituency majority was 16%. The map on page 11 shows constituency majorities from lowest
(darkest) to highest (lightest).
This report does not review majority share at a regional level. The D’Hondt method used for the regional vote
means majority share is not reached in the same way as the first past the post system and is therefore not
comparable.
Figure 9 Majority share, lowest (dark) to highest (light)
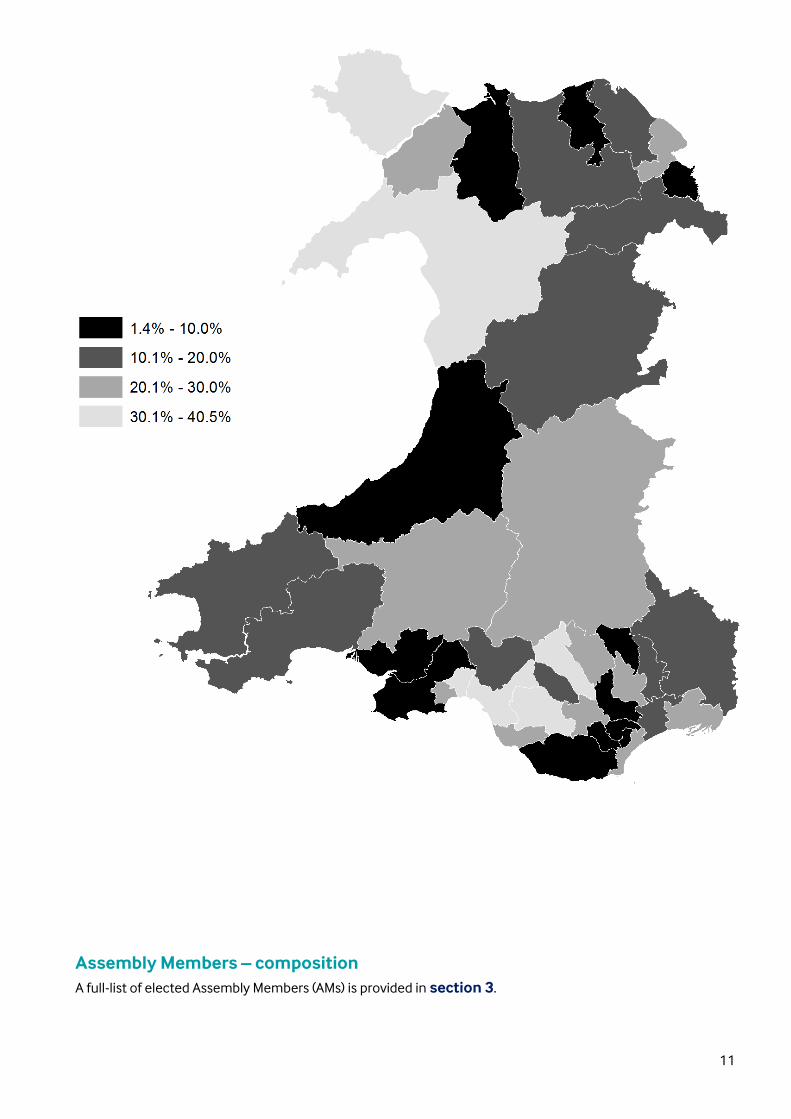
11
Assembly Members – composition
A full-list of elected Assembly Members (AMs) is provided in section 3.

12
Of the sixty elected AMs, 25 are women and 35 are men. This is the same as at the previous election and
equates to 41.7% of Assembly members being women. In 2011 John Dixon was elected as regional Member for
South Wales Central. This would put the 2011 composition as 36 men to 24 women, however, he was found to
be ineligible to become an Assembly Member and was replaced by Eluned Parrott as Liberal Democrat
list candidate for the region.
In total, 553 candidates stood for election to the Assembly in 2016 (not adjusted for candidates who stood on
both the regional list and for constituency office). Of these, 362 (65.5%) were men and 191 (34.5%) were
women.
Women made-up 31.5% of constituency candidates but were elected to 47.5% of constituencies.
The below map shows constituencies and regions by sex of elected candidate.
Figure 10 Constituencies and regions by sex of elected member (women in red, men in blue)
New AMs
There are 22 new AMs in the Fifth Assembly. There are 11 new constituency AMs due to incumbent AMs
standing down. The only constituency to change hands went to a candidate previously serving as Regional AM
for South Wales Central. Out of the 20 regional seats, there are 11 new AMs. This includes Dai Lloyd who was
previously elected in the First, Second and Third Assemblies.

13
Turnout
The 2011 election was the highest turnout since 1999.
The definition of turnout used in this paper is the valid votes cast as a percentage of the electorate.
As at 18 April there were approximately 2.25 million registered voters in Wales. Of these individuals, over 1.02
million voted in the 5 May 2016 National Assembly elections.
Turnout was 4% points higher than in 2011 and 1% point below the highest turnout (in 1999).
The below graphic shows turnout statistics in Wales, since the Welsh Assembly Referendum in 1997.
Figure 11 Turnout in Wales since 1997
Turnout based on valid votes was 45.4%. This is lower than the 2015 General Election (65.7%) but up 4% points
on the 2011 National Assembly election (41.4%).
At constituency level, Ceredigion saw the highest turnout (57.6%) of any constituency, while Alyn and Deeside
had the lowest (34.6%). The highest ever constituency turnout was in Carmarthen East and Dinefwr in 1999
(60.9%). The lowest ever turnout was in Alyn and Deeside in 2003 (24.9%).
Turnout increased in every constituency except for Alyn and Deeside, where it fell by 2.3% points from 36.9%
in 2011 to 34.6% in 2016. The largest increase in turnout was in the Rhondda in 2011, where it rose from
38.1% to 47.2% in 2016 (9.1%).
Figure 12Turnout by constituency (Highest in dark, lowest in light)

14
15
Detailed election results
Table 2 Summary of voting in Wales: Overall
16

17
18
Table 3 Constituency Results

19
Table 4 Constituency results, change in share of vote, electorate and turnout
Table 5 Constituency results, share of vote and majority, percentage of total valid votes cast
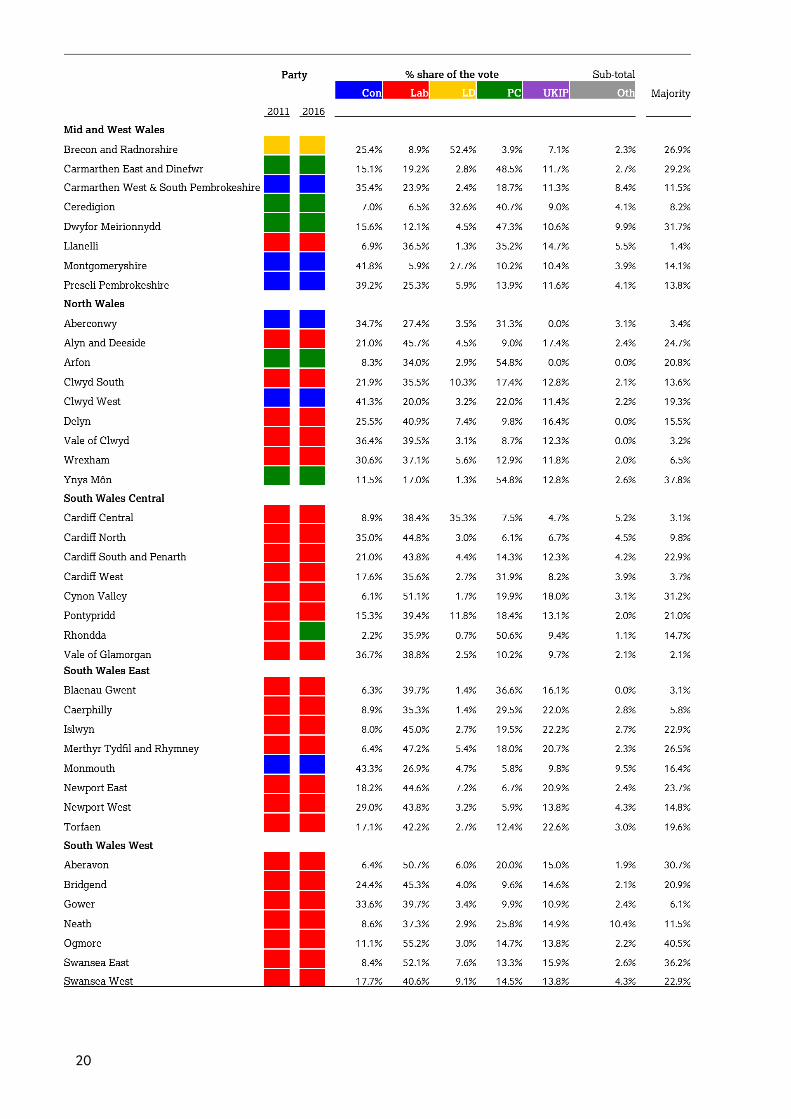
20
21
Table 6 Regional results and share of vote
Table 7 Variation between share of constituency and regional ballot votes

22
Table 8 Regional table - Seats and change in seats

23

24
Table 9 Regional table – Change in share of the vote, turnout comparisons with 2011 results

25
Table 11 Regional table - Votes, including minor parties and independent candidates (see section 4 for party codes)

26
Table 12 Elected Members

27

28
Source and Notes
Data sources – votes
Where available, the number of votes cast for each party in 2016 is taken from the information provided by
local authorities through Returning Officers and verified using data from the Press Association and the BBC.
Other historical election results used in this paper are based on official results provided by the Electoral
Commission.
Data sources – electorate and turnout
Returning Officers and the Press Association have provided data relating to turnout, this has been verified
using data from the BBC.
Turnout has been calculated as valid votes as a percentage of the electorate. Spoilt ballots or rejected ballots
are not included in the calculation.
Key to party codes
Each registered part has a short code as shown below. In many tables within this publication parties other than
Conservative, Labour, Liberal Democrat, Plaid Cymru and UKIP are combined in grey as ‘other’ parties, with
short code ‘oth’.