research article usage of fuzzy spatial theory for...
TRANSCRIPT
Hindawi Publishing CorporationAdvances in Fuzzy SystemsVolume 2013, Article ID 506406, 7 pageshttp://dx.doi.org/10.1155/2013/506406
Research ArticleUsage of Fuzzy Spatial Theory for Modelling ofTerrain Passability
Alois Hofmann,1 Sarka Hoskova-Mayerova,2 and Vaclav Talhofer1
1 Department of Military Geography and Meteorology, Faculty of Military Technology, University of Defence, Kounicova 65,66210 Brno, Czech Republic
2 Department of Mathematics and Physics, Faculty of Military Technology, University of Defence, Kounicova 65,662 10 Brno, Czech Republic
Correspondence should be addressed to Sarka Hoskova-Mayerova; [email protected]
Received 14 September 2013; Accepted 10 October 2013
Academic Editor: Ferdinando Di Martino
Copyright © 2013 Alois Hofmann et al.This is an open access article distributed under the Creative Commons Attribution License,which permits unrestricted use, distribution, and reproduction in any medium, provided the original work is properly cited.
Geographic support of decision-making processes is based on various geographic products, usually in digital form, which comefrom various foundations and sources. Each product can be characterized by its quality or by its utility value for the given type oftask or group of tasks, for which the product is used.They also usually have different characteristics and thus can very significantlyinfluence the resulting analytical material.The aim of the paper is to contribute to the solution of the question of how it is possible towork with diverse spatial geographic information so that the user has an idea about the resulting product.The concept of fuzzy setsis used for representation of classes, whose boundaries are not clearly (not sharply) set, namely, the fuzzy approach in overlayingoperations realized in ESRI ArcGIS environment. The paper is based on a research project which is being solved at the Faculty ofMilitary Technologies of the University of Defence. The research deals with the influence of geographic and climatic factors on theactivity of armed forces and the Integrated Rescue System.
1. Introduction
Geographic support for decision-making processes is basedon various geographic products, usually in digital form,which come from various foundations and sources. Eachproduct can be characterized by its quality [1, 2] or by itsutility value for the given type of task or group of tasks,for which the product is used [3, 4]. In both cases, amongothers also positional and thematic accuracy are evaluatedeither as an exactly given value, for example, mean squareposition error, probable error, and so forth, or as a levelof fulfilment of user’s requirements expressed in percentage[5]. Decision-making processes are based on multicriteriadecision-making, in which many factors are involved [6]. Bya suitable combination of various factors, analytical productsare created. They are the base for answering questions suchas “What happens if. . .?” That is the reason why variousfoundations are used for geographic support. They alsousually have different characteristics and thus can very
significantly influence the resulting analytical material. Theaim of the paper is to contribute to the solution of thequestion of how it is possible to work with diverse spatialgeographic information so that the user has an idea aboutthe resulting product. The paper is based on a researchproject which is being solved at the Faculty of MilitaryTechnologies of the University of Defence. The researchdeals with the influence of geographic and climatic factorson the activity of armed forces and the Integrated RescueSystem.
Within the work on solution of the project, the problemsolving team continued with development of models ofinfluences of geographical and climatic factors on terrainpassability. In the evaluated period, the team focused ondevelopment of the theory ofmodels, onways of visualizationof vagueness of results caused by inhomogeneity of thesupport data, combining their characteristics within theperformed analyses, and so forth. For these purposes, fuzzylogic was used.
2 Advances in Fuzzy Systems
2. Vagueness of Spatial Information
Standardly used types and procedures of geoproceduralanalyses suppose that the used data are created with explicit,sharp boundaries that restrict the position of the individualobjects.
The technical quality of position setting of such bound-aries is usually given by the above-mentioned criteria, suchas mean square positional error of its determination. Thetechnical quality is based on measurement methods ordigitalization of foundation.
Boundaries of many geographical elements are, however,only a result of human perception and not of a real matter ofthings. Even in case of existence of a real discrete boundary,the boundary linemay be inaccurate due to vagueness of dataor their interpretation. Vegetation or soil types are typicalexamples of geographical elements where there are no clearnatural boundaries in space. Traditional classifications failcompletely here. However, spatial units are usually repre-sented by sharp boundaries. Brown andHeuvelink [7] suggest2 types of uncertainty that have a special importance inGIS—thematic and spatial vagueness. In the first case we are notable to confirm occurrence of the given topic in the givenplace, and in the second case it is an inability to find an exactplacement of the given topics. The formal conceptual modelof uncertainty is useful to create for effective GIS utilizationin the decision-making process [8]. Several authors tried toclassify uncertainty [9–12], but the most used classificationcan be found in the standard for spatial data transfer [13].
As people both reason andmake decisions with uncertaingeospatial data every day, it is important to understand thecomplexity of uncertainty, how it propagates through eachdataset, and how to best visualize uncertainty to supportreasoning and decision-making [14–18].
Spatial and thematic data should not be evaluated inde-pendently. The way to solve these problems is to use thetheory of “soft classifications,” among which also “fuzzy”approaches belong. Fuzzy logic is quite frequently used foruncertainty of GIS data expression in the last years and isbased on fuzzy theory [19–21].
Fuzzy sets together with the theory of fuzzy logic offer ascope for processing of predicates, whose level of probabilityis given in degrees (“true to certain degrees”) and uncertaintyis also expressed gradually. The concept of fuzzy sets dealswith representation of classes, whose boundaries are notclearly (not sharply) set. When sharp boundaries separatingthe set from the surroundings are missing, a problem ofunambiguous setting of an element belonging to a set and toits complement appears [22, 23].
Fuzzy files are then files or classes that do not have sharplimitation.With spatial data itmeans that at considered placesthe transition between the membership and nonmembershipin a file is gradual. The fuzzy file then can be characterizedby fuzzy levels of membership in an interval from 0.0 to1.0 which expresses a gradual growth of membership fromnonmembership up to the full membership. It can be definedwith the help of the membership function.
In the environment of GIS three basic types of geoele-ments are usually defined: points, lines and areas (polygons).
When we use linesm and areas we sometimes ask a questionof how to delimit boundaries of the given geoelement. If thereis an area layer which captures ecological stability of the givenarea, then there are only two possibilities of how to expressstability: stable or unstable. This classification is very difficultand it depends on the person that decides and on the concretearea.
One of the basic characteristics that can be definedwhen creating and saving geographical objects is topology.Topological relations characterize the relative placement oftwo spatial objects with respect to their mutual position—for example, if they touch, overlay, or contain one another. InGIS they are important especially for a definition of spatialquestions and selections and they play an important rolewhen language SQL is used. In case of fuzzy spatial objects,however, traditional topologic predicates fail and their fuzzyvariants come into consideration; they are able to answerinquiries such as the following.
(i) Do areas A and B overlay at least a bit?(ii) Does area A partly contain area B?(iii) Which areas are partly inside area B?
The fact that belonging of an element to a fuzzy topologi-cal predicate is expressed by a set [0, 1], however, complicatesits direct usage in language SQL and thus possible spatialinquiries.
3. Fuzzy Overlay
A concrete possibility of usage of the fuzzy approach is theapplication in overlaying operations that can be realized inthe environment of ArcGIS [24]. For this type of operationsit is nowadays possible to use tools of map algebra as well asalready implemented tools in the extension of Spatial Analyst.Fuzzy logic in the so-called “Overlay Analysis” is based ontwo fundamental steps.
The first one is the so-called “fuzzification” or “fuzzymembership,” in other words the process of implementingvalues into fuzzy sets, and the second step is the actualanalysis-overlay of these sets. It is possible to use several typesof fuzzification functions, from a linear to Gaussian function,according to the type of value distribution.
Relations among created fuzzy sets are then analysed bymeans of fuzzy overlaying operations, such as FuzzyAnd andFuzzyOr. The detailed description can be found for example,in the help file of ArcGIS Help.
Practical approaches of realization of usage of the “fuzzy”approach in analysis of geospatial data were the subject ofdevelopment of procedures of finding an optimal route withthe help of map algebra, which was suggested as one of theresults of the mentioned project. It was testing of data thatshowed positional vagueness.
4. Terrain Passability
Avery frequent task in the decision-making process in armedforces is to evaluate the possibility of vehicle movement ina terrain. This task is usually called Cross-Country Mobility
Advances in Fuzzy Systems 3
(CCM) in military language. The main goal of CCM is toevaluate the impact of geographic conditions on movementof vehicles in terrain [25, 26]. For the purpose of classificationand qualification of geographic factors of CCM, it is necessaryto determine
(i) particular degrees of CCM,(ii) typology of terrain properties evaluated by the kind
of vehicles used,(iii) geographic factors and features with significant
impact on CCM.
As a result of the geographic factors impact evaluation weget three CCMdegrees: passable terrain, passable terrainwithrestrictions, or impassable terrain.
The impact of a geographic factor can be evaluated asa coefficient of deceleration “Ci” on the scale of 0 to 1. Thecoefficient of deceleration shows the real (simulated) speedof vehicle V in the landscape in the confrontation with themaximum speed of a given vehicle Vmax. The impact of all 𝑛geographic factors can be expressed by the following formula:
V = Vmax
𝑛
∏
𝑖=1
𝐶
𝑖, 𝑛 = 1, . . . ,N. (1)
The main coefficients of deceleration are listed in Table 1.In case of searching for an optimal route within the
project, a procedure of fuzzification for calculation of coef-ficient of deceleration𝐶
3(influence of soil and ground cover)
was looked for. The initial data layer was a raster layer ofcoefficient 𝐶
3, where there are 3 values for passable (1),
passable with difficulty (0.5), and impassable terrain (0).From the point of view of the input data—that is, area ofsoil types and kinds—a presumption was introduced that theboundary of passability will not be sharp according to theoriginal data basis but it will change its value in the distanceof 100m to both sides. Based on this presumption, fuzzy setswere created with the use of several raster techniques andtheir overall influence was analysed.
In the next step, possibilities of analysis of several resultedsets were tested by theirmutual interaction (overalls) throughvarious methods. The solution of the problem, however,was not finished in such a way so that it was possibleto prove the change of course of the found route due tovagueness. The authors suppose that the stated results willbe further developed in the years to come when solvingthe project and their successive transfer to models withvagueness consideration. The way of solution is discussed inthe following paragraphs.
5. Development of Creation of CCM ModelsUsing Fuzzy Logic
Six basic models were created for searching of the way. Withthe help of thesemodels it is possible to create a so-calledCostMap, which is a raster file that is the basic input informationfor creation of the file of the searched route. The cost map ismade by application of overlaying operations or in this casewith the use of the so-called map algebra that provides tools
Table 1: Main coefficients of deceleration.
Basic coefficient Geographic signification and impact
𝐶
1
Terrain relief (gradient of terrain relief andmicrorelief shapes)
𝐶
2Vegetation cover
𝐶
3Soils and soil cover
𝐶
4Weather and climate
𝐶
5Hydrology
𝐶
6Built-up area
𝐶
7Road network
for working with raster files. To set the overall coefficient ofdecelerationwhenmoving through terrain, relations stated inthe elaborated methodology were used.
Models for calculation of individual coefficients werecompiled with the help of basic operations with raster data bymeans of implemented tools of the so-called Spatial Analyst,which is an extension of ArcGIS system, as well as using atool of the so-called map algebra, that is, a set of operatorsand functions for work with raster data.
Raster layers were used as input data. The layers werecreated by calculation (e.g., a high raster model) or bya conversion of vector data according to the appropriateattributes. This data base was created as explicit data withclearly defined objects and their boundaries.
Another step when solving CCM problem is theintroduction of some uncertainty causing a greater activityin decision-making about the use of the gained results. Foreach coefficient of deceleration, a new process model wasmade, in which principles of fuzzy logic were applied. Forsolution of the individual models, various approaches had tobe used with respect to the character of input data and resultthat shall be reached.
5.1. Creation of Models for the Individual Coefficients. In thefollowing text are briefly discussed procedures of calcula-tion of the individual coefficients of deceleration that wererealized in the environment of ArcGIS.
5.1.1. Coefficient of Deceleration due to Elevation of Terrain.Layers of relief and objects of microrelief are taken as sourcedata.The compiled model is created from a layer of relief thatwas calculated with the help of raster interpolation and layersof point, line, and polygons.
In case of raster relief, the value of height is determinedfor each individual pixel of high area. In this case for itsfuzzification we used data about the height range of theheight model and setting of boundary for determination ofimpassability for the given means of transport.
For other layers the procedure is based on severalsubsteps. The first step is the conversion of the layer in araster and its editing. Data about height and depth of anobject were used to convert height objects to a raster format.During the conversion of a vector into a raster it happens thatthe individual objects are converted into a set of pixels witha value of an attribute, according to which the conversion

4 Advances in Fuzzy Systems
is realized (e.g., hgt, which is a height of an object). Allsurrounding pixels are marked with attribute NoData. Thesepixels would not enter into the calculation of the cost mapnot only of this but also of all other overlaying raster layers.The editing is testing of individual pixels for attribute NoData(by function IsNull) and assigning value 0 to all found pixels.Thus it is secured that all pixels outside height objects have azero value which is later used when creating the “Cost Map”.This procedure is applied also for other input layers.
The second step is a conversion of values “integer”raster to values in a real domain so that the operation of“fuzzification” could be initiated, that is, implementing ofvalues of the raster into a “fuzzy set” with the help of oneof the “fuzzification” functions. The input raster was in thesecases divided by the value 10.0 so that a raster with real valueswas created. For verification of the “fuzzy” approach to thisproblem, only linear function was used so far in all phases ofcalculation.
The third step of the solution is the use of “fuzzy” setsfor application of vagueness in the position of the giventypes of objects. This problem is solved with the help ofcalculation of “Euclidean” distance for each type of objects.Placing values of distance into “fuzzy” sets uses once againa linear function with setting of various values of maximumdistance. It depends on the values of four classes of accuracythat the database creator gives [27]:
(i) <0.5meter for geodetic points,(ii) <3metres for stable objects,(iii) <10metres for other objects,(iv) <20metres for unstable objects.
Apart from these values it is necessary to consider also thesize of a pixel that is used for conversion of vector drawing toa raster. The above stated values make sense in case the sizeof a pixel is maximally 1 meter.
For comparison, cost maps were created with a pixelvalue of 5 metres and fuzzification of distance was in onecase chosen the same as the size of a pixel (which actuallyrepresents a sharp boundary and thus it does not get blurred)and in another case the distances are chosen mostly as 100mbesides calculation of factors 𝐶
6and 𝐶
7where the value was
reduced to 30m with respect to the character of objects.The last step for most calculated factors is a combination
of the gained results with the help of the so-called “FuzzyOverlay,” that is, weighted “fuzzy” overlay of the individualraster layers (within calculation of factor 𝐶
1).
Overlay can be realized with the use of various logicaloperations, in the case of logical sum “OR” that made surethe highest value from the overlaying rasters was written intothe resulting pixel; in most cases it was value “1” representingbasically impassable terrain (see Figures 1 and 2 in detail).
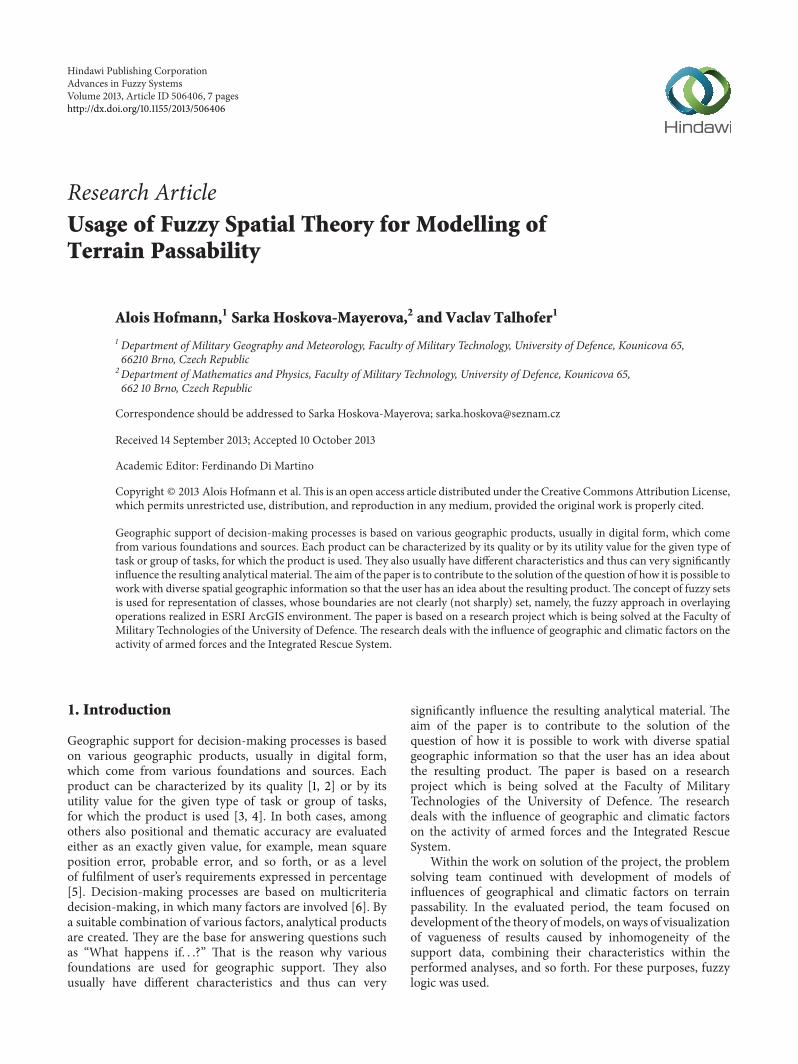
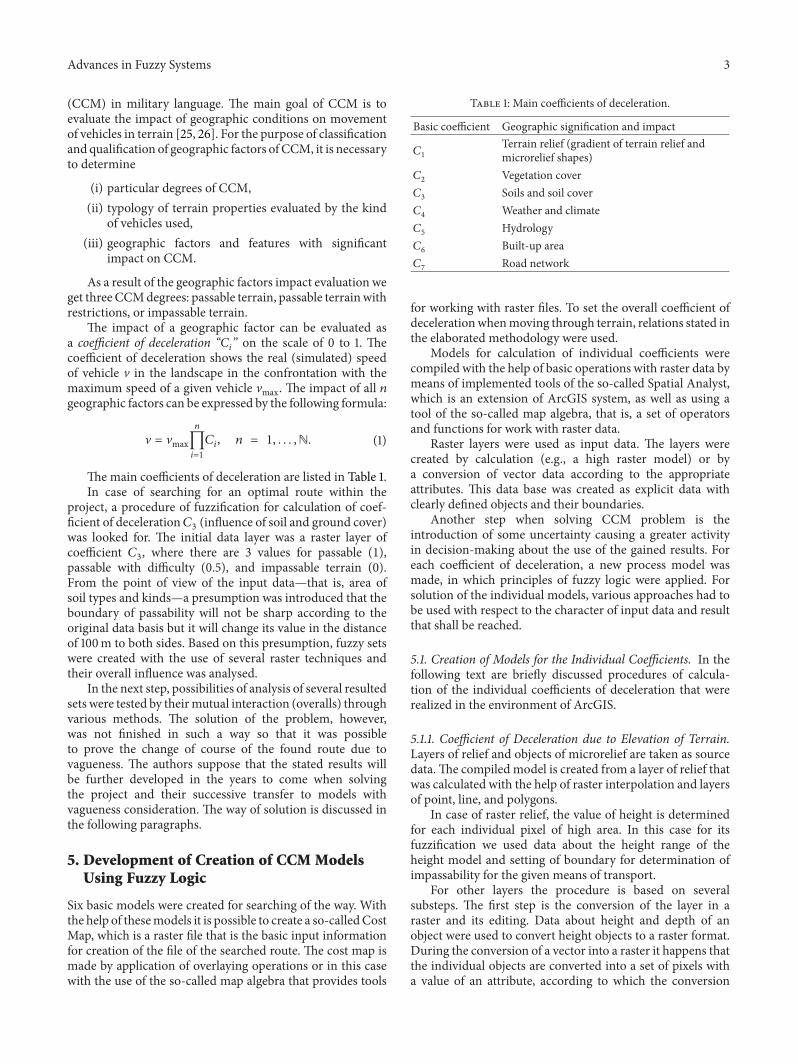
5.1.2. Coefficient of Deceleration due to Vegetation. In case ofvegetation, the type of vegetation is significant information.If it is vegetation with grown trees, information about trunkcross-section and spacing between trees are taken as param-eters. For fuzzification, such a procedure was chosen that
Figure 1: Visualization of calculation results of coefficient 𝐶1.
Figure 2: Visualization of calculation results of coefficient𝐶1-detail.
stems from classification of vegetation according to a valueof these parameters and introduction of geometric vaguenessof boundaries of in this way classified vegetation. The resultis a layer, in which appropriate values are assigned to areasand their boundaries are blurred with the help of a distancefunction and their values change depending on the type offuzzification method (Figures 3 and 4).
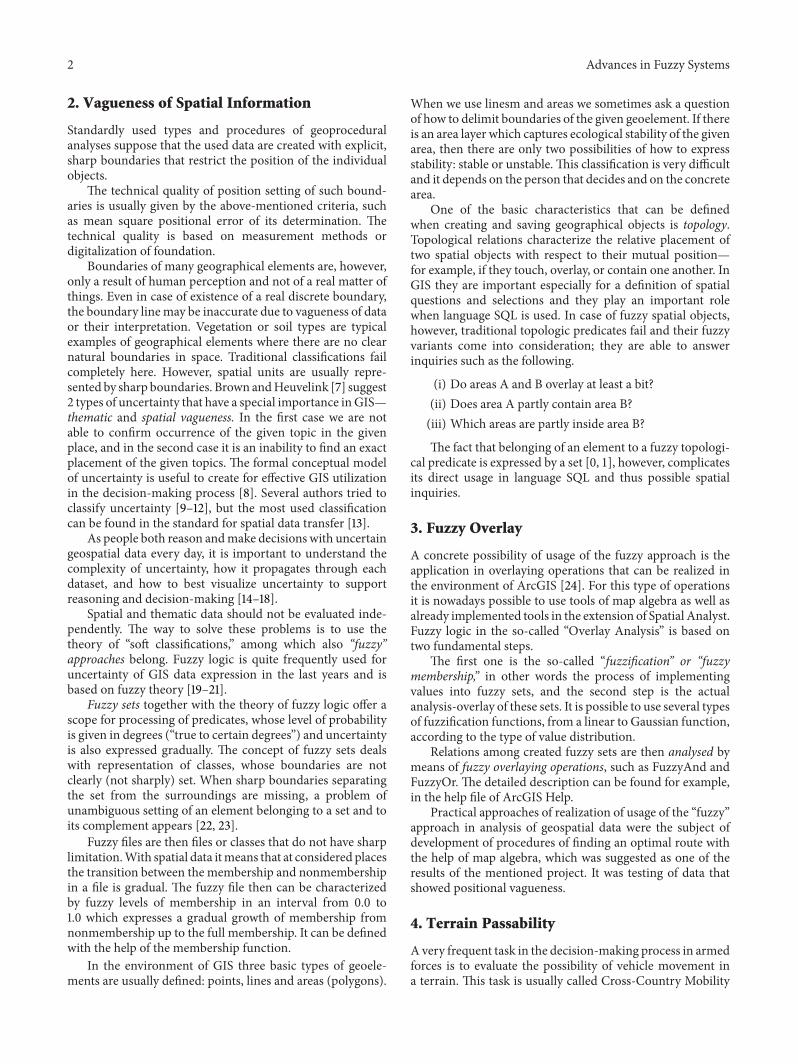
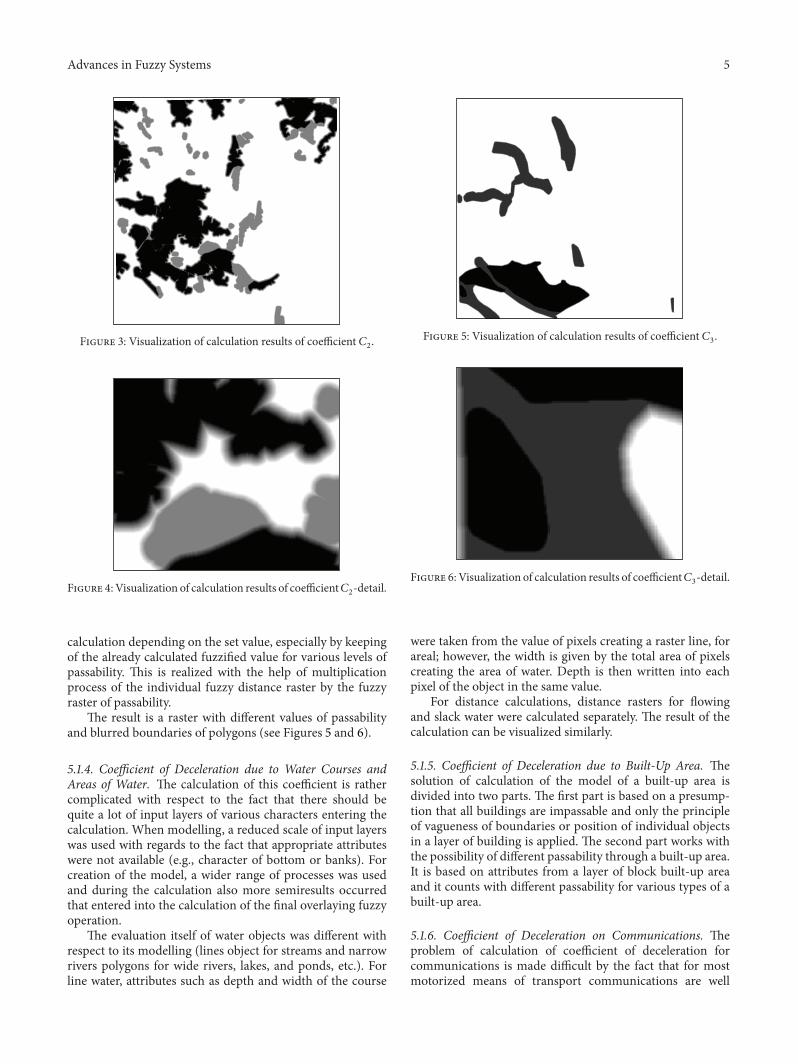
5.1.3. Coefficient of Deceleration due to Soils. For calculatingthis coefficient, attributes soil type, soil kind, andmatrix wereused. Using logical operators helped to determine passabilityof soils in four values (1, 2, 3, and 4). For fuzzification aprocedure that is based on these values was used togetherwith application of the general steps stated before, with thedifference in vegetation lying in the method of creation ofvague boundaries of the individual classes of soil polygons.In this case, these classes had to be transformed intoindependent layers for which distance rasters for blurringof their boundaries were calculated. Unlike the previousvalues of accuracy that were applied for all other factors ofdeceleration, boundaries for blurring with soils were chosento be 100m with respect to the character of this geographicalelement. The calculated raster entered into other steps of
Advances in Fuzzy Systems 5
Figure 3: Visualization of calculation results of coefficient 𝐶2.
Figure 4: Visualization of calculation results of coefficient𝐶2-detail.
calculation depending on the set value, especially by keepingof the already calculated fuzzified value for various levels ofpassability. This is realized with the help of multiplicationprocess of the individual fuzzy distance raster by the fuzzyraster of passability.
The result is a raster with different values of passabilityand blurred boundaries of polygons (see Figures 5 and 6).
5.1.4. Coefficient of Deceleration due to Water Courses andAreas of Water. The calculation of this coefficient is rathercomplicated with respect to the fact that there should bequite a lot of input layers of various characters entering thecalculation. When modelling, a reduced scale of input layerswas used with regards to the fact that appropriate attributeswere not available (e.g., character of bottom or banks). Forcreation of the model, a wider range of processes was usedand during the calculation also more semiresults occurredthat entered into the calculation of the final overlaying fuzzyoperation.
The evaluation itself of water objects was different withrespect to its modelling (lines object for streams and narrowrivers polygons for wide rivers, lakes, and ponds, etc.). Forline water, attributes such as depth and width of the course
Figure 5: Visualization of calculation results of coefficient 𝐶3.
Figure 6: Visualization of calculation results of coefficient𝐶3-detail.
were taken from the value of pixels creating a raster line, forareal; however, the width is given by the total area of pixelscreating the area of water. Depth is then written into eachpixel of the object in the same value.
For distance calculations, distance rasters for flowingand slack water were calculated separately. The result of thecalculation can be visualized similarly.
5.1.5. Coefficient of Deceleration due to Built-Up Area. Thesolution of calculation of the model of a built-up area isdivided into two parts. The first part is based on a presump-tion that all buildings are impassable and only the principleof vagueness of boundaries or position of individual objectsin a layer of building is applied. The second part works withthe possibility of different passability through a built-up area.It is based on attributes from a layer of block built-up areaand it counts with different passability for various types of abuilt-up area.
5.1.6. Coefficient of Deceleration on Communications. Theproblem of calculation of coefficient of deceleration forcommunications is made difficult by the fact that for mostmotorized means of transport communications are well
6 Advances in Fuzzy Systems
Input trueraster orconstant
Input trueraster orconstant
Input trueraster orconstant
Input falseraster orconstant
Input falseraster orconstant
Input falseraster orconstant
Con
Con (2)
Con (3)
C311
C312
C313
Fuzzymembership
Weather
Rastercalculator (2)
Fuzzymembership (3)
Fuzzymembership (2)
FC312
FC313
Fuzzy overlay 311
P P
FuzzyOv FC
FC311
Soiltype
Raster calc 1
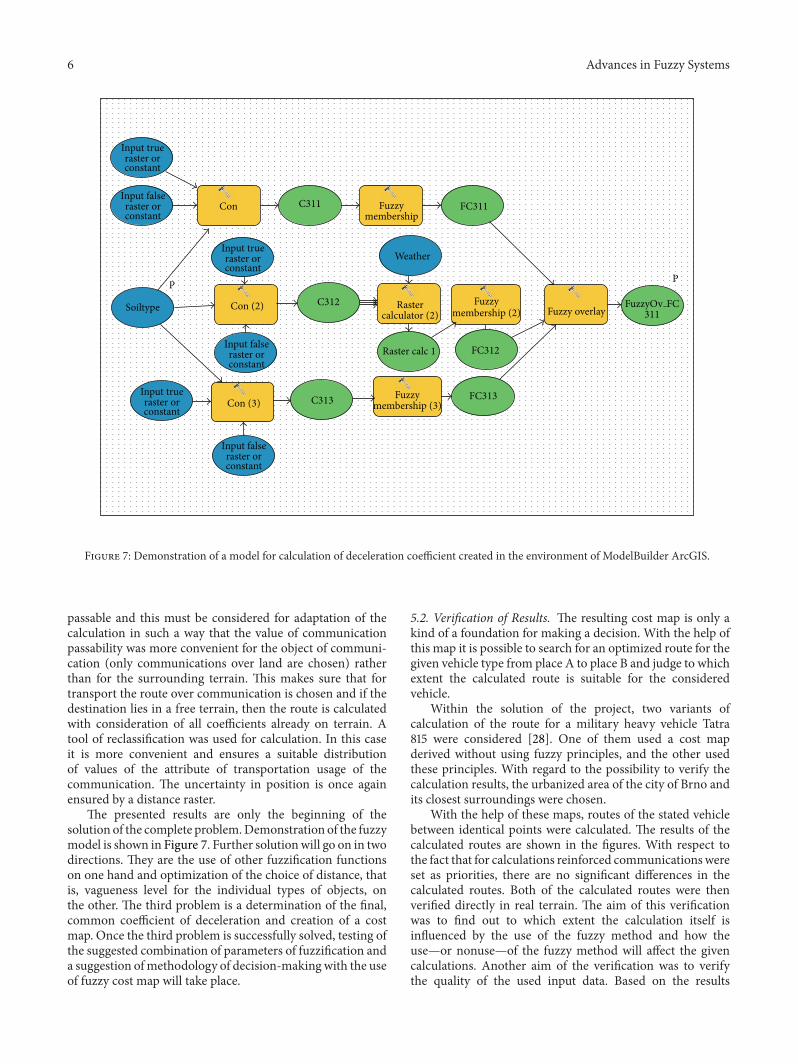
Figure 7: Demonstration of a model for calculation of deceleration coefficient created in the environment of ModelBuilder ArcGIS.
passable and this must be considered for adaptation of thecalculation in such a way that the value of communicationpassability was more convenient for the object of communi-cation (only communications over land are chosen) ratherthan for the surrounding terrain. This makes sure that fortransport the route over communication is chosen and if thedestination lies in a free terrain, then the route is calculatedwith consideration of all coefficients already on terrain. Atool of reclassification was used for calculation. In this caseit is more convenient and ensures a suitable distributionof values of the attribute of transportation usage of thecommunication. The uncertainty in position is once againensured by a distance raster.
The presented results are only the beginning of thesolution of the complete problem.Demonstration of the fuzzymodel is shown in Figure 7. Further solutionwill go on in twodirections. They are the use of other fuzzification functionson one hand and optimization of the choice of distance, thatis, vagueness level for the individual types of objects, onthe other. The third problem is a determination of the final,common coefficient of deceleration and creation of a costmap. Once the third problem is successfully solved, testing ofthe suggested combination of parameters of fuzzification anda suggestion ofmethodology of decision-makingwith the useof fuzzy cost map will take place.
5.2. Verification of Results. The resulting cost map is only akind of a foundation for making a decision. With the help ofthis map it is possible to search for an optimized route for thegiven vehicle type from place A to place B and judge to whichextent the calculated route is suitable for the consideredvehicle.
Within the solution of the project, two variants ofcalculation of the route for a military heavy vehicle Tatra815 were considered [28]. One of them used a cost mapderived without using fuzzy principles, and the other usedthese principles. With regard to the possibility to verify thecalculation results, the urbanized area of the city of Brno andits closest surroundings were chosen.
With the help of these maps, routes of the stated vehiclebetween identical points were calculated. The results of thecalculated routes are shown in the figures. With respect tothe fact that for calculations reinforced communicationswereset as priorities, there are no significant differences in thecalculated routes. Both of the calculated routes were thenverified directly in real terrain. The aim of this verificationwas to find out to which extent the calculation itself isinfluenced by the use of the fuzzy method and how theuse—or nonuse—of the fuzzy method will affect the givencalculations. Another aim of the verification was to verifythe quality of the used input data. Based on the results
Advances in Fuzzy Systems 7
of the terrain research it is possible to say that in cityagglomerations where there is a sufficient net of qualityreinforced communications using fuzzy principles is almostunnecessary and if sufficient quality input data are used, it ismore effective to use the method of sharp boundaries for thecalculation of a cost map.
Another situation, however, can happen outside urban-ized areas where the net of reinforced communications isscarce and where there are a lot of forests, fields, and so forth.This fact occurred only on the edge of the researched area.That is the reason why the team for solution will focus on thistype of countryside in the following steps.
Acknowledgment
The work presented in this paper was supported withinthe project for Development of Military Geography andMeteorology and for Support for Mathematical and PhysicalResearch supported by the Ministry of Defence of the CzechRepublic.
References
[1] ISO, ISO 19113—Geographic Information—Quality Principles,International Organization for Standardization, 2002, http://www.iso.org/iso/home/storecatalogue tc/catalogue detail.htm?csnumber=26018.
[2] ISO, ISO 19138—Geographic Information—Data Quality Meas-ures, Interational Organization for Standardization, 2006,http://www.iso.org/iso/catalogue detail.htm?csnumber=32556.
[3] V. Talhofer and A. Hofmann, “Possibilities of evaluation ofdigital geographic data quality and reliability,” in Proceedigs ofthe 24th International Cartographic Conference, theWorld’s Geo-Spatial Solutions, pp. 1–11, ICA/ACI, Santiago de Chilie, Chile,2009.
[4] V. Talhofer, S. Hoskova-Mayerova, and A. Hofmann, “Improve-ment of digital geographic data quality,” International Journal ofProduction Research, vol. 50, no. 17, pp. 4846–4859, 2012.
[5] V. Talhofer, S. Hoskova, V. Kratochvil, and A. Hofmann,“Geospatial data quality,” in International Conference on Mili-tary Technologies (ICMT ’09), pp. 570–578, Univerzita obrany,Brno, Czech Republic, 2009.
[6] V. Kovarık, “Use of spatial modelling to select the helicopterlanding sites,” Advances in Military Technology, vol. 8, no. 2, pp.1–10, 2013.
[7] J. D. Brown and G. B. M. Heuvelink, “The data uncertaintyengine (DUE): a software tool for assessing and simulatinguncertain environmental variables,” Computers & Geosciences,vol. 33, no. 2, pp. 172–190, 2007.
[8] R. Abbaspour, R. Mahmoud, K. Delavar, and B. Reihaneh, “Theissue of uncertainty propagation in spatial decision making,”in Proceedings of the 9th Scandinavian Research Conference onGeographical Information Science (ScanGIS ’03), K. V. Tveite,Ed., pp. 57–65, Department of Surveying, Helsinki Universityof Technology, Espoo, Finland, 2003.
[9] M. F. Goodchild, S. Guoqing, and Y. Shiren, “Development andtest of an errormodel for categorical data,” International Journalof Geographical Information Systems, vol. 6, no. 2, pp. 87–104,1992.
[10] G. Hunter, Handling Uncertainty in Spatial Database [Ph.D.thesis], Department of Surveying and Land Information, Uni-versity of Melbourne, Melbourne, Australia, 1993.
[11] O. Kremenova, Fuzzy Modeling of Soil Maps, University ofTechnology, Helsinky, Finland, 2004.
[12] P. Kubıcek and C. Sasinka, “Thematic uncertainty visualizationusability—comparison of basic methods,” Annals of GIS, vol. 17,no. 4, pp. 253–263, 2011.
[13] NIST, Spatial Data Transfer Standard (FIPS 173), NationalInstitute of Standards and Technology, US Department ofCommerce, Washington, DC, USA, 1992.
[14] P. D’Amico, F. Di Martino, and S. Sessa, “A GIS as a decisionsupport system for planning sustainabel mobility in a case-study,” in Multicriteria and Multiagend Decision Making withApplications to Economics and Social Sciences, A. Ventre, A.Maturo, S. Hoskova-Mayerova, and J. Kacprzyk, Eds., Studiesin Fuzziness and Soft Computing, pp. 115–128, Springer, Berlin,Germany, 2013.
[15] F. De Felice and A. Petrillo, “Decision making analysis toimprove public participation in stategic energy productionmanagement,” inMulticriteria andMultiagend DecisionMakingwith Applications to Economics and Social Sciences, A. Ventre,A.Maturo, S. Hoskova-Mayerova, and J. Kacprzyk, Eds., Studiesin Fuzziness and Soft Computing, pp. 129–142, Springer, Berlin,Germany, 2013.
[16] N. Gershon, “Visualization of an imperfect world,” IEEE Com-puter Graphics and Applications, vol. 18, no. 4, pp. 43–45, 1998.
[17] A. MacEachren, “Visualizing uncertain inforamtion,” Carto-graphic Perspectives, vol. 13, pp. 10–19, 1992.
[18] J. Smith, D. Retchless, C. Kinkeldey, and A. Klippel, “Beyondthe surface: current issues and future irections in uncertaintyvisualization research,” in Proceedigs of the 26th InternationalCartographic Conference, pp. 1–10, ICA, Dresden, Germany,2013.
[19] B. Ahmad and A. Kharal, “Fuzzy sets fuzzy s-open and s-closedmappings,” Advances in Fuzzy Systems, vol. 2009, Article ID303042, 5 pages, 2009.
[20] F. Di Martino, V. Loia, and S. Sessa, “Fuzzy transforms methodin prediction data analysis,” Fuzzy Sets and Systems, vol. 180, no.1, pp. 146–163, 2011.
[21] L. A. Zadeh, “Fuzzy sets,” Information and Control, vol. 8, no. 3,pp. 338–353, 1965.
[22] F. Di Martino and S. Sessa, “Spatial analysis and fuzzy relationequations,” Advances in Fuzzy Systems, vol. 2011, Article ID429498, 14 pages, 2011.
[23] I. Cristea and S. Hoskova, “Fuzzy pseudotopological hyper-groupoids,” Iranian Journal of Fuzzy Systems, vol. 6, no. 4, pp.11–19, 2009.
[24] ESRI, “User documentation,” Copyright © 1995-2013 Esri.[25] M. Rybansky, Cross-Country Movement, the Imapct and Evalu-
ation of Geographic Factors, Akademicke nakladatelstvı CERM,s.r.o. Brno, Brno, Czech Republic, 1st edition, 2009.
[26] M. Rybansky and M. Vala, “Relief impact on transport,” inInternational Conference on Military Technologies (ICMT ’09),pp. 551–559, University of Defence, Brno, Czech Republic, 2010.
[27] MoD-GeoS, Catalogue of the Topographic Objects DMU25,Ministry of Defence of the Czech Republic, Geographic Service,Dobruska, Czech Republic, 7.3 edition, 2010.
[28] Tatra, Tatra is the solution. (Tatra, a.s.), TATRA, 2010, http://partners.tatra.cz/exter pr/vpnew/typovy listprospekt.asp?kod=341&jazyk=CZ.

Submit your manuscripts athttp://www.hindawi.com
Computer Games Technology
International Journal of
Hindawi Publishing Corporationhttp://www.hindawi.com Volume 2014
Hindawi Publishing Corporationhttp://www.hindawi.com Volume 2014
Distributed Sensor Networks
International Journal of
Advances in
FuzzySystems
Hindawi Publishing Corporationhttp://www.hindawi.com
Volume 2014
International Journal of
ReconfigurableComputing
Hindawi Publishing Corporation http://www.hindawi.com Volume 2014
Hindawi Publishing Corporationhttp://www.hindawi.com Volume 2014
Applied Computational Intelligence and Soft Computing
Advances in
Artificial Intelligence
Hindawi Publishing Corporationhttp://www.hindawi.com Volume 2014
Advances inSoftware EngineeringHindawi Publishing Corporationhttp://www.hindawi.com Volume 2014
Hindawi Publishing Corporationhttp://www.hindawi.com Volume 2014
Electrical and Computer Engineering
Journal of
Journal of
Computer Networks and Communications
Hindawi Publishing Corporationhttp://www.hindawi.com Volume 2014
Hindawi Publishing Corporation
http://www.hindawi.com Volume 2014
Advances in
Multimedia
International Journal of
Biomedical Imaging
Hindawi Publishing Corporationhttp://www.hindawi.com Volume 2014
ArtificialNeural Systems
Advances in
Hindawi Publishing Corporationhttp://www.hindawi.com Volume 2014
RoboticsJournal of
Hindawi Publishing Corporationhttp://www.hindawi.com Volume 2014
Hindawi Publishing Corporationhttp://www.hindawi.com Volume 2014
Computational Intelligence and Neuroscience
Industrial EngineeringJournal of
Hindawi Publishing Corporationhttp://www.hindawi.com Volume 2014
Modelling & Simulation in EngineeringHindawi Publishing Corporation http://www.hindawi.com Volume 2014
The Scientific World JournalHindawi Publishing Corporation http://www.hindawi.com Volume 2014
Hindawi Publishing Corporationhttp://www.hindawi.com Volume 2014
Human-ComputerInteraction
Advances in
Computer EngineeringAdvances in
Hindawi Publishing Corporationhttp://www.hindawi.com Volume 2014