mathematical modeling of spatial disease variables … · mathematical modeling of spatial disease...
TRANSCRIPT
MATHEMATICAL MODELING OF SPATIAL DISEASE VARIABLES BY SPATIALFUZZY LOGIC FOR SPATIAL DECISION SUPPORT SYSTEMS
M. Platza,∗, J. Rappa, M. Groesslera, E. Niehausa, A. Babub, B. Somanc
a University of Koblenz-Landau. Institute of Mathematics, Fortstr. 7, 76829 Landau, Germany- (platz, rapp, groessler, niehaus)@uni-landau.de
b Center for Advancement of Global Health, Kochi, India & Saint Louis University, St. Louis, USA - [email protected] Sree Chitra Tirunal Institute for Medical Sciences, Thiruvananthapuram, Kerala, India - [email protected]
KEY WORDS: Mathematical Modeling, Risk Mitigation, Spatial Decision Support System (SDSS), Spatial Fuzzy Logic, Early Warn-ing and Response System (EWARS), Open Source
ABSTRACT:
A Spatial Decision Support System (SDSS) provides support for decision makers and should not be viewed as replacing human intelli-gence with machines. Therefore it is reasonable that decision makers are able to use a feature to analyze the provided spatial decisionsupport in detail to crosscheck the digital support of the SDSS with their own expertise. Spatial decision support is based on risk andresource maps in a Geographic Information System (GIS) with relevant layers e.g. environmental, health and socio-economic data.Spatial fuzzy logic allows the representation of spatial properties with a value of truth in the range between 0 and 1. Decision makerscan refer to the visualization of the spatial truth of single risk variables of a disease. Spatial fuzzy logic rules that support the allocationof limited resources according to risk can be evaluated with measure theory on topological spaces, which allows to visualize the appli-cability of this rules as well in a map. Our paper is based on the concept of a spatial fuzzy logic on topological spaces that contributesto the development of an adaptive Early Warning And Response System (EWARS) providing decision support for the current or futurespatial distribution of a disease. It supports the decision maker in testing interventions based on available resources and apply riskmitigation strategies and provide guidance tailored to the geo-location of the user via mobile devices. The software component of thesystem would be based on open source software and the software developed during this project will also be in the open source domain,so that an open community can build on the results and tailor further work to regional or international requirements and constraints. Afreely available EWARS Spatial Fuzzy Logic Demo was developed wich enables a user to visualize risk and resource maps based onindividual data in several data formats.
1. INTRODUCTION
In this article, decision support for the user is considered; forexample in the context of a hazardous situation, such as the epi-demiological outbreak of a disease, ecotoxicological or radioac-tive exposure or an accident situation. For this purpose we haveto generate risk and resource maps, as well as adaptive GraphicalUser Interfaces (GUIs) tailored to different user groups, that sup-port the comprehension of the spatial sense for optimal decisionsupport. The demand for an adaptive GUI arises from the differ-ing needs of various user groups. These groups can include, forexample, decision makers such as governmental facilities, PublicHealth Agency (PHA)s, vector control units, medical doctors andnurses or users who find themselves in hazardous situations. Inthis paper, we focus on decision makers (e.g. a governmental fa-cility) and users who are in a hazardous situation. Consequently,we have the following requirements: The decision maker wantsto know where to locate resources, and users in hazardous situa-tions want to know how they can protect themselves. Therefore,risk and resource maps are required. The terms “risk” and “re-source” are defined as follows:“Risk is a quality that reflects both the range of possible outcomesand the distribution of respective probabilities for each of the out-comes.” (Norrman and Jansson, 2004). This can be expressed:
Risk = Probability (of an event) · Impact (or severity) of an event(1)
(Norrman and Jansson, 2004).“A Resource is something that can be used for support or help, anavailable supply that can be drawn on when needed.” (The Amer-
∗Corresponding author
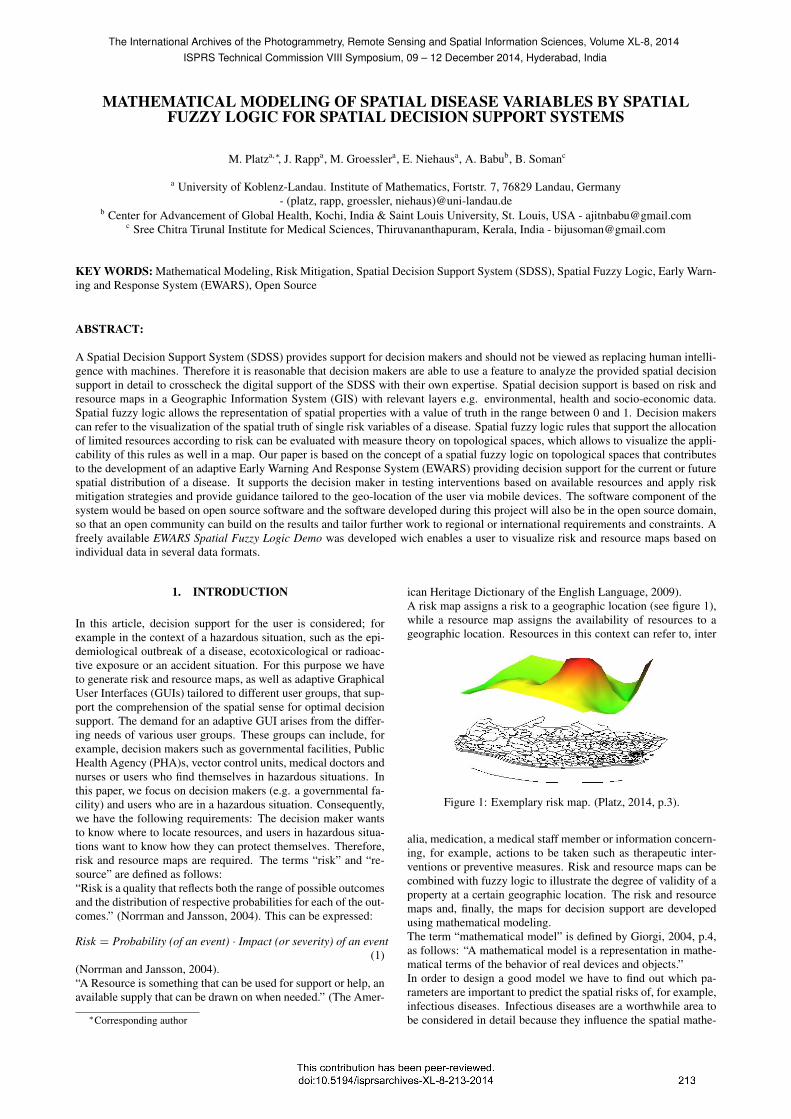
ican Heritage Dictionary of the English Language, 2009).A risk map assigns a risk to a geographic location (see figure 1),while a resource map assigns the availability of resources to ageographic location. Resources in this context can refer to, inter
Figure 1: Exemplary risk map. (Platz, 2014, p.3).
alia, medication, a medical staff member or information concern-ing, for example, actions to be taken such as therapeutic inter-ventions or preventive measures. Risk and resource maps can becombined with fuzzy logic to illustrate the degree of validity of aproperty at a certain geographic location. The risk and resourcemaps and, finally, the maps for decision support are developedusing mathematical modeling.The term “mathematical model” is defined by Giorgi, 2004, p.4,as follows: “A mathematical model is a representation in mathe-matical terms of the behavior of real devices and objects.”In order to design a good model we have to find out which pa-rameters are important to predict the spatial risks of, for example,infectious diseases. Infectious diseases are a worthwhile area tobe considered in detail because they influence the spatial mathe-
The International Archives of the Photogrammetry, Remote Sensing and Spatial Information Sciences, Volume XL-8, 2014ISPRS Technical Commission VIII Symposium, 09 – 12 December 2014, Hyderabad, India
matical modeling of public health issues. In this regard we haveto model the distribution of resources and combine the risk mapswith maps of available resources for optimal decision support andearly warning and response. To develop a risk map for a disease,accurate information about the disease is essential, for examplethe transmission of the disease. Furthermore, treatment, preven-tion and possible mitigation strategies for the disease are consid-ered, because if this information is communicated to the popu-lation via an appropriate communication channel it may help toreduce the spreading of the disease. The risk, resource and deci-sion support maps are processed and visualized using a GIS. Spa-tial decision support can be derived and delivered via Informationand Communication Technology (ICT), for example mobile de-vices (e.g. smartphones) using an adaptive GUI, in areas whereits distribution within the target audience is high.Platz, 2014, deals with the mathematical modeling of GIS-tailoredGUI design with the application of spatial fuzzy logic. She con-siders the mathematical visualization of risk and resource mapsfor epidemiological issues using GIS and adaptive GUI designfor an open source application for digital devices. The intentionof Platz, 2014, is to provide spatial decision support tailored todifferent user groups.This method will be used within the EWARS and the SDSS de-scribed in this paper to adapt the information required by a userto the user’s needs.
2. OBJECTIVES
2.1 Common Objectives
The Research-Group Learning and Neurosciences (ReGLaN) -Health and Logistics project deals with interdisciplinary devel-opment aid to optimize the distribution of medical goods and ser-vices. The implementation of an EWARS and an SDSS tailoredto different user groups is aimed in form of an open source ap-plication for digital devices with an adaptive GUI. Action Team 6Follow Up Initiative (AT6FUI) deals with leveraging the potentialof space technology for global health risk mitigation and healthservice delivery.
2.2 Objectives of this Paper
This paper is based on the concept of a spatial fuzzy logic ontopological spaces that contributes to the development of an EWARSproviding decision support for a current or future spatial distribu-tion of a disease. Using this approach, it is postulated that thehealth situation can be optimized by supporting decision makersin applying risk mitigation strategies and providing guidance to auser tailored to the geo-location of the user via mobile devices.
3. METHODOLOGY
In radiation, ecotoxicology and epidemiology we have invisiblerisks. A person, who is located in a risk area needs support fornavigation and routing to minimize exposure to risk. Therefore,we deal with the questions: How can risk be made visible fora person located in a risk area and how can early warning andspatial decision support be provided to this person? How can weprovide access to resources for risk mitigation? Risk can be visu-alized with a risk map.Risk maps can be created with GIS (see sub-subsection 3.2.1) byconsidering spatial and temporal attributes, which determine theoccurrence of diseases. They visualize regions and populationgroups with high risk for e.g. the outbreak of these diseases (cf.Yang et al., 2007).Maps showing the temporal and spatial risk for the occurrence of
epidemic diseases are helpful tools for public health agencies orother institutions by supplying them with information for a Deci-sion Support System (DSS) (see sub-subsection 3.2.2). With thehelp of a DSS resources like water, vaccines or medical equip-ment can be located in an optimal way. Such risk maps were de-veloped for several factors influencing human health, for examplethe occurrence of dengue fever (cf. Hales et al., 2002), malaria(cf. Hay et al., 2004), water-associated infectious diseases (cf.Yang et al., 2012) or water scarcity (cf. Oki and Kanae 2006).Traditionally, GIS is used for route optimization in transport lo-gistics and the logistics process in supply chain management (cf.Hwang, 2004.). Hwang, 2004, shows on a developed 3D-GISsupply chain management tool the potential of a GIS in the fieldof route optimization that provides logistical optimization andhow this can be customized depending on customer requirements.As Sarkar, 2007, determined in a study on GIS applications, GIScurrently are becoming increasingly important also in other areasof logistics and resource optimization and still have great growthpotential. This he attributes to the decreasing barriers due to thelow cost of hardware and software, the increasing availability ofdigital map data and the possibility for flexible connection anduse of databases and the internet.Decision support tools have been used in public health, such asthe research group led by Garg et al., 2005, had explored in astudy. The investigated DSS tools have the task to support thedecision makers in hospitals in all treatment decisions. Becausethese decisions often have no spatial reference on the low spatiallevel of a hospital, GIS-based software is not used in the study.GIS is used as DSS because the logistic optimization of medicalresources on the high spatial level as a region or a country has avery strong spatial reference.Ricketts, 2003, sees GIS in public health as an extension of thestatistical analysis of epidemiological, sociological, clinical andeconomic data with spatial reference. According to Ricketts,2003, GIS is applied in the areas of disease distribution and pro-vision of health care in general medical resources. The two ap-plication areas with the greatest potential for Ricketts, 2003, areepidemiology and telemedicine.Yang et al., 2012, showed in a study on SDSS (see subsection3.2) that applying the SDSS in endangered areas can prevent epi-demic diseases.The core methodology demonstrated in this paper is the conceptof a spatial fuzzy logic on topological spaces that contributes tothe development of an EWARS providing decision support fora current or prospective spatial distribution of a disease. Con-sequently, the topics EWARSs, SDSSs, spatial fuzzy logic andmeasure theory on topological spaces will be addressed in moredetail.
3.1 EWARS
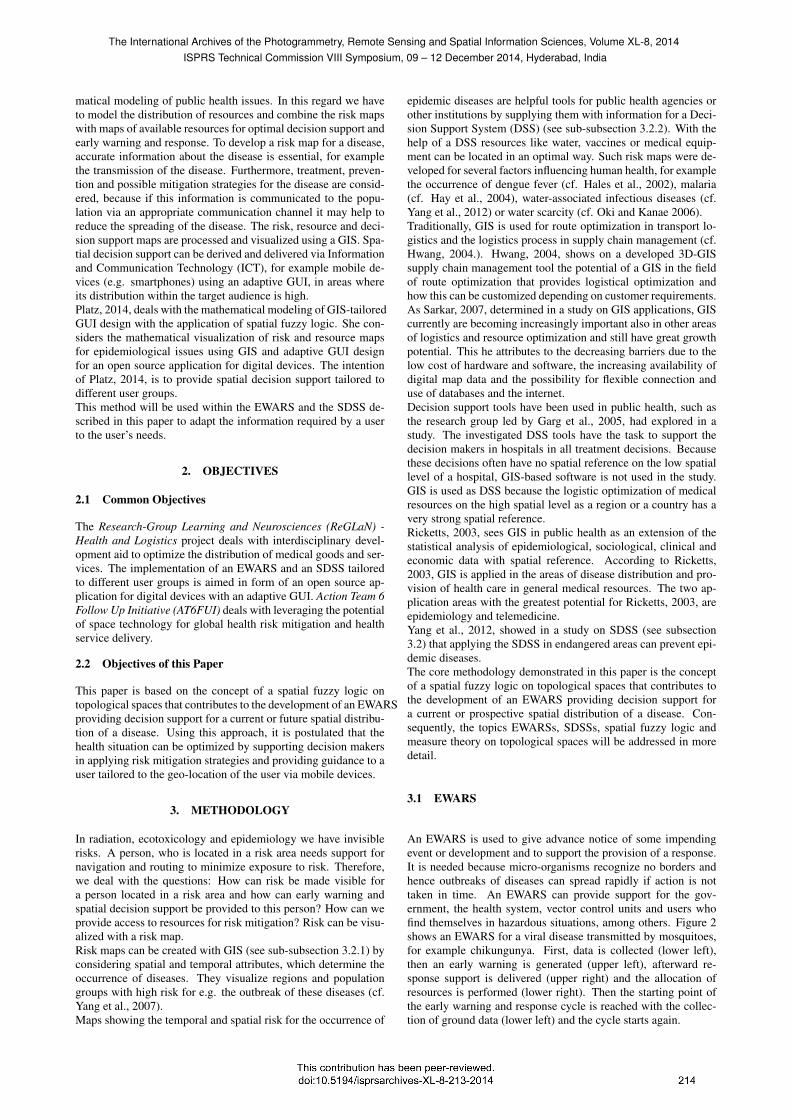
An EWARS is used to give advance notice of some impendingevent or development and to support the provision of a response.It is needed because micro-organisms recognize no borders andhence outbreaks of diseases can spread rapidly if action is nottaken in time. An EWARS can provide support for the gov-ernment, the health system, vector control units and users whofind themselves in hazardous situations, among others. Figure 2shows an EWARS for a viral disease transmitted by mosquitoes,for example chikungunya. First, data is collected (lower left),then an early warning is generated (upper left), afterward re-sponse support is delivered (upper right) and the allocation ofresources is performed (lower right). Then the starting point ofthe early warning and response cycle is reached with the collec-tion of ground data (lower left) and the cycle starts again.
The International Archives of the Photogrammetry, Remote Sensing and Spatial Information Sciences, Volume XL-8, 2014ISPRS Technical Commission VIII Symposium, 09 – 12 December 2014, Hyderabad, India
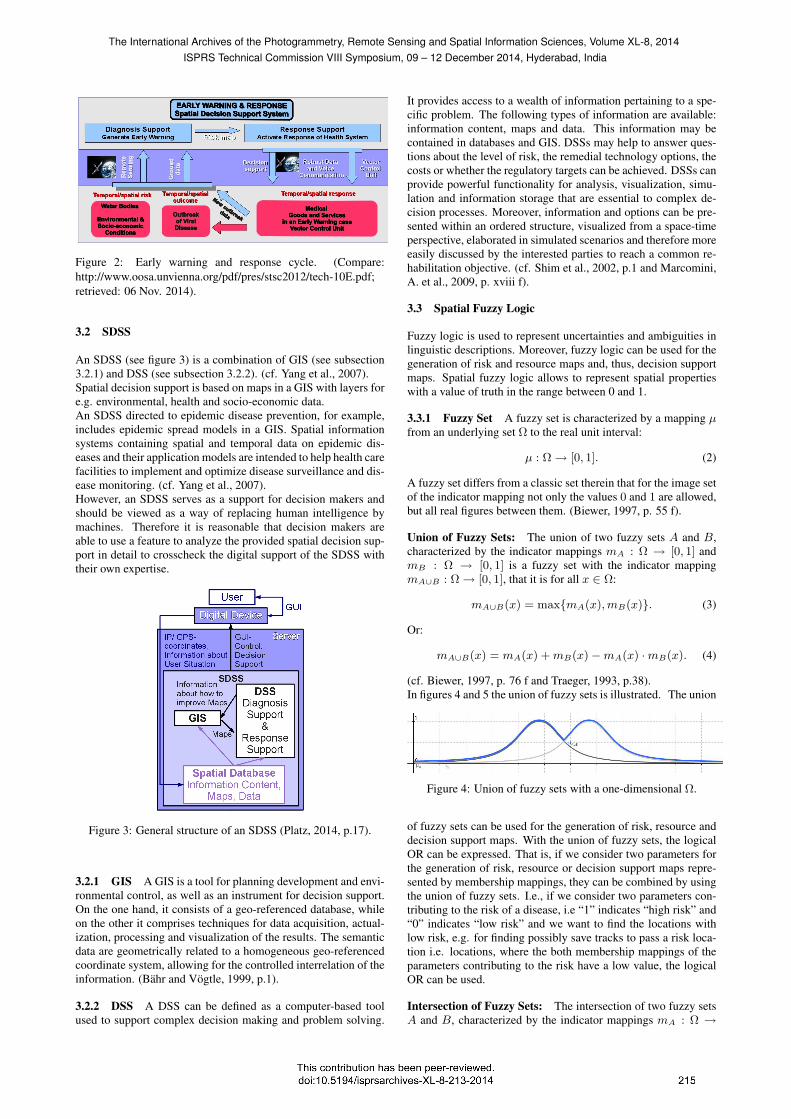
Figure 2: Early warning and response cycle. (Compare:http://www.oosa.unvienna.org/pdf/pres/stsc2012/tech-10E.pdf;retrieved: 06 Nov. 2014).
3.2 SDSS
An SDSS (see figure 3) is a combination of GIS (see subsection3.2.1) and DSS (see subsection 3.2.2). (cf. Yang et al., 2007).Spatial decision support is based on maps in a GIS with layers fore.g. environmental, health and socio-economic data.An SDSS directed to epidemic disease prevention, for example,includes epidemic spread models in a GIS. Spatial informationsystems containing spatial and temporal data on epidemic dis-eases and their application models are intended to help health carefacilities to implement and optimize disease surveillance and dis-ease monitoring. (cf. Yang et al., 2007).However, an SDSS serves as a support for decision makers andshould be viewed as a way of replacing human intelligence bymachines. Therefore it is reasonable that decision makers areable to use a feature to analyze the provided spatial decision sup-port in detail to crosscheck the digital support of the SDSS withtheir own expertise.
Figure 3: General structure of an SDSS (Platz, 2014, p.17).
3.2.1 GIS A GIS is a tool for planning development and envi-ronmental control, as well as an instrument for decision support.On the one hand, it consists of a geo-referenced database, whileon the other it comprises techniques for data acquisition, actual-ization, processing and visualization of the results. The semanticdata are geometrically related to a homogeneous geo-referencedcoordinate system, allowing for the controlled interrelation of theinformation. (Bahr and Vogtle, 1999, p.1).
3.2.2 DSS A DSS can be defined as a computer-based toolused to support complex decision making and problem solving.
It provides access to a wealth of information pertaining to a spe-cific problem. The following types of information are available:information content, maps and data. This information may becontained in databases and GIS. DSSs may help to answer ques-tions about the level of risk, the remedial technology options, thecosts or whether the regulatory targets can be achieved. DSSs canprovide powerful functionality for analysis, visualization, simu-lation and information storage that are essential to complex de-cision processes. Moreover, information and options can be pre-sented within an ordered structure, visualized from a space-timeperspective, elaborated in simulated scenarios and therefore moreeasily discussed by the interested parties to reach a common re-habilitation objective. (cf. Shim et al., 2002, p.1 and Marcomini,A. et al., 2009, p. xviii f).
3.3 Spatial Fuzzy Logic
Fuzzy logic is used to represent uncertainties and ambiguities inlinguistic descriptions. Moreover, fuzzy logic can be used for thegeneration of risk and resource maps and, thus, decision supportmaps. Spatial fuzzy logic allows to represent spatial propertieswith a value of truth in the range between 0 and 1.
3.3.1 Fuzzy Set A fuzzy set is characterized by a mapping µfrom an underlying set Ω to the real unit interval:
µ : Ω→ [0, 1]. (2)
A fuzzy set differs from a classic set therein that for the image setof the indicator mapping not only the values 0 and 1 are allowed,but all real figures between them. (Biewer, 1997, p. 55 f).
Union of Fuzzy Sets: The union of two fuzzy sets A and B,characterized by the indicator mappings mA : Ω → [0, 1] andmB : Ω → [0, 1] is a fuzzy set with the indicator mappingmA∪B : Ω→ [0, 1], that it is for all x ∈ Ω:
mA∪B(x) = maxmA(x),mB(x). (3)
Or:
mA∪B(x) = mA(x) +mB(x)−mA(x) ·mB(x). (4)
(cf. Biewer, 1997, p. 76 f and Traeger, 1993, p.38).In figures 4 and 5 the union of fuzzy sets is illustrated. The union
Figure 4: Union of fuzzy sets with a one-dimensional Ω.
of fuzzy sets can be used for the generation of risk, resource anddecision support maps. With the union of fuzzy sets, the logicalOR can be expressed. That is, if we consider two parameters forthe generation of risk, resource or decision support maps repre-sented by membership mappings, they can be combined by usingthe union of fuzzy sets. I.e., if we consider two parameters con-tributing to the risk of a disease, i.e “1” indicates “high risk” and“0” indicates “low risk” and we want to find the locations withlow risk, e.g. for finding possibly save tracks to pass a risk loca-tion i.e. locations, where the both membership mappings of theparameters contributing to the risk have a low value, the logicalOR can be used.
Intersection of Fuzzy Sets: The intersection of two fuzzy setsA and B, characterized by the indicator mappings mA : Ω →
The International Archives of the Photogrammetry, Remote Sensing and Spatial Information Sciences, Volume XL-8, 2014ISPRS Technical Commission VIII Symposium, 09 – 12 December 2014, Hyderabad, India
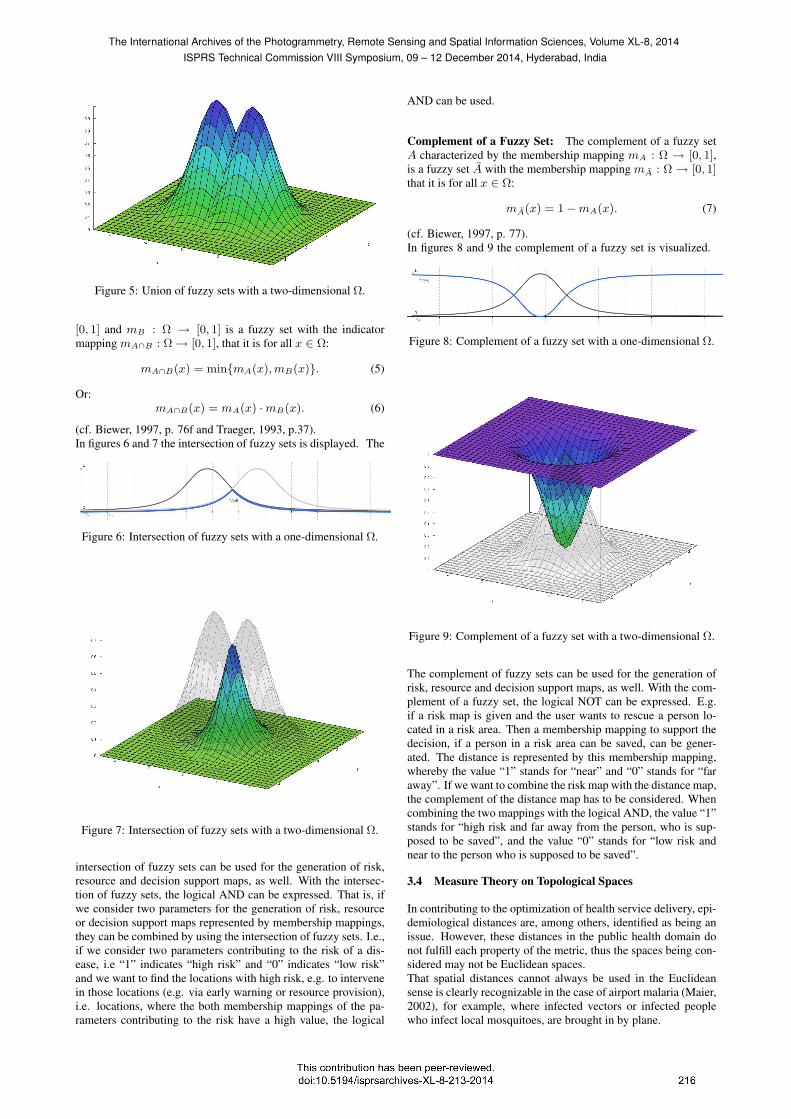
Figure 5: Union of fuzzy sets with a two-dimensional Ω.
[0, 1] and mB : Ω → [0, 1] is a fuzzy set with the indicatormapping mA∩B : Ω→ [0, 1], that it is for all x ∈ Ω:
mA∩B(x) = minmA(x),mB(x). (5)
Or:mA∩B(x) = mA(x) ·mB(x). (6)
(cf. Biewer, 1997, p. 76f and Traeger, 1993, p.37).In figures 6 and 7 the intersection of fuzzy sets is displayed. The
Figure 6: Intersection of fuzzy sets with a one-dimensional Ω.
Figure 7: Intersection of fuzzy sets with a two-dimensional Ω.
intersection of fuzzy sets can be used for the generation of risk,resource and decision support maps, as well. With the intersec-tion of fuzzy sets, the logical AND can be expressed. That is, ifwe consider two parameters for the generation of risk, resourceor decision support maps represented by membership mappings,they can be combined by using the intersection of fuzzy sets. I.e.,if we consider two parameters contributing to the risk of a dis-ease, i.e “1” indicates “high risk” and “0” indicates “low risk”and we want to find the locations with high risk, e.g. to intervenein those locations (e.g. via early warning or resource provision),i.e. locations, where the both membership mappings of the pa-rameters contributing to the risk have a high value, the logical
AND can be used.
Complement of a Fuzzy Set: The complement of a fuzzy setA characterized by the membership mapping mA : Ω → [0, 1],is a fuzzy set A with the membership mapping mA : Ω→ [0, 1]that it is for all x ∈ Ω:
mA(x) = 1−mA(x). (7)
(cf. Biewer, 1997, p. 77).In figures 8 and 9 the complement of a fuzzy set is visualized.
Figure 8: Complement of a fuzzy set with a one-dimensional Ω.
Figure 9: Complement of a fuzzy set with a two-dimensional Ω.
The complement of fuzzy sets can be used for the generation ofrisk, resource and decision support maps, as well. With the com-plement of a fuzzy set, the logical NOT can be expressed. E.g.if a risk map is given and the user wants to rescue a person lo-cated in a risk area. Then a membership mapping to support thedecision, if a person in a risk area can be saved, can be gener-ated. The distance is represented by this membership mapping,whereby the value “1” stands for “near” and “0” stands for “faraway”. If we want to combine the risk map with the distance map,the complement of the distance map has to be considered. Whencombining the two mappings with the logical AND, the value “1”stands for “high risk and far away from the person, who is sup-posed to be saved”, and the value “0” stands for “low risk andnear to the person who is supposed to be saved”.
3.4 Measure Theory on Topological Spaces
In contributing to the optimization of health service delivery, epi-demiological distances are, among others, identified as being anissue. However, these distances in the public health domain donot fulfill each property of the metric, thus the spaces being con-sidered may not be Euclidean spaces.That spatial distances cannot always be used in the Euclideansense is clearly recognizable in the case of airport malaria (Maier,2002), for example, where infected vectors or infected peoplewho infect local mosquitoes, are brought in by plane.
The International Archives of the Photogrammetry, Remote Sensing and Spatial Information Sciences, Volume XL-8, 2014ISPRS Technical Commission VIII Symposium, 09 – 12 December 2014, Hyderabad, India
Fuzzy mappings operate on these general topological spaces. Thesefuzzy mappings can be measured with measure theory on topo-logical spaces. Spatial fuzzy logic rules that support the alloca-tion of limited resources according to risk can be evaluated withmeasure theory on topological spaces, which allows to visualizethe applicability of this rule as well in a map.
4. TECHNOLOGY DESCRIPTION
The use of a GUI on a mobile device, e.g. smartphone, allows tai-lored information to different user groups to be visualized. Theinformation for the user is location-specific by determining thelocation of the user via Global Positioning System (GPS). Oldercellphones without GPS and internet can provide their approxi-mate location by determining the distance from the user to threetransmitter masts by measuring the duration that is needed to senda signal from the mobile device of the user to the transmitter mastor vice versa. With triangulation, the geo-location of the usercan be approximated. Open source software and open contentfor providing the application free of charge have proven suitableto make the application available for as many potential users aspossible. Additionally, open source software can be easily en-hanced by local computer scientists to adapt the software to theirneeds. Consequently, the software component of the system willbe based on open source software and the software developedduring this project will also be in the open source domain, so thatan open community (see section 7.) can build on the results andtailor further work to regional or international requirements andconstraints. For the development of the application, we use interalia the following open content: OpenStreetMap (OSM), a freewiki world map, in the sense of the Humanitarian OSM Team(HOT), an initiative for the use of open data and open source forhumanitarian purpose. We need OSM for our purpose among oth-ers to determine tracks that could be taken, e.g. by including theinfrastructure. The following open source software is used:
• as GIS: GRASS GIS;
• for calculations and plots: GeoGebra, Maxima, gnuplot, R,LibreOffice Calc, Octave;
• for object oriented analysis (development of UML model):ArgoUML;
• for data collection: OpenDataKit, LimeSurvey, SDAPS;
• for visualization and navigation: Navit, Mixare.
To provide the application free of charge for smartphones, theoperating system Android is required. To relieve the digital de-vices, especially the mobile devices, certain GUI-components aresourced out on a server. This is important, because it is energysaving and a charging-possibility is not available everywhere. Fur-thermore, time can be an important factor, especially in hazardoussituations. By using a server for large calculations, time canbe saved. For this outsourcing, an internet-connection is essen-tial. To make the application usable although there is no internet-connection available, an offline-usage of the application needs tobe enabled. For a decision maker the option to be able to con-sider a location the decision maker is not located in needs tobe implemented. As we want to reach a large mass of peoplewith the application, it is developed not only for smartphones,but for several other mobile devices. If the mobile device doesnot have a screen, the decision support can be delivered via textmessages. This method is maybe not that comprehensible as thevisualization of the decision support, but it is at least a help for
the user. Additionally, we have to think about solutions for illit-erates and disabled users (e.g. (color-)blind users or wheelchairusers), which are supposed to be implemented in the future.
5. DEVELOPMENTS
Allocating limited resources according to risk is a global prob-lem. Therefore the optimal distribution of resources is a chal-lenge decision makers have to face in several disciplines at differ-ent decision-making levels. Decision Support and Early Warningcan be delivered based on risk and resource maps, compare Rapp,2012, and Großler, 2012.Therefore, e.g. the risk of an epidemiological disease like malariacan be considered and resources in this context could be medica-tion that prevent infection or that treat infected persons or thecommunication of risk mitigation strategies and prevention mea-sures via the developed application. A decision maker is likely tobe concerned with distributing those resources in an optimal way.Therefore risk and resource maps are combined for the genera-tion of decision support maps and special GUIs matching to thedecision maker’s needs are developed. For the development ofan adaptive GUI for an application for public health service de-livery, an important tool used throughout the whole developmentprocess is the application of mathematics and mathematical mod-eling. The further processing of risk and resource maps for thedetermination of decision support maps can be implemented withfuzzy logic membership mappings. Those membership mappingsare a basal instrument to express e.g. the logistic supply qualityor the impact of an epidemic on a person. Calculations can be op-erated with those membership functions, if the domain is equal.Thus, a common domain to connect the three topics logistics, epi-demiology and adaptive GUI-design is determined as follows:
XΩ :=
S2R0(z) ∪
R0
00
,
−R0
00
× T (8)
withS2R0(z) = ω ∈ [0, R0]3 | ‖ω − z‖2 = R0 (9)
with
ω =
ω1
ω2
ω3
=
R0 · sin(θ) · cos(ϕ)R0 · sin(θ) · sin(ϕ)
R0 · cos(θ)
(10)
with θ ∈ (−π2, π
2) which corresponds to the latitude (−90°, 90°)
andϕ ∈ (−π, π] which corresponds to the longitude (−180°, 180°],
z =
000
is the barycenter of the three-dimensional object de-
scribing the earth, T = IR the time and R0 the distance fromthe barycenter z to the earth’s surface at the time-point t ∈ T(averaged 6371km).
‖ω − z‖2 =√
(ω1 − 0)2 + (ω2 − 0)2 + (ω3 − 0)2. (11)
(cf. Platz, 2014, p. 147).This way, decision support maps can be generated and decisionsupport can be communicated to the user via an adaptive GUI.The maps are processed and illustrated using visualization toolssuch as the EWARS Spatial Fuzzy Logic Demo (see figure 10)available at
http://mathematik.uni-landau.de/EWARS/
and decision support is delivered to the user via a digital deviceusing an adaptive GUI. The EWARS Spatial Fuzzy Logic Demo
The International Archives of the Photogrammetry, Remote Sensing and Spatial Information Sciences, Volume XL-8, 2014ISPRS Technical Commission VIII Symposium, 09 – 12 December 2014, Hyderabad, India
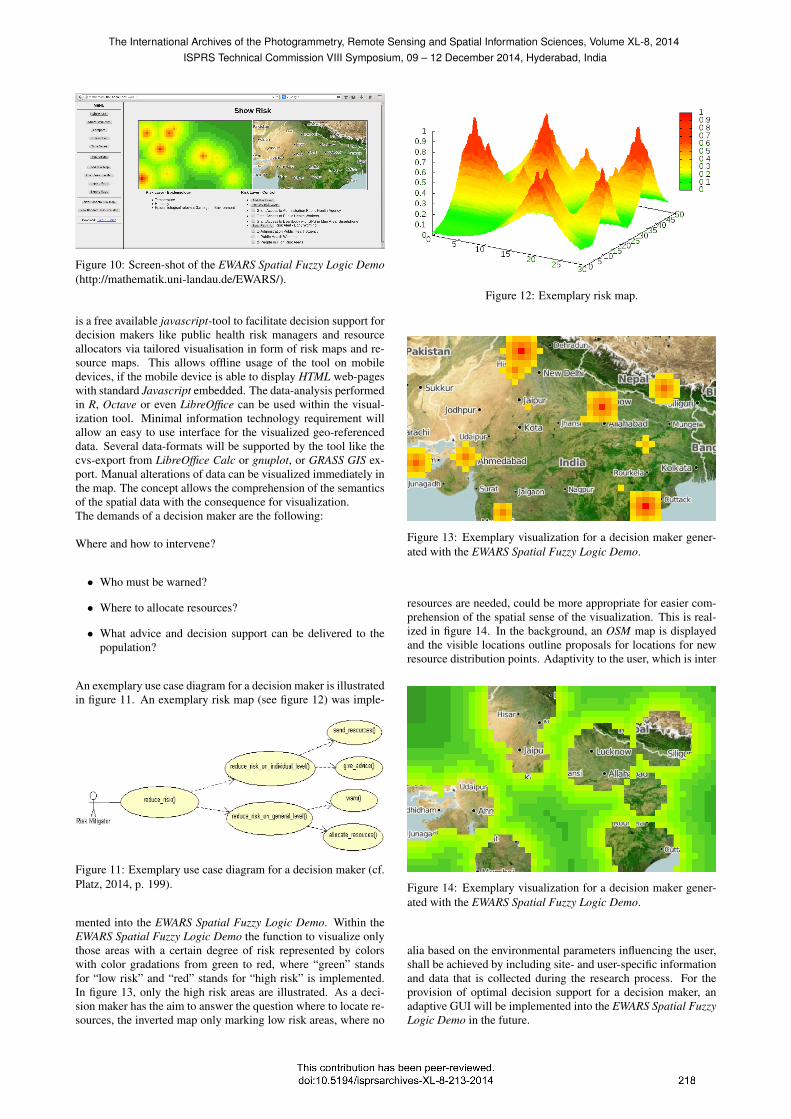
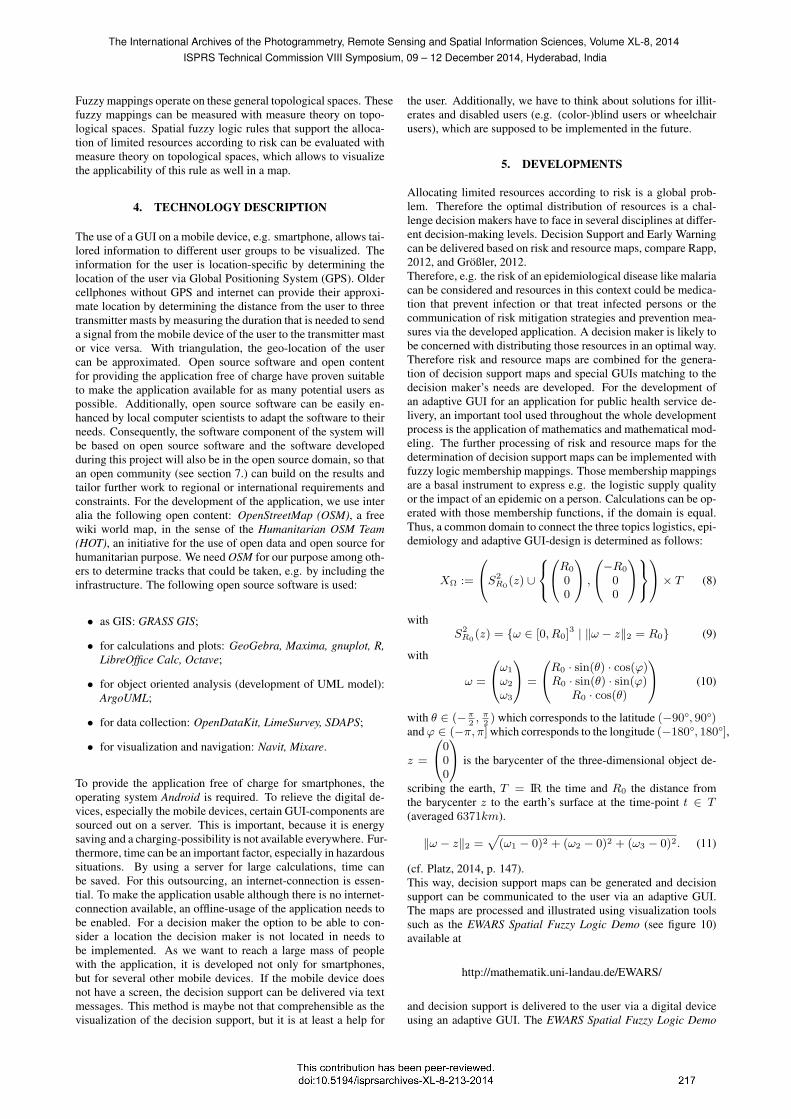
Figure 10: Screen-shot of the EWARS Spatial Fuzzy Logic Demo(http://mathematik.uni-landau.de/EWARS/).
is a free available javascript-tool to facilitate decision support fordecision makers like public health risk managers and resourceallocators via tailored visualisation in form of risk maps and re-source maps. This allows offline usage of the tool on mobiledevices, if the mobile device is able to display HTML web-pageswith standard Javascript embedded. The data-analysis performedin R, Octave or even LibreOffice can be used within the visual-ization tool. Minimal information technology requirement willallow an easy to use interface for the visualized geo-referenceddata. Several data-formats will be supported by the tool like thecvs-export from LibreOffice Calc or gnuplot, or GRASS GIS ex-port. Manual alterations of data can be visualized immediately inthe map. The concept allows the comprehension of the semanticsof the spatial data with the consequence for visualization.The demands of a decision maker are the following:
Where and how to intervene?
• Who must be warned?
• Where to allocate resources?
• What advice and decision support can be delivered to thepopulation?
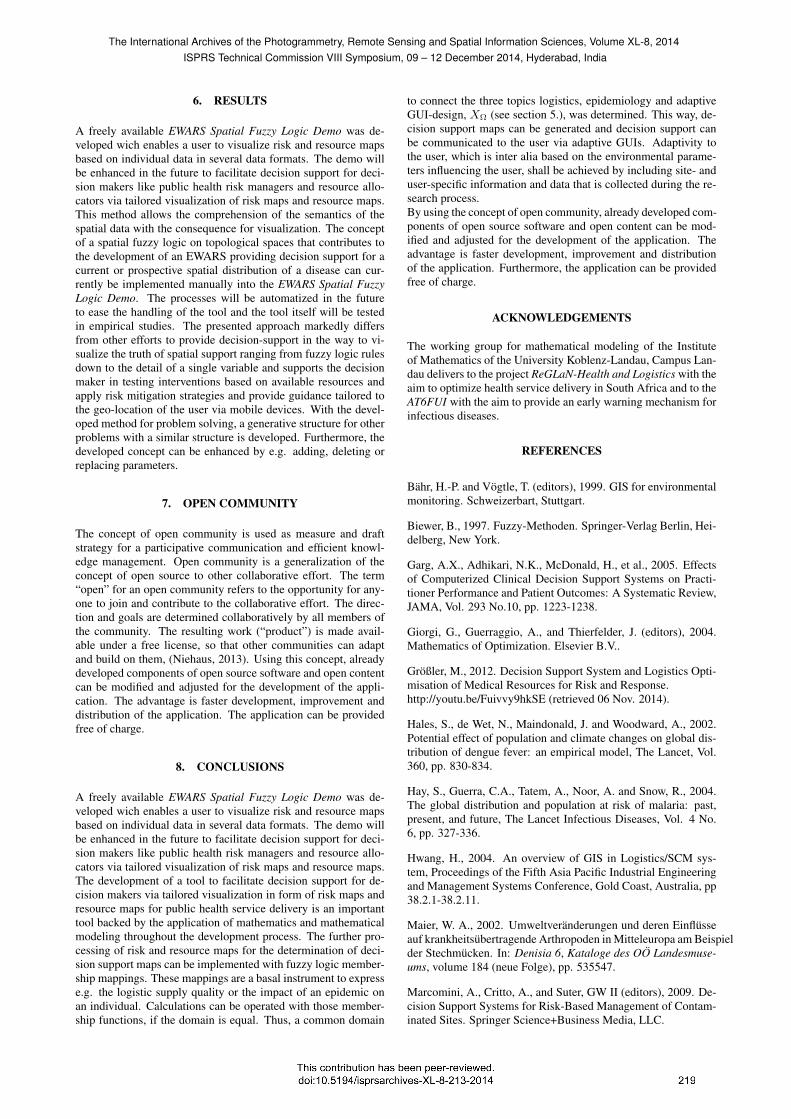
An exemplary use case diagram for a decision maker is illustratedin figure 11. An exemplary risk map (see figure 12) was imple-
Figure 11: Exemplary use case diagram for a decision maker (cf.Platz, 2014, p. 199).
mented into the EWARS Spatial Fuzzy Logic Demo. Within theEWARS Spatial Fuzzy Logic Demo the function to visualize onlythose areas with a certain degree of risk represented by colorswith color gradations from green to red, where “green” standsfor “low risk” and “red” stands for “high risk” is implemented.In figure 13, only the high risk areas are illustrated. As a deci-sion maker has the aim to answer the question where to locate re-sources, the inverted map only marking low risk areas, where no
Figure 12: Exemplary risk map.
Figure 13: Exemplary visualization for a decision maker gener-ated with the EWARS Spatial Fuzzy Logic Demo.
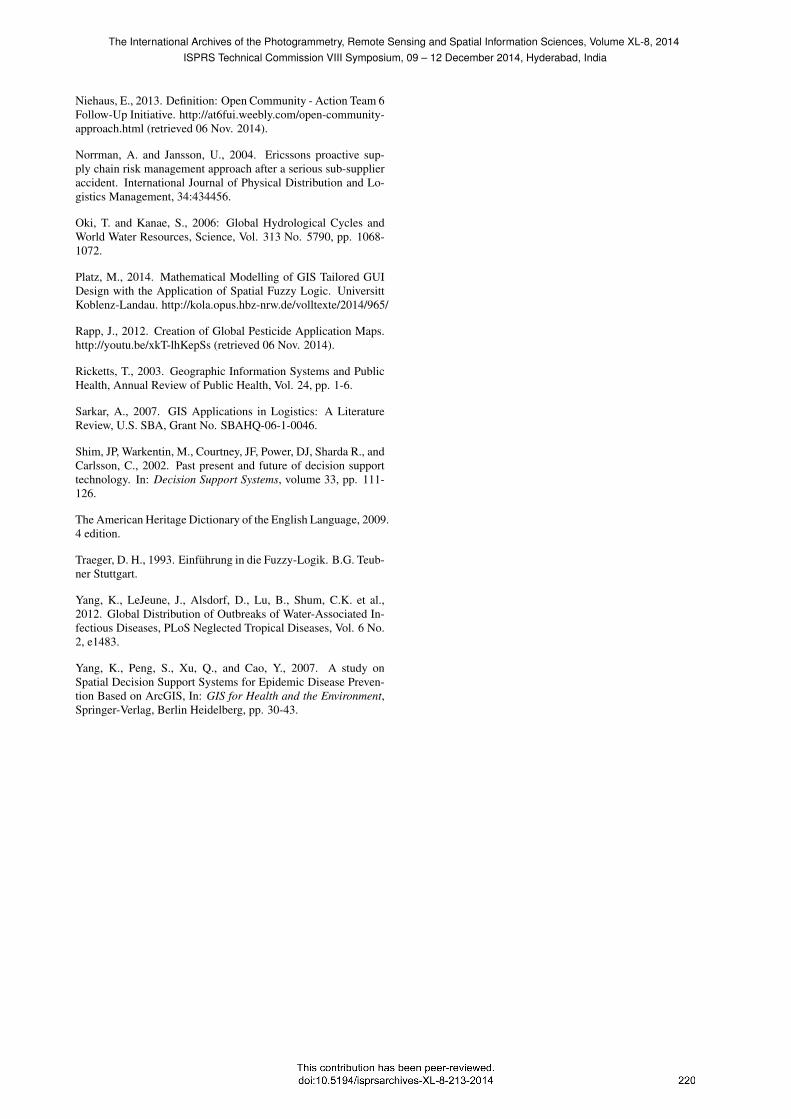
resources are needed, could be more appropriate for easier com-prehension of the spatial sense of the visualization. This is real-ized in figure 14. In the background, an OSM map is displayedand the visible locations outline proposals for locations for newresource distribution points. Adaptivity to the user, which is inter
Figure 14: Exemplary visualization for a decision maker gener-ated with the EWARS Spatial Fuzzy Logic Demo.
alia based on the environmental parameters influencing the user,shall be achieved by including site- and user-specific informationand data that is collected during the research process. For theprovision of optimal decision support for a decision maker, anadaptive GUI will be implemented into the EWARS Spatial FuzzyLogic Demo in the future.
The International Archives of the Photogrammetry, Remote Sensing and Spatial Information Sciences, Volume XL-8, 2014ISPRS Technical Commission VIII Symposium, 09 – 12 December 2014, Hyderabad, India
6. RESULTS
A freely available EWARS Spatial Fuzzy Logic Demo was de-veloped wich enables a user to visualize risk and resource mapsbased on individual data in several data formats. The demo willbe enhanced in the future to facilitate decision support for deci-sion makers like public health risk managers and resource allo-cators via tailored visualization of risk maps and resource maps.This method allows the comprehension of the semantics of thespatial data with the consequence for visualization. The conceptof a spatial fuzzy logic on topological spaces that contributes tothe development of an EWARS providing decision support for acurrent or prospective spatial distribution of a disease can cur-rently be implemented manually into the EWARS Spatial FuzzyLogic Demo. The processes will be automatized in the futureto ease the handling of the tool and the tool itself will be testedin empirical studies. The presented approach markedly differsfrom other efforts to provide decision-support in the way to vi-sualize the truth of spatial support ranging from fuzzy logic rulesdown to the detail of a single variable and supports the decisionmaker in testing interventions based on available resources andapply risk mitigation strategies and provide guidance tailored tothe geo-location of the user via mobile devices. With the devel-oped method for problem solving, a generative structure for otherproblems with a similar structure is developed. Furthermore, thedeveloped concept can be enhanced by e.g. adding, deleting orreplacing parameters.
7. OPEN COMMUNITY
The concept of open community is used as measure and draftstrategy for a participative communication and efficient knowl-edge management. Open community is a generalization of theconcept of open source to other collaborative effort. The term“open” for an open community refers to the opportunity for any-one to join and contribute to the collaborative effort. The direc-tion and goals are determined collaboratively by all members ofthe community. The resulting work (“product”) is made avail-able under a free license, so that other communities can adaptand build on them, (Niehaus, 2013). Using this concept, alreadydeveloped components of open source software and open contentcan be modified and adjusted for the development of the appli-cation. The advantage is faster development, improvement anddistribution of the application. The application can be providedfree of charge.
8. CONCLUSIONS
A freely available EWARS Spatial Fuzzy Logic Demo was de-veloped wich enables a user to visualize risk and resource mapsbased on individual data in several data formats. The demo willbe enhanced in the future to facilitate decision support for deci-sion makers like public health risk managers and resource allo-cators via tailored visualization of risk maps and resource maps.The development of a tool to facilitate decision support for de-cision makers via tailored visualization in form of risk maps andresource maps for public health service delivery is an importanttool backed by the application of mathematics and mathematicalmodeling throughout the development process. The further pro-cessing of risk and resource maps for the determination of deci-sion support maps can be implemented with fuzzy logic member-ship mappings. These mappings are a basal instrument to expresse.g. the logistic supply quality or the impact of an epidemic onan individual. Calculations can be operated with those member-ship functions, if the domain is equal. Thus, a common domain
to connect the three topics logistics, epidemiology and adaptiveGUI-design, XΩ (see section 5.), was determined. This way, de-cision support maps can be generated and decision support canbe communicated to the user via adaptive GUIs. Adaptivity tothe user, which is inter alia based on the environmental parame-ters influencing the user, shall be achieved by including site- anduser-specific information and data that is collected during the re-search process.By using the concept of open community, already developed com-ponents of open source software and open content can be mod-ified and adjusted for the development of the application. Theadvantage is faster development, improvement and distributionof the application. Furthermore, the application can be providedfree of charge.
ACKNOWLEDGEMENTS
The working group for mathematical modeling of the Instituteof Mathematics of the University Koblenz-Landau, Campus Lan-dau delivers to the project ReGLaN-Health and Logistics with theaim to optimize health service delivery in South Africa and to theAT6FUI with the aim to provide an early warning mechanism forinfectious diseases.
REFERENCES
Bahr, H.-P. and Vogtle, T. (editors), 1999. GIS for environmentalmonitoring. Schweizerbart, Stuttgart.
Biewer, B., 1997. Fuzzy-Methoden. Springer-Verlag Berlin, Hei-delberg, New York.
Garg, A.X., Adhikari, N.K., McDonald, H., et al., 2005. Effectsof Computerized Clinical Decision Support Systems on Practi-tioner Performance and Patient Outcomes: A Systematic Review,JAMA, Vol. 293 No.10, pp. 1223-1238.
Giorgi, G., Guerraggio, A., and Thierfelder, J. (editors), 2004.Mathematics of Optimization. Elsevier B.V..
Großler, M., 2012. Decision Support System and Logistics Opti-misation of Medical Resources for Risk and Response.http://youtu.be/Fuivvy9hkSE (retrieved 06 Nov. 2014).
Hales, S., de Wet, N., Maindonald, J. and Woodward, A., 2002.Potential effect of population and climate changes on global dis-tribution of dengue fever: an empirical model, The Lancet, Vol.360, pp. 830-834.
Hay, S., Guerra, C.A., Tatem, A., Noor, A. and Snow, R., 2004.The global distribution and population at risk of malaria: past,present, and future, The Lancet Infectious Diseases, Vol. 4 No.6, pp. 327-336.
Hwang, H., 2004. An overview of GIS in Logistics/SCM sys-tem, Proceedings of the Fifth Asia Pacific Industrial Engineeringand Management Systems Conference, Gold Coast, Australia, pp38.2.1-38.2.11.
Maier, W. A., 2002. Umweltveranderungen und deren Einflusseauf krankheitsubertragende Arthropoden in Mitteleuropa am Beispielder Stechmucken. In: Denisia 6, Kataloge des OO Landesmuse-ums, volume 184 (neue Folge), pp. 535547.
Marcomini, A., Critto, A., and Suter, GW II (editors), 2009. De-cision Support Systems for Risk-Based Management of Contam-inated Sites. Springer Science+Business Media, LLC.
The International Archives of the Photogrammetry, Remote Sensing and Spatial Information Sciences, Volume XL-8, 2014ISPRS Technical Commission VIII Symposium, 09 – 12 December 2014, Hyderabad, India
Niehaus, E., 2013. Definition: Open Community - Action Team 6Follow-Up Initiative. http://at6fui.weebly.com/open-community-approach.html (retrieved 06 Nov. 2014).
Norrman, A. and Jansson, U., 2004. Ericssons proactive sup-ply chain risk management approach after a serious sub-supplieraccident. International Journal of Physical Distribution and Lo-gistics Management, 34:434456.
Oki, T. and Kanae, S., 2006: Global Hydrological Cycles andWorld Water Resources, Science, Vol. 313 No. 5790, pp. 1068-1072.
Platz, M., 2014. Mathematical Modelling of GIS Tailored GUIDesign with the Application of Spatial Fuzzy Logic. UniversittKoblenz-Landau. http://kola.opus.hbz-nrw.de/volltexte/2014/965/
Rapp, J., 2012. Creation of Global Pesticide Application Maps.http://youtu.be/xkT-lhKepSs (retrieved 06 Nov. 2014).
Ricketts, T., 2003. Geographic Information Systems and PublicHealth, Annual Review of Public Health, Vol. 24, pp. 1-6.
Sarkar, A., 2007. GIS Applications in Logistics: A LiteratureReview, U.S. SBA, Grant No. SBAHQ-06-1-0046.
Shim, JP, Warkentin, M., Courtney, JF, Power, DJ, Sharda R., andCarlsson, C., 2002. Past present and future of decision supporttechnology. In: Decision Support Systems, volume 33, pp. 111-126.
The American Heritage Dictionary of the English Language, 2009.4 edition.
Traeger, D. H., 1993. Einfuhrung in die Fuzzy-Logik. B.G. Teub-ner Stuttgart.
Yang, K., LeJeune, J., Alsdorf, D., Lu, B., Shum, C.K. et al.,2012. Global Distribution of Outbreaks of Water-Associated In-fectious Diseases, PLoS Neglected Tropical Diseases, Vol. 6 No.2, e1483.
Yang, K., Peng, S., Xu, Q., and Cao, Y., 2007. A study onSpatial Decision Support Systems for Epidemic Disease Preven-tion Based on ArcGIS, In: GIS for Health and the Environment,Springer-Verlag, Berlin Heidelberg, pp. 30-43.
The International Archives of the Photogrammetry, Remote Sensing and Spatial Information Sciences, Volume XL-8, 2014ISPRS Technical Commission VIII Symposium, 09 – 12 December 2014, Hyderabad, India