research article trace detection of pentaerythritol...
TRANSCRIPT
Research ArticleTrace Detection of Pentaerythritol Tetranitrate UsingElectrochemical Gas Sensors
Praveen K. Sekhar,1 Jie Zhou,1 Hui Wang,2 and Eric R. Hamblin1
1Nanomaterials and Sensor Laboratory, School of Engineering and Computer Science, Washington State University Vancouver,14204 NE Salmon Creek Avenue, Vancouver, WA 98686, USA2Department of Industrial and Manufacturing Engineering, College of Engineering, Florida State University,2525 Pottsdamer Street, Building A, Suite A231, Tallahassee, FL 32310-6046, USA
Correspondence should be addressed to Praveen K. Sekhar; [email protected]
Received 12 October 2014; Revised 3 December 2014; Accepted 7 December 2014; Published 22 December 2014
Academic Editor: Banshi D. Gupta
Copyright © 2014 Praveen K. Sekhar et al. This is an open access article distributed under the Creative Commons AttributionLicense, which permits unrestricted use, distribution, and reproduction in any medium, provided the original work is properlycited.
Selective and sensitive detection of trace amounts of pentaerythritol tetranitrate (PETN) is demonstrated. The screening systemis based on a sampling/concentrator front end and electrochemical potentiometric gas sensor as the detector. A single sensor isoperated in the dominant hydrocarbon (HC) and nitrogen oxides (NO
𝑥) mode by varying the sensor operating condition. The
potentiometric sensor with integrated heaters was used to capture the signature of PETN. Quantitative measurements based onhydrocarbon and nitrogen oxide sensor responses indicated that the detector sensitivity scaled proportionally with the mass ofthe explosives (10𝜇g down to 200 ng). The ratio of the HC integrated peak area to the NO
𝑥integrated peak area is identified as
an indicator of selectivity. The HC/NO𝑥ratio is unique for PETN and has a range from 1.7 to 2.7. This detection technique has
the potential to become an orthogonal technique to the existing explosive screening technologies for reducing the number of falsepositives/false negatives in a cost-effective manner.
1. Introduction
The 2011 Department of Homeland Security (DHS) ProgressReport [1] on “Implementing 9/11 Committee Recommenda-tions” places important precedence on improving nationalsecurity through robust explosive screening technologies.Moreover, given the widespread use of explosive formula-tions, the analysis of explosives is also of interest in landminedetection, forensic research, and studying environmentalproblems associated with explosive residues. Among thedifferent explosives, nitroaromatics are perhaps the mostcommonly used and from them PETN is the one withhighest shattering capability. Several techniques have beendeveloped to detect TNT including fluorescence [2], Ramanspectroscopy [3], mass spectrometer [4], ion mobility spec-trometry [5], metal oxide gas sensors [6, 7], and electrochem-ical sensing [8].
The detector combination of gas chromatography (GC)and mass spectrometry (MS) is currently considered a gold
standard [9] for explosives detection. However, the high costof GC-MS, their bulky size, and the need for an informedend user have motivated investigations for new screeningtechnologies, which are more cost effective [10]. Amongthe several modalities to screen explosives, electrochemicaldetection possesses several advantages such as easy oper-ation, low cost, high sensitivity, simple instrumentation,suitability for portable devices, and, depending on the natureof the technology, the potential for extended shelf life andminimal calibration requirements [11–13]. The drawback ofelectrochemical devices is the poor sensitivity in detectingexplosives vapor, as the vapor pressure of most explosivesis extremely low. Another drawback is the general lack ofability to discriminate or identify the detected explosive.However, while the presence of a preconcentrator has beendemonstrated as a way to ameliorate the first barrier, theelectrochemical sensing of explosives reported to date typ-ically relies on the detection of redox potentials, especiallythe redox potential of NO/NO
2and therefore discrimination
Hindawi Publishing CorporationJournal of SensorsVolume 2014, Article ID 234607, 6 pageshttp://dx.doi.org/10.1155/2014/234607
2 Journal of Sensors
of the high explosive (HE) species particularly in a com-plex background with many chemical signatures becomesunlikely.
Probing the vapor phase (instead of solid or liquid)surrounding the potential threatmay lead to improvedmeansfor threat detection. The inevitable gas phase decomposi-tion of explosives that are made up of C, H, N, and Oinvolves highly predictable and readily measurable principal“breakdown” components such as NO, NO
2, CO, CO
2,
C3H6, NH2, and NH
3[14]. By detecting the breakdown
components, the signature of the explosives can be obtained.In this context, electrochemical gas sensors can be used toscreen the explosives. Among the several classifications ofelectrochemical gas sensors, mixed potential based deviceshave gained prominence in gas sensing applications.
Mixed potential sensors are a class of electrochemicaldevices, which develop a non-Nernstian electromotive force(EMF) due to the difference in the kinetics of the redox reac-tions at each electrode/electrolyte interface upon exposure tovarious analytes [15–17].
These sensors rely on the fact that two dissimilar elec-trodes along with an oxygen ion conducting electrolyteexhibit different nonequilibrium potentials in the presence ofa reducing gas and oxygen.Themixed potential based sensingmechanism facilitates sensor miniaturization and a directvoltage read-out circumventing the need for any additionalconditioning circuitry.Themixed potential strongly dependson the catalytic and electrocatalytic properties near the three-phase interface (electrode/electrolyte/gas), which in turndepend on the operating temperature of the sensor.
In an earlier study by the authors [18], detection anddiscrimination of explosives such as PETN, TNT, and RDXwere demonstrated using tape-cast ceramic mixed potentialsensors based on a zirconia solid electrolyte.The nature of theoxygen ion conducting solid electrolyte required that thesedevices be operated above 450∘C to function. In that work,the tape-cast hydrocarbon (HC) and nitrogen oxides (NO
𝑥)
sensors were externally heated in a miniature tube furnacewith preconcentrator as the front end. The sensitivity andthe detection limit were found too low. The detection limitwas around 1 𝜇g. The diminished sensitivity and selectivitywere attributed to external heating of the sensors and thesubsequent high temperature decomposition of explosivebefore reaching the sensor surface (thereby limiting theamount of analyte reaching the three-phase interface of thesensor) for electrochemical detection.
Hence, in an attempt to understand factors dictatingthe limits of detection using mixed potential type electro-chemical sensors, a change in sensor design was adopted.Instead of external heating in a furnace, a commercial hightemperature ceramic cofire (HTCC) approach was used toprepare sensors with platinum heaters integrated into aplanar device structure. Due to this modification, a differentsensor package configuration was used from previous workwith the front end remaining the same. Reiterating, thedifference between this paper and the earlier work is theintegrated heater sensor structure as opposed to heating thesensors externally in a tube furnace. The front end houses astate-of-the-art preconcentrator system [19] (a hand-portable
sample collection and preconcentrator device), which, whencombinedwith an appropriatemethod of detection, is capableof detecting vanishingly faint odors (parts per trillion) ofexplosives, drugs, and other chemicals. In this study, pref-erential HC and NO
𝑥mixed potential sensors were used in
tandem with integrated heaters with a view to improve thesensitivity and detection limit. PETNwas used as the analyte.
2. Experimental
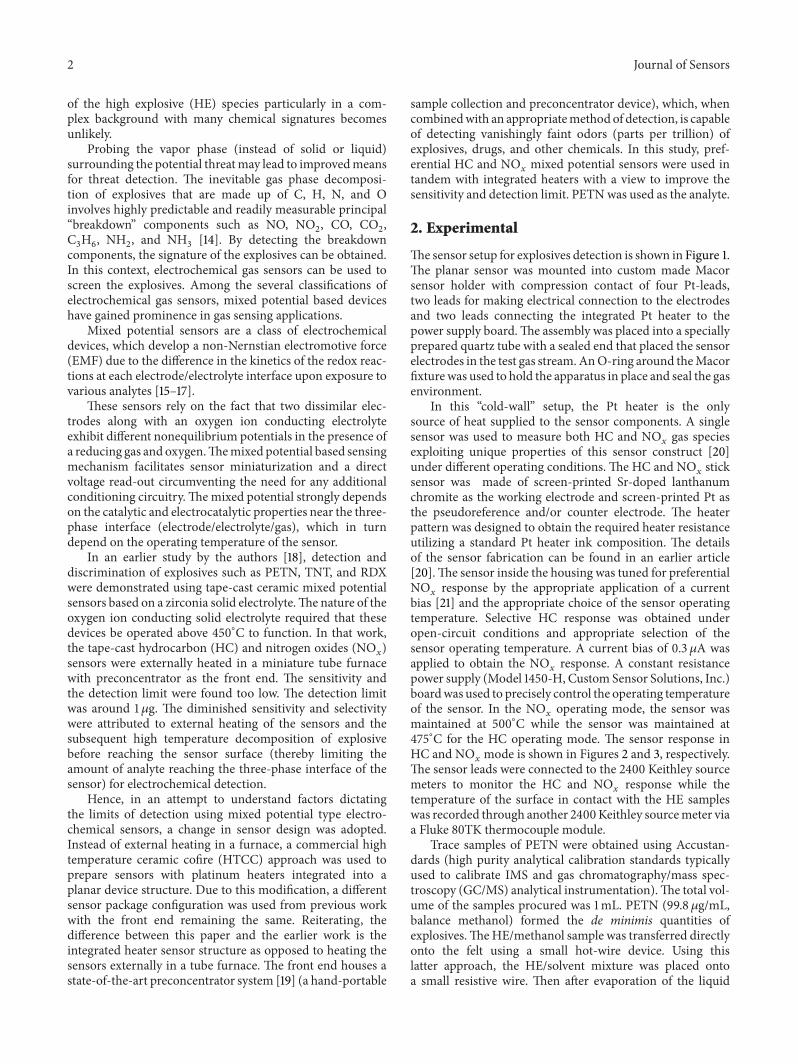
Thesensor setup for explosives detection is shown in Figure 1.The planar sensor was mounted into custom made Macorsensor holder with compression contact of four Pt-leads,two leads for making electrical connection to the electrodesand two leads connecting the integrated Pt heater to thepower supply board.The assembly was placed into a speciallyprepared quartz tube with a sealed end that placed the sensorelectrodes in the test gas stream.AnO-ring around theMacorfixturewas used to hold the apparatus in place and seal the gasenvironment.
In this “cold-wall” setup, the Pt heater is the onlysource of heat supplied to the sensor components. A singlesensor was used to measure both HC and NO
𝑥gas species
exploiting unique properties of this sensor construct [20]under different operating conditions. The HC and NO
𝑥stick
sensor was made of screen-printed Sr-doped lanthanumchromite as the working electrode and screen-printed Pt asthe pseudoreference and/or counter electrode. The heaterpattern was designed to obtain the required heater resistanceutilizing a standard Pt heater ink composition. The detailsof the sensor fabrication can be found in an earlier article[20].The sensor inside the housing was tuned for preferentialNO𝑥response by the appropriate application of a current
bias [21] and the appropriate choice of the sensor operatingtemperature. Selective HC response was obtained underopen-circuit conditions and appropriate selection of thesensor operating temperature. A current bias of 0.3 𝜇A wasapplied to obtain the NO
𝑥response. A constant resistance
power supply (Model 1450-H, Custom Sensor Solutions, Inc.)boardwas used to precisely control the operating temperatureof the sensor. In the NO
𝑥operating mode, the sensor was
maintained at 500∘C while the sensor was maintained at475∘C for the HC operating mode. The sensor response inHC and NO
𝑥mode is shown in Figures 2 and 3, respectively.
The sensor leads were connected to the 2400 Keithley sourcemeters to monitor the HC and NO
𝑥response while the
temperature of the surface in contact with the HE sampleswas recorded through another 2400Keithley sourcemeter viaa Fluke 80TK thermocouple module.
Trace samples of PETN were obtained using Accustan-dards (high purity analytical calibration standards typicallyused to calibrate IMS and gas chromatography/mass spec-troscopy (GC/MS) analytical instrumentation).The total vol-ume of the samples procured was 1mL. PETN (99.8 𝜇g/mL,balance methanol) formed the de minimis quantities ofexplosives.TheHE/methanol sample was transferred directlyonto the felt using a small hot-wire device. Using thislatter approach, the HE/solvent mixture was placed ontoa small resistive wire. Then after evaporation of the liquid
Journal of Sensors 3
Air
To diaphragm pump
K-2400Analysiscomputer
Preconcentratorfront end
Electrochemical sensor package
TeflonSwagelok
union
Air
Power supplyms timer
Air
Type K thermocouple to record desorber felt T
Quartz cap
Machined ceramic sensor clamp
O-ring
CRPS heatercontrolboard
Mixed potential
“stick”sensor
Momentary switch
Sample flow
T record
Voltage outK-2400
Figure 1: Experimental schematic showing the explosives detection setup.
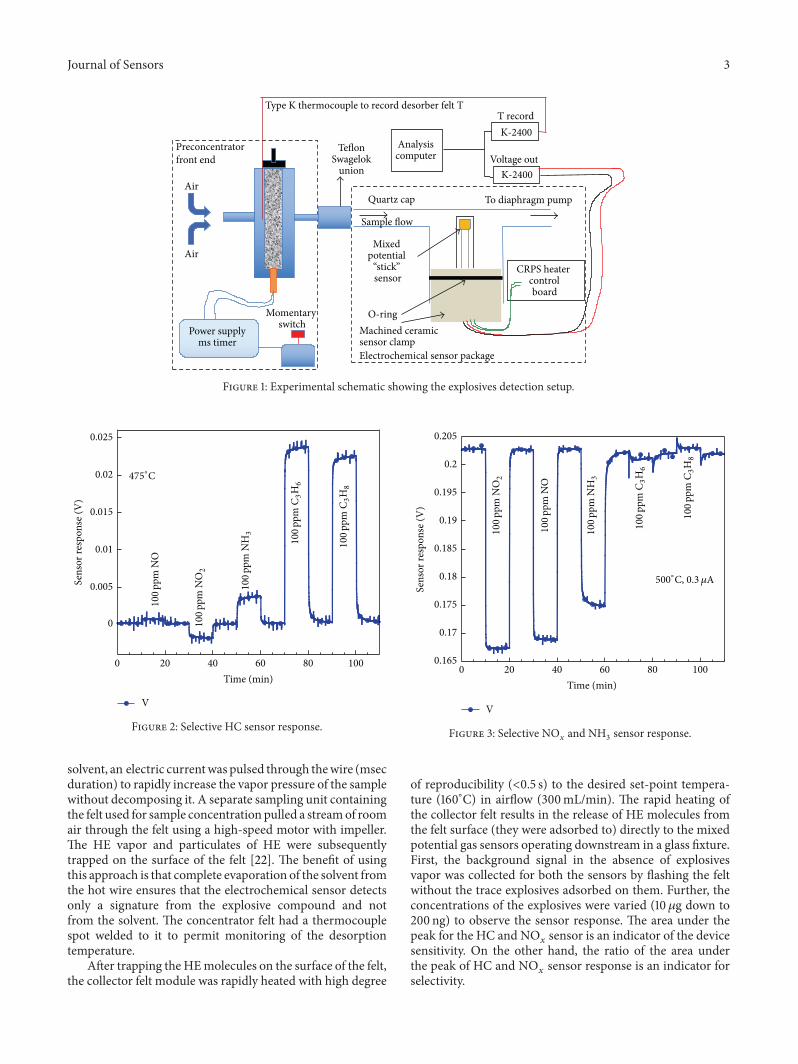
100
ppm
NO
100
ppm
NO
2
100
ppm
NH
3
100
ppm
C 3H
6
100
ppm
C 3H
8
475∘C
0
0.005
0.01
0.015
0.02
0.025
0 20 40 60 80 100
V
Sens
or re
spon
se (V
)
Time (min)
Figure 2: Selective HC sensor response.
solvent, an electric currentwas pulsed through thewire (msecduration) to rapidly increase the vapor pressure of the samplewithout decomposing it. A separate sampling unit containingthe felt used for sample concentration pulled a streamof roomair through the felt using a high-speed motor with impeller.The HE vapor and particulates of HE were subsequentlytrapped on the surface of the felt [22]. The benefit of usingthis approach is that complete evaporation of the solvent fromthe hot wire ensures that the electrochemical sensor detectsonly a signature from the explosive compound and notfrom the solvent. The concentrator felt had a thermocouplespot welded to it to permit monitoring of the desorptiontemperature.
After trapping theHEmolecules on the surface of the felt,the collector felt module was rapidly heated with high degree
0 20 40 60 80 100
V
Sens
or re
spon
se (V
)
Time (min)
0.165
0.17
0.175
0.18
0.185
0.19
0.195
0.2
0.205
100
ppm
NO
100
ppm
NO
2
100
ppm
NH
3
100
ppm
C 3H
6
100
ppm
C 3H
8
500∘C, 0.3 𝜇A
Figure 3: Selective NO𝑥and NH
3sensor response.
of reproducibility (<0.5 s) to the desired set-point tempera-ture (160∘C) in airflow (300mL/min). The rapid heating ofthe collector felt results in the release of HE molecules fromthe felt surface (they were adsorbed to) directly to the mixedpotential gas sensors operating downstream in a glass fixture.First, the background signal in the absence of explosivesvapor was collected for both the sensors by flashing the feltwithout the trace explosives adsorbed on them. Further, theconcentrations of the explosives were varied (10 𝜇g down to200 ng) to observe the sensor response. The area under thepeak for the HC and NO
𝑥sensor is an indicator of the device
sensitivity. On the other hand, the ratio of the area underthe peak of HC and NO
𝑥sensor response is an indicator for
selectivity.
4 Journal of Sensors
Baseline = 0.056V·s
2𝜇g = 0.078V·s
0
0.002
0.004
0.006
0.008
0.01
0.012
0.014
0.016
0 200 400 600 800 1000
HC
sens
or re
spon
se (V
)
Time (s)
(a)
0.155
0.16
0.165
0.17
0.175
5500 6000 6500Time (s)
Baseline = 0.016 V·s
2𝜇g = 0.032V·s
NO
xse
nsor
resp
onse
(V)
(b)
Figure 4: Baseline responses of the sensor upon flashing the empty felt. (a) HC mode and (b) NO𝑥mode.
3. Results and Discussion
Figures 4(a) and 4(b) show the baseline responses of theHC and NO
𝑥sensor upon flashing the empty or clean felt,
respectively. It is ensured that the clean felt is devoid of anyexplosives or solvent. Ideally, there should have been no peaksafter flashing the empty felt. But the HC and NO
𝑥sensor
responses deviated from their sensor baselines with sharppeaks. The origin of this baseline peak response is still underinvestigation. At this point, the anomalous baseline responseis speculated to the outgassing of the polymer insulationon thermocouple wire that was attached to the surface ofcollector felt; however, this will be rigorously investigated infuture work. The area under the peak for the HC and NO
𝑥
baseline response was found to be 0.056V⋅s and 0.016V⋅s,respectively. Figures 4(a) and 4(b) also show theHC andNO
𝑥
response corresponding to 2 𝜇g of PETN. The peak heightof both NO
𝑥and HC response corresponding to 2𝜇g was
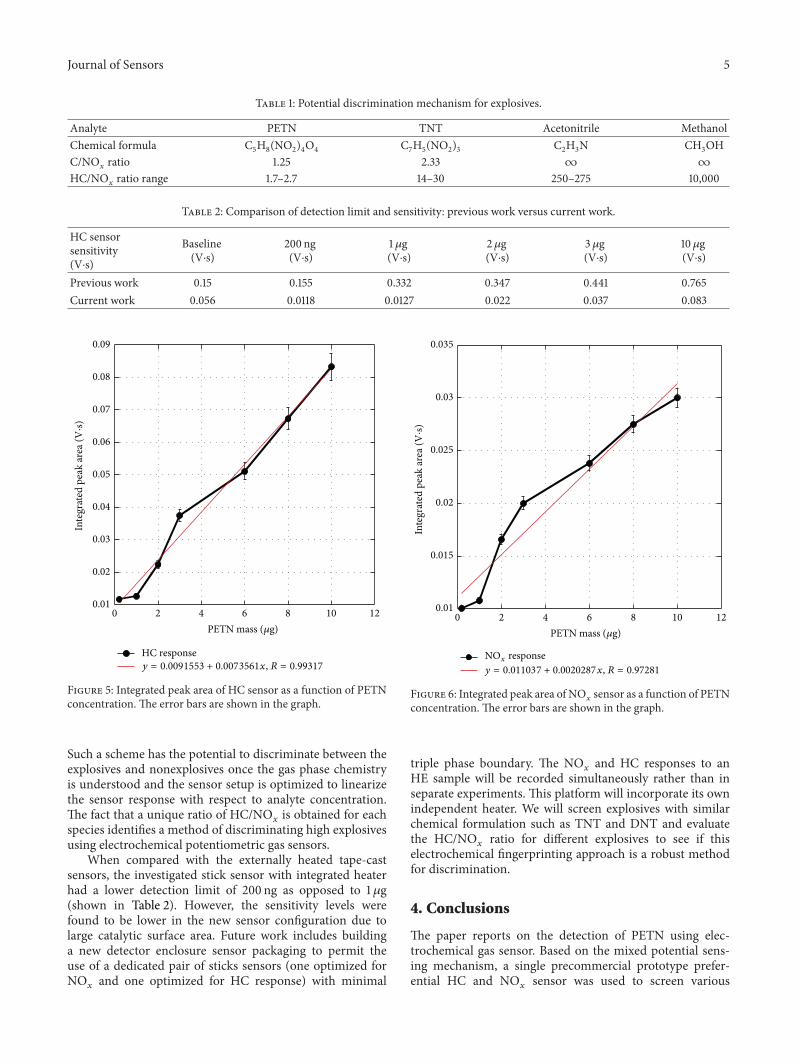
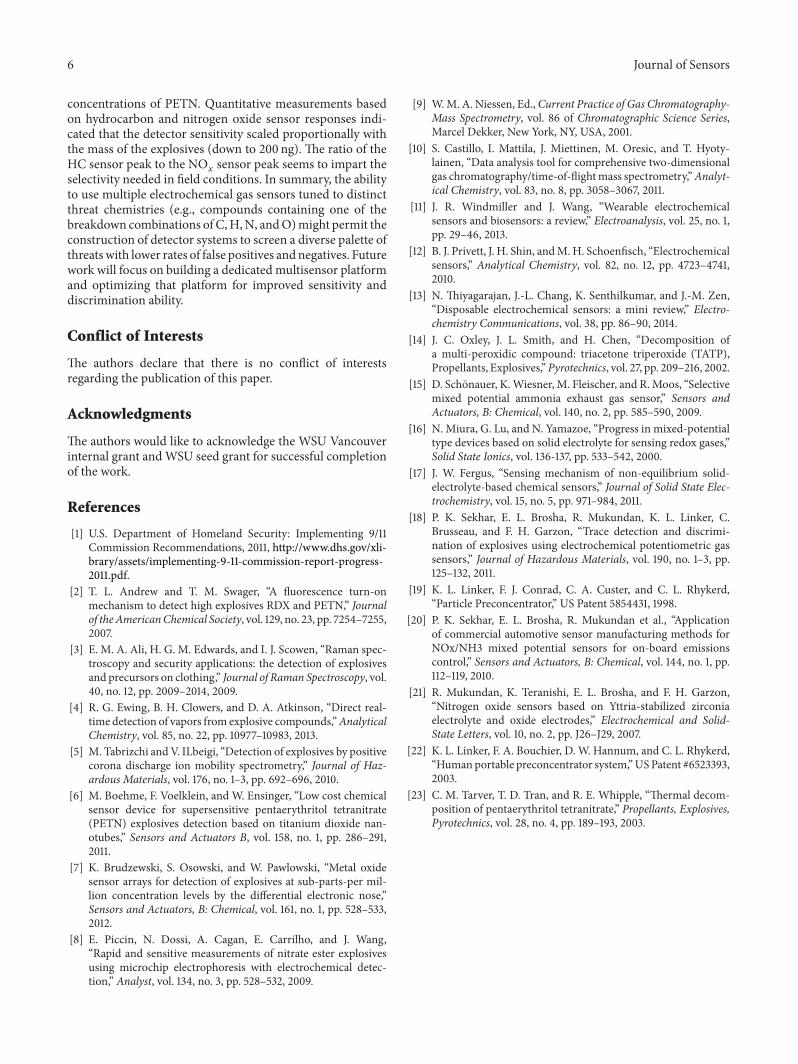
observed to be larger than the baseline.Figures 5 and 6 show the HC and NO
𝑥sensor response
as a function of PETN concentration, respectively. With anincrease in the concentration of PETN, the sensor responseseems to increase for both HC and NO
𝑥sensor. As the
baseline response cannot be neglected, it is taken into con-sideration prior to calculating the sensor peak areas.The datashown in Figures 5 and 6 incorporates baseline correction.
The area under the sensor peaks accounts for thesensitivity. A linear trend was observed for the HC andNO𝑥responses upon exposure to different concentrations
of PETN. The test was repeated three times and a statisticalvariation of 1% in sensor response was observed. This statis-tical variation in the HC and NO
𝑥is reflected as error bars.
The equation for the linear trend for the HC response wasfound to be “𝑦 = 0.0091553 + 0.007356𝑥,” where 𝑦 denotes
the integrated peak area and 𝑥 denotes PETN concentration.The goodness of fit was found to be 0.99. The equation forthe linear trend for the NO
𝑥response was found to be “𝑦 =
0.011037 + 0.002028𝑥,” where 𝑦 denotes the integrated peakarea and 𝑥 denotes PETN concentration. The goodness of fitwas found to be 0.97.The sensingmechanism to detect PETNcan be speculated. Based on the available literature [23],PETN decomposes at 163∘C into 11 byproducts that includeNO2, CH2O, N2O, NO, CO
2, CO, H
2O, CH
3OH, HNO
2,
CH3NO2, and (O
2NOCH
2)3C-CHO. The mixed potential
HC and NO𝑥sensor sees a mixture of these byproducts.
The sensor response to this mixture is complex and isfurther convoluted by the catalytic nature of the electrodeand the electrolyte. For an accurate understanding of therelationship between the sensitivity and the concentrationof the explosives, it is essential to (a) investigate the gasphase decomposition of the explosives at the operatingtemperature of the sensors, (b) study homogenous (in thesystem) and heterogeneous catalysis (on the sensor electrodesand electrolyte) as a function of explosives concentration, and(c) study thermodynamics and kinetics of gas phase flow ofthe explosive vapor over hot surfaces.
To evaluate the selectivity, the ratio of the HC sensorpeak integrated area to the NO
𝑥sensor peak integrated area
was calculated. The calculated ratio is tabulated (Table 1) forPETN, TNT, acetonitrile, and methanol. Acetonitrile andmethanol were used as controls. Table 1 presents a potentialdiscrimination mechanism with explosives and nonexplo-sives listed left to right in the order of increasing carbon-to-NO𝑥ratio. The chemical formula for each analyte has been
highlighted so as to quantify the number and nature of thenitro groups. It can be inferred from Table 1 that the ratioof peak area measured by the HC sensor to the peak areameasured by the total NO
𝑥sensor is unique for each analyte.
Journal of Sensors 5
Table 1: Potential discrimination mechanism for explosives.
Analyte PETN TNT Acetonitrile MethanolChemical formula C5H8(NO2)4O4 C7H5(NO2)3 C2H3N CH3OHC/NO
𝑥ratio 1.25 2.33 ∞ ∞
HC/NO𝑥ratio range 1.7–2.7 14–30 250–275 10,000
Table 2: Comparison of detection limit and sensitivity: previous work versus current work.
HC sensorsensitivity(V⋅s)
Baseline(V⋅s)
200 ng(V⋅s)
1 𝜇g(V⋅s)
2𝜇g(V⋅s)
3 𝜇g(V⋅s)
10𝜇g(V⋅s)
Previous work 0.15 0.155 0.332 0.347 0.441 0.765Current work 0.056 0.0118 0.0127 0.022 0.037 0.083
Inte
grat
ed p
eak
area
(V·s)
PETN mass (𝜇g)
0.01
0.02
0.03
0.04
0.05
0.06
0.07
0.08
0.09
0 2 4 6 8 10 12
HC responsey = 0.0091553 + 0.0073561x, R = 0.99317
Figure 5: Integrated peak area of HC sensor as a function of PETNconcentration. The error bars are shown in the graph.
Such a scheme has the potential to discriminate between theexplosives and nonexplosives once the gas phase chemistryis understood and the sensor setup is optimized to linearizethe sensor response with respect to analyte concentration.The fact that a unique ratio of HC/NO
𝑥is obtained for each
species identifies a method of discriminating high explosivesusing electrochemical potentiometric gas sensors.
When compared with the externally heated tape-castsensors, the investigated stick sensor with integrated heaterhad a lower detection limit of 200 ng as opposed to 1 𝜇g(shown in Table 2). However, the sensitivity levels werefound to be lower in the new sensor configuration due tolarge catalytic surface area. Future work includes buildinga new detector enclosure sensor packaging to permit theuse of a dedicated pair of sticks sensors (one optimized forNO𝑥and one optimized for HC response) with minimal
Inte
grat
ed p
eak
area
(V·s)
PETN mass (𝜇g)
0.01
0.015
0.02
0.025
0.03
0.035
0 2 4 6 8 10 12
NOx responsey = 0.011037 + 0.0020287x, R = 0.97281
Figure 6: Integrated peak area of NO𝑥sensor as a function of PETN
concentration. The error bars are shown in the graph.
triple phase boundary. The NO𝑥and HC responses to an
HE sample will be recorded simultaneously rather than inseparate experiments. This platform will incorporate its ownindependent heater. We will screen explosives with similarchemical formulation such as TNT and DNT and evaluatethe HC/NO
𝑥ratio for different explosives to see if this
electrochemical fingerprinting approach is a robust methodfor discrimination.
4. Conclusions
The paper reports on the detection of PETN using elec-trochemical gas sensor. Based on the mixed potential sens-ing mechanism, a single precommercial prototype prefer-ential HC and NO
𝑥sensor was used to screen various
6 Journal of Sensors
concentrations of PETN. Quantitative measurements basedon hydrocarbon and nitrogen oxide sensor responses indi-cated that the detector sensitivity scaled proportionally withthe mass of the explosives (down to 200 ng). The ratio of theHC sensor peak to the NO
𝑥sensor peak seems to impart the
selectivity needed in field conditions. In summary, the abilityto use multiple electrochemical gas sensors tuned to distinctthreat chemistries (e.g., compounds containing one of thebreakdown combinations of C,H,N, andO)might permit theconstruction of detector systems to screen a diverse palette ofthreatswith lower rates of false positives andnegatives. Futurework will focus on building a dedicated multisensor platformand optimizing that platform for improved sensitivity anddiscrimination ability.
Conflict of Interests
The authors declare that there is no conflict of interestsregarding the publication of this paper.
Acknowledgments
The authors would like to acknowledge the WSU Vancouverinternal grant andWSU seed grant for successful completionof the work.
References
[1] U.S. Department of Homeland Security: Implementing 9/11Commission Recommendations, 2011, http://www.dhs.gov/xli-brary/assets/implementing-9-11-commission-report-progress-2011.pdf.
[2] T. L. Andrew and T. M. Swager, “A fluorescence turn-onmechanism to detect high explosives RDX and PETN,” Journalof theAmericanChemical Society, vol. 129, no. 23, pp. 7254–7255,2007.
[3] E. M. A. Ali, H. G. M. Edwards, and I. J. Scowen, “Raman spec-troscopy and security applications: the detection of explosivesand precursors on clothing,” Journal of Raman Spectroscopy, vol.40, no. 12, pp. 2009–2014, 2009.
[4] R. G. Ewing, B. H. Clowers, and D. A. Atkinson, “Direct real-time detection of vapors from explosive compounds,”AnalyticalChemistry, vol. 85, no. 22, pp. 10977–10983, 2013.
[5] M. Tabrizchi andV. ILbeigi, “Detection of explosives by positivecorona discharge ion mobility spectrometry,” Journal of Haz-ardous Materials, vol. 176, no. 1–3, pp. 692–696, 2010.
[6] M. Boehme, F. Voelklein, and W. Ensinger, “Low cost chemicalsensor device for supersensitive pentaerythritol tetranitrate(PETN) explosives detection based on titanium dioxide nan-otubes,” Sensors and Actuators B, vol. 158, no. 1, pp. 286–291,2011.
[7] K. Brudzewski, S. Osowski, and W. Pawlowski, “Metal oxidesensor arrays for detection of explosives at sub-parts-per mil-lion concentration levels by the differential electronic nose,”Sensors and Actuators, B: Chemical, vol. 161, no. 1, pp. 528–533,2012.
[8] E. Piccin, N. Dossi, A. Cagan, E. Carrilho, and J. Wang,“Rapid and sensitive measurements of nitrate ester explosivesusing microchip electrophoresis with electrochemical detec-tion,” Analyst, vol. 134, no. 3, pp. 528–532, 2009.
[9] W.M. A. Niessen, Ed.,Current Practice of Gas Chromatography-Mass Spectrometry, vol. 86 of Chromatographic Science Series,Marcel Dekker, New York, NY, USA, 2001.
[10] S. Castillo, I. Mattila, J. Miettinen, M. Oresic, and T. Hyoty-lainen, “Data analysis tool for comprehensive two-dimensionalgas chromatography/time-of-flightmass spectrometry,”Analyt-ical Chemistry, vol. 83, no. 8, pp. 3058–3067, 2011.
[11] J. R. Windmiller and J. Wang, “Wearable electrochemicalsensors and biosensors: a review,” Electroanalysis, vol. 25, no. 1,pp. 29–46, 2013.
[12] B. J. Privett, J. H. Shin, andM.H. Schoenfisch, “Electrochemicalsensors,” Analytical Chemistry, vol. 82, no. 12, pp. 4723–4741,2010.
[13] N. Thiyagarajan, J.-L. Chang, K. Senthilkumar, and J.-M. Zen,“Disposable electrochemical sensors: a mini review,” Electro-chemistry Communications, vol. 38, pp. 86–90, 2014.
[14] J. C. Oxley, J. L. Smith, and H. Chen, “Decomposition ofa multi-peroxidic compound: triacetone triperoxide (TATP),Propellants, Explosives,”Pyrotechnics, vol. 27, pp. 209–216, 2002.
[15] D. Schonauer, K.Wiesner, M. Fleischer, and R.Moos, “Selectivemixed potential ammonia exhaust gas sensor,” Sensors andActuators, B: Chemical, vol. 140, no. 2, pp. 585–590, 2009.
[16] N. Miura, G. Lu, and N. Yamazoe, “Progress in mixed-potentialtype devices based on solid electrolyte for sensing redox gases,”Solid State Ionics, vol. 136-137, pp. 533–542, 2000.
[17] J. W. Fergus, “Sensing mechanism of non-equilibrium solid-electrolyte-based chemical sensors,” Journal of Solid State Elec-trochemistry, vol. 15, no. 5, pp. 971–984, 2011.
[18] P. K. Sekhar, E. L. Brosha, R. Mukundan, K. L. Linker, C.Brusseau, and F. H. Garzon, “Trace detection and discrimi-nation of explosives using electrochemical potentiometric gassensors,” Journal of Hazardous Materials, vol. 190, no. 1–3, pp.125–132, 2011.
[19] K. L. Linker, F. J. Conrad, C. A. Custer, and C. L. Rhykerd,“Particle Preconcentrator,” US Patent 5854431, 1998.
[20] P. K. Sekhar, E. L. Brosha, R. Mukundan et al., “Applicationof commercial automotive sensor manufacturing methods forNOx/NH3 mixed potential sensors for on-board emissionscontrol,” Sensors and Actuators, B: Chemical, vol. 144, no. 1, pp.112–119, 2010.
[21] R. Mukundan, K. Teranishi, E. L. Brosha, and F. H. Garzon,“Nitrogen oxide sensors based on Yttria-stabilized zirconiaelectrolyte and oxide electrodes,” Electrochemical and Solid-State Letters, vol. 10, no. 2, pp. J26–J29, 2007.
[22] K. L. Linker, F. A. Bouchier, D. W. Hannum, and C. L. Rhykerd,“Humanportable preconcentrator system,”USPatent #6523393,2003.
[23] C. M. Tarver, T. D. Tran, and R. E. Whipple, “Thermal decom-position of pentaerythritol tetranitrate,” Propellants, Explosives,Pyrotechnics, vol. 28, no. 4, pp. 189–193, 2003.

International Journal of
AerospaceEngineeringHindawi Publishing Corporationhttp://www.hindawi.com Volume 2014
RoboticsJournal of
Hindawi Publishing Corporationhttp://www.hindawi.com Volume 2014
Hindawi Publishing Corporationhttp://www.hindawi.com Volume 2014
Active and Passive Electronic Components
Control Scienceand Engineering
Journal of
Hindawi Publishing Corporationhttp://www.hindawi.com Volume 2014
International Journal of
RotatingMachinery
Hindawi Publishing Corporationhttp://www.hindawi.com Volume 2014
Hindawi Publishing Corporation http://www.hindawi.com
Journal ofEngineeringVolume 2014
Submit your manuscripts athttp://www.hindawi.com
VLSI Design
Hindawi Publishing Corporationhttp://www.hindawi.com Volume 2014
Hindawi Publishing Corporationhttp://www.hindawi.com Volume 2014
Shock and Vibration
Hindawi Publishing Corporationhttp://www.hindawi.com Volume 2014
Civil EngineeringAdvances in
Acoustics and VibrationAdvances in
Hindawi Publishing Corporationhttp://www.hindawi.com Volume 2014
Hindawi Publishing Corporationhttp://www.hindawi.com Volume 2014
Electrical and Computer Engineering
Journal of
Advances inOptoElectronics
Hindawi Publishing Corporation http://www.hindawi.com
Volume 2014
The Scientific World JournalHindawi Publishing Corporation http://www.hindawi.com Volume 2014
SensorsJournal of
Hindawi Publishing Corporationhttp://www.hindawi.com Volume 2014
Modelling & Simulation in EngineeringHindawi Publishing Corporation http://www.hindawi.com Volume 2014
Hindawi Publishing Corporationhttp://www.hindawi.com Volume 2014
Chemical EngineeringInternational Journal of Antennas and
Propagation
International Journal of
Hindawi Publishing Corporationhttp://www.hindawi.com Volume 2014
Hindawi Publishing Corporationhttp://www.hindawi.com Volume 2014
Navigation and Observation
International Journal of
Hindawi Publishing Corporationhttp://www.hindawi.com Volume 2014
DistributedSensor Networks
International Journal of