quality anomaly detection and trace checking tools - final...
TRANSCRIPT

Developing Data-Intensive CloudApplications with Iterative Quality
Enhancements
Quality anomaly detection and tracechecking tools - Final Version
Deliverable 4.4
Ref. Ares(2017)3823134 - 31/07/2017

Deliverable 4.4. Quality anomaly detection and trace checking tools - Final version.
Deliverable: D4.4Title: Quality anomaly detection and trace checking tools
Editor(s): Gabriel Iuhasz (IEAT)
Contributor(s):Gabriel Iuhasz (IEAT), Ioan Dragan (IEAT), Giuliano Casale (IMP),Tatiana Ustinova (IMP), Marcello Bersani (PMI), Ismael Torres(PRO)
Reviewers: Andrew Phee (FlexiOPS), Vasilis Papanikolaou (ATC)Type (R/P/DEC): DEM
Version: 1.0Date: 31-July-2017
Status: Final version.Dissemination level: Public
Download page: http://www.dice-h2020.eu/deliverables/Copyright: Copyright 2017, DICE consortium All rights reserved
The DICE project (February 2015-January 2018) has received funding from the EuropeanUnions Horizon 2020 research and innovation programme under grant agreement No. 644869
Copyright 2017, DICE consortium All rights reserved 2

Deliverable 4.4. Quality anomaly detection and trace checking tools - Final version.
Executive summary
This deliverable documents the anomaly and trace checking tools from the DICE solution. It details thedevelopment and architecture of the Anomaly Detection Tool (ADT) from Task 4.2 and that of the TraceChecking (TraCT) from T4.3. The initial versions of the Regression based Anomaly Detection method isalso detailed in this deliverable. With the final versions of these tools we have created a comprehensiveand extensible yet lightweight solution which can be used for quality and performance related contextualand sequential anomaly detection. We have done this by implementing the architecture and workflow forADT as well as TraCT defined during the course of the project. Furthermore, we also detail a Regressionbased AD solution that is able to compare and highlight anomalies in different versions of the sameapplication.
The document is structured as follows: the Introduction section highlights the objectives and featuresof the anomaly detection, trace checking tools as well as that of the Regression based AD method. Italso describes the contributions of these tools to DICE objectives and DICE innovation objectives. Thisis followed by the presentation of the position of the tools inside the overall architecture and interfacesto other DICE tools. The first section also highlights the achievements of the period under report. Thesecond section, Architecture and design of the tool, details the constituent components of each of thetools. The third section connects the DICE Monitoring platform to DICE use cases and requirementsidentified and presented in deliverable D1.2. Deployment and validation of the tools is tackled in section4. The last section draws final conclusions and sets the future development plans for DICE ADT andTrace Checking.
Copyright 2017, DICE consortium All rights reserved 3

Deliverable 4.4. Quality anomaly detection and trace checking tools - Final version.
Glossary
AD Anomaly DetectionADT Anomaly Detection ToolDIA Data Intensive ApplicationsDICE Data-Intensive Cloud Applications with iterative quality enhancementsDICE-TraCT DICE Trace-checking ToolDMon DICE MonitoringD-VerT DICE Verification ToolELK Elasticsearch, Logstash and KibanaIDE Integrated Development EnvironmentLM Log MergerPMML Predictive Model Markup LanguageTCE Trace Checking EngineUML Unified Modelling Language
Copyright 2017, DICE consortium All rights reserved 4

Deliverable 4.4. Quality anomaly detection and trace checking tools - Final version.
Contents
Executive summary . . . . . . . . . . . . . . . . . . . . . . . . . . . . . . . . . . . . . . . . . 3
Glossary . . . . . . . . . . . . . . . . . . . . . . . . . . . . . . . . . . . . . . . . . . . . . . . 4
Table of Contents . . . . . . . . . . . . . . . . . . . . . . . . . . . . . . . . . . . . . . . . . . 5
List of Figures . . . . . . . . . . . . . . . . . . . . . . . . . . . . . . . . . . . . . . . . . . . . 6
List of Tables . . . . . . . . . . . . . . . . . . . . . . . . . . . . . . . . . . . . . . . . . . . . . 6
List of Listings . . . . . . . . . . . . . . . . . . . . . . . . . . . . . . . . . . . . . . . . . . . . 6
1 Introduction . . . . . . . . . . . . . . . . . . . . . . . . . . . . . . . . . . . . . . . . . . . 71.1 Objectives . . . . . . . . . . . . . . . . . . . . . . . . . . . . . . . . . . . . . . . . . . 81.2 Relation to DICE objectives . . . . . . . . . . . . . . . . . . . . . . . . . . . . . . . . 81.3 Relation to DICE Tools . . . . . . . . . . . . . . . . . . . . . . . . . . . . . . . . . . . 81.4 Achievements of the period under report . . . . . . . . . . . . . . . . . . . . . . . . . . 101.5 Structure of the document . . . . . . . . . . . . . . . . . . . . . . . . . . . . . . . . . . 10
2 Architecture and Implementation . . . . . . . . . . . . . . . . . . . . . . . . . . . . . . . 112.1 Anomaly detection tool . . . . . . . . . . . . . . . . . . . . . . . . . . . . . . . . . . . 11
2.1.1 Big Data framework metrics data . . . . . . . . . . . . . . . . . . . . . . . . . 112.1.2 Anomaly detection methods . . . . . . . . . . . . . . . . . . . . . . . . . . . . 122.1.3 Anomaly detection Implementation . . . . . . . . . . . . . . . . . . . . . . . . 142.1.4 Configuration . . . . . . . . . . . . . . . . . . . . . . . . . . . . . . . . . . . . 162.1.5 Configuration File . . . . . . . . . . . . . . . . . . . . . . . . . . . . . . . . . 172.1.6 Method Settings . . . . . . . . . . . . . . . . . . . . . . . . . . . . . . . . . . 192.1.7 Requirements . . . . . . . . . . . . . . . . . . . . . . . . . . . . . . . . . . . . 22
2.2 Trace checking tool . . . . . . . . . . . . . . . . . . . . . . . . . . . . . . . . . . . . . 222.2.1 DICE-TraCT REST API . . . . . . . . . . . . . . . . . . . . . . . . . . . . . . 242.2.2 Trace Checking Engine - TCE . . . . . . . . . . . . . . . . . . . . . . . . . . . 272.2.3 Trace-checking Runner . . . . . . . . . . . . . . . . . . . . . . . . . . . . . . . 272.2.4 Trace-checking Instance . . . . . . . . . . . . . . . . . . . . . . . . . . . . . . 282.2.5 Monitoring connectors . . . . . . . . . . . . . . . . . . . . . . . . . . . . . . . 28
3 Use cases . . . . . . . . . . . . . . . . . . . . . . . . . . . . . . . . . . . . . . . . . . . . . 343.1 Anomaly Detection . . . . . . . . . . . . . . . . . . . . . . . . . . . . . . . . . . . . . 34
3.1.1 Training Data . . . . . . . . . . . . . . . . . . . . . . . . . . . . . . . . . . . . 343.1.2 Parameter Selection . . . . . . . . . . . . . . . . . . . . . . . . . . . . . . . . 35
3.2 Trace Checking tool . . . . . . . . . . . . . . . . . . . . . . . . . . . . . . . . . . . . . 35
4 Integration and Validation . . . . . . . . . . . . . . . . . . . . . . . . . . . . . . . . . . . 374.1 Anomaly Detection . . . . . . . . . . . . . . . . . . . . . . . . . . . . . . . . . . . . . 374.2 Regression based Anomaly Detection . . . . . . . . . . . . . . . . . . . . . . . . . . . 434.3 Trace Checking tool . . . . . . . . . . . . . . . . . . . . . . . . . . . . . . . . . . . . . 43
5 Conclusions . . . . . . . . . . . . . . . . . . . . . . . . . . . . . . . . . . . . . . . . . . . . 455.1 Summary . . . . . . . . . . . . . . . . . . . . . . . . . . . . . . . . . . . . . . . . . . 455.2 Further work . . . . . . . . . . . . . . . . . . . . . . . . . . . . . . . . . . . . . . . . 45
References . . . . . . . . . . . . . . . . . . . . . . . . . . . . . . . . . . . . . . . . . . . . . . 46
Copyright 2017, DICE consortium All rights reserved 5

Deliverable 4.4. Quality anomaly detection and trace checking tools - Final version.
List of Figures
1 Summary view of the project methodology. . . . . . . . . . . . . . . . . . . . . . . . . . . 72 DICE Overall architecture. . . . . . . . . . . . . . . . . . . . . . . . . . . . . . . . . . . 103 General overview of Anomaly Detection Stack. . . . . . . . . . . . . . . . . . . . . . . . . 154 ADT Sequence diagram. . . . . . . . . . . . . . . . . . . . . . . . . . . . . . . . . . . . 165 Dependencies between DICE-TraCT, DMon and the IDE component . . . . . . . . . . . 236 DICE-TraCT architecture . . . . . . . . . . . . . . . . . . . . . . . . . . . . . . . . . . 247 POST method implementing DICE-TraCT main service in dicetractservice.py. 258 An example of payload specifying two trace-checking analysis on spout “word” and bolt
“exclaim1” of ExclamationTopology. . . . . . . . . . . . . . . . . . . . . . . . . . . . . 259 Portion of code showing the use of the iterator pattern on the trace-checking instances
obtained from the TCRunner object tc instances. . . . . . . . . . . . . . . . . . . 2710 Class TCRunner and (i) the declaration of the chain-of-responsibility with sparkTC
and simpleTC instances, (ii) the method next() implementing the iterator on thesolvable trace-checking instances. . . . . . . . . . . . . . . . . . . . . . . . . . . . . . 28
11 Class TCInstance and the implementation of the Chain-of-Responsibility pattern meth-ods setSuccessor() and getRunnableTCInstance(). . . . . . . . . . . . . . 29
12 Class SimpleTCSolver and the two methods canProcess() and run(). . . . . . . . 2913 RemoteDMonConnector class in dicetract.py . . . . . . . . . . . . . . . . . . 3014 Anomaly Detection flow. . . . . . . . . . . . . . . . . . . . . . . . . . . . . . . . . . . . 3415 Anomaly detection integration with DMON. . . . . . . . . . . . . . . . . . . . . . . . . . 3716 DMon Predictive model saving resources . . . . . . . . . . . . . . . . . . . . . . . . . 3817 DICE IDE plugin for ADT . . . . . . . . . . . . . . . . . . . . . . . . . . . . . . . . . 3918 Decision Tree Model for CEP . . . . . . . . . . . . . . . . . . . . . . . . . . . . . . . 4119 Launch configuration for a trace-checking analysis on two topology nodes . . . . . . . . 44
List of Tables
1 Relation to DICE objectives . . . . . . . . . . . . . . . . . . . . . . . . . . . . . . . . 92 Anomaly Detection Tool requirements . . . . . . . . . . . . . . . . . . . . . . . . . . . 223 Trace Checking tool requirements . . . . . . . . . . . . . . . . . . . . . . . . . . . . . 334 Experimental runs for CEP component . . . . . . . . . . . . . . . . . . . . . . . . . . . 405 Feature Importance for different methods CEP . . . . . . . . . . . . . . . . . . . . . . . 406 Experimental runs for Wikistat Storm . . . . . . . . . . . . . . . . . . . . . . . . . . . 417 Feature importance for different methods Wikistat . . . . . . . . . . . . . . . . . . . . . 428 Isolation Forest performance on labeled data set . . . . . . . . . . . . . . . . . . . . . . 42
Listings
1 Configuration file for ADT . . . . . . . . . . . . . . . . . . . . . . . . . . . . . . . . . 312 Example user defined query . . . . . . . . . . . . . . . . . . . . . . . . . . . . . . . . . 32
Copyright 2017, DICE consortium All rights reserved 6

Deliverable 4.4. Quality anomaly detection and trace checking tools - Final version.
1 Introduction
This section will describe the motivation and context for this deliverable. A summary view of the projectmethodology is shown in the Figure 1:
Figure 1: Summary view of the project methodology.
This deliverable presents the final release of the DICE Anomaly Detection Tool (ADT) and Tracechecking tool (DICE-TraCT) whose main goals are to enable the definition and detection of anomalousmeasurements from Big Data frameworks such as Apache Hadoop, Spark, Storm as well as NoSQLdatabases such as MongoDB and Cassandra . Both tools are developed in WP4, more specifically theADT is developed in T4.2 Quality incident detection and analysis while the DICE-TraCT tool in T4.3Feedbacks for iterative quality enhancement. We can see that these tools are represented in Figure 1and are responsible for signaling anomalous behavior based on measured metrics (ADT and Regressionbased AD) and on framework logs (DICE-TraCT).
The main objectives of these tools are to detect anomalies, in particular contextual anomalies. DICE-TraCT on the other hand will be used for detecting sequential anomalies. Also, the creation of a lambdaarchitecture when combining ADT with DMon.
Main features of the anomaly detection are:
• Integration with several open source machine learning frameworks
• Trace checking capabilities for Apache Storm
• Regression based anomaly detection
• Integration with DMon [17]
• Ability to train and validate supervised predictive models
The remaining of this section presents the positioning of ADT and Trace checking tool relative toDICE innovation objectives, DICE objectives and relation to other tools from DICE tool-chain.
Copyright 2017, DICE consortium All rights reserved 7

Deliverable 4.4. Quality anomaly detection and trace checking tools - Final version.
1.1 Objectives
The focus of the DICE project is to define a quality-driven framework for developing data-intensiveapplications that leverage Big Data technologies hosted in private or public clouds. DICE will offer anovel profile and tools for data-aware quality-driven development. The methodology will excel for itsquality assessment, architecture enhancement, agile delivery and continuous testing and deployment,relying on principles from the emerging DevOps paradigm. The DICE anomaly detection and tracechecking tools contribute to all core innovations of DICE, as follows:
I1: Tackling skill shortage and steep learning curves in quality-driven development of data- intensivesoftware through open source tools, models, methods and methodologies.
ADT and Regression based AD will enable the detection and alerting of anomalous behavior dur-ing data intensive application development. DICE-TraCT on the other hand will deal with sequen-tial anomalies identified from log data. This will help identify quality related anomalies and signalthese, in essence making the debugging and identification of performance bottlenecks much easier.
I2: Shortening the time to market for data-intensive applications that meet quality requirements, thusreducing costs for ISVs while at the same time increasing value for end-users.
Several tools and actors profit from the information (anomalies) signaled by ADT and DICE-TraCT, thus using the detected anomalies in their initial setup.
I3: Decreasing costs to develop and operate data-intensive cloud applications, by defining algorithmsand quality reasoning techniques to select optimal architectures, especially in the early develop-ment stages, and taking into account SLAs.
By detecting quality and performance related anomalies operational costs can be reduced by theoptimized version of the application. At the same time other tools may use the detected anoma-lies to provide feedback to the end user/developer and the output of these optimization tools canprovide significant financial and performance advantages.
I4: Reducing the number and severity of quality-related incidents and failures by leveraging DevOps-inspired methods and traditional reliability and safety assessment to iteratively learn applicationruntime behavior
Runtime application behavior is collected by DMon which is then used as a data source for ADTpermitting the timely detection of quality-related incidents.
1.2 Relation to DICE objectives
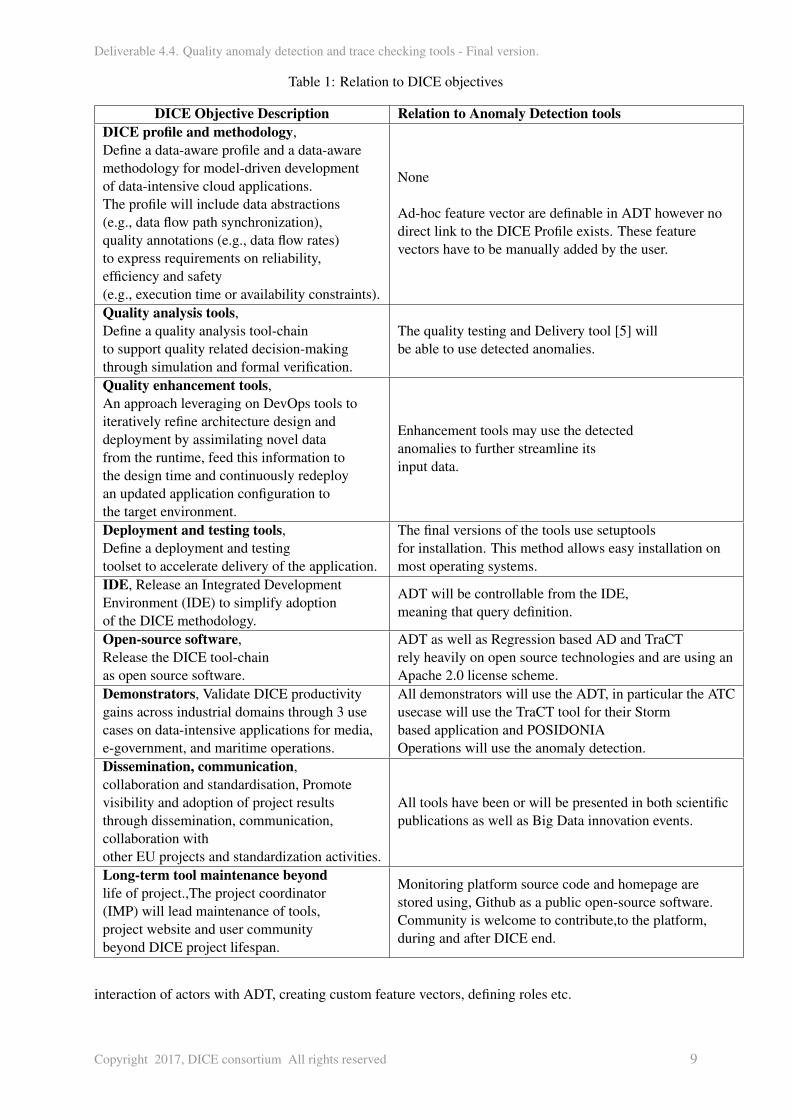
The following table 1 highlights the contributions of ADT and Trace checking tool to DICE objec-tives.
1.3 Relation to DICE Tools
Figure 2 illustrates the interfaces between the ADT (marked with red) and the rest of the DICEsolution. The main goal of ADT is to detect inconsistencies at runtime and on historical data for jobs andservices in data intensive applications. It is meant to provide a powerful but still light weight solution forboth developers, architects and software engineers.
As mentioned in deliverable D4.1 [17], there exists a tight integration between DMon and ADT asthese two tools will for the basis of a lambda type architecture. DMon is the serving layer while instancesof ADT can take the role of both speed and batch layers.
Other tools that make use of ADT are: Fault Injection, Quality Testing and IDE. The fault injectiontool is able to produce system level anomalies which can be used by ADT for the creation of training/-validation datasets. Quality testing tool will use the detected anomalies while the IDE will permit the
Copyright 2017, DICE consortium All rights reserved 8
Deliverable 4.4. Quality anomaly detection and trace checking tools - Final version.
Table 1: Relation to DICE objectives
DICE Objective Description Relation to Anomaly Detection toolsDICE profile and methodology,Define a data-aware profile and a data-awaremethodology for model-driven developmentof data-intensive cloud applications.The profile will include data abstractions(e.g., data flow path synchronization),quality annotations (e.g., data flow rates)to express requirements on reliability,efficiency and safety(e.g., execution time or availability constraints).
None
Ad-hoc feature vector are definable in ADT however nodirect link to the DICE Profile exists. These featurevectors have to be manually added by the user.
Quality analysis tools,Define a quality analysis tool-chainto support quality related decision-makingthrough simulation and formal verification.
The quality testing and Delivery tool [5] willbe able to use detected anomalies.
Quality enhancement tools,An approach leveraging on DevOps tools toiteratively refine architecture design anddeployment by assimilating novel datafrom the runtime, feed this information tothe design time and continuously redeployan updated application configuration tothe target environment.
Enhancement tools may use the detectedanomalies to further streamline itsinput data.
Deployment and testing tools,Define a deployment and testingtoolset to accelerate delivery of the application.
The final versions of the tools use setuptoolsfor installation. This method allows easy installation onmost operating systems.
IDE, Release an Integrated DevelopmentEnvironment (IDE) to simplify adoptionof the DICE methodology.
ADT will be controllable from the IDE,meaning that query definition.
Open-source software,Release the DICE tool-chainas open source software.
ADT as well as Regression based AD and TraCTrely heavily on open source technologies and are using anApache 2.0 license scheme.
Demonstrators, Validate DICE productivitygains across industrial domains through 3 usecases on data-intensive applications for media,e-government, and maritime operations.
All demonstrators will use the ADT, in particular the ATCusecase will use the TraCT tool for their Stormbased application and POSIDONIAOperations will use the anomaly detection.
Dissemination, communication,collaboration and standardisation, Promotevisibility and adoption of project resultsthrough dissemination, communication,collaboration withother EU projects and standardization activities.
All tools have been or will be presented in both scientificpublications as well as Big Data innovation events.
Long-term tool maintenance beyondlife of project.,The project coordinator(IMP) will lead maintenance of tools,project website and user communitybeyond DICE project lifespan.
Monitoring platform source code and homepage arestored using, Github as a public open-source software.Community is welcome to contribute,to the platform,during and after DICE end.
interaction of actors with ADT, creating custom feature vectors, defining roles etc.
Copyright 2017, DICE consortium All rights reserved 9

Deliverable 4.4. Quality anomaly detection and trace checking tools - Final version.
Figure 2: DICE Overall architecture.
1.4 Achievements of the period under report
Overview of the main achievements in the reported period:• Final versions of ADT, Trace Checking and regression based AD tools
• Validation of tools using toy applications and use cases
• Integration of tools into the DICE ecosystem
• Supervised methods for anomaly detection
• Grid search for automatic method parameter setting
• Checked performance of DMon (DICE Monitoring Platform) and ADT on container based solu-tions
• Outline of potential improvements
1.5 Structure of the document
The structure of this deliverable is as follows:• Section 2 the architecture and implementation details of the anomaly detection, Trace Checking
and Regression based Anomaly Detection tools and methods since last deliverable
• Section 3 gives some details related to the use cases for the tools
• Section 4 presents details on initial integration and validation of these tools
• Section 5 gives conclusions and outlines future work
Copyright 2017, DICE consortium All rights reserved 10
Deliverable 4.4. Quality anomaly detection and trace checking tools - Final version.
2 Architecture and Implementation
The following section will detail the overall architecture, implementation as well as the requirementcoverage of each tool. It also covers the main rationale behind the necessity of each tool as well as theinteraction between them and the overall DICE toolchain.
2.1 Anomaly detection tool
Anomaly Detection is an important component involved in performance analysis of data intensive appli-cations. We define an anomaly as an observation that does not conform to an expected pattern [6, 10].Most tools or solutions such as Sematex1, Datadog2 etc. are geared more towards a production environ-ment in contrast to this the DICE Anomaly Detection Tool (ADT) which is designed to be used duringthe development phases of big data applications.
2.1.1 Big Data framework metrics data
In DICE most data preprocessing activities will be done within DMon [17]. However, some additionalpreprocessing such as normalisation or filtering will have to be applied at method level.
In anomaly detection the nature of the data is a key issue. There can be different types of data suchas: binary, categorical or continuous. In DICE we deal mostly with the continuous data type althoughcategorical or even binary values could be present. Most metrics data relate to computational resourceconsumption, execution time etc. There can be instances of categorical data that denotes the status/stateof a certain job or even binary data in the form of boolean values. This makes the creation of data sets onwhich to run anomaly detection an extremely crucial aspect of ADT, because some anomaly detectionmethods don’t work on categorical or binary attributes.
It is important to note that most, if not all, anomaly detection techniques and tools, deal with pointdata, meaning that no relationship is assumed between data instances [10]. In some instances this as-sumption is not valid as there can be spatial, temporal or even sequential relationships between datainstances. This in fact is the assumption we are basing ADT on with regard to the DICE context.
All the data which the anomaly detection techniques use are queried from DMon. This means thatsome basic statistical operations (such as aggregations, median etc.) can already be integrated into theDMon query. In some instances this can reduce the dataset size in which to run anomaly detection.
Since the last deliverable D4.3 [9] we have added native support for several Big data frameworks onwhich Data Intensive Applications (DIAs) are based. ADT now supports; Yarn, Spark, Storm, Cassan-dra, MongoDB. In addition to these we have also added native support for the Complex event processor(CEP) component from the Posidonia Operations usecase. Later additions are possible as the moccationsnecesary in order to add support for other technologies is limited to the Data Formatter component.
Anomaly detection libraries
In recent years, there have been a great deal of general machine learning frameworks developed.These can deal with a wide range of problems. One of the problem domains that can be tackled usingthem is that of anomaly detection. It is important to mention that we will use not only bespoked anomalydetection libraries/methods but also more general supervised (i.e. classification based) and unsupervised(i.e. clustering based) techniques in ADT. In Figure 3 we have a short overview of the core libraries inthe current version of ADT. For the sake of completeness we will briefly describe the machine learninglibraries used, and the rationale behind using them in ADT.
During integration of the anomaly detection libraries we have encountered a few unforeseen diffi-culties. The performance of JVM based libraries such as Weka [16] and ELKI [23] is quite poor. Thisdoesn’t mean that the trained models are of a lower quality but rather their reliance on JVM creates somedifficulties when running them from ADT. Because of this, we decided to focus our work on the libraries
1https://sematext.com/spm/2https://www.datadoghq.com/
Copyright 2017, DICE consortium All rights reserved 11

Deliverable 4.4. Quality anomaly detection and trace checking tools - Final version.
which are written or officially support bindings in Python. The JVM methods are still integrated andusable from ADT but they are not used on any use cases or experiments.
Since the last deliverable we have integrated TensorFlow [1] based deep learning methods into ADT.We have found that although there is quite a substantial documentation available for Tensorflow using itis quite difficult. The Keras3 library is a high level neural network API which is capable of running ontop of TensorFlow, CNTK4 or Theano5. It is extremely user friendly and is very good at abstracting theunderlying backend.
2.1.2 Anomaly detection methods
There are a wide range of anomaly detection methods currently in use [6]. These can be split upinto two distinct categories based on how they are trained. First there are methods used in supervisedmethods. In essence these can be considered as classification problems in which the goal is to train acategorical classifier that is able to output a hypothesis about the anomality of any given data instances.These classifiers can be trained to distinguish between normal and anomalous data instances in a givenfeature space. These methods do not make assumptions about the generative distribution of the eventdata, they are purely data driven. Because of this the quality of the data is extremely important.
For supervised learning methods labeled anomalies from application data instances are a prereq-uisite. False positives frequency is high in some instances, this can be mitigated by comprehensivevalidation/testing. Computational complexity of validation and testing can be substantial and representsa significant challenge which has been taken into consideration during in the ADT tool. Methods usedfor supervised anomaly detection include but are note limited to: Neural Networks, Neural Trees, ART1,Radial Basis Function, SVM, Association Rules and Deep Learning based techniques.
In unsupervised anomaly detection methods the base assumption is that normal data instances aregrouped in a cluster in the data while anomalies don’t belong to any cluster. This assumption is used inmost clustering based methods [20, 21] such as: DBSCAN, ROCK, SNN FindOut, WaveCluster. Thesecond assumption [6, 23] on which K-Means, SOM, Expectation Maximization (EM) algorithms arebased is that normal data instances belong to large and dense clusters while anomalies in small and sparsones. It is easy to see that the effectiveness of each unsupervised, or clustering based, method is largelybased on the effectiveness of individual algorithms in capturing the structure of normal data instances.
It is important to note that these types of methods are not designed with anomaly detection in mind.The detection of anomalies is more often than not a by product of clustering based techniques. Also, thecomputational complexity in the case of clustering based techniques can be a serious issue and carefulselection of the distance measure used is a key factor.
The following paragraphs will present the available anomaly detection methods from ADT.
Unsupervised
KMeans [3] is one of the simplest unsupervised learning algorithms used for clustering. It is able toclassify any given data set through a certain number of clusters which have to be defined a priori. Eachof the user defined clusters will be represented internally by a centroid as far away from each other aspossible. Then each data point is associated with the closest centroid. The next step is to recalculate newcentroids and this process is repeated until the centroids do not move anymore. The goal of the algorithmis to minimize an objective function denoted by equation 1:
J =k∑
j=1
n∑i=1
∥∥∥x(j)i − cj
∥∥∥2 (1)
where∥∥∥xji − cj
∥∥∥2 is the distance measure between a datapoint x(j) and cluster center cj , is an indi-cator of the distance of the n data points from their perspective cluster center.
3https://keras.io/4https://github.com/Microsoft/cntk5https://github.com/Theano/Theano
Copyright 2017, DICE consortium All rights reserved 12

Deliverable 4.4. Quality anomaly detection and trace checking tools - Final version.
DBSCAN [8] is a density based data clustering algorithm that marks outliers based on the densityof the region they are located in. There are several advantages to using this algorithm. First, we don’thave to specify the number of clusters a priori as opposed to KMeans. Secondly, and most importantlyDBSCAN has the concept of noise or outliers which are in fact anomalies from the point of view of theDICE Methodology.
As with many algorithms DBSCAN has some limitations, some of which directly impact it’s useful-ness in DICE. First, because it is density based, its performance on large feature spaces is quite poor andthe amount of data points categorized as noise is unrealistic. Second, performance is largely dependenton the distance measure used. If the standard euclidian distance is used the problem of high dimensiondata is greatly increased.
EM [24] can be used to generate the best hypothesis for the distribution of parameters for multi-modal data. In this case we define the best hyphotesis as being the most likely one. This algorithm hasbeen successfully used in some for or another in the detection of anomalies for differernt types of usecases [27].
Isolation Forest [18] ’isolates’ observations by randomly selecting a feature and then randomly se-lecting a split value between the maximum and minimum values of the selected feature. Since recursivepartitioning can be represented by a tree structure, the number of splittings required to isolate a sample isequivalent to the path length from the root node to the terminating node. This path length, averaged overa forest of such random trees, is a measure of normality and our decision function. Random partitioningproduces noticeably shorter paths for anomalies. Hence, when a forest of random trees collectively pro-duce shorter path lengths for particular samples, they are highly likely to be anomalies.
Supervised
Random Forest [4] is a meta estimator that fits a number of decision tree classifiers on various sub-samples of a data-set. In order to improve accuracy and reduce overfitting it uses averaging. It can beused for classification as well as regression tasks. Bootstrap aggregation is used as a generalized trainingtechnique. Given a training set X = x1, ..., xn with the desired features as Y = y1, ..., yn, baggingrepeatedly (B times) and selecting random samples from the training set to which trees are fitted. Forb = 1, ..., B:
1. B training examples from X,Y (denoted as Xb, Yb)
2. Training of a regression tree fb on Xb, YB
After training, predictions for unseen sample x′
is made by averaging predictions from all distinctregression trees on x
′as seen in equation 2.
f = 1/B
B∑b=1
fb(x′) (2)
Decision Trees [2] are used as predictive models for observation (represented by the branches) toconclusions (represented by leaves). In our case the leaves of a learned decision tree will present classlabels while branches will represent conjunctions of features that lead to the labels. Algorithms usuallywork top down by choosing a variable at each step that best splits the set of items. The Gini impurityis a measure of how often a randomly chosen element would be incorrectly labeled. It is the sum ofthe probability pi of an item with label i being chosen times the probability 1 − pi of a mistake incategorizing that item. To compute Gini of a set of items with T classes, suppose i ∈ 1, 2, ..., T and letpi be the fraction of items labeled with class i in the set, see equation 3.
IG(p) =∑i 6=k
pipk (3)
AdaBoost [7] is a meta learning algorithm specially designed to tackle the curse of dimensionalityproblem related to the features present in a data-set. During training, AdaBoost selects only the featureswhich improve the predictive power of the model, thus leading to a reduction in the dimensionality of
Copyright 2017, DICE consortium All rights reserved 13

Deliverable 4.4. Quality anomaly detection and trace checking tools - Final version.
the data and a great potential to reduce execution time. A boost classifier as used in AdaBoost is definedas seen in equation 4
FT (x) =
T∑t=1
ft(x) (4)
where ft is a weak learner that takes an object x as input and returns a value indicating the class ofthe object. Each weak learner produces a hypothesis denoted by h(xi), for each sample in the trainingset. At each iteration t a learner is selected and a coefficient αt is assigned to it such that the trainingerror Et (equation 5) is minimized.
Et =∑i
E[Ft−1(xi) + αth(xi)] (5)
Neural Networks [25, 13, 26] are based on biological neural network and are designed to mimic the waya biological brain functions. It has a series of artificial neurons which are interconnected with weightedconnections. The number of layers (they are referred to as hidden layers) is a variable as well as thenumber of input and outputs of the neural network. In the context of anomaly detection, neural networksand deep neural networks have been extensively used. In DICE we aim to enable the use of not only feedforward but also of recurrent and even deep learning based neural networks.
2.1.3 Anomaly detection Implementation
The ADT is made up of a series of interconnected components that are controlled from a simplecommand line interface. An eclipse plugin was also developed for this tool which is integrated into theDICE IDE. A more user friendly interface is also possible.
In total there are 8 components that make up ADT. The general architecture can be seen in Figure3 These are meant to encompass each of the main functionalities and requirements identified in therequirements deliverable [12].
First we have the data connector(called dmon-connector) component which is used to connect toDMon. It is able to query the monitoring platform and also send it new data. This data can be used forboth detected anomalies or as training dataset for creating predictive models. For each of these types ofdata dmon-connector creates a different index inside DMon. In deliverable 4.3 [9] we detailed how wecreated an anomaly index that was rotated every 24 hours. In the latest version of ADT this behavior haschanged so that only one anomaly index is created and it is up to the user to decide when to purge it.This has been done in order to maximize the performance of the serving layer (i.e. DMon) as creatingpotentially hundreds of indexes of limited size is not efficient.
It is important to note that both DMon and ADT where tested on a container based deployment ofSpark. This was done in collaboration with the CloudLightning research project. In CloudLightning theyuse an Apache Mesos cluster on top of which they run Marathon6 container orchestrator. We managedto run DMon successfully on a container based deployment of Spark. No major issues where detected,DMon is fully capable of monitoring container based DIAs.
After the monitoring platform is queried the resulting dataset can be in JSON, CSV or RDF/XML.However, in some situations additional formatting is required. This is done by the data formatter com-ponent. It is able to normalize the data, filter different features from the dataset or even window thedata. The type of formatting the dataset may or may not need is highly dependent on the anomaly detec-tion method used. One example of additional formatting is that of categorical feature encoding. Someanomaly detection methods require categorical data to be reencoded, in these situations ADT has thecapability to encode these in a so called one hot encoding. This can be done automatically (ADT is ableto detect categorical features) or for user defined features.
The feature selection component is used to reduce the dimensionality of the dataset. Not all featuresof a dataset may be needed to train a predictive model for anomaly detection. So in some situations it is
6https://mesosphere.github.io/marathon/
Copyright 2017, DICE consortium All rights reserved 14

Deliverable 4.4. Quality anomaly detection and trace checking tools - Final version.
Figure 3: General overview of Anomaly Detection Stack.
important to have a mechanism that allows the selection of only the features that have a significant impacton the performance of the anomaly detection methods. Currently only two types of feature selection issupported. The first is Principal Component Analysis7 (from Weka) and Wrapper Methods. Because ofthe difficulties encountered during the integration of JVM based methods the PCA version implementedin scikit-learn is the recommended and the default one used.
The next two components (see Figure 3 model trainer and exporter) are used for training and thenvalidating predictive models for anomaly detection. For training a user must first select the type ofmethod desired. The dataset is then split up into training and validation subsets and later used for crossvalidation. The ratio of validation to training size can be set during this phase. Parameters related to eachmethod can also be set in this component. It is also possible to ”side load” training data into ADT.
Validation is handled by a specialized component which minimizes the risk of overfiting the modelas well as ensuring that out of sample performance is adequate. It does this by using cross validation andcomparing the performance of the current model with past ones. Crossvalidation can be ommited at userrequest.
Once validation is complete the model exporter component transforms the current model into a seri-alized loadable form. We will use the PMML [14] format wherever possible in order to ensure compat-ibility with as many machine learning frameworks as possible. This will also make the use of ADT in aproduction like environment much easier.
The resulting model can be uploaded into DMon. In fact the core services from DMon (specificallyElasticsearch) have the role of a serving layer from a lambda architecture. Both detected anomalies andtrained models are stored in DMon and can be queried directly from the monitoring platform. In essencethis means that other tools from the DICE toolchain need to know only the DMon endpoint in order tosee what anomalies have been detected.
Furthermore, the training and validation scenarios (see Figure 15) is in fact the batch layer whileunsupervised methods and/or loaded predictive models are the speed layer. Both these scenarios can beaccomplished by ADT. This integration will be further detailed in later sections.
The last component is the anomaly detection engine. It is responsible for detecting anomalies. Itis important to note that it is able to detect anomalies however it is unable to communicate them to theserving layer (i.e. DMon). It uses the dmon-connector component to accomplish this. The anomalydetection engine is also able to handle unsupervised learning methods. We can see this in Figure 3 inthat the Anomaly detection engine is in some ways a subcomponent of the model selector which selectboth pre-trained predictive models and unsupervised methods.
We can see in Figure 4 the sequence diagram for ADT and DMon. It is clearly observable that bothanomalies and predictive models are served and stored inside DMon.
7http://weka.sourceforge.net/doc.dev/weka/attributeSelection/PrincipalComponents.html
Copyright 2017, DICE consortium All rights reserved 15

Deliverable 4.4. Quality anomaly detection and trace checking tools - Final version.
Figure 4: ADT Sequence diagram.
2.1.4 Configuration
In order to run ADP we must execute the following command:$ python dmonadp.py <args>
There are currently two ways of configuring ADT. First we have the command line arguments andsecond we have the configuration file. The following paragraphs will deal with the command line argu-ments.
$ python dmonadp.py -h
Where the h argument lists a short help message detailing some basic usage of for ADT.
$ python dmonadp.py -f <file_location>
Where the f argument will define the configuration file is location. If the config file is not defined itwill use a default location with the name dmonadp.ini.
$ python dmonadp.py -e <es_endpoint>
Where the e argument allows the setting for the Elasticsearch endpoint. It is important to note thatADT is tightly integrated with DMon and requires both the controller and Elasticsearch endpoints.
$ python dmonadp.py -a <query> -t -m <method> -v <folds> -x <model>
Copyright 2017, DICE consortium All rights reserved 16

Deliverable 4.4. Quality anomaly detection and trace checking tools - Final version.
The query string is represented by a and is used to generate the final DMon query. The resultingdata will be used for training. The query is a standard elasticsearch query8 containing also the desiredtimeframe for the data. Also it can be in the form of the aggregated preset queries detailed later in thisdeliverable.
The t parameter if set instructs ADT to initiate the training of the predictive model. While m representthe method name used to create the predictive model (or clusterer). In order to run cross-validation thev parameter has to be set and will run for the number of fold defined by the use. In order to export themodel in PMML format the x parameter has to be set together with the model name. This user definedmodel name is used together with the model to generate the final model name. It is important to note thatthis name will be used to identify the model thus the user has the obligation to give it a suitable name.The last two arguments namely v and x, are optional and can be omitted.
$ python dmonadp.py -a <query> -d <model>
By setting the d parameter ADT will predict use the user defined predictive model to detect anomalies inthe incoming monitoring event stream.
2.1.5 Configuration File
The configuration file allows the definition of all of the arguments already listed. The settings passedas command line arguments will override any settings written in the configuration file. The file uses anini format which makes integration into the DICE IDE much simpler as this file format is extensivelyused in Eclipse. Listing 1 contains an example configuration file.Connector
The Connector section sets the parameters for use in connecting and querying DMon:•
• ESEndpoint - sets the current endpoint for DMon, it can be also in the form of a list if more thanone elasticsearch instance is used by DMon
• ESPort - sets the port for the elasticsearch instances. It is important to note that this setting isimportant for anomaly index creation and updating.
• DMonPort - sets the port for DMon
• From - sets the first timestamp for query, the use of time arithmetic of the form ”now-2h” is alsosupported.
• To - sets the second timestamp for query, lower bound
• Query - defines what metrics context to query from DMon
– each metric context is divided into subfields as follows:
∗ yarn - cluster, nn, nm, dfs, dn, mr∗ system - memory, load, network∗ spark - executor, driver∗ storm - all∗ cassandra - all∗ mongodb - all∗ userquery - the user can define a manually created elasticsearch query which will be
use instead of the aforementioned aggregated queries
• Nodes - list of desired nodes, if nothing specified than uses all available nodes8https://www.elastic.co/guide/en/elasticsearch/reference/current/query-dsl.html
Copyright 2017, DICE consortium All rights reserved 17

Deliverable 4.4. Quality anomaly detection and trace checking tools - Final version.
• QSize - sets the query size (number of instances), if set to 0 then no limit is set
• QInterval - sets aggregation interval
Each large context is delimited by ”;” while each subfield is divided by ”,”. Also QInterval must beset to the largest value if query contains both system and platform specific metrics. If the values are twofar apart it may cause issues while merging the metrics. In this case ADT will issue a warning to theuser. Another important point is that in some circumstances if the interval value is set to low DMon willnot be able to successfully aggregate the Elasticsearch response which might cause unwanted behavior.In order to fix this the interval should never be set lower than the interval set for the monitoring auxiliarycomponents from DMon.
The userquery aggregation option was added in the final version of ADT so that users which mightuse different technologies than the ones officially supported by DICE can use the anomaly detectionplatform. The query must be in JSON format and be stored in the queries directory. An example querycan be found in listing 2.
Mode
The Mode section defines the mode in which ADP will run. The options are as follows:• Training - If set to True the selected method will be trained using metrics collected from DMON
• Validate - If set to True the trained methods are compared and validated
• Detect - If set to True the trained model is used to decide if a given data instance is an anomaly ornot.
Filter
The Filter section is used to filter the collected data and can be used to select which features are usedfor anomaly detection. The options are as follows:
• Columns - Defines the columns to be used during training and/or detecting. Columns are delimitedby ”;”
• Rows - Defines the minimum (using ld) and maximum (using gd) of the metrics. The time formatused is utc.
• DColumns - Defines the columns to be removed from the dataset.
Detect
The Detect section is used for selecting the anomaly detection methods for both training and detectingas follows:
• Method - sets the desired anomaly detection method to be used (available ’skm’, ’em’, ’dbscan’,isolationforest, randomforest, decisiontree, adabost, neural)
• Type - type of anomaly detection (available ’clustering’, ’classification)
• Export - name of the exported predictive/clustering model
• Load - name of the predictive/clustering model to be loaded
If ’Export’ and ’Load’ is set to the same value then one a model is trained it will be automaticallyloaded and used to detect anomalies. If the model is not yet available then detect will try every 30 secondsuntil it detects a model with the given name. Since D4.3 [9] we have implemented a set of classificationalgorithms in addition to the clustering and density based ones.
Copyright 2017, DICE consortium All rights reserved 18

Deliverable 4.4. Quality anomaly detection and trace checking tools - Final version.
Point
The Point section is used to set threshold values for memory, load and network metrics to be usedduring point anomaly detection. This type of anomaly detection is run even if ’Train’ and ’Detect’ is setto False.Miscellaneous
The Misc section is used to set miscellaneous settings which are as follows:• heap - sets heap space max value for all JVM based AD method implementations
• checkpoint - If set to false, all metrics will be saved as csv files into the data directory otherwise alldata will be kept in memory as dataframes. It is important to note the if the data is kept in memoryprocessing will be much faster. If checkpointing is activated each pre-processing and processingstep will yield a csv file which serves as a checkpoint. If an operation fails or the platform crashesit will resume from the last checkpoint.
• delay - sets the query delay for point anomalies
• interval - similar to delay however it sets the query interval for complex anomalies
• resetindex - if set to True the ’anomalies’ index will be reset and all previously detected anomalieswill be deleted.
2.1.6 Method Settings
The MethodSettings section of the configuration files allows the setting of different parameters ofthe chosen training method. These parameters can’t be set using the command line arguments and ifnot defined will use default values. Some algorithms such as KMeans and EM will not be covered indetail in this deliverable as during testing these algorithms have proven to be of limited use for detectinganomalies. There available parameters can be found in the official ADT wiki9.
Unsupervised Methods
As mentioned in section DBSCAN is a density based data clustering algorithm that marks outliersbased on the density of the region they are located in. For this algorithm we support two versions.The first one is base on the Weka implementation of the algorithm while the second one is based onthe scikit-learn implementation. During testing we have found that the Weka implementations are notthat computationally efficient especially when considering the fact that they require the starting of aWeka JVM as a subprocess from inside ADT which can then execute training and validation. The twoimplementation have the following method settings:DBSCAN Weka10
• E - epsilon which denotes the maximum distance between two samples for them to be consideredas in the same neighborhood (default 0.9)
• M - the number of samples (or total weight) in a neighborhood for a point to be considered as acore point. This includes the point itself (default 6)
• D - distance measure (default weka.clusterers.forOPTICSAndDBScan.DataObjects.EuclideanDataOb-ject)
DBSCAN scikit-learn11
• eps - epsilon which denotes the maximum distance between two samples for them to be consideredas in the same neighborhood (default 0.5)
9https://github.com/dice-project/DICE-Anomaly-Detection-Tool/wiki10http://weka.sourceforge.net/doc.packages/optics dbScan/weka/clusterers/DBScan.html11http://scikit-learn.org/stable/modules/generated/sklearn.cluster.DBSCAN.html
Copyright 2017, DICE consortium All rights reserved 19

Deliverable 4.4. Quality anomaly detection and trace checking tools - Final version.
• min samples - The number of samples (or total weight) in a neighborhood for a point to be con-sidered as a core point. This includes the point itself (default 5)
• metric - metric used when calculating distance between instances in a feature array (default eu-clidean)
• Algorithm - the algorithm used by the nearest-neighbor module to compute pointwise distance andfind nearest neighbor (default auto)
• leaf size - leaf size passed to BallTree or cKDTree, this can affect the speed of the constructionand query, as well as the memory required to store the tree (default 30)
• p - the power of the Minkowski metric used to calculate distance between points (default None)
• n jobs - the number of parallel jobs to run (default 1, if -1 all cores are used)
IsolationForest12 implementation used is the one found in the scikit-learn library. It has the wollowingparameters:
• n estimators - number of base estimators in the ensemble (default 100)
• max samples - number of samples to draw to train each base estimator (default auto)
• contamination - the amount of contamination of the dataset, used when fitting to defined thresholdon the decision function (default 0.1)
• max features - the number of features to draw to train each base estimator (default 1.0)
• boostrap - if true individual trees are fit on random subsets of the training data sample with re-placements, if false sampling without replacement is performed (default false)
• n jobs - the number of jobs to run in parallel for both fit and predict, (default 1, if -1 all cores areused)
Supervised Methods
Random Forest parameters are:• n estimators - number of trees in the forest (default 10)
• criterion - function to measure the quality of the split; supported criteria are ”gini” for Gini impu-rity and ”entropy” for the information gain (default gini)
• min sample split - minimum number of samples required to split an internal node; if int it isconsidered the minimum sample if float it is a percentage (default 2)
• min sample leaf - minimum number of samples required to be at a leaf; if int it is considered theminimum sample if float it is a percentage (default 1)
• min weight fraction leaf - minimum weighted fraction of the sum total of weights required to bea leaf node (default 0)
• bootstrap - whether bootstrap samples are used when building trees (default True)
• n jobs - the number of jobs to run in parallel for both fit and predict, (default 1, if -1 all cores areused)
• random state - if int it is the seed used by the random number generator if None uses np.random(default None)
12http://scikit-learn.org/stable/modules/generated/sklearn.ensemble.IsolationForest.html
Copyright 2017, DICE consortium All rights reserved 20

Deliverable 4.4. Quality anomaly detection and trace checking tools - Final version.
Decision Tree parameters are:
• criterion - function to measure the quality of the split; supported criteria are ”gini” for Gini impu-rity and ”entropy” for the information gain (default gini)
• splitter - strategy used to chose the split at each node; strategies supported are ”best” for chose thebest split and ”random” to choose the best random split.
• max features - number of features to consider when looking for the best split (default None):
– if int represents the number of features
– if float represent the percentage of features at each split
– if ”auto” then maxfeatures = sqrt(nfeatures)
– if ”sqrt” then maxfeatures = sqrt(nfeatures)
– if ”log2” then maxfeatures = log2(nfeatures)
– if None then maxfeatures = nfeatures
• min sample split - the minimum number of samples reqired to split an internal node; if int it isconsidered the minimum sample if float it is a percentage (default 2)
• min weight fraction leaf - minimum weighted fraction of the sum total of weights required to bea leaf node (default 0)
• random state - if int it is the seed used by the random number generator if None uses np.random(default None)
AdaBoost parameters are:
• n estimator - number of trees in the forest (default 10)
• random state - if int it is the seed used by the random number generator if None uses np.random(default None)
• learning rate - learning rate shrinks the contribution of each classifier (default 1.)
Neural Network parameters are:
• hidden layer sizes - tuple, represents the number of elements in the hidden layer (default (100, ))
• max iter - maximum number of iterations until convergence (1e− 4) or this number of iterations
• activation - activation function for hidden layers (default relu):
– ’identity’, no-op activation f(x) = x
– ’logistic, sigmoid function f(x) = 1/(1 + exp(−x))
– ’tanh’, hyperbolic tan function, f(x) = tanh(x)
– ’relu’, rectified linear unit function, f(x) = max(0, x)
• solver - solver for weight optimization:
– ’lbfgs’ is a quasi-Newton method optimizer
– ’sgd’ stochastic gradient descent
– ’adam’ stochastic gradient-based optimizer proposed by Kingma, Diederik and Jimmy Ba
• batch size - size of mini-batches for stochastic optimizer
• learning rate- learning rate schedule for weight updates (default constant):
Copyright 2017, DICE consortium All rights reserved 21

Deliverable 4.4. Quality anomaly detection and trace checking tools - Final version.
– ’constant’ constant learning rate
– ’invscaling’ gradually decreases the learning rate at each timestep
– ’adaptive’ keeps the learning rate constant as long as training loss keeps decreasing
• momentum - momentum for gradient descent updates (default 0.9)
• alpha - L2 penalty (regularization term) parameter (default 0.0001)
This tool is still a work in progress. All commands and their behaviors are subject to changes. Pleaseconsult the official DICE repository changelog13 to see any significant changes.
2.1.7 Requirements
Table 2: Anomaly Detection Tool requirements
ID Title Priority Status CommentsR4.24 Anomaly detection in app quality MUST 3
R4.24.1 Unsupervised Anomaly Detection MUST 3ADT is capable of runningclustering based methods
R4.24.2 Supervised Anomaly Detection MUST 3
ADT is able to query andgenerate datasets fortraining and validation.
R4.24.3 Contextual Anomalies Should 3
Is possible to definefeature vectors that definecontext.
R4.24.4 Collective anomalies Should 3 Using the data formatter
R4.24.5 Predictive Model saving for AD MUST 3Is capable of generating PMMLor serialized predictive models
R4.24.6 Semi-automated data labeling Could 3Can be done via dmon-gencomponent.
R4.24.7 Adaptation of thresholding Could 3 User defined treasholding
R4.26.2 Report generation of analysis results Should 3Local generation ofreport is possible.
R4.36 AD between two versions of DIA MUST 3 Querying based on DIA tags
R4.37ADT should get inputparameters from IDE
MUST 3 DICE IDE plugin
In table 2 we can see the current status of the requirements related to ADT. Requirements markedwith an x are still to be started while the other ones are either started (grey) or fully operational (black).
2.2 Trace checking tool
In Deliverable D4.3 DICE-TraCT has already been presented as a stand-alone application, takingpart of the definition of the Anomaly Detection component in the DICE ecosystem. DICE-TraCT has thepurpose of enabling log analysis of the DIA implemented in Apache Storm by means of trace-checkingtechniques. To this end, DICE-TraCT exploits a direct connection to the monitoring platform (DMon)which is used to retrieve and collect log traces of the application currently analysed. The architecturepresented in D4.3 has already introduced the fundamental connections between DICE-TraCT and theIDE component and between DICE-TraCT and Dmon, not yet implemented at the time of delivering the
Copyright 2017, DICE consortium All rights reserved 22

Deliverable 4.4. Quality anomaly detection and trace checking tools - Final version.
Figure 5: Dependencies between DICE-TraCT, DMon and the IDE component
document. The following Figure 5 shows the architectural connections among the three components.By means of suitable API methods, available from Dmon (depicted on the left-hand side), DICE-
TraCT can:• activate a log monitoring session on the current application running in the deployed Storm topology
by calling
POST /dmon/v1/overlord/storm/logs
• visualize the list of the available logs that can be obtained from Dmon by calling
GET /dmon/v1/overlord/storm/logs
• collect the logs of the application that were stored in the specified session and that are available inthe platform
GET /dmon/v1/overlord/storm/logs/{log_name}
The REST calls required to implement such functionalities are arguments of deliverable D4.3 and willnot further explained in this document.
On the right-hand side of Figure 5, the connection between DICE-TraCT and the IDE has the purposeof enabling the trace-checking analysis by making the trace-checking service available to the DICE user,who enforces the iterative refinement of the DIA application through the quality analysis and enhance-ment tools.
This section elaborates on the implementation of the two connectors and shows the definition of thecore API that DICE-TraCT supplies as a REST service. In addition, besides the architectural relationsexisting among the components required by DICE-TraCT to perform the log analysis, the second argu-ment of the section is related to the extensions implemented in the last version of the tool and that havebeen included in the M30 release. In particular, these improvements affect one subcomponent of DICE-TraCT called Trace Checking Engine (TCE). According to Figure 6 in D4.3, DICE-TraCT is composedof three main components: DICE-TraCTor, Trace Checking Engine and Log Manager (LM).
• Trace Checking Engine (TCE) actually performs the trace analysis. The input is a time stampedlog of events and a property to analyze; the output is the result of the evaluation of the propertyover the specified log.
• Log Merger (LM) collects the logs that undergo the analysis and splits them into various smallerlogs, each one specific for a node of the Storm topology in analysis. Storm worker log mightcontain more than one sequence of events, each one associated with an executor spawned in thatworker. Therefore, to reduce the size of the analyzed logs, that can entail an onerous trace-checkinganalysis, DICE-TraCT first manipulates the collected logs to aggregate all the relevant events gen-erated by a node (or a subset of the nodes in the topology) into a new smaller log trace.
13https://github.com/dice-project/DICE-Anomaly-Detection-Tool/wiki/Changelog
Copyright 2017, DICE consortium All rights reserved 23

Deliverable 4.4. Quality anomaly detection and trace checking tools - Final version.
Figure 6: DICE-TraCT architecture
• DICE-TraCTor coordinates all of the activities carried out by DICE-TraCT. It manages the trace-checking request from the IDE, instructs LM and TCE and handles the communication with themonitoring platform.
The modification affecting TCE allows the use of different trace-checking engines. In the previousversion, TCE only dealt with one external solver whereas in M30 release TCE is able to select the mostappropriate engine based on the log analysis that the user wants to carry out.
2.2.1 DICE-TraCT REST API
DICE-TraCT can be accessed through a POST call with the following input data:• parameter ip and port specify the IP address and the port where the DICE-TraCT service is de-
ployed and running;
• the payload is a json descriptor which defines the trace-checking analysis to be carried out. Theformat of the json descriptor has been already shown in deliverable D4.3 and it is examined indetail afterwords.
The blue component in Figure 6 is implemented by a Flask 14 module dicetractservice.py,shown in Figure 7. DICE-TraCT is implemented by function dicetract() which is associated withthe POST method /run. Line 1 of Figure 7 specifies that /run is a POST method. DICE-TraCTorcomponent of DICE-TraCT is called at line 6 through function dicetractor(), which is invokedwith parameter request.get json() returning the JSON payload of the call.
Assuming that DICE-TraCT is deployed at dicetracturl on port 5050 and that the monitoring platformis deployed at dmonurl at port dmonport, an example of a method call can be the following:
POST http://dicetracturl:5050/run?ip=dmonurl&port=dmonport
The payload associated with the POST call is obtained, at line 6, through the request.get json()function which is specified as a parameter of dicetractor() function. An example of a possiblepayload that DICE-TraCT can manage is shown if Figure 8. It specifies two trace-checking tasks for thenodes “word” and “exclaim1” of ExclamationTopology, a simple Storm benchmark application which isdistributed within the Storm framework and that was used to validate DICE-TraCT.
The json descriptor consists of two main items: the topology name, specified by the key “topology-name”, and a list of descriptors of the trace-checking instances for each node in the tuple associated withthe key “nodes”. Each node descriptor provides the following data.
• The name of the node to analyze is specified in the “name” string. The specified identifiers mustmatch the names that are used in the deployed topology and that appear in the log files associatedwith the events of the nodes in the topology.
14http://flask.pocoo.org/
Copyright 2017, DICE consortium All rights reserved 24

Deliverable 4.4. Quality anomaly detection and trace checking tools - Final version.
1 @app.route(’/run’, methods=[’POST’])2 def dicetract():3 result = None45 if (request.args.get(’ip’) ... ):6 result = dicetractor(..., request.get_json())7 else:8 result = -19
10 # return a string version of the list containing results11 if (result == -1):12 # send error to the caller13 else14 # send the response to the caller
Figure 7: POST method implementing DICE-TraCT main service in dicetractservice.py.
1 {2 "topologyname": "ATopology",3 "nodes": [4 {5 "name": "exclaim1",6 "type": "bolt",7 "parameter": "sigma",8 "timewindow": 3600,9 "method": "counting",
10 "relation": "=",11 "designvalue": "0.8"12 },13 {14 "name": "word",15 "type": "spout",16 "parameter": "spoutrate",17 "timewindow": 3600,18 "timesubwindow": "36",19 "method": "average",20 "relation": "<",21 "designvalue": "0.3"22 }23 ]24 }
Figure 8: An example of payload specifying two trace-checking analysis on spout “word” and bolt“exclaim1” of ExclamationTopology.
• The “type” of node can be either a “spout” or a “bolt” (Storm topologies are defined by graphs ofcomputational nodes. Spouts are the data sources of a topology and always produce messages -or tuples - that are elaborated by the bolts. Bolts receive tuples from one or more nodes and sendtheir outcome to other bolts, unless they are final. In this last case, a bolt does not emit tuples).
• The parameter (or property) that the analysis has to consider for the node. The current implemen-
Copyright 2017, DICE consortium All rights reserved 25

Deliverable 4.4. Quality anomaly detection and trace checking tools - Final version.
tation of DICE-TraCT only deals two two distinct parameters for the quality analysis assessmentand they are tightly related to the verification analysis that is carried out by D-VerT accordingto the line presented in deliverables D3.5 DICE Verification tool Initial version. In particular,the two possible parameters are: “spoutrate” and “sigma”. “Spoutrate” is the emitting rate of aspout node, defined as the number of tuple emitted per second, and “sigma” is the ratio betweenthe number of tuples produced by a bolt node in output and the number of tuples that it has arereceived in input.
• The length of the time window limiting the trace-checking analysis. The size, specified by the valueof the key “window”, determines how many log events are considered to carry out the evaluationof the property defined by “parameter”. The unit measurement is the millisecond.
• The kind of the analysis, that DICE-TraCT has to use to calculate the value of the property, is spec-ified in the method keyword. The analysis is performed by running the engine that is specific forthe property to be verified. This feature was not implemented in the first release of DICE-TraCTand it represents one improvement that is implemented for the final release. The first implemen-tation of DICE-TraCT exploited a trace-checking procedure that is based on a logical approach.Logical languages involved in the trace checking analysis are usually extensions of metric tempo-ral logics which offer special operators called aggregating modalities. These operators are usefulto count events in the logs or calculate an average on the occurrences over a certain time windowand compare the value with a given threshold. Therefore, the outcome is always a boolean answer.DICE-TraCT is based on Soloist language[3]. The current implementation of DICE-TraCT canalso call a simpler trace-checker (called SimpleTC) than the one for Soloist, that is developed toprovide quantitative information calculated from the logs: specifically, the value of the emit ratefor the spouts and the sigma of bolts can be directly extracted from the logs and provided to theuser. The possible values of the key “method” are:
counting : it enables the evaluation of the “parameter” by means of the so called Countingformulae of the Soloist logic. This choice will call the Soloists trace-checker (https://bitbucket.org/krle/mtlmapreduce/overview).
”average” : it enables the evaluation of the “parameter” by means of the so called Averageformulae of the Soloist logic. This choice will call the Soloists trace-checker (https://bitbucket.org/krle/mtlmapreduce/overview).
quantitative : it enables the quantitative analysis of the logs which extracts the value of “param-eter”. This method will call SimpleTC engine.
• The analysis instantiated by the Soloist trace checker is designed to provide a boolean result calcu-lated by comparing the number of occurrences of an event in the log with a user defined threshold.The relation “<”, “=” or “>” is specified by “relation” and the threshold value is provided in“designvalue” key.
For each instance descriptor in the JSON payload, DICE-TraCT carries out the proper trace-checkinganalysis. The trace-checking engine and the Soloist formula for the analysis are identified in DICE-TraCT by means of a specific hierachy of classes defined in the module formula.py.
• Formula is an abstract class and the root of the hierarchy.
• SpoutRateAverage and SpoutRateCounting are the subclass of Formula representing the analysisis the emit rate of spout nodes by means of average and counting criteria.
• SigmaAverage and SigmaCounting are the subclass of Formula representing the analysis is thesigma value of bolt nodes by means of average and conting criteria.
• SigmaQuantitative and SpoutRateQuantitative are the two classes enabling the quantitative analy-sis of logs.
Copyright 2017, DICE consortium All rights reserved 26

Deliverable 4.4. Quality anomaly detection and trace checking tools - Final version.
2.2.2 Trace Checking Engine - TCE
The core part of DICE-TraCT hinges on a specific object implementing class TCRunner, which isdefined based on the trace-checking analysis specified in the payload of the REST call /run. Theportion of code shown in Figure 9 is a part of function dicestractor() which in responsibleof performing all the trace-checking instances in the tc instances. Variable tc instances isa TCRunner object which is instantiated with the information derived from the payload in variabletc descriptor. tc instances is an iterable object and each element in tc instances is a(solvable) trace-checking instance that can be actually carried out by calling the engine associated with itby means of the function call i.run() at line 4. If no errors occurred while calling the trace-checkingengine, the outcome of the analysis is appended to the result list in variable result, which is returnedto the caller at the end of all the trace-checking tasks at line 12.
1 tc_instances = TCRunner(tc_descriptor)2 for i in tc_instances:3 try:4 i.run()5 if (i.getResult()):6 result.append(i.getResult())7 else:8 # return error9 except Exception, err_msg:
10 # return error11 return result
Figure 9: Portion of code showing the use of the iterator pattern on the trace-checking instances obtainedfrom the TCRunner object tc instances.
Component TCE in DICE-TraCT is implemented by TCRunner class in the dicetract.py mod-ule. TCE has been improved in the M30 release to allow trace-checking analysis with Soloist trace-checking engine and with SimpleTC engine, the latter specifically developed to allow the extraction ofquantitative values of emit rate for spout and sigma for bolts.
2.2.3 Trace-checking Runner
TCRunner returns an iterator on a set of trace-checking instances, each one associated with an ele-ment of the list in the value of the key “nodes” of the payloads provided with the call to /run. Eachtrace-checking instance represents a trace-checking problem that can be solved with one of the availableengines. The solver is selected based on the subclass of Formula that contribute to the definition of theproblem instance and that is derived from the description of the analysis in the payload (through thekeys “parameter” and “method”). TCRunner includes a chain-of-responsibility defined by the availabletrace-checking engines that can be used to select the most appropriate engine to solve an instance.
The portion of code in Figure 10 is an excerpt of the implementation of the class TCRunner. The con-structor method instantiates, at line 5 and 6 respectively, the two solvers: the first one is sparkTC, withan attrbute of class with class SparkTCSolver(), and the second one is simpleTC, with an attributeof class SimpleTCSolver(). In addition, it declares a chain-of-responsibility composed by meansof the two solvers, at line 8. TCRunner implements method next(), which returns a trace-checkinginstance properly set with the formula to analyze and the node undergoing the analysis. This method ac-tually realizes the iterator behavior of the class. The method call to getRunnableTCInstance(),at line 15, allows TCRunner to visit the chain-of-responsibility and obtain the suitable trace-checkingsolver that can manage the problem instance defined for node and the formula in analysis.
Copyright 2017, DICE consortium All rights reserved 27

Deliverable 4.4. Quality anomaly detection and trace checking tools - Final version.
1 class TCRunner():23 def __init__(self, tc_descriptor):4 # Declaration of Chain-Of-Responsibility handlers5 self.sparkTC = SparkTCSolver()6 self.simpleTC = SimpleTCSolver()78 self.sparkTC.setSuccessor(self.simpleTC)9
10 def next(self):11 if (there are trace-checking instances to solve):12 # define the formula to solve based on tc_descriptor1314 # return a TCInstance specifying the node and the formula15 return self.sparkTC.getRunnableTCInstance(node[’name’], formula)16 else:17 raise StopIteration()
Figure 10: Class TCRunner and (i) the declaration of the chain-of-responsibility with sparkTC andsimpleTC instances, (ii) the method next() implementing the iterator on the solvable trace-checkinginstances.
2.2.4 Trace-checking Instance
A trace-checking instance is represented by the class TCInstance. It implements the design patternChain-of-Responsibility to allow the selection of the trace-checking engine to be used for the resolution.Therefore, TCInstance is an abstract class providing
• two methods setSuccessor() and getRunnableTCInstance() implementing the pat-tern and
• the abstract method run(), that actually executes the solver on the problem instance and that isimplemented by the concrete classes SparkTCSolver and SimpleTCSolver, being them associatedwith an existing trace-checking engine.
Figure 11 shows the main structure of the classSparkTCSolver and SimpleTCSolver are the two implementations of TCSolver representing the
Soloist trace-checker and the Simple trace-checker. Both implement the abstract method canProcess()based on their solving capabilities. The outcome of the method is a boolean that determines if the formulaprovided in the parameter of the call can be undertaken by the solver.
SparkTCSolver deals with the trace-checking instances that can be solved by the Soloist trace-checker, which is implemented in Spark; whereas SimpleTCSolver captures the instances that are solvedby SimpleTC. For the sake of brevity, only an excerpt of SimpleTC is provided in Figure 12, as detailson the Soloist trace-checker was already described in the previous deliverable D3.4. SimpleTC can han-dle formulae of type SigmaQuantitative and SpoutRateQuantitative. Hence, method canProcess()checks that the trace-checking instance, represented by the formula to be verified, has type SigmaQuan-titative and SpoutRateQuantitative. Method run() actually launches the SimpleTC on the logs thathas been obtained by component LM (see Figure 6), according to what has already been explained indeliverable D4.3.
2.2.5 Monitoring connectors
DICE-TraCT exploits two different log retrieval features. The first one is developed for testing pur-poses and does not require a running monitoring platform (“nodmon” mode). The second one, on the
Copyright 2017, DICE consortium All rights reserved 28

Deliverable 4.4. Quality anomaly detection and trace checking tools - Final version.
1 class TCInstance():2 ...34 @abc.abstractmethod5 def canProcess(self, formula):6 pass78 @abc.abstractmethod9 def run(self):
10 pass1112 def setSuccessor(self, successor):13 self.successor = successor1415 def getRunnableTCInstance(self, node, formula):16 if (self.canProcess(formula)):17 self.setTCInstance(node, formula)18 return self19 else:20 return self.successor.getRunnableTCInstance(node, formula)
Figure 11: Class TCInstance and the implementation of the Chain-of-Responsibility pattern methodssetSuccessor() and getRunnableTCInstance().
1 class SimpleTCSolver( TCInstance ):23 def __init__(self, nodename=None, formula=None):4 ...5 # declaration of a SimpleTC solver6 self.tc = SimpleTC()78 ...9
10 def canProcess(self, formula):11 if ( (type(formula) is SigmaQuantitative) or12 (type(formula) is SpoutRateQuantitative) ):13 return True14 else:15 return False1617 def run(self):18 self.tc.run(self.__nodename, self.__formula)
Figure 12: Class SimpleTCSolver and the two methods canProcess() and run().
other hand, implements the communication with a running instance of DMon that might be working lo-cally or remotely. RemoteDMonConnector is the class in module dicetract.py that instrumentsthe REST calls to DMon to retrieve the application logs from the monitoring platform. Figure 13 showsthe fundamental methods that realize the functionality of the connector to the DMon platform.
• getTopologyDescriptor() is the main method that builds the topology descriptor associ-ated with the analysis to be performed. A topology descriptor is a json file specifying the list
Copyright 2017, DICE consortium All rights reserved 29

Deliverable 4.4. Quality anomaly detection and trace checking tools - Final version.
of all the log files where each node of the topology appers. The information included therein arefundamental to carry out the functionality of component LM (already detailed in deliverable D4.3).
• availableStormLogs() retrieves the list of all the collected logs available in DMon, bycalling the method GET /v1/overlord/storm/logs/.
• whichLog() provides the capability for selecting the proper log files archive from DMon basedon the characteristic of the trace-checking analysis specified by the user.
• getStormLog(): calls the method GET /v1/overlord/storm/logs/{workerlog}specifiying the “workerlog” to download. The obtained file is then used to perform the analysis.
1 class RemoteDMonConnector( AbstractDMonConnector ):23 def getTopologyDescriptor(self, jsonscript, regexp_descriptor):45 topology_descriptor = None67 if (self.checkDMonOn()):8 # build a topology_descriptor9
10 return topology_descriptor1112 def whichLog(self, jsonscript):13 # select the proper workerlog file to be downloaded from Dmon,14 # based on the requirement in the jsonscript parameter1516 def availableStormLogs(self):17 # call GET /v1/overlord/storm/logs/ of DMon to retrieve18 # the list of available workerlogs1920 def getStormLog(self, workerlogToCheck):21 # call GET /v1/overlord/storm/logs/{workerlogs} of DMon
Figure 13: RemoteDMonConnector class in dicetract.py
Requirements
This paragraph reports on the achievements obtained for the trace checking tool. Table 3 providesthe most relevant requirements and shows the degree of completion.
Copyright 2017, DICE consortium All rights reserved 30

Deliverable 4.4. Quality anomaly detection and trace checking tools - Final version.
Listing 1: Configuration file for ADT1 [ Connec to r ]2 ESEndpoint : 8 5 . 1 2 0 . 2 0 6 . 2 73 ESPor t :92004 DMonPort :50015 From :14791053622846 To :14791197699787 Query : ya rn : c l u s t e r , nn , nm , dfs , dn , mr ; sys tem8 Nodes :9 QSize : 0
10 Q I n t e r v a l : 1 0 s1112 [ Mode ]13 T r a i n i n g : t r u e14 V a l i d a t e : F a l s e15 D e t e c t : f a l s e1617 [ F i l t e r ]18 Columns : colname ; colname2 ; colname319 Rows : l d : 1 4 5 6 0 7 9 7 9 ; gd :14560797920 DColumns : colname ; colname2 ; colname32122 [ D e t e c t ]23 Method : skm24 Type : c l u s t e r i n g25 Ex po r t : t e s t 126 Load : t e s t 12728 [ M e t h o d S e t t i n g s ]29 n : 1 030 s : 1 03132 [ P o i n t ]33 Memory : cached : gd : 2 3 1 3 1 3 ; b u f f e r e d : l d : 3 1 2 1 2 3 ; used : l d : 1 2 3 1 3 ; f r e e : gd :2312334 Load : s h o r t t e r m : gd : 2 . 0 ; midterm : l d : 0 . 1 ; l o n g t e r m : gd : 1 . 035 Network : t x : gd : 3 4 3 4 4 ; rx : l d :3234343637 [ Misc ]38 heap :512m39 c h e c k p o i n t : f a l s e40 d e l a y : 2m41 i n t e r v a l : 1 5m42 r e s e t i n d e x : f a l s e
Copyright 2017, DICE consortium All rights reserved 31
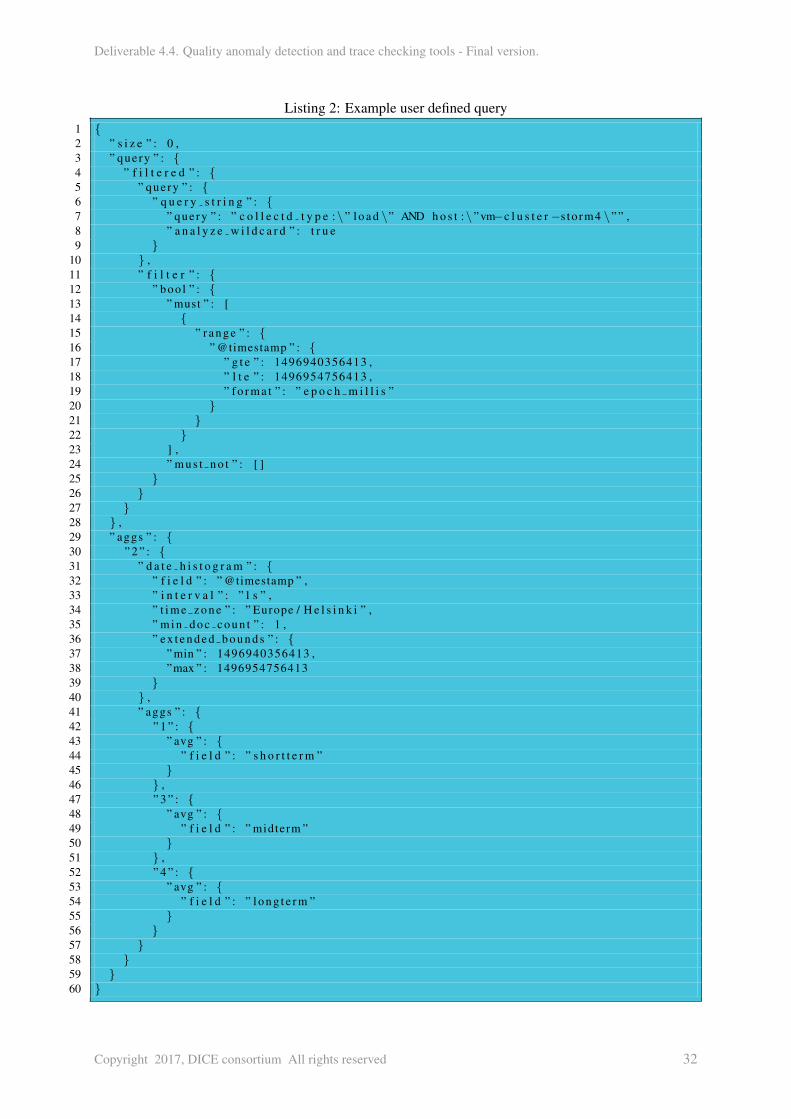
Deliverable 4.4. Quality anomaly detection and trace checking tools - Final version.
Listing 2: Example user defined query1 {2 ” s i z e ” : 0 ,3 ” que ry ” : {4 ” f i l t e r e d ” : {5 ” que ry ” : {6 ” q u e r y s t r i n g ” : {7 ” que ry ” : ” c o l l e c t d t y p e :\ ” l o a d \” AND h o s t :\ ”vm−c l u s t e r −s to rm4 \”” ,8 ” a n a l y z e w i l d c a r d ” : t r u e9 }
10 } ,11 ” f i l t e r ” : {12 ” boo l ” : {13 ” must ” : [14 {15 ” r a n g e ” : {16 ” @timestamp ” : {17 ” g t e ” : 1496940356413 ,18 ” l t e ” : 1496954756413 ,19 ” f o r m a t ” : ” e p o c h m i l l i s ”20 }21 }22 }23 ] ,24 ” m u s t n o t ” : [ ]25 }26 }27 }28 } ,29 ” aggs ” : {30 ” 2 ” : {31 ” d a t e h i s t o g r a m ” : {32 ” f i e l d ” : ” @timestamp ” ,33 ” i n t e r v a l ” : ”1 s ” ,34 ” t i m e z o n e ” : ” Europe / H e l s i n k i ” ,35 ” m i n d o c c o u n t ” : 1 ,36 ” e x t e n d e d b o u n d s ” : {37 ” min ” : 1496940356413 ,38 ”max ” : 149695475641339 }40 } ,41 ” aggs ” : {42 ” 1 ” : {43 ” avg ” : {44 ” f i e l d ” : ” s h o r t t e r m ”45 }46 } ,47 ” 3 ” : {48 ” avg ” : {49 ” f i e l d ” : ” midterm ”50 }51 } ,52 ” 4 ” : {53 ” avg ” : {54 ” f i e l d ” : ” l o n g t e r m ”55 }56 }57 }58 }59 }60 }
Copyright 2017, DICE consortium All rights reserved 32

Deliverable 4.4. Quality anomaly detection and trace checking tools - Final version.
Table 3: Trace Checking tool requirements
IF Title Priority Status CommentsR4.28 Safety and privacy
properties loadingMUST 3
R4.26 Report generation ofanalysis results
Should 3 Trace checking results areshown in the DICE IDE.
R4.28 Safety and privacyproperties loading
MUST 3 Log analysis is based on thekind of property the user
chooses.R4.28.1 Definition of time
window of interestfor safety/privacy
properties
MUST 3 Storm monitoring allows theuser to select the the time
window.
R4.29 Event occurrencesdetection for safety
and privacypropertiesmonitoring
MUST 3 DICE-TraCT implements thelogic to customize how to select
events from Storm logs.
R4.30 Safety and privacypropertiesmonitoring
MUST 3 Storm monitoring is currentlysupported.
R4.30.1 Safety and privacyproperties result
reporting
MUST 3
R4.31 Feedback fromsafety and privacy
propertiesmonitoring to UML
models
Could 3
R4.30 Safety and privacypropertiesmonitoring
MUST 3 Privacy properties are notsupported yet. Safety propertiesare related to some parameters
of the verification modelR4.32 Correlation between
data stored in theDW and DICEUML models
MUST 3 The case of Storm applicationhas been studied to verify the
need of instrumenting thesource code.
Copyright 2017, DICE consortium All rights reserved 33

Deliverable 4.4. Quality anomaly detection and trace checking tools - Final version.
3 Use cases
This section details what use cases are handled by each tool. It shows the main workflow for ADTas well as that of TraCT. For the Regression based AD the input parameters for the method are detailedas well as example configuration files.
3.1 Anomaly Detection
Anomaly detection tool will check for anomalies during the runtime of a deployed application on awide range of Big Data frameworks. These frameworks are unchanged from those supported by the DICEMonitoring platform (DMon) [17]. In the case of unsupervised anomaly detection methods the queryingof DMon will result in the generation of the data sets on which these methods will operate. In essence theonly thing that the end user needs to do is to specify the query string and the desired time frame. Thereare several operations made available by ADT which enable the reencoding and filtering of features asdetailed in section 2.1.5. It is important to remember that the bigger the time frame specified the moreaccurate the anomaly detection becomes. The tradeoff is that querying as well as cluster creation becomecomputationally more expensive the bigger the query time frame is.
For supervised anomaly detection methods this is a bit more complicated as it is not enough to givethe query string and time frame. The data sets must be labeled in order to create a viable training andvalidating data set. Once this is done the resulting predictive models can be easily applied at runtime.
Figure 14: Anomaly Detection flow.
Figure 14 show the basic flow of data between all components of ADT. It is easy to see that there aretwo branching workflows. The first one is meant for training and validating the aforementioned predictivemodels while the second one is meant for unsupervised methods and the loading of the validated models.
It is important to note that the method selector and anomaly detection engine are the two tools re-quired for detecting and signaling anomalies. The method selector is used to select between unsuper-vised and supervised methods (including their runtime parameters). This component is also responsiblefor loading pre-trained predictive models. The anomaly detection engine is in charge of instantiating theselected methods and signalling to the dmonconnector any and all detected anomalies.
We can think of the first branch as the batch layer of a lambda architecture. Once it trains andvalidates a model it sends it to be stored and indexed into DMon. From there the second branch candownload it and instantiate it. This in essence represents the speed layer. There can be more than oneinstance of ADT at the same time so scaling should not pose a significant problem.
3.1.1 Training Data
In deliverable D5.5 we have introduced the dmon-gen too which is used to define different Big Dataand DIAs related jobs thus ensuring semi-supervised labeling of training data. In some instances this isnot available. For instance if a developer is using the DICE solution to develop and deploy his DIA the
Copyright 2017, DICE consortium All rights reserved 34

Deliverable 4.4. Quality anomaly detection and trace checking tools - Final version.
first versions of the application will not have known anomalies. In these kinds of instances unsupervisedmethods are extremely useful allowing the detection of anomalous events soley based on the avilabledata.
There are several problems with this approach. The first problem is that we cannot distinguish be-tween different types of anomalies, we only know that a particular event is anomalous when comparedto the others. Secondly, the incidence of false positives can be significant. Because of this we havedeveloped a method of boostraping labeled training data suing the output of unsupervised methods.
First we run the Isolation forest algorithm in order to detect anomalous events. Then we isolate theresulting anomalies and cluster these using DBSCAN. This will create clusters of anomalies, in essencecreating labels for them. This is not an optimal solution as the clustered anomalies are still largelymeaningless for the developer. It is meant to help the developer or architect in identifying the underlyingcause of the anomalies. Finally, the clustered information is added back into the original data set thuscreating a first iteration of a training set. This can later be fine tuned, anomalies can be added or removedas required.
Thus ADT facility aids in creating valid training sets for predictive model training. ADT is also ableto accept manually created training and validation data sets. If no validation set is defined ADT can splitthe user defined labeled data set into two parts training and validation. At the same time the user candefine what percentage of the original set is to be defined as the validation sets. All datapoints selectedto be in the validation set are chosen randomly ensuring that during cross validation we do not fall preyto cherry picking.
3.1.2 Parameter Selection
During the development of ADT we have found that most algorithms have a large set of availableparameters that can be fine tuned. This fine tuning requires extensive knowledge of the underlyingalgorithms which can result in low uptake of ADT as most novice user will be overwhelmed. In order tomitigate this as much as possible we have implemented a GridSearch method which allows the definitionof the parameter space for any given method which is then used for an exhaustive search. At the end ofthis optimization step the best combaination is retained and used for the final predictive model creation.
This step has to be run only once as long as the data set has the same feature dimensionality. The re-sulting model has a very good chance to outperform any naively chose parameters. It requires no futherinput from the user while at the same time guaranteeing exelent detection performance of all trainedmodels. Sadly there is one downside to this method. It requires a lot of computational resources for largeparameter search spaces. One solution is to define a set of parameter vectors to the grid search methodwhich it then uses to perform the optimizations instead of just individual parameter values.
3.2 Trace Checking tool
DICE-TraCT has been developed to perform log analysis of Storm applications. It is used to assessthe runtime behavior of a deployed application as log traces collected from the monitoring platform areanalyzed to certify the adherence to the behavioral model that is assumed at design time. If the runtimebehavior does not conform to the design, then the design must be refined and later verified to obtain anew certification of correctness.
Trace-checking can be applied to supply information to the verification task carried out by D-VerT(details can be found in DICE Verification Tool - Initial version [19]). Verification of Storm topologiestakes place at DTSM level on UML models enriched with information needed to represent the applicationbehavior over time. To verify DTSM models with D-VerT, the designer must provide some parametervalues that abstract the (temporal) behavior of spouts and bolts. Trace checking extracts from real ex-ecutions the parameter values of the model used by D-VerT that are not available from the monitoringservice of the framework, as they are inherently specific of the modeling adopted for the verification. Anexample of such a parameter is the ratio between the number of messages that are received by a bolt andthe number of messages that it emits in output.
The second class of property concerns privacy aspects of the applications. Privacy constraints might
Copyright 2017, DICE consortium All rights reserved 35

Deliverable 4.4. Quality anomaly detection and trace checking tools - Final version.
be specified at the DPIM level by means of suitable classes, annotations and new ad-hoc constraintsthat impose the accessing restrictions applied to the users of the resources in a database. Checking theintegrity of the deployed and running application can be achieved through the analysis of the applicationlogs against suitable properties that are annotated by the user in the application model. An examinationof this problem and a solution based on trace-checking techniques has been presented in [15] and alsoreported in the final methodology document D2.4 - Deployment abstractions - Final Version.
Copyright 2017, DICE consortium All rights reserved 36

Deliverable 4.4. Quality anomaly detection and trace checking tools - Final version.
4 Integration and Validation
This section covers integration as well as validation issues for each tool. The first subsection will dealwith both ADT as well as Regression based AD and how it interacts with the overall DMon Architecture.The second section details the Trace Checking tool and how it combines logs and checks for sequentialanomalies.
4.1 Anomaly Detection
Integration
ADT has a closer integration with DMon than with other tools from the DICE solution. This ismainly due to two facts. Firstly, ADT needs data on which to run anomaly detection methods. Thus it isextremely important to have data available in a format which is usable. Second, ADT together with themonitoring forms a lambda architecture. Each instance of ADT can have the role of batch or speed layerwhile DMon has the role of a serving layer. For more details see Figure 15.
Figure 15: Anomaly detection integration with DMON.
As mentioned before the detected anomalies are sent and indexed into DMon. All DICE actorsand tools will be able to query this special index to see/listen for detected anomalies. In this way it ispossible to create specialized ADT instances for each anomaly detection method in part. The result willbe reflected in the same index from DMon. This architecture also allows us to serve the results of boththe monitoring and anomaly detection on the same endpoint (DMon).
All anomaly detection methods used have their predictive models (be they clusterers or predictivemodels for classification) serialized or saved in PMML format. In order to completely implement alambda type architecture we have to ensure that the trained models are versioned and saved inside DMon(serving layer). Figure 16 shows the REST API resources used for saving and versioning. This featurefrom DMon is a heavily modified version of the Artifact Repository from the FP7 MODAClouds researchproject [22].
The artifact are stored directly on the file system. The file hierarchy is directly mirrored from the URLstructure shown in figure 16. This means that the folder structure will include folders for repositories,artifacts, versions and the models. Thus making interrogation extremely intuitive. Another bonus ofusing a simple file system based approach is the ability to use rsync as the synchronization mechanismbetween artifact repository models. In order to support multicloud environments the artifact repositoryis able to sync contents between different instances of DMon.
For the artifact repository to be fully usable in DICE we had to make 2 major modifications. First, weadded the capability to store some metadata about the models stored in the repository pertaining to the
Copyright 2017, DICE consortium All rights reserved 37

Deliverable 4.4. Quality anomaly detection and trace checking tools - Final version.
Figure 16: DMon Predictive model saving resources
shape of the data set (rows and columns), the method parameter settings used and finally the performanceor score. This enables the fast checking of weather a stored predictive mode is usable on a particular dataset and what it’s overall score is. Versioning of the models is done via the naming convention used for themodels. The first part of the name represents the model used for training, the second part is the uniqueidentifier of the model (this can be user defined or by default is set as the application tag from DMon).The last part of a name is the timestamp of the model creation.
Second, we completely integrated the artifact repository into DMon as opposed to having a separateservice. This allows a vastly simplified usage pattern and integration. Tools such as the ADT will onlyrequire the access point of DMon for both data fetching and anomaly reporting. From figure 16 we cansee that inside DMon we organize models into repositories which can have several artifact which canhave different versions.
For this version of ADT we have also implemented an Eclipse plugin ) that is part of the integrationwith the DICE IDE as seen in figure 17. The plugins main goal is to generate the ADT configurationfile and start the execution. All outputs from ADT (which are not sent to DMon) are shown inside thisplugin. At this point we should mention that if ADT is run from Windows in some circumstance it willsuffer from slow performance.
This is due to the multiprocessing module which behaves differently on Linux and Windows. InLinux multiprocessing uses the fork system call to create a child process with all the same resources asthe parent while on Windows a new python interpreter has to be spawned and all the information neededby the child has to be passed as an argument. This difference is only evident during one preprocessingoperation in ADT, namely the reencoding of a data set.
Validation
As mentioned in section some anomaly detection methods, more precisely the ones using supervisedlearning techniques, need labeled data in order to function properly. This is a fairly complicated thing toaccomplish. One solution is to label all normal data instances and all unlabelled instances are consideredanomalies. In most systems the normal data instances far outnumber the anomalous ones so labelingthem is extremely impractical. We have detailed several method of ensuring that novice users are able totrain and use anomaly detection methods using ADT, see section 3.1 for more details.
Copyright 2017, DICE consortium All rights reserved 38

Deliverable 4.4. Quality anomaly detection and trace checking tools - Final version.
Figure 17: DICE IDE plugin for ADT
POSIDONIA Operations is an integrated port operations management system. Its mission consistson globally monitor vessels positions in real time to improve and automatize port authoritys operations.In the use case, some scenarios are considered. The deployment or the Posidonia system on the cloudconsidering different parameters, supporting different vessel traffic intensities, adding new business rules(high CPU demand), running simulation scenario to evaluate performance and quality metrics. PosidoniaOperations core functionality is based on analysing a real-time stream of messages that represent vesselspositions to detect and emit events that occur on the real world (a berthing, an anchorage, a bunkering,etc.).
One of the software components of the Posidonia Operations is the CEP, Complex Event Processing,engine which analyse all the AIS messages in order to detect patterns and create the corresponding events.One of the types of requirements of the Posidonia Operations use case is the Assessment of the impact inperformance after changes in software or conditions. The changes in software and conditions include: (1)Adding, modifying and removing the rules of the existing CEPs,(2) Adding or removing CEPs (since wecan have more than one CEP processing the incoming flow of AIS messages), (3)Increasing or decreasingthe input message rate. The Anomaly Detection Tool is used to fulfill these requirements. During thedevelopment phases of the Posidonia use case, the Anomaly Detection Tool has been validated to detectanomalies related with the cost execution time of the different events that the CEP component analyses,this cost impact directly in the performance of the system.
As validation for ADT we used the POSIDONIA use case [11] as well as the Wikistat toy applicationsStorm topology related metrics.
The data available for the POSIDONIA usecase has 6 features in it, all extracted by DMon from rawlog information. It is important to mention that not all features are useful when it comes to testing ADT.We eliminated/filtered the host and ship features as the former one is essentially a constant in the currentdeployment (having a cardinality of one). The latter represents the unique identifier of the ship to whichthe metrics are relating. ADT is designed to offer DIA performance related anomaly detection so weonly need metrics related to what rules are being activate inside the Complex Event Processor (CEP) notwhat it processes.
Two features from the data set are categorical (component and method) because of this they requiredre-encoding. We first tried label encoding however it resulted in poor performance, this type of encodingusually leads to a significant loss of relationships between different data points. Much better results
Copyright 2017, DICE consortium All rights reserved 39

Deliverable 4.4. Quality anomaly detection and trace checking tools - Final version.
Method BScore BTime ParamSearch CV Mean CV STD CV Time Fscore FTimeRF 0.68 0.0611 185.446 99.98% 0.05% 27.5004 1 4.5732DT 0.53 0.0049 5.0348 99.97% 0.09% 0.0478 0.9989 0.0036AD 0.51 0.2358 62.6346 100.00% 0.00% 0.4151 1 0.0548NN 0.34 0.5640 1771.0435 100.00% 0.00% 0.2695 1.0 0.03283
Table 4: Experimental runs for CEP component
Metric AdaBoost DecisionTree Random ForestAIS SENTENCE LISTENER 0.1 0.193142068 0.153848567RETRACT OLD AISGEOMDATA 0.1 0.000700426 0.005668693SESSION 0.1 0.00990615 0.032303538SIMPLE ANCHOR IN 0.1 0.052707564 0.196569172SIMPLE DOCK START OUT 0.1 0.003373742 0.035556067SIMPLE DOCK STOP 0.1 0.091526082 0.208327863STOP OVER IN 0.1 0.526665234 0.194793414ms 0.3 0.121978734 0.172932687
Table 5: Feature Importance for different methods CEP
where obtained using the one hot encoding detailed in section 2.1.3. All subsequent experiments detailin this section are using this type of encoding.
With the help of the developers from the POSIDONIA use case we where able to manually label adataset comprising over 4800 data points. For validation purposes we ran all supervised and unsupervisedmethods on this data set. We can see in table 4 the results of the first validations. First we ran a baselinewhere all methods had their parameters set to default values. After which we ran parameter optimizationon all methods and executed a 10 fold crossvalidation with 30% of the dataset used for validation. Wecan see that the parameter optimization not only allowed us to optimize the predictive performance butalso the required training time (BScore and BTime for the baseline and FScore and FTime for the bestperforming).
An interesting observation which can be made using ADT is the so called feature importance. It isin fact showing what the impact of each feature from the data set has on the classification model. Table5 show the feature importance for the tree based classification methods. One surprising fact evident inthis table is that although logically the most important feature in detecting anomalies for CEP would bethe ms feature indicating how long a particular rule takes to fire. However, we can see in table 5 thatalthough this feature has quite an impact on the predictive model it is not the most representative. Thiscan be explained by the fact that some rules are much more prone to have abnormal behavior and are avery good indicator of anomalies.
ADT provides in addition to the anomaly reporting inside DMon a more complete report for thetrained models It creates files with the confusion metrics, training related parameters(time it took to trainand validate, parameter optimization information etc.) and some visualizations of the trained model. Infigure 18 we see the best performing decision tree structure learned.
In the case of the Wikistat toy application we used Storm topology related metrics. As opposed tothe POSIDONIA use case data we do not have any categorical information, reencoding the data is notnecessary. For these experiments we used a dataset with 60218 data points with a total of 54 features.This is a much larger data set both in event count and feature number. As opposed to the POSIDONIAdata set this data was labeled using the dmon-gen tool.
We have run the same battery of experiments as before. Table 6 shows the overall performance andcomputational time of all supervised methods. As before we see that the performance of each resultingmodel is much better after the parameter search. We can also see that it took much longer for theparameter search to complete, this is in large part due to the size of the data set.
An interesting observation can be made from the feature importance metrics. Table 7 shows those
Copyright 2017, DICE consortium All rights reserved 40

Deliverable 4.4. Quality anomaly detection and trace checking tools - Final version.
Figure 18: Decision Tree Model for CEP
Method BScore BTime ParamSearch CV Mean CV STD CV Time FScore FTimeRF 0.62 1.5985 1118.2022 93.61 0.27 24.8098 0.968 6.3571DT 0.52 1.9713 100.0836 91.63 0.74 0.4723 0.9539 0.0663AD 0.51 10.5293 1629.4891 89 21.15 32.0148 0.949 5.3124NN 0.43 20.5565 4256.4321 93.1 0.94 49.2121 0.9522 7.2346
Table 6: Experimental runs for Wikistat Storm
Copyright 2017, DICE consortium All rights reserved 41

Deliverable 4.4. Quality anomaly detection and trace checking tools - Final version.
Storm Metrics AdaBoost DecisionTree Random Forestbolts 0 acked 0 0.261248981 0.07353724bolts 0 capacity 0 0 0.013144028bolts 0 emitted 0 0.042070332 0.091775431bolts 0 executed 0 1.91E-07 0.074560628bolts 0 processLatency 0 0.004960664 0.008871831bolts 0 transferred 0.05 0.013922383 0.062518511bolts 1 acked 0.1 0 0.088776415bolts 1 capacity 0.45 0 0.012296491bolts 1 emitted 0.05 0.353170154 0.093166881bolts 1 executed 0 0.136724359 0.097394063bolts 1 executeLatency 0.05 0 0.03206146spouts 0 emitted 0 0.023710512 0.059667492spouts 0 transferred 0 0.033190521 0.079343435topologyStats 10m emitted 0.25 0 0.009834129topologyStats 10m transferred 0 9.64E-05 0.010155682topologyStats 1d emitted 0 0 0.006489571topologyStats 1d transferred 0 0 0.006286803topologyStats 3h emitted 0 0 0.003205677topologyStats 3h transferred 0 2.35E-05 0.003470178topologyStats all emitted 0 0 0.086787035topologyStats all transferred 0.05 0.130881988 0.086657019
Table 7: Feature importance for different methods Wikistat
Metric CEP StormLabeled anomalies 1447 6624Detected anomalies 999 4516False Positives 58 217Good Anomalies 941 4299Percentage labeled 22.4 11Percentage detected 15.5 7.5Accuracy 93.4 95.2
Table 8: Isolation Forest performance on labeled data set
features which have some degree of impact on the predictive performance of the learned models. Unlikethe POSIDONIA data set where only two features can define an anomaly in this case we have a muchwider set of possibilities which can give context to any anomaly.
The last set of validation experiments where done for Isolation Forest unsupervised method. Becausewe have already labeled data we can run the unsupervised method and see if it identifies the correctanomalies. Of course Isolation Forest is not able to distinguish between different types of anomalies itcan mark events as normal or anomalous however, this is enough to test the ratio of false positives to truepositives.
Table 8 shows the performance of Isolation Forest on both labeled dataset. Although at first glanceone might conclude that it has poor performance a closer inspection shows that in fact the number offalse positives is under 6% of the total identified for both data sets. It is true that not all anomalies havebeen found but this is of little practical significance as it is more important for the algorithm to detecttrue anomalies then to identify false ones. Keeping in mind that this methods precision increases withthe amount of data it has to work with we are confident that this method is extremely useful for detectinganomalies during the initial stages of DIA development. In the latter stages of DIA development moredata will be available and most likely examples of anomalous behavior These can be used for the training
Copyright 2017, DICE consortium All rights reserved 42
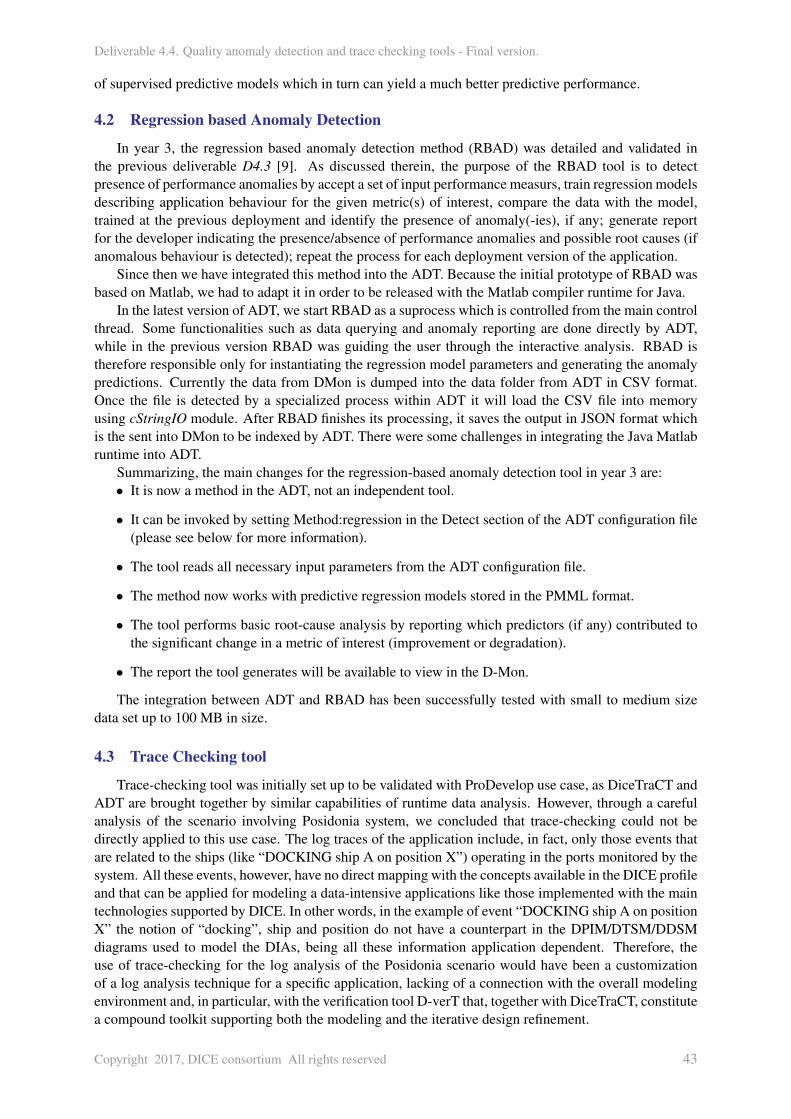
Deliverable 4.4. Quality anomaly detection and trace checking tools - Final version.
of supervised predictive models which in turn can yield a much better predictive performance.
4.2 Regression based Anomaly Detection
In year 3, the regression based anomaly detection method (RBAD) was detailed and validated inthe previous deliverable D4.3 [9]. As discussed therein, the purpose of the RBAD tool is to detectpresence of performance anomalies by accept a set of input performance measurs, train regression modelsdescribing application behaviour for the given metric(s) of interest, compare the data with the model,trained at the previous deployment and identify the presence of anomaly(-ies), if any; generate reportfor the developer indicating the presence/absence of performance anomalies and possible root causes (ifanomalous behaviour is detected); repeat the process for each deployment version of the application.
Since then we have integrated this method into the ADT. Because the initial prototype of RBAD wasbased on Matlab, we had to adapt it in order to be released with the Matlab compiler runtime for Java.
In the latest version of ADT, we start RBAD as a suprocess which is controlled from the main controlthread. Some functionalities such as data querying and anomaly reporting are done directly by ADT,while in the previous version RBAD was guiding the user through the interactive analysis. RBAD istherefore responsible only for instantiating the regression model parameters and generating the anomalypredictions. Currently the data from DMon is dumped into the data folder from ADT in CSV format.Once the file is detected by a specialized process within ADT it will load the CSV file into memoryusing cStringIO module. After RBAD finishes its processing, it saves the output in JSON format whichis the sent into DMon to be indexed by ADT. There were some challenges in integrating the Java Matlabruntime into ADT.
Summarizing, the main changes for the regression-based anomaly detection tool in year 3 are:• It is now a method in the ADT, not an independent tool.
• It can be invoked by setting Method:regression in the Detect section of the ADT configuration file(please see below for more information).
• The tool reads all necessary input parameters from the ADT configuration file.
• The method now works with predictive regression models stored in the PMML format.
• The tool performs basic root-cause analysis by reporting which predictors (if any) contributed tothe significant change in a metric of interest (improvement or degradation).
• The report the tool generates will be available to view in the D-Mon.
The integration between ADT and RBAD has been successfully tested with small to medium sizedata set up to 100 MB in size.
4.3 Trace Checking tool
Trace-checking tool was initially set up to be validated with ProDevelop use case, as DiceTraCT andADT are brought together by similar capabilities of runtime data analysis. However, through a carefulanalysis of the scenario involving Posidonia system, we concluded that trace-checking could not bedirectly applied to this use case. The log traces of the application include, in fact, only those events thatare related to the ships (like “DOCKING ship A on position X”) operating in the ports monitored by thesystem. All these events, however, have no direct mapping with the concepts available in the DICE profileand that can be applied for modeling a data-intensive applications like those implemented with the maintechnologies supported by DICE. In other words, in the example of event “DOCKING ship A on positionX” the notion of “docking”, ship and position do not have a counterpart in the DPIM/DTSM/DDSMdiagrams used to model the DIAs, being all these information application dependent. Therefore, theuse of trace-checking for the log analysis of the Posidonia scenario would have been a customizationof a log analysis technique for a specific application, lacking of a connection with the overall modelingenvironment and, in particular, with the verification tool D-verT that, together with DiceTraCT, constitutea compound toolkit supporting both the modeling and the iterative design refinement.
Copyright 2017, DICE consortium All rights reserved 43

Deliverable 4.4. Quality anomaly detection and trace checking tools - Final version.
In conclusion, validation of trace-checking is therefore postponed and it will be realized in collabo-ration with the DICE industrial partner ATC on the Storm use case.
Nonetheless, the validation of DICE-TraCT has been achieved by running the trace-checking analysison a benchmark application called ExclamationTopology, that was already used to test the solution in theprevious deliverable D4.3. ExclamationTopology is a standard and very intuitive Storm application thatis distributed in the Storm framework and that simply consists of three node: one spout emitting stringsof characters, called “word”, and two bolts “exclaim1” and “exclaim2” that elaborate the messages of“word” and “exclaim1”, respectively, by simply adding a suffix with some symbols “!”. To validate thefunctionality of DICE-TraCT, the topology was deployed in a local cluster running three Storm workersand one master node coordinating the topology. Beside the Storm topology an instance of the monitoringplatform was executed to provide the monitoring functionalities that are required to carry out the trace-checking analysis. The trace-checking service has been deployed as a local service at 127.0.0.1 listeningthe port 5050.
The topology was first defined in the design panel of the DICE IDE with the UML classes and theDICE stereotypes <<StormSpout>> and <<StormBolt>> by means of the same procedure thata user follows to carry out verification with D-VerT. Then, the running Storm topology was registeredin DMon through the web interface and DICE-TraCT was launched from the DICE IDE through the“Run configuration” window that is shown in Figure 19. A monitoring session was activated by clickingthe button ‘’Activate” in the DICE-TraCT window and, afterwards, loading the Xml descriptor of thetopology previously designed allowed the DICE-TraCT client to visit the structure of the application andshow the nodes that can be analyzed. The value of parameters “sigma” and “emit rate” of the nodes“exclaim1” and ‘’word”, respectively, were selected and then the trace-checking analysis was activated.
Figure 19: Launch configuration for a trace-checking analysis on two topology nodes
Copyright 2017, DICE consortium All rights reserved 44

Deliverable 4.4. Quality anomaly detection and trace checking tools - Final version.
5 Conclusions
5.1 Summary
This deliverable presented the final versions of ADT as well as DICE-TraCT. The goal of the finalversion (M30) of these tools is to enable the definition and reporting of anomalies present in monitoredperformance and quality related data from Big Data technologies. This is directly related to milestoneMS5 “DICE Integrated framework Second release Currently ADT has been tested on all DICE supportedBig data technologies as well as on of the use case DIAs. DICE-TraCT has been completely integratedin the DICE framework and has been tested with a benchmark Storm application.
Furthermore we have finalized the connector between the anomaly detection tool and the DICE mon-itoring platform. This connector can be used both to retrieve datasets and to send detected anomalies tothe Monitoring platform. It is important to note that at this time (M30) this integration is fully functional,data sets can be created, anomalies are transmitted to DMon and finally predictive models are saved andversioned.
5.2 Further work
At this stage the ADT and DICE-TraCT tools are fully operational an are an integral part of the DICEsolution. Further work on these tools would be to extend their functionality past the one needed in DICE,to other problem domains. For example in the case of ADT problem domains such as IoT, Cloud and HPCcan be easily included into the tool by extending some of its functionality (the connector component).Also, the integration of novel anomaly detection techniques can also be done by adding them to the ADTengine component. A little effort will be earmarked for the validation of DICE-TraCT with ATC use casein the next months.
Copyright 2017, DICE consortium All rights reserved 45

Deliverable 4.4. Quality anomaly detection and trace checking tools - Final version.
References
[1] Martın Abadi, Ashish Agarwal, Paul Barham, Eugene Brevdo, Zhifeng Chen, Craig Citro, Greg S.Corrado, Andy Davis, Jeffrey Dean, Matthieu Devin, Sanjay Ghemawat, Ian Goodfellow, AndrewHarp, Geoffrey Irving, Michael Isard, Yangqing Jia, Rafal Jozefowicz, Lukasz Kaiser, ManjunathKudlur, Josh Levenberg, Dan Mane, Rajat Monga, Sherry Moore, Derek Murray, Chris Olah, MikeSchuster, Jonathon Shlens, Benoit Steiner, Ilya Sutskever, Kunal Talwar, Paul Tucker, VincentVanhoucke, Vijay Vasudevan, Fernanda Viegas, Oriol Vinyals, Pete Warden, Martin Wattenberg,Martin Wicke, Yuan Yu, and Xiaoqiang Zheng. Tensorflow: Large-scale machine learning onheterogeneous systems, 2015. Software available from tensorflow.org.
[2] Giuseppe Bombara, Cristian-Ioan Vasile, Francisco Penedo, Hirotoshi Yasuoka, and Calin Belta. Adecision tree approach to data classification using signal temporal logic. In Proceedings of the 19thInternational Conference on Hybrid Systems: Computation and Control, HSCC ’16, pages 1–10,New York, NY, USA, 2016. ACM.
[3] Mihaela Elena Breaban and Henri Luchian. Pso aided k-means clustering: Introducing connec-tivity in k-means. In Proceedings of the 13th Annual Conference on Genetic and EvolutionaryComputation, GECCO ’11, pages 1227–1234, New York, NY, USA, 2011. ACM.
[4] Leo Breiman. Random forests. Mach. Learn., 45(1):5–32, October 2001.
[5] Giuliano Casale, Pooyan Jamshidi, Tatiana Ustinova, Gabriel Iuhasz, Matej Arta, Tadej Borovak,and Matic Pajni. Dice delivery tools initial version.
[6] Varun Chandola, Arindam Banerjee, and Vipin Kumar. Anomaly detection: A survey. ACM Com-put. Surv., 41(3):15:1–15:58, July 2009.
[7] Yu-Shu Chen and Yi-Ming Chen. Combining incremental hidden markov model and adaboostalgorithm for anomaly intrusion detection. In Proceedings of the ACM SIGKDD Workshop onCyberSecurity and Intelligence Informatics, CSI-KDD ’09, pages 3–9, New York, NY, USA, 2009.ACM.
[8] Martin Ester, Hans-Peter Kriegel, Jrg Sander, and Xiaowei Xu. A density-based algorithm fordiscovering clusters in large spatial databases with noise. pages 226–231. AAAI Press, 1996.
[9] Tatiana Ustinova Marcello Bersani Gabriel Iuhasz, Ioan Dragan. Quality anomaly detection andtrace checking tools - initial version. DICE Deliverable D, 4.3, 2016.
[10] Matthias Gander, Michael Felderer, Basel Katt, Adrian Tolbaru, Ruth Breu, and Alessandro Mos-chitti. Anomaly detection in the cloud: Detecting security incidents via machine learning. InAlessandro Moschitti and Barbara Plank, editors, Trustworthy Eternal Systems via Evolving Soft-ware, Data and Knowledge, volume 379 of Communications in Computer and Information Science,pages 103–116. Springer Berlin Heidelberg, 2013.
[11] Youssef Ridene George Giotis, Christophe Joubert. D6.1 dice demonstrators implementation plan.
[12] Pooyan Jamshidi Marc Gil Christophe Joubert Alberto Romeu Jos Merseguer Raquel Trillo MatteoGiovanni Rossi Elisabetta Di Nitto Damian Andrew Tamburri Danilo Ardagna Jos Vilar SimonaBernardi Matej Arta Madalina Erascu Daniel Pop Gabriel Iuhasz Youssef Ridene Josuah Aron CraigSheridan Darren Whigham Giuliano Casale, Tatiana Ustinova. D1.2 dice requirement specification.
[13] R. G. Goss and G. S. Nitschke. Automated pattern identification and classification: Anomalydetection case study. In Proceedings of the Genetic and Evolutionary Computation ConferenceCompanion, GECCO ’17, pages 59–60, New York, NY, USA, 2017. ACM.
Copyright 2017, DICE consortium All rights reserved 46

Deliverable 4.4. Quality anomaly detection and trace checking tools - Final version.
[14] Robert L. Grossman, Stuart Bailey, Ashok Ramu, Balinder Malhi, Philip Hallstrom, Ivan Pulleyn,and Xiao Qin. The management and mining of multiple predictive models using the predictivemodeling markup language. Information & Software Technology, 41(9):589–595, 1999.
[15] Michele Guerriero, Damian Andrew Tamburri, Youssef Ridene, Francesco Marconi, Marcello M.Bersani, and Matej Artac. Towards devops for privacy-by-design in data-intensive applications: Aresearch roadmap. In Companion Proceedings of the 8th ACM/SPEC on International Conferenceon Performance Engineering, ICPE 2017, L’Aquila, Italy, April 22-26, 2017, pages 139–144, 2017.
[16] Mark Hall, Eibe Frank, Geoffrey Holmes, Bernhard Pfahringer, Peter Reutemann, and Ian H. Wit-ten. The weka data mining software: An update. SIGKDD Explor. Newsl., 11(1):10–18, November2009.
[17] Gabriel Iuhasz and Daniel Pop. Monitoring and data warehousing tools initial version. DICE EUH2020 Project Deliverable, 2016.
[18] Fei Tony Liu, Kai Ming Ting, and Zhi-Hua Zhou. Isolation-based anomaly detection. ACM Trans.Knowl. Discov. Data, 6(1):3:1–3:39, March 2012.
[19] Francesco Marconi Marcello M. Bersani, Madalina Erascu. D3.5 dice verification tools initialversion.
[20] Mehryar Mohri, Afshin Rostamizadeh, and Ameet Talwalkar. Foundations of Machine Learning.The MIT Press, 2012.
[21] Animesh Patcha and Jung-Min Park. An overview of anomaly detection techniques: Existingsolutions and latest technological trends. Comput. Netw., 51(12):3448–3470, August 2007.
[22] Daniel Pop, Gabriel Iuhasz, Ciprian Craciun, and Silviu Panica. Support services for applicationsexecution in multi-clouds environments. In Autonomic Computing (ICAC), 2016 IEEE Interna-tional Conference on, pages 343–348. IEEE, 2016.
[23] Erich Schubert, Alexander Koos, Tobias Emrich, Andreas Zufle, Klaus Arthur Schmid, and ArthurZimek. A framework for clustering uncertain data. PVLDB, 8(12):1976–1979, 2015.
[24] Ofer Schwartz, Sharon Gannot, and Emanuel A. P. Habets. An expectation-maximization algorithmfor multimicrophone speech dereverberation and noise reduction with coherence matrix estimation.IEEE/ACM Trans. Audio, Speech and Lang. Proc., 24(9):1491–1506, September 2016.
[25] Rinku Sen, Manojit Chattopadhyay, and Nilanjan Sen. An efficient approach to develop an intru-sion detection system based on multi layer backpropagation neural network algorithm: Ids usingbpnn algorithm. In Proceedings of the 2015 ACM SIGMIS Conference on Computers and PeopleResearch, SIGMIS-CPR ’15, pages 105–108, New York, NY, USA, 2015. ACM.
[26] Manoj Kumar Sharma, Debdoot Sheet, and Prabir Kumar Biswas. Abnormality detecting deepbelief network. In Proceedings of the International Conference on Advances in Information Com-munication Technology & Computing, AICTC ’16, pages 11:1–11:6, New York, NY, USA, 2016.ACM.
[27] Xiuyao Song, Mingxi Wu, Christopher Jermaine, and Sanjay Ranka. Conditional anomaly detec-tion. IEEE Trans. on Knowl. and Data Eng., 19(5):631–645, May 2007.
Copyright 2017, DICE consortium All rights reserved 47