research article snowfall in the northwest iberian...
TRANSCRIPT

Research ArticleSnowfall in the Northwest Iberian Peninsula: SynopticCirculation Patterns and Their Influence on Snow Day Trends
Andrés Merino, Sergio Fernández, Lucía Hermida, Laura López,José Luis Sánchez, Eduardo García-Ortega, and Estíbaliz Gascón
University of Leon, Instituto de Medio Ambiente (IMA), 24006 Leon, Spain
Correspondence should be addressed to Andres Merino; [email protected]
Received 1 April 2014; Revised 20 June 2014; Accepted 3 July 2014; Published 24 July 2014
Academic Editor: Aondover Tarhule
Copyright © 2014 Andres Merino et al.This is an open access article distributed under the Creative Commons Attribution License,which permits unrestricted use, distribution, and reproduction in any medium, provided the original work is properly cited.
In recent decades, a decrease in snowfall attributed to the effects of global warming (among other causes) has become evident.However, it is reasonable to investigate meteorological causes for such decrease, by analyzing changes in synoptic scale patterns.On the Iberian Peninsula, the Castilla y Leon region in the northwest consists of a central plateau surrounded by mountain ranges.This creates snowfalls that are considered both an important water resource and a transportation risk. In this work, we develop aclassification of synoptic situations that produced important snowfalls at observation stations in the major cities of Castilla y Leonfrom 1960 to 2011. We used principal component analysis (PCA) and cluster techniques to define four synoptic patterns conduciveto snowfall in the region. Once we confirmed homogeneity of the series and serial correlation of the snowfallday records at thestations from 1960 to 2011, we carried out a Mann-Kendall test. The results show a negative trend at most stations, so there are adecreased number of snowfall days. Finally, variations in these meteorological variables were related to changes in the frequenciesof snow events belonging to each synoptic pattern favorable for snowfall production at the observatory locations.
1. Introduction
Snow and ice, together with windstorms, are among themost important meteorological hazards in winter. In fact,heavy snowfall can significantly inconvenience users of thetransportation infrastructure and can increase the numberof injuries and fatalities related to traffic accidents [1]. Inmountainous areas, avalanches caused by snow accumulationare a potential danger, whose triggermechanisms are difficultto identify [2]. Another source of difficulty is wet snowicing accretion on power lines, causing failures of highand medium voltage power supplies [3]. Moreover, heavysnowfall followed by melting can trigger large floods thatrepresent a serious natural hazard [4]. Furthermore, theaccumulation of snow in mountain headwater basins is amajor water source, particularly in semiarid environments[5]. Additionally, snowfall permits the development of eco-nomic activities related to winter tourism in mountainousareas [6].
Snowfall detection and measurement represent very dif-ficult problems in modern hydrometeorology. For snowfall
detection, it is necessary not only to consider precipitationsystems, but also to determine other variables such as thelevel of snowflake fusion (melting level), in order to dis-criminate precipitation reaching the ground as rain or snow.Determining the melting level is also critical for hydrologicmodels, since it determines the basin surface exposed to rainand the possibility of flooding. Ground measurements arecomplicated owing to detection technology limitations, snowdrift and accumulation issues, and error definition [7].
Usually, the melting level is slightly below the freezinglevel, which is the height of the 0∘C isotherm. Lundquist etal. [8] found that, in California at 1.5∘C, 50% of the precip-itation falls as rain and 50% as snow. Similar results werefound in the Alps [9], the Bolivian Andes [10], and Sweden[11]. Nevertheless, at times complex topography favors low-level thermal inversions that cause superposition of warmlayers atop cold ones, which complicates the identification ofprecipitation type.
In recent decades, several studies have shown the influ-ences of climate change on water resources availability, pre-cipitation, and temperature [12, 13]. In the Iberian Peninsula,
Hindawi Publishing Corporatione Scientific World JournalVolume 2014, Article ID 480275, 14 pageshttp://dx.doi.org/10.1155/2014/480275

2 The Scientific World Journal
it has been shown that temperature during wintermonths hasincreased in several mountainous regions [14]. Furthermore,since temperature is expected to continue rising globally,it is reasonable to expect a decrease in snowfall frequencyand accumulated snow depths [15, 16] and, therefore, shorterduration of the snow season [17, 18]. However, there islittle information about how future heavy snowfall eventsmight evolve. Changnon [19] reported less frequent but moreintense snowstorms in the USA. Lopez-Moreno et al. [20]studied the frequency and intensity of snowfall events in thePyrenees (Spain), finding a decrease in snowfall intensity atelevations below 1000m above sea level (asl) and increasedintensity above 2000m asl. Pons et al. [21] analyzed snowfallfrequency in the northern Iberian Peninsula, finding a 50%decrease in the number of snowfall days since the mid-1970s.These authors stated that the decrease in snowfall days wasassociated with increasing temperatures, especially at low-elevation stations. However, for stations at high elevations,the main factor related to the decline in number of snowfalldays was a decrease in overall recorded precipitation [22].
Synoptic scale patterns responsible for severe snowfallepisodes have been used inmanymountainous areas to defineatmospheric conditions underwhich these phenomena occur[23, 24]. Esteban et al. [25] characterized synoptic situationsproducing heavy snow in the eastern Pyrenees, concludingthat northwest flows with strong isobaric gradient were mostconducive to heavy snowfall.
In this paper, we analyze synoptic scale conditions favor-able for the most important snowfall in the principal citiesof the northwestern Iberian Peninsula. Once we establish thesynoptic scale patterns, we study the frequency of each andtheir temporal evolution, as well as the trend in number ofdays with recorded snowfall. Finally, since the number ofsnowfall days has decreased, we assess whether this negativetrend is attributable to changes in large-scale circulationpatterns, to variations of temperature, or to a combination ofthe two.
2. Study Area and Databases
The northern plateau region is in the northwest IberianPeninsula (Figure 1). This region is characterized by a centralplateau with elevation about 800m asl, surrounded bymoun-tain ranges around 2000m asl, except for the southwest andnortheast where elevations are lower.The Iberian Peninsula isoften affected by the polar jet stream, resulting in a variety ofsituations under which precipitation occurs in the study area.However, snowfall is more frequent in mountainous areasbecause of upslope moisture flow producing a precipitationblocking effect. Thus, snowfall frequency is therefore signif-icantly reduced toward the center of the northern plateau.Thereby, cities with more snowfall days are near mountainranges, owing to their high altitude and influence of themountains (Figure 2).
To classify situations conducive to snow in Castilla andLeon, we selected the most significant snow events in 10major cities of the region between 1960 and 2011. Thechoice of these observation sites was made because most of
the regional population is concentrated near these cities,which are also in areas more vulnerable to snowfall. More-over, long-term, reliable time series are available from stationsat these sites. We also selected stations overseen by a pro-fessional staff and, where possible, airport weather stations,because these are usually at very stable locations. The criteriafor snowfall events selection were days with more than 5mmof accumulated precipitation and temperature below 2∘C.According to Lundquist et al. [8], the accumulation of snowis greater than snowmelt at temperatures less than 2.5∘C.In addition, stations with the presence of observers alwaysreport snow days under these conditions. A total of 241snowfall events met these criteria for at least one of the 10stations.
3. Methods of Investigation
3.1. Establishment of Synoptic Patterns. Synoptic conditionsof snow events were characterized by extracting temperatureand geopotential height at 850 and 500 hPa from NCEP-NCAR reanalysis data [26] of the 241 events in the database,over the region 30–60∘N by 30∘W–10∘E with 2.5∘ resolu-tion. These variables describe synoptic scale atmosphericconditions under which the snowfall events developed. The850 hPa and 500 hPa geopotential heights show atmosphericcirculations in the lower and mid-troposphere. These fieldshave been evaluated by several authors to define synop-tic patterns of heavy snow events [25, 27]. The 850 hPaand 500 hPa temperatures provide a good approximationof the snow level and therefore permit determination ofareas (according to their elevations) that may be affectedby snow. Other atmospheric fields (sea level pressure and1000–500 hPa thickness) used in previous studies [25] todefine synoptic patterns of heavy snow were evaluated bythe scree test [28]. It was found that addition of sea surfacepressure and 1000–500mb thickness fields did not providemore meaningful factors. Window dimensions were selectedto be consistent with the synoptic scale analysis of the presentstudy and to avoid circulation features in regions remote fromthe study area. Time was standardized for all snow events.Because synoptic conditions showed little change during theevent, NCEP data files at 12:00 UTC were chosen as the mostrepresentative.
Synoptic scale patterns were produced from reanalysisdata using principal component analysis (PCA) and clustertechniques (CT) based on retained principal componentloadings. Days possessing similar loadings on the extractedcomponents were clustered together. Both methods havebeen widely used for classifying and establishing weatherpatterns [29, 30].
PCA is designed for the reduction of the number ofvariables while maintaining strong representation of vari-ability contained in the original data. PCA is a method thatensures that only the fundamental variation modes of thedata are considered in the clustering process [31]. In thepresent study, PCA was applied with a correlation matrix inT-mode where the variables are the selected days and gridpoints as observations. The number of components explains

The Scientific World Journal 3
Bay of Biscay
Castile-Leon
IberianPeninsula
Cantabrian mountains
North plateau
Central range
Ponferrada Leon
Palencia
Zamora
Valladolid
Burgos
Soria
Salamanca
Avila
Segovia N
E
(km)0 50 100
W
S
(a) (b)
Figure 1: (a) Iberian Peninsula. (b) Study area of Castilla y Leon and locations of its principal cities.
30
20
10
0
Num
ber o
f sno
w d
ays/
year
Av Bu Le Pal Pon Sa Seg So Va Za
Figure 2: Box and whisker plot for number of snow days/year foreach station (Avila, Burgos, Leon, Palencia, Ponferrada, Salamanca,Segovia, Soria, Valladolid, and Zamora). The lower end of the boxindicates the 25th percentile, the central line indicates the median,and the line above the box indicates the 75th percentile. The errorlines above and below the box indicate the 95th and 5th percentiles,respectively.
a significant proportion of the total variance [32]. Here, wechose only the most important extracted components thataccount for at least 90% of the total variance. Additionally,the number of components extracted for each variable wasevaluated via the scree test [28], and the rule of thumb ofNorth et al. [33] was used for estimating the sampling error.PCA provides component scores, which are standardizedvalues representing the relationship between observationsand retained orthogonal components.
The CT allows for separation of data into groups, whoseidentities are previously unknown. In this study, the selectedCT was the nonhierarchical K-means method [34]. TheEuclidean distance was chosen for classifying groups ofdata according to their similarity. One of the sources ofsubjectivity in this method is the requirement that thenumber of final conglomerations (k) is predetermined aheadof time. The selection of k can be done objectively bycomputing the minimum decrease of intragroup distances.Nevertheless, the decision regarding the number of groups isnot a completely objective task since a degree of subjectivityis present, based on researchers’ experience [35]. Previousworks have described the application of these statisticaltechniques toward determining weather patterns in detail[36].
3.2. Trend Analysis. Once the synoptic patterns favorable forthe most significant snow events have been identified, wetest how frequency variations of snow events in the observedpatterns affect the number of snowfall days recorded at eachstation. To this end, we analyzed trends in the numberof snow days (days on which solid precipitation occurredduring the study period) between 1960 and 2011 at thestations used previously to extract the synoptic patterns. Wefurther investigated trends in precipitation and temperatureat the selected stations. Our aim was to determine whetherthe decrease in frequencies of snow events belonging toeach aforementioned pattern was due to climatic variabilitypatterns or to an increase of temperature favoring increasedmelting level altitude. As already noted, despite the presenceof patterns favorable for precipitation, there might be nosnowfall at the stations.
We should first point out that measurements at weatherstations can be easily affected by nonclimatic factors such aschanges in instrumentation, exposure or measurement tech-nique, observers, observation times, or the use of different

4 The Scientific World Journal
methods to calculate monthly averages [37]. Environmentalchanges at the station location should also be taken intoaccount, with emphasis on growth of urbanized areas [38].According to Conrad and Pollak [39], a numerical seriesrepresenting variations in climatological elements can onlybe defined as homogeneous if such variations are causedexclusively by time or climate changes. Thus, prior to trendanalysis, we assessed homogeneity of the time series datafor all stations, using the nonparametric Kruskal-Wallis test[40, 41].
Subsequently, statistical techniques of the nonparamet-ric Mann-Kendall test were applied at the 10 stations, todetermine trends in number of snowfall days and theirstatistical significance. These techniques were applied usingthe MAKESENS template [42]. Sign of the trends was testedusing the Mann-Kendall test, whereas slope of the lineartrend was estimated using Sen’s method [43]. The mainlimitation of the Mann-Kendall trend test occurs whenthere is serial correlation of the data in space and time.Climatological data do not normally satisfy the conditionof independent and identically distributed samples, so theexistence of positive serial correlation increases the proba-bility that the test detects a trend when there is none (falsepositive). This would lead to rejection of the null hypoth-esis when it is actually true. A negative serial correlation,however, decreases the possibility of null hypothesis rejection[44].
To assess this effect, we executed the method proposedby von Storch and Navarra [38], to replace the originaltime series. If there is no correlation between successiveobservations, the null hypothesis is accepted, the data areindependent, and there is no persistence in the time series.Otherwise, before applying the Mann-Kendall test, we per-formed prewhitening via the method of Tabari and Talaee[45].
The Mann-Kendall test is used in climate studies todetect trends in data series [45, 46], by statistically deter-mining whether the values of a variable are increasingor decreasing over a period of time [47]. This test is anonparametric statistical method; that is, no distributionmodel is assumed for the random variables studied. Otheradvantages of this test include its low sensitivity to suddenbreaks owing to inhomogeneity of the time series [48] andthe fact that time series containing missing values may beused. The test consists of comparing the value of a givenvariable with its value at a prior time and assigning apositive or negative sign depending on whether the latervalue is smaller or larger than the earlier one. A zerostatistic indicates no change in the trend with time, so thenull hypothesis is accepted. The greater the deviation fromzero is, the greater the data trend is [47]. Positive valuesindicate an upward trend and negative ones a downwardtrend.
Finally, to estimate the magnitude of change per unittime of a linear trend, we used the nonparametric Sen’sslope estimator [48]. This method obtains the slope for eachpossible pair of measurements in different years; the medianof all slope values obtained is the estimator.
Ponferrada
LeonPalencia
ZamoraValladolid
BurgosSoria
SalamancaAvilaSegovia
60
50
40
30
20
10
0
(day
s)
1 2 3 4
Cluster
Figure 3: Cluster distribution of snow events by city between 1960and 2011.
4. Results
4.1. Synoptic Patterns Favorable for Snowfall in Castillay Leon. As noted above, applying PCA for geopotentialheight and temperature at 500 and 850 hPa, respectively,we extracted 5, 5, 8, and 7 components. These componentswere extracted until reaching 90% of explained variance foreach variable. These extracted components were evaluatedby means of the scree test [28], and the rule of thumb ofNorth et al. [33] was used for estimating the sampling error(Figure 4).
Then, with a matrix of a total 25 PCA results (columns)and 241 study days (rows), K-means clustering was applied.Intragroup distances were computed for 𝑘 = 2, 3, 4, . . ., 20and showed a minimum decrease for 𝑘 = 4, considered theoptimal cluster number. For this result, we classified a totalof 84, 71, 30, and 56 events in each cluster. To physicallyinterpret the results, we calculated mean atmospheric fieldsfor each cluster, averaging data grids corresponding to theevents grouped in each cluster (Figures 5–8).
Figure 3 represents the cluster distribution at each sta-tion analyzed. The results show that the cities of Palencia,Valladolid, and Zamora, all at low altitude and far frommountainous areas, have a lower frequency of snow events.We call the 4 clusters favorable to snowfall in the region“Arctic advection,” “western flow,” “northeastern advection,”and “cyclonic circulation.”

The Scientific World Journal 5
100
80
60
40
20
Cum
ulat
ive e
xpla
ined
var
ianc
e (%
)
5 10 15 20
Components500-GTH850-GTH
500-T850-T
(a)
140
120
100
80
60
40
20
0
Eige
nval
ues
50 10 15 20
Components
500-GTH850-GTH
500-T850-T
(b)
5.00
2.00
0.50
0.20
0.05
0.02
Dist
ance
amon
g co
mpo
nent
s err
or in
terv
als
5 10 15 20
Components500-GTH850-GTH
500-T850-T
(c)
Figure 4: PCA applied to each variable. (a) Cumulative explained variance (%); black horizontal line indicates cumulative variance 90%. (b)Scree test. (c) North rule of thumb.
4.1.1. Cluster 1: Arctic Advection. Cluster 1 is defined by thearrival of maritime Arctic air over the Iberian Peninsula.An upper-air ridge associated with a surface high in theAtlantic, coupled with a trough in western Europe, producesa strong barometric gradient that causes horizontal advectionof maritime Arctic air over the peninsula. With this configu-ration, a cold tongue at mid-levels settles over the northwestpeninsula, whereas at low levels, the maritime flow generatessignificant cold and moist air advection over the northernpeninsula (Figure 5). This configuration usually producesorographic precipitation at the windward base of mountain
ranges, in this case mainly affecting the Cantabrian region.In the study area, the Cantabrian Mountains in the northorographically block moisture, resulting in precipitation innearby areas. However, to the east the Cantabrian Mountainshave lower elevations, favoring the entry of clouds andmoisture to this region. Moreover, the cold air mass at upperlevels causes greater instability, which increases the possibilityof convective precipitation.Thus, the city of Burgos hadmoreevents of this nature, owing to the entry of clouds fromthe eastern part of the Cantabrian Mountains. This affectsSegovia and Soria to a lesser extent, with 7 and 13 events,

6 The Scientific World Journal
5300
30∘W 20
∘W 10∘W 10
∘E0∘
5360
5420
5480
5540
5600
5660
5720
60∘N
55∘N
50∘N
45∘N
40∘N
35∘N
30∘N
HGT500
(a)
30∘W 20
∘W 10∘W 10
∘E0∘
T500
60∘N
55∘N
50∘N
45∘N
40∘N
35∘N
30∘N
240
242
244
246
248
250
252
254
256
258
260
262
(b)
30∘W 20
∘W 10∘W 10
∘E0∘
60∘N
55∘N
50∘N
45∘N
40∘N
35∘N
30∘N
1350
1390
1430
1470
1510
1550
HGT850
(c)
30∘W 20
∘W 10∘W 10
∘E0∘
T850
60∘N
55∘N
50∘N
45∘N
40∘N
35∘N
30∘N
260
262
264
266
268
270
272
274
276
278
280
282
(d)
Figure 5: Synoptic environment of cluster 1. Geopotential height (HGT) and temperature (T) at 500 hPa (a, b) and 850 hPa (c, d).
respectively (Figure 3). Despite being on the southern slopesof the mountain range, the city of Leon had 16 such events.This is explained by the proximity of the city to themountainsand suggests strong moisture advection events that transportclouds toward the southern face of the mountain range.
4.1.2. Cluster 2: Westerly Flow. Cluster 2 is marked by themovement of storms across the North Atlantic, while thetropical ridge shifts to the southwest peninsula. Thus, anintense west-northwest barometric gradient that advects theNorthwester Atlantic air is established over the peninsula.This air mass has a long maritime trajectory, acquiring highhumidity and gradually warming at lower levels, owing tocontact with the ocean. This is seen from 850 hPa temper-atures (Figure 6). This situation is favorable for the entry of
cold fronts from the northwest of the Iberian Peninsula thatproduce abundant precipitation in the study area. However,cold fronts are often accompanied by increased melting levelbecause of warm air advection ahead of the fronts, sincecold advection occurs after frontal passage. Therefore, forthis situation, to produce snow at relatively low levels, theremust be earlier cold advection over the Atlantic, which issubsequently transported ahead of the front.
The northwest regions are in Castilla y Leon, and thoseat higher altitude are most affected by snowfall events sincethe melting level is relatively high. The cities of Ponferradaand Leon had conditions resulting in most snowfall events(Figure 3). Burgos and Soria also had numerous such eventsunder these conditions, owing to their high altitudes (about1000m).

The Scientific World Journal 7
30∘W 20
∘W 10∘W 10
∘E0∘
60∘N
55∘N
50∘N
45∘N
40∘N
35∘N
30∘N
HGT500
5225
5300
5375
5450
5525
5600
5675
5750
(a)
30∘W 20
∘W 10∘W 10
∘E0∘
T500
60∘N
55∘N
50∘N
45∘N
40∘N
35∘N
30∘N
240
242
244
246
248
250
252
254
256
258
260
262
(b)
30∘W 20
∘W 10∘W 10
∘E0∘
60∘N
55∘N
50∘N
45∘N
40∘N
35∘N
30∘N
1250
1290
1330
1370
1410
1450
HGT850
1490
1530
1570
(c)
30∘W 20
∘W 10∘W 10
∘E0∘
T850
60∘N
55∘N
50∘N
45∘N
40∘N
35∘N
30∘N
260
262
264
266
268
270
272
274
276
278
280
282
(d)
Figure 6: As in Figure 2 but for cluster 2.
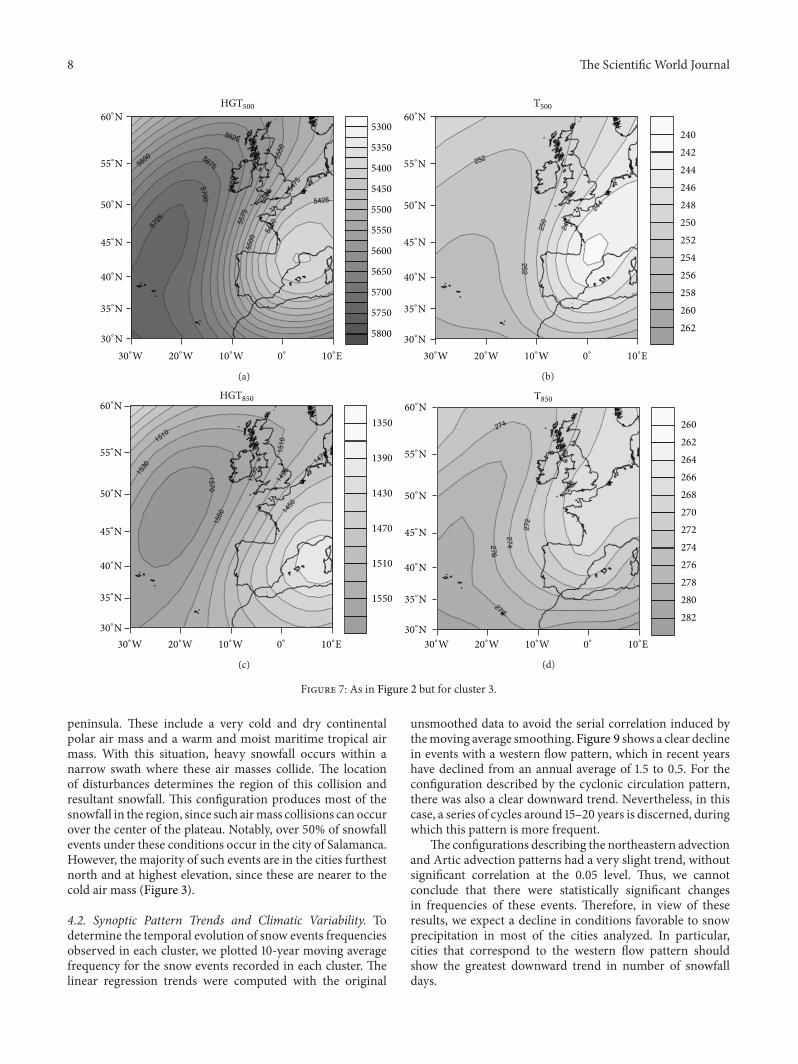
4.1.3. Cluster 3: Northeasterly Advection. The conditionsdescribed by cluster 3 correspond to arrival of a continentalpolar air mass over the Iberian Peninsula. A low-pressuresystem is situated over the western Mediterranean and anupper-air ridge over northwestern Europe. This forms astrong northwest barometric gradient that advects continen-tal polar air. Very cold isotherms are evident under theseconditions, at both 850 hPa and 500 hPa (Figure 7). This isbecause the flow originates from East Europe, where thecontinental air mass produces the very cold temperaturesand low moisture content characteristic of winter. Becausethis air mass is very dry, precipitation in the study areashould not be abundant. However, the brief transit of the airmass over the Bay of Biscay supplies moisture conducive toprecipitation upon reaching the Cantabrian Mountains. Thenortheast flow generates lingering clouds over the northernface of the Cantabrian range. This causes precipitation in
this area and further east, within a corridor formed by theCantabrian Mountain. Although precipitation is often weak,persistent snowfall together with low temperatures can resultin significant accumulation. Burgos clearly stands out inthis regard, with 17 snowfall events. Other cities to the eastlagged far behind, such as Segovia and Soria where there is ageneral deficiency of moisture, thereby preventing significantsnowfall (Figure 3).
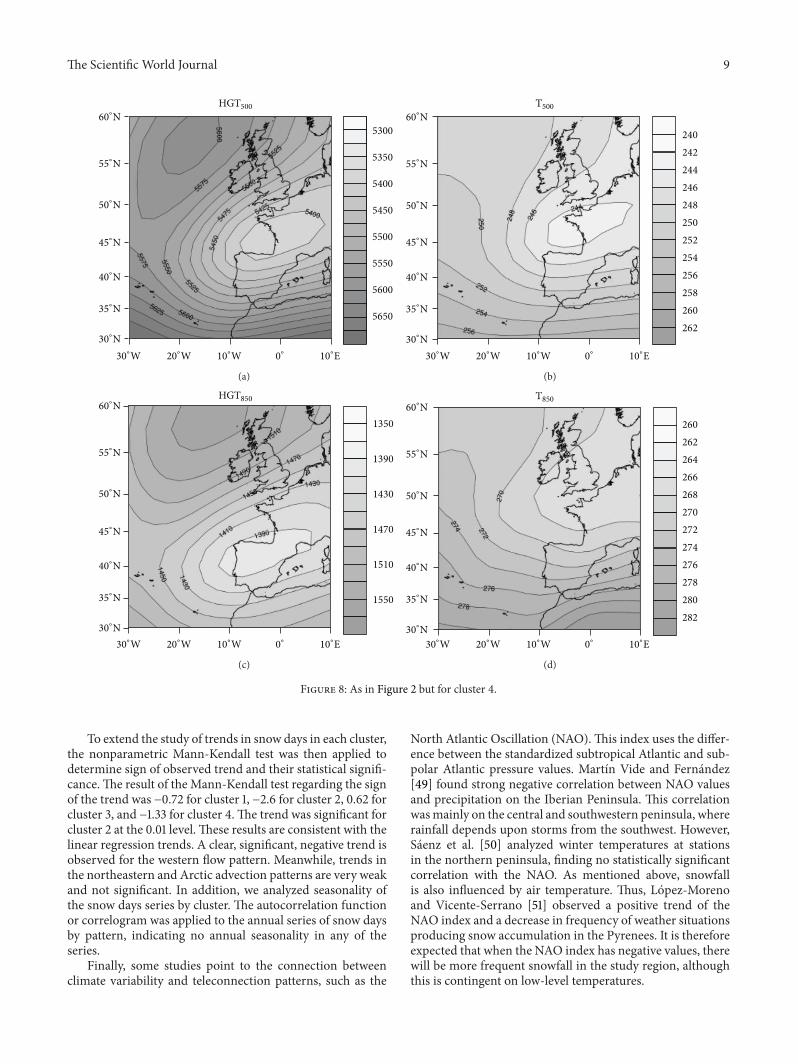
4.1.4. Cluster 4: Cyclonic Circulation. Cluster 4 shows acyclonic circulation at relatively low latitudes, affecting theIberian Peninsula. By contrast, there is an anticyclonic cir-culation area in the North Atlantic, where there are typicallypassing disturbances (Figure 8). This circulation produces astrong thermal gradient over the study area, since there isa collision of air masses of different characteristics over the
8 The Scientific World Journal
5300
30∘W 20
∘W 10∘W 10
∘E0∘
5350
5400
5450
5500
5550
5600
5650
60∘N
55∘N
50∘N
45∘N
40∘N
35∘N
30∘N
HGT500
5700
5750
5800
(a)
30∘W 20
∘W 10∘W 10
∘E0∘
T500
60∘N
55∘N
50∘N
45∘N
40∘N
35∘N
30∘N
240
242
244
246
248
250
252
254
256
258
260
262
(b)
30∘W 20
∘W 10∘W 10
∘E0∘
60∘N
55∘N
50∘N
45∘N
40∘N
35∘N
30∘N
1350
1390
1430
1470
1510
1550
HGT850
(c)
30∘W 20
∘W 10∘W 10
∘E0∘
T850
60∘N
55∘N
50∘N
45∘N
40∘N
35∘N
30∘N
260
262
264
266
268
270
272
274
276
278
280
282
(d)
Figure 7: As in Figure 2 but for cluster 3.
peninsula. These include a very cold and dry continentalpolar air mass and a warm and moist maritime tropical airmass. With this situation, heavy snowfall occurs within anarrow swath where these air masses collide. The locationof disturbances determines the region of this collision andresultant snowfall. This configuration produces most of thesnowfall in the region, since such airmass collisions can occurover the center of the plateau. Notably, over 50% of snowfallevents under these conditions occur in the city of Salamanca.However, the majority of such events are in the cities furthestnorth and at highest elevation, since these are nearer to thecold air mass (Figure 3).
4.2. Synoptic Pattern Trends and Climatic Variability. Todetermine the temporal evolution of snow events frequenciesobserved in each cluster, we plotted 10-year moving averagefrequency for the snow events recorded in each cluster. Thelinear regression trends were computed with the original
unsmoothed data to avoid the serial correlation induced bythemoving average smoothing. Figure 9 shows a clear declinein events with a western flow pattern, which in recent yearshave declined from an annual average of 1.5 to 0.5. For theconfiguration described by the cyclonic circulation pattern,there was also a clear downward trend. Nevertheless, in thiscase, a series of cycles around 15–20 years is discerned, duringwhich this pattern is more frequent.
The configurations describing the northeastern advectionand Artic advection patterns had a very slight trend, withoutsignificant correlation at the 0.05 level. Thus, we cannotconclude that there were statistically significant changesin frequencies of these events. Therefore, in view of theseresults, we expect a decline in conditions favorable to snowprecipitation in most of the cities analyzed. In particular,cities that correspond to the western flow pattern shouldshow the greatest downward trend in number of snowfalldays.
The Scientific World Journal 9
5300
30∘W 20
∘W 10∘W 10
∘E0∘
5350
5400
5450
5500
5550
5600
5650
60∘N
55∘N
50∘N
45∘N
40∘N
35∘N
30∘N
HGT500
(a)
30∘W 20
∘W 10∘W 10
∘E0∘
T500
60∘N
55∘N
50∘N
45∘N
40∘N
35∘N
30∘N
240
242
244
246
248
250
252
254
256
258
260
262
(b)
30∘W 20
∘W 10∘W 10
∘E0∘
60∘N
55∘N
50∘N
45∘N
40∘N
35∘N
30∘N
1350
1390
1430
1470
1510
1550
HGT850
(c)
30∘W 20
∘W 10∘W 10
∘E0∘
T850
60∘N
55∘N
50∘N
45∘N
40∘N
35∘N
30∘N
260
262
264
266
268
270
272
274
276
278
280
282
(d)
Figure 8: As in Figure 2 but for cluster 4.
To extend the study of trends in snow days in each cluster,the nonparametric Mann-Kendall test was then applied todetermine sign of observed trend and their statistical signifi-cance.The result of the Mann-Kendall test regarding the signof the trend was −0.72 for cluster 1, −2.6 for cluster 2, 0.62 forcluster 3, and −1.33 for cluster 4.The trend was significant forcluster 2 at the 0.01 level. These results are consistent with thelinear regression trends. A clear, significant, negative trend isobserved for the western flow pattern. Meanwhile, trends inthe northeastern and Arctic advection patterns are very weakand not significant. In addition, we analyzed seasonality ofthe snow days series by cluster. The autocorrelation functionor correlogram was applied to the annual series of snow daysby pattern, indicating no annual seasonality in any of theseries.
Finally, some studies point to the connection betweenclimate variability and teleconnection patterns, such as the
North Atlantic Oscillation (NAO).This index uses the differ-ence between the standardized subtropical Atlantic and sub-polar Atlantic pressure values. Martın Vide and Fernandez[49] found strong negative correlation between NAO valuesand precipitation on the Iberian Peninsula. This correlationwasmainly on the central and southwestern peninsula, whererainfall depends upon storms from the southwest. However,Saenz et al. [50] analyzed winter temperatures at stationsin the northern peninsula, finding no statistically significantcorrelation with the NAO. As mentioned above, snowfallis also influenced by air temperature. Thus, Lopez-Morenoand Vicente-Serrano [51] observed a positive trend of theNAO index and a decrease in frequency of weather situationsproducing snow accumulation in the Pyrenees. It is thereforeexpected that when the NAO index has negative values, therewill be more frequent snowfall in the study region, althoughthis is contingent on low-level temperatures.

10 The Scientific World Journal
2.0
1.8
1.6
1.4
1.2
1.0
0.8
0.6
Clus
ter 1
10
-yea
r mov
ing
aver
age f
requ
ency
1960–1970
1970–1980
1980–1990
1990–2000
2000–2010
YearsFrequency cluster 1 = 12.3 + −0.00559
∗year
(a)
2.0
1.5
1.0
0.5
0.0
10
-yea
r mov
ing
aver
age f
requ
ency
1960–1970
1970–1980
1980–1990
1990–2000
2000–2010
Years
Clus
ter2
Frequency cluster 2 = 52.9 + −0.0262∗year
(b)
1.0
0.8
0.6
0.4
0.2
0.0
Clus
ter 3
10
-yea
r mov
ing
aver
age f
requ
ency
1970
1970–1980
1980–1990
1990–2000
2000–2010
Years
1960–
Frequency cluster 3 = −9.05 + 0.00476∗year
(c)
2.0
1.5
1.0
0.5
0.0
Clus
ter 4
10
-yea
r mov
ing
aver
age f
requ
ency
1970
1970–1980
1980–1990
1990–2000
2000–2010
Years
1960–
Frequency cluster 4 = 27.5 + −0.0134∗year
(d)
Figure 9: Ten-year moving average frequency of snow events. Cluster 1 (a), cluster 2 (b), cluster 3 (c), and cluster 4 (d).
Table 1 shows the average daily NAO index for snowfallevents classified by cluster and for episodes producing snowat the stations within each cluster. In the total average, allpatterns had a negative NAO. However, events classifiedwith the cyclonic circulation pattern had larger negativevalues, whereas the average approached zero in the remainingclusters. This is because this configuration is marked bywestern flow at low latitudes and a positive pressure anomalyat high latitudes. In the remaining patterns, a meridional flowwith high pressure dominates, encompassing the Atlantic.
Thus, a negative NAO favors the presence of a cycloniccirculation that produces precipitation across the study area.However, low temperatures are also necessary for snowfall.
Therefore, we conclude that a strongly negative NAO greatlyfavors precipitation in the study area but not necessarily inthe form of snow.
4.3. Snowfall Day Trends in Castilla y Leon. In this section,we examine the results obtained by analyzing trends in thenumber of snowfall days, maximum andminimum tempera-ture, and precipitation.
The nonparametric Kruskal-Wallis test results indicatethat all stationswere homogeneous for all variables, except forthe stations in the cities of Avila (for snowdays andmaximumand minimum temperature) and Segovia (for maximumtemperature). Serial correlation evaluation showed that the

The Scientific World Journal 11
Table 1: Average NAO index on heavy snow events, by cluster andstation.
Cluster 1 2 3 4Avila −0.30 −1.58 0.44 −0.79Burgos 0.04 −0.12 0.06 −0.58Leon −0.22 −0.08 −0.50 −1.23Palencia N.A. −0.72 N.A. −0.65Ponferrada −0.82 −0.34 −0.97 −1.39Salamanca −0.06 −0.26 −0.09 −1.53Segovia −0.83 0.22 −0.37 −0.95Soria −0.17 −0.18 0.30 −0.80Valladolid N.A. −0.28 −0.09 −1.70Zamora N.A. −0.10 −0.75 N.A.Total −0.15 −0.05 −0.05 −0.88
Burgos series had serial correlation for snowfall days andmaximum temperature, the Leon station for minimumtemperature, Ponferrada for snowfall days, and Salamancafor maximum temperature. In these cases, we performedprewhitening of the series prior to applying the Mann-Kendall test [45]. We decided not to include the Palenciastation for number of snow days, because of a large numberof missing values.
Table 2 shows trend results for each variable and station.A clear positive trend is evident for maximum temperature,which was the most significant trend at most stations. Bycontrast, there were no clear trends for minimum temper-ature, except for the two cities at the center of the plateau(Valladolid and Palencia), which had positive trends. Theseresults are consistent with those of del Rıo et al. [52]. Theyobserved no significant trends of minimum temperatureduring winter, whereas trends were positive and significantfor maximum temperature in the central and southernplateau. Causes of these increases may be various forcingsof the climate system such as the greenhouse effect, solarradiation, and aerosols [53, 54]. Nevertheless, there are workspointing to other external forcings, such as sunshine durationand cloudiness [55]. Variations in these parameters can beexplained by changes of weather patterns from variationsin teleconnection patterns that have stronger influence inwinter, such as the NAO [56]. Increased sunshine durationand decreased cloudiness positively affect the variation ofmaximum temperatures.This effect is reversed for minimumtemperatures, since these forcings favor nocturnal inversions.The predominant geomorphic unit in the study area is theplateau, which is very favorable for inversions, and mayexplain the low trends for minimum temperature.
For precipitation, most of the stations had a downwardtrend except in Palencia, Segovia, and particularly Avila,where the trend was significant at 0.01 level. Studies similarto ours by Gallego et al. [57] showed a slight negative trendof precipitation for winter over 1954–2003. They noted anincrease of light precipitation and a decline in moderate orheavy precipitation. The slight decrease of precipitation maybe due to an increase in the NAO index during the secondhalf of the 20th century [58, 59]. Thus, a positive trend of
this index is consistent with precipitation reduction in thewestern Mediterranean during winter [58]. In this sense,many authors highlight a winter increase of synoptic patternsconducive to a lack of precipitation on the Iberian Peninsula[60, 61].
Consequently, broadly considering the rising temper-atures and declining precipitation, negative trends in thenumber of snow days are expected. Correspondingly, allstations except Segovia had negative trends of this number.The downward trend was stronger and more significant inthe western cities of Castilla y Leon, especially Leon. Thisresult is consistent with the first part of this study, whichoutlined synoptic patterns responsible for heavy snow in eachcity. Thus, heavy snowfalls in Leon were very dependent onthe western flow synoptic pattern, which has significantlydeclined in frequency during the second half of the 20thcentury. In contrast, eastern cities of the region, like Burgosand Soria, had heavy snowfalls under a variety of synopticpatterns characterized by flows with a northerly component.These patterns have had slight trends in frequency, whichcoincide with more moderate declines in frequency of snow-fall days. The city of Segovia stands out, where there was apositive trend in the number of snowfall days. This may bebecause, together with Avila, it is situated on northern slopeswhere light snow typically occurs owing to lingering clouds.Thus, these snowfalls are recorded as snow days, but theyare usually weak and therefore not represented in the heavysnowfall database.
These results suggest that a decrease in number of snowdays at the analyzed stations can be attributable to risingtemperatures and decreased frequency of patterns favorablefor heavy snow. This is in line with the results of Pons et al.[21]. Thus, the decrease in frequency of patterns conduciveto heavy snow at the stations is largely attributable toincreased low-level temperatures and, thereby, an increaseof melting level. This is especially true in the western flowpattern, in which the freezing level was near the elevationat most stations, and therefore snowfall frequency at study-area stations has drastically decreased. Nevertheless, it shouldalso be considered that an increase of the NAO index inwinter months during the second half of the 20th centurymay be another cause for the decreased frequency of patternsfavorable for heavy snow in the region.
5. Conclusions
Knowledge of the types of synoptic scale patterns lead-ing to a particular meteorological phenomenon can aid inunderstanding of the causes of climate variability and moreprecise explanation of its changes in trend. In this work,we classified synoptic scale patterns defined by temperatureand geopotential fields at 500 and 850 hPa, respectively, for241 days with recorded important snowfall in at least one of10 main observation stations in Castilla y Leon, from 1948to 2011. By applying PCA and K-means cluster techniques,we obtained four patterns: Arctic advection, western flow,northeastern advection, and cyclonic circulation.

12 The Scientific World Journal
Table 2: Trends for maximum and minimum temperature, precipitation, and snow days for the stations studied, between 1960 and 2011.
Station 𝑇max 𝑇min Precipitation Snow daysTest 𝑍 Signific. 𝑄 Test 𝑍 Signific. 𝑄 Test 𝑍 Signific. 𝑄 Test 𝑍 Signific. 𝑄
Burgos (Villafrıa) 2.13 ∗ 0.029 1.24 0.037 −0.91 −0.98 −0.76 −0.064Valladolid 2.47 ∗ 0.029 2.42 ∗ 0.056 −1.46 −1.546 −1.58 −0.05Zamora 3.56 ∗ ∗ ∗ 0.047 0.31 0.006 −0.39 −0.476 −1.23 −0.025Soria 2.33 ∗ 0.024 −0.24 −0.006 −0.53 −0.614 −1.23 −0.069Leon 0.45 0.005 0.35 0.005 −1.6 −2.025 −3.01 ∗∗ −0.142Ponferrada 3.14 ∗∗ 0.035 −1.13 −0.016 −0.08 −0.16 −2.47 ∗ −0.044Salamanca 3.21 ∗∗ 0.044 −0.73 −0.013 −1.22 −0.954 −2.32 ∗ −0.079Palencia 0.32 0 2.55 ∗ 0.008 0.41 0 NaNSegovia NaN −0.81 −0.018 0.54 0.477 2.032 ∗ 0.08Avila NaN NaN 2.75 ∗∗ 2.247 NaNMann-Kendall test (𝑍) indicates sign of observed trend,with significance of 0.001 (∗∗∗), 0.01 (∗∗) 0.05 (∗).𝑄represents trend slope, using Sen’s slope estimator.
We obtained trends in number of snowfall days, maxi-mum and minimum temperature, and precipitation for thestations from 1960 to 2011, using the Mann-Kendall test. Theresults show a significant decrease in number of snow days atstations in the northwest part of the region. We also foundan increase in maximum temperatures and a decrease inprecipitation although to a lesser extent. These results canbe explained by conditions favoring snowfalls that dominatein an area. Thus, stations in the northwestern study area arevery dependent on the western flow pattern for snowfall.Thispattern is characterized by temperatures at lower levels thatare not extremely cold. Consequently in recent years, therehas been a pronounced decline in the number of snow eventsassociated with this pattern. One possible cause is an increaseofmelting level, which has produced precipitation in the formof rain rather than snow at the stations.
However, cities in the eastern part of the region hadthe least negative trend for number of snow days. This areabenefits from almost all the above patterns, especially thosethat generate advection with a northerly component. Thus,the decrease in frequency of snowfall events under thesepatterns was much smaller, because the melting level is lowenough that a temperature increase fails to raise it above thestation elevations.
Another possible cause of the decrease in number of snowdays is an observed increase in the NAO index during wintermonths. Conditions conducive to snowfall at stations in theregion are characterized by a neutral NAO, except for thecyclonic circulation pattern that has a clear negative NAO.Thus, at the Salamanca station, where this pattern occurs inmore than 50% of snowfall events, this could be one cause ofthe significant decline in number of snow days.
Finally, only the Segovia station had a significant positivetrend. The reason may be that it is the only station on thenorthern slope. Therefore, it commonly has lingering cloudsfrom northerly advection, which produce snowfall days withonly light precipitation.
As we have shown, changes in trends of meteorologicalphenomena respond to variations in large-scale atmosphericcirculation patterns. In the special case of the snowfalls,they are directly affected by increased temperatures, and it is
difficult to establish how much the reduced snowfall may beattributed to rising temperatures and how much to changesin weather patterns. In-depth study of the behavior of thesepatterns provides a basis for future analysis of trend changesin meteorological variables.
Conflict of Interests
The authors declare that there is no conflict of interestsregarding the publication of this paper.
Acknowledgments
The authors would like to thank the Junta of Castilla y Leon(LE220A11-2 and LE176A11-2) and the CGL2010-15930 fortheir support. Additionally, they wish to thank the StateAgency of Meteorology (AEMET) for the use of data fromtheir weather station networks. Sergio Fernandez-Gonzalezacknowledges the support from the FPU program (AP 2010-2093).
References
[1] S. Datla and S. Sharma, “Impact of cold and snow on temporaland spatial variations of highway traffic volumes,” Journal ofTransport Geography, vol. 16, no. 5, pp. 358–372, 2008.
[2] Y. Buhler, S. Kumar, J. Veitinger, M. Christen, and A. Stoffel,“Automated identification of potential snow avalanche releaseareas based on digital elevation models,” Natural Hazards andEarth System Science, vol. 13, no. 5, pp. 1321–1335, 2013.
[3] P. Bonelli, M. Lacavalla, P. Marcacci, G. Mariani, and G. Stella,“Wet snow hazard for power lines: a forecast and alert systemapplied in Italy,”Natural Hazards and Earth System Science, vol.11, no. 9, pp. 2419–2431, 2011.
[4] S. A. Changnon and D. Changnon, “A spatial and temporalanalysis of damaging snowstorms in the United States,”NaturalHazards, vol. 37, no. 3, pp. 373–389, 2006.
[5] D. Dixon, S. Boon, and U. Silins, “Watershed-scale controls onsnow accumulation in a small montane watershed, southwest-ern Alberta, Canada,” Hydrological Processes, vol. 28, pp. 1294–1306, 2013.

The Scientific World Journal 13
[6] B. Uhlmann, S. Goyette, and M. Beniston, “Sensitivity analysisof snow patterns in Swiss ski resorts to shifts in temperature,precipitation and humidity under conditions of climate change,”International Journal of Climatology, vol. 29, no. 8, pp. 1048–1055, 2009.
[7] V. Levizzani, S. Laviola, and E. Cattani, “Detection and mea-surement of snowfall from space,” Remote Sensing, vol. 3, no. 1,pp. 145–166, 2011.
[8] J. D. Lundquist, P. J. Neiman, B. Martner, A. B. White, D. J.Gottas, and F.M.Ralph, “Rain versus snow in the SierraNevada,California: comparing doppler profiling radar and surfaceobservations of melting level,” Journal of Hydrometeorology, vol.9, no. 2, pp. 194–211, 2008.
[9] M. Rohrer, “Determination of the transition air temperaturefrom snow to rain and intensity of precipitation. Instrumentsand Observing Methods,” World Meteorological OrganizationTechnical Report, vol. 328, no. 48, pp. 475–482, 1989.
[10] Y. L’Hote, P. Chevallier, A. Coudrain, Y. Lejeune, and P.Etchevers, “Relationship between precipitation phase and airtemperature: comparison between the Bolivian Andes and theSwiss Alps,” Hydrological Sciences Journal, vol. 50, no. 6, pp.989–998, 2005.
[11] J. Feiccabrino and A. Lundberg, “Precipitation phase discrim-ination by dew point and air temperature,” in Proceedings ofthe 75th Western Snow Conference, pp. 141–146, Kailua-Kona,Hawaii, USA, 2008.
[12] W. Sun, J. Wang, Z. Li, X. Yao, and J. Yu, “Influences of climatechange on water resources availability in Jinjiang Basin, China,”The Scientific World Journal, vol. 2014, Article ID 908349, 7pages, 2014.
[13] Z. Hao, Q. Ju, W. Jiang, and C. Zhu, “Characteristics andscenarios projection of climate change on the tibetan plateau,”The Scientific World Journal, vol. 2013, Article ID 129793, 9pages, 2013.
[14] J. I. Lopez-Moreno, S. Goyette, M. Beniston, and B. Alvera,“Sensitivity of the snow energy balance to climatic changes:implications for the evolution of snowpack in the Pyrenees inthe 21st century,” Climate Research, vol. 36, no. 3, pp. 203–217,2008.
[15] M. Falarz, “Variability and trends in the duration and depth ofsnow cover in Poland in the 20th century,” International Journalof Climatology, vol. 24, no. 13, pp. 1713–1727, 2004.
[16] M. Beniston, B. Uhlmann, S. Goyette, and J. I. Lopez-Moreno,“Will snow-abundant winters still exist in the Swiss Alps inan enhanced greenhouse climate?” International Journal ofClimatology, vol. 31, no. 9, pp. 1257–1263, 2011.
[17] R. Dankers and O. B. Christensen, “Climate change impacton snow coverage, evaporation and river discharge in the sub-arctic Tana Basin, Northern Fennoscandia,” Climatic Change,vol. 69, no. 2-3, pp. 367–392, 2005.
[18] P. Mellander, M. O. Lofvenius, and H. Laudon, “Climate changeimpact on snow and soil temperature in boreal Scots pinestands,” Climatic Change, vol. 85, no. 1-2, pp. 179–193, 2007.
[19] S. A. Changnon, “Catastrophic winter storms: an escalatingproblem,” Climatic Change, vol. 84, no. 2, pp. 131–139, 2007.
[20] J. I. Lopez-Moreno, S. Goyette, S. M. Vicente-Serrano, andM. Beniston, “Effects of climate change on the intensity andfrequency of heavy snowfall events in the Pyrenees,” ClimaticChange, vol. 105, no. 3-4, pp. 489–508, 2011.
[21] M. R. Pons, D. San-Martın, S. Herrera, and J. M. Gutierrez,“Snow trends in Northern Spain: analysis and simulation
with statistical downscaling methods,” International Journal ofClimatology, vol. 30, no. 12, pp. 1795–1806, 2010.
[22] M. P. Clark, M. C. Serreze, and D. Robinson, “Atmosphericcontrols on eurasian snow extent,” International Journal ofClimatology, vol. 19, pp. 27–40, 1999.
[23] K. W. Birkeland and C. J. Mock, “Atmospheric circulationpatterns associated with heavy snowfall events, Bridger Bowl,Montana, USA.,” Mountain Research and Development, vol. 16,no. 3, pp. 281–286, 1996.
[24] G. Plaut, E. Schuepbach, and M. Doctor, “Heavy precipitationevents over a few Alpine sub-regions and the links with large-scale circulation, 1971–1995,” Climate Research, vol. 17, no. 3, pp.285–302, 2001.
[25] P. Esteban, P. D. Jones, J. Martın-Vide, and M. Mases, “Atmo-spheric circulation patterns related to heavy snowfall days inAndorra, Pyrenees,” International Journal of Climatology, vol.25, no. 3, pp. 319–329, 2005.
[26] E. Kalnay, M. Kanamitsu, R. Kistler et al., “The NCEP/NCAR40-year reanalysis project,” Bulletin of the AmericanMeteorolog-ical Society, vol. 77, no. 3, pp. 437–471, 1996.
[27] K. W. Birkeland and C. J. Mock, “Atmospheric circulationpatterns associated with heavy snowfall events, Bridger Bowl,Montana, U.S.A.,”Mountain Research and Development, vol. 16,no. 3, pp. 281–286, 1996.
[28] R. B. Cattell, “The scree test for the number of factors,”Multivariate Behavioral Research, vol. 1, no. 2, pp. 245–276, 1966.
[29] A. Pascual, M. L. Martın, F. Valero, M. Y. Luna, and A. Morata,“Wintertime connections between extreme wind patterns inSpain and large-scale geopotential height field,” AtmosphericResearch, vol. 122, pp. 213–228, 2013.
[30] E. Garcıa-Ortega, L. Lopez, and J. L. Sanchez, “Atmosphericpatterns associated with hailstorm days in the Ebro Valley,Spain,” Atmospheric Research, vol. 100, no. 4, pp. 401–427, 2011.
[31] B. Yarnal, Synoptic Climatology in Environmental Analysis, BelHaven Press, London, UK, 1993.
[32] L. S. Kalkstein and J. A. Skindlov, “An evaluation of three cluster-ing procedures for use in synoptic climatological classification,”Journal of Climate &AppliedMeteorology, vol. 26, no. 6, pp. 717–730, 1987.
[33] G. R.North, T. L. Bell, andR. F. Calahan, “Sampling errors in theestimation of empirical orthogonal functions,”MonthlyWeatherReview, vol. 110, pp. 699–706, 1982.
[34] F. J. Hair Jr., E. E. Anderson, R. Tatham, and W. C. Black,Multivariate Data Analysis, Prentice-Hall, New Jersey, NJ, USA,1998.
[35] M. B. Richman, “On the application of cluster analysis togrowing season precipitation data in North America east of theRockies,” Journal of Climate, vol. 8, no. 4, pp. 897–931, 1995.
[36] A. Merino, E. Garcıa-Ortega, L. Lopez, J. L. Sanchez, andA. M. Guerrero-Higueras, “Synoptic environment, mesoscaleconfigurations and forecast parameters for hailstorms in South-western Europe,” Atmospheric Research, vol. 122, pp. 183–198,2013.
[37] T. C. Peterson, D. R. Easterling, T. R. Karl et al., “Homogeneityadjustments of in situ atmospheric climate data: a review,”International Journal of Climatology, vol. 18, no. 13, pp. 1493–1517, 1998.
[38] H. von Storch and A. Navarra, Analysis of Climate Variability:Applications of Statistical Techniques, Springer, 1999.
[39] V. Conrad and L. W. Pollack,Methods in Climatology, HarvardUniversity Press, Cambridge, Mass, USA, 1962.

14 The Scientific World Journal
[40] S. del Rıo, L. Herrero, C. Pinto-Gomes, and A. Penas, “Spatialanalysis of mean temperature trends in Spain over the period1961–2006,” Global and Planetary Change, vol. 78, no. 1-2, pp.65–75, 2011.
[41] T. Partal and E. Kahya, “Trend analysis in Turkish precipitationdata,”Hydrological Processes, vol. 20, no. 9, pp. 2011–2026, 2006.
[42] T. Salmi, A. Maatta, P. Anttila, T. Ruoho-Airola, and T. Amnell,Detecting Trends of Annual Values of Atmospheric Pollutants bytheMann-Kendall Test and Sen’s Slope Estimates:The Excel Tem-plate ApplicationMAKESENS, FinnishMeteorological Institute,Helsinki, Finland, 2002.
[43] R. O. Gilbert, Statistical Methods for Environmental PollutionMonitoring, Van Nostrand Reinhold, New York, NY, USA, 1987.
[44] S. Yue and C. Wang, “The Mann-Kendall test modified byeffective sample size to detect trend in serially correlatedhydrological series,” Water Resources Management, vol. 18, no.3, pp. 201–218, 2004.
[45] H. Tabari andP.H. Talaee, “Temporal variability of precipitationover Iran: 1966–2005,” Journal ofHydrology, vol. 396, no. 3-4, pp.313–320, 2011.
[46] S. del Rıo, M. Anjum Iqbal, A. Cano-Ortiz, L. Herrero, A.Hassan, and A. Penas, “Recent mean temperature trends inPakistan and links with teleconnection patterns,” InternationalJournal of Climatology, vol. 33, no. 2, pp. 277–290, 2013.
[47] F. Yenilmez, F. Keskin, and A. Aksoy, “Water quality trendanalysis in Eymir Lake, Ankara,” Physics and Chemistry of theEarth, vol. 36, no. 5-6, pp. 135–140, 2011.
[48] H. Tabari, S. Marofi, A. Aeini, P. H. Talaee, and K.Mohammadi,“Trend analysis of reference evapotranspiration in the westernhalf of Iran,” Agricultural and Forest Meteorology, vol. 151, no. 2,pp. 128–136, 2011.
[49] J. Martın Vide and D. Fernandez, “El ındice NAO y la pre-cipitacion mensual en la Espana peninsular,” InvestigacionesGeograficas, vol. 26, pp. 41–58, 2001.
[50] J. Saenz, J. Zubillaga, and C. Rodrıguez-Puebla, “Interannualwinter temperature variability in the north of the IberianPeninsula,” Climate Research, vol. 16, no. 3, pp. 169–179, 2001.
[51] J. I. Lopez-Moreno and S. M. Vicente-Serrano, “Atmosphericcirculation influence on the interannual variability of snowpackin the Spanish Pyrenees during the second half of the 20thcentury,” Nordic Hydrology, vol. 38, no. 1, pp. 33–44, 2007.
[52] S. del Rıo, A. Cano-Ortiz, L. Herrero, and A. Penas, “Recenttrends in mean maximum and minimum air temperatures overSpain (1961–2006),” Theoretical and Applied Climatology, vol.109, no. 3-4, pp. 605–626, 2012.
[53] A. Sanchez-Lorenzo, M. Brunetti, J. Calbo, and J. Martin-Vide,“Recent spatial and temporal variability and trends of sunshineduration over the Iberian Peninsula from a homogenized dataset,” Journal of Geophysical ResearchD: Atmospheres, vol. 112, no.20, Article ID D20115, 2007.
[54] K. Makowski, E. B. Jaeger, M. Chiacchio, M.Wild, T. Ewen, andA. Ohmura, “On the relationship between diurnal temperaturerange and surface solar radiation in Europe,” Journal of Geophys-ical Research D: Atmospheres, vol. 114, no. 7, Article ID D00D07,2009.
[55] A. Sanchez-Lorenzo, J. Sigro, J. Calbo et al., “Efectos dela nubosidad e insolacion en las temperaturas recientes deEspana,” in Cambio climatico regional y sus impactos, J. Sigro,M. Brunet, and E. Aguilar, Eds., vol. A, no. 6, pp. 273–283,Asociacion Espanola de Climatologıa, 2008.
[56] D. Pozo-Vazquez, M. J. Esteban-Parra, F. S. Rodrigo, and Y.Castro-D ıez, “A study of NAO variability and its possible non-linear influences on European surface temperature,” ClimateDynamics, vol. 17, no. 9, pp. 701–715, 2001.
[57] M. C. Gallego, R. M. Trigo, J. M. Vaquero et al., “Trends infrequency indices of daily precipitation over the Iberian Penin-sula during the last century,” Journal of Geophysical Research D:Atmospheres, vol. 116, no. 2, Article ID D02109, 2011.
[58] R. M. Trigo, D. Pozo−Vazquez, T. J. Osborn, Y. Castro-Dıez,S. Gamiz-Fortis, and M. J. Esteban-Parra, “North AtlanticOscillation influence on precipitation, river flow and waterresources in the Iberian Peninsula,” International Journal ofClimatology, vol. 24, pp. 925–944, 2004.
[59] J. Lopez-Bustins, J. Martın-Vide, and A. Sanchez-Lorenzo,“Iberia winter rainfall trends based upon changes in telecon-nection and circulation patterns,”Global and Planetary Change,vol. 63, no. 2-3, pp. 171–176, 2008.
[60] R. M. Trigo and C. DaCamara, “Circulation weather typesand their impact on the precipitation regime in Portugal,”International Journal of Climatology, vol. 20, pp. 1559–1581,2000.
[61] S. M. Vicente-Serrano and J. I. Lopez-Moreno, “The influenceof atmospheric circulation at different spatial scales on winterdrought variability through a semi-arid climatic gradient inNortheast Spain,” International Journal of Climatology, vol. 26,no. 11, pp. 1427–1453, 2006.

Submit your manuscripts athttp://www.hindawi.com
Hindawi Publishing Corporationhttp://www.hindawi.com Volume 2014
ClimatologyJournal of
EcologyInternational Journal of
Hindawi Publishing Corporationhttp://www.hindawi.com Volume 2014
EarthquakesJournal of
Hindawi Publishing Corporationhttp://www.hindawi.com Volume 2014
Hindawi Publishing Corporationhttp://www.hindawi.com
Applied &EnvironmentalSoil Science
Volume 2014
Mining
Hindawi Publishing Corporationhttp://www.hindawi.com Volume 2014
Journal of
Hindawi Publishing Corporation http://www.hindawi.com Volume 2014
International Journal of
Geophysics
OceanographyInternational Journal of
Hindawi Publishing Corporationhttp://www.hindawi.com Volume 2014
Journal of Computational Environmental SciencesHindawi Publishing Corporationhttp://www.hindawi.com Volume 2014
Journal ofPetroleum Engineering
Hindawi Publishing Corporationhttp://www.hindawi.com Volume 2014
GeochemistryHindawi Publishing Corporationhttp://www.hindawi.com Volume 2014
Journal of
Atmospheric SciencesInternational Journal of
Hindawi Publishing Corporationhttp://www.hindawi.com Volume 2014
OceanographyHindawi Publishing Corporationhttp://www.hindawi.com Volume 2014
Advances in
Hindawi Publishing Corporationhttp://www.hindawi.com Volume 2014
MineralogyInternational Journal of
Hindawi Publishing Corporationhttp://www.hindawi.com Volume 2014
MeteorologyAdvances in
The Scientific World JournalHindawi Publishing Corporation http://www.hindawi.com Volume 2014
Paleontology JournalHindawi Publishing Corporationhttp://www.hindawi.com Volume 2014
ScientificaHindawi Publishing Corporationhttp://www.hindawi.com Volume 2014
Hindawi Publishing Corporationhttp://www.hindawi.com Volume 2014
Geological ResearchJournal of
Hindawi Publishing Corporationhttp://www.hindawi.com Volume 2014
Geology Advances in